Matokeo ya”

Mtazamo wa EUR/USD kabla ya data ya mfumuko wa bei na data ya ajira ya Marekani
EUR/USD inabaki katika kiwango maalum huku masoko yakisubiri ufafanuzi kutoka kwa data ya mfumuko wa bei ya Marekani iliyochelewa.
EUR/USD inabaki katika kiwango maalum huku masoko yakisubiri ufafanuzi kutoka kwa data ya mfumuko wa bei ya Marekani iliyochelewa. Jozi hii imekuwa ikifanya biashara kati ya 1.156 na 1.166, huku wafanyabiashara wakisita kujitolea hadi takwimu za Kielelezo cha Bei za Walaji (CPI) zifichue ikiwa Federal Reserve itadumisha msimamo wake wa kulegeza masharti au kusitisha ulegezaji zaidi.
Kukosekana kwa data kumepunguza kuyumba kwa soko na kuacha euro ikiwa imara dhidi ya dola inayodhoofika, huku masoko yakitathmini kupungua kwa ukuaji, mabadiliko ya matarajio ya viwango vya riba, na kuimarika kwa hisia za hatari duniani.
Mambo muhimu ya kuzingatia
- EUR/USD inashikilia imara karibu na 1.1642, ikifanya biashara ndani ya wigo mwembamba wa 1.156–1.166 huku wafanyabiashara wakisubiri data ya CPI.
- Kuchelewa kwa data za Marekani kufuatia kufungwa kwa serikali kumesimamisha mwelekeo wa soko na kudhoofisha kasi ya dola.
- Tofauti za sera zinapungua, huku Fed ikielekea kwenye kupunguza viwango wakati ECB inashikilia msimamo.
- Utulivu wa Kanda ya Euro na hisia zinazoimarika zinatofautiana na kutokuwa na uhakika kwa Marekani, zikisaidia ustahimilivu wa euro.
- Kubanwa kwa kuyumba kwa soko kunaashiria uwezekano wa kuvunja soko mara data ya mfumuko wa bei itakapotolewa.
Soko lakwama huku kuchelewa kwa data ya mfumuko wa bei na ajira ya Marekani kukiendelea
Kuchelewa kutolewa kwa data ya mfumuko wa bei na ajira ya Marekani kumeacha soko bila mwelekeo. Ofisi ya Takwimu za Ajira (BLS) bado inashughulikia usumbufu uliosababishwa na kufungwa kwa serikali hivi karibuni, ikiongeza uwezekano kwamba baadhi ya takwimu za Oktoba huenda zisichapishwe kamwe.
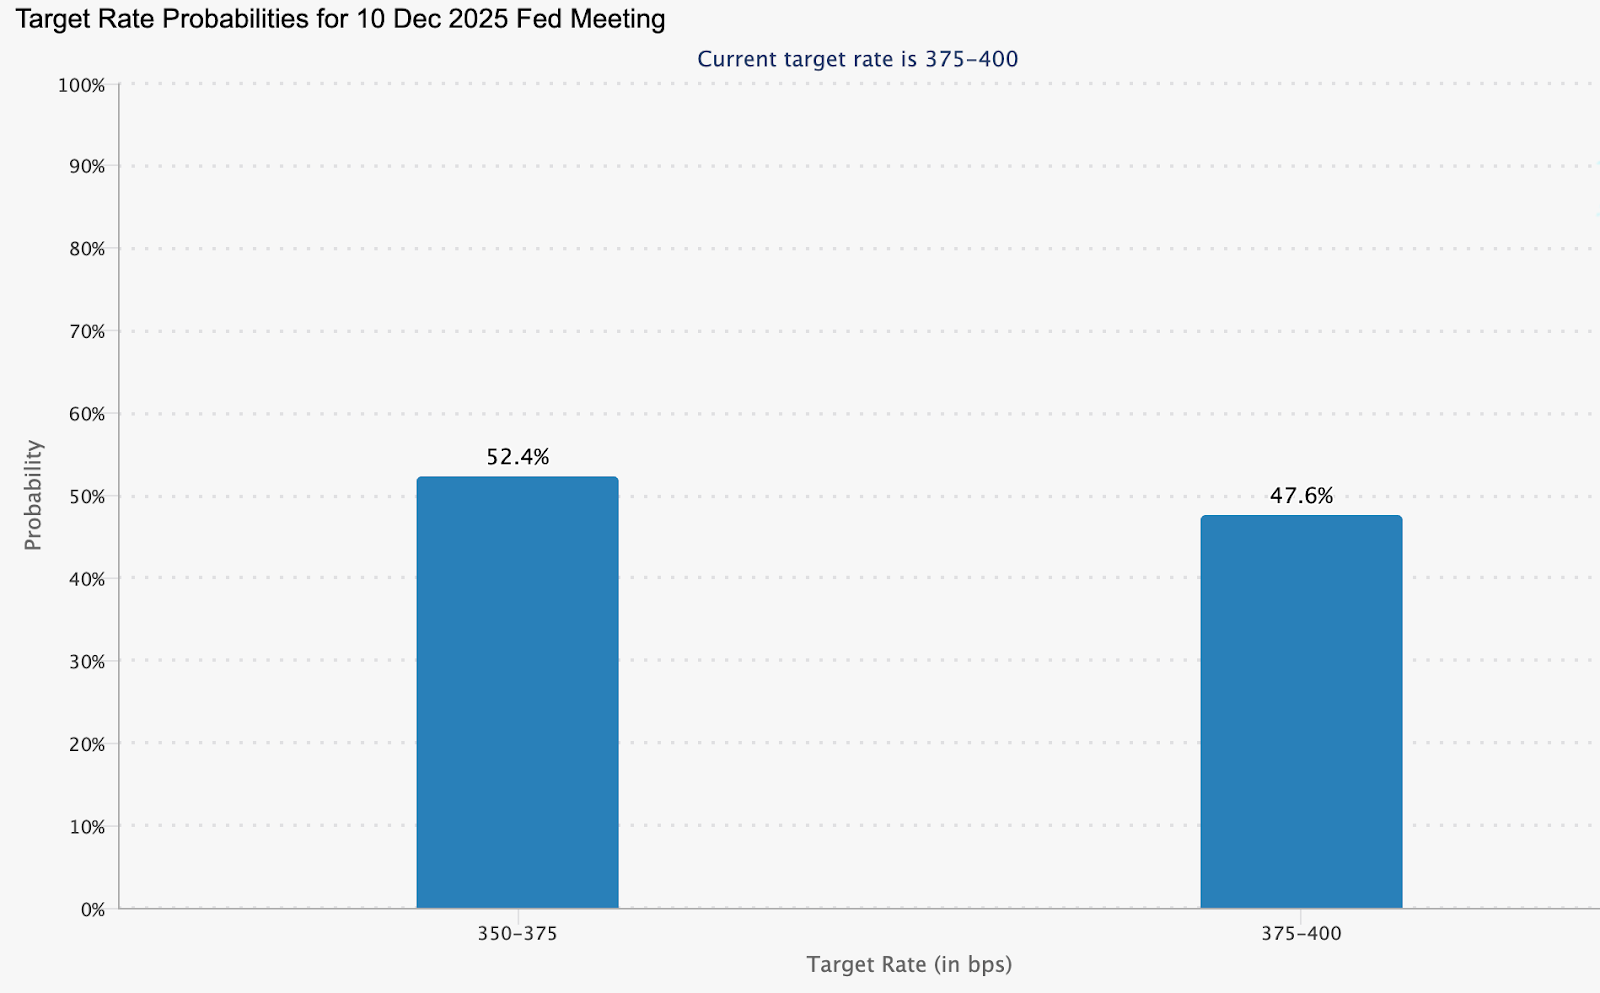
Ukosefu huu wa mwonekano umepooza wafanyabiashara na watunga sera. Bila data ya CPI au Non-Farm Payrolls, maamuzi ya Fed yanapunguzwa kuwa ya kubahatisha. Kulingana na CME FedWatch Tool, masoko sasa yanapanga bei kwa uwezekano wa 52.4% wa punguzo la kiwango la pointi 25 za msingi mnamo Desemba, lakini uhakika unapungua haraka.
Wakati huo huo, hamu ya hatari inaimarika, wakati fahirisi za Ulaya ziko imara - mchanganyiko ambao kwa kawaida hudhoofisha dola. Kadiri hisia za kupenda hatari zinavyoenea, euro inapata msaada usio wa moja kwa moja kutoka kwa mtiririko bora wa mtaji na kupungua kwa mahitaji ya mali salama (safe-haven).
Euro yapata faida huku pengo la sera ya ECB-Fed na tofauti ya ukuaji vikipungua
Zaidi ya ukosefu wa sasa wa data, misingi mipana inaegemea upande wa kuunga mkono euro. IMF inatabiri ukuaji wa Pato la Taifa (GDP) la Marekani kupungua kutoka 2.8% hadi 2.0% mnamo 2025, wakati kiwango cha ukuaji wa Kanda ya Euro kinatarajiwa kupanda kutoka 0.9% hadi 1.2%. Pengo hilo la ukuaji linalopungua linamomonyoa moja ya nguvu za jadi za dola.
Sera ya fedha pia inakaribiana. Benki Kuu ya Ulaya (ECB) inaelekea kuhitimisha awamu yake ya kulegeza masharti, wakati Federal Reserve inaonekana kuwa karibu na kupunguza viwango huku kasi ya Marekani ikipoa. Kupungua kwa tofauti ya mavuno kihistoria ni chanya kwa EUR/USD.
Wakati huo huo, utulivu wa Kanda ya Euro unakuwa rasilimali. Hatari za nishati zimepungua, kuyumba kwa kisiasa kumelegea, na imani ya watumiaji inaonyesha dalili hafifu za kupona. Kwa hatari chache za kimuundo na sera thabiti ya fedha, euro haihitaji tena kupanda kwa matumaini - inahitaji tu kubaki thabiti wakati dola inahangaika kutafuta mwelekeo.
Athari ya data ya CPI: Sehemu kuu ambayo soko halioni
Mfumuko wa bei unabaki kuwa kiini. Ikiwa CPI ya Marekani itashangaza kwa kupanda juu, masoko yanaweza kupanga upya matarajio ya kusitisha kwa Fed, na kusukuma EUR/USD chini. Takwimu dhaifu, hata hivyo, zitathibitisha mtazamo wa kulegeza masharti na kuimarisha mkono wa euro.
Kwa sasa, kutokuwepo kwa data ya mfumuko wa bei kumekuwa kichocheo chake chenyewe. Bila namba mpya, wafanyabiashara wanazidi kutegemea hisia na ishara za kiufundi badala ya misingi. Hii imebana kuyumba kwa soko na kupunguza uhakika, lakini kadiri inavyoendelea, ndivyo kuvunja kwa soko hatimaye kunaweza kuwa na nguvu zaidi.
Athari za uwekezaji wa EUR/USD: Kasi yakutana na upinzani
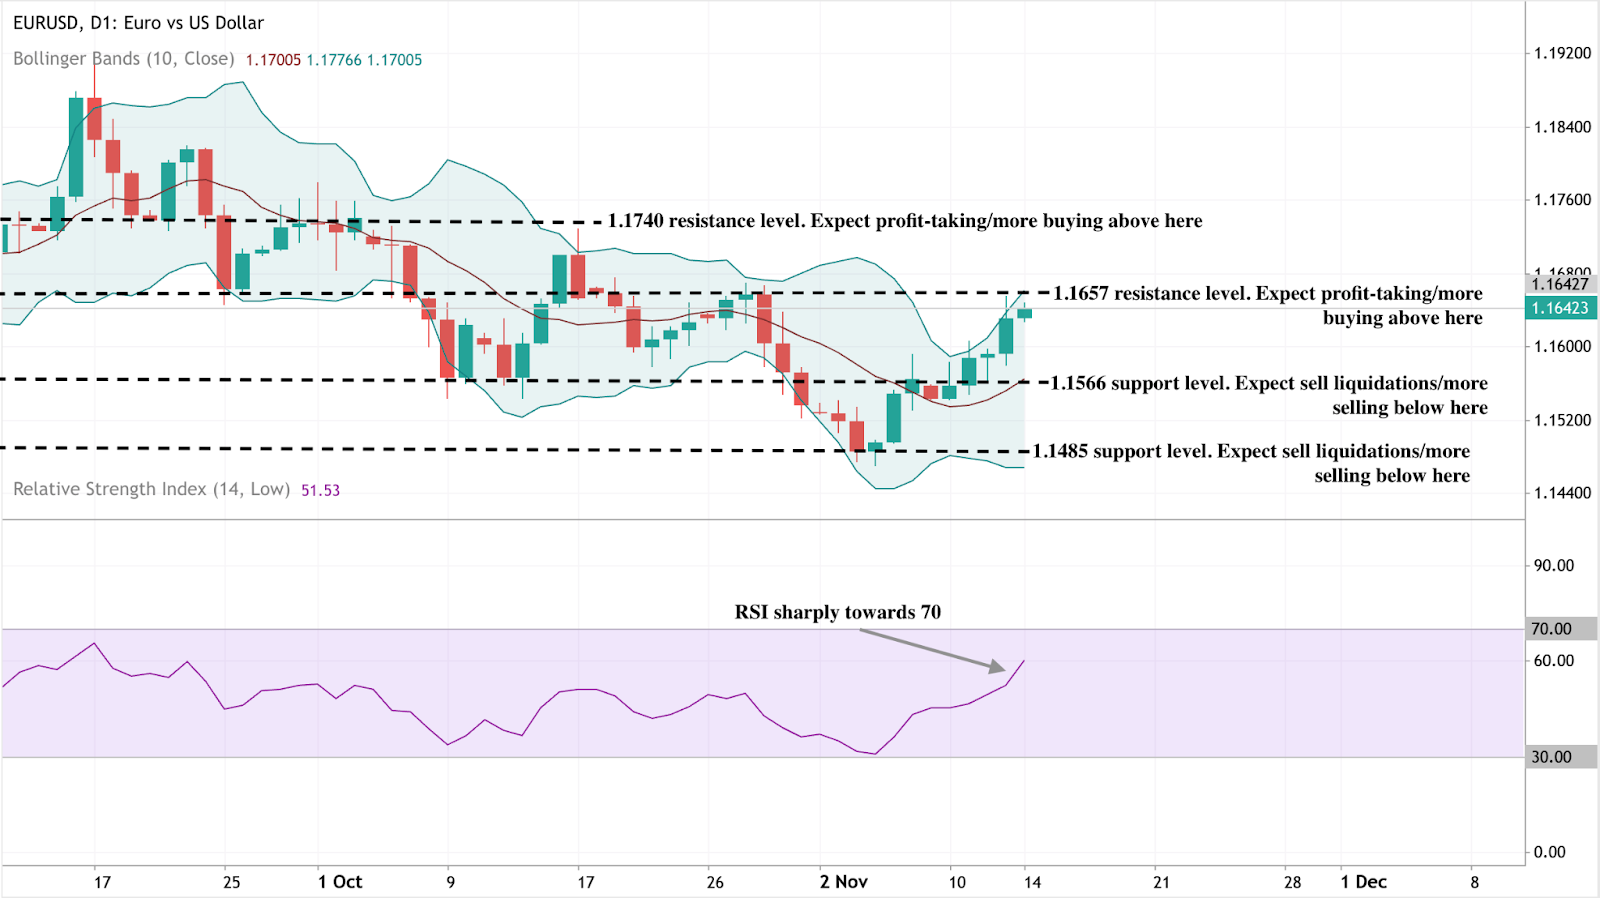
Wakati wa kuandika, EUR/USD inafanya biashara karibu na 1.1642, na kasi ikiegemea kwenye kupanda (bullish) lakini ikikabiliwa na eneo muhimu la upinzani.
Bollinger Bands zinaonyesha kuwa hatua ya bei inashinikiza dhidi ya bendi ya juu, ikipendekeza kuongezeka kwa kuyumba na shinikizo kubwa la kununua. Hata hivyo, jozi hiyo inapokaribia 1.1657, wafanyabiashara wanaweza kutarajia kuchukua faida au uimarishaji wa muda mfupi kabla ya harakati yoyote zaidi ya juu.
Kuvunja kwa uamuzi juu ya 1.1740 kunaweza kuimarisha hisia ya kupanda (bullish) na kuvutia maslahi ya ziada ya kununua. Kwa upande wa chini, msaada wa haraka upo 1.1566, na sakafu ya kina karibu na 1.1485. Kuvunja chini ya viwango hivi kunaweza kusababisha uuzaji wa kufunga nafasi na shinikizo jipya la kushuka.
Wakati huo huo, RSI inakaribia 70, ikiashiria kuwa jozi hiyo inakaribia eneo la kununuliwa kupita kiasi. Hii inapendekeza uwezekano wa marekebisho ya muda mfupi kabla ya mwenendo kurejelea njia yake ya kupanda.
Athari za uwekezaji wa EUR/USD
Kwa wafanyabiashara, hili ni soko linalofafanuliwa na uvumilivu badala ya uchokozi. Biashara ya masafa karibu na 1.156–1.166 inabaki kuwa na faida, lakini vituo vya karibu (stops) ni muhimu kutokana na hatari ya kuvunja kwa soko kunakoendeshwa na data.
Wawekezaji wa muda wa kati wanapaswa kutambua kuwa utulivu wa kimsingi wa euro, kupungua kwa mapengo ya ukuaji, na kupungua kwa hatari ya Kanda ya Euro kunaweza kudumisha kasi ya taratibu ya kupanda kuelekea 1.18–1.20 ikiwa dola itaendelea kudhoofika hadi mapema 2026.
Kadiri kuyumba kunavyobanwa, usimamizi wa hatari unakuwa muhimu. Kwa kutumia kikokotoo cha biashara cha Deriv, wafanyabiashara wanaweza kukadiria thamani za pip, mahitaji ya margin, na faida au hasara inayoweza kutokea kabla ya kutekeleza nafasi. Usahihi huu husaidia kudhibiti mfiduo karibu na viwango muhimu, kama vile msaada wa 1.156 au upinzani wa 1.174 - faida muhimu katika masoko yenye kuyumba kidogo.
Huku EUR/USD ikielea karibu na viwango muhimu vya kiufundi, wafanyabiashara wanaweza kufuatilia mienendo ya bei ya moja kwa moja kwenye Deriv MT5 na kupanga maingizo yanayoendeshwa na data kwa kutumia Kikokotoo cha Biashara cha Deriv. Ripoti ya CPI itakapotolewa, zana zote mbili zitakuwa muhimu kwa kutambua kasi ya kuvunja soko na kudhibiti mfiduo katika muda halisi.

Utabiri wa bei ya fedha: Kwa nini kupanda kwa chuma hiki kuna nguvu safari hii
Kupanda kwa bei ya fedha katika siku tano zilizopita si matumaini hewa - ni hatua iliyojengwa kwenye misingi imara, si hofu, kulingana na wachambuzi.
Kupanda kwa bei ya fedha katika siku tano zilizopita si matumaini hewa - ni hatua iliyojengwa kwenye misingi imara, si hofu, kulingana na wachambuzi. Tofauti na miinuko ya kubahatisha ya zamani, ongezeko hili linaonyesha muunganiko wa matarajio ya ulegezwaji wa sera za kifedha, hali ngumu ya ugavi, na kuongezeka kwa mahitaji ya kiviwanda kutoka kwa nishati mbadala na utengenezaji wa semikonda.
Huku dola ikiwa chini ya shinikizo na wafanyabiashara wakizingatia kupunguzwa kwa viwango mwezi Desemba, nguvu ya hivi karibuni ya fedha inaashiria kuanza kwa awamu inayoendeshwa na misingi imara badala ya mlipuko mwingine wa muda mfupi wa matumaini.
Mambo muhimu ya kuzingatia
- Fedha inauzwa karibu na $54.40, ikiendeleza mwamko wake mkubwa zaidi tangu Oktoba.
- Uwezekano wa Fed kupunguza viwango ulipanda hadi 68%, na kuwafanya wawekezaji kuelekea kwenye rasilimali zisizotoa mapato, kama vile fedha.
- Ugavi wa uchimbaji umepungua kwa 7% tangu 2016, huku mahitaji ya kiviwanda yakizidi uzalishaji.
- Nishati mbadala na mahitaji ya EV sasa yanachangia zaidi ya nusu ya matumizi yote ya fedha.
Mabadiliko ya sera ya fedha na udhaifu wa data vyachochea ununuzi
Mwamko wa hivi karibuni wa fedha ulisababishwa na mabadiliko makali katika matarajio ya viwango vya riba. Data za hivi karibuni za Marekani zilionyesha uchumi ukipoteza kasi - uundaji wa ajira katika sekta binafsi ulipungua kwa karibu 11,000 kwa wiki hadi mwishoni mwa Oktoba, kulingana na ADP. Kudorora huko kuliongeza imani ya soko kwamba Federal Reserve itapunguza viwango mwezi Desemba, huku uwezekano ukipanda kutoka 62% hadi 68%, kama inavyofuatiliwa na CME FedWatch Tool.
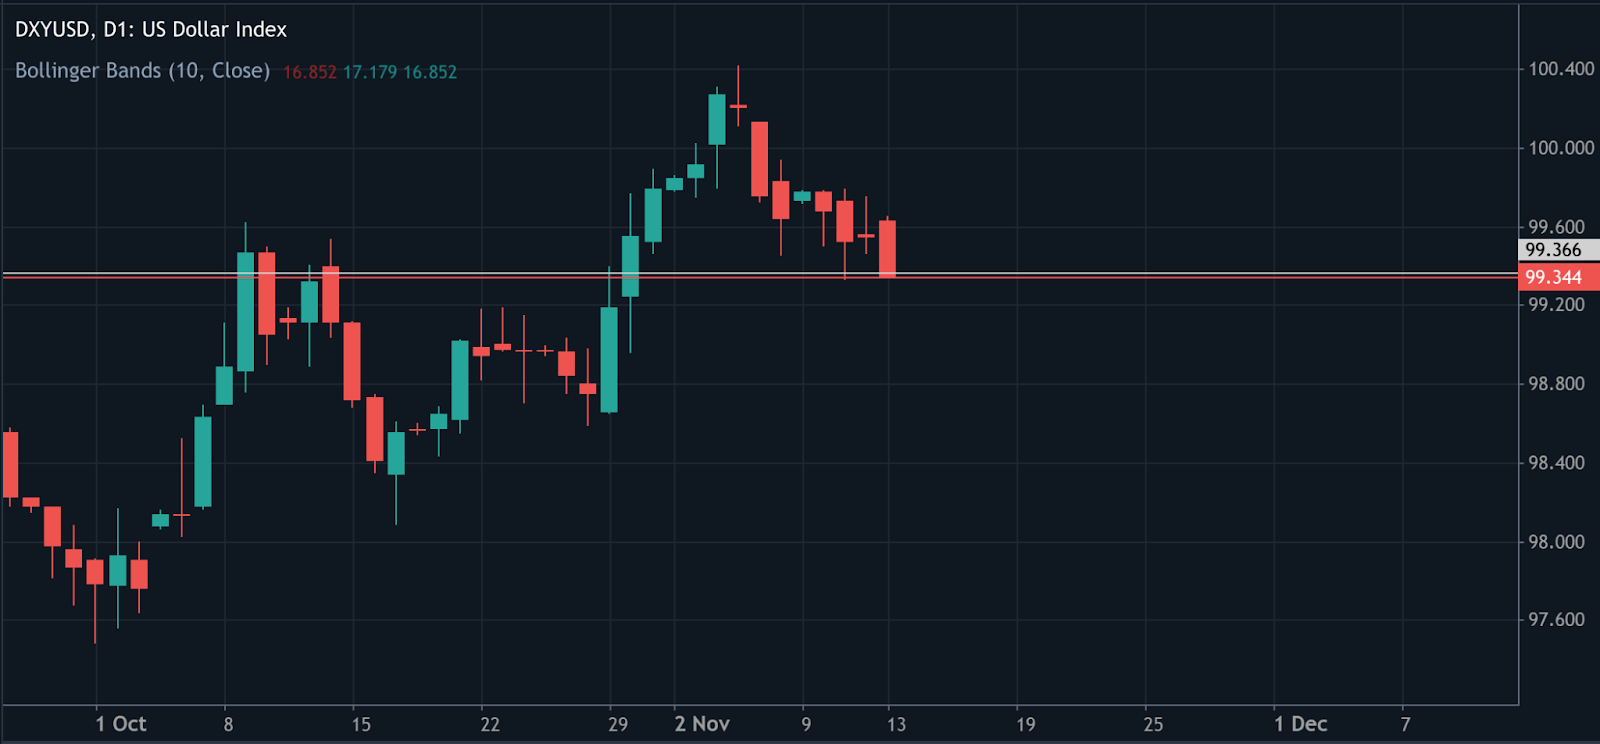
Viwango vya chini kwa kawaida hudhoofisha dola na kuongeza mahitaji ya rasilimali za hifadhi salama zisizotoa mapato. U.S. Dollar Index (DXY) imeshuka hadi karibu 99.60, ikiongeza faida katika dhahabu na fedha huku wawekezaji wakitafuta njia mbadala za pesa taslimu zenye mapato ya chini.
Kwa kawaida, maendeleo kuhusu kufungwa kwa serikali ya Marekani yangeunguza mahitaji ya hifadhi salama, lakini safari hii, matarajio ya sera yalizidi siasa. Soko linaitikia hadithi pana zaidi: kupungua kwa ukuaji na Fed kulazimika kulegeza masharti.
Kutoka hofu hadi misingi imara: Nakisi ya ugavi wa fedha na hadithi ya mahitaji
Mwamko huu unaashiria kuachana na matukio ya awali yaliyosukumwa na biashara ya kubahatisha. Kulingana na Sprott Asset Management, nguvu ya fedha sasa imejikita katika nakisi za kimuundo za ugavi na upanuzi wa kiviwanda, si kelele za soko. Jumla ya uzalishaji wa migodi imepungua kwa 7% tangu 2016, wakati mahitaji kutoka kwa nishati mbadala, magari ya umeme (EVs), na vifaa vya kielektroniki yameongezeka kwa kasi.
Mahitaji ya kiviwanda ya fedha yaendelea kuzidi ukuaji wa ugavi
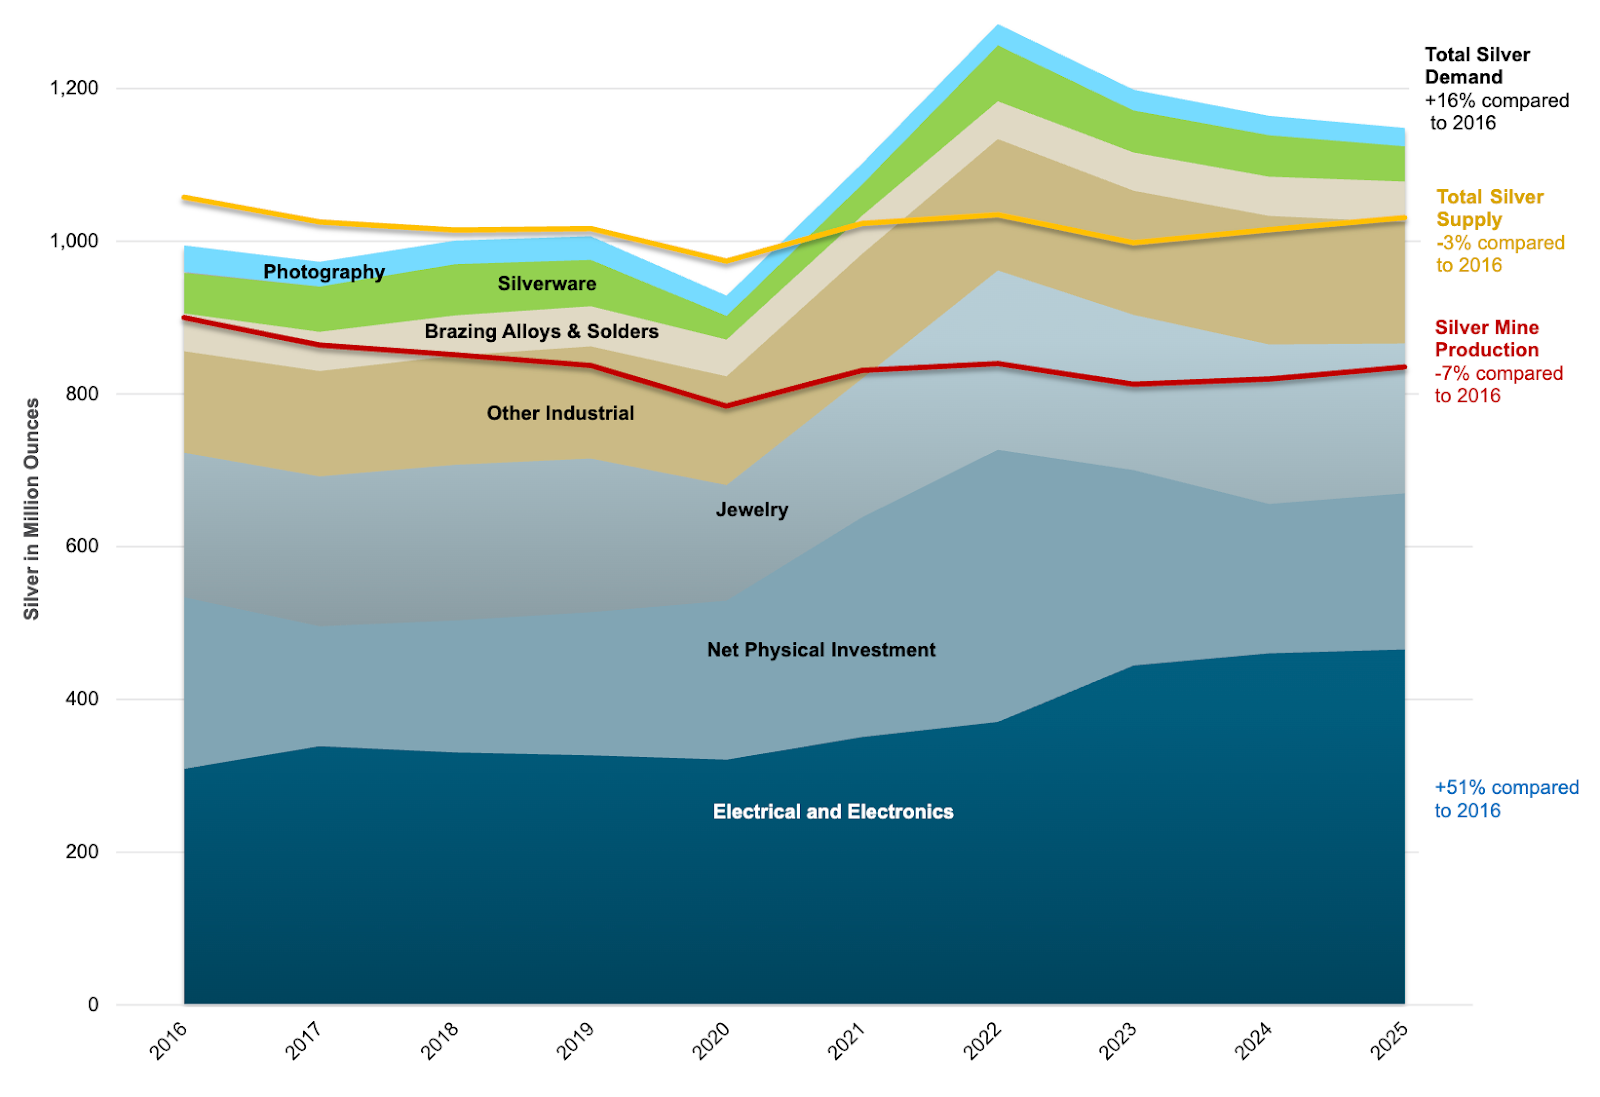
Zaidi ya nusu ya mahitaji yote ya fedha sasa yanatokana na matumizi ya kiviwanda - hasa utengenezaji wa paneli za jua, semikonda, na vipengele vya EV. Hata hivyo, ugavi haujaenda sambamba na mahitaji hayo. Viwango vya urejelezaji vimekua kwa kiasi kidogo tu, na uwekezaji mpya wa uchimbaji bado ni mdogo, kuliacha soko likiwa limebana zaidi.
Kama mchambuzi mmoja alivyosema, "Huu ni mwamko wa kwanza wa fedha katika miaka mingi unaoendeshwa zaidi na viwanda kuliko hofu."
Ikiwa unapanga kuingia sokoni, kikokotoo cha biashara cha Deriv kinakusaidia kukadiria margin, swap, na faida tarajiwa kwenye majukwaa ya Deriv, kama vile Deriv MT5.
Mazingira ya jumla: Udhaifu wa dola na sera ya kulegeza
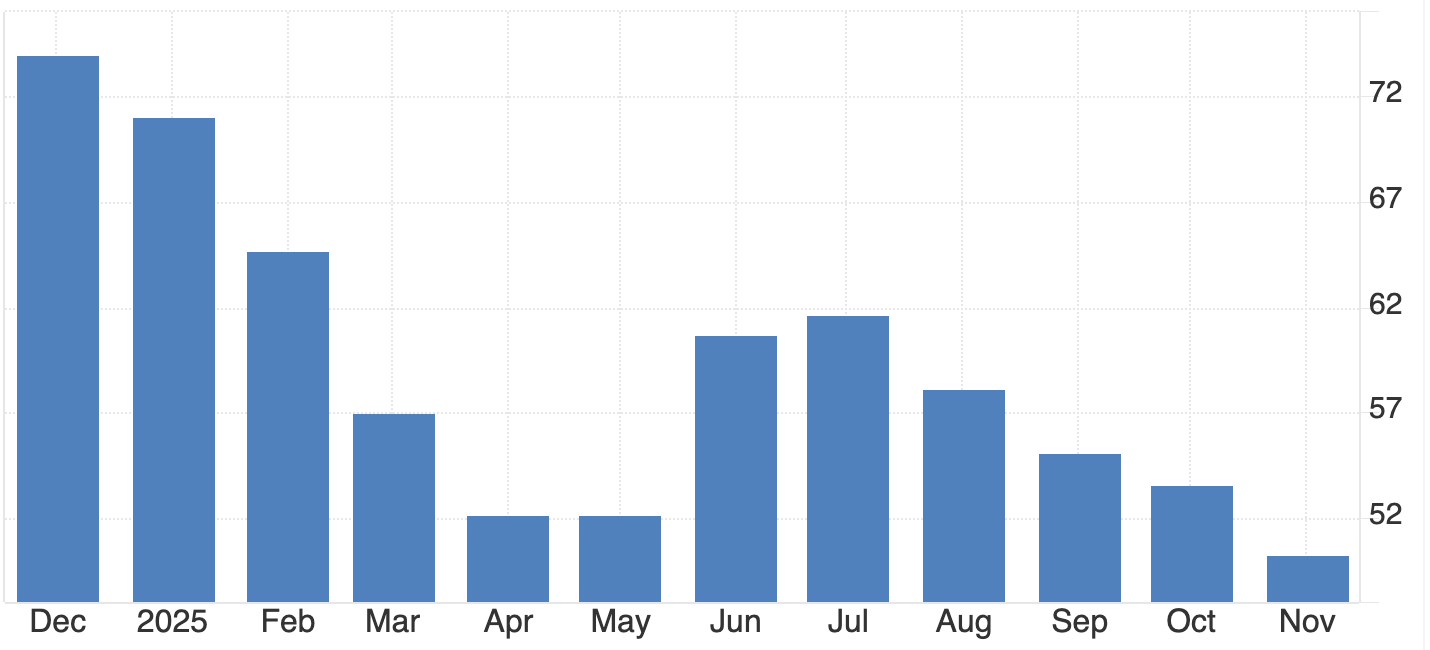
Mazingira mapana yanaimarisha nguvu ya fedha. Mchanganyiko wa dola dhaifu, kushuka kwa mapato (yields), na viashiria laini vya kiuchumi kumeunda mazingira bora kwa metali za thamani. Kielelezo cha Hisia za Watumiaji cha University of Michigan kilishuka hadi kiwango chake cha chini zaidi tangu 2022, wakati shughuli za rejareja zimepungua, ikiashiria kuwa mzunguko wa kubana wa Fed umefikia kikomo.
Hisia za watumiaji wa Marekani


Dhahabu pia imechangia kasi ya sekta hiyo, ikipanda kwa muda mfupi juu ya $4,300 kwa aunzi mwezi Oktoba. Fedha, ambayo kwa kawaida huwa na mabadiliko makubwa zaidi, imenufaika na athari za ziada huku wawekezaji wakitawanya rasilimali zao kwenye metali mbalimbali wakitarajia ulegezwaji wa muda mrefu wa sera za kifedha.
Sambamba na hilo, kubanwa kwa ugavi wa shaba kunaongeza uzito kwenye hoja kwamba sekta nzima ya metali inaingia katika awamu ya kutathminiwa upya kutokana na ugavi. Uhaba wa kimuundo unaoonekana kwenye shaba sasa unajitokeza kwenye fedha, ukisisitiza simulizi ya pamoja: ukuaji wa mahitaji unazidi uzalishaji katika bidhaa muhimu.
Nguvu ya kiviwanda: Kichocheo kipya cha mzunguko wa fedha
Jukumu la pande mbili la fedha - kama hifadhi salama na chuma cha kiviwanda - linaifanya kuwa ya kipekee kati ya bidhaa.
Wakati dhahabu inategemea zaidi mahitaji ya wawekezaji na benki kuu, fedha inanufaika na jukumu lake katika nishati safi na minyororo ya ugavi wa teknolojia. Ufungaji wa mitambo ya jua unatarajiwa kufikia viwango vya rekodi mwaka 2025, wakati matumizi ya EV yanaendelea kuongezeka kasi.
Wachambuzi wanakadiria kuwa mahitaji kutoka kwa nishati mbadala na vifaa vya kielektroniki yatakua kwa kasi zaidi kuliko uzalishaji wa migodi kwa angalau miaka miwili ijayo, na kusababisha makadirio ya ongezeko la bei la 34% mwaka 2025 na 8% mwaka 2026. Hata ongezeko dogo la matumizi sasa linasababisha mwitikio mkubwa wa bei kutokana na nakisi inayoendelea.
Tathmini ya kiufundi ya fedha
Wakati wa kuandika makala haya, fedha (XAG/USD) inajaribu kiwango cha upinzani cha $54.30, eneo muhimu ambapo uchukuaji wa faida unaweza kuongezeka baada ya mwamko mkali wa kupanda kwa bei. RSI inazunguka karibu na 69, ikikaribia eneo la kununuliwa kupita kiasi, ambayo inaashiria uwezekano wa kuishiwa nguvu kwa kasi ya ununuzi na uwezekano wa kuimarika kwa muda mfupi au kurudi nyuma.
Viashiria vya Bollinger Bands vinaonyesha kuwa mwenendo wa bei unakumbatia bendi ya juu, ikionyesha shinikizo kubwa la kupanda lakini pia hatari ya kupanda kupita kiasi kwa muda mfupi. Kuvunja kwa nguvu juu ya $54.30 kunaweza kualika ununuzi zaidi, ukilenga viwango vipya vya juu.
Hata hivyo, kushindwa kuvuka kiwango hiki kunaweza kusababisha kurudi nyuma kuelekea kiwango cha usaidizi cha $47.00, ambapo wanunuzi wanaweza kuibuka tena. Chini ya hapo, kiwango muhimu kinachofuata kiko $41.28, kikiashiria eneo la usaidizi la kina zaidi linalohusishwa na limbikizo la awali.

Hatari na uwezekano wa mabadiliko ya fedha
Licha ya mtazamo mzuri, hatari chache zinabaki:
- Kuimarika kwa dola kutokana na data imara za Marekani kunaweza kuzuia faida kwa muda.
- Kufufuka polepole kwa viwanda au kupungua kwa usambazaji wa nishati mbadala kunaweza kupunguza ukuaji wa mahitaji.
- Uchukuaji wa faida wa muda mfupi unaweza kusababisha kuyumba kwa bei karibu na kiwango cha $50–52.
Hata hivyo, haya yana uwezekano wa kuwa marekebisho ya muda badala ya mabadiliko ya mwelekeo. Hali ngumu ya ugavi na misingi imara ya kiviwanda inatoa sakafu imara chini ya soko.
Mtazamo wa fedha: Mwamko unaoungwa mkono na uhalisia
Kupanda kwa fedha kunahusu mabadiliko ya kimuundo zaidi kuliko kubahatisha. Wakati sera ya fedha inakuwa yenye kuunga mkono na mahitaji ya kiviwanda yakiongezeka kasi, soko linahama kutoka biashara ya kuitikia matukio hadi tathmini mpya ya muda mrefu.
Wachambuzi wanatarajia fedha kubaki juu ya $50 kwa aunzi mwaka 2025, na uwezekano wa kujaribu tena kilele cha Oktoba cha $54 ikiwa kupunguzwa kwa viwango kutatimia na shughuli za kiviwanda zikiimarika. Uwiano wa ulegezwaji wa uchumi mkuu, upanuzi wa nishati ya kijani, na nakisi ya ugavi unaupa mwamko huu msingi wa kuaminika zaidi katika zaidi ya muongo mmoja.
Kwa kifupi, hofu inaweza kuwa iliianzisha - lakini misingi imara sasa inaiendesha.

Je, kuongezeka kwa mahitaji ya AI, EV na nishati kutageuza shaba kuwa mafuta yajayo?
Nafasi ya shaba katika uchumi wa dunia inabadilika kutoka pembejeo ya viwanda hadi rasilimali ya kimkakati inayounga mkono mabadiliko ya nishati na teknolojia.
Ndiyo - na data inazidi kuunga mkono mtazamo huo. Nafasi ya shaba katika uchumi wa dunia inabadilika kutoka pembejeo ya viwanda hadi rasilimali ya kimkakati inayounga mkono mabadiliko ya nishati na teknolojia. Bei zinafanya biashara karibu $11,000 kwa tani kwenye London Metal Exchange (LME), juu kwa takriban 27% tangu Januari 2025, huku mahitaji kutoka vituo vya data vya AI, magari ya umeme (EVs), na miundombinu ya nishati mbadala yakiongezeka kwa kasi.
Huku usambazaji wa kimataifa ukihangaika kwenda sambamba, wachambuzi wanaamini shaba inaweza hivi karibuni kuwa muhimu kwa ukuaji wa kisasa kama mafuta yalivyokuwa kwa karne ya 20 - ikiendesha kila kitu kutoka kwa gridi za voltage ya juu hadi seva za AI za enzi ya kidijitali.
Mambo muhimu ya kuzingatia
- Bei za shaba zinabaki karibu na rekodi za juu, zikisaidiwa na mahitaji kutoka vituo vya data vya AI, EVs, na miradi ya nishati mbadala.
- Usumbufu wa usambazaji nchini Chile na Peru, pamoja na kupungua kwa daraja la madini na ucheleweshaji wa miradi, vinabana uzalishaji wa kimataifa.
- Mapato ya taasisi kutoka mifuko ya pensheni na fedha za utajiri wa taifa yamebadilisha shaba kuwa rasilimali ya uwekezaji wa kimkakati.
- JPMorgan inatarajia shaba kufikia $12,000 kwa tani mapema 2026, wakati Morgan Stanley inakadiria nakisi kubwa ya usambazaji hadi 2029.
- Kutokuwa na uhakika wa sera ya biashara na Fed yenye tahadhari kunaweza kuleta kuyumba kwa muda mfupi, lakini misingi ya kimuundo inabaki kuwa ya matumaini makubwa (bullish).
Uhaba wa usambazaji wa shaba unakutana na mahitaji yanayoongezeka
Tofauti na kuongezeka kwa bidhaa hapo awali, kupanda kwa shaba si matokeo ya uvumi - ni jibu kwa usawa mbaya wa kimuundo. Uzalishaji wa kimataifa unaendelea kuhangaika, huku karibu 6% ya usambazaji ukiwa umesimama kwa sasa kutokana na migomo ya wafanyakazi, usumbufu wa hali ya hewa, na vikwazo vya miundombinu kote Amerika Kusini.
Chile na Peru, ambazo kwa pamoja zinachangia takriban 40% ya uzalishaji wa shaba duniani, zinakabiliwa na shinikizo kubwa la uendeshaji. Mitandao ya usafirishaji iliyoharibika, ratiba za matengenezo zilizocheleweshwa, na uwezo mdogo wa usafiri vimepunguza usafirishaji wa madini, wakati viyeyusho vilivyochakaa vinafanya kazi chini ya uwezo.
Kinachoongeza tatizo hili ni jiolojia. Amana mpya za shaba zinatoa madini ya daraja la chini - kwa kawaida maudhui ya shaba ya 0.3–0.8%, ikilinganishwa na 2–5% katika miongo ya awali. Hii inamaanisha wachimbaji lazima wachakate mawe mengi zaidi ili kupata kiasi kilekile cha chuma, hivyo kuongeza gharama na athari za kimazingira.
Wakati huo huo, muda wa maendeleo ya migodi umeongezeka hadi kati ya miaka saba na kumi na nane, ikipunguza kasi ambayo usambazaji mpya unaweza kujibu mahitaji yanayoongezeka. Morgan Stanley inatabiri nakisi ya kimataifa ya tani 590,000 mwaka 2026, ambayo inatarajiwa kuongezeka hadi tani milioni 1.1 ifikapo 2029 - kubwa zaidi katika zaidi ya miongo miwili.

Mapinduzi ya mahitaji ya shaba: AI, EVs, na nishati safi
Mahitaji ya shaba ya muongo ujao hayatatoka kwenye ujenzi au utengenezaji wa jadi, bali kutoka kwa teknolojia zinazoendesha mabadiliko ya nishati na data duniani.
Vituo vya data vya AI vimekuwa chanzo kipya kikuu cha mahitaji. Kulingana na U.S. Department of Energy na utafiti wa Lawrence Berkeley National Laboratory, vituo vya data vinaweza kutumia 6.7% hadi 12% ya jumla ya umeme wa Marekani ifikapo 2028, kutoka 4.4% mwaka 2023. Kila kituo kipya kinahitaji kiasi kikubwa cha shaba kwa ajili ya nyaya, transfoma, na usambazaji wa nguvu.
Magari ya umeme (EVs) ni kichocheo kingine muhimu cha ukuaji. Kila EV ina takriban kilo 40–50 za shaba, takriban mara nne zaidi ya gari linalotumia petroli. Huku uzalishaji wa EV ukiongezeka duniani, nafasi ya shaba katika utengenezaji wa magari inapanuka kwa kasi.
Wakati huo huo, sekta ya nishati mbadala - hasa nishati ya upepo na jua - inaendelea kunyonya kiasi kisicho cha kawaida cha shaba. Taba moja ya upepo wa baharini ya megawati 2–3 hutumia tani 5–7 za shaba kwenye koili zake za jenereta, nyaya, na mifumo ya udhibiti. Usasaishaji wa gridi na uwekezaji wa uhifadhi wa betri unaongeza tu uhitaji huu wa shaba.
Kwa pamoja, nguvu hizi zinachochea kile wachambuzi wengi wanakielezea kama mabadiliko ya mahitaji ya mara moja katika kizazi - ambayo yanaiweka shaba kama kiungo muhimu kati ya umeme, kidijitali, na kupunguza kaboni.
Kasi ya shaba: Chuma cha viwanda hadi rasilimali ya kimkakati
Shaba si chuma cha viwanda tu tena - sasa ni rasilimali ya kifedha na kimkakati. London Metal Exchange inabaki kuwa kipimo kikuu cha bei za kimataifa, lakini viwango vya biashara katika hatima za shaba na ETFs vimeongezeka katika mwaka wa 2025.
Wawekezaji wa taasisi, ikiwa ni pamoja na mifuko ya pensheni na fedha za utajiri wa taifa, wameongeza uwekezaji wao kwenye shaba kama kinga dhidi ya mabadiliko ya nishati duniani. Mahitaji haya ya taasisi yanaongeza shinikizo zilizopo za usambazaji, na kuunda mzunguko ambapo kupanda kwa bei kunavutia mapato zaidi ya mtaji.
Wataalamu wa mikakati ya bidhaa wanabainisha kuwa mzunguko huu unajimarisha wenyewe: "muda wote nakisi zikiendelea, wawekezaji wataendelea kununua uhaba huo," mchambuzi mmoja aliona.
Kwenye Deriv MT5, wafanyabiashara wanaweza kufuatilia harakati za bei ya shaba (XCU/USD) moja kwa moja kupitia chati za hali ya juu na viashiria vya kiufundi - kuwapa ufikiaji wa zana za uchambuzi wa daraja la taasisi zinazotumiwa katika mazingira ya kitaaluma ya biashara.
Ushuru wa shaba, sera, na tahadhari ya Fed
Licha ya misingi imara, utendaji wa muda mfupi wa shaba bado unaathiriwa na sera za biashara na fedha.
Sera ya ushuru inayobadilika ya utawala wa Trump kuhusu shaba iliyosafishwa mapema mwaka huu iliunda kuyumba kati ya viwango vya CME na LME. Wakati ushuru ulipopendekezwa awali, bei za shaba za Marekani zilipanda huku waagizaji wakikimbilia kupata usambazaji. Mara baada ya shaba iliyosafishwa kusamehewa, bei zilirekebishika - lakini pengo hilo lilionyesha jinsi hatari ya kisiasa sasa inavyosogeza masoko ya chuma.
Mapitio ya ushuru ya 2026 yanabaki kuwa tukio la hatari kuu, na wafanyabiashara wanatarajia usumbufu zaidi ikiwa msamaha utaondolewa. Wachambuzi kama Roukaya Ibrahim wa BCA Research wanaamini "uwezekano unaoendelea wa ushuru kwenye shaba iliyosafishwa utaendelea kuathiri soko," kuweka bei za Marekani kwenye kiwango cha juu.
Wakati huo huo, sauti ya tahadhari ya Federal Reserve kuhusu kupunguzwa kwa viwango imepunguza kwa muda mapato ya uvumi kwenye bidhaa. Hata hivyo kwa wawekezaji wa muda mrefu, kubana kwa kimuundo katika usambazaji wa shaba kunafunika kelele za sera za muda mfupi.
Mtazamo wa uwekezaji wa shaba: Njia kuelekea $12,000 na zaidi
JPMorgan Chase inatabiri kuwa bei za shaba zinaweza kufikia $12,000 kwa tani mapema 2026, ikiwakilisha ongezeko la 11% kutoka viwango vya sasa. Mtazamo wake wa matumaini unaungwa mkono na:
- Kupanuka kwa uwekezaji katika nishati mbadala, EVs, na miundombinu ya AI.
- Majibu machache ya usambazaji wa muda mfupi kutoka kwa wazalishaji wakuu.
- Mizunguko mirefu ya maendeleo ya migodi inachelewesha uzalishaji mpya.
- Mahitaji endelevu ya taasisi kwa ajili ya uwekezaji wa bidhaa.
Vile vile, Morgan Stanley inatarajia soko kuingia kwenye nakisi yake kali zaidi katika miaka 22, wakati Goldman Sachs imeelezea shaba kama "fursa ya muda mrefu yenye mvuto zaidi katika mkusanyiko wa metali za viwanda".
Ikiwa utabiri huu utatimia, shaba inaweza kudumisha sakafu mpya ya bei juu ya $10,000 kwa tani, hata mbele ya kushuka kwa uchumi mkuu wa muda.
Uchambuzi wa kiufundi wa shaba
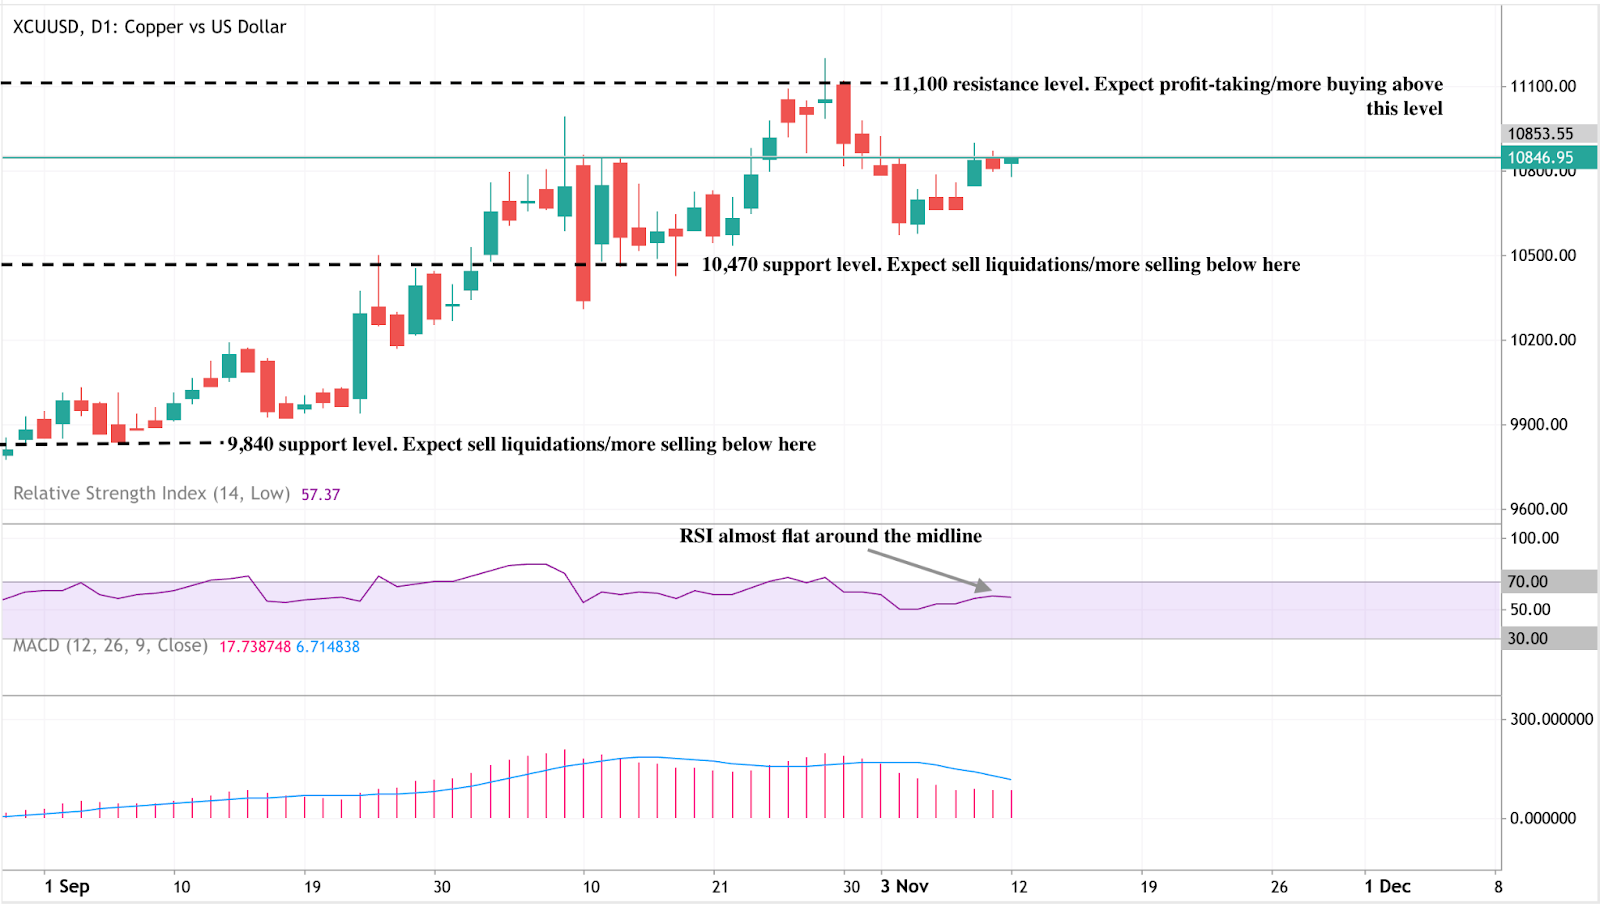
Wakati wa kuandika, Shaba (XCU/USD) inafanya biashara karibu 10,850, ikiimarika kati ya eneo muhimu la msaada la 10,470 na kiwango cha upinzani cha 11,100. Kuvunja juu ya 11,100 kunaweza kuanzisha kasi mpya ya matumaini (bullish), wakati kushuka chini ya 10,470 kunaweza kualika shinikizo jipya la kuuza. Msaada wa chini unaofuata upo karibu 9,840, ambapo uuzaji zaidi unaweza kutokea ikiwa hisia zitageuka kuwa za kukwepa hatari.
Kiashiria cha RSI kinazunguka karibu 57, karibu tambarare karibu na mstari wa kati, ikipendekeza msimamo wa kati - si kununuliwa sana wala kuuzwa sana. Hii inaonyesha soko liko katika hali ya kusubiri na kuona, huku kasi ikikosa mwelekeo wazi.
Wakati huo huo, mstari wa MACD unabaki kidogo juu ya mstari wa ishara lakini unaonyesha kasi inayofifia, ikiakisi msukumo wa matumaini unaodhoofika. Ikiwa MACD itavuka chini ya mstari wa ishara, inaweza kuthibitisha hisia za muda mfupi za kushuka (bearish).
Wafanyabiashara wanaweza kutumia kikokotoo cha biashara cha Deriv kukadiria mahitaji ya margin na uwezekano wa faida wakati wa kufanya biashara ya shaba na metali nyingine. Ili kuongeza uelewa wako wa mikakati ya biashara ya bidhaa, chunguza miongozo ya biashara ya bidhaa ya Deriv - bora kwa wafanyabiashara wapya na wa hali ya juu.
Kuyumba kwa muda mfupi kwa shaba dhidi ya usadikisho wa muda mrefu
Licha ya mwelekeo wa matumaini wa muda mrefu, vikwazo vya muda mfupi vinaendelea. Kushuka kwa sekta ya mali ya China kunaendelea kulemea hisia kwa metali za viwanda, wakati hali ngumu zaidi za kifedha zinaweza kuchelewesha mapato ya uvumi.
Hata hivyo, wachambuzi wanaamini sana kwamba marekebisho yoyote ya bei yatakuwa ya muda mfupi, kwani misingi ya muda mrefu inabaki kuwa yenye kuunga mkono. Kurudi nyuma kuelekea kiwango cha $9,000–$9,500 kunaonekana kama fursa za kununua na fedha zinazojiandaa kwa mwelekeo ujao wa kupanda mwaka 2026.
Uchambuzi: Nini kinachochochea kupanda sambamba kwa bei za Dhahabu na hisa za Marekani?
Kupanda sambamba kwa bei za dhahabu na hisa za Marekani ni jambo lisilo la kawaida kiasi fulani, kwani kiasili, dhahabu inachukuliwa kama rasilimali ya "kimbilio salama".
Kupanda sambamba kwa bei za dhahabu na hisa za Marekani ni jambo lisilo la kawaida kiasi fulani, kwani kiasili, dhahabu inachukuliwa kama rasilimali ya "kimbilio salama" ambayo huwa inafanya vizuri wakati wa kutokuwa na uhakika wa kiuchumi, wakati hisa zinahusishwa zaidi na ukuaji wa uchumi na hamu ya hatari. Mambo kadhaa yanachochea masoko yote mawili kupanda kwa wakati mmoja, kulingana na wachambuzi.
Wafanyabiashara wanaona uwezekano wa 63% wa kupunguzwa kwa pointi 25 za msingi mwezi Desemba, kulingana na zana ya CME ya FedWatch. Simulizi hiyo moja - pesa nafuu - inainua rasilimali ambazo kwa kawaida huenda katika mwelekeo tofauti: dhahabu, kimbilio salama la asili, na hisa, mchezo wa hatari wa kiasili.
Masoko yote mawili yanategemea matumaini yanayochochewa na sera badala ya nguvu za kiuchumi. Data dhaifu ya ajira, hisia hafifu za watumiaji, na dalili za msukumo wa kifedha zinawasukuma wafanyabiashara kujiweka tayari kwa njia laini ya kifedha, ikichochea mkusanyiko wa ukwasi unaofuta mstari kati ya usalama na uvumi.
Mambo muhimu ya kuzingatia
- Dhahabu inashikilia juu ya $4,100 kwa aunzi, kiwango chake cha juu zaidi katika wiki mbili, wakati wafanyabiashara wakitarajia kulegezwa kwa masharti na Fed.
- Hisa za Marekani pia zinapanda huku matarajio ya viwango vya chini yakiongeza uthamini wa mapato ya baadaye.
- Kupanda huku kunaonyesha imani ya ukwasi, sio ukuaji - soko linaloendeshwa na benki kuu, sio misingi.
- Wasiwasi wa kifedha na kupanda kwa mavuno ya Hazina ya Marekani (US Treasury yields) kunaongeza safu ya pili ya msaada kwa dhahabu.
- Mahitaji makubwa ya kifizikia kutoka India na benki kuu yanashikilia bei chini ya wimbi la uvumi.
Wito wa kupunguza viwango vya Fed unachochea dhahabu na hisa za Marekani
Kupanda kwa pamoja kunatokana na mabadiliko ya wazi ya jumla. Data za hivi karibuni za uchumi wa Marekani zimeonyesha kupoteza kasi - ajira za kibinafsi zilidhoofika mwezi Oktoba, ajira za serikali na rejareja zilianguka, na hisia za watumiaji zilishuka hadi kiwango cha chini zaidi katika miezi kadhaa. Masoko yalitafsiri hii kama uthibitisho kwamba Fed itageukia kupunguza viwango mwezi Desemba.
Viwango vya chini vya riba vinaathiri pande zote mbili za soko kwa wakati mmoja:
- Kwa hisa, zinafanya kukopa kuwa rahisi na kuinua thamani ya sasa ya mapato ya shirika.
- Kwa dhahabu, zinapunguza gharama ya fursa ya kushikilia rasilimali isiyo na mavuno.
Matokeo yake ni kupanda kwa pamoja. Wawekezaji hawachagui kati ya usalama na hatari; wanununua vyote viwili, wakiunganishwa na tarajio moja - kurejea kwa pesa rahisi.
Kwa wafanyabiashara kwenye Deriv MT5, mienendo hii ya rasilimali mtambuka imeunda fursa mpya za utofauti, kwani tete katika fahirisi, bidhaa, na metali zote zinaitikia msukumo ule ule wa sera.
Sera ya fedha ya Marekani yaibuka tena kama kichocheo kilichofichika
Kufungwa kwa serikali ya Marekani na utatuzi wake wa muda kumeongeza umakini kwenye utulivu wa kifedha. Maelewano ya pande mbili za Seneti kufungua tena serikali - yakiungwa mkono na Rais Donald Trump - yalipunguza msongo wa soko wa muda mfupi lakini yaliwakumbusha wawekezaji tatizo la deni la muda mrefu la Marekani.
Kama Ole Hansen wa Saxo Bank alivyobainisha, “Kupanda kwa mavuno kunakochochewa na wasiwasi wa kifedha, badala ya nguvu za kiuchumi, kihistoria kumekuwa msaada kwa metali za uwekezaji.” Mavuno ya juu ya dhamana, katika muktadha huu, yanaonyesha wasiwasi juu ya uendelevu wa deni, sio uchumi imara - kuimarisha hoja ya kushikilia dhahabu kama kinga dhidi ya kutokuwa na uhakika wa kifedha.
Kufunguliwa tena kwa mashirika ya serikali pia kutarejesha upatikanaji wa data rasmi za kiuchumi, kutoa uwazi zaidi kwa masoko. Hata hivyo, kwa data hiyo inayotarajiwa kuthibitisha kupungua kwa shughuli, wafanyabiashara wanaona uhalali zaidi kwa Fed kuchukua hatua.
Dhahabu na hisa: Ongezeko la pamoja adimu katika masoko
Dhahabu na hisa kiasili huenda katika mwelekeo tofauti. Moja inawakilisha hofu, nyingine imani. Hata hivyo, tabia ya soko ya 2025 inapendekeza kwamba vyote sasa ni maonyesho ya matarajio ya ukwasi.
Wakati wawekezaji wanatarajia kulegezwa kwa fedha, kila kitu kinachofaidika na pesa nafuu hupanda - kutoka dhahabu hadi hisa za teknolojia ya ukuaji. Mabadiliko haya ya uhusiano yanaangazia mabadiliko ya kimuundo katika jinsi masoko yanavyofanya kazi: matarajio ya sera yamechukua nafasi ya misingi kama kichocheo kikuu cha bei.
Uwezo wa dhahabu kupanda hata wakati dola ya Marekani inaimarika unasisitiza mabadiliko hayo. Mienendo ya sarafu inafunikwa na utawala wa sera ya benki kuu katika upangaji bei wa rasilimali za kimataifa.
Mahitaji ya dhahabu yanaongeza kina kwenye kupanda huko
Zaidi ya simulizi ya uvumi, kupanda kwa dhahabu kuna msaada mkubwa wa ulimwengu halisi. Mahitaji ya kifizikia yanabaki kuwa imara, hasa nchini India na miongoni mwa benki kuu:
- Mapato ya ETF ya dhahabu ya India yalifikia $2.9 bilioni katika miezi 10 ya kwanza ya 2025 - sawa na tani 26 za dhahabu, karibu kulingana na jumla ya kuanzia 2020 hadi 2024 kwa pamoja.
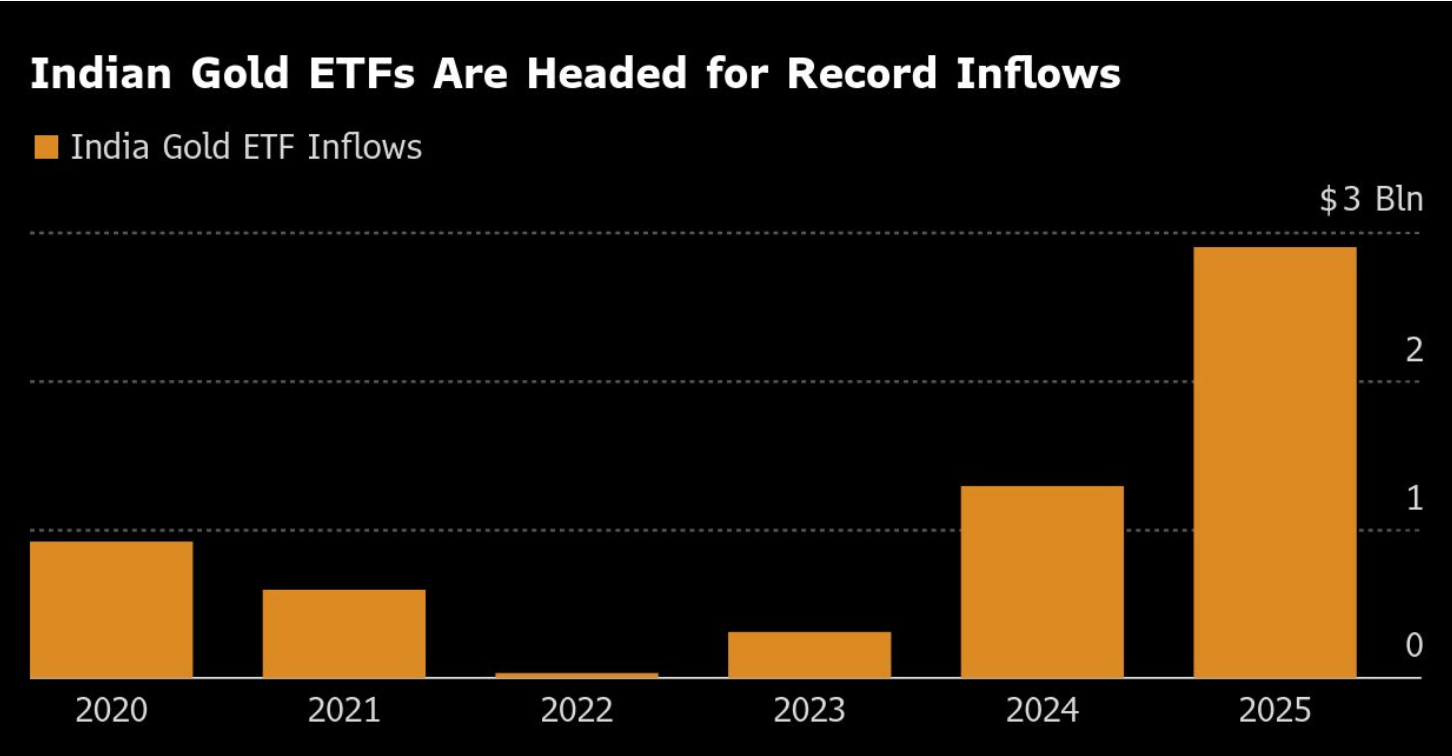
- Oktoba pekee ilishuhudia $850 milioni katika mapato mapya, kufuatia rekodi ya $942 milioni mwezi Septemba.
- Jumla ya umiliki wa ETF wa India sasa unasimama kwa tani 83.5, zenye thamani ya zaidi ya $11 bilioni.
Mahitaji haya yanapendekeza kuwa kupanda huko sio kwa uvumi tu. Kunaonyesha hamu ya kweli ya kimataifa kwa dhahabu kama hifadhi ya thamani ya muda mrefu - kipingamizi kwa kutokuwa na uhakika wa kifedha na sera.
Wachimbaji wa dhahabu wanaakisi imani ya wawekezaji
Upande wa ushirika wa soko la dhahabu unaunga mkono hisia hii. Barrick Gold (ABX.TO), mmoja wa wazalishaji wakubwa duniani, alipandisha gawio lake la robo mwaka kwa 25% na kupanua mpango wake wa kununua hisa wa $500 milioni baada ya kuripoti faida iliyorekebishwa iliyozidi matarajio.
- Wastani wa bei ya dhahabu iliyopatikana: $3,457 kwa aunzi, juu kutoka $2,494 mwaka mmoja uliopita.
- Uzalishaji ulianguka kutoka aunzi 943,000 hadi 829,000, wakati gharama zote za uendelezaji zilipanda kidogo hadi $1,538 kwa aunzi.
Licha ya changamoto za kiutendaji na kufutwa kwa $1 bilioni kulikohusishwa na kupoteza mgodi wake wa Mali, mabadiliko ya kimkakati ya Barrick kuelekea uzalishaji wa Amerika Kaskazini yanaashiria imani katika bei za juu za dhahabu endelevu.
Hata hivyo, mzozo wa Mali - ambao unajumuisha kuzuiliwa kwa wafanyakazi na vikwazo vya usafirishaji - unasisitiza udhaifu wa kijiografia wa usambazaji wa dhahabu duniani, jambo ambalo linaweza kubana masoko zaidi ikiwa halitatatuliwa.
Mandhari ya soko: deni, mavuno, na kitendawili cha sera
Kupanda kwa dhahabu kwa zaidi ya 50% mwaka huu sio tu tafakari ya hofu ya mfumuko wa bei. Ni jibu kwa udhaifu wa kifedha na utegemezi wa soko kwa ukwasi.
Kupanda kwa mavuno ya Hazina ni ishara ndogo ya afya ya uchumi na zaidi ni onyo kuhusu uendelevu wa deni. Wawekezaji wanununua dhahabu kama kinga dhidi ya hatari hizi za kimuundo huku wakipandisha bei za hisa kwa dhana kwamba ukwasi utaendelea kutiririka.
Tabia hii mbili - kutafuta usalama na hatari kwa wakati mmoja - ndio kitendawili kinachofafanua saikolojia ya soko ya 2025.
Dhahabu na hisa za Marekani: Matukio ya miezi ijayo
- Kuvunja kwa kupanda (Bullish breakout)
Ikiwa Fed itapunguza viwango mwezi Desemba na kuashiria kulegezwa zaidi, dhahabu inaweza kuvunja $4,200 haraka, ikisaidiwa na wasiwasi wa kifedha na mahitaji thabiti ya benki kuu.
- Uimarishaji wa muda mfupi
Msimamo wa tahadhari au uliocheleweshwa wa Fed unaweza kuona dhahabu ikielea kati ya $4,050 na $4,150, huku hisa zikitarajiwa kudumisha faida hadi matarajio ya ukwasi yatakapofifia.
Vyovyote vile, jambo kuu la kuzingatia ni kwamba dhahabu na hisa sasa zinajibu kichocheo kile kile cha uchumi mkuu - bei ya pesa - badala ya nguvu za kihisia zinazopingana.
Uchambuzi wa kiufundi wa Dhahabu
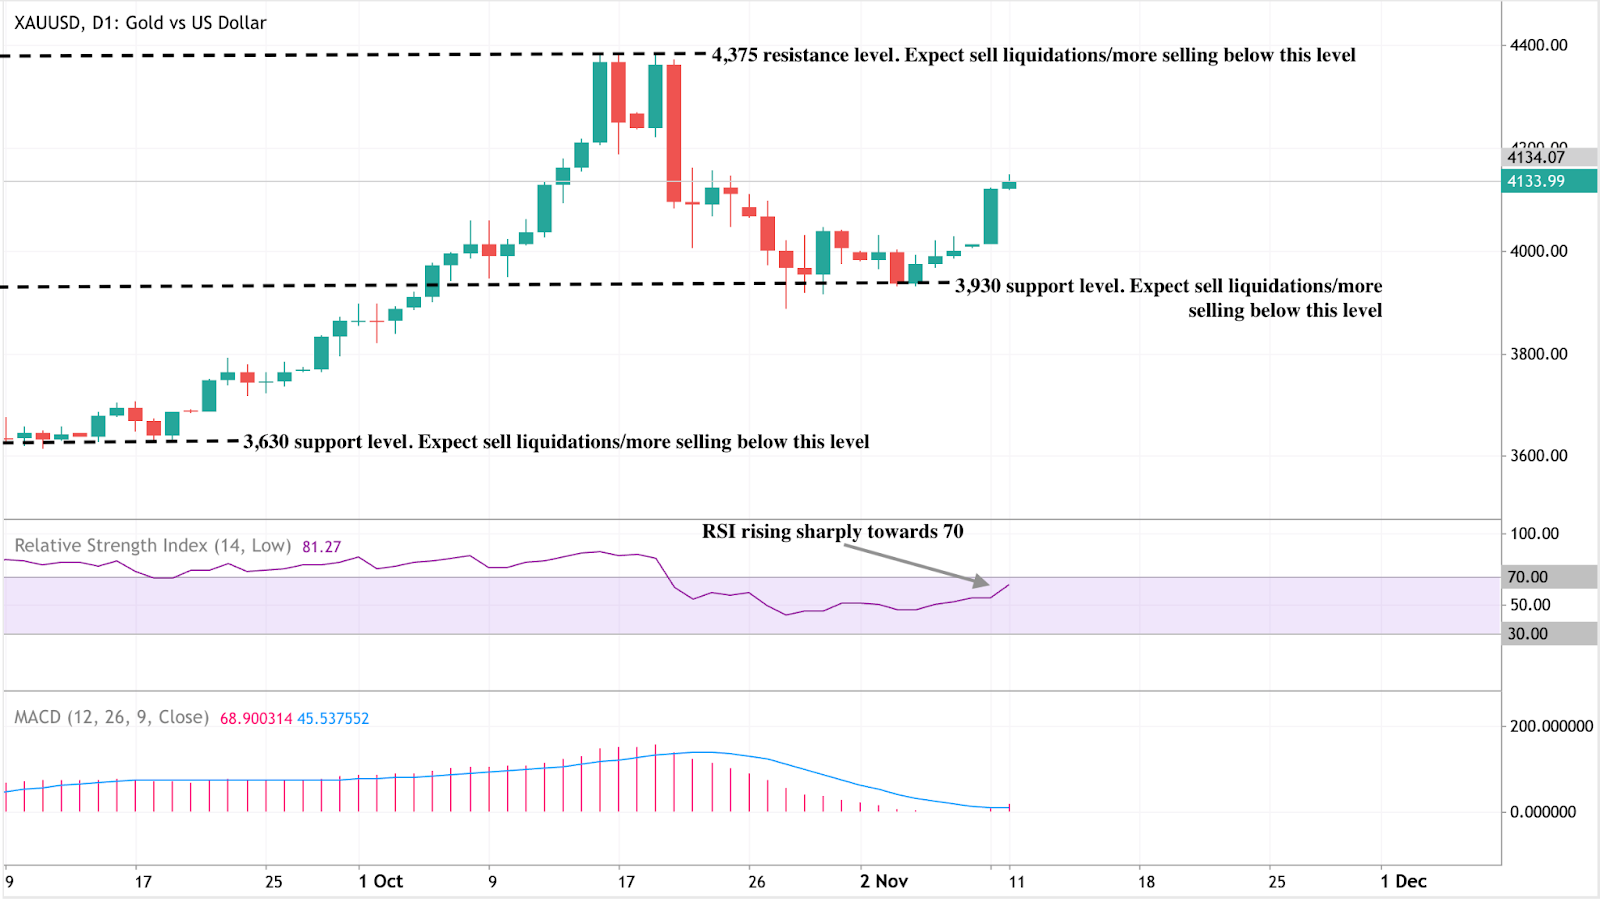
Dhahabu (XAU/USD) inafanya biashara karibu na $4,134, ikiimarika kati ya viwango muhimu - upinzani katika $4,375 na msaada katika $3,930. Kuvunja juu ya $4,375 kunaweza kuongeza kupanda, wakati kushuka chini ya $3,930 kunahatarisha uuzaji mpya kuelekea $3,630.
RSI (81) inaonyesha kasi kubwa ya kupanda (bullish) lakini inaashiria hali ya kununuliwa kupita kiasi (overbought), ikipendekeza uwezekano wa uimarishaji wa muda mfupi au kurudi nyuma. Wakati huo huo, MACD inabaki katika makutano ya kupanda, ikithibitisha shinikizo la kununua linaloendelea.
Kwa ujumla, mwelekeo wa dhahabu unabaki chanya juu ya $3,930, lakini wafanyabiashara wanapaswa kuangalia kupoa kwa kasi karibu na maeneo yaliyonunuliwa kupita kiasi. Unaweza kufuatilia viwango hivi moja kwa moja kwenye Deriv MT5 au jaribu mipangilio ya margin na hatari ukitumia Kikokotoo cha Biashara cha Deriv kupanga nafasi katika metali na fahirisi.
Mtazamo wa uwekezaji wa Dhahabu
- Wafanyabiashara wa muda mfupi: Eneo la $4,100–$4,200 ndio safu muhimu ya kuangalia kabla ya uamuzi wa Fed wa Desemba.
- Wawekezaji wa muda wa kati: Msongo wa kifedha, tete ya mavuno halisi, na mahitaji ya India yanaunda vichocheo vya msingi kwa nguvu inayoendelea.
Wasimamizi wa kwingineko: Uhusiano unaoendelea wa dhahabu na hisa unamaanisha kuwa sasa inafanya kazi kama rasilimali sambamba inayojali sera, sio kinga safi. Mikakati ya utofauti inapaswa kuzingatia mabadiliko haya ya kimuundo.

Can a tariff dividend create a new liquidity cycle for Bitcoin in 2025?
Analysts suggest that President Donald Trump’s proposed $2,000 “tariff dividend” has fuelled a wave of market optimism rather than a genuine injection of liquidity.
Yes - but only in sentiment, not in substance. Analysts suggest that President Donald Trump’s proposed $2,000 “tariff dividend” has fuelled a wave of market optimism rather than a genuine injection of liquidity.
The announcement triggered a short-lived crypto rebound, lifting Bitcoin back above $104,000, as traders drew parallels with the 2020 pandemic payments that helped fuel the last major bull run. Yet with limited fiscal backing and political obstacles, many believe this rally may be driven more by sentiment than by substance.
Key takeaways
- Trump’s $2,000 “tariff dividend” prompted a brief rally in Bitcoin and Ethereum, despite serious doubts over its feasibility.
- Funding gap: The proposed payout would cost around $300 billion, but tariff revenues generate only about $90 billion net.
- Institutional demand remains strong, with $2.7 billion in ETF inflows and BlackRock’s IBIT managing close to $100 billion in BTC.
- The Federal Reserve’s 25-basis-point rate cut and improved risk appetite continue to support Bitcoin above the $100K mark.
- Analysts see two paths: A climb towards $120K–$125K if optimism holds, or a slide below $100K once political enthusiasm fades.
- Crypto’s sensitivity to liquidity narratives underscores how sentiment - not policy - often leads market direction.
Trump’s tariff dividend promise and the market reaction
In a Truth Social post, President Trump claimed that the United States was generating “trillions of dollars” from tariffs and could use those funds to both reduce its $38 trillion national debt and finance a “dividend” for most Americans, excluding high earners.
The statement triggered a modest crypto rally as traders priced in the possibility of more household liquidity.
Markets quickly drew comparisons to the pandemic-era stimulus cheques that helped spark a historic bull market. Traders, long conditioned to respond to any hint of fresh money supply, reacted instinctively - even though the policy remains more political talking point than fiscal plan.
Why the maths don’t add up
Despite the excitement, the numbers simply do not work. Fiscal experts note that Trump cannot unilaterally authorise such payments; they require Congressional approval and a new funding bill.
The funding shortfall is also substantial:
- A $2,000 payment for 150 million adults would cost around $300 billion.
- Tariff collections to date total $120 billion, and after factoring in slower economic growth and lower tax receipts, net revenue sits closer to $90 billion.
As Erica York, Vice President of Federal Tax Policy, explained: “Each dollar raised through tariffs offsets about 24 cents in income and payroll tax revenue.” In short, the government lacks both the legal authority and the financial headroom to execute this plan, making any near-term payout highly unlikely.
Stimulus Déjà Vu: Why markets still care
The crypto rally reflects not fiscal reality but liquidity psychology. Even without concrete policy action, the mere suggestion of a “dividend” rekindles traders’ belief in free-flowing money and renewed risk-taking.
This mirrors 2020, when stimulus payments coincided with a surge in Bitcoin and altcoins as retail investors redirected government cheques into digital assets.

Although the scale is smaller this time, the pattern remains: crypto markets respond instantly to liquidity cues - whether real or imagined.
Bitcoin ETF inflows and structural strength
Beyond political headlines, Bitcoin’s structural outlook remains solid. Institutional inflows into U.S. spot Bitcoin ETFs exceeded $2.7 billion in early November, led by BlackRock’s IBIT and Fidelity’s FBTC. IBIT alone now holds $80.47 billion, cementing its position as the fastest-growing ETF in U.S. history.
Macroeconomic conditions are also supportive:
- The Federal Reserve’s 25-basis-point rate cut has lifted risk appetite.
- Trump’s pardon of Binance founder Changpeng Zhao signalled a more conciliatory stance towards crypto.
- Thailand and Malaysia are exploring the inclusion of Bitcoin in national reserves, marking a step towards mainstream adoption.
These developments indicate that even if Trump’s “dividend” proves politically untenable, the underlying liquidity narrative remains alive.
Market impact and price scenarios
If bullish sentiment and ETF inflows persist, Bitcoin could extend towards $120,000, driven by institutional accumulation and looser policy. However, should enthusiasm fade, a pullback below $100,000 remains a possibility as traders reassess the fundamentals.
So far, Bitcoin’s stability above $100,000 reflects confidence from institutional investors - although analysts warn that the rally is driven more by belief than by financial logic.
Bitcoin technical insights
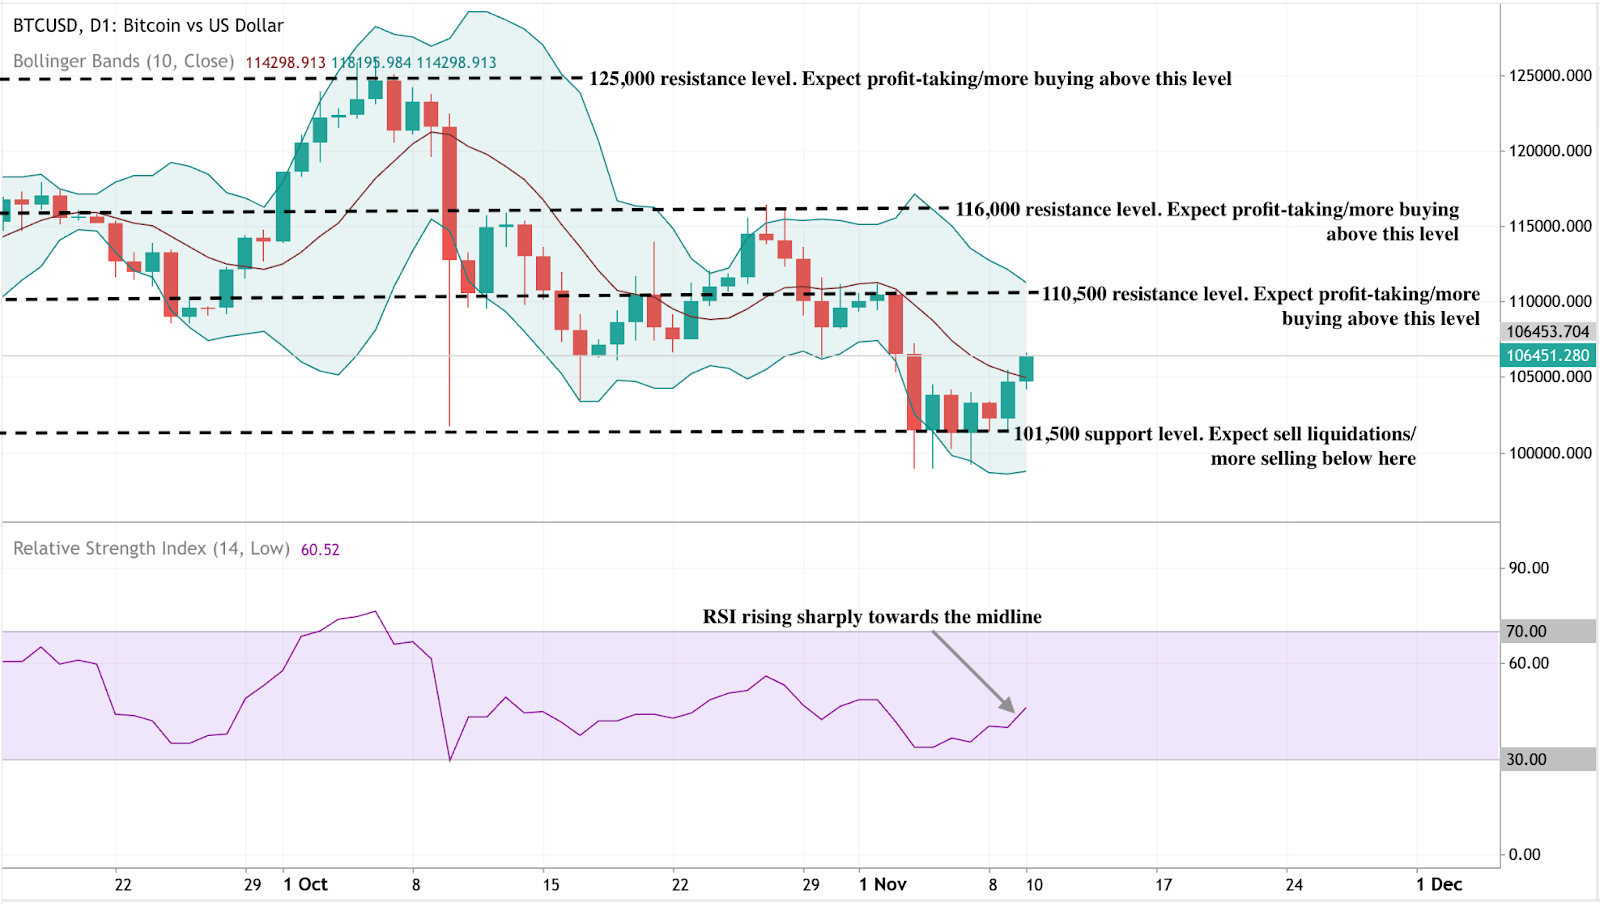
Bitcoin’s price action shows early signs of recovery after holding above the key $101,500 support level, where sellers appear to have exhausted their momentum. This level remains crucial - a decisive break below could trigger further liquidations. On the upside, $110,500 serves as the first major resistance, followed by $116,000 and $125,000, where profit-taking is likely to intensify.
The Bollinger Bands are beginning to narrow after a period of strong volatility, suggesting potential consolidation before the next breakout. The price is also attempting to climb back toward the middle band (the 10-day moving average), signalling an improving short-term outlook.
Meanwhile, the RSI (14) has risen sharply to around 60, pointing to strengthening bullish momentum without yet entering overbought territory. If RSI continues upward past 60–70, it would confirm a shift in market sentiment toward renewed buying pressure.
Investment implications
For traders, sentiment remains the main short-term driver. Bitcoin’s $100K level represents the critical dividing line between bullish conviction and renewed caution.
Those trading crypto through Deriv MT5 can access advanced charting tools and cross-market analysis, making it easier to track correlations between Bitcoin, gold, and the U.S. dollar - especially during policy-driven volatility.
Meanwhile, traders can use the Deriv Trading Calculator to estimate potential profits, required margin, and swap rates before entering a position, ensuring tighter risk control in fast-moving conditions.
- Short term: Tactical buying opportunities exist above $102K–$104K if ETF inflows remain robust.
- Medium-term: Expect volatility tied to political announcements and monetary policy signals.
Long-term: Institutional accumulation and steady global adoption continue to underpin a structurally bullish outlook, even if near-term hype cools.
Is Filecoin’s price surge the start of a broader crypto market recovery?
According to experts, Filecoin’s 50% surge could mark the early stages of a broader recovery across the cryptocurrency market, driven by renewed interest in utility-based blockchain assets.
According to experts, Filecoin’s 50% surge could mark the early stages of a broader recovery across the cryptocurrency market, driven by renewed interest in utility-based blockchain assets. The decentralised storage token’s sharp rebound above the $2 level has placed it at the forefront of the DePIN (Decentralised Physical Infrastructure Network) rally - a niche sector that has gained roughly 11% overall in recent days.
Analysts point to rising network activity, strong developer funding, and growing institutional focus on real-world blockchain utilities as reasons why Filecoin’s latest move may represent more than just a speculative bounce. Still, whether the rally extends further will depend on broader market sentiment and sustained adoption within the decentralised storage ecosystem.
Key takeaways
- Filecoin leads crypto recovery: Up over 50% in 24 hours, Filecoin is outperforming most major tokens and driving gains in the DePIN sector.
- DePIN sector strength: Decentralised infrastructure projects have collectively gained 11%, signalling investor interest in tokens with tangible use cases.
- Ecosystem investment expanding: Protocol Labs has launched RetroPGF Round 3, allocating 585,000 FIL to support developer projects from November 2024 to September 2025.
- Market capitalisation: Filecoin’s valuation now stands at $1.52 billion, ranking it among the top 50 public blockchains.
- A short-term focus on maintaining momentum above $2 could pave the way for a move to $3, a key technical resistance level.
- Long-term outlook: Experts see Filecoin as a leading project in the growing Web3 infrastructure and decentralised storage economy.
Filecoin rally leads the market’s structural recovery
Filecoin’s performance is part of a broader market trend where investors are shifting capital towards utility-based projects - tokens that provide real-world functionality. Within this trend, DePIN networks stand out. These projects bridge physical resources such as computing power, energy, and data storage with blockchain incentive mechanisms, creating measurable productivity within decentralised systems.
The DePIN sector’s 11% rise reflects a shift in sentiment from speculative trading towards functional blockchain services. Filecoin’s 50% rally to above $2.00 has cemented its status as the flagship token for decentralised storage and one of the strongest indicators that the market is rediscovering value in blockchain infrastructure.

Filecoin vs traditional cloud storage
Launched in October 2020 by Protocol Labs, Filecoin provides a peer-to-peer marketplace for data storage. It enables users to rent out unused hard drive space, earning FIL tokens in exchange. Unlike traditional storage services such as Google Drive, iCloud, or Dropbox, Filecoin’s system operates without a central authority - meaning that pricing, availability, and access are determined entirely by the network.
The system relies on two unique consensus mechanisms:
- Proof-of-Replication (PoRep): Verifies that storage providers hold exact copies of the data they claim to store.
- Proof-of-Spacetime (PoSt): Confirms that the data remains stored for the entire agreed period.
Together, these mechanisms make Filecoin’s network verifiable, secure, and tamper-resistant, addressing long-standing challenges in data storage trust and transparency.
Decentralised storage: From research to real-world impact
Filecoin’s origins date back to 2014, when Protocol Labs developed the InterPlanetary File System (IPFS) - a decentralised file-sharing protocol designed to replace centralised web servers. Filecoin was later introduced as the economic layer of IPFS, incentivising users to store and maintain data using blockchain rewards.
In August 2017, Filecoin completed one of the largest token offerings in crypto history, raising $257 million in its Initial Coin Offering (ICO). Major investors, including Sequoia Capital, Union Square Ventures, and Digital Currency Group, backed the project.
By the time its mainnet launched in October 2020, Filecoin had become one of the most anticipated blockchain networks globally. Its price soared to an all-time high of $236.97 in 2021 before correcting sharply alongside the broader market downturn. Despite that decline, the network has continued to expand and maintain strong developer interest, positioning it as one of the most credible decentralised storage solutions in the Web3 space.
Filecoin’s ecosystem expansion reinforces fundamentals
While price volatility has dominated headlines, Filecoin’s ecosystem growth has been quietly strengthening. Protocol Labs recently launched RetroPGF Round 3, allocating 585,000 FIL to projects that contributed to the ecosystem between late 2024 and 2025.
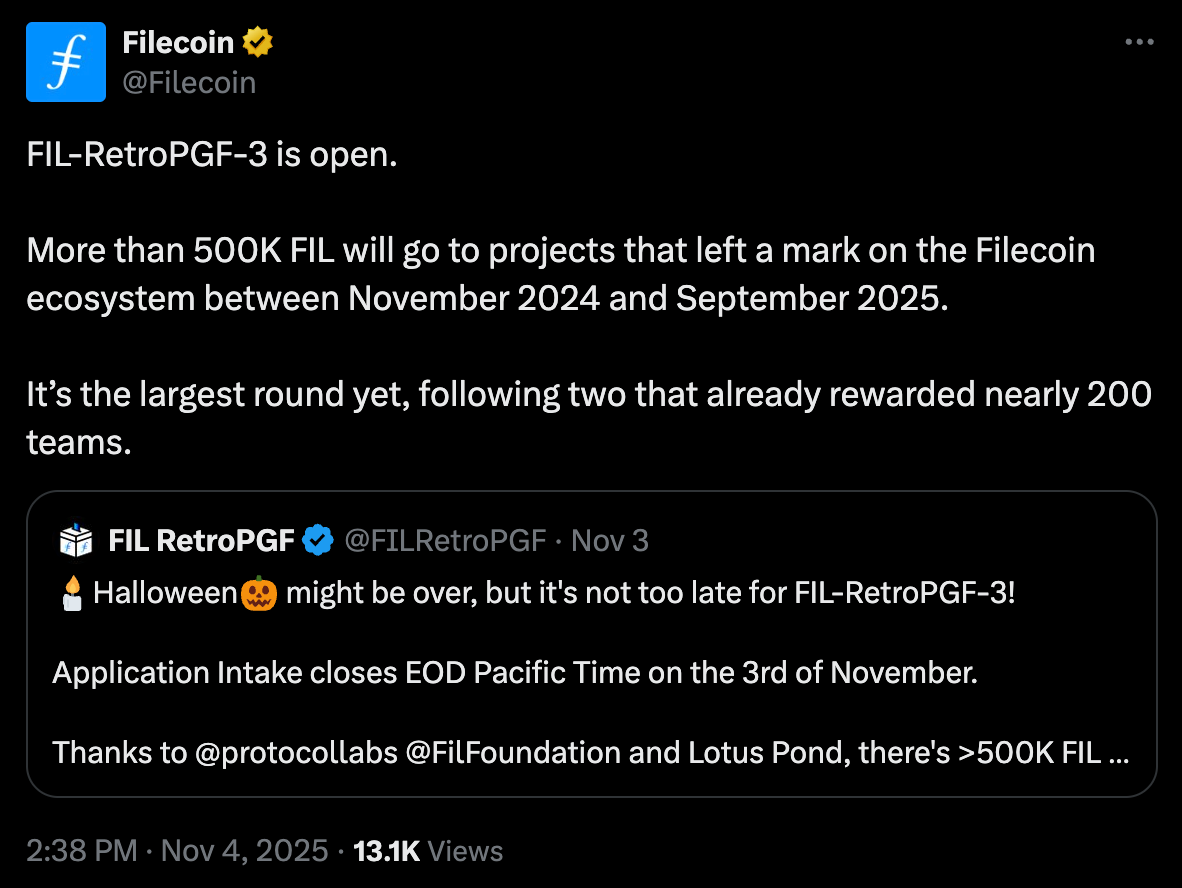
This round follows two earlier programmes that rewarded nearly 200 development teams, supporting innovations in decentralised computing, data retrieval, and dApp integration. The funding initiative underscores Filecoin’s commitment to sustainable growth - a key differentiator in a market often driven by short-term speculation.
Such ecosystem support not only encourages innovation but also signals confidence to institutional investors who are increasingly assessing Web3 infrastructure projects as long-term opportunities.
Market outlook: Can Filecoin sustain momentum?
Breaking past the $2 psychological level marks a pivotal moment for Filecoin. The next major resistance sits near $3, a level last tested in mid-2023. Technical analysts suggest that continued momentum could propel prices toward this mark if trading volumes remain high and the DePIN rally sustains.
However, Filecoin still trades far below its 2021 highs, underscoring both its potential for recovery and its vulnerability to market sentiment. Short-term corrections are possible as traders take profits, but experts say the latest surge is supported by more robust fundamentals than previous speculative rallies.
With a market cap of $1.52 billion and growing integration across decentralised applications, Filecoin is viewed as a key player in Web3’s evolving infrastructure layer. Its combination of utility, decentralisation, and developer support could allow it to benefit from the next major rotation into functional crypto assets.
Filecoin technical analysis
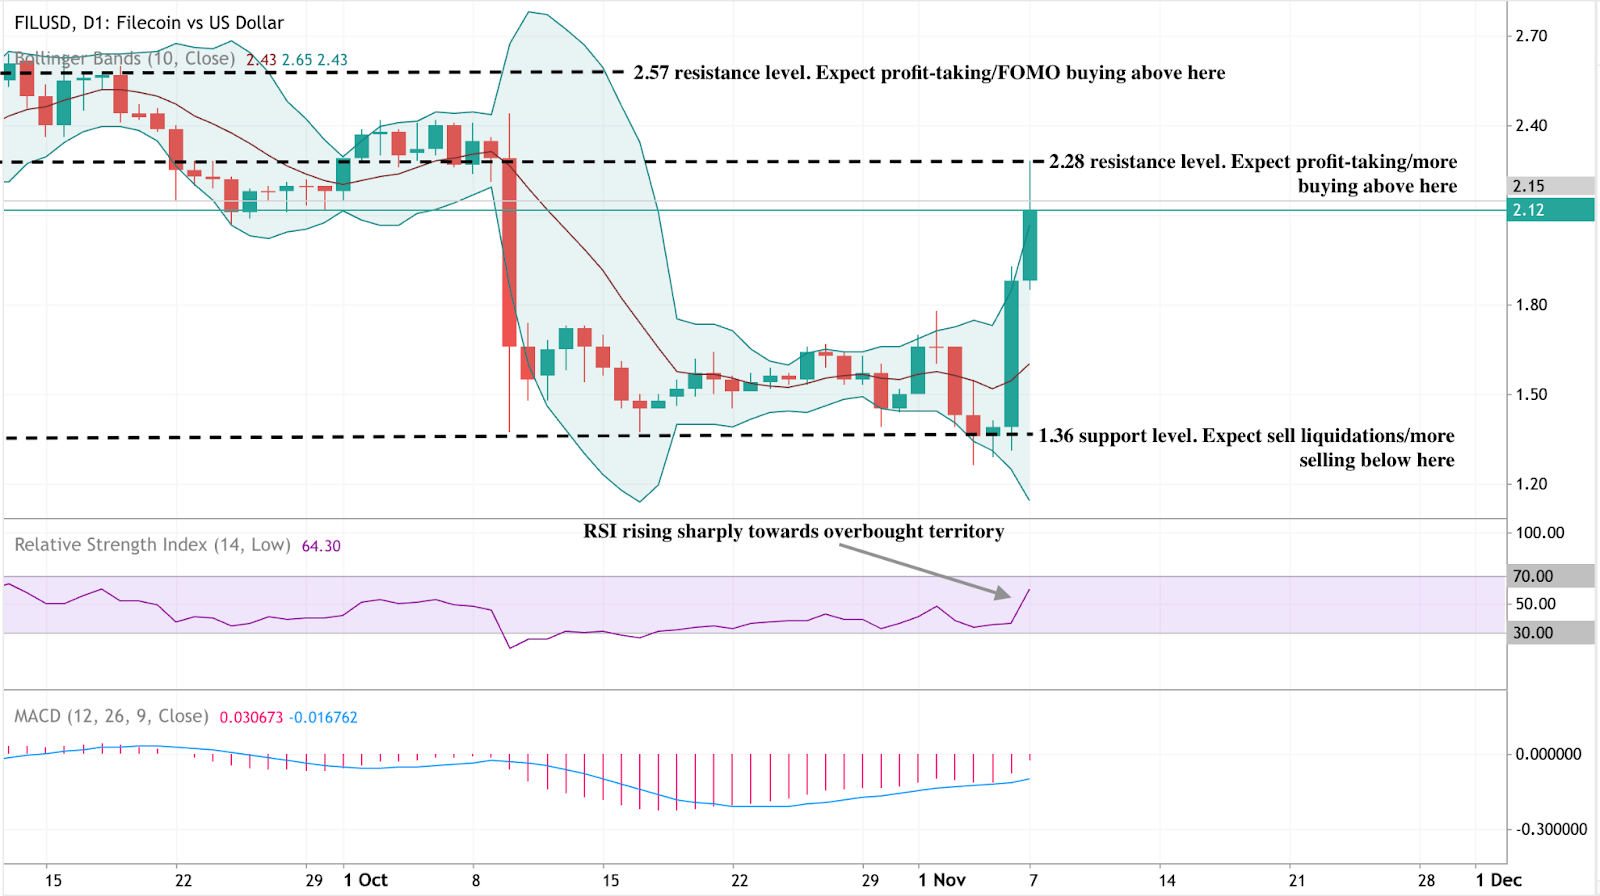
At the time of writing, Filecoin (FIL/USD) is trading around $2.12, extending its rally after rebounding from the $1.36 support level. The Bollinger Bands have expanded, reflecting heightened volatility, with price now testing the upper band - often a sign of short-term exhaustion. The RSI, at 64.3, is rising sharply toward the overbought zone, suggesting momentum remains strong but could soon face a cooling period.
Meanwhile, the MACD has turned positive with a fresh bullish crossover, reinforcing the current uptrend. However, traders should monitor momentum closely as the histogram begins to flatten. The next key resistance levels sit at $2.28 and $2.57, where profit-taking or renewed buying may occur. On the downside, $1.36 remains the critical support level - a break below it could trigger another wave of selling.
To explore and analyse these setups in real-time, traders can track Filecoin price action directly on Deriv MT5, which provides advanced charting tools, indicators, and multi-asset trading access for crypto, forex, and commodities markets.
Filecoin’s short-term outlook is bullish but nearing overbought territory, hinting at a potential cooldown if resistance levels hold.
Filecoin investment implications
For traders, Filecoin’s recent breakout offers short-term momentum opportunities above the $2 level, with upside potential towards $3 if DePIN sector strength continues. Caution remains warranted given crypto market volatility, but the technical setup favours buyers as long as Filecoin holds its newly reclaimed support zone.
For long-term investors, Filecoin stands out as one of the few blockchain networks with clear real-world use cases. Its robust developer base, institutional backing, and role in the decentralised data economy make it an appealing bet on the future of Web3 infrastructure.
Competition from centralised cloud giants and other blockchain storage protocols could cap growth if adoption plateaus. Filecoin’s success will depend on scaling efficiently, maintaining ecosystem incentives, and integrating more deeply into decentralised application frameworks.
Before entering Filecoin positions, traders can use the Deriv trading calculator to estimate potential profit and loss based on position size, leverage, and price movement - an essential tool for managing risk in volatile crypto markets.
Trading Filecoin on Deriv
- Momentum trading: Traders can use RSI and MACD crossovers on Deriv MT5 to capture short bursts of volatility during rallies above key breakout levels.
- Range trading: When Filecoin consolidates between $1.80–$2.50, short-term traders may use Bollinger Band reversals to enter positions at range extremes.
- Breakout strategy: A sustained move above $2.57 could signal a new bullish leg toward $3.00 - traders can confirm signals using MT5’s volume indicators and EMA crossovers.

How Solana’s real-world integrations are redefining crypto in 2025
From institutional ETFs to payment infrastructure and decentralised finance (DeFi) applications, Solana is reshaping what it means for a blockchain to operate at scale in 2025.
Solana’s expanding real-world integrations - ranging from institutional ETFs to payment infrastructure and decentralised finance (DeFi) applications - are redefining what it means for a blockchain to operate at scale in 2025. The network’s steady ETF inflows, validator reforms, and partnership activity show that Solana’s growth story is no longer simply about price volatility; it is about building financial and operational depth across both on-chain and institutional layers.
Key takeaways
- Institutional inflows remain steady: Solana ETFs have recorded six consecutive days of positive inflows, signalling confidence from long-term investors.
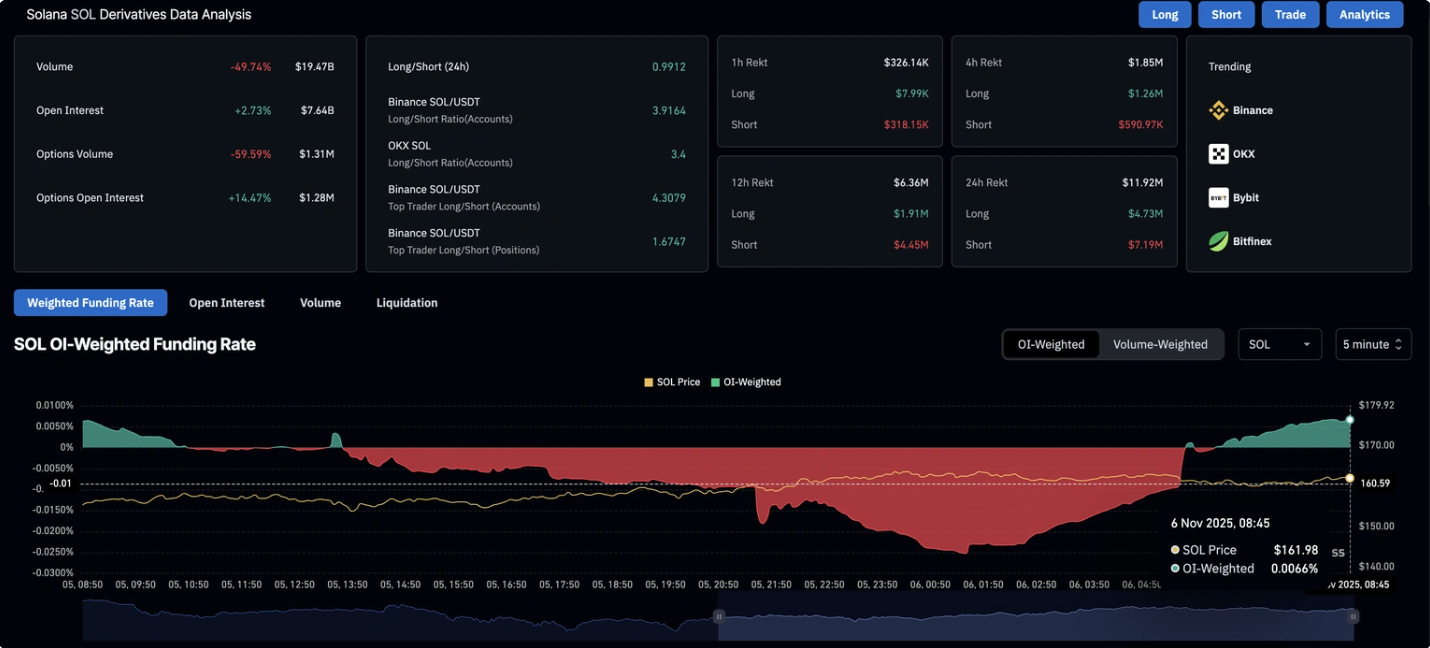
- Retail activity returns: Futures open interest has climbed to $7.64 billion, up 2.73% in 24 hours, while funding rates have turned positive - a sign of renewed retail optimism.
- Real-world integration grows: Solana is under evaluation for Western Union’s blockchain-based remittance pilot, positioning it for mainstream financial use.
- Network efficiency improves: Validator count has fallen 64% since early 2023, yet performance has strengthened as outdated operators were removed.
- Liquidity risks persist: Despite Solana total value locked (TVL) rising to $10.2 billion, stablecoin liquidity has declined 8.16% in a week - a warning for on-chain demand.
Solana institutional investment anchors Solana’s 2025 momentum
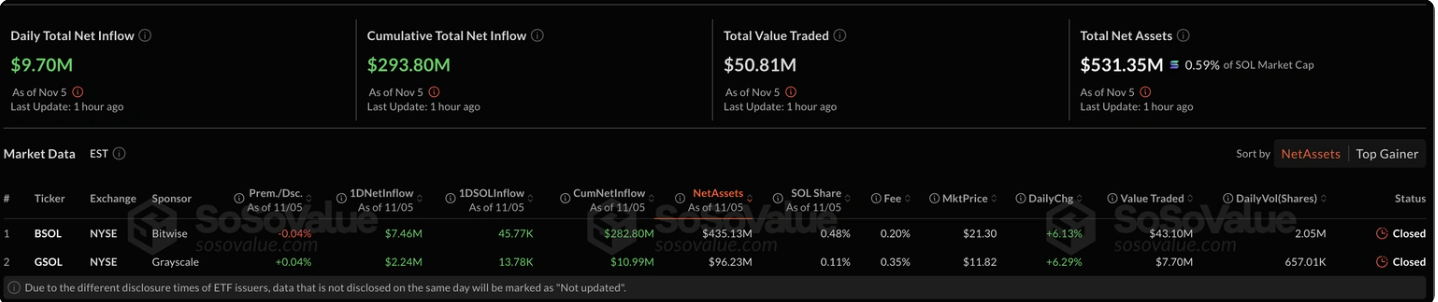
Institutional interest has become the foundation of Solana’s resilience this year. The Bitwise Solana Staking ETF (BSOL) drew $417 million in its debut week - outpacing even Bitcoin and Ethereum products - while the Grayscale Solana Trust (GSOL) attracted more than $1 million on its first day.
This consistent flow marks Solana’s shift from speculative trade to structured investment vehicle. For the sixth consecutive day, Solana ETFs have reported net inflows totalling $9.7 million mid-week, as professional investors position for long-term exposure despite macroeconomic uncertainty.
The rise of ETFs also introduces new liquidity and transparency. Each inflow represents a vote of confidence in Solana’s sustainability, particularly significant in a market shaped by cautious institutional allocators following the turbulence of 2022–23.
Solana retail traders re-engage as on-chain data strengthens
Following a weak start to the week, retail interest in Solana has picked up. According to CoinGlass, open interest in Solana futures increased 2.73% within 24 hours, and funding rates flipped from negative to positive territory. This indicates an expansion in leveraged long positions as traders bet on a continued rebound from the $155 support zone, with potential tests at $174–$177.
Short liquidations totaling $7.19 million exceeded long liquidations of $4.73 million, indicating that bearish positions were squeezed out and adding upward pressure on the price. The long-to-short ratio of 0.9912 indicates a market leaning cautiously bullish, yet still balanced.
Solana validator reforms make the network leaner and faster
Solana’s validator count has declined from around 2,500 to under 900 since 2023 - a 64% reduction - but this contraction reflects strategic consolidation rather than weakness. Many of the removed validators were outdated, slow, or linked to exploitative trading behaviours such as “sandwich” attacks.
The Solana Foundation has restructured its subsidy programme, now removing three subsidised validators for every new one added. The result: lower congestion, smoother transaction flow, and a healthier infrastructure.
As Tomas Eminger, Chief Infrastructure Officer at RockawayX, noted, this shift improves hardware quality and eliminates inefficiencies that previously slowed the network.
Solana real-world adoption: From DeFi to payments
Beyond market speculation, Solana is strengthening its institutional relevance through real-world adoption. Western Union has officially partnered with Solana to develop and test blockchain-powered cross-border transfer systems.
If adopted, the integration could channel significant transactional volume through Solana’s ecosystem, lifting both TVL and stablecoin demand. Simultaneously, developers are expanding Solana’s DeFi and asset-listing infrastructure:
- New perpetual markets are live.
- Launchpads are enabling faster token distribution.
- A revised asset-listing process simplifies onboarding for fintech and DeFi projects.
Together, these improvements suggest that Solana’s next growth phase will be driven less by speculative yield-farming and more by functional adoption - a shift reminiscent of how cloud computing matured from experimentation to enterprise utility.
Solana’s liquidity constraints: The risk beneath the rally
Despite these advances, the network faces liquidity constraints. DeFiLlama data shows Solana’s TVL rose 2.27% in 24 hours to $10.215 billion, but its stablecoin market capitalisation fell 8.16% over the week to $13.816 billion.

Falling stablecoin liquidity often signals shrinking capital reserves for decentralised applications, potentially reducing on-chain activity even as price metrics remain elevated.
If this decline continues, Solana may require stronger external inflows, such as ETF-driven liquidity or new payment-related transactions, to sustain ecosystem growth.
Comparing Solana’s institutional path to gold’s macro role
Solana’s 2025 performance mirrors gold’s cautious yet persistent rally amid uncertainty from the Federal Reserve. Both assets now reflect investor demand for alternatives that combine liquidity with long-term value preservation.
Just as gold ETFs legitimised physical gold as a mainstream portfolio component in the early 2000s, Solana’s regulated ETFs are giving institutions a compliant channel to access crypto exposure.
If the Fed’s December meeting signals prolonged policy tightness, risk assets could falter - yet steady institutional inflows suggest Solana is maturing into a digital asset capable of weathering policy-driven volatility.
Solana trading strategies on Deriv
- Breakout trading: Use Bollinger Bands or trendlines on Deriv MT5 to identify volatility-driven price movements. A confirmed breakout above resistance levels, such as $178 could indicate a bullish momentum continuation.
- Swing trading: Analyse Solana’s RSI and moving averages to time short- to medium-term entries. Combining this with the Deriv Trading Calculator can help manage position sizes and margin efficiently.
- Range trading: During consolidation, consider buying near support and selling near resistance using smaller lot sizes to manage risk effectively.
Deriv provides tight spreads, flexible leverage, and 24/7 access to crypto markets, allowing traders to act swiftly as Solana’s price responds to institutional flows or network developments.
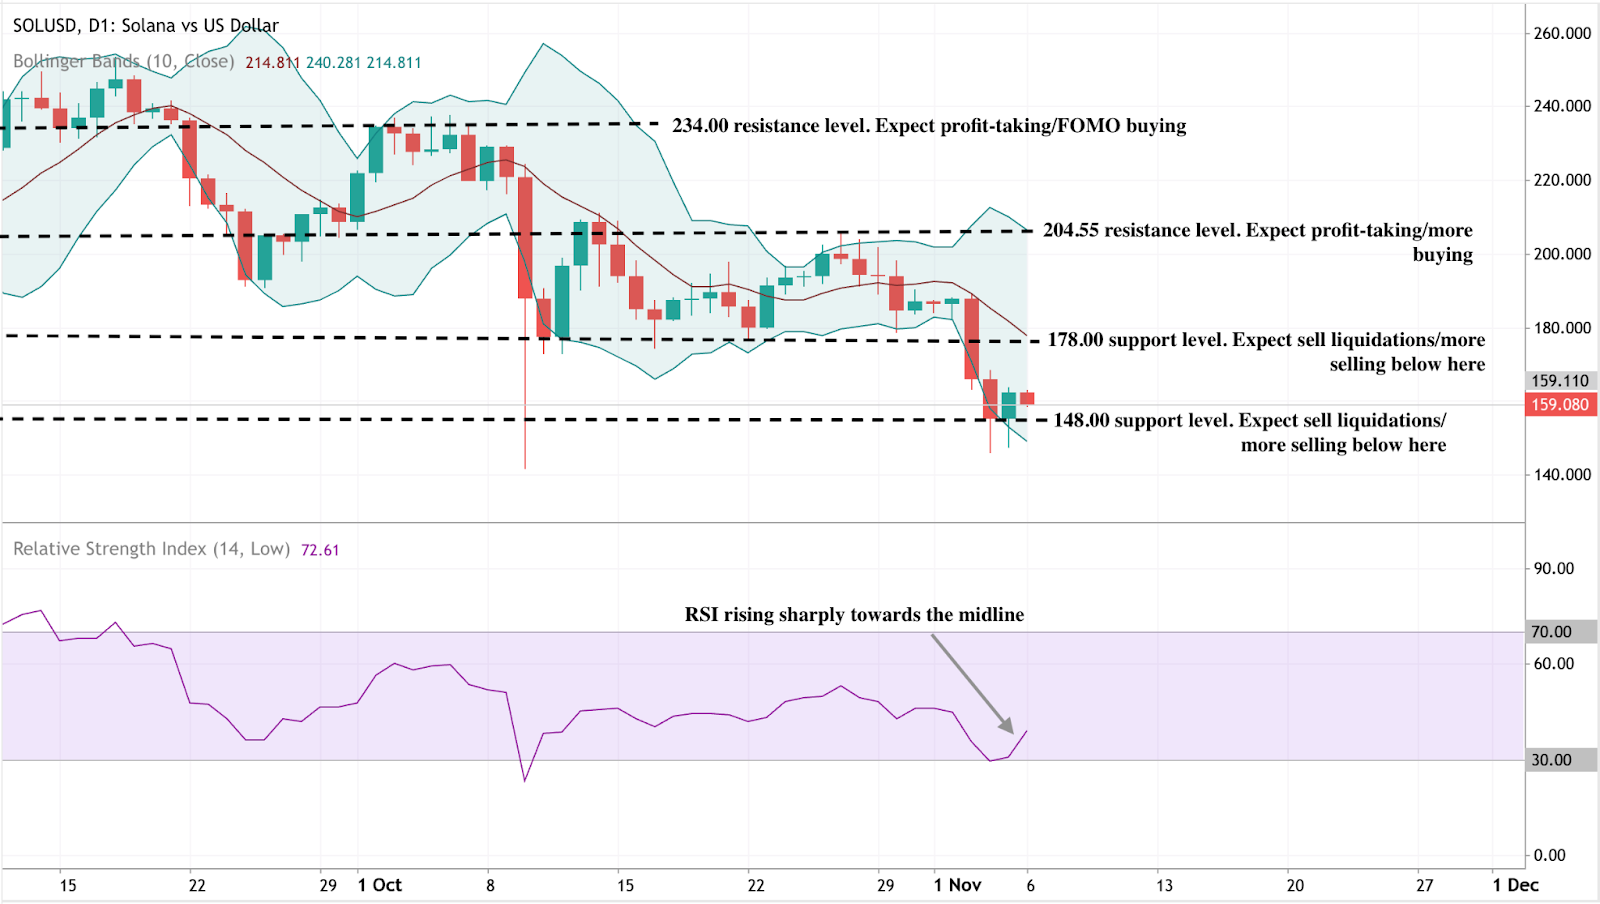
Solana technical insights
Solana is consolidating around $159 after bouncing from the $148 support, a key level where further sell-offs could accelerate if breached. The RSI at 72.6 is rising sharply towards the midline, signalling improving momentum and the potential for a short-term rebound.
The Bollinger Bands indicate that the price is hugging the lower band, suggesting oversold conditions with room for mean reversion if buying pressure strengthens. Immediate resistance lies at $178, followed by $204.55, where profit-taking is likely. A sustained break above $178 could signal a move towards $200–$210, while a failure to hold $148 risks a slide towards $135.
For traders interested in capitalising on such opportunities, Solana CFDs are available on Deriv MT5.
Solana price prediction and investment outlook
For portfolio managers, Solana’s transformation signals a gradual shift from a speculative token to an institutional-grade digital infrastructure.
- In the short term, price performance may remain tied to macroeconomic sentiment and ETF flows.
- Medium-term: The adoption of payment rails and DeFi applications could deepen liquidity.
- In the long term, continued integration with global finance and efficient network scaling may establish Solana as one of the few crypto assets offering both utility and institutional credibility.
In 2025, the real story is not the daily price chart - it is the quiet institutional infrastructure forming beneath it.

Ethereum price crash: Are we in a crypto winter or just a profit-taking phase?
Ethereum’s sharp fall below $3,500 looks less like the beginning of a crypto winter and more like a large-scale profit-taking reset.
Ethereum’s sharp fall below $3,500 looks less like the beginning of a crypto winter and more like a large-scale profit-taking reset. Data across on-chain, derivatives, and institutional flows suggest the market is undergoing a correction after months of aggressive gains, rather than entering a prolonged bearish cycle.
While retail traders and exchange-traded funds (ETFs) are showing fear, whales and institutional treasuries are using the pullback to accumulate - hinting that the current phase could set the foundation for a late-year recovery.
Key takeaways
- Ethereum trades at around $3,312, down 8.92% over the past month.
- Over $1.1 billion in leveraged positions were liquidated within 24 hours, as 303,000 traders were forced out.
- The Crypto Fear & Greed Index dropped to 20 (“Fear”), down from 59 (“Greed”) a month ago.
- Whale wallets added 1.64 million ETH (~$6.4 billion) in October, despite declining prices.
- The Fusaka hard fork upgrade scheduled for 3 December 2025 introduces PeerDAS, expected to cut Layer-2 fees by up to 95%.
- November has historically been Ethereum’s best-performing month, with an average return of +6.9% over the past eight years.
Crypto Market sentiment turns fearful
The Crypto Fear and Greed Index has plunged to 20, signaling widespread unease among investors.
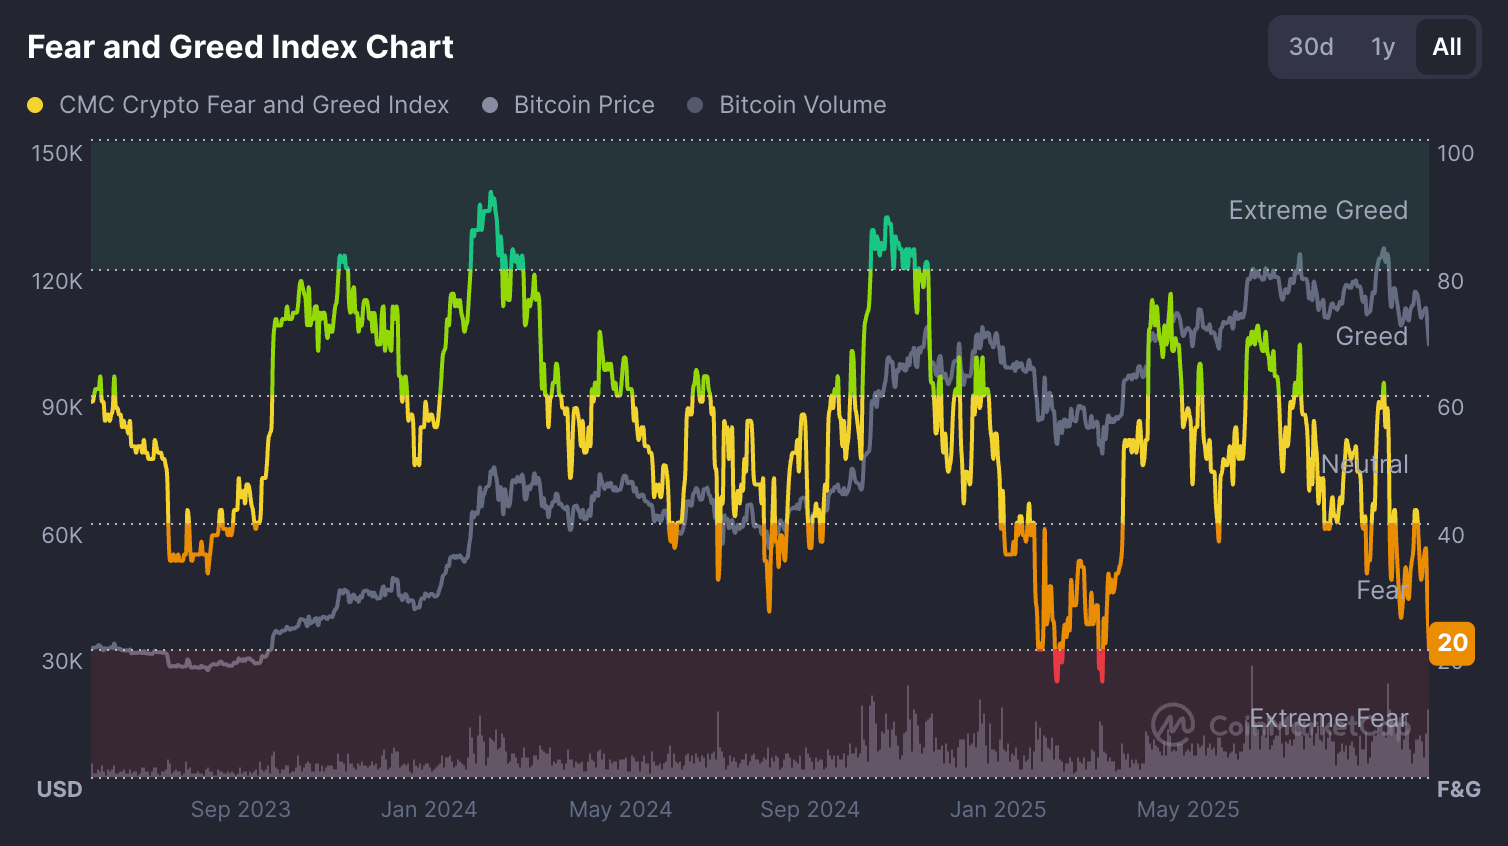
Just a month ago, readings above 50 showed moderate greed. The shift underscores a dramatic shift in sentiment as traders move from optimism to caution.
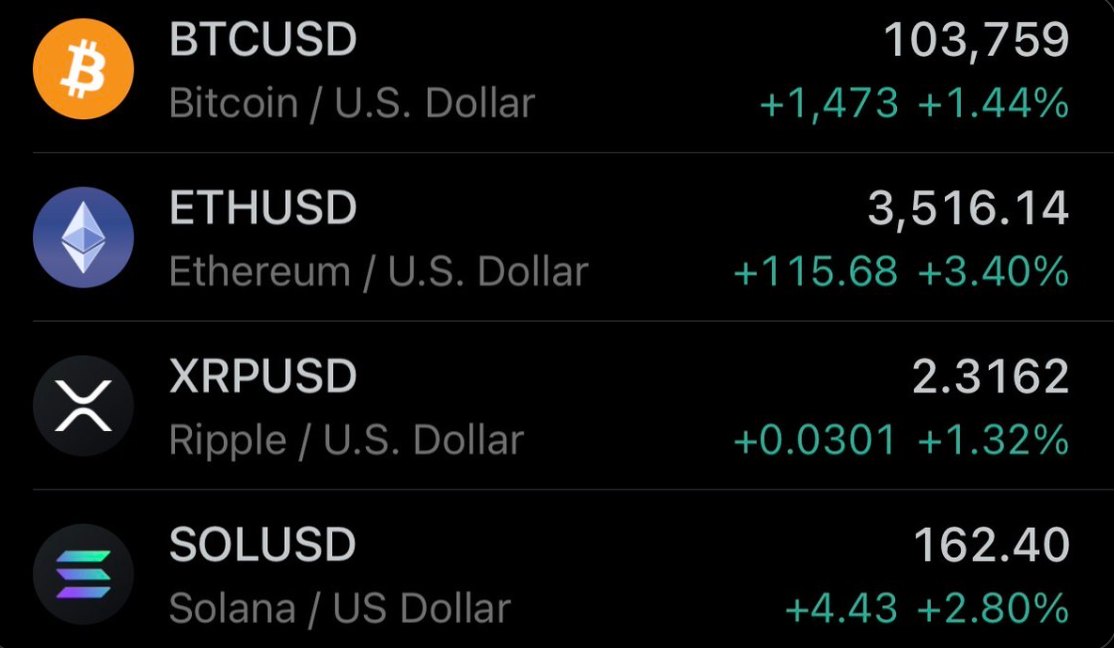
Across the broader market, nearly every major asset has turned red. Bitcoin fell 2.8% to $104,577, Solana dropped 11%, BNB lost 8.3%, XRP fell 6.7%, and Cardano slid 7.4% in the past 24 hours. The total cryptocurrency market cap has slipped 4% daily, erasing over $140 billion in value.
The macro backdrop compounds the pressure. The Federal Reserve’s uncertain rate outlook and a strengthening U.S. dollar are draining liquidity from risk assets - a dynamic often associated with crypto drawdowns.
ETH Whale accumulation intensifies while retail retreats
While fear dominates headlines, blockchain data reveals that the largest holders are quietly accumulating Ethereum. According to analytics firm Santiment, wallets holding between 1,000 and 100,000 ETH increased their balance from 99.28 million to 100.92 million ETH during the month of October.

This buying occurred even as Ethereum fell around 7% that month - a strong sign that institutional and high-net-worth investors view current prices as attractive entry points.
In contrast, long-term retail accumulation has slowed. Glassnode data show that the Holder Accumulation Ratio has declined from 31.27% to 30.45% since late October.
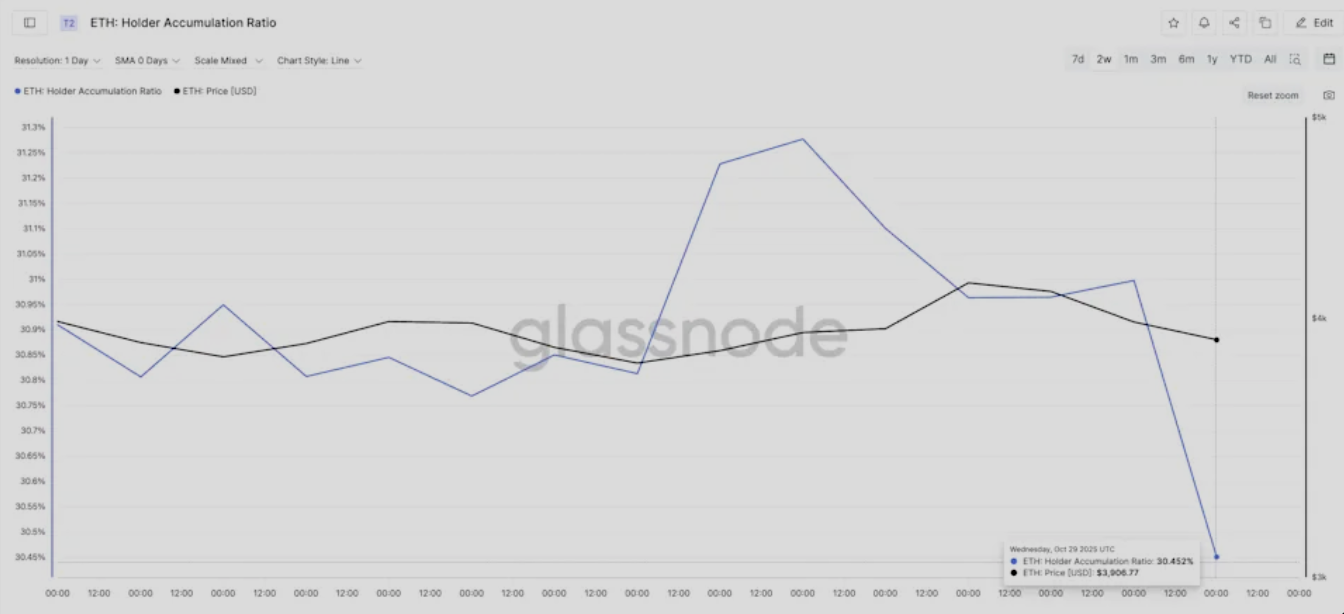
Retail investors are reducing exposure, waiting for clearer signals before re-entering. This divergence between whale buying and retail caution has become the defining feature of the current correction.
Institutional positioning: ETFs and treasuries diverge
Institutional flows paint a mixed picture. On the one hand, U.S. spot Ethereum ETFs experienced $135.76 million in outflows on 3 November.
- BlackRock’s ETHA: −$81.7 million
- Fidelity’s FETH: −$25.1 million
- Grayscale’s ETHE: −$15 million
These redemptions came alongside $186.5 million in Bitcoin ETF outflows, as institutional desks reduced exposure amid heightened volatility.
On the other hand, corporate treasuries are accumulating. Publicly traded BitMine Immersion Technologies (BMNR) added 82,353 ETH last week - worth roughly $294 million - bringing its total holdings to 3.39 million ETH, or 2.8% of Ethereum’s circulating supply. The company’s average purchase price stands around $3,909, suggesting confidence in long-term upside.
BMNR’s chairman, Tom Lee, told CNBC that the market is “consolidating after a reset,” adding that fundamentals such as stablecoin volume and application revenues are at all-time highs. Lee predicts a possible rally toward $7,000 for Ethereum before the end of the year, framing current conditions as a healthy correction rather than a crisis.
Liquidations reveal a market reset
The most dramatic signal of the correction came from the derivatives market. Data from Coinglass shows that over 303,000 traders were liquidated in just 24 hours, resulting in a total of $1.1 billion in forced positions. Within a single hour, more than $300 million was wiped out - $287 million of which were long positions.
This scale of liquidation reveals how over-leveraged bullish bets unraveled once prices broke below key support levels. Ethereum and Bitcoin accounted for the bulk of the wipeout, while high-beta altcoins like Solana and BNB saw even sharper declines.
The outcome is paradoxically constructive: leverage has been purged, funding rates have normalised, and open interest now reflects disciplined accumulation rather than speculative excess. Ethereum’s open interest remains high at $19.9 billion, but funding rates are flat - an equilibrium that often precedes a more stable recovery phase.
Fusaka upgrade offers long-term optimism
While short-term traders react to price volatility, developers are preparing for one of Ethereum’s most ambitious upgrades yet.
The Fusaka hard fork, confirmed for 3 December 2025, introduces Peer Data Availability Sampling (PeerDAS) - a technology that increases block capacity from 6 to 48 per block. This upgrade could reduce Layer-2 transaction fees by up to 95%, significantly improving scalability for DeFi and rollup networks.
Such infrastructure improvements strengthen Ethereum’s long-term competitiveness against alternative Layer-1 chains. With stablecoin transactions on Ethereum hitting $2.8 trillion in October, network fundamentals remain robust despite price turbulence.
Ethereum’s November historical pattern: a bullish bias
Seasonality may soon lend support. Over the past eight years, Ethereum has averaged a monthly return of +6.9 % in November. In 2024, it recorded a remarkable 47.4% rally, marking one of its strongest months ever.
The Net Unrealised Profit/Loss (NUPL) ratio - which measures the percentage of investors in profit - has fallen from 0.43 to 0.39, near the monthly low of 0.38 that last triggered a 13% rebound from $3,750 to $4,240.
This trend suggests selling pressure may be fading as investor incentives to take profits decline.
Macro context: profit-taking, not panic
Ethereum’s downturn mirrors the broader behavior of risk assets. After months of double-digit gains across cryptocurrencies, profit-taking has accelerated amid global liquidity concerns. The U.S. dollar index strengthened sharply, and Fed officials have hinted at slower rate cuts, encouraging investors to rotate out of speculative assets.
Unlike prior bear-market conditions, however, there is no collapse in network activity or developer engagement. DeFi revenue remains strong, stablecoin velocity is high, and whale inflows indicate rotation rather than retreat. The sell-off, therefore, aligns more with profit-locking behavior than the sustained capital flight that characterised the 2022–2023 crypto winter.
Traders on Deriv MT5 can track these shifts across multiple assets, from cryptocurrencies to forex, to gauge broader market sentiment in real-time.
Ethereum technical insights: Stabilisation vs. further weakness

Ethereum is currently trading near $3,313, rebounding after a sharp decline that tested the $3,745 support level. This zone has acted as a key area where sell liquidations intensified, but the recent bounce suggests early signs of buyer interest.
The Bollinger Bands have widened significantly, indicating elevated volatility, while price action remains near the lower band - typically a sign of short-term oversold conditions. A sustained close above the middle band could confirm a recovery in momentum.
Meanwhile, the Relative Strength Index (RSI) has risen sharply from 33, signaling improving bullish momentum after near-oversold readings. A further RSI move above 50 would reinforce a potential short-term reversal.
Resistance levels remain at $4,250 (where profit-taking and more buying may emerge) and $4,700, marking a stronger ceiling for any extended rally. Overall, ETH shows early signs of recovery but still faces strong resistance ahead.
The near-term outlook depends on whether ETF outflows stabilise and whether the whale accumulation trend continues through November. With fear levels elevated, contrarian traders are closely watching for a potential bottoming process similar to past mid-cycle corrections. The Deriv trading calculator can help traders assess potential profit and margin exposure before taking positions in such volatile environments.
Ethereum investment implications
For short-term traders, Ethereum’s setup suggests a high-volatility environment with tactical entry opportunities near the $3,500–$3,700 support range. Upside targets into December sit between $4,400 and $4,600, assuming sentiment stabilises and ETF outflows slow.
For medium-term investors, current levels represent an accumulation window. Whale buying, the Fusaka upgrade, and seasonal patterns point to improving fundamentals beneath the surface fear. Institutional participation is likely to return once macroeconomic uncertainty eases and on-chain stability confirms a bottom.
In essence, Ethereum’s decline is a market normalisation, not a meltdown. As leverage unwinds and fundamentals strengthen, the groundwork for the next leg higher may already be forming.

Coffee price forecast: Can U.S. trade talks cool a weather-fuelled rally?
Arabica coffee futures remain caught between drought in Brazil and tariffs in Washington.
Arabica coffee futures remain caught between drought in Brazil and tariffs in Washington. Until either rainfall normalises or a U.S.–Brazil trade deal removes the 50% import duty, prices are likely to stay near multi-month highs. A continued supply squeeze could lift Arabica above $425, while quick diplomatic progress or heavier rains could drag it back toward $380.
Key takeaways
- Brazil’s Minas Gerais drought has cut rainfall to 75 % of normal, the latest in a string of dry years.
- Vietnam’s crop risk from Typhoons Kalmaegi and Fengshen threatens robusta output in the Central Highlands.
- U.S. tariffs on Brazilian coffee have pushed exchange inventories to their lowest since 2024.
- Vietnam logged a record US$8.4 billion in exports, offsetting part of the global shortfall.
- La Niña probability of 71 % points to further dryness through early 2026.
- Global production ≠ ample supply: Arabica deficits persist despite record total output.
Brazil’s drought deepens the arabica deficit
Weather agency Somar Meteorologia reported Minas Gerais - the heart of Brazil’s arabica belt - received just 33 mm of rain in late October, barely three-quarters of the historical average, following a near-dry week earlier. The soil moisture deficit poses a threat to flowering and bean development for the 2026/27 crop.
NOAA’s September update lifted the probability of a La Niña event to 71%, reinforcing expectations of continued dryness across southern Brazil. Conab cut its 2025 arabica estimate by 4.9 % to 35.2 million bags, and total coffee output to 55.2 million bags. Years of sub-par rainfall have already reduced bean size and yields, creating what traders call a “climate premium” in arabica futures.
Trade barriers tighten U.S. supply
In July 2025, Washington imposed a 50 % tariff on Brazilian beans - part of a wider trade confrontation between Presidents Trump and Lula. Brazil supplies roughly a third of America’s unroasted coffee; the duty instantly disrupted shipments.
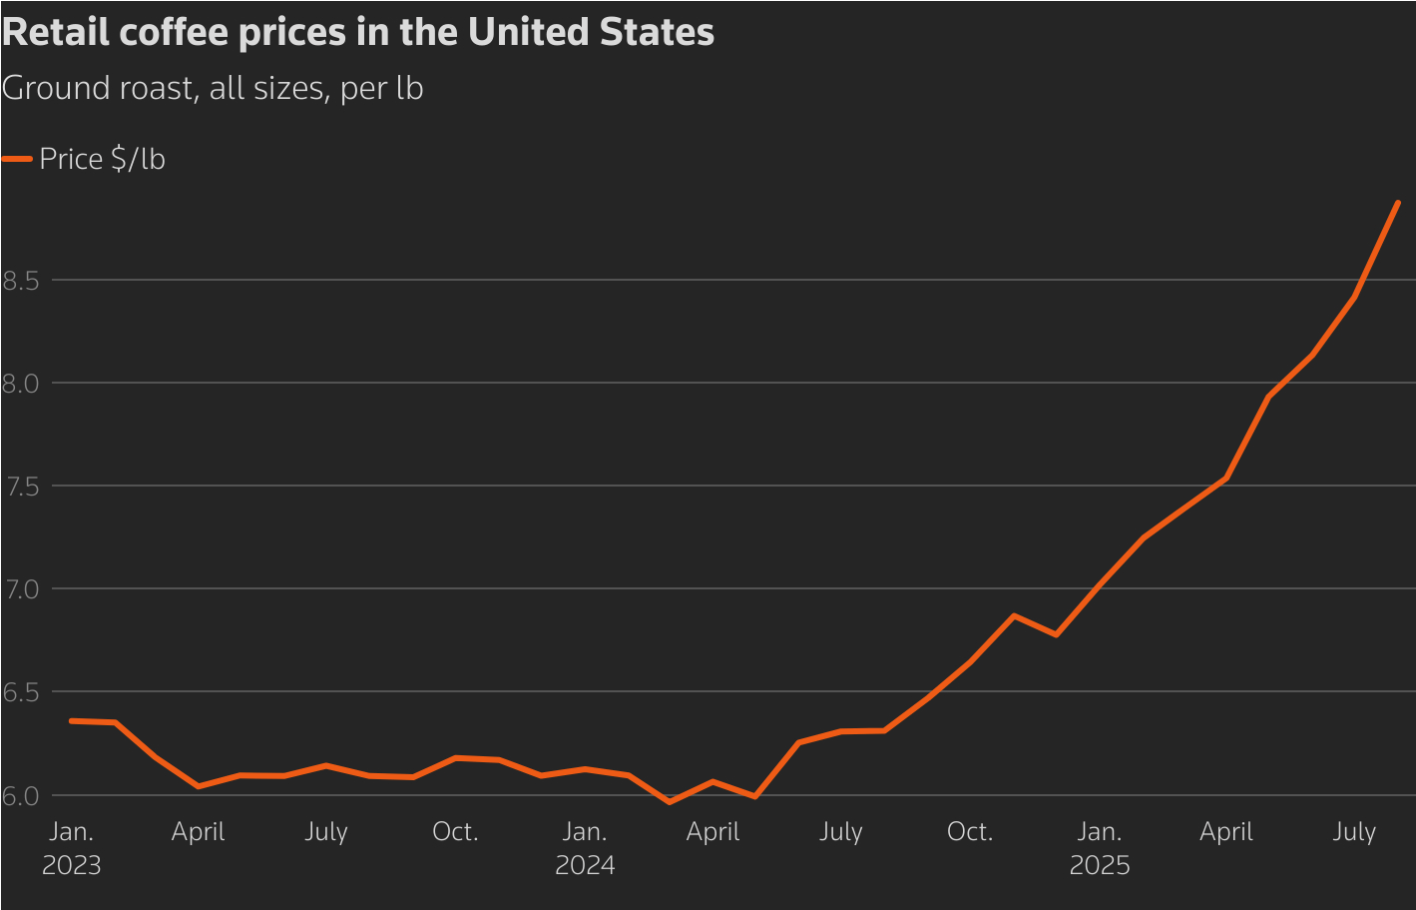
Importers rerouted cargoes to Canada, paid $20–25 per bag cancellation fees, or warehoused beans under bond in Florida to delay tax payment. ICE-monitored arabica stocks have since plummeted to a 1.75-year low of ≈ approximately 431,481 bags, while robusta holdings have declined to ≈ approximately 6,053 lots. Retail coffee prices in U.S. stores rose 41% year-over-year, adding to food inflation.
Both sides now signal progress: Trump described the latest meeting as “positive,” and Lula hinted at a “definitive solution” soon. Any rollback of tariffs would reopen the world’s largest consumer market and relieve U.S. roasters by mid-2026.
Vietnam’s robusta boom - and its limits
Vietnam has been the outlier in 2025’s volatile market. Exports for 2024–25 reached 1.5 million tonnes worth US$8.4 billion, up 55% in value despite minimal volume growth. Average prices jumped 52% to US$5,610 per tonne, reflecting the global supply squeeze.
Europe absorbed 47% of shipments, led by Germany, Italy, and Spain. Farm-gate prices around VND 116,000–118,000 per kg (≈ US$4.6) deliver strong profits, given production costs of VND 35,000–40,000.
However, Typhoons Kalmaegi and Fengshen threaten flooding and landslides in the Central Highlands. Vicofa forecasts a 5–10% increase in 2025/26 output, but warns that persistent storms or fertilizer shortages could reverse those gains. The sector’s new EU “low-risk” status on traceability protects access to European buyers but not against climate volatility.
To explore how traders can capitalise on such volatility, Deriv’s trading calculator help estimate margin and profit scenarios for coffee, gold, and oil positions.
Global production: Record high, but shortages remain
According to the USDA FAS, world coffee production for 2025/26 will reach a record 178.7 million bags (+2.5 %). Yet, arabica output is expected to fall 1.7% to 97 million bags, while robusta rises 7.9% to 81.7 million bags. Ending stocks are expected to rise 4.9% to 22.8 million bags, but this aggregate figure masks an arabica shortfall.
Trader Volcafe projects a global arabica deficit of 8.5 million bags - the fifth straight year of undersupply - wider than last season’s 5.5 million. Even with record totals, the quality mix and logistical bottlenecks leave roasters short of premium beans.
U.S. roasters face an expensive squeeze
American roasters, relying heavily on Brazilian arabica, are drawing down remaining inventories. Some redirected beans to Canada to avoid tariffs, incurring higher freight costs. Others cancelled shipments outright, paying penalty fees.
Small and mid-sized roasters report margins collapsing as replacement beans from Colombia and Mexico cost 10% more, while Brazilian beans - though cheaper - carry the 50% duty.

The ripple effect reaches consumers: a typical supermarket blend has risen from $ 6–7 to $11 per pack. The U.S. Labor Statistics Bureau links these increases directly to reduced imports and weather-related shortages. Analysts expect inventories to fall to 2.5–3 million bags by December, near critical levels.
Coffee price Market outlook
- Bullish scenario: Continued dryness, strong La Niña, and stalled trade talks push arabica through $425, extending the rally into early 2026.
- Base case: Partial tariff relief and modest rains keep prices range-bound $380–$420.
- Bearish scenario: Rapid trade détente plus Vietnam’s larger harvest could pull arabica back to $350–$370 by mid-2026.
Even in the bearish case, structural deficits and climate risks suggest the long-term floor is moving higher.
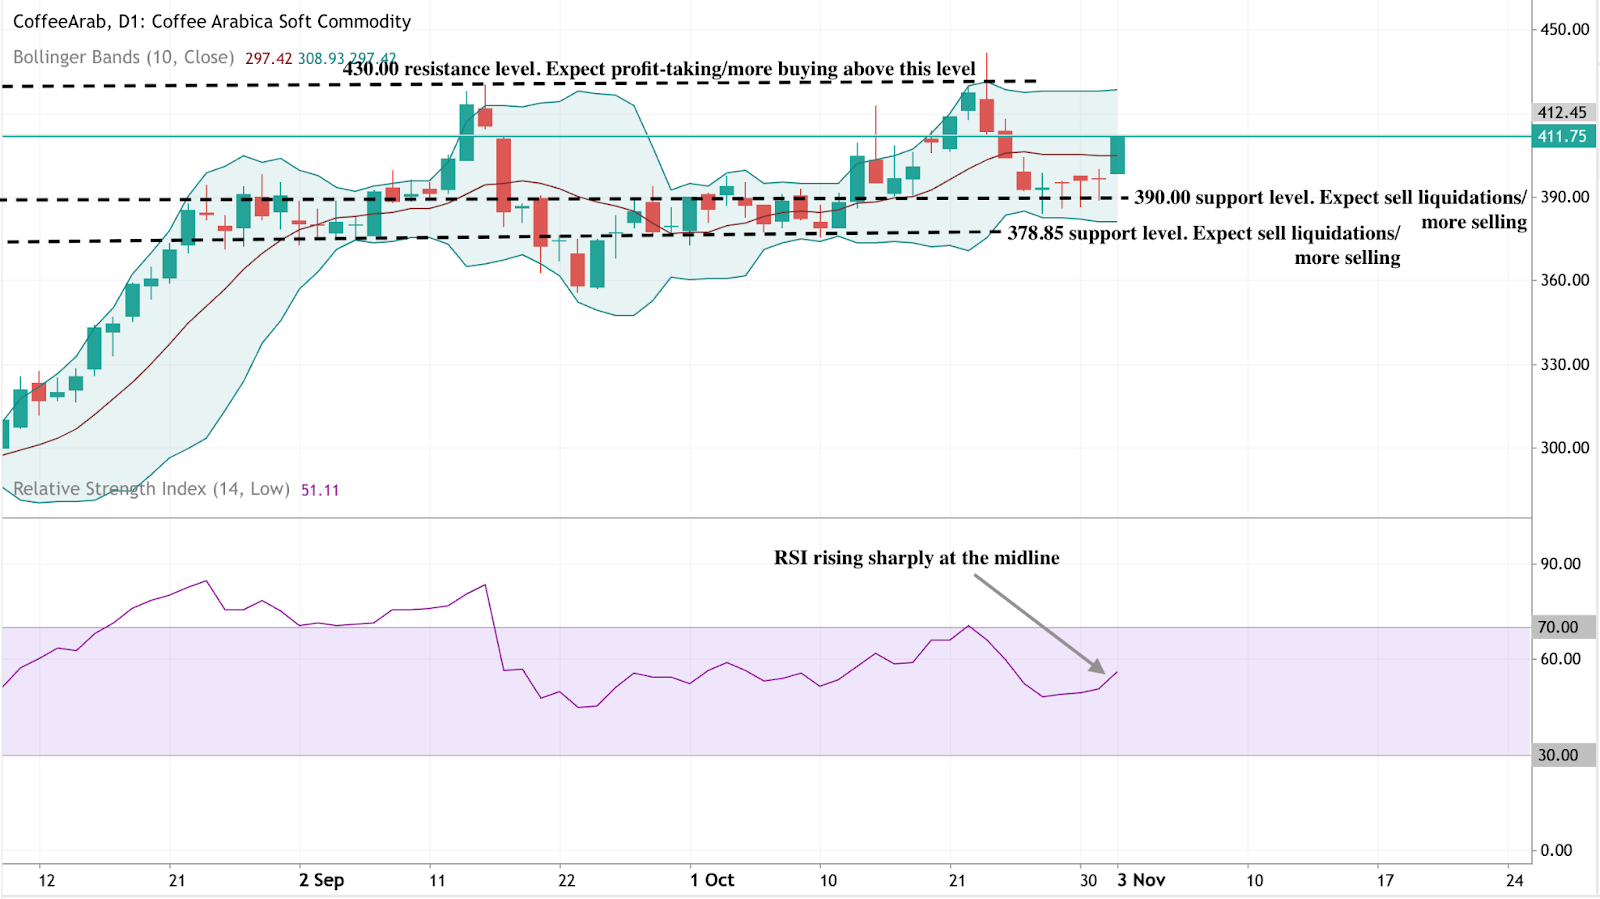
Coffee price technical analysis
Coffee Arabica prices are consolidating near $411.75, showing a mixed but slightly bullish setup. Bollinger Bands are moderately wide, indicating ongoing volatility. The latest candle is testing the upper mid-band, indicating potential for a short-term push higher if momentum persists.
The key resistance remains at $430.00, where previous rallies faced profit-taking. A decisive break above this could attract fresh buying pressure. On the downside, $390.00 and $378.85 serve as major support zones - a breach below either could trigger liquidation-driven selling.
RSI (14) currently sits around 51, rising sharply from the midline, implying improving bullish momentum but not yet in overbought territory. This reinforces the idea of a cautious recovery phase rather than a breakout trend.
Coffee price investment implications
For traders and investors, the near-term setup points to heightened volatility rather than a sustained correction.
- Short term: Price swings will hinge on U.S.–Brazil trade headlines and rainfall updates; speculative spikes above $425 remain possible.
- Medium-term: Monitor Vietnam’s harvest and La Niña developments, as both could reset the global supply balance.
- Long-term: Structural climate risk keeps the floor higher - arabica below $350 looks unlikely barring a policy breakthrough. Coffee’s current rally may cool, but the underlying heat - political and climatic - shows no sign of dissipating.
For traders seeking exposure, coffee CFDs are available on Deriv MT5, alongside other soft commodities and energy assets, such as gold and oil.
Samahani, hatukuweza kupata matokeo yoyote yanayofanana na .
Tafuta vidokezo:
- Tafadhali angalia tahajia yako na ujaribu tena
- Jaribu neno lingine