Matokeo ya”

Nvidia’s blowout quarter gets the market’s cold shoulder
Despite Nvidia's surge and raised guidance of about $65 billion for the next quarter, the market’s reaction was oddly restrained.
When Nvidia Corporation reported third-quarter revenue of $57 billion - up 62 % year-on-year - it looked like another flawless win in the AI hardware race. Yet despite the surge and raised guidance of about $65 billion for the next quarter, the market’s reaction was oddly restrained.
In a leaked all-hands meeting, CEO Jensen Huang admitted: “The market did not appreciate it.” This disconnect between execution and excitement reveals how high expectations - and AI euphoria - have raised the bar for even the best performers.
What’s driving Nvidia’s blowout quarter
The lifeblood of Nvidia’s results is still data-centre demand - the backbone of AI infrastructure. That segment alone generated roughly $51 billion in revenue, up 66% year-over-year and 25% quarter-over-quarter.

Flagship products like the Blackwell platform continue to dominate enterprise orders, while guidance now points toward another record quarter - $65 billion in revenue, 65% growth year-on-year. Nvidia isn’t merely growing; it’s defining the tempo for an entire industry’s capital-expenditure cycle.
Geopolitical and structural forces amplify that growth. As cloud, robotics and autonomous systems scale globally, Nvidia’s hardware sits at the centre of innovation - and the bottleneck of supply. But with success comes fragility: when perfection becomes expected, the smallest wobble feels seismic. “When you’ve trained the market to expect perfection,” one analyst quipped, “even great isn’t good enough.”
Why it matters
Nvidia now commands roughly 7.31% of the S&P 500’s total weighting, making it the single most influential barometer of AI sentiment. A stock this large moving sideways after a record quarter suggests investors are questioning not the data, but the narrative.
FinancialContent called it “a crucible moment for AI and the broader market.” If Nvidia’s excellence no longer excites, the rest of tech will feel the chill.
Huang himself put it plainly: deliver a bad quarter and you’re blamed for bursting the bubble; deliver a great one and you’re accused of fuelling it. That perception trap highlights a new phase in the AI trade - one where results must be beyond exceptional to move markets. It also reflects a subtle shift: from hype and promise to discipline and delivery.
Impact on the tech & AI ecosystem
Nvidia’s print initially lifted tech shares across the board, with AMD, Broadcom and memory suppliers riding the optimism. But as the day wore on, those gains faded - proof that enthusiasm has become fragile.
According to analysts, if monster results no longer trigger a rally, it implies much of the AI infrastructure growth is already priced in. Investors may now reward operational efficiency over raw expansion. That’s a natural evolution: when growth matures, valuation discipline takes over.
For hardware buyers and enterprise users, this evolution may mean slightly easier supply conditions but tighter pricing. Nvidia’s challenge will be to sustain margins while scaling output - a shift from visionary growth to industrial precision.
Expert outlook
Market watchers say two roads lie ahead. If Nvidia continues to execute - scaling new product lines, widening manufacturing capacity, and navigating export risks - it can retain leadership and extend its run. The company still holds a technological moat that few can breach.
The other scenario is one of valuation reset: if investors start questioning whether hardware growth can outpace cost inflation and competition indefinitely, Nvidia could face a plateau. As one Bernstein analyst put it: “I’m not sure what else you can ask for, at least on the print.”
For traders, the signals to monitor are guidance trends, backlog updates (especially in China), and the rollout pace of the Rubin and Blackwell chips. A market-cap swing of half a trillion dollars in weeks shows just how sensitive sentiment has become.
Nvidia technical insights
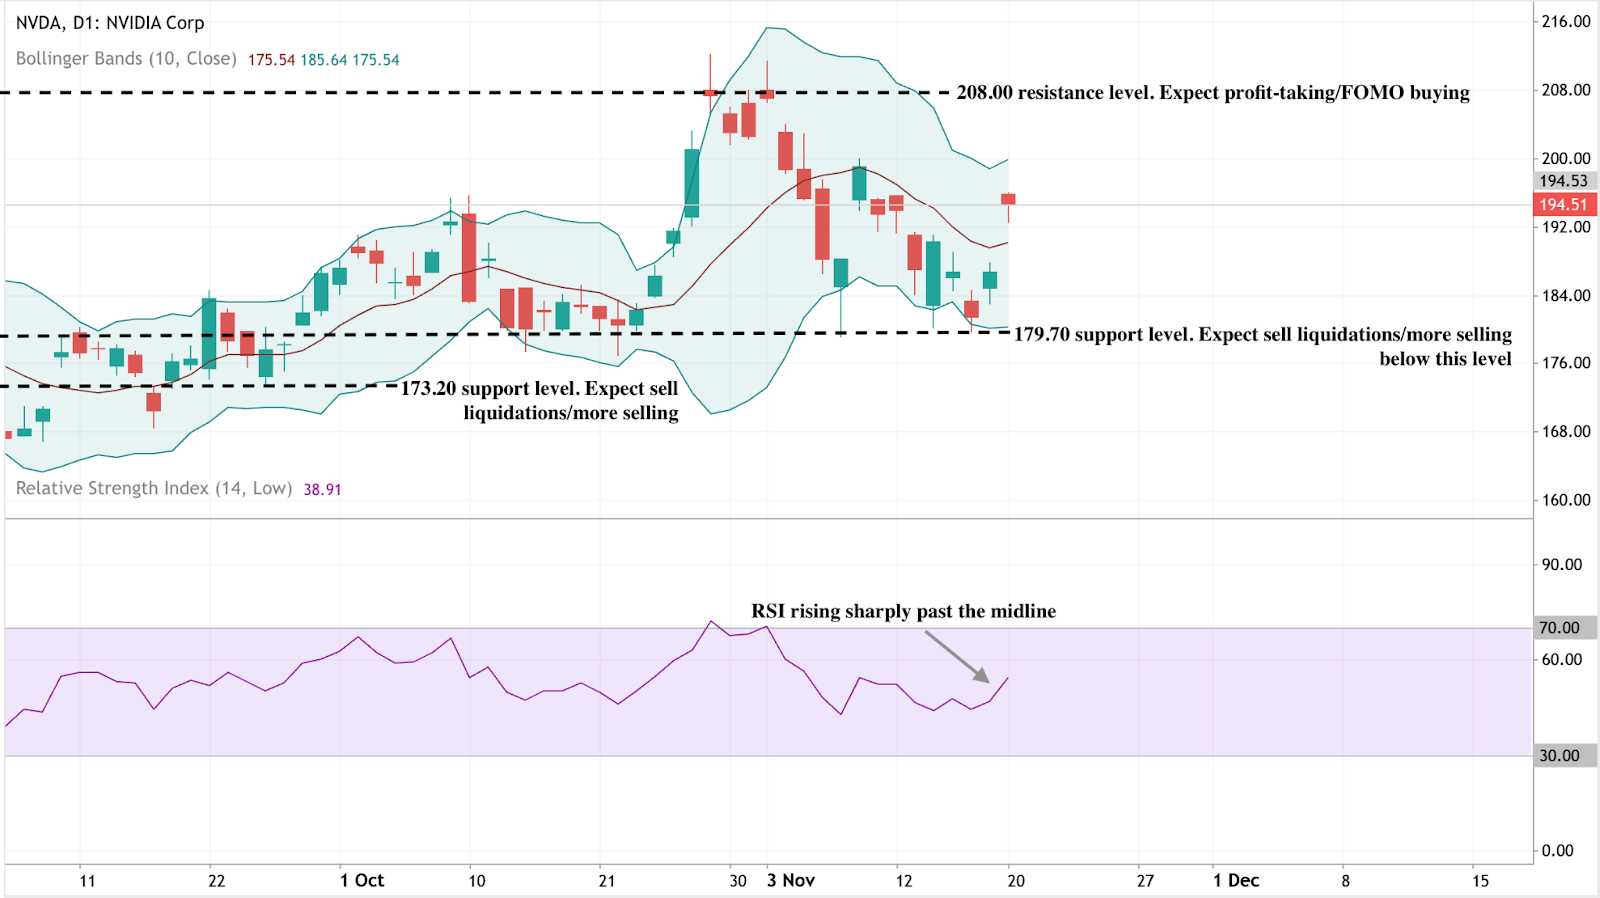
At the time of writing, Nvidia (NVDA) trades near $194.50, rebounding from the lower Bollinger Band after testing the $179.70 support level. The Bollinger Bands (10, close) are moderately widening - a sign of increasing volatility - with price action gravitating toward the midline. This suggests a potential continuation toward the upper band in the short term.
The $173.20 level stands out as the next key support; a break below could spark sell liquidations and amplify downside momentum. Conversely, $208.00 forms a strong resistance zone where both profit-taking and late-cycle FOMO buying could emerge if the rally extends.
Momentum indicators add weight to the bullish case. The RSI (14) has turned sharply upward, crossing above the midline around 50 - a technical cue for renewed buying pressure. A sustained move above that level, supported by stability above $179.70, would reinforce a short-term uptrend and re-engage traders eyeing momentum moves.
For those mapping scenarios, the Deriv calculator can be useful for simulating profit and loss under different volatility setups - an essential complement to chart analysis when planning NVDA trades on Deriv MT5.
Key takeaway
Investors see Nvidia as remaining the nucleus of the AI infrastructure boom - financially unmatched and technologically dominant. Yet the market’s lukewarm response marks a turning point: investors no longer reward promise, only proof. In this new phase of the AI trade, execution, margin resilience and innovation cadence will define leadership. For traders, Nvidia’s chart may hint at short-term upside, but the bigger story is one of shifting expectations - where perfection is now the baseline, not the surprise.

Mtazamo wa bei ya dhahabu: Benki kuu zinatoa sakafu
Chini ya kelele za dau za kupunguzwa kwa kiwango na nguvu za dola iko nguvu kubwa ya muundo: ununuzi wa dhahabu usiopo na benki kuu za ulimwengu.
Uthabiti wa kushangaza wa dhahabu karibu na $4,050 kwa aunsi sio ajali, kulingana na ripoti. Chini ya kelele za dau za kupunguzwa kwa kiwango na nguvu za dola iko nguvu kubwa ya muundo: ununuzi usiopo na benki kuu za ulimwengu. Kutoka Beijing hadi Ankara, watunga sera wanaandika tena utulivu sheria za usalama wa fedha, wakitumia dhahabu kama kizuizi chao dhidi ya hatari ya kisiasa, utulivu wa sarafu, na kupungua kwa uaminifu katika utaratibu wa kifedha wa Marekani.
Mahitaji haya yamekuwa mkono usioonekana unaounga mkono, kulingana na wachambuzi. Hata kama wafanyabiashara wa uvumi wanavuta nyuma na mtiririko wa ETF unavyopungua, wanunuzi wenye nguvu wanasaidia kufunga soko.
Pamoja na Benki ya Watu ya China iliongeza mstari wake wa kununuzi wa dhahabu za miezi 12 na benki zingine kuu kufuata hivyo, hatari ya dhahabu sasa inaonekana kama kupumzika kuliko kuanguka - sakafu inayoimarishwa na mataifa, sio fedha.
Ni nini kinachoendesha dhahabu hivi sasa?
Takwimu za hivi karibuni ya ajira za Marekani zimeweka upya matarajio katika masoko ya kim Ripoti ya Malipo ya Nzo ya Kilimo ya Septemba ilionyesha faida ya kazi 119,000, zaidi ya mara mbili zaidi ya wachumi walivyotarajiwa, wakati ukosefu wa ajira uliongezeka hadi 4.4%.

Kwa uso, data inaonekana kuwa imechanganywa - kuajiri kali lakini inapunguza kasi - lakini ilikuwa ya kutosha kuchochea wawekezaji kurudisha simu zao juu ya kupunguzwa kwa kiwango cha Desemba kutoka Hifadhi ya Shirikisho.
Ufungaji huo uliongeza mauzo ya dola na Marekani, kwa kawaida mchanganyiko wa sumu kwa dhahabu. Lakini chuma hicho kilikuwa kidogo. Sababu ni kwamba mahitaji ya benki kuu yamebadilisha unyeti wa dhahabu kwa mzunguko wa sera.
Kulingana na data kutoka kwa Baraza la Dhahabu la Dunia, ununuzi rasmi wa sekta sasa huhusu karibu robo ya mahitaji ya kila mwaka - mabadiliko ya muundo kutoka muongo mmoja uliopita. Wakati Fed inashita, benki kuu hazifanyi.
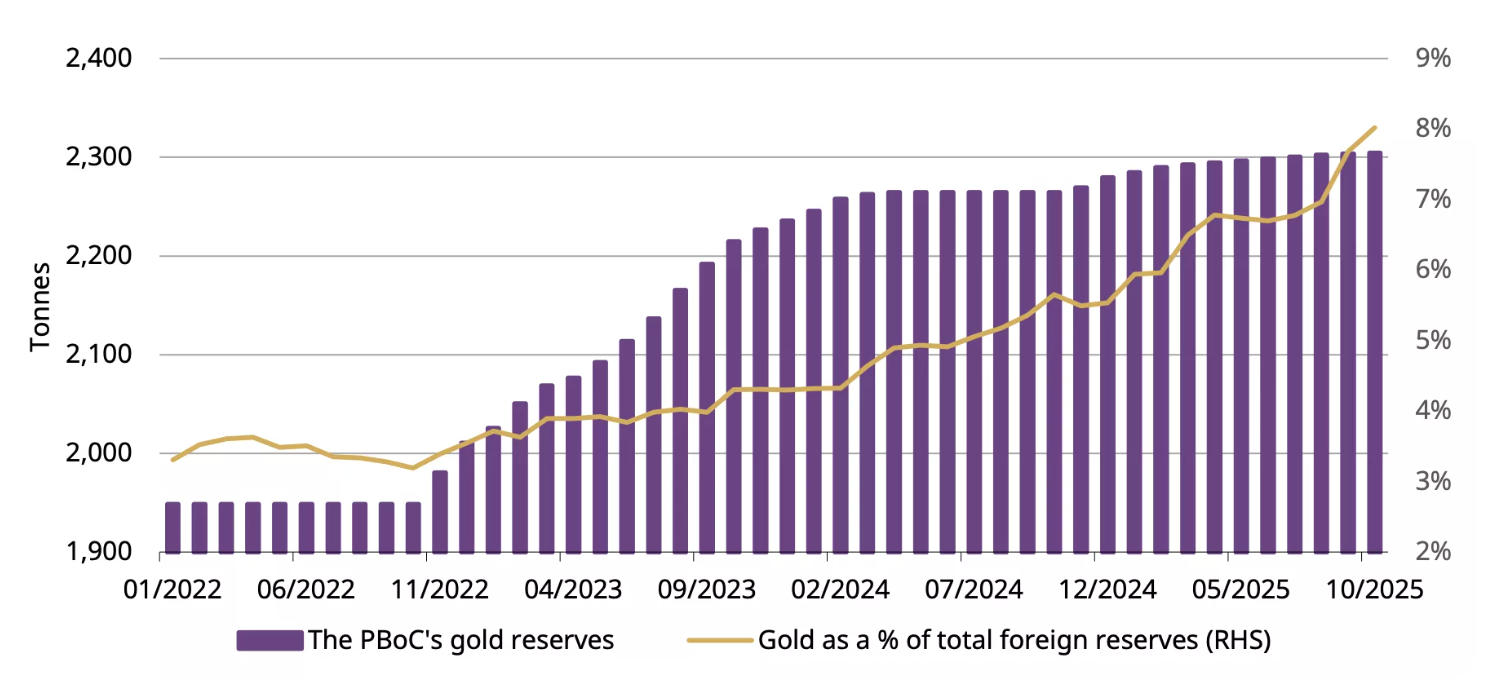
Benki ya Watu ya China (PBoC) imeripoti ununuzi wa dhahabu kwa miezi 12 mfululizo, na kuongeza 0.9t mnamo Oktoba, ambayo iliongeza jumla hiyo hadi 2,304t, ikiwakilisha 8% ya akiba ya fedha za kigeni za China na kuashiria mwaka kamili wa ununuzi usioingiliwa. Uturuki, Poland, na India zote zimejiunga na mwenendo wa mkusanyiko.
Kwa nini ni muhimu
Watazamaji wa soko wanasema mkusanyiko huu wa utulivu utulivu unabadilisha jukumu la dhahabu katika mfumo wa kifedha ulimwenguni Kile lilikuwa biashara ya “hatari” sasa ni sehemu ya mkakati wa hifadhi ya kitaifa. Kuhifadhiwa kwa mali za kigeni wa Urusi mnamo 2022 ilisababisha serikali kutathmini tena ufichuliano wao kwa mfumo unaotawaliwa na dola, na dhahabu iliibuka kama njia mbadala isiyo na upya.
Kama mkakati wa Zaner Metals Peter Grant anasema, data ya hivi karibuni ya ajira za Marekani “inathibitisha soko lililopungua lakini thabiti - lakini hiyo haipunguzi hamu ya usalama.”
Kwa watunga sera katika masoko yanayoibuka, dhahabu hutoa kitu ambacho mali ya karatasi haiwezi: kuzuiliwa kutoka kwa vikwazo, mfumuko wa bei, na siasa ya sarafu. Kwa wawekezaji, hii inamaanisha kuwa bei ya dhahabu sio tena kazi ya viwango vya riba au hamu ya hatari. Ni kiashiria cha kijiografia - kioo cha uaminifu kiasi gani inabaki katika utaratibu wa sasa wa fedha.
Athari kwa masoko na wawekezaji
Mabadiliko ya kushangaza zaidi katika mzunguko huu ni kwamba dhahabu inashikilia karibu na viwango vya juu vya rekodi hata wakati fahirisi ya dola ya Amerika (DXY) inafanya biashara kwa kiwango chake cha nguvu katika miezi. Uhusiano wa jadi wa kinyume umedhaika. Kulingana na wachambuzi, mali zote mbili zinununuliwa kwa sababu sawa: usalama. Hii yenye nguvu linapinga wazo kwamba dhahabu inakusanyika tu wakati viwango vinashuka
Kwa wafanyabiashara, hiyo inagumu nafasi ya muda mfupi. Pamoja na dhahabu sasa takriban 7% chini ya rekodi yake ya Oktoba ya $4,380, kasi imebaridi, lakini mahitaji ya muundo bado sawa. Mtiririko wa ETF, ingawa mbaya sana katika wiki za hivi karibuni, haonyesi ishara za hofu.
Wawekezaji wa rejareja wamepunguza uchunguzi, lakini sekta rasmi imewabadilisha kama mnunuzi wa kidogo. Kwa wawekezaji wa muda mrefu, mabadiliko haya yanaonyesha kuwa kujiondoa kunaweza kutoa fursa badala ya onyo, haswa ikiwa kutokuwa na uhakika wa uchumi wa uchumi wa uchumi
Mtazamo wa mta
Wachambuzi wanabaki wamegawanyika juu ya kiasi gani zabuni hii ya benki kuu inaweza kubeba chuma hiyo. Goldman Sachs bado inaona udhaifu huo wa hivi karibuni kama “ugonjwa, sio mabadiliko,” na kudumisha kuwa mahitaji ya uwekezaji serikali na ya kibinafsi yataunga mkono bei hadi 2026. UBS inatarajia kupanda uwezekano hadi $4,900 kwa aunsi ndani ya miaka miwili ijayo, ikidhani unaendelea kutofautisha mbali na akiba ya dola.
Hatari kuu kwa mtazamo huo iko katika kujiridhisha fedha. Ikiwa data ya Marekani inabaki imara na Fed inathibitisha msimamo wake wa “juu kwa muda mrefu”, riba ya uvumi inaweza kupungua zaidi. Lakini kwa sasa, ustahimilivu wa dhahabu unazungumza yenyewe. Soko linarekebisha ukweli mpya - ambapo benki kuu, sio wafanyabiashara, huweka sauti.
Ufahamu wa kiufundi wa dh
Wakati wa kuandika, Dhahabu (XAU/USD) inafanya biashara karibu na mkoa wa $4,030, ikiwa karibu na kiwango cha usaidizi cha $4,020. RSI ni gorofa na karibu na mstari wa kati, ikionyesha ukosefu wa kasi kubwa katika mwelekeo mmoja - ishara ya kutokuamua soko.
Wakati huo huo, Bendi za Bollinger wameanza kupungua, ikionyesha ugonjwa wa chini baada ya mabadiliko ya hivi karibuni Bei inaendelea karibu na bendi ya katikati, ikipendekeza awamu inayowezekana ya ujumuishaji kabla ya kuvunjika unaofuata.
Kwa upande mwingine, $4,200 na $4,365 bado ni viwango muhimu vya upinzani, ambapo wafanyabiashara wanaweza kutarajia kuchukua faida au riba upya ya ununuzi ikiwa hisia za kupanda zinazorudi. Kinyume chake, mapumziko chini ya $4,020 kunaweza kufungua mlango wa usaidizi wa $3,940, ambapo shinikizo la kuongezeka kwa uuzaji au uamuzi unaweza kutokea.

Vidokezo muhimu
Uthabiti wa dhahabu mwishoni mwa 2025 sio siri - ni ujumbe wa wachambuzi walioonyesha. Taasisi sawa ambazo hapo awali zilizoamini Hazina za Marekani sasa zinanunua nyumbani ili kudhibiti sera, siasa, na kutokuwa na uhakika. Wafanyabiashara wanaweza kupunguza mkutano huo, lakini benki kuu hazianguka. Kama Fed inaendelea mtazamo wa sera iliyogawanyika na akiba ya kimataifa zinaendelea kubadilika mashariki, sakafu chini ya dhahabu inaonekana kuwa imara kama mikono inayoishikilia
.png)
Bitcoin’s harsh reset: Flows, fear and two lines that matter
The world’s largest cryptocurrency has shed nearly a third of its value since its October peak, slipping toward critical technical levels as headwinds take effect.
Bitcoin’s harsh reset has arrived. The world’s largest cryptocurrency has shed nearly a third of its value since its October peak, slipping toward critical technical levels as exchange-traded fund outflows and macroeconomic headwinds take effect.
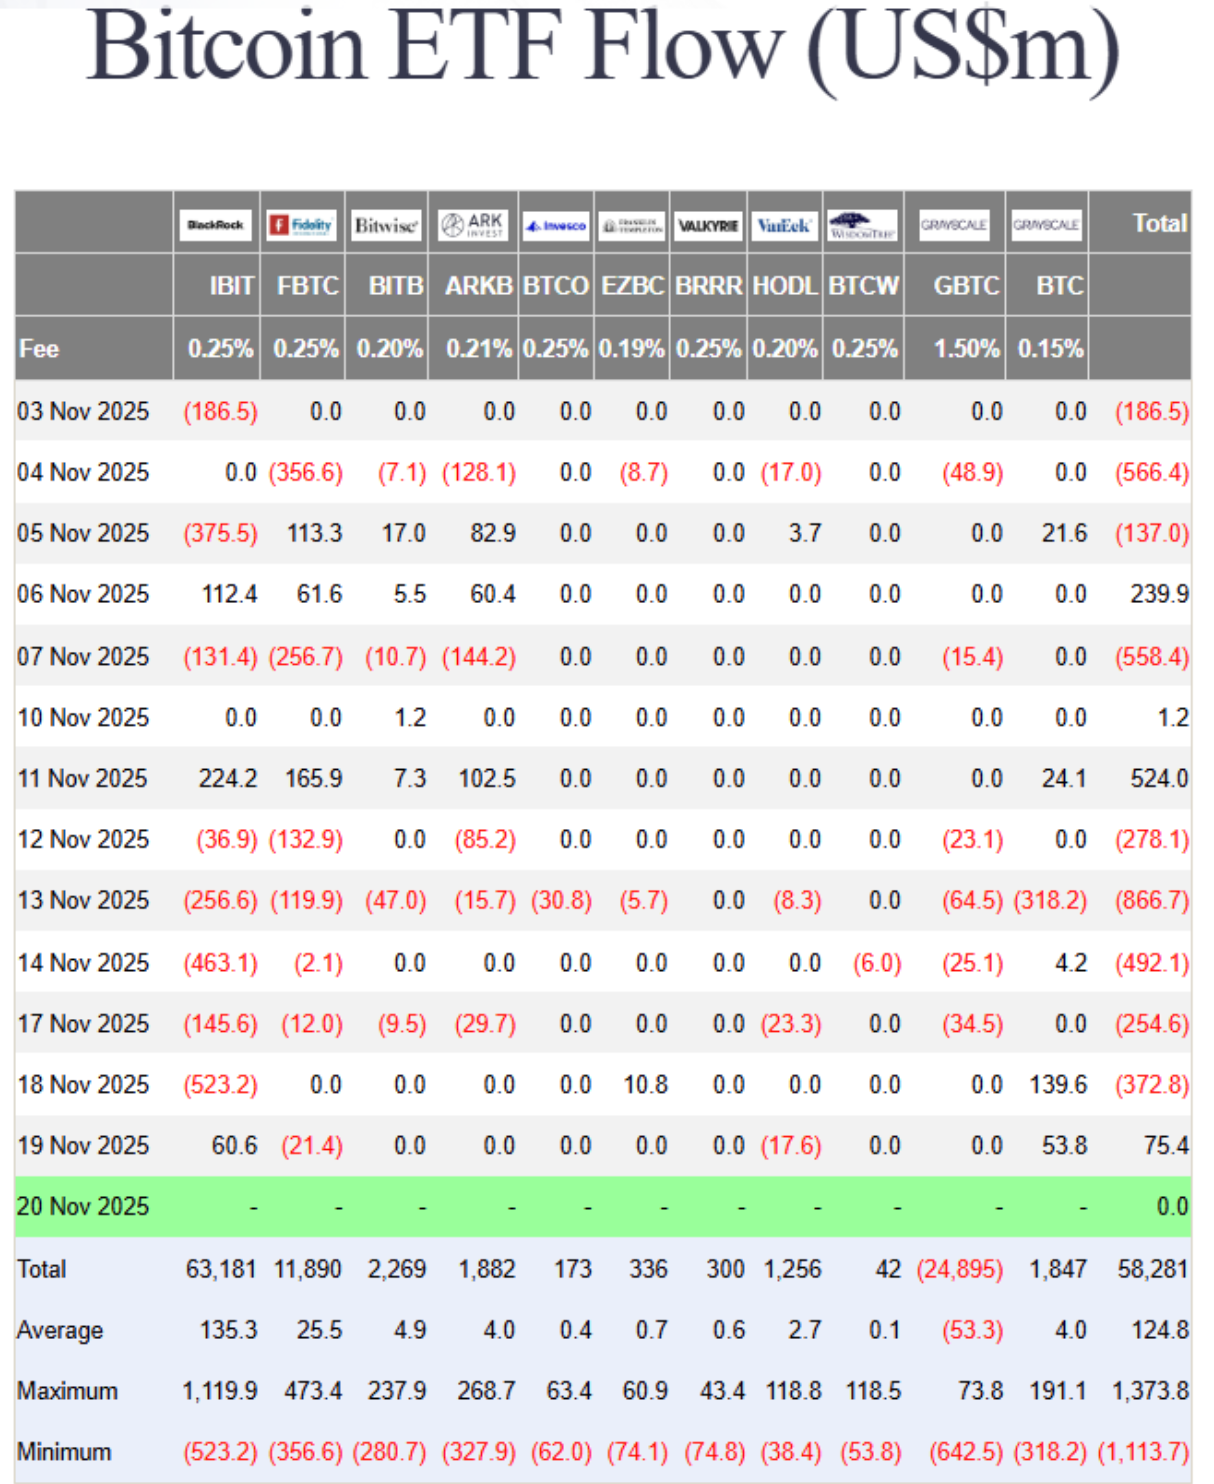
Recent data showed nearly $3 billion has exited Bitcoin ETFs this month alone, turning the same institutional flows that once fuelled the rally into a feedback loop of redemptions and retreat.
Behind the selloff lies a mix of fading Fed-rate-cut hopes, tightening liquidity, and a market paralysed by “extreme fear”. With prices hovering near $85,600 and the one-year low at $74,000 looming, the question is simple but urgent: is this correction a passing flush - or the start of a deeper shift in Bitcoin’s new ETF era?
What’s driving Bitcoin’s correction
Bitcoin’s 30% slide isn’t being driven by scandal or shock - it’s the result of structural forces finally reversing, according to analysts. After two years of relentless inflows, spot Bitcoin ETFs are now experiencing capital outflows. Institutional investors, once hailed as crypto’s stabilisers, are showing how quickly sentiment turns when markets wobble.
According to Farside data, ETF redemptions have occurred on all but four days this month, stripping nearly $3 billion in net outflows.
Part of that retreat stems from shifting macro conditions. The Federal Reserve’s reluctance to confirm rate cuts has strengthened the US dollar, drawing liquidity away from speculative assets.
Past movements have shown that a stronger dollar typically weighs on Bitcoin, and with inflation readings still sticky, traders are reassessing the narrative of “easy money” returning in December. The result is a market where rallies are met with selling rather than enthusiasm - a sharp turn from the euphoria that drove Bitcoin to $126,000 just weeks ago.
Why it matters
Bitcoin’s selloff is revealing just how tightly traditional and digital markets are now intertwined. ETFs opened the floodgates for institutional exposure, but they also linked Bitcoin to broader risk trends. When investors pull money from ETF products, the effect ricochets through liquidity pools and sentiment alike.
As Matt Williams of Luxor explained, “The drop to $86,000 is largely driven by macro forces - rate expectations, inflation - and by large holders cutting exposure after breaking key technical supports.”
For traders, this is a psychological turning point. The same retail crowd that once flooded exchanges during Thanksgiving 2017 - when Bitcoin first crossed $10,000 - is largely silent now.
Social data from Santiment shows sentiment evenly split between predictions of a plunge below $70,000 and wild optimism for a rally to $130,000. The divide signals indecision, not conviction. In this phase, fear - not fundamentals - is setting the tone.

Impact on markets and investors
The selloff has spilled beyond the crypto space. Bitcoin’s correlation with equity indices, such as the Nasdaq 100, has climbed above 0.8 at times, meaning that moves in tech stocks and digital assets now feed off the same macro triggers. When rate optimism fades, both markets suffer. That link cuts against Bitcoin’s long-standing claim as a hedge against monetary risk.
ETF outflows are another pressure point. As funds are redeemed, liquidity providers are compelled to unwind their positions in futures and spot markets, thereby deepening volatility.
The Crypto Fear & Greed Index, which plunged to 14 this week - its lowest since February - underscores how rapidly sentiment has deteriorated. Analysts like Rachael Lucas of BTC Markets warn that momentum, money flow, and volume trends “all reflect a sharp deterioration in sentiment,” driven by macro tightening and risk-off positioning.

In the background, liquidity providers are struggling. Tom Lee of Fundstrat compared crypto market makers to “central banks” of digital liquidity - and right now, those banks are running dry.
Following October’s $20 billion liquidation wave, market makers are operating with smaller balance sheets, which limits their ability to absorb order flow. It’s a reminder that crypto’s plumbing, though more sophisticated, is still fragile.
Expert outlook
Analysts are torn between caution and curiosity. Nic Puckrin of Coin Bureau describes the current landscape as a “bull-bear tug of war,” with macroeconomic pessimism offset by resilience in the tech sector.
Nvidia’s earnings beat briefly lifted risk appetite, but Bitcoin failed to follow through, suggesting traders are still unwinding rather than reloading. Puckrin pegs the next resistance at $107,500, if a rebound can gain traction.
Andre Dragosch of Bitwise sees parallels to past mid-cycle corrections, noting that the depth and duration of this decline “remain consistent with interim pullbacks in previous bull markets.” His base case still anticipates the cycle extending into 2026, driven by gradual global monetary easing.
For now, though, short-term risk remains tilted lower, with $85,600 and $74,000 as the two critical levels to watch. Hold those, and Bitcoin could form a base; lose them, and the next flush could be swift.
The bigger picture: Could Bitcoin trigger a financial crisis?
Despite the panic, Bitcoin remains relatively small compared to the real financial system. The total crypto market stands around $3–4 trillion, with Bitcoin representing roughly half. In contrast, global financial assets exceed $400 trillion. Past collapses, such as FTX in 2022 and Terra in 2021, caused chaos within the crypto industry but barely rippled across global markets.
That said, every cycle pulls crypto closer to traditional finance. ETFs, corporate holdings, and stablecoins backed by US Treasuries have created real linkages. A severe Bitcoin crash could trigger ETF redemptions, hurt balance sheets at companies holding BTC, and pressure stablecoins to liquidate their Treasury assets. None of that would cause a 2008-style crisis today - but as the overlap grows, the line between “crypto crash” and “financial contagion” gets thinner.
Bitcoin technical insights
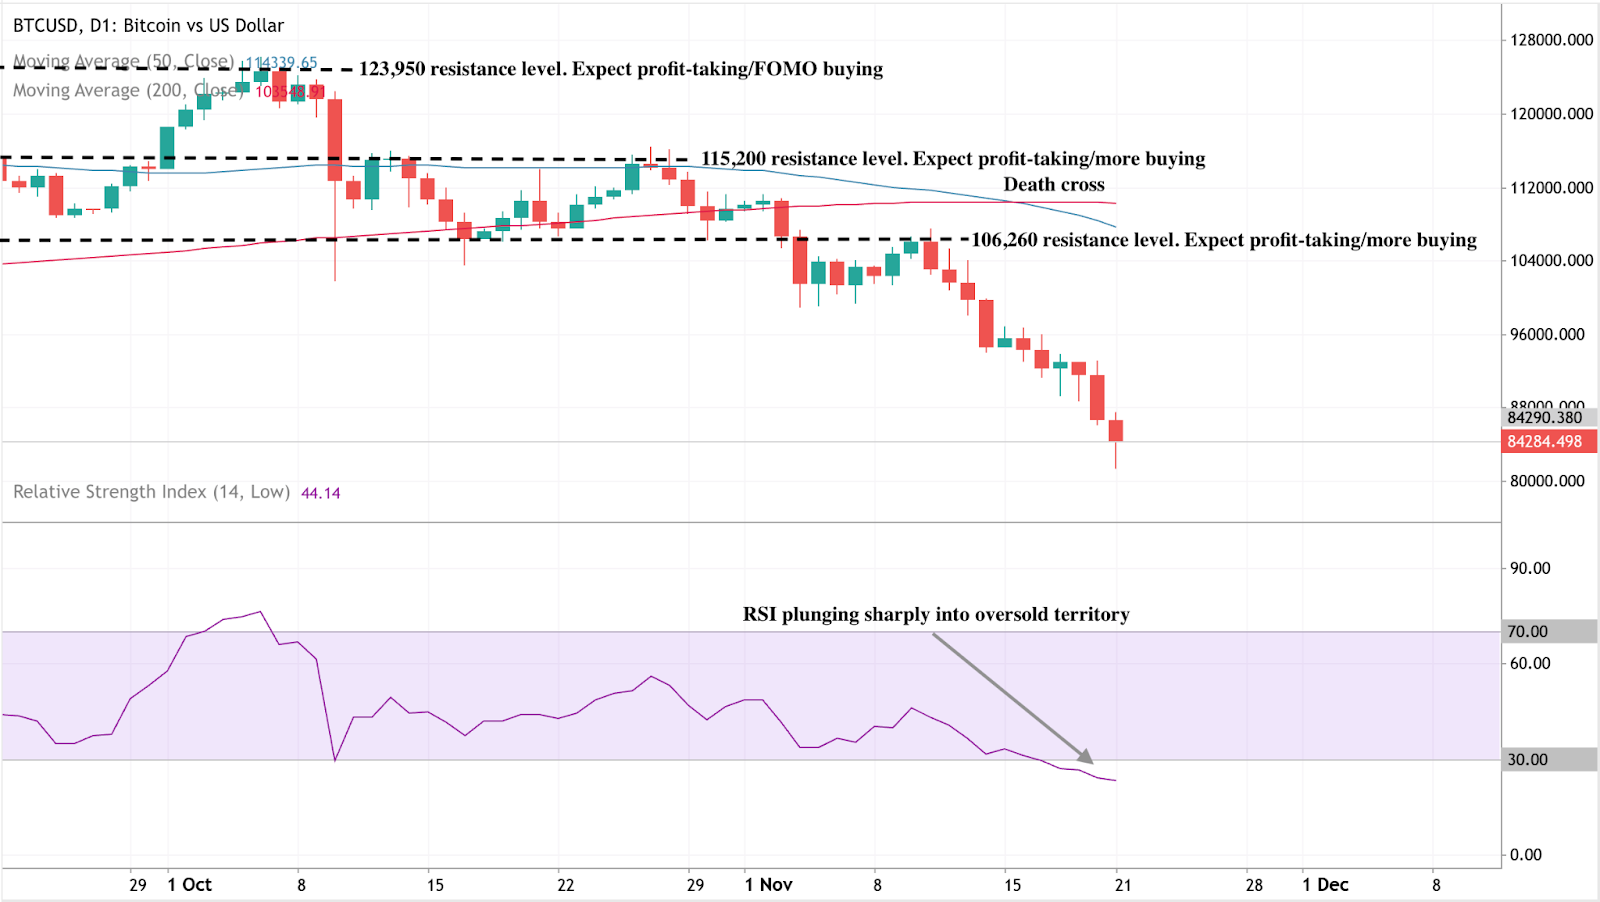
At the time of writing, Bitcoin (BTC/USD) is trading around the $84,200 mark after an extended downtrend. The RSI has plunged sharply into oversold territory, signalling intense bearish momentum and the potential for a short-term relief bounce if buyers step in.
A death cross - where the 50-day moving average has fallen below the 200-day moving average - reinforces the bearish bias, suggesting further downside pressure in the near term.
Key resistance levels sit at $106,260, $115,200, and $123,950, where traders may expect profit-taking or renewed buying interest if recovery attempts occur. Failure to reclaim these zones could see Bitcoin remain under pressure, with sentiment staying fragile amid persistent selling.
Key takeaways
Bitcoin’s decline isn’t an accident - it’s a stress test of its new reality. The ETF era has tied the cryptocurrency closer to the global financial system, for better and worse. Liquidity, once a tailwind, now cuts both ways. Fear dominates, but deep corrections are part of Bitcoin’s DNA.
If those two lines - $85,600 and $74,000 - hold firm, many say this reset may end up looking like just another cleansing phase before the next wave of institutional demand. Lose them, and Bitcoin’s harsh reset could turn into something much deeper.

Nvidia earnings reality check: Is the AI boom back on track?
Nvidia’s latest earnings didn’t inflate another round of hype; they restored confidence that artificial intelligence is entering its scale phase.
Yes - the AI boom is back on track, according to analysts, just in a different gear. Nvidia’s latest earnings didn’t inflate another round of hype; they restored confidence that artificial intelligence is entering its scale phase, not its speculative one.
Nvidia investors are bracing for a $300 billion surge in market value after the chipmaker reported its first sales acceleration in seven quarters, signalling that AI demand isn’t fading - it’s normalising into a sustainable growth cycle.
For months, markets were haunted by talk of “peak AI.” However, Nvidia’s results - record data centre revenue, renewed partnerships, and a 5% share spike in after-hours trading - show the story isn’t one of collapse, but calibration. This isn’t a bubble bursting; it’s the industry learning how to breathe again.
What’s driving Nvidia’s momentum
At the core of Nvidia’s dominance in artificial intelligence architecture is its data centre segment, which surpassed $50 billion this quarter, a milestone reached earlier than analysts expected.
This reflects an industrial-scale buildout, not a speculative frenzy. The surge in demand from AI workloads has transformed GPUs from niche products into the backbone of modern computing, powering everything from ChatGPT to enterprise cloud systems.
CEO Jensen Huang captured it best: “We’re in every cloud.” That ubiquity underpins Nvidia’s stability. Its chips are not optional - they’re essential infrastructure. With Blackwell GPUs offering up to 40 times faster inference speeds than the previous generation, the company isn’t chasing hype; it’s engineering the next leap in computational efficiency.
Why it matters
Nvidia’s report acts as a barometer for the AI economy. The stock’s post-earnings rally wasn’t just about profits; it was about validation. The market had priced in fear after days of tech sell-offs, but Nvidia’s blowout numbers reintroduced realism.
Analysts like Julian Emanuel of Evercore ISI summed up the pre-earnings tension: “The angst around ‘peak AI’ has been palpable.” Those fears evaporated when Nvidia showed that demand isn’t flattening - it’s broadening.
The company’s performance has become closely tied to the trajectory of U.S. equities. With AI now a structural growth driver, Nvidia’s consistency reassures investors that this is an economic revolution in progress, not a fleeting mania. Its $5 trillion valuation last month wasn’t an aberration; it was a preview of scale yet to come.
Impact on global markets
The aftershocks were immediate. Tech indices that had stumbled under the weight of “AI fatigue” rebounded as Nvidia reignited investor faith. Asian markets opened higher, and S&P futures turned positive, driven by renewed conviction that the AI trade still has legs. Even after a period of correction - Meta down 19%, Oracle off 20% - Nvidia’s performance reaffirmed that the long-term AI thesis remains intact.
Beyond markets, Nvidia’s results signal a new capital cycle. Its multibillion-dollar partnerships with Microsoft, OpenAI, and Anthropic aren’t one-off investments; they’re structural commitments to an AI-driven infrastructure era. Every dollar of GPU spending feeds into an ecosystem that’s building capacity for the next generation of models, data centres, and intelligent services.
Expert outlook
Forecasts are being rewritten. McKinsey estimates $7 trillion in AI infrastructure spending by 2030, with $5.2 trillion going toward data centres. According to McKinsey, we will also see significant incremental AI capacity added every year through to 2030.
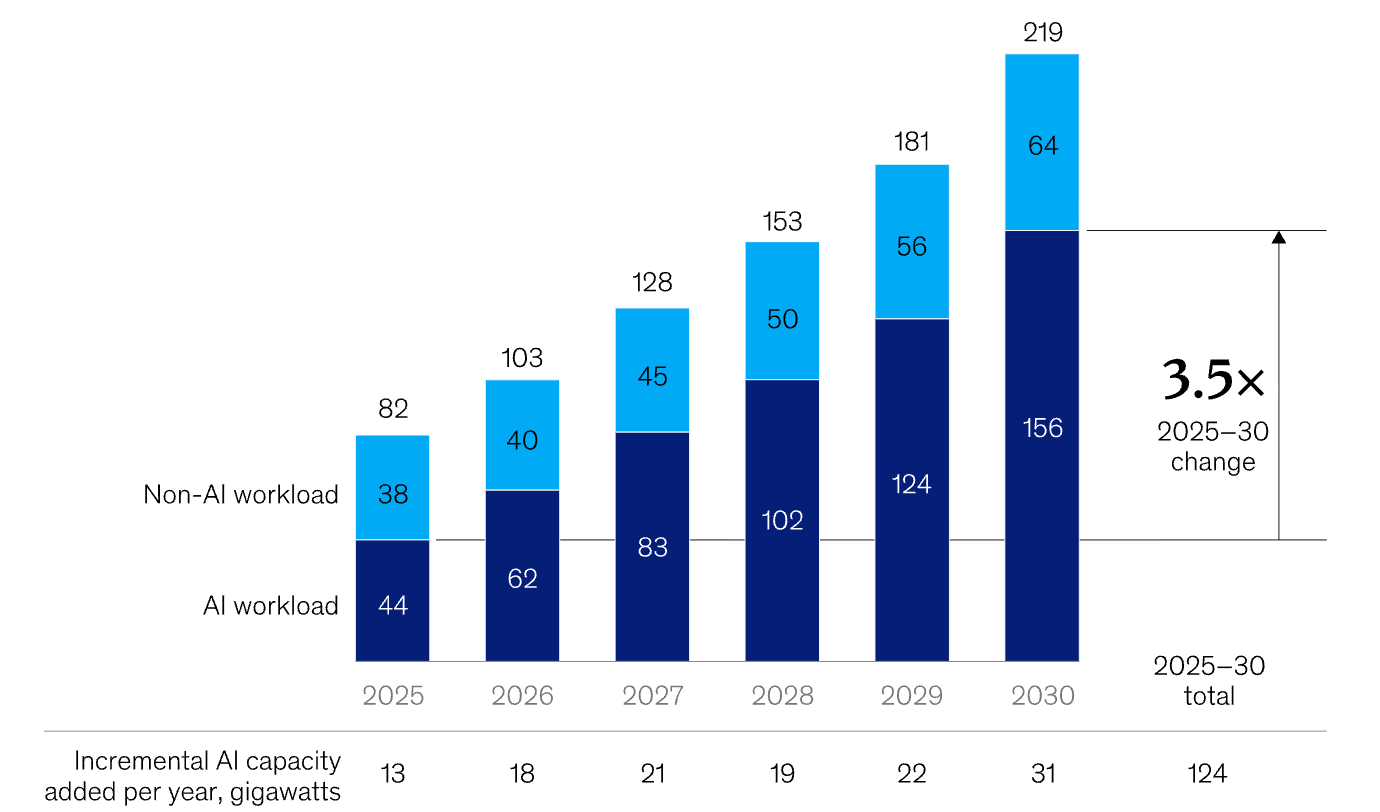
Nvidia’s share of that pie could exceed 50%, given its current dominance and design lead. Some analysts even project a $20 trillion market capitalisation by 2030 if the company maintains its pace of innovation.
Still, this is not a frictionless ascent. Export restrictions to China and the rise of custom silicon from rivals like AMD and Google pose challenges. Yet Nvidia’s edge isn’t just its hardware - it’s the CUDA software ecosystem, which locks developers and enterprises into its platform. As long as AI workloads require versatility and performance across models and frameworks, Nvidia’s moat will hold.
Nvidia technical analysis
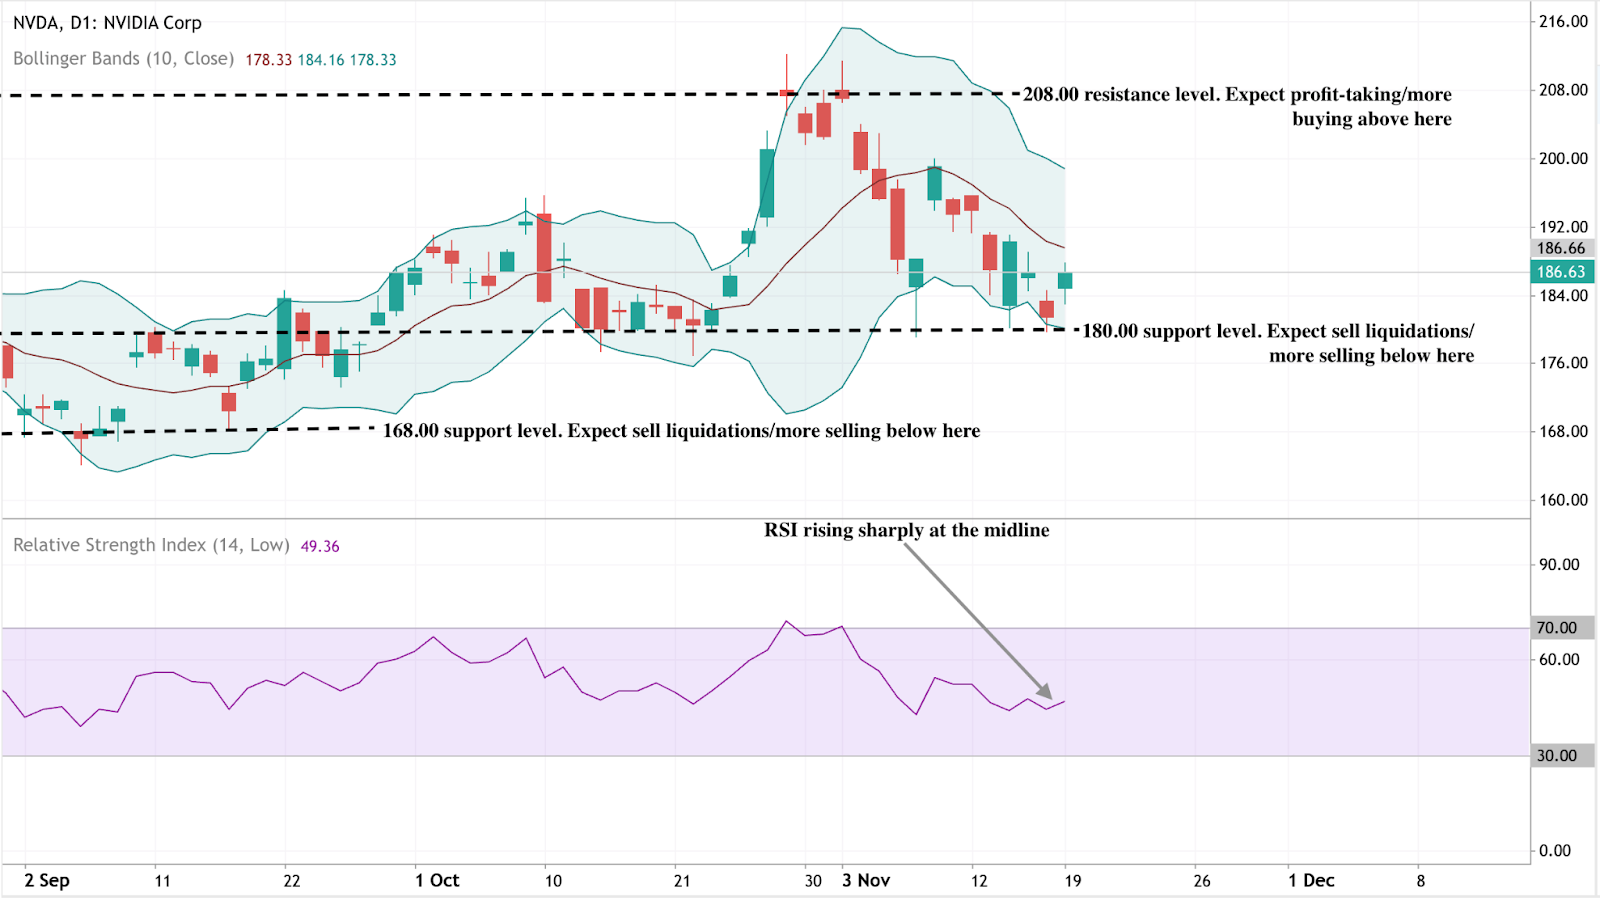
At the time of writing, Nvidia’s stock (NVDA) is hovering around $186, showing early signs of recovery after a short-term pullback. The RSI is rising sharply from the midline near 50, indicating that bullish momentum may be building as buying pressure intensifies.
Meanwhile, the Bollinger Bands are starting to narrow slightly, signalling a potential volatility squeeze that could precede a directional breakout. The price is currently positioned around the middle band, indicating a balance between buying and selling forces.
On the downside, support levels lie at $180 and $168. A drop below $180 may trigger further selling or stop-loss liquidations, while a break under $168 could confirm a deeper correction. On the upside, the key resistance sits at $208, where profit-taking and fresh buying activity are likely to intensify if the price breaks above it.
Key takeaway
Nvidia’s potential $300bn surge isn’t a sign of euphoria - it’s a reality check for those betting on an AI crash. The company’s results confirm that artificial intelligence has moved beyond the phase of promise into proof. As capital shifts from prototypes to platforms, the question isn’t whether AI will endure - it’s how fast it will reshape every market it touches. For now, Nvidia remains the pulse of that transformation.
For traders navigating that transformation, platforms like Deriv MT5 offer exposure to the tech rally’s next phase - while tools such as the Deriv trading calculator provide the precision to manage risk as the AI-driven market matures.

Vikwazo dhidi ya wingi wa usambazaji: Vita vinavyoamua bei za Mafuta
Bei za mafuta zimekwama kwenye mvutano unaoamua mjadala mzima wa nishati kwa sasa - vikwazo dhidi ya ziada ya usambazaji.
Bei za mafuta zimekwama kwenye mvutano unaoamua mjadala mzima wa nishati kwa sasa - vikwazo dhidi ya ziada ya usambazaji. Kadri vizuizi vipya vya Washington dhidi ya makampuni makubwa ya mafuta ya Urusi kama Rosneft na Lukoil vinavyoanza kutekelezwa, wafanyabiashara wanajiuliza kama hatua hizi hatimaye zitasababisha upungufu wa usambazaji wa kutosha kuinua bei au kama akiba kubwa na uzalishaji wa rekodi wa Marekani vitaendelea kuzuia ongezeko la bei.
WTI crude imekuwa ikizunguka karibu na $60 katika mikutano ya hivi karibuni, ikionyesha hali hiyo hiyo ya kutokueleweka. Kila habari kuhusu vikwazo huwasha matumaini; kila ripoti ya akiba huyazima. Matokeo ya mvutano huu - kati ya siasa za kimataifa na misingi ya soko - yataamua kama hatua inayofuata ya mafuta ni ongezeko la kweli au ni matumaini hewa tena.
Nini kinachochochea kuimarika kwa bei
Kwa mujibu wa wachambuzi, ongezeko la hivi karibuni la bei ya mafuta linasukumwa zaidi na wasiwasi mkubwa kuhusu mtiririko wa mauzo ya nje ya Urusi. Katika taarifa kwa vyombo vya habari iliyotolewa na Wizara ya Fedha ya Marekani, Marekani na nchi washirika zimeweka vikwazo vikubwa vinavyolenga wazalishaji wakuu wa mafuta wa Urusi, wakiwemo Rosneft na Lukoil, pamoja na mamia ya meli kutoka kwenye "jeshi la meli za siri".
Hatua hizi zinalenga kukata mapato ya mafuta ya Urusi na hivyo kupunguza kiasi cha mauzo yake ya nje. Mantiki ni rahisi: mapipa machache kutoka Urusi = usambazaji finyu duniani = bei juu zaidi. Lakini nguvu pinzani ni kubwa: usambazaji wa kimataifa bado ni imara, na mahitaji hayarudi juu kama ilivyotarajiwa.
Kwa mujibu wa Shirika la Kimataifa la Nishati (IEA), uzalishaji nje ya OPEC+ unatarajiwa kukua kwa mapipa milioni 1.7 kwa siku (bpd) mwaka 2025, huku ukuaji wa mahitaji ukikadiriwa kuwa mapipa milioni 0.79 kwa siku pekee, ikionyesha ziada ya kimuundo isipokuwa mabadiliko yatokee.
Wakati huo huo, takwimu zinaonyesha kuwa mbinu mbadala za Urusi za uzalishaji na usafirishaji bado zinafanya kazi kwa ufanisi hadi sasa - uzalishaji wa Urusi uliongezeka kwa takriban mapipa 100,000 kwa siku hata baada ya vikwazo. Hivyo, kuimarika kwa bei kunabaki kati ya simulizi ya mshtuko wa usambazaji na ziada sugu ya mahitaji/akiba, na kama bei zitapanda inategemea upande upi utashinda.
Umuhimu wake
Kwa wafanyabiashara, wazalishaji na watumiaji, mwelekeo huu si wa kinadharia tu. Ongezeko la bei linalodumu linalosababishwa na upungufu wa usambazaji lingefaa wawekezaji wenye mizigo mikubwa ya mafuta, faida za usafishaji, na nchi zinazouza mafuta. Kinyume chake, kama ziada ya usambazaji itaendelea na mahitaji yakashindwa kuimarika, hata simulizi ya vikwazo haitasaidia bei. Kama mchambuzi mmoja mwandamizi wa nishati alivyonukuliwa: “Soko halitarajii upungufu mkubwa wa usambazaji hadi utekelezaji wa vikwazo uthibitike bila shaka.”
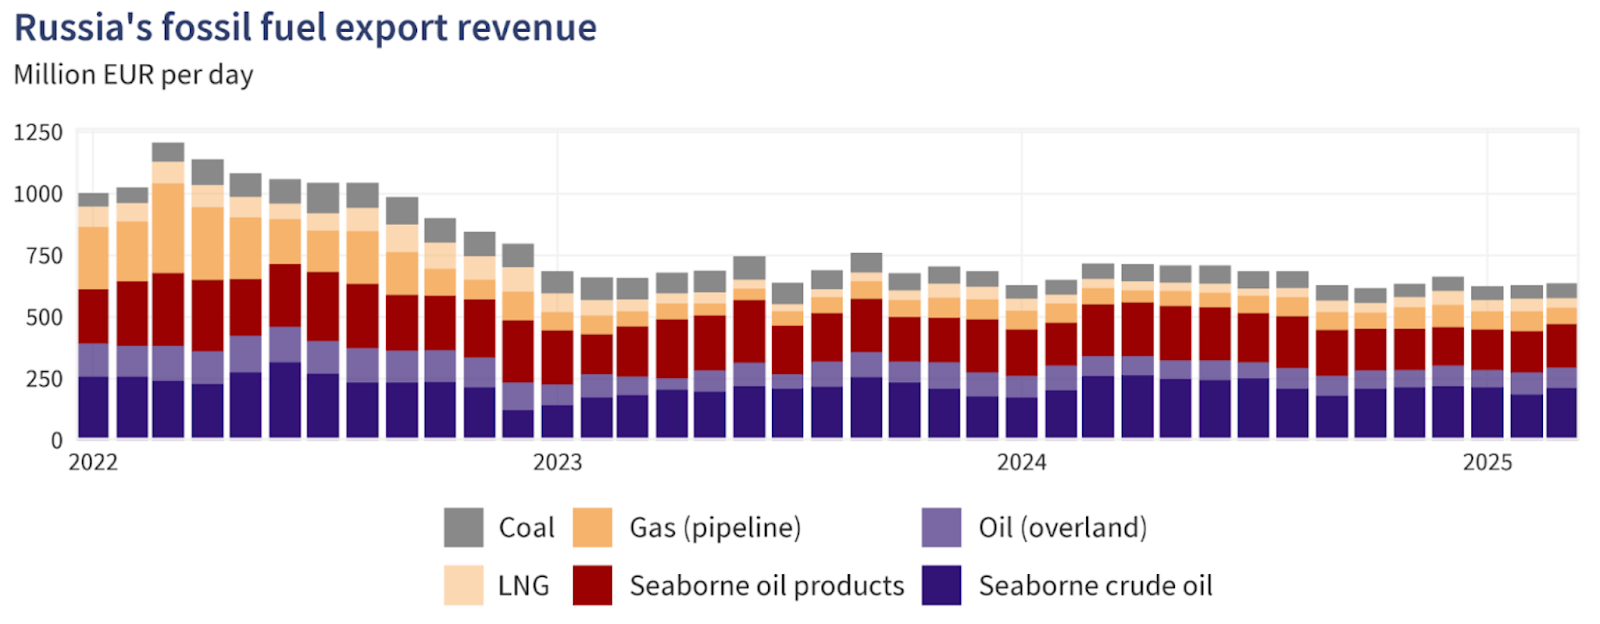
Kwa Urusi na wanunuzi wake wa kimataifa, mizani ni kubwa. Mapato ya mafuta na gesi ya Urusi yalishuka kwa 27% mwezi Oktoba 2025 ikilinganishwa na mwezi huo huo mwaka uliopita, ikionyesha shinikizo la vikwazo hata kama kiasi cha mauzo kiliendelea kupitia mbinu mbadala.
Wakati huo huo, waagizaji wakubwa wa mafuta kama India na China wamekuwa wakiongeza ununuzi wao wa mafuta ya Urusi katika miezi ya hivi karibuni kabla ya kushuka kwa mauzo mwezi Novemba, jambo ambalo limeleta mashaka kuhusu uendelevu wa mtiririko wa mafuta kwa nchi hizo.
Hivyo, kama waagizaji wataendelea kununua mapipa ya Urusi kwa punguzo, usambazaji wa kimataifa unaweza kubaki mkubwa hata kama simulizi linaonyesha vinginevyo. Kwa upande wa watumiaji, kama bei za mafuta zitabaki chini kutokana na ziada ya usambazaji, gharama za mafuta zitaendelea kuwa nafuu. Ikiwa upungufu wa usambazaji utatawala, bei za bidhaa zilizochakatwa (dizeli, petroli) zinaweza kupanda, kuchochea mfumuko wa bei na kuathiri ukuaji wa uchumi - hatari inayopaswa kufuatiliwa katika masoko yaliyoendelea na yanayoibukia.
Athari kwa soko
Kwa vitendo, mistari ya mapambano imechorwa kulingana na wachambuzi. Kwa upande wa hatari ya usambazaji, kama vikwazo vitafanya kazi na mauzo ya nje ya Urusi yakashuka kwa kiasi kikubwa, masoko yanaweza kubana haraka na bei za mafuta zikapanda.
Hatari hii tayari inaonekana kwenye tofauti za bei ya mafuta ghafi: punguzo la mafuta ghafi ya Urals ya Urusi dhidi ya viwango vya kimataifa liliruka hadi karibu dola za Marekani 19 kwa pipa mwanzoni mwa Novemba, baada ya wanunuzi kukwepa mizigo ya Urusi, kwa mujibu wa ripoti ya Meduza. Hii inaashiria kuwa athari ya vikwazo huenda inaanza kuonekana.
Lakini upande mwingine, takwimu za ufuatiliaji zinaonyesha kuwa mtiririko wa mafuta ya Urusi bado unabadilishwa njia, na wazalishaji wa kimataifa (hasa shale, Brazil na Marekani) wanajibu. Kwa uzalishaji wa Marekani ukiwa kwenye viwango vya juu kabisa na akiba ikiongezeka, simulizi ya ziada ya usambazaji bado ina nguvu, kwa mujibu wa wachambuzi wa sekta. Ikiwa mahitaji yataendelea kuwa dhaifu - kwa mfano, kutoka China au sekta ya viwanda duniani - basi ongezeko lolote la bei kutokana na mshtuko wa usambazaji linaweza kuwa la muda mfupi, na bei zikashuka tena.
Mtiririko wa usafishaji na biashara pia unabadilika. Wauzaji na wasafishaji sasa wanazingatia mafuta ghafi ya Urusi yenye punguzo, njia ndefu za usafirishaji, na gharama kubwa za usafiri na bima - mambo yote haya yanaongeza ugumu lakini hayapunguzi kiasi cha mafuta mara moja. Mpaka upotevu halisi wa mapipa uonekane kwenye takwimu za mauzo ya nje, soko linaweza kubaki katika hali ya kusubiri, likisita kujitolea kwa mwelekeo wa juu wa bei.
Mtazamo wa wataalamu
Kwa mujibu wa wachambuzi, hali inayotarajiwa zaidi ni soko kubaki kwenye mwelekeo wa biashara wa ndani ya viwango, likikatizwa na milipuko ya mabadiliko ya bei. Yaani, mafuta yanaweza kupanda kwa muda kutokana na uvumi wa vikwazo au usumbufu wa usambazaji, lakini kama mahitaji hayatakuwa imara na usambazaji haukubanwa kweli, ongezeko hilo halitakuwa endelevu. Reuters iliripoti kuwa IEA inaendelea kutarajia ukuaji wa usambazaji kuzidi mahitaji mwaka huu.
Kama utekelezaji wa vikwazo utakuwa mkali zaidi - kwa mfano, kama meli za jeshi la siri zitazuiwa, gharama za bima zipande au waagizaji wakubwa waache kununua mafuta ya Urusi - basi tunaweza kuona ongezeko la maana la bei.
Kwa upande wa mahitaji, viashiria vya kufuatilia ni pamoja na viwango vya usafishaji (ambavyo bado viko chini ya shinikizo), mwenendo wa usafiri na uhamaji, na mahitaji ya petrokemikali ya China. Mpaka moja ya haya ionyeshe mabadiliko chanya wazi, simulizi ya ziada ya usambazaji itaendelea kuzuia ongezeko la bei.
Kwa kifupi, hatari ya usambazaji ni halisi, lakini bado haijashinda hali ya ziada ya usambazaji na mahitaji dhaifu. Mpaka hilo litokee, ongezeko la bei litaendelea kuwa la tahadhari.
Uchambuzi wa kiufundi wa mafuta
Wakati wa kuandika, Mafuta ya Marekani yanauzwa karibu $59.50, yakijikusanya ndani ya eneo finyu huku kasi ikianza kutulia. RSI inapanda kwa kasi kutoka mstari wa katikati karibu na 50, ikiashiria kuimarika kwa nguvu ya wanunuzi na kupendekeza kuwa wanunuzi wanaweza kurejesha udhibiti wa muda mfupi.
Bollinger Bands (10, close) ni nyembamba, ikiashiria kupungua kwa mabadiliko ya bei na uwezekano wa kutokea kwa mwelekeo mpya. Mienendo ya bei inabaki katikati ya bendi ya kati, ikionyesha kutokueleweka lakini ikiwa na mwelekeo mdogo wa juu huku wanunuzi wakijaribu kusukuma bei juu ya kiwango cha kati.
Ngazi kuu za msaada zinapatikana kwenye $58.26 na $56.85, ambapo kushuka chini kunaweza kusababisha shinikizo zaidi la mauzo au uuzaji wa haraka wa mali. Kwa upande wa juu, upinzani uko kwenye $62.00 na $65.00 - viwango ambavyo faida na shughuli kubwa za ununuzi zinaweza kujitokeza ikiwa soko litapanda zaidi.

Hitimisho kuu
Soko la mafuta liko kwenye njia panda ambapo simulizi ya hatari ya usambazaji inayosukumwa na vikwazo inagongana na uhalisia wa ziada ya usambazaji na mahitaji dhaifu. Ingawa vikwazo vipya vya Urusi vimeongeza hatari ya bei, uzalishaji na akiba ya kimataifa bado ni kubwa na mahitaji ni dhaifu.
Isipokuwa upotevu wa mauzo ya nje utokee kweli na mahitaji yaimarike, simulizi ya ziada ya usambazaji itaendelea kushikilia bei za mafuta chini. Viashiria muhimu vya kufuatilia: takwimu za mauzo ya nje kutoka Urusi, mabadiliko ya akiba duniani na viashiria vya mahitaji kutoka Asia na Marekani. Endelea kuwa makini - hii ni vita ya hatari kubwa inayoweza kubadilika upande wowote.
Kwa wafanyabiashara wanaonavigeta soko la mafuta, Deriv MT5 inatoa fursa ya kufanya biashara ya WTI na Brent. Wakati huo huo, zana kama kikokotoo cha biashara cha Deriv zinatoa usahihi unaohitajika kudhibiti hatari kadri soko linaloendeshwa na AI linavyoendelea kukua.

USD/JPY outlook: Can the Yen hold its ground amid Japan’s policy tug-of-war?
Reports indicate that the Japanese yen is struggling to maintain its stability as Japan’s fiscal and monetary priorities diverge in opposite directions.
Reports indicate that the Japanese yen is struggling to maintain its stability as Japan’s fiscal and monetary priorities diverge in opposite directions. A massive ¥25 trillion stimulus plan from Prime Minister Sanae Takaichi has reignited concerns about inflation and weighed on the currency, while the Bank of Japan’s cautious stance on rate hikes offers little support. The result is a yen pinned near a nine-month low, with the USD/JPY pair hovering around ¥155.
Many say Japan’s policy tug-of-war is tilting decisively against the yen. Unless the government and central bank find common ground, traders may see further weakness - especially if the dollar remains buoyed by a patient but firm Federal Reserve.
What’s driving USD/JPY
The yen’s weakness stems from a widening policy divide inside Japan’s leadership. Prime Minister Takaichi’s administration has revived Abenomics-style stimulus, prioritising fiscal expansion to boost wages and consumer demand.
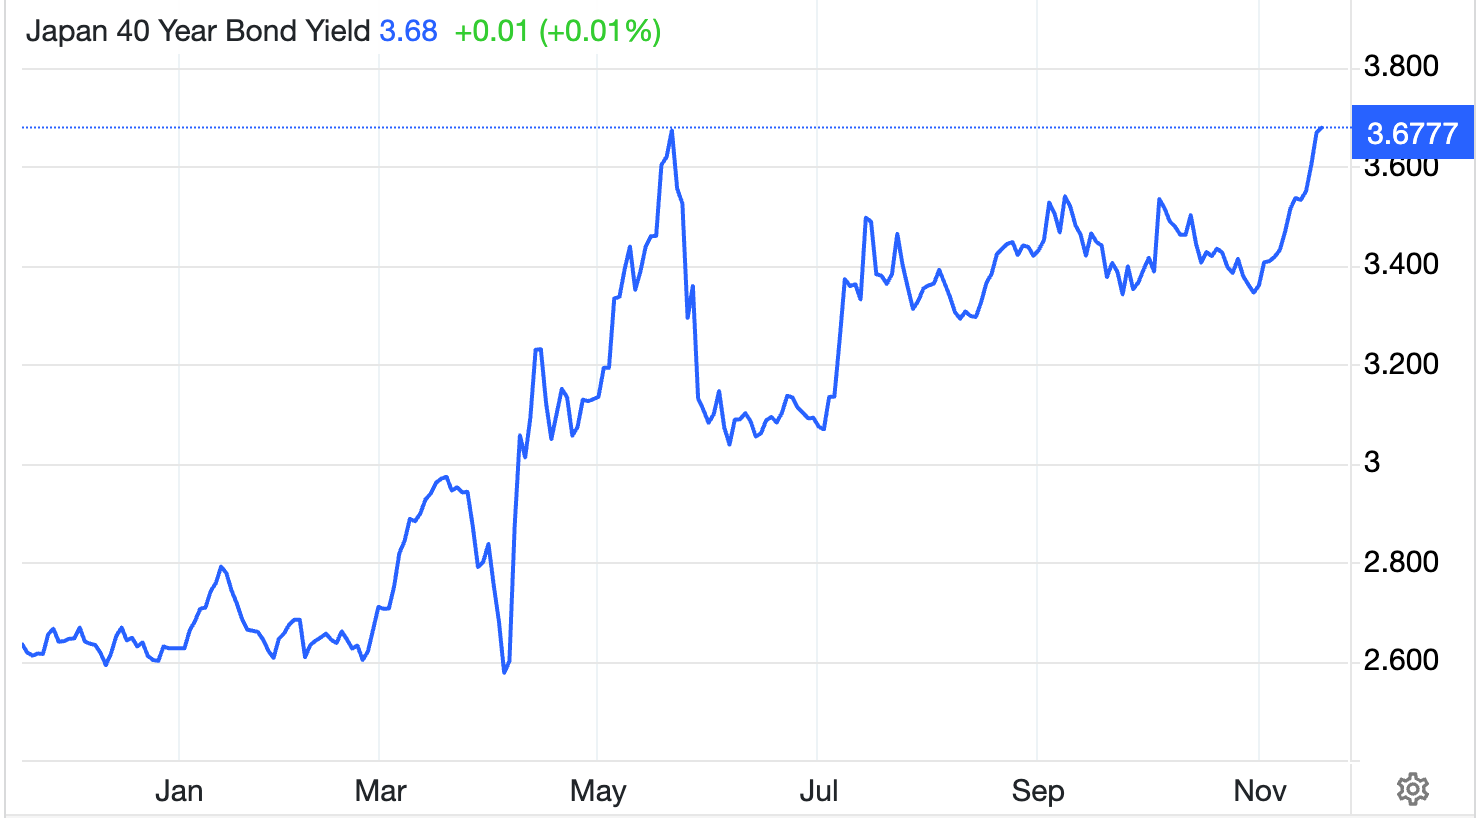
Lawmakers have proposed a supplementary budget exceeding ¥25 trillion, stoking concerns over rising debt issuance and sending 40-year Japanese government bond yields to record highs.
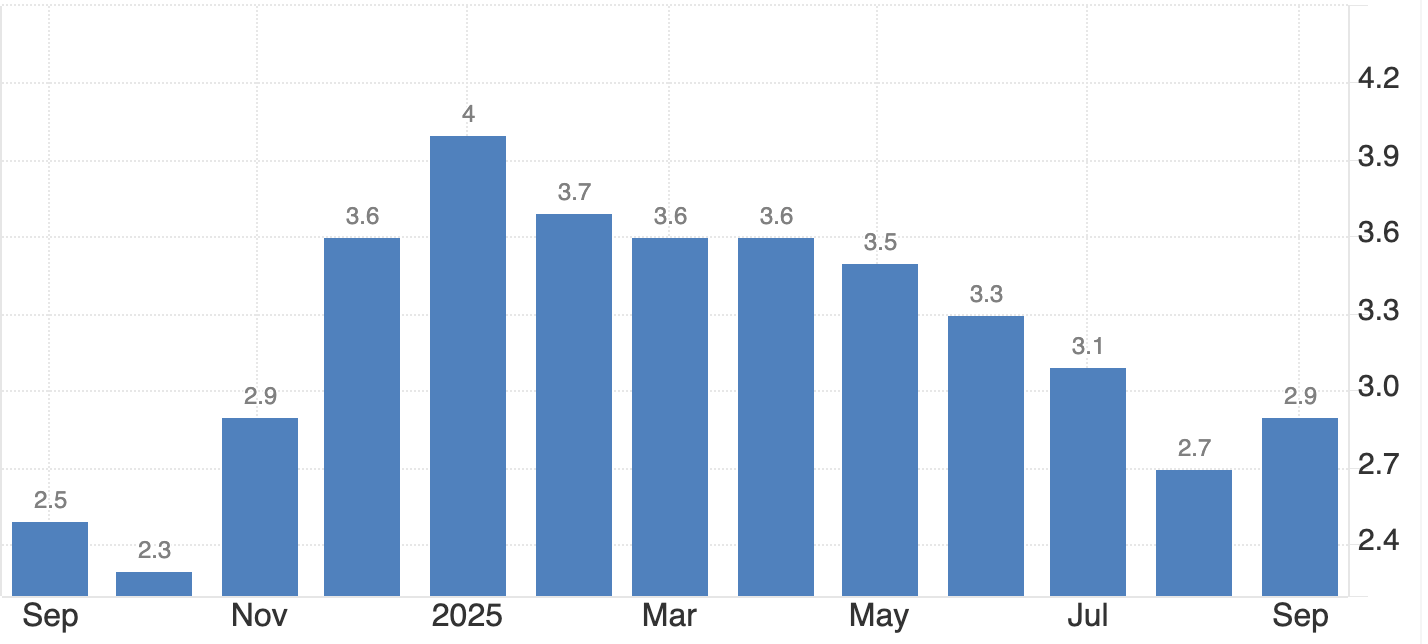
Meanwhile, the Bank of Japan (BoJ) is caught between political pressure and macroeconomic caution. Inflation, currently around 2.9%, remains above target, yet the prime minister insists on keeping rates low until wage growth - not food or energy costs - drives price stability.
Governor Kazuo Ueda has hinted at tightening if inflation persists, but uneven growth complicates matters: GDP grew 1.1% year-on-year, yet contracted 0.4% quarter-on-quarter. This tug-of-war has left investors unsure whether Japan’s policies are reflating the economy or eroding its currency.
Why it matters
This internal conflict is redefining how global markets view the yen. Once seen as a safe-haven anchor, it’s now behaving more like a risk currency, moving with rather than against global sentiment. “Japan has added a tumultuous element - they’re a little more wild, a little more volatile,” said Juan Perez of Monex USA. That volatility reflects a new reality: fiscal expansion is now Japan’s dominant narrative, while monetary prudence takes a back seat.
For traders, the risk is that verbal intervention replaces actual action. Finance Minister Satsuki Katayama has expressed concern over the yen’s sharp depreciation, but Tokyo has so far refrained from stepping into the market. Intervention is likely only if USD/JPY breaches ¥156 decisively - a level seen as politically sensitive rather than economically critical by analysts.
Impact across markets
According to reports, the consequences of Japan’s fiscal-monetary split are evident across its bond and currency markets. The yield curve has steepened sharply as investors price in heavier debt issuance, while near-zero short-term rates keep domestic liquidity abundant. This imbalance encourages capital outflows, as investors seek higher yields abroad, further putting downward pressure on the yen.
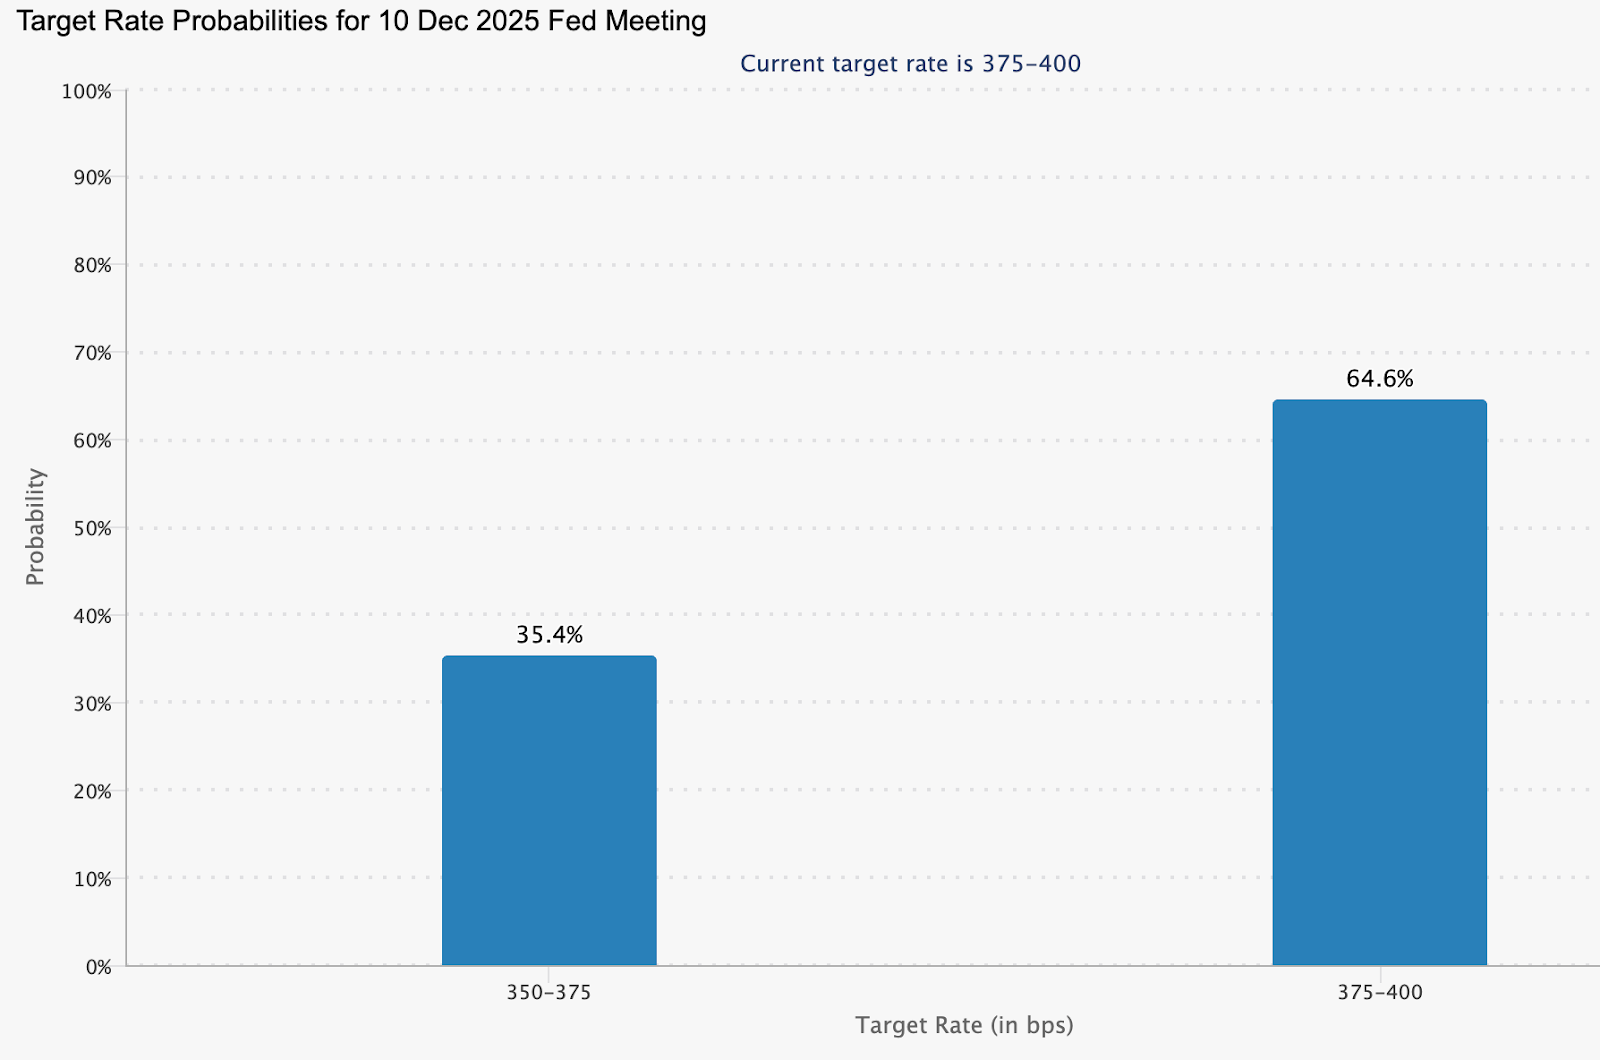
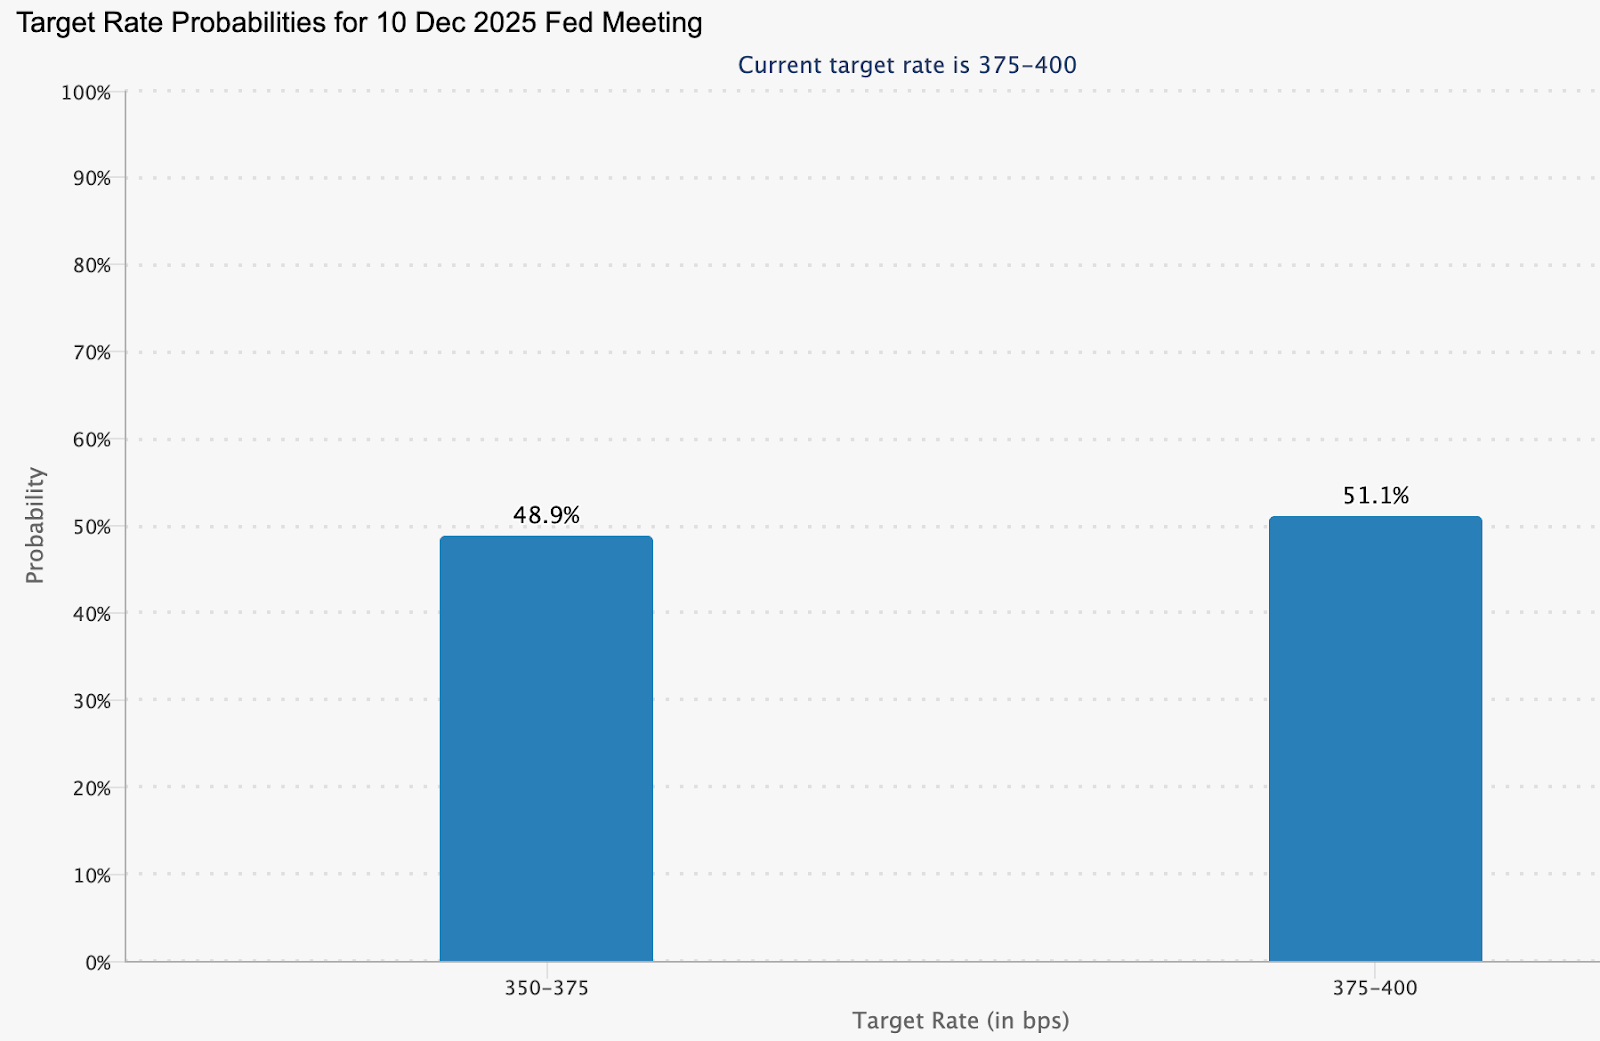
Across the Pacific, the Federal Reserve’s steadiness has reinforced dollar strength. Officials such as Philip Jefferson and Christopher Waller continue to advocate patience on rate cuts, trimming the probability of a December reduction to around 48%, down from 60% last week (CME FedWatch).
According to analysts, as long as this interest-rate gap persists, the dollar will remain structurally favoured against the yen, - and any yen rallies will likely prove temporary.
Expert outlook
Analysts see little relief for the yen in the near term. Barclays recommends holding a long position on the dollar against the yen, arguing that Takaichi’s expansionary agenda will suppress domestic yields and maintain downward pressure on the currency. Still, a sustained climb beyond ¥156 could test Tokyo’s resolve and force coordinated intervention.
The next key event is the delayed US Non-Farm Payrolls report, expected to provide fresh insight into labour market conditions. A weaker reading could trigger short-term dollar selling, allowing the yen to recover briefly. Yet without a policy shift in Japan, that reprieve may be short-lived. For now, the yen’s trajectory is dictated less by data and more by the dissonance between fiscal ambition and monetary caution.
USD/JPY technical insight
At the time of writing, USD/JPY is trading around 155.45, extending gains within a price discovery zone as bullish momentum persists. The pair is hugging the upper Bollinger Band, signalling strong buying pressure but also hinting at a possible overextension.
The RSI is climbing toward the overbought region, reinforcing the risk of a short-term pullback or profit-taking. Immediate support lies at 152.96, followed by 146.45, where a breakdown could trigger sell liquidations and accelerate downside movement.
However, as long as prices hold above the middle Bollinger Band and 153.00, the broader uptrend could remain intact, supported by policy divergence between the Federal Reserve and the Bank of Japan.

Key takeaway
Japan’s yen problem isn’t just about markets - it’s about messaging. Expansionary fiscal policy collides with a hesitant central bank, leaving investors unsure which signal to follow. The result is a currency under sustained strain, with verbal intervention doing little to stop the slide. Unless Tokyo finds alignment between stimulus and stability, the yen’s effort to hold its ground may remain more symbolic than successful.

Gold’s reversion to the mean: A pause before the next rally?
Gold has climbed back above $4,050 per ounce, stabilising after a sharp two-week selloff that pulled the metal down from record highs.
Gold has climbed back above $4,050 per ounce, stabilising after a sharp two-week selloff that pulled the metal down from record highs. The move reflects what analysts increasingly describe as a reversion to the mean - a natural correction following a steep run from $3,450 to $4,380 earlier in the quarter.
With the long-delayed US Non-Farm Payrolls (NFP) report now in focus, traders are watching whether this consolidation is a breather before the next leg up. The broader backdrop remains tense. Hawkish Federal Reserve remarks, delayed data from the US government shutdown, and continued geopolitical stress are all reshaping sentiment. Yet, behind the noise, gold’s pullback looks less like weakness - and more like equilibrium returning.
What’s driving gold’s mean reversion
The latest correction follows months of relentless buying, fuelled by soft US data, de-dollarisation flows, and record central-bank accumulation. Gold’s sprint from $3,450 to $4,380 outpaced fundamentals, leaving technical indicators stretched and sentiment euphoric.
Now, as traders recalibrate expectations for a December rate cut - pricing in a 48.9% chance according to CME FedWatch - the metal has slipped back toward its midrange, around $4,050–$4,100, where short-term and long-term averages converge.
This retreat also mirrors a psychological reset. Markets are digesting the Fed’s cautious tone, with Vice Chair Philip Jefferson urging a “slow approach” to policy changes and regional presidents Bostic and Schmid signalling preference for steady rates. Those comments, paired with delayed macro data, have thinned speculative positions and allowed gold to breathe. In effect, the market is rediscovering balance - a hallmark of mean reversion after an overextended move.
Why it matters
Gold’s mean reversion tells a deeper story about trust and monetary fatigue. As Citadel’s Ken Griffin noted, the rising price of gold reflects “a loss of trust first in US Treasuries, then in G7 bond markets.” Investors are responding not to short-term volatility, but to structural concerns about government debt and the stability of fiat currency.
Analysts at Deutsche Bank maintain that the medium-term trend remains intact, projecting an average gold price of $4,000 per ounce next year. They highlight “elevated official demand” - a reference to sustained central-bank buying.
In October, China’s central bank added 0.9 tonnes to its reserves, marking its 12th straight month of accumulation. Ongoing purchases throughout 2025 have lifted China’s official gold reserves to 2,304.5 tonnes.
This underlines that while traders may be reverting to the mean, nations are not - they’re steadily diversifying away from the dollar.
Impact across markets
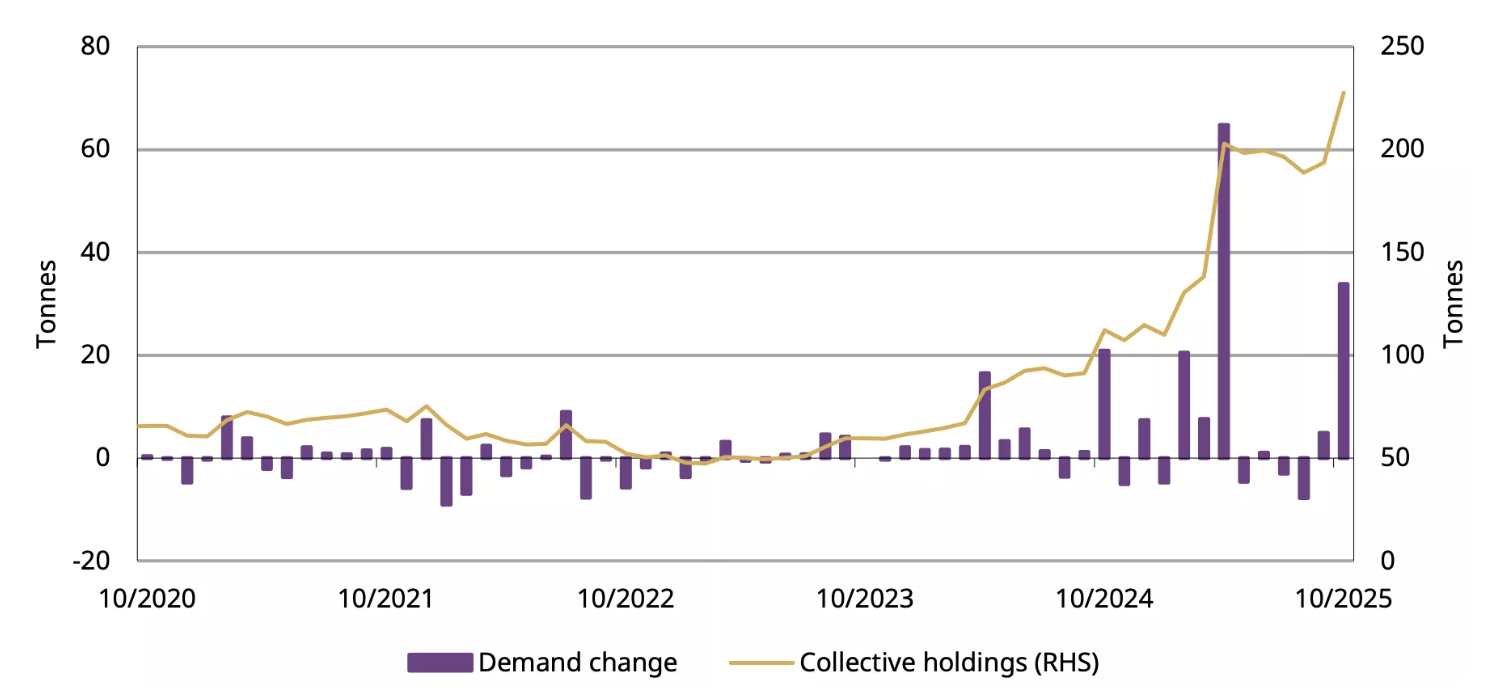
In China, investor appetite for gold remains vigorous even during the correction. ETF inflows jumped RMB 32 billion (US$4.5 billion) in October, pushing total holdings to a record 227 tonnes.
Physical demand, measured by withdrawals from the Shanghai Gold Exchange, rose 17 tonnes year-on-year to 124 tonnes, defying seasonal softness. The data suggests that investors see dips as opportunities, not red flags.
Globally, the story is similar. Soft US employment data and climbing jobless claims have tempered the dollar’s strength, nudging investors back into gold and silver.
Still, there’s awareness that a stronger NFP print or easing geopolitical risk could stall momentum. Even so, mean reversion isn’t a bearish event - it’s the market’s way of restoring order after a speculative sprint. And order, in uncertain times, is the most bullish foundation of all.
Expert outlook
Most analysts agree that gold’s medium-term trajectory remains higher, although near-term volatility will hinge on the US jobs data and the Fed’s stance in December. Independent trader Tai Wong says, “soft data is slightly boosting hopes for a December cut - helping gold and silver, which are trying to break a three-day losing streak.” That sentiment captures the current equilibrium: cautious optimism tempered by macro prudence.
If the NFP report underperforms, gold could swiftly retest $4,200, according to analysts. If it surprises to the upside, a dip toward $3,950 would complete a textbook mean reversion cycle before stabilising. Either way, the long-term bull case - driven by de-dollarisation, AI-driven labour disruption, and inflation inertia - remains intact. The question isn’t whether gold rises again, but when.
Gold technical analysis
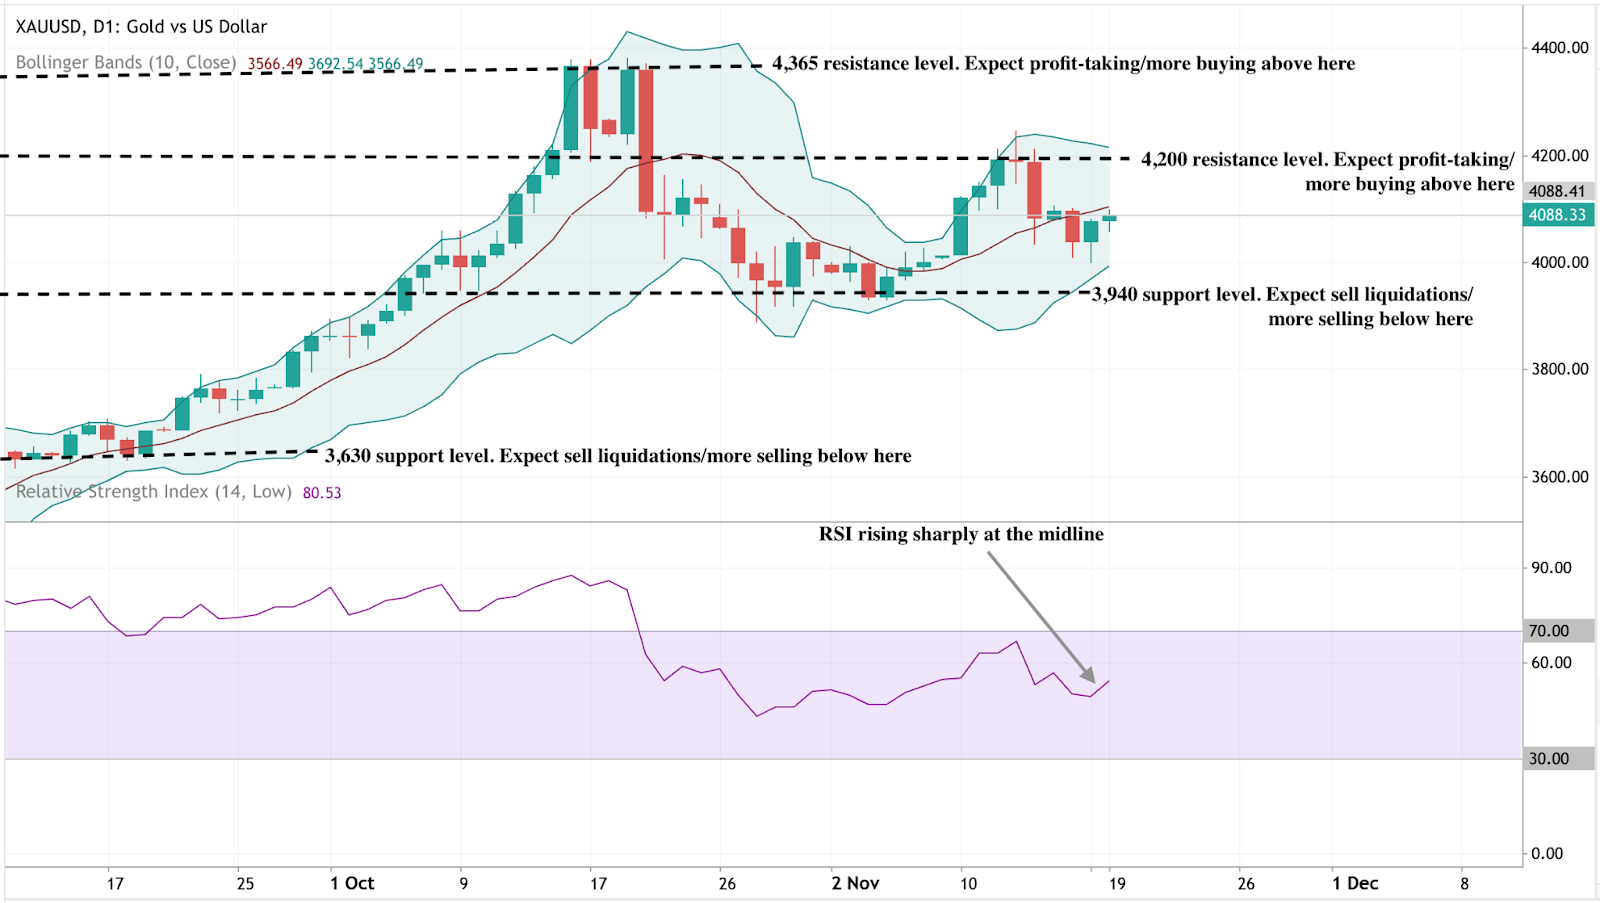
At the time of writing, XAU/USD is trading near $4,088, rebounding from the lower Bollinger Band as buyers re-enter the market. The Bollinger Bands are beginning to widen after a period of contraction, suggesting that volatility may be returning.
The RSI is rising sharply from the midline, signalling improving bullish momentum. Key resistance levels are seen at $4,200 and $4,365, where profit-taking or further buying could occur if gold breaks higher. On the downside, a fall below $3,940 would likely trigger sell liquidations, exposing deeper support at $3,630.
Overall, gold appears to be in the early stages of a potential bullish continuation, with the technical setup hinting at renewed upside pressure if momentum sustains above the mid-Bollinger Band.
Key takeaway
Gold’s pullback to the $4,000 zone isn’t weakness - it’s rhythm. A reversion to the mean after a parabolic rise is how sustainable trends reset. Beneath short-term volatility, the drivers of this bull phase - de-dollarisation, central-bank accumulation, and macro distrust - remain fully in play. As the US jobs data and Fed decisions unfold, this pause could mark the quiet before gold’s next major rally.

Bitcoin crashes under $90K as ‘death cross’ bites
Spot prices printed as low as 89,420 dollars, the weakest level since February, only six weeks after setting a record near 126,250 dollars.
Bitcoin slipped below 90,000 dollars on Tuesday, extending a selloff that has erased its 2025 gains and pushed sentiment toward the bleak end of the spectrum. Spot prices printed as low as 89,420 dollars, the weakest level since February, only six weeks after setting a record near 126,250 dollars.
The breakdown coincided with a bearish technical crossover known as a death cross and increasingly hesitant fund flows into U.S. spot ETFs.
Together with macro anxiety around the rate path, these factors have tightened liquidity and amplified swings across majors. The next phase hinges on whether price can quickly reclaim lost support and whether ETF prints stabilise from recent choppiness.
What’s driving the slide
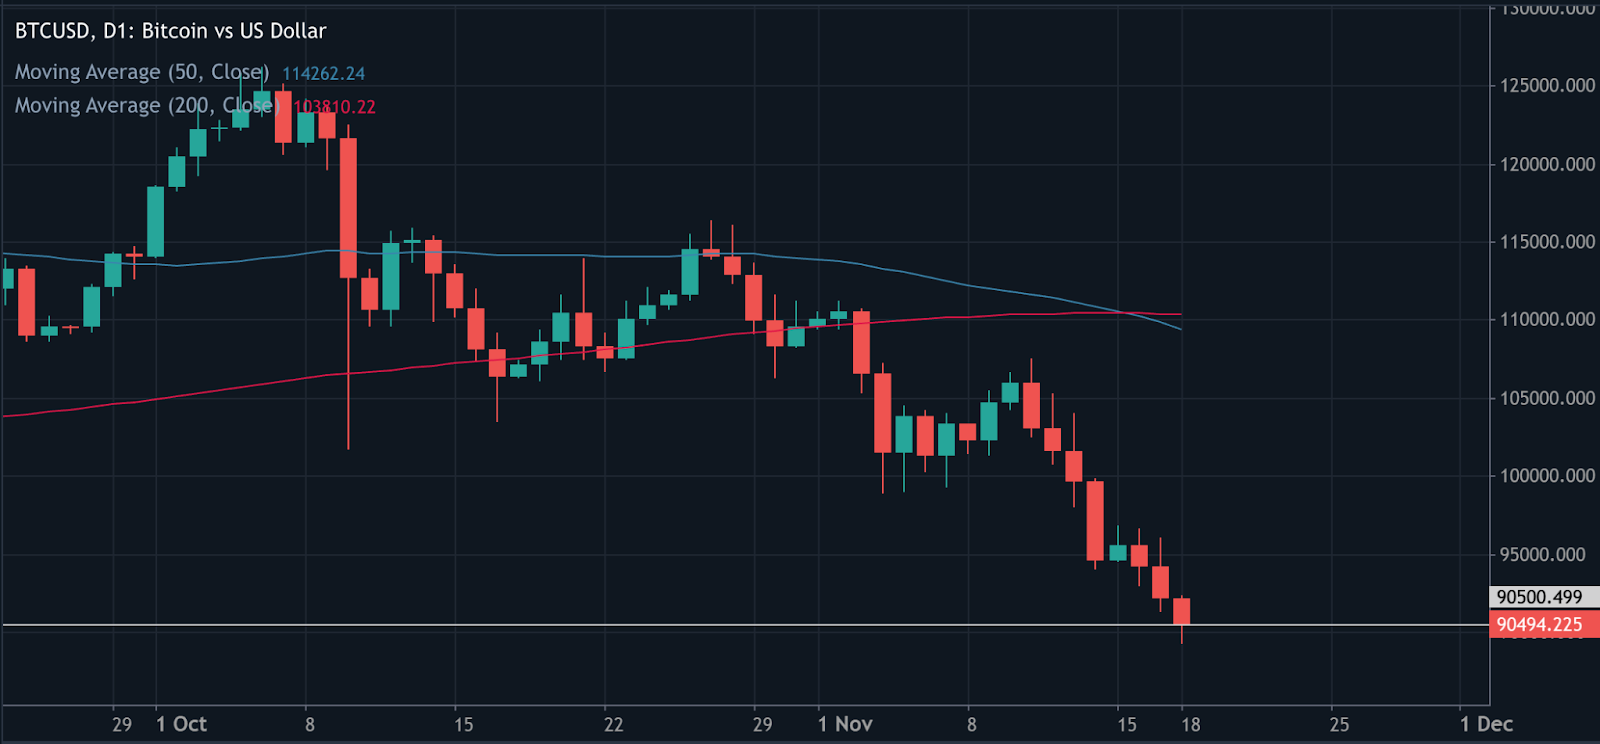
The proximate trigger is technical: Bitcoin fell back through reclaimed support near 93,700 dollars, lost its 200-day moving average, and then registered a death cross as the 50-day slipped beneath the 200-day.
On its own the signal is imperfect, but in weak liquidity regimes it often coincides with multi-week drawdowns as momentum traders de-risk.
Flows add fuel. U.S. spot ETF activity has turned choppy after heavy intake earlier in the year, with trackers showing sequences of outflows or flat prints that blunt marginal demand. When the incremental demand fades, price tends to chase lower liquidity pockets until new buyers emerge. Recent dashboards corroborate the stop-start nature of ETF demand. CoinDesk+1.
The Mt. Gox repayments - a trigger, not the cause
Adding fuel to the fire, over 10,600 BTC (worth roughly $953 million) were transferred from Mt. Gox wallets on 18 November 2025, marking the first such movement in eight months.

The long-running repayment saga, stemming from the 2014 collapse of the world’s then-largest exchange, has left creditors waiting over a decade for compensation.
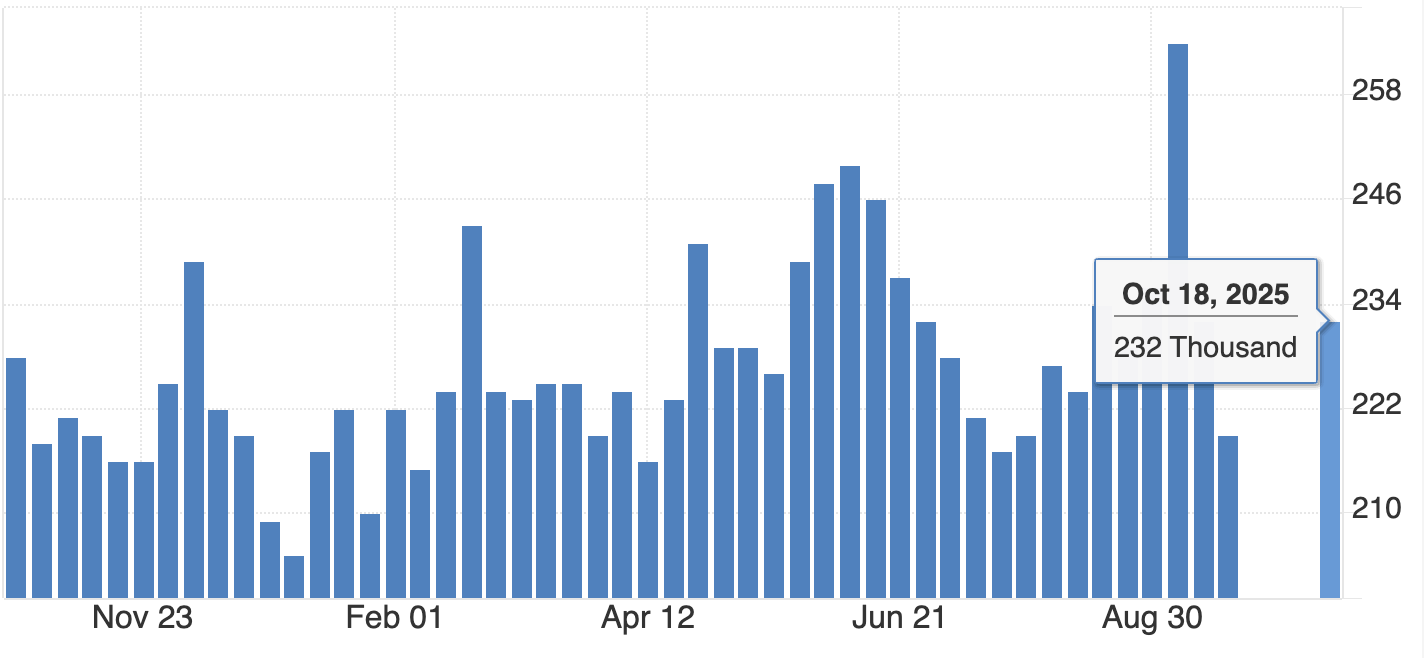
While some feared that repayments could unleash fresh supply, blockchain data shows these movements were administrative, not market sales. Still, perception alone was enough to unsettle sentiment, sparking liquidations and feeding the broader risk-off tone. Analysts now estimate over 230,000 trading accounts were liquidated within 24 hours, totalling more than $1 billion in forced sell orders.
Why this matters
Sentiment has swung hard into fear. CoinDesk flagged “extreme fear” conditions into the weekend and early week, aligning with widely followed gauges that punish downside volatility and negative breadth. In past cycles, similar extremes have marked acceleration phases within larger drawdowns or short-lived exhaustion points.
The macro overlay is not helping. Traders are parsing shifting expectations for U.S. rate cuts and inflation risks tied to policy developments, a mix that reduces risk appetite and tightens crypto liquidity. Reuters’ read-across captures the mood: a near 30 percent retreat from the October peak and growing caution among institutions.
Impact on markets and participants
Price leadership rotated back to bitcoin as traders sold altcoins to manage risk, a pattern visible when social attention and volumes consolidate in the benchmark asset during stress. Ether and other large caps have tracked lower alongside, while crypto-linked equities have generally underperformed on drawdown days, transmitting crypto volatility into listed proxies.
For allocators, ETF prints serve as the cleanest real-time barometer of spot demand. Multi-day flat or negative flows often coincide with fragility in order books and heavier slippage, which is why desks are laser-focused on whether the next sequence turns positive again. If it doesn’t, the unfilled liquidity pocket toward 86,000–88,000 dollars cited by traders continues to be a live risk.
Expert outlook
CoinDesk’s market desk notes that fear spikes of this magnitude have sometimes preceded relief rallies, particularly when realised-loss pressure begins to stabilise and ETF outflows slow. That requires confirmation: a swift reclaim of broken support and evidence of renewed net inflows. Until then, technicals and positioning argue for elevated two-way volatility.
Long-horizon investors continue to point at structural adoption and institutional participation as reasons to stay constructive on multi-year horizons. Dan Tapiero, whose 50T platform backs later-stage crypto companies, frames short-term turbulence as noise against a secular build-out, a view he has reiterated while forecasting a much larger digital-asset economy over the next decade.
Bitcoin price technical insight
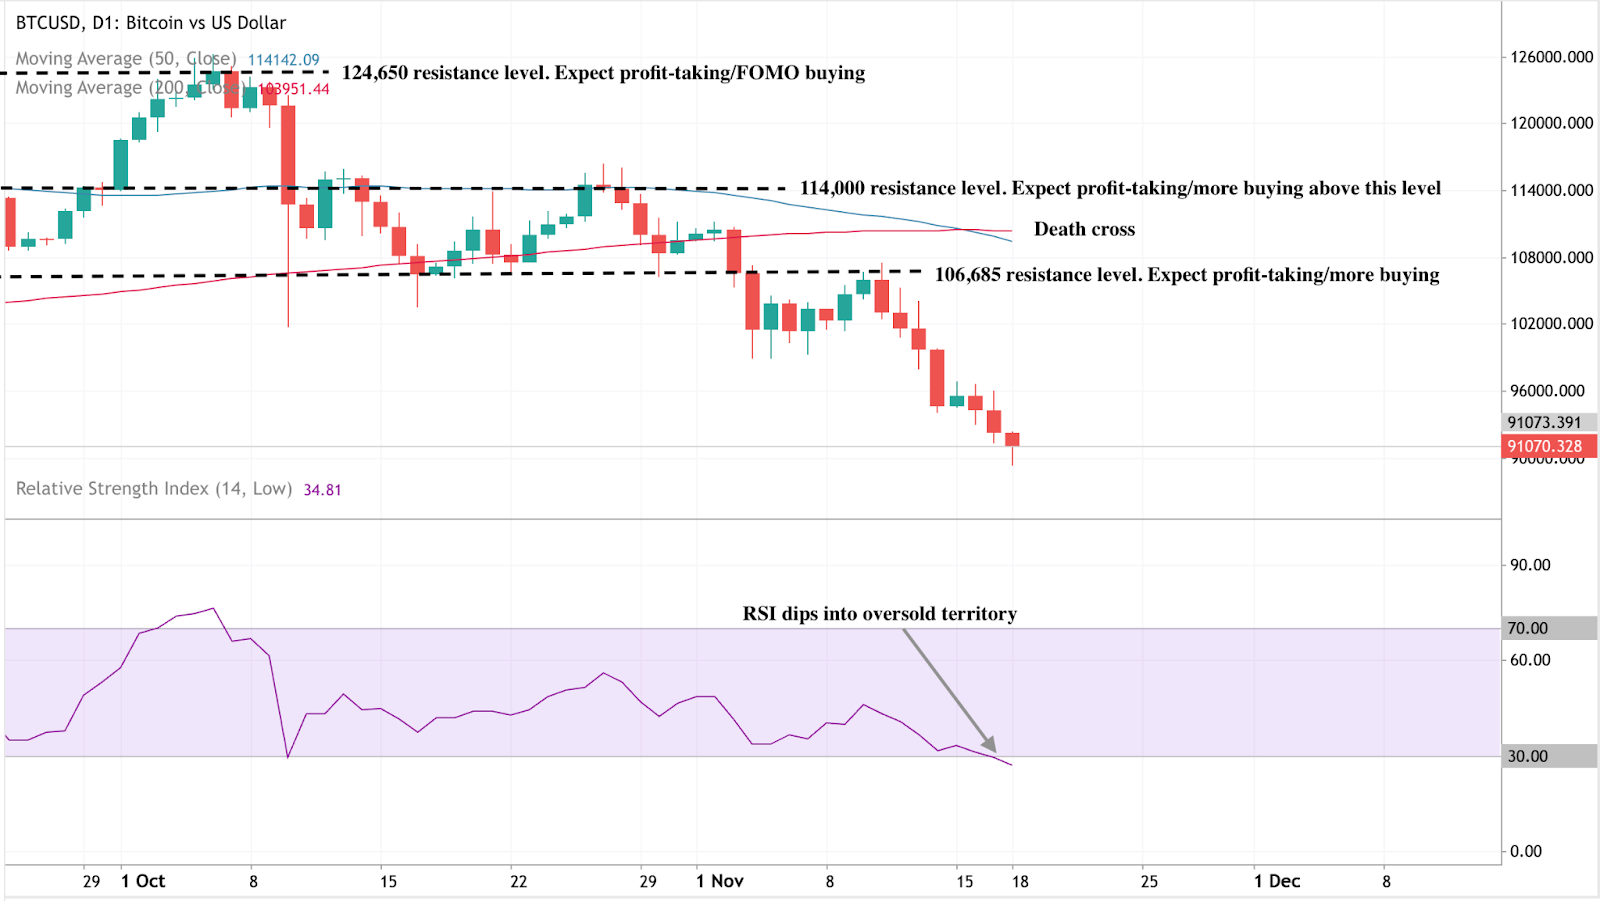
Bitcoin (BTC/USD) continues its downward trajectory after forming a death cross, with the 50-day moving average (MA) crossing below the 200-day MA - a classic bearish signal suggesting extended downside pressure. The price is currently hovering near $91,000, after repeatedly failing to hold above key resistance levels at $106,685, $114,000, and $124,650, where prior rallies saw heavy profit-taking and FOMO-driven buying.
The Relative Strength Index (RSI) has dipped into oversold territory, indicating that selling momentum may be overextended and a short-term technical rebound could occur. However, as long as BTC remains below the 50-day MA, the broader trend remains bearish, with traders likely to view any bounce as a chance to sell into strength.
Key takeaway
Bitcoin’s slide below $90,000 reflects a convergence of technical breakdown, hesitant ETF demand, and a risk-off macro tone. The resulting fear spike is typical of late-stage selloffs, but it needs flow confirmation before calling a durable low. Watch for a quick reclaim of the $ 90,000 - $93,000 zone and a run of positive ETF prints to validate any rebound attempt. Until then, expect elevated volatility and tighter liquidity conditions.

Yen carry trade in reverse: Japan’s yield shift and its impact on USD/JPY
As domestic yields rise, Japanese investors are increasingly repatriating funds from abroad, strengthening the yen and unsettling one of the world’s longest-standing funding trades.
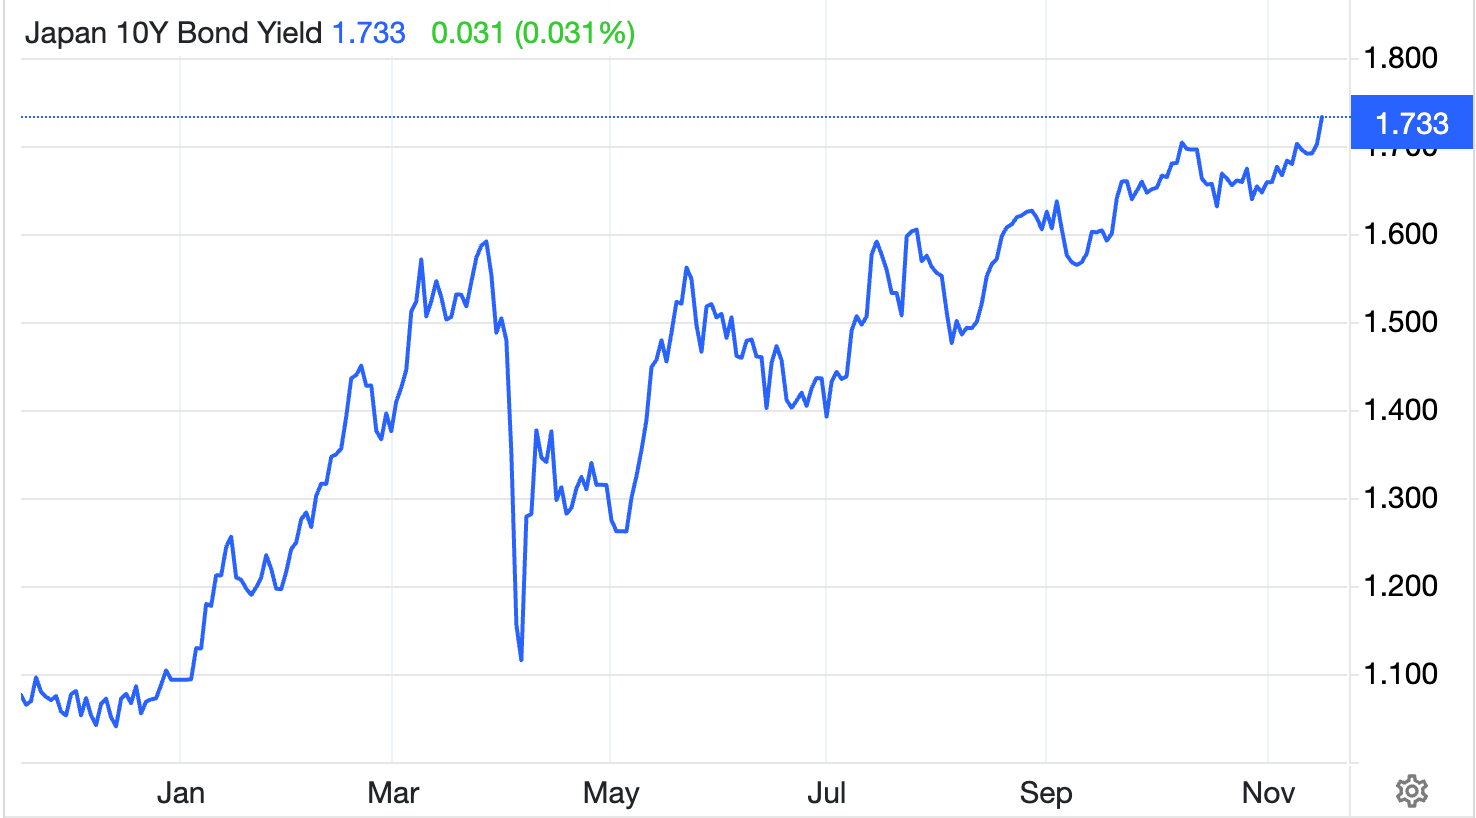
Japan’s bond market is rewriting the rules of the global foreign exchange market. The country’s 10-year government bond (JGB) yield has surged to 1.73% - its highest level since June 2008 - as markets brace for a ¥17 trillion (£88 billion / $110 billion) fiscal stimulus and a further reduction in Bank of Japan (BoJ) bond purchases. The move signals the beginning of a new phase: the yen carry trade in reverse.
As domestic yields rise, Japanese investors are increasingly repatriating funds from abroad, strengthening the yen and unsettling one of the world’s longest-standing funding trades.
The question now dominating markets is clear - will this shift pull USD/JPY back from its multi-decade highs near 156, or force the BoJ and Ministry of Finance (MoF) to intervene once again to stabilise the currency?
Key takeaways
- Japan’s 10-year bond yield has reached 1.73%, the highest since 2008, as markets price in rising inflation, fiscal stimulus, and reduced BoJ support.
- The BoJ’s gradual normalisation - with short-term rates now at 0.5% - is driving a global reassessment of the yen’s funding role.
- A planned ¥17 trillion stimulus aims to offset Japan’s 0.4% GDP contraction in Q3 but risks adding inflationary pressure.
- Rising yields are drawing capital back into Japan, prompting a partial unwinding of the yen carry trade.
- USD/JPY faces key resistance near 155–156, a zone where past interventions have been triggered.
Japan bond yields go up to breach the 1.7 mark
After nearly two decades of near-zero yields, Japan’s bond market is finally moving under its own weight.
The 10-year JGB yield, which stayed below 1% for years due to the BoJ’s Yield Curve Control (YCC), has now broken decisively higher - a sign that investors expect sustained inflation, more fiscal spending, and a lighter BoJ hand in the market.
Several forces have converged:
- The BoJ is tapering bond purchases, reducing artificial demand for JGBs.
- Short-term policy rates have been raised to 0.5%, marking the end of an era of negative rates.
- A massive stimulus plan under Prime Minister Sanae Takaichi is expected to inject over ¥17 trillion into the economy through tax cuts, infrastructure spending, and household support.
Together, these dynamics have pushed bond yields to levels unseen since the global financial crisis, marking what analysts describe as the end of Japan’s “zero-cost money” era.
Higher yields despite Japan’s fragile economy
Despite higher yields, Japan’s economy remains fragile. Data from the Cabinet Office show that GDP contracted by 0.4% in Q3, its first decline in six quarters. Weak residential investment and subdued consumer demand dragged growth lower, even as exports rebounded slightly in September.
BNP Paribas economist Ryutaro Kono noted that while the contraction is not “particularly serious”, it highlights uneven recovery momentum. Still, the forthcoming stimulus package - expected to be approved soon - aims to restore confidence and support households facing rising living costs.
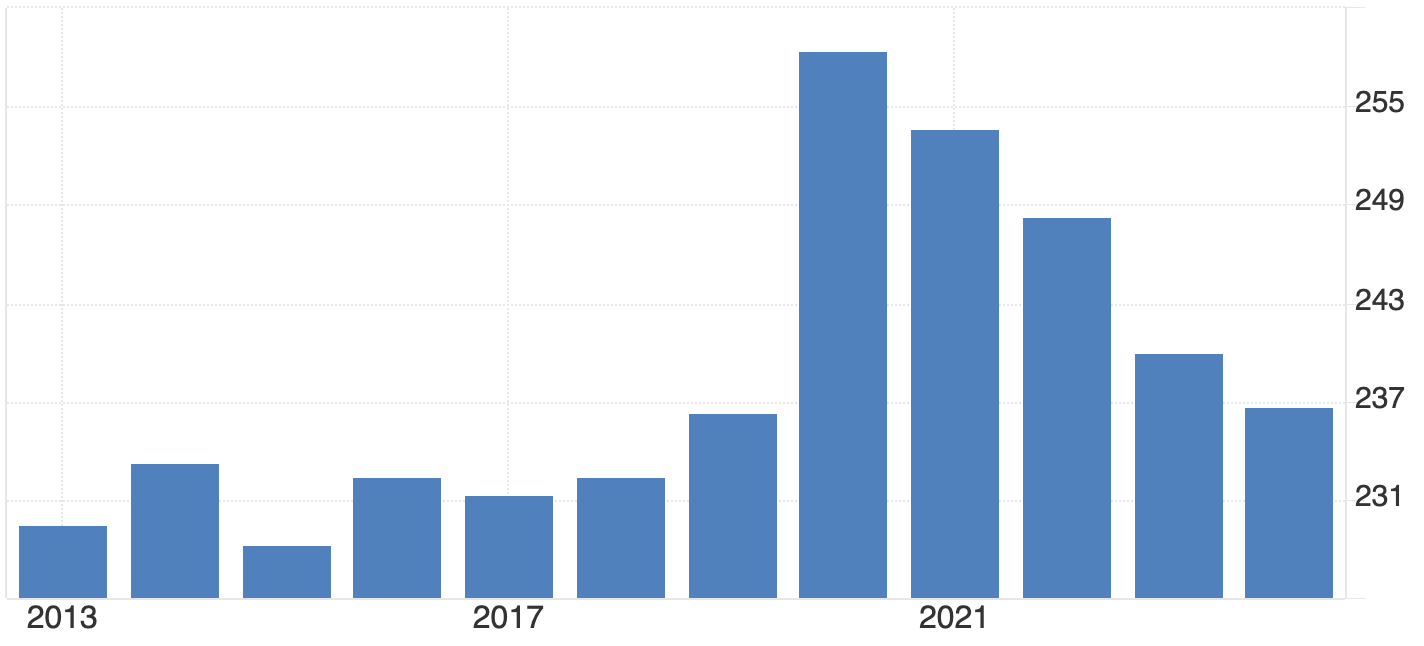
Yet the market reaction suggests scepticism. Investors view fiscal expansion as inflationary and debt-heavy. With Japan’s public debt exceeding 230% of GDP, every new round of spending increases pressure on the bond market - and by extension, the yen.
The mechanics: Why higher yields strengthen the yen
The surge in Japanese yields has immediate foreign exchange implications, particularly for the USD/JPY exchange rate.
1. Repatriation of capital
Japan’s institutional investors - who collectively hold trillions of dollars in foreign bonds - are now finding better returns at home. As domestic yields climb, they begin selling U.S. Treasuries, European debt, and emerging market assets to reinvest in JGBs. This process increases demand for yen, supporting its value against major currencies.
2. Unwinding the carry trade
The yen carry trade - borrowing in low-yielding yen to buy higher-yielding assets abroad - has been a cornerstone of global markets for years. With Japanese rates rising, this trade becomes less profitable. Traders must buy yen to repay loans, triggering powerful short-term rallies.
3. Yield Differentials and Global Comparison
Even with U.S. 10-year yields near 4–5%, Japan’s rapid shift from near-zero to 1.7% is significant. For Japanese investors who once earned nothing on domestic bonds, the new yield environment is competitive enough to slow outflows and boost inflows, tilting currency dynamics in favour of the yen.
Yen policy trade-offs: Growth, debt, and stability
For the BoJ, this shift poses a major challenge. Governor Kazuo Ueda must balance a weak economy, rising inflation, and market volatility. The ¥17 trillion fiscal push could revive domestic demand, but it also risks fueling inflation expectations and adding strain to already high debt levels.
If yields rise too high, the BoJ may need to intervene in bond markets again or issue verbal guidance to temper speculation. Finance Minister Satsuki Katayama has already warned she is “watching FX moves with a sense of urgency”. Historically, such language has preceded yen-supportive interventions, particularly when USD/JPY nears 155–156 - a zone Credit Agricole analysts flag as Tokyo’s soft intervention threshold.
Geopolitics: China tensions and trade headwinds
External risks compound Japan’s policy dilemma. Relations with China have deteriorated following Takaichi’s remarks on Taiwan, prompting mutual travel warnings and raising fears of trade retaliation.
Economists such as Marcel Thieliant at Capital Economics warn that restrictions on rare earth exports or Japanese goods could escalate into a broader trade dispute - one that hurts exporters already under pressure from Chinese electric vehicle competition.
These tensions could trigger safe-haven inflows into the yen, but they also risk weakening Japan’s export engine - another reason why policymakers may resist further currency volatility.
USD/JPY forecast: Scenarios for late 2025
In the near term, a test of 145–148 remains plausible as capital returns home. But if the U.S. Federal Reserve delays rate cuts - keeping U.S. yields high - USD/JPY could stay anchored closer to 150–153.
Either way, the BoJ’s tolerance threshold around 156 is becoming a critical line for traders to watch. Traders can monitor these levels directly on Deriv MT5, which offers live market depth and advanced charting to track yen volatility in real time.
USD/JPY technical analysis

At the time of writing, USD/JPY is trading around 154.72, holding just below a fresh price discovery zone. The RSI sits flat just below the overbought threshold, signalling that bullish momentum remains strong but may be nearing exhaustion if no further upside breakout occurs.
Meanwhile, Bollinger Bands are expanding, indicating an increase in volatility. The price is hugging the upper band, reflecting sustained buying pressure - though such positioning often precedes short-term pullbacks or consolidation phases.
On the downside, immediate support lies at 153.00, with further key levels at 150.00 and 146.45. A break below these levels could trigger sell liquidations or panic selling, especially if sentiment turns against the dollar.
Overall, momentum currently favours the bulls, but with the RSI nearing overbought territory and price extended along the upper Bollinger Band, traders should watch for possible short-term corrections before any continuation higher.
Global ripple effects of yen
Japan’s yield shift is not an isolated story. As the world’s largest creditor nation, any repatriation of Japanese funds can affect global bond markets:
- U.S. Treasuries: Selling pressure from Japanese investors could lift U.S. yields.
- Europe and Australia: Investors may rebalance towards JGBs, driving global yield convergence.
- Emerging markets: Funding costs could rise as yen liquidity tightens.
The implications are profound - the end of Japan’s zero-yield era may gradually unwind two decades of global risk-taking built on cheap yen funding.
Investment and trading implications of yen
For traders, Japan’s bond market is now the most important variable in the yen equation.
- Short-term outlook: Higher JGB yields and repatriation flows could push USD/JPY lower towards 145–148, especially if U.S. yields stabilise.
- Medium-term: Fiscal stimulus and persistent inflation may keep yields elevated but volatile, anchoring USD/JPY near 150–153.
Intervention watch: If the pair nears 156, expect stronger verbal warnings and possible BoJ/MoF coordination.
Samahani, hatukuweza kupata matokeo yoyote yanayofanana na .
Tafuta vidokezo:
- Tafadhali angalia tahajia yako na ujaribu tena
- Jaribu neno lingine