Ergebnisse für

Big Tech liefert die lauteste Berichtswoche des Jahres
An der Wall Street endete die Woche mit der Antwort auf die Frage, die sie sich einen Monat lang gestellt hatte – und sofort stellte sich eine neue Frage.
An der Wall Street endete die Woche mit der Antwort auf die Frage, die sie sich einen Monat lang gestellt hatte – und sofort stellte sich eine neue Frage. Die Quartalszahlen der Mega-Cap-Technologiekonzerne trugen den Markt durch eine Phase voller makroökonomischer Belastungen – ein andauernder Krieg, Ölpreise nahe der jüngsten kriegsbedingten Höchststände und die Federal Reserve, die die Zinsen erneut unverändert ließ – und lieferten genug, um die wichtigsten US-Benchmarks auf neue Rekordstände zu heben. Die offene Frage ist, was als Nächstes kommt, denn der Preis für diese Übertreffungen ist eine Investitionsrechnung, die immer weiter wächst.
Was die Mag 7 tatsächlich geliefert haben
Fünf Mega-Cap-Unternehmen berichteten innerhalb von 48 Stunden, und jedes übertraf die Konsensschätzungen bei der Kennzahl, auf die der Markt am meisten achtete.
Microsoft meldete einen Umsatz im dritten Geschäftsquartal von 82,9 Milliarden US-Dollar gegenüber Erwartungen von etwa 81,3 Milliarden US-Dollar, mit einem Gewinn von 4,27 US-Dollar pro Aktie und einem Umsatzwachstum von 18 %. Azure und andere Cloud-Dienste wuchsen im Jahresvergleich um 40 %, bzw. 39 % bei konstanter Währung, und beschleunigten sich damit gegenüber den Vorquartalen. Das Unternehmen signalisierte zudem, dass die Investitionsausgaben im kommenden Jahr weiter steigen werden, da weiterhin Kapazitäten für die AI-Infrastruktur aufgebaut werden.
Alphabet meldete einen Umsatz von 109,9 Milliarden US-Dollar gegenüber Erwartungen von etwa 107,2 Milliarden US-Dollar, wobei Google Cloud besonders hervorstach. Der Cloud-Umsatz stieg um 63 % auf 20 Milliarden US-Dollar, und das Management verwies auf einen Cloud-Auftragsbestand, der sich nun auf Hunderte Milliarden US-Dollar beläuft. Alphabet erhöhte seine Investitionsausgabenprognose für 2026 auf bis zu 190 Milliarden US-Dollar. Die Umsätze aus der Suche wuchsen im hohen zweistelligen Prozentbereich.
Meta erzielte das schnellste Umsatzwachstum seit 2021, mit einem Umsatz im ersten Quartal von 56,3 Milliarden US-Dollar gegenüber Erwartungen von etwa 55,5 Milliarden US-Dollar, ein Plus von 33 % im Jahresvergleich. Die Dynamik im Werbegeschäft nahm sowohl beim Volumen als auch bei den Preisen zu. Das Management wies darauf hin, dass Internetstörungen im Iran und Zugangsbeschränkungen für WhatsApp die Nutzerzahlen im Quartal belasteten – eine relativ seltene direkte Verbindung zwischen dem Krieg im Nahen Osten und den gemeldeten Fundamentaldaten eines Mega-Cap-Unternehmens.
Amazon meldete einen Umsatz von 181,5 Milliarden US-Dollar gegenüber Erwartungen von etwa 177,3 Milliarden US-Dollar. AWS wuchs um 28 % auf 37,6 Milliarden US-Dollar, das schnellste Wachstum des Segments seit etwa 15 Quartalen. Die Werbeeinnahmen stiegen um 24 % auf rund 17,2 Milliarden US-Dollar.
Apple schloss die Woche ab. Der Umsatz im zweiten Geschäftsquartal von 111,2 Milliarden US-Dollar übertraf den Konsens von etwa 109,7 Milliarden US-Dollar, die Service-Umsätze erreichten mit rund 31 Milliarden US-Dollar einen Rekordwert und die Umsätze in Greater China stiegen um 28 %. Die Aktien stiegen am Freitag um etwa 3 %, was dem Nasdaq zu einem neuen Rekordschlussstand von 25.114 verhalf – dem ersten Schlussstand über 25.000 – und dem breiten US-Benchmark zu einem Rekord von 7.230 verhalf.
Die Investitionsrechnung wächst weiter
Das Muster in der Gruppe war klar: Cloud- und Werbeumsätze beschleunigten sich, AI-Workloads skalierten weiter und die Ausgaben, um dies zu ermöglichen, wurden größer. Alphabets Investitionsausblick von 190 Milliarden US-Dollar für 2026 war das deutlichste Signal, wobei sowohl Microsoft als auch Amazon im Zuge ihrer Ergebnisse auf Rekordinvestitionen in Infrastruktur verwiesen. Die kombinierten Ausgaben der Hyperscaler dürften sich in diesem Jahr auf Hunderte Milliarden US-Dollar belaufen.
Die Märkte belohnten Unternehmen, bei denen die AI-Umsätze sichtbar zu den AI-Ausgaben aufschließen. Wo die Monetarisierung weiter entfernt schien, fielen die Kursreaktionen schärfer aus. Die Asymmetrie, die Händler nun einpreisen, ist eindeutig: Solange Cloud-Buchungen, AI-gebundene Dienste und Werbevolumen die Ausgaben weiterhin absorbieren, können sich die Multiplikatoren der Gruppe weiter ausdehnen. Sollten eine dieser Umsatzquellen nachlassen, während die Investitionsverpflichtungen bestehen bleiben, kehrt sich der operative Hebel, der die Gruppe angetrieben hat, schnell um.
Mit was der Mai beginnt
Der Berichtskalender lässt nicht nach. Palantir, Advanced Micro Devices und Arm Holdings werden nächste Woche berichten und halten das Thema AI-Infrastruktur direkt im Fokus der Händler. Mehrere Strategen meinen, dass diese Namen für die Rotationsfrage wichtiger sind als für die Hauptfrage – nämlich ob die Rallye sich über die größten Hyperscaler hinaus auf Chipdesigner, Softwareplattformen und Infrastrukturanbieter ausdehnen kann, die auf derselben Investitionswelle reiten.
Am Freitag gab es zudem eine neue Öl-Schlagzeile. Der WTI-Ölpreis gab um etwa 2–3 % nach, nachdem Berichte bekannt wurden, dass Iran einen Friedensvorschlag über pakistanische Vermittler unterbreitet habe, obwohl eine zuvor von der US-Regierung angekündigte Seeblockade iranischer Häfen weiterhin besteht und Brent für die Woche hoch blieb. In der kommenden Woche stehen der US-Arbeitsmarktbericht für April, ISM-Produktionsdaten und eine Welle von Reden der Federal Reserve an. Jede davon birgt das Potenzial, die Zinserwartungen zu verschieben, die sich derzeit bei vielen Händlern weitgehend auf ein Halten bis 2027 eingependelt haben.
Für die Mega-Cap-Technologie ist das unmittelbare Hindernis überwunden. Die schwierigere Frage – ob die AI-Monetarisierung mit einer Investitionsrechnung Schritt halten kann, die jedes Quartal größer wird – ist die, die im nächsten Berichtszyklus beantwortet werden muss. Für den Moment hat sich die Gruppe ein weiteres Quartal Vertrauensvorschuss erkauft.

Nasdaq steht vor seiner bisher größten KI-Capex-Bewährungsprobe
Der Nasdaq 100 notiert auf einem neuen Rekordhoch, unmittelbar vor dem konzentriertesten 48-Stunden-Gewinnfenster des Zyklus – und die Frage ist, ob der KI-Infrastruktur-Trade seinem eigenen Erfolg standhalten kann.
Der Nasdaq 100 notiert auf einem neuen Rekordhoch, unmittelbar vor dem konzentriertesten 48-Stunden-Gewinnfenster des Zyklus – und die Frage, die Händler noch nicht beantworten können, ist, ob der KI-Infrastruktur-Trade seinem eigenen Erfolg standhalten kann. Vier Hyperscaler berichten am Mittwoch. Schätzungen der Analysten auf Basis der Unternehmensprognosen setzen deren kombinierte Investitionsausgaben (Capex) für 2026 nun auf etwa 635–665 Milliarden US-Dollar an, gegenüber rund 381 Milliarden im Jahr 2025. Der freie Cashflow bei mehreren von ihnen dürfte dadurch deutlich schrumpfen.
Das ist der Widerspruch, den der Index in Echtzeit einpreisen muss. Die Rallye basiert auf der Annahme, dass KI-Umsätze die Ausgaben letztlich rechtfertigen werden. Das Urteil beginnt in 48 Stunden einzutreffen.
Was der Index einpreist
Der Nasdaq 100 schloss am Montag bei 27.305,68. Der Nasdaq Composite beendete den Tag auf einem Rekordhoch von 24.887,10. Der S&P 500 schloss auf einem Rekordstand von 7.173,91. Der Dow gab um 0,13 % nach.
Hinter diesen scheinbar flachen Bewegungen verbirgt sich eine Positionierung, die alles andere als flach ist. Alphabet, Amazon, Meta und Microsoft haben im laufenden Monat vor den Quartalszahlen jeweils mehr als 10 % zugelegt. Apple hat mehr als 6 % gewonnen. Fünf der Magnificent Seven machen etwa ein Viertel der Marktkapitalisierung des S&P 500 aus, was bedeutet, dass jede Änderung der Prognosen direkt in den breiteren Index einfließt – nicht nur in den Tech-Bereich.
Warum die Capex-Zahl wichtiger ist als der Schlagzeilen-Gewinn
Die Capex-Prognosen der Hyperscaler sind zum meistbeachteten Einzelposten dieses Zyklus geworden. Amazon prognostiziert für 2026 Investitionen von rund 200 Milliarden US-Dollar. Alphabet hat 175–185 Milliarden US-Dollar in Aussicht gestellt. Meta rechnet mit 115–135 Milliarden US-Dollar. Microsoft steuert auf etwa 140–150 Milliarden US-Dollar im Geschäftsjahr 2026 zu.
Die Auswirkungen auf den Cashflow rücken zunehmend in den Fokus. Analysten von Barclays erwarten, dass Metas freier Cashflow 2026 um fast 90 % sinkt. Analysten von Morgan Stanley prognostizieren, dass Amazons freier Cashflow um einen hohen zweistelligen Milliardenbetrag ins Negative dreht, während Analysten der Bank of America ein noch größeres Defizit im Bereich der hohen 20er-Milliarden erwarten. Alphabet führte im November eine Anleiheemission über 25 Milliarden US-Dollar durch und erhöhte damit seine langfristigen Verbindlichkeiten für 2025.
Für Händler bedeutet das, dass allein Gewinnüberraschungen den Index diese Woche möglicherweise nicht bewegen. Entscheidend ist, ob die Kommentare des Managements die Bereitschaft signalisieren, die Ausgabenphase zu pausieren, zu verlangsamen oder zu verlängern – und ob sie Belege für eine Monetarisierung vorlegen können, die eine Fortsetzung rechtfertigt.
Wie diese Woche den Trade verändern könnte
Microsoft, Alphabet, Meta und Amazon berichten alle in einem konzentrierten Zeitfenster zur Wochenmitte, Apple folgt kurz darauf. Die Fed trifft ihre geldpolitische Entscheidung im selben Zeitfenster. Händler preisen nahezu eine 100%ige Wahrscheinlichkeit ein, dass das Ziel für die Federal Funds Rate bei 3,50–3,75 % bleibt, wobei der Fokus darauf liegt, wie Jerome Powell die Inflationsrisiken einschätzt – einschließlich der Auswirkungen höherer Energiepreise.
Damit fallen vier Hyperscaler-Berichte, eine Fed-Entscheidung und ein Powell-Auftritt in eine einzige Handelssitzung. Die implizite Volatilität bei einzelnen Mega-Cap-Werten ist vor den Quartalszahlen tendenziell erhöht, aber das Setup auf Indexebene ist für Nasdaq-100-Händler entscheidend. Da vier Unternehmen, die zusammen einen bedeutenden Anteil am Index ausmachen, nach Börsenschluss berichten, ist das Risiko eines Overnight-Gaps zum Handelsstart am Donnerstag strukturell größer als an einem typischen Earnings-Abend.
Die klarste Indikation für den Index ergibt sich aus dem Cloud-Wachstum und den Capex-Kommentaren. Einige Strategen meinen, dass das Cloud-Umsatzwachstum bei Alphabet und Microsoft entweder beschleunigen oder das aktuelle Tempo halten muss, um die Ausgaben für 2026 zu rechtfertigen. Jedes Signal, dass die Nachfrage nach KI-Workloads die neue Kapazität nicht absorbiert – oder dass die Hyperscaler selbst beim Ausbau vorsichtiger werden – könnte das Multiple, das der Markt zu zahlen bereit ist, neu justieren.
Was der Index verteidigen muss
Technisch handelt der Nasdaq 100 über seinem 200-Tage-Durchschnitt und deutlich über den Tiefs von Anfang April. Das verschafft dem Index ein Polster, bedeutet aber auch, dass eine enttäuschende Reaktion auf die Quartalszahlen mehr Raum für eine Rückkehr zum Mittelwert lässt, bevor eine bedeutende Unterstützung erreicht wird. Die Hochs von Oktober 2025 liegen knapp unter dem aktuellen Niveau und dürften kurzfristig als Referenz für Händler dienen, die nach Anschlusskäufen nach den Berichten am Mittwoch Ausschau halten.
Die Sektorenbreite ist die zweite Variable, die es zu beobachten gilt. Ein Großteil der April-Rallye konzentrierte sich auf denselben Hyperscaler-Komplex, der diese Woche berichtet. Sollten die Ergebnisse eine Rotation statt einer breiten Rallye auslösen, kann der Index stabil bleiben, während sich die interne Führung verschiebt – ein Umstand, den einige Strategen als typischen späten Zykluswechsel und nicht als Top bezeichnen.
Was Händler als Nächstes beobachten
Die Berichte am Mittwoch und die Fed-Entscheidung sind die unmittelbaren Katalysatoren. Apples Ergebnisse am Donnerstag schließen den Mag-7-Zyklus ab. Darüber hinaus achten Händler darauf, ob einer der vier Hyperscaler seine Capex-Spanne für das Gesamtjahr – nach oben oder unten – anpasst und ob die Monetarisierungskommentare die Ausgabenentwicklung bis 2027 stützen. Bis diese Antworten vorliegen, handelt der Nasdaq 100 auf Rekordniveau auf Basis einer These, die nun in Echtzeit auf die Probe gestellt wird.

Die Bitcoin-Rallye steht vor ihrem ersten echten Überzeugungstest
Das ETF-Interesse, das Bitcoin diese Woche wieder über 77.000 $ getragen hat, trifft nun direkt auf die Verkäufer, die es eigentlich absorbieren sollte.
Das ETF-Interesse, das Bitcoin diese Woche wieder über 77.000 $ getragen hat, trifft nun direkt auf die Verkäufer, die es eigentlich absorbieren sollte. Acht aufeinanderfolgende Sitzungen mit Zuflüssen in Spot-ETFs, insgesamt 2,1 Milliarden $, haben Bitcoin etwa 12 % von seinen April-Tiefs nach oben gehoben – und ihn in eine Preiszone gebracht, in der On-Chain-Daten darauf hindeuten, dass kurzfristige Halter historisch eher Gewinne mitgenommen als nachgekauft haben.
Das ist die zentrale Frage dieser Rallye. Nicht, ob die institutionelle Nachfrage zurück ist – das zeigen die Zuflüsse –, sondern ob sie früh genug einsetzt, um die Verteilung zu absorbieren, oder zu spät kommt und so Ausstiegsmöglichkeiten für Trader bietet, die zu niedrigeren Kursen gekauft haben.
Die acht Tage, die das Bild verändert haben
Spot-Bitcoin-ETFs verzeichneten am 23. April einen Nettozufluss von 223 Millionen $, womit die längste Zuflussserie seit der neuntägigen Serie im Oktober 2025 fortgesetzt wurde, die Bitcoin auf sein Allzeithoch von 126.000 $ trug. Die kumulierten Nettozuflüsse seit dem Start liegen nun über 58 Milliarden $, das Gesamtvermögen beträgt etwa 102 Milliarden $ – rund 6,5 % der Marktkapitalisierung von Bitcoin.
BlackRocks IBIT hat das jüngste Interesse dominiert und fast 75 % der Zuflüsse am Donnerstag angezogen. Fidelitys FBTC war der einzige nennenswerte Abfluss. Bitcoin ist während dieser Serie von etwa 68.000 $ auf 77.650 $ gestiegen – eine Bewegung, die die Rückkehr der ETF-Nachfrage nach Wochen uneinheitlicher Dynamik im April nahezu perfekt widerspiegelt.
Diese Konzentration ist bedeutsam. Wenn die Zuflüsse so stark auf ein einziges Vehikel konzentriert sind, ist der marginale Käufer eng gefasst, und jede Verlangsamung aus dieser einen Quelle kann die Stimmung schnell drehen.
Warum Trader auf die Marke von 78.100 $ achten
Glassnode-Daten zeigen, dass Bitcoin seinen True Market Mean bei 78.100 $ zurückerobert hat – die durchschnittlichen Anschaffungskosten des aktiv gehandelten Angebots. Dieses Niveau wurde seit Mitte Januar nicht mehr erreicht und trennt historisch Phasen, in denen kurzfristige Halter auf Verlusten sitzen, von Phasen, in denen sie auf Gewinnen sitzen.
Ein zweiter On-Chain-Cluster liegt nahe 80.100 $, was Glassnode als kurzfristige Haltekostenbasis für diesen Zyklus identifiziert. Analysten haben beide Bereiche als Zonen markiert, in denen frühere Rallyes im Jahr 2026 gedeckelt wurden. Die Implikation: Die nächsten 3–5 % haben überproportionales technisches Gewicht, da sie bestimmen, ob die Gruppe, die Anfang des Jahres über 80.000 $ gekauft hat, wieder auf ihren Einstand zurückkehrt – und ob sie bei Erreichen dieses Niveaus verkauft.
Einige Analysten vermuten, dass das ETF-Interesse eher als Ausstiegsmöglichkeit für kurzfristige Halter dient als als Netto-Neunachfrage. Andere argumentieren, dass das Zuflussprofil strukturell anders aussieht als bei früheren, von Privatanlegern getriebenen Rallyes, wobei die Dominanz von IBIT eine allokatorgetriebene Positionierung widerspiegelt, die weniger auf kurzfristige Kursbewegungen reagiert.
Die Ethereum-Divergenz
Während Bitcoin-ETFs ihre Serie fortsetzten, beendeten Spot-Ethereum-ETFs am 23. April eine zehn Tage andauernde Zuflussserie mit einem Abfluss von 75,9 Millionen $. Ether hat im gleichen Zeitraum schlechter abgeschnitten und ist auf etwa 2.317 $ gefallen, nachdem die asiatische Sitzung noch bei rund 2.375 $ eröffnet wurde.
Die Bitcoin-Dominanz ist wieder auf etwa 60 % gestiegen. Das ist das klarste Signal für Trader, dass Kapital gezielt in BTC und nicht allgemein in Krypto rotiert. Frühere Zyklen zeigten ähnliche Dominanzspitzen sowohl zu Beginn als auch am Ende größerer BTC-Aufwärtsbewegungen, weshalb dieser Wert umstritten und nicht eindeutig richtungsweisend ist.
Optionsverfall und das makroökonomische Umfeld
Nahezu 10 Milliarden $ an BTC- und ETH-Optionskontrakten laufen am 24. April aus, darunter etwa 8,5 Milliarden $ auf BTC und 1,3 Milliarden $ auf ETH. Verfallstermine dieser Größenordnung neigen dazu, die Volatilität bis zum Ereignis zu komprimieren und sie kurz danach freizusetzen, was Tradern einen kurzfristigen Volatilitätsimpuls unabhängig von den fundamentalen Zuflüssen gibt.
Das makroökonomische Umfeld bleibt ungelöst. Die Gespräche zwischen den USA und Iran haben wenig Fortschritte gemacht, der Schiffsverkehr durch die Straße von Hormus ist weiterhin stark gestört, und Öl wird nach einem starken Anstieg nahe 100 $ gehandelt. Die aktuelle Stärke von Bitcoin ist in diesem Kontext ungewöhnlich – Zuflüsse in sichere Häfen sind größtenteils in Gold und den Dollar geflossen, während BTC auf einer Erzählung gekauft wird, die wenig mit Geopolitik zu tun hat. Diese Entkopplung ist entweder ein Zeichen für eine reifere institutionelle Beteiligung oder eine Warnung, dass die ETF-Zuflüsse gegenüber makroökonomischen Risiken, die eigentlich relevant sein sollten, unempfindlich sind.
Worauf Trader als Nächstes achten
Der kurzfristige Test ist, ob Bitcoin klar über 80.100 $ schließen und dieses Niveau halten kann. Ein klarer Ausbruch würde signalisieren, dass die kurzfristigen Halter absorbiert wurden, anstatt zum Verkauf angeregt zu werden. Eine Ablehnung würde darauf hindeuten, dass das ETF-Interesse, so beständig es auch ist, noch nicht groß genug ist, um das Überangebot abzubauen.
Darüber hinaus würde der neunte Tag in Folge mit ETF-Zuflüssen die Serie vom Oktober 2025 einstellen – ein symbolischer Marker, auf den Trader für eine Fortsetzung oder Ermüdung achten werden. Eine Stabilisierung der Ethereum-Zuflüsse oder eine weitere Ausweitung der BTC/ETH-Divergenz könnte bestimmen, ob dies als Bitcoin-spezifisches Ereignis oder als Beginn einer breiteren Krypto-Rotation gewertet wird.
Was die aktuellen Daten noch nicht beantworten können, ist, ob das institutionelle Interesse früh oder spät in diese Bewegung einsetzt – und genau das werden die nächsten Sitzungen einpreisen.

Die Rekordrallye des S&P 500 steht auf schmalen Fundamenten
Der S&P 500 hat sich wieder in Rekordhöhen über 7.100 bewegt, doch der jüngste Anstieg wirkt fragiler, als es der Indexstand vermuten lässt.
Der S&P 500 hat sich wieder in Rekordhöhen über 7.100 bewegt, doch der jüngste Anstieg wirkt fragiler, als es der Indexstand vermuten lässt. Unter der Oberfläche verweisen Strategen auf eine konzentrierte Führungsriege, eine geringe Marktteilnahme und eine starke Abhängigkeit von wechselnden Schlagzeilen aus dem Nahen Osten – alles Faktoren, die den Markt anfällig machen, falls sich die Nachrichtenlage verschlechtert.
Der Leitindex hat sich seit dem Tief Ende März kräftig erholt. Eine große Nachrichtenagentur berichtet, dass er im April fast 9 % zugelegt hat – einer der stärksten Monatsgewinne der letzten Jahre. Eine andere meldet, dass der S&P 500 Ende Januar erstmals die Marke von 7.000 Punkten überschritten hat, angetrieben von der Begeisterung für Aktien aus dem Bereich künstliche Intelligenz, und Mitte April erstmals über 7.000 schloss, nachdem er eine Reihe neuer Allzeithochs erreicht hatte. Der jüngste Anstieg erfolgte, obwohl der anhaltende Krieg unter Beteiligung des Iran zunächst die Ölpreise in die Höhe schnellen ließ und US-Aktien zu Jahresbeginn kurzzeitig in eine Korrektur drängte.
Rückschlag am Wochenende nach erneuten Hormuz-Spannungen
Der jüngste Optimismus wurde am vergangenen Wochenende erschüttert, als die Spannungen zwischen Washington und Teheran rund um die Straße von Hormuz, eine wichtige Route für den weltweiten Öltransport, erneut aufflammten. Laut einem vielzitierten Agenturbericht beschlagnahmten US-Streitkräfte ein unter iranischer Flagge fahrendes Frachtschiff, woraufhin der Iran mit neuen Drohungen reagierte, die das Risiko erneuter Einschränkungen für den Tankerverkehr durch die Wasserstraße erhöhten. Das weckte erneut Sorgen, dass die Straße, die kürzlich wieder für die Handelsschifffahrt geöffnet wurde, erneut gestört werden könnte.
Am Montag, dem 20. April, gaben US-Aktien einen kleinen Teil ihrer Rekordrallye wieder ab. Der S&P 500 fiel um etwa 0,2 % bis 0,3 %, der Nasdaq Composite verlor in ähnlichem Umfang, und der Dow Jones Industrial Average schloss leicht im Minus, da ein Anstieg der Ölpreise und neue geopolitische Unsicherheiten einige Anleger dazu veranlassten, Gewinne mitzunehmen.
Brent-Öl stieg angesichts der neuesten Schlagzeilen deutlich an und kletterte um etwa 5 % bis 6 % auf die mittleren 90 US-Dollar pro Barrel, während auch US-Öl-Benchmarks zulegten. Damit blieben die Preise zwar unter den dreistelligen Höchstständen früherer Störungen, doch die Entwicklung unterstreicht, dass der Energiekanal in Richtung Inflation weiterhin ein aktives Risiko für die Märkte darstellt.
Eine Rekordjagd, getragen von wenigen Giganten
Was Marktexperten beunruhigt, ist nicht der Rücksetzer an einem einzelnen Tag, sondern die Struktur des vorangegangenen Anstiegs. Ein großes Finanzmedium beschreibt die jüngste Rekordrallye als Paradebeispiel für eine „ungeliebte“ Rallye – mit enger Führung, niedrigen Handelsvolumina und verhaltener Anlegerstimmung, obwohl der S&P 500 neue Höchststände erreicht.
Die Analyse zeigt, dass rund 45 % der Erholung seit dem Märztief auf nur fünf Large-Cap-Aktien zurückzuführen sind – ein Hinweis darauf, wie sehr sich der Marktfortschritt auf eine kleine Gruppe von Gewinnern konzentriert. Indikatoren für die Marktbreite zeigen, dass weniger als die Hälfte der S&P 500-Mitglieder über ihren 200-Tage-Durchschnittskursen notieren – ein Profil, das laut den in diesen Berichten zitierten Strategen eher typisch für eine Zwischenerholung in einer Korrektur ist als für den Beginn eines breit angelegten Bullenmarktes.
Der Technologie- und KI-Sektor hat dabei die Hauptlast getragen. Ein Index, der einen Korb der größten US-Technologiewerte abbildet, hat sich seit dem Märztief um rund 20 % erholt und damit einen erheblichen Rückgang vom Höchststand des Vorjahres wettgemacht. Diese Erholung war ein wesentlicher Treiber für den Anstieg des S&P 500 auf neue Höchststände. Innerhalb dieser Gruppe sind einzelne Leitwerte zum Sinnbild der Trendwende geworden und haben sich nach früheren Rückgängen stark erholt.
Analysten warnen, dass die Haltbarkeit der Rallye stark davon abhängt, dass diese wenigen Megacaps weiterhin die Gewinnerwartungen übertreffen und ihre hohen Bewertungen halten können. Sollte einer der führenden Namen ins Straucheln geraten, könnte die mangelnde breite Marktteilnahme die Abwärtsbewegung verstärken.
Gewinne und Bewertungen: Unterstützung mit Vorbehalten
Frühe Signale aus der Berichtssaison zum ersten Quartal haben das Bullen-Szenario gestützt. Große Nachrichtenagenturen berichten, dass die Gewinne der US-Unternehmen in diesem Jahr solide wachsen dürften, wobei Technologie und verwandte Sektoren eine führende Rolle spielen, und dass der bisherige Teil der S&P 500-Unternehmen die Analystenerwartungen größtenteils übertroffen hat. Mehrere große US-Banken haben besser als erwartet abgeschnitten und auf eine robuste Konsumausgaben hingewiesen – trotz monatelang hoher Zinsen und geopolitischer Risiken.
Gleichzeitig deuten Bewertungskennzahlen darauf hin, dass der Spielraum für Enttäuschungen begrenzt ist. Mit dem S&P 500 auf neuen Allzeithochs sind die Kurs-Gewinn-Verhältnisse wieder in Richtung der Höchststände vom Jahresanfang gestiegen, sodass Aktien laut in aktuellen Berichten zitierten Strategen mit einem Aufschlag gegenüber den langfristigen Durchschnitten gehandelt werden. Einige in der Finanzpresse hervorgehobene Analysen weisen zudem darauf hin, dass die Aufwärtskorrekturen der Gewinnerwartungen seit Beginn des Iran-Konflikts auf eine relativ kleine Gruppe von Unternehmen konzentriert waren – und nicht breit über den Index verteilt.
Für Anleger bedeutet diese Kombination – hohe Bewertungen, konzentrierte Gewinnführerschaft und geopolitische Unsicherheit –, dass selbst moderate Enttäuschungen bei Gewinnen oder Ausblicken, insbesondere von großen Technologie- und KI-Werten, eine deutlichere Korrektur auslösen könnten.
Worauf die Märkte als Nächstes achten
Der Verlauf des Konflikts und der Status der Straße von Hormuz bleiben für die kurzfristigen Aussichten risikobehafteter Anlagen zentral. Die jüngste Marktberichterstattung betont, wie sensibel Aktien inzwischen auf jede Wendung in der Hormuz-Geschichte reagieren: Die Wall Street legte zu, als der Iran die Straße wieder öffnete und die Ölpreise fielen, gab aber einen Teil der Gewinne wieder ab, als neue Spannungen das Risiko erneuter Störungen erhöhten.
Wenn die Pattsituation erneut entschärft wird und der Tankerverkehr durch Hormuz weiterläuft, würde das den Druck auf Energiepreise, Inflationserwartungen und die Zentralbankpolitik verringern und den Aktienbullen möglicherweise mehr Spielraum verschaffen. Ein Scheitern der Gespräche oder eine weitere Eskalation hingegen könnte den Ölpreis wieder in Richtung der jüngsten Höchststände treiben und Investoren dazu zwingen, ihre Annahmen zu Wachstum, Gewinnen und Zinspolitik zu überdenken.
Unterdessen werden Indikatoren für die Marktbreite und Führungstrends genau beobachtet. Sollte sich der Anstieg auf mehr als nur eine Handvoll Megacaps ausweiten – mit mehr S&P 500-Mitgliedern, die wichtige Durchschnittswerte zurückerobern, und Sektoren außerhalb der Technologiebranche, die stärker zu den Renditen beitragen –, würde das laut Strategen die Argumente für einen nachhaltigeren Bullenmarkt stärken. Bleiben hingegen neue Höchststände auf schmalen Fundamenten und die geopolitischen Risiken hoch, könnte die Spanne von 7.000 bis 7.100 eher als Decke denn als neuer Boden für den Index fungieren.

Q1 2026 earnings season: What traders are watching
The question traders are navigating is not whether Q1 numbers were good, but whether company guidance can hold up under conditions that no forecast model anticipated three months ago.
The S&P 500 has clawed back to within reach of its pre-war highs. The Nasdaq has posted nine consecutive daily gains. Goldman Sachs just delivered one of its strongest quarters on record. On the surface, Q1 2026 earnings season reads as a story of corporate resilience. The contradiction is that every one of those results landed into a market where oil is trading above $100, headline inflation re-accelerated to 3.3% in March, the Federal Reserve is on hold, and a US naval blockade of Iranian ports was ordered on 13 April. The question traders are navigating is not whether Q1 numbers were good — early indications suggest they were — but whether company guidance can hold up under conditions that no forecast model anticipated three months ago.
US earnings season for Q1 2026 is running on its standard schedule. Banks report first, followed by technology and semiconductors mid-week, then big tech in the final week of April. Here is the reporting cadence traders are tracking:
Financials: What the bank results actually signal
Goldman Sachs opened the season on 13 April with earnings per share of $17.55 against a consensus of $16.47, on revenue of $17.23 billion. Equities trading revenue reached $5.33 billion — a record for the firm — driven by prime brokerage activity and elevated market volatility. Investment banking fees surged 48% year-over-year. By headline metrics, the quarter was strong. Yet the stock fell on the day, a reminder that in this earnings season the beat matters less than the guidance and the macro context it arrives in.
The more consequential bank read comes from JPMorgan Chase, Wells Fargo, and Citigroup, all reporting 14 April. JPMorgan's results carry the most interpretive weight. CEO Jamie Dimon's commentary on consumer health, credit conditions, and the economic outlook functions as a de facto proxy for the Wall Street read on the US economy. On the earnings call, JPMorgan pointed to low‑single‑digit growth in discretionary card spending year-to-date — the consumer is intact, but not accelerating. Options markets were pricing a clearly larger‑than‑usual move in JPMorgan shares into earnings, reflecting the degree of uncertainty around both the results and the macro commentary.
The signal traders should watch beyond the headline beat: loan loss provisions and net interest income guidance for the second half. With the 10-year Treasury yield near 4.30% — above where most bank models assumed rates would be by mid-2026 — net interest margins remain elevated. But if bank CEOs signal deteriorating credit quality or pull NII guidance for H2, it would suggest the weight of persistent inflation and elevated energy costs is beginning to reach the consumer balance sheet.
Technology and semiconductors: The AI capex stress test
TSMC reports Thursday 16 April, and its call is the most consequential single data point of the week for technology traders. The top line is already known — the company disclosed Q1 revenue of $35.71 billion, up 35% year-over-year, beating the top end of its guided range. What the market does not yet know is whether management will maintain, raise, or trim the US$52–56 billion capital expenditure range it has outlined for 2026 — a scale of spending that underpins much of the current AI infrastructure build-out narrative across Nasdaq-listed names.
The underlying concern some strategists have raised is straightforward. Analysts project that the four major US hyperscalers — Microsoft, Alphabet, Amazon, and Meta — could collectively spend around US$635–665 billion on AI infrastructure in 2026, nearly double their estimated 2025 outlays. Several of those forecasts also point to meaningful free cash flow compression as a consequence of that capex surge. If any of them signals a capex pause or reduction when they report in late April, TSMC's demand outlook changes — and so does the valuation case for the Nasdaq 100, which has been trading above its 200-day moving average near 24,400 on the assumption that AI revenue will eventually justify the spend.
Netflix reports the same day, after the US market close. The company has guided to Q1 revenue of roughly US$12.2 billion, about 15% year-over-year growth, with Street forecasts putting operating margins in the high‑20s. The key variable is the ad-supported tier, which some analyst estimates suggest now accounts for roughly 30% of new sign‑ups and could roughly double its revenue contribution over the course of 2026 if current trends hold. If ad revenue momentum shows signs of slowing, it would be an early warning signal ahead of Meta and Alphabet — both heavily dependent on digital advertising — reporting the following week.
Cross-asset context: How earnings interact with the macro environment
Earnings season does not exist in isolation. The multi-asset landscape surrounding it is shaping how results are being interpreted in real time.
The dollar index has pulled back from its 2026 peak but remains above 98, supported by safe-haven demand from the Iran conflict and the rate differential created by the Fed's pause at 3.50–3.75%. A strong earnings season that reinforces US growth outperformance may push the dollar higher — which would apply pressure to commodities priced in USD. Gold has already fallen more than 10% from its January peak in the mid‑US$4,000s per ounce, a counterintuitive move during a geopolitical conflict explained by the inflation channel: oil above US$100 drives real yield expectations higher and strengthens the dollar, both of which work against gold.
The 10-year Treasury yield near 4.30% is the variable with the widest cross-asset reach. If big tech guidance in late April suggests AI revenue is beginning to materialise at scale — validating the capex cycle — it could prompt a reassessment of both growth and inflation expectations simultaneously, pushing yields higher and compressing growth equity valuations. Conversely, if guidance is cautious or withdrawn, the market may begin pricing a sharper growth slowdown, which would support Treasuries and weigh on the dollar.
What remains unresolved
Analysts estimated S&P 500 earnings growth of approximately 13% for Q1 2026 heading into this season. If early beat patterns hold — with roughly 73% of early reporters clearing estimates — some strategists see a path for actual growth to finish closer to the high‑teens, potentially around 19–20%. That would be a meaningful positive for equity sentiment. But strong Q1 numbers do not resolve the Iran conflict, reset oil prices, or clarify the tariff trajectory. Several consumer-facing companies have already signalled difficulty providing reliable forward guidance, citing tariff volatility and energy cost uncertainty. If that pattern spreads to large-cap technology in late April, it would weigh on equity markets regardless of what the Q1 numbers ultimately show.
Tesla on approximately 20 April and the big tech cohort from 28 April will determine whether the current equity rally is justified by fundamentals or running ahead of them.

USD/JPY nähert sich 160, da Ölschock die BOJ in die Falle lockt
Die Blockade von Hormuz hat die Bank of Japan in eine ihrer schwierigsten politischen Zwickmühlen der letzten Zeit gebracht.
Die Blockade von Hormuz hat die Bank of Japan in eine ihrer schwierigsten politischen Zwickmühlen der letzten Zeit gebracht. Derselbe Energieschock, der den Dollar stärkt und USD/JPY in Richtung 160 treibt, heizt auch die Inflation an, die die BOJ zu Zinserhöhungen zwingen könnte – doch eine Straffung inmitten eines Wachstumsschocks birgt eigene Risiken für eine Wirtschaft, die stark von Energieimporten abhängig ist.
USD/JPY wurde am Montag um 159,30 gehandelt, nahe dem oberen Ende seiner 52‑Wochen-Spanne knapp unter der Marke von 160,00. Der Dollar setzte seine jüngsten Gewinne gegenüber einem Währungskorb fort, während Washington Pläne für eine Seeblockade der Straße von Hormuz vorantrieb, was dazu beitrug, den Rohölpreis wieder über 100 Dollar pro Barrel zu treiben und die Nachfrage nach dem Greenback als sicherem Hafen zu erhöhen.
Die Inflationsfalle
Japans Großhandelspreisdaten, die am 10. April veröffentlicht wurden, zeigten das Ausmaß des Problems für die politischen Entscheidungsträger deutlich auf. Der Corporate Goods Price Index stieg im März stärker als erwartet und beschleunigte sich gegenüber dem Tempo im Februar, was anhaltenden Druck auf die Großhandelspreise unterstreicht. Auch die auf Yen basierenden Importpreise stiegen im Vergleich zum Vormonat deutlich an, da höhere Energie-, Metall- und Chemiekosten sich auf die gesamte Wirtschaft ausweiteten.
Die Daten kamen wenige Tage vor der Bestätigung der Blockade. Da Brent nun wieder über 100 Dollar pro Barrel gehandelt wird, erwarten Analysten, dass sich dieser Importkostendruck im April weiter verstärken wird. Japan importiert den Großteil seines Energiebedarfs und verfügt über keine nennenswerte eigene Ölproduktion, wodurch die Wirtschaft besonders anfällig für Lieferunterbrechungen im Persischen Golf ist.
BOJ-Vizegouverneur Ryozo Himino sagte letzten Freitag im Parlament, dass Japan sich nicht in einer Stagflation befinde, warnte jedoch davor, dass ein anhaltender Schock im Nahen Osten, der die Preise steigen und das Wachstum sinken lässt, ein „Dilemma und schwieriges Problem“ darstellen würde. Sollte der Konflikt im Nahen Osten andauern und gleichzeitig die Inflation anheizen und das Wachstum belasten, so sagte er, würde dies „ein Dilemma und schwieriges Problem“ darstellen. Diese vorsichtige Formulierung eines hochrangigen Zentralbankvertreters wurde von den Märkten weithin als Signal gewertet, dass die Sitzung am 27.–28. April weiterhin offen ist.
Wahrscheinlichkeit einer Zinserhöhung und die 60%-Frage
Bis zum 10. April preisten die Märkte bereits eine Wahrscheinlichkeit von etwa 60 % für eine Zinserhöhung der BOJ bei der April-Sitzung ein, noch bevor die jüngste Eskalation der Hormuz-Krise eintrat. Die Rendite der fünfjährigen japanischen Staatsanleihe erreichte am 10. April ein Rekordhoch, was die Erwartung widerspiegelt, dass eine Straffung früher als bisher angenommen erfolgen könnte.
Die BOJ beließ ihren Leitzins bei der Sitzung im März mit 0,75 % bei einer Abstimmung von 8:1. Bereits bei einer früheren Sitzung im Januar hatte Vorstandsmitglied Hajime Takata für eine Anhebung des Leitzinses auf 1,0 % plädiert und damit seinen Wunsch nach einem schnelleren Straffungstempo unterstrichen. Seine Position war bemerkenswert: Schon vor der jüngsten Eskalation war ein BOJ-Mitglied der Ansicht, dass das Risikogleichgewicht ein schnelleres Handeln rechtfertige. In einem aktuellen Interview sagte das ehemalige BOJ-Vorstandsmitglied Seiji Adachi, er halte es für wahrscheinlicher, dass die Zentralbank die Zinsen im April anhebt, sobald ihr umfassendere Inflationsdaten vorliegen.
Japans Handelsminister sagte am 12. April, dass eine BOJ-Politik zur „Stärkung des Yen eine Option sein könnte“, um die Inflation einzudämmen – eine Bemerkung, die von Investoren als Zeichen für eine Lockerung des offiziellen Widerstands gegen eine straffere Geldpolitik als Instrument zur Währungsverteidigung gewertet wurde.
Die 160er-Marke und Interventionsrisiko
Die Marke von 160 hat besonderes Gewicht. Das Währungspaar hat diesen Bereich in früheren Phasen der Yen-Schwäche erreicht, die Interventionen der japanischen Behörden auslösten, wodurch 160,00 als eine Marke gilt, die Händler genau beobachten. Bei 159,30 liegt USD/JPY nahe genug an dieser Zone, dass Händler das Interventionsrisiko in ihre Positionierung einbeziehen.
Analysten großer internationaler Banken warnen, dass anhaltend hohe US–Japan-Renditedifferenzen, negative Realzinsen in Japan und strukturelle Kapitalabflüsse den Aufwärtsdruck auf USD/JPY aufrechterhalten und einen Test des 160er-Bereichs im Zeitverlauf schwer ausschließen lassen könnten. Da der Fed Funds Rate weiterhin deutlich über 3,5 % liegt und die BOJ bei 0,75 % bleibt, ist diese Renditedifferenz eine der größten unter den führenden Volkswirtschaften – ein struktureller Anker, der die Yen-Schwäche aufrechterhält, selbst wenn die BOJ ein oder zwei weitere Zinserhöhungen vornimmt.
Es gibt zudem eine weitere technische Dynamik. Einige Strategen argumentieren, dass Phasen, in denen Brent über 100 Dollar pro Barrel gehandelt wird, tendenziell unterstützend für USD/JPY wirken, da Japan stark auf importierte Energie angewiesen ist. Die Rückkehr des Ölpreises in den dreistelligen Bereich könnte daher kurzfristig als Untergrenze für das Währungspaar fungieren, unabhängig davon, welche Signale die BOJ sendet.
Verbrauchervertrauen und Wachstumsrisiko
Das Argument für Vorsicht bei der BOJ ist nicht unbegründet. Das Verbrauchervertrauen in Japan verschlechterte sich im März laut Regierungsumfrage deutlich und verdeutlicht die Belastung, die höhere Energiekosten für die Haushalte darstellen. Die stark gestiegenen Energiekosten schmälern die Kaufkraft der Haushalte, während die Unternehmensmargen durch steigende Inputkosten unter Druck geraten, die nicht vollständig weitergegeben werden können.
Dies ist das Dilemma in seiner deutlichsten Form. Zinserhöhungen zur Bekämpfung der Inflation und zur Verteidigung des Yen könnten die Kreditkosten für eine ohnehin durch den Energieschock belastete Wirtschaft erhöhen. Bleiben die Zinsen unverändert, könnte die Yen-Schwäche weiter zunehmen, die Importpreise weiter steigen lassen und so die Inflation verstärken, die die BOJ eigentlich eindämmen will.
Worauf Händler achten
Die Sitzung am 27.–28. April ist der wichtigste kurzfristige Auslöser. Die Kommunikation von BOJ-Gouverneur Kazuo Ueda vor der Sitzung wird genau beobachtet – Analysten ziehen Parallelen zu den Hinweisen, die er im Dezember vor der letzten Zinserhöhung gab. Jedes Signal der BOJ-Absicht, in welche Richtung auch immer, könnte USD/JPY deutlich bewegen.
Über die Sitzung hinaus ist der Verlauf des Konflikts direkt entscheidend. Sollte die Blockade bestehen bleiben und Rohöl bis Ende April über 100 Dollar bleiben, könnte der Importpreiskanal die Inflationssorgen der BOJ verstärken und das Argument für ein Handeln stärken. Sollte die Diplomatie zu einem Waffenstillstand führen – wie es während der Gespräche in der vergangenen Woche kurzzeitig möglich schien – könnte sich der Yen rasch erholen, wenn die Nachfrage nach dem Dollar als sicherem Hafen nachlässt und die Ölpreise wieder sinken.
Derzeit notiert USD/JPY auf einem Niveau, bei dem die nächsten 48 Stunden geopolitischer Nachrichten und die nächsten 14 Tage der Zentralbankkommunikation möglicherweise entscheidender sind als jede einzelne Datenveröffentlichung.

Gold steigt, da Waffenruhe die Bullen-These neu gestaltet
Die Goldpreise sind nach der Vereinbarung einer zweiwöchigen Waffenruhe zwischen den Vereinigten Staaten und dem Iran auf den höchsten Stand seit fast drei Wochen gestiegen.
Die Goldpreise sind nach der Vereinbarung einer zweiwöchigen Waffenruhe zwischen den Vereinigten Staaten und dem Iran auf den höchsten Stand seit fast drei Wochen gestiegen, obwohl normalerweise zu erwarten wäre, dass die Aussicht auf eine Deeskalation die Nachfrage nach sicheren Häfen abkühlen würde. Der Spotpreis für Gold stieg am Mittwoch um mehr als 2 % und notierte im Bereich der mittleren 4.700 US-Dollar pro Unze, nachdem er zuvor um über 3 % auf den höchsten Stand seit dem 19. März gesprungen war. Auch die US-Gold-Futures für die Lieferung im Juni legten zu.
Die Bewegung folgt auf einen starken Ausverkauf im März, als Gold um rund 10 % fiel, da steigende Ölpreise, anhaltende Inflation und robuste US-Konjunkturdaten die Anleger dazu veranlassten, ihre Erwartungen an Zinssenkungen der Federal Reserve zurückzuschrauben. Höhere Treasury-Renditen und ein stärkerer Dollar belasteten das nicht verzinste Metall, selbst als sich der Konflikt im Iran verschärfte. Die Rallye am Mittwoch deutet darauf hin, dass derzeit Veränderungen im Zins- und Währungsausblick einen größeren Einfluss auf Gold ausüben als bloße Schlagzeilen zu geopolitischen Risiken.
Waffenruhe, Öl und das makroökonomische Umfeld
Die Waffenruhe, die verkündet wurde, nachdem US-Präsident Donald Trump zustimmte, Angriffe für zwei Wochen auszusetzen, während der Iran im Gegenzug die Straße von Hormus wieder für Energiesendungen öffnete, löste eine breite Erholungsrallye an den globalen Märkten aus. Die Ölpreise fielen deutlich, wobei wichtige Benchmarks wieder unter die Marke von 100 US-Dollar rutschten, da Händler das Risiko einer länger anhaltenden Angebotsunterbrechung neu bewerteten. Gleichzeitig gab der US-Dollar von seinen jüngsten Höchstständen nach und die Anleihemärkte zogen an, was den Druck auf die Realrenditen verringerte.
Von großen Medien zitierte Analysten sagen, dass diese Kombination aus schwächerem Dollar, niedrigeren Ölpreisen und nachlassenden kurzfristigen Inflationsängsten das Interesse an Gold wiederbelebt hat, auch wenn die unmittelbare Kriegsprämie nachlässt. Einige weisen zudem darauf hin, dass die fragile Natur der Waffenruhe weiterhin die Nachfrage nach Absicherungen gegen weitere Volatilität stützt.
Zinsen, Inflation und der Ausblick
Für die Fed hat der Schock im Nahen Osten einen ohnehin schon unsicheren Zinskurs weiter verkompliziert. Das am Mittwoch veröffentlichte Protokoll der Zentralbanksitzung im März zeigte, dass die Verantwortlichen weiterhin besorgt sind, dass die Inflation länger über dem Ziel bleiben könnte – unter anderem wegen der früheren Ölpreisanstiege. Während viele Notenbanker weiterhin Spielraum für Zinssenkungen im Zeitverlauf sehen, hoben die Protokolle auch hervor, dass die Option weiterer Straffungen offen gehalten wird, falls der Preisdruck nicht nachlässt.
Händler werden nun auf die bevorstehenden US-Inflationsdaten blicken, um einzuschätzen, ob der jüngste Rückgang der Ölpreise zu einer Entlastung beim Anstieg der Verbraucherpreise führt. Ein stärker als erwarteter Wert würde das Narrativ von länger anhaltend hohen Zinsen untermauern – ein Umfeld, das Goldrallyes tendenziell begrenzt, da es die Renditen und den Dollar steigen lässt. Schwächere Daten hingegen könnten die Sichtweise stützen, dass die Fed ihre Geldpolitik letztlich lockern kann, was für das Edelmetall unterstützender wäre.
Ein fragiles Gleichgewicht
Die Waffenruhe selbst bleibt vorerst temporär und an Bedingungen geknüpft; Verhandlungen sollen später in dieser Woche in Pakistan fortgesetzt werden, wobei alle Seiten erhebliche ungelöste Fragen einräumen. Ein Scheitern der Gespräche, das die Ölpreise erneut steigen lässt oder die Angst vor einer Ausweitung des Konflikts neu entfacht, könnte das Gleichgewicht der Einflussfaktoren für Gold rasch verändern und eine stärkere Nachfrage nach sicheren Häfen zurückbringen – selbst wenn sich die Finanzierungsbedingungen verschärfen.
Derzeit wird Gold von zwei Kräften beeinflusst: einerseits die Erleichterung, die die Energiepreise gesenkt und den Dollar geschwächt hat, andererseits die anhaltende Unsicherheit über den weiteren Verlauf des Konflikts und die Reaktion der Fed auf die hartnäckige Inflation. Wie sich diese Spannung auflöst – durch neue Daten, Zentralbank-Kommunikation oder Entwicklungen vor Ort – wird wahrscheinlich bestimmen, ob die jüngste Erholung den Beginn eines nachhaltigeren Aufwärtstrends markiert oder nur eine Pause in einem weiterhin fragilen Markt darstellt.

Öl zwischen Friedenshoffnungen und Angebotsschock gefangen
Die Ölpreise gaben am 6. April nach, da Investoren einen vorgeschlagenen Plan zur Beendigung der Feindseligkeiten zwischen den Vereinigten Staaten und Iran gegen anhaltende Risiken für die Versorgung durch die Straße von Hormus abwogen.
Die Ölpreise gaben am 6. April nach, da Investoren einen vorgeschlagenen Plan zur Beendigung der Feindseligkeiten zwischen den Vereinigten Staaten und Iran gegen anhaltende Risiken für die Versorgung durch die Straße von Hormus abwogen. Brent-Rohöl fiel im volatilen Handel auf etwa 107 USD pro Barrel, während U.S. West Texas Intermediate (WTI) sich in Richtung der niedrigen 100er bewegte. Beide Benchmarks liegen weiterhin deutlich über den Niveaus vor dem Konflikt.
Laut Reuters hat Pakistan Washington und Teheran einen zweistufigen Vorschlag unterbreitet. Dieser würde mit einem sofortigen Waffenstillstand und der Wiedereröffnung der Straße von Hormus beginnen, gefolgt von 15 bis 20 Tagen Gesprächen zur Ausarbeitung einer umfassenderen Vereinbarung, die vorläufig als „Islamabad Accord“ bezeichnet wird. Separate Berichte von Axios deuten darauf hin, dass Vermittler auch über einen möglichen 45-tägigen Waffenstillstand sprechen, was die Bandbreite der noch in Betracht gezogenen Ergebnisse unterstreicht.
Eine große Angebotsunterbrechung an einem wichtigen Engpass
Der Konflikt hat die Ströme durch die Straße von Hormus, die normalerweise etwa ein Fünftel des weltweiten Rohöl- und Flüssigerdgasangebots transportiert, stark beeinträchtigt. Die U.S. Energy Information Administration beschreibt sie als den weltweit wichtigsten Öl-Transit-Engpass, der etwa 20 % des globalen Verbrauchs von Erdölflüssigkeiten abwickelt.
Beschränkungen des Verkehrs haben viele Tankerbetreiber gezwungen, Fahrten auszusetzen, was die Exporte der Golfstaaten stark reduziert hat. Während einige Lieferungen weiterhin erfolgen, bleiben die Ströme erheblich eingeschränkt, sodass Versorgungsängste im Mittelpunkt der Marktpreisbildung stehen.
Die jüngsten Preisschwankungen spiegeln diese Unsicherheit wider. Reuters berichtet, dass der U.S.-Rohölpreis zeitweise um mehr als 11 % in einer einzigen Sitzung gestiegen ist, wobei auch Brent in Phasen der Eskalation deutliche Gewinne verzeichnete. Die International Energy Agency hat gewarnt, dass der Konflikt einen außergewöhnlich großen Öl-Angebotsschock ausgelöst hat, wobei sehr große Mengen vorübergehend vom Markt genommen wurden.
Eskaltionsrisiken halten die Märkte in Alarmbereitschaft
U.S.-Präsident Donald Trump hat gewarnt, dass die Vereinigten Staaten die Energieinfrastruktur Irans ins Visier nehmen könnten, falls die Straße nicht wieder geöffnet wird, und zugleich signalisiert, dass eine Einigung weiterhin möglich ist. Laut Reuters prüfen beide Seiten den von Pakistan vermittelten Vorschlag, auch wenn noch keine offizielle Reaktion bestätigt wurde.
Diese Mischung aus diplomatischem Fortschritt und Eskalationsrisiko hält die Ölmärkte hochgradig reaktiv. Die Preise schwanken stark als Reaktion auf Schlagzeilen zu Verhandlungen, Vorschlägen und geopolitischen Spannungen, was unterstreicht, wie sich die Stimmung parallel zu den Entwicklungen vor Ort verändert.
Preisszenarien bleiben breit gefächert
Von Reuters zitierte Analysten gehen davon aus, dass die Ölpreise in den meisten Konfliktszenarien erhöht bleiben könnten. Die Preisbildung am Optionsmarkt deutet darauf hin, dass Brent auf bis zu 150 USD pro Barrel steigen könnte, falls die Störungen anhalten, insbesondere wenn die Schäden an der Infrastruktur zunehmen.
Zugleich könnte ein anhaltender Waffenstillstand und die Wiedereröffnung von Hormus die Preise dämpfen, wenn das Angebot zurückkehrt und der geopolitische Risikoaufschlag nachlässt. Einige Institutionen merken an, dass dies einen Teil der jüngsten Rallye umkehren könnte, abhängig davon, wie schnell sich die Ströme normalisieren.
Die große Bandbreite möglicher Ergebnisse spiegelt das Ausmaß der Unsicherheit wider. Da ein erheblicher Anteil des weltweiten Angebots betroffen ist, balancieren die Märkte zwischen anhaltender Störung und einer ausgehandelten Rückkehr zu stabileren Bedingungen.
Worauf Händler als Nächstes achten
Die Marktstruktur signalisiert weiterhin angespannte Bedingungen. Die Terminstruktur bleibt in starker Backwardation, wobei kurzfristige Kontrakte über länger laufenden gehandelt werden, was auf eine starke Nachfrage nach sofortiger Lieferung hindeutet. Auch die Volatilität ist gestiegen, mit starken täglichen Schwankungen, die durch schnelle Veränderungen der Erwartungen getrieben werden.
Händler konzentrieren sich nun darauf, ob die diplomatischen Bemühungen in einen Waffenstillstand und eine Wiedereröffnung von Hormus münden oder ob die Verhandlungen ins Stocken geraten. Die Aufmerksamkeit richtet sich auch auf die U.S.-Inflationsdaten. Bloomberg berichtet, dass Ökonomen erwarten, dass der Verbraucherpreisindex für März um etwa 1 % gegenüber dem Vormonat steigt, was einen frühen Hinweis darauf geben könnte, wie sich höhere Energiepreise auf die allgemeine Inflation auswirken.
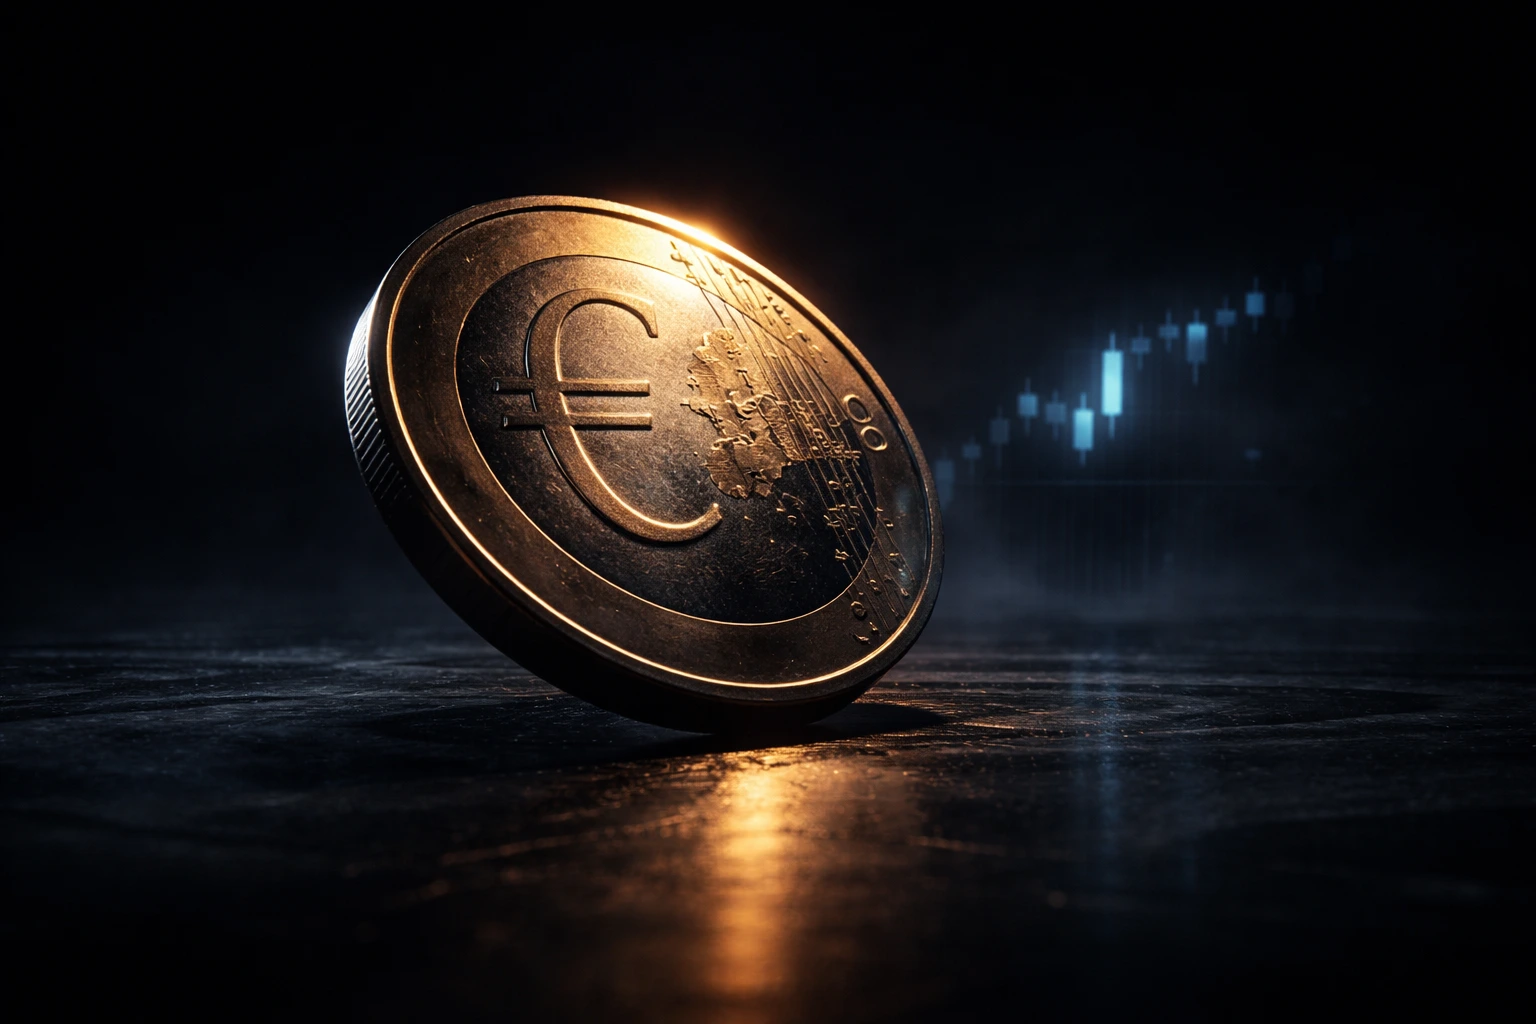
EUR/USD erholt sich, da die Nachfrage nach dem Dollar als sicherer Hafen nachlässt
Der Euro gewinnt an Boden, doch die Frage, die über den Devisenmärkten schwebt, ist, ob dies ein echter Wendepunkt ist oder lediglich eine Erholungsrallye auf fragiler Basis.
Der Euro gewinnt am 1. April an Boden, doch die Frage, die über den Devisenmärkten schwebt, ist, ob dies ein echter Wendepunkt ist oder lediglich eine Erholungsrallye auf fragiler Basis. Ein einziger Bericht – dass Präsident Trump angedeutet hat, die Kampagne gegen Iran könnte früher enden als bisher angenommen – hat Wochen der Nachfrage nach dem Dollar als sicherer Hafen zunichtegemacht, doch die strukturellen Kräfte, die EUR/USD auf ein Drei-Monats-Tief gedrückt haben, bleiben weiterhin bestehen.
Das Währungspaar legte um etwa ein halbes Prozent zu und notierte wieder im mittleren Bereich von 1,15 US-Dollar, womit ein Teil des Rückgangs aus dem März, einem der schlechtesten Monate für den Euro seit fast einem Jahr, wieder wettgemacht wurde.
Ein brutales Quartal für den Euro
Der Euro fiel im März um rund 2,5 % gegenüber dem Dollar – der stärkste monatliche Rückgang seit Juli – und verlor im ersten Quartal fast 2 %, was die schlechteste Quartalsentwicklung seit Q3 2024 darstellt. Dieser Rückgang war fast ausschließlich auf eine einzige Ursache zurückzuführen: Europas akute Verwundbarkeit gegenüber hohen Ölpreisen.
Als US-amerikanische und israelische Angriffe auf Iran Ende Februar einen Anstieg des Brent-Ölpreises auslösten, wurde der Euro zu einer der am stärksten betroffenen Hauptwährungen. Anders als die Vereinigten Staaten, die seit fast einem Jahrzehnt Nettoenergieexporteur sind, ist die Eurozone stark von Rohölimporten abhängig. Jeder Dollar, der dem Ölpreis hinzugefügt wird, wirkt wie eine Steuer auf das europäische Wachstum, und da der Brent-Preis im März meist über 100 US-Dollar pro Barrel lag, reduzierten Händler ihre Euro-Positionen aggressiv. Der Dollar profitierte gleichzeitig von Zuflüssen in sichere Häfen und seiner relativen Unabhängigkeit von Energieunterbrechungen und verzeichnete im Monat einen Anstieg von rund 2,5 % – ebenfalls der beste Wert seit Juli.
Die unmögliche Position der EZB
Die Haltung der Europäischen Zentralbank hat eine weitere Komplexitätsebene hinzugefügt. Die EZB beließ ihren Einlagensatz auf ihrer Sitzung im Februar bei 2,0 % und hielt damit zum fünften Mal in Folge an diesem Wert fest. Die Projektionen im März bestätigten einen datenabhängigen, von Sitzung zu Sitzung gehenden Ansatz. Analysten weisen darauf hin, dass die Projektionen der EZB-Mitarbeiter nur begrenzten Spielraum für eine weitere Euro-Stärke lassen, ohne das Risiko einzugehen, dass die Inflation das 2 %-Ziel unterschreitet, während ein anhaltender Ölpreisschock das Wachstum gleichzeitig schwächen könnte.
Diese stagflationäre Zwickmühle ließ der EZB nur wenig Spielraum. An den Terminmärkten wurde im März zeitweise bereits die Möglichkeit von Zinserhöhungen der EZB ab Juli eingepreist – eine dramatische Kehrtwende gegenüber den zu Jahresbeginn erwarteten Zinssenkungen. Analysten von JPMorgan stellten fest, dass die bisherigen Währungsbewegungen noch nicht das Niveau erreicht hätten, das die EZB als alarmierend betrachten würde, warnten jedoch, dass sich diese Einschätzung bei sich verschlechternden Wachstumsdaten oder einem stärkeren Euro-Rückgang schnell ändern könnte.
Technisches Bild: Eine Erholung aus dem Schaden
Aus technischer Sicht hatte EUR/USD die Unterstützung nahe 1,1505 US-Dollar – ein Tiefstand von über drei Monaten – erreicht, bevor Berichte über eine Deeskalation die aktuelle Erholung auslösten. Die Erholung in Richtung 1,1532–1,1543 hat das Paar näher an den kurzfristigen Widerstand gebracht. Der Dollar-Index, der sich nahe 99,96–100,00 hält, bleibt im Vergleich zu den Vorkriegsniveaus erhöht, was darauf hindeutet, dass der Markt seine Präferenz für den Greenback noch nicht vollständig aufgegeben hat.
Der Yen erholte sich parallel zum Euro, wobei USD/JPY nach den jüngsten Höchstständen im hohen 150er-Bereich zurückging, nachdem japanische Offizielle wiederholt vor spekulativem Yen-Verkauf warnten und andeuteten, die Märkte genau zu beobachten.
Widersprüchliche Signale trüben den Ausblick
Strategen weisen darauf hin, dass das Währungspaar während des Konflikts mit ungewöhnlicher Sensibilität auf die Ölpreise reagiert hat und jede erneute Eskalation die heutigen Gewinne rasch wieder umkehren könnte. Dieses Risiko zeigte sich bereits am 1. April: Hochrangige US-Beamte warnten, dass die nächsten Tage entscheidend sein würden, und drohten mit verstärkten Angriffen, falls Teheran nicht nachgebe – Äußerungen, die am selben Tag wie Berichte über Trumps Bereitschaft zur Beendigung der Operationen veröffentlicht wurden. Iranische Streitkräfte sollen zudem einen Öltanker in den Golfgewässern angegriffen haben – ein Hinweis darauf, dass die physischen Störungen der Schifffahrt nicht nachgelassen haben.
Analysten beschreiben EUR/USD als gefangen zwischen zwei Kräften. Die während des Iran-Konflikts aufgebaute Safe-Haven-Prämie des Dollars beginnt zu schwinden. Doch Europas Abhängigkeit von Energieimporten bedeutet, dass selbst eine teilweise Wiederöffnung der Straße von Hormus möglicherweise nicht ausreicht, um das Vertrauen in das Wachstum der Eurozone vollständig wiederherzustellen.
Worauf Händler als Nächstes achten
Der US-Arbeitsmarktbericht für März, der am 3. April veröffentlicht wird, ist der erste wichtige Indikator dafür, wie der Arbeitsmarkt den Ölpreisschock verkraftet hat. Die für den 10. April geplanten März-CPI-Daten werden zeigen, ob sich die Energiepreise auf die Kerninflation ausgewirkt haben. Die geldpolitische Sitzung der EZB Ende April könnte den Ton des EZB-Rats in Bezug auf Inflationsrisiken verändern und die Richtung für EUR/USD im zweiten Quartal vorgeben.
Abgesehen von den Daten könnte jede Entwicklung im Iran-Konflikt – Fortschritte bei einem Waffenstillstand oder eine erneute Eskalation – der entscheidende Faktor für das Währungspaar sein. Derzeit spiegelt die Erholung des Euro eher Hoffnung als eine Lösung wider. Die Bedingungen, die ihn auf die jüngsten Tiefstände gedrückt haben, haben sich nicht wesentlich verändert. Was sich verändert hat, ist die Erzählung – und an den Devisenmärkten kann das ausreichen, bis es das nicht mehr tut.
Leider konnten wir keine Ergebnisse für finden.
Tipps zur Suche:
- Überprüfe deine Schreibweise und versuche es erneut
- Versuchen Sie ein anderes Schlüsselwort