Matokeo ya”

Gold and silver surge as the debasement trade takes hold
Gold and silver are climbing at a pace that reflects more than a routine haven rally.
Gold and silver are climbing at a pace that reflects more than a routine haven rally. Their surge has become the clearest expression of the so-called debasement trade - a shift by investors who believe political instability, widening fiscal risks, and weakening currencies are chipping away at real purchasing power.
Silver futures have doubled this year, while gold is up more than 60%, signalling how widespread the flight into hard assets has become.
Copper’s record high above $11,400 per tonne adds weight to this shift, but it is gold and silver that best capture the market’s concern that volatile policy choices can distort the value of money itself. Their rise now hinges on a complex mix of supply constraints, tariff tensions, and expectations of easier monetary policy, setting the stage for a pivotal period ahead.
What’s driving gold and silver higher?
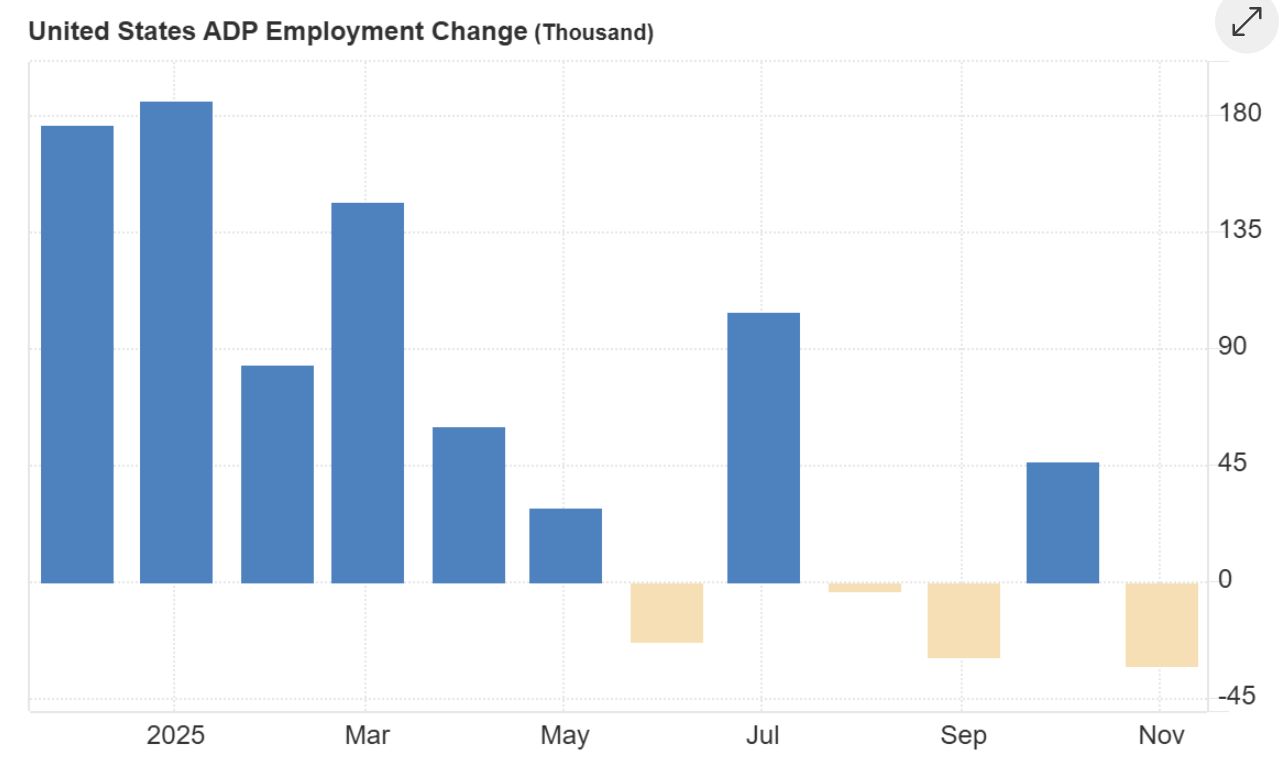
The forces behind the metals rally have intensified in recent months as the economic backdrop weakens. Labour data showing a 32,000 job loss in November - the first negative three-month employment trend since 2020 - has reinforced the sense that the US economy is slowing.
Markets now expect a 25-basis-point rate cut this month, a shift that has pushed the dollar lower and strengthened the appeal of non-yielding assets. Treasury bill yields dipping below the Fed funds rate have added to the impression that policy is turning accommodative again.
Alongside these macro pressures comes a significant structural story, according to analysts. Silver is being driven not by speculative flows but by an extraordinary rise in physical demand, led by India’s imports of around 60 million ounces in October - four times last year’s levels.
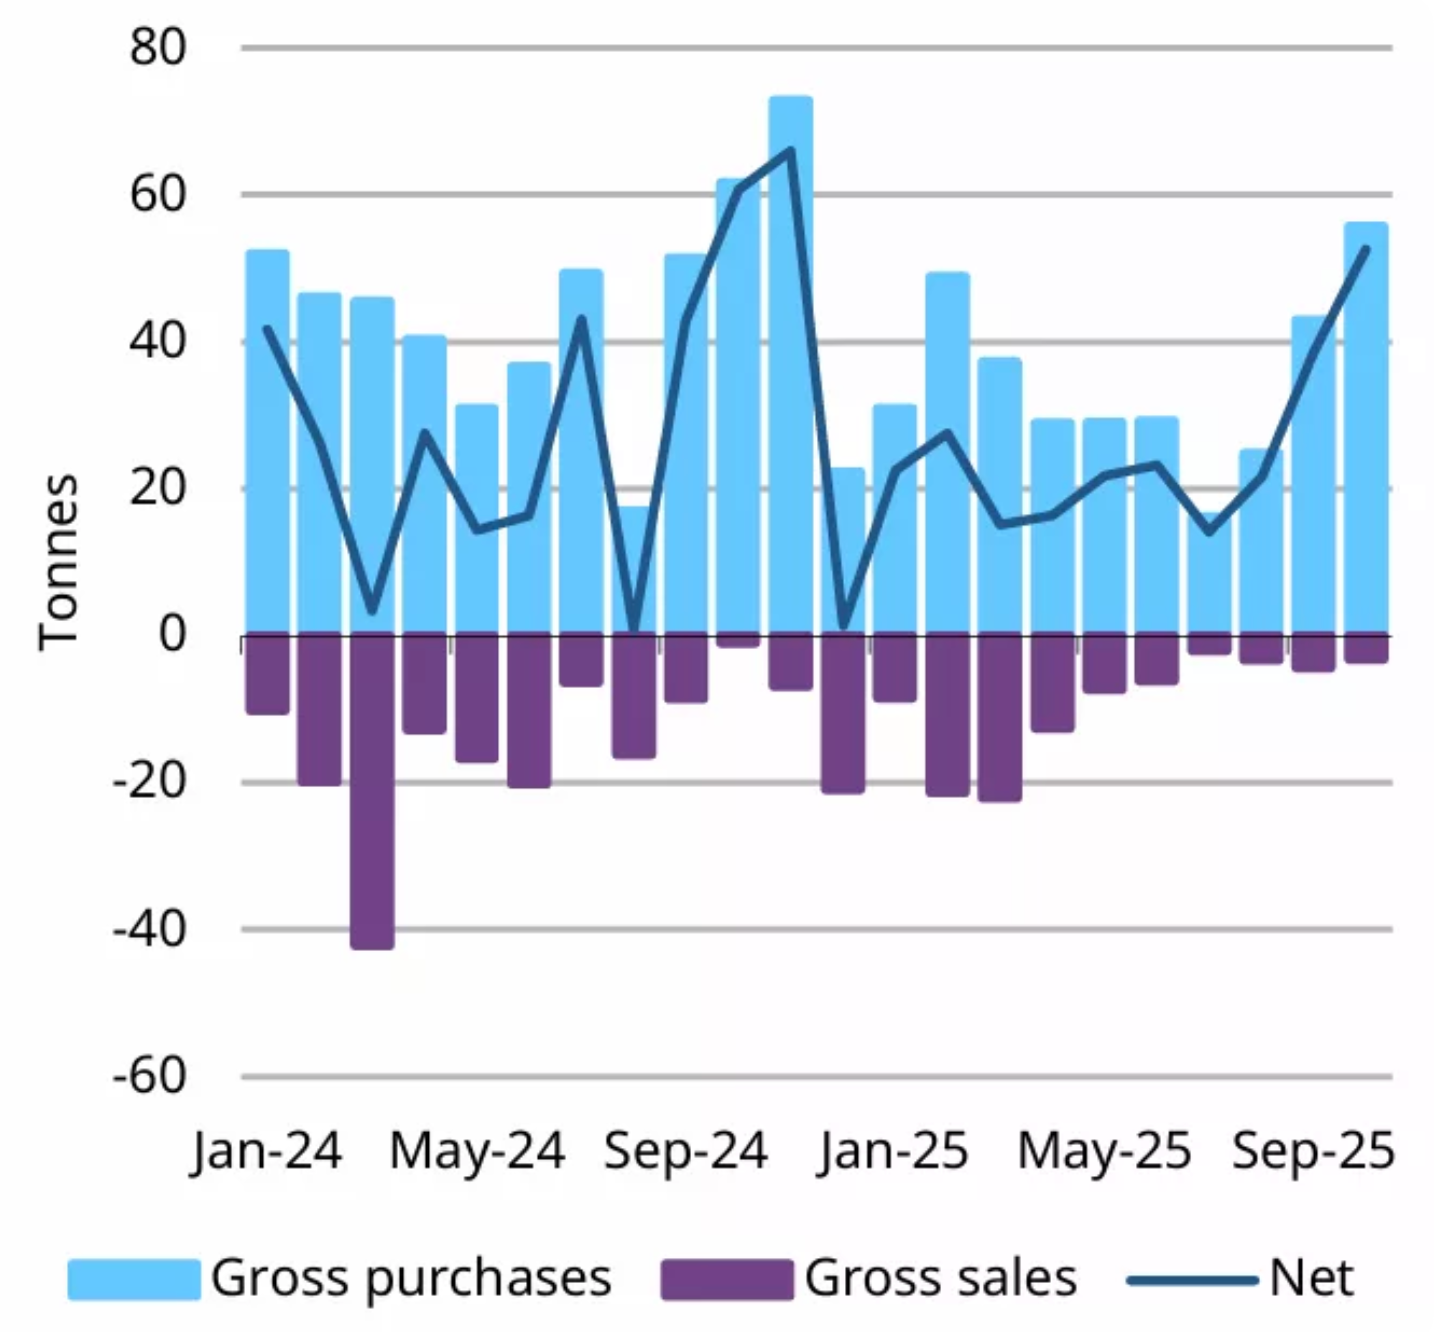
Executives describe this as the first period in decades when the physical market is determining price direction. Gold is experiencing its own structural push, with central banks buying 53 tonnes in October alone as countries such as Poland and Brazil diversify away from the US dollar. Supply constraints in both metals are tightening at the same time that demand is accelerating.
Why it matters
The rally in gold and silver is resonating beyond commodity markets because it reflects a broader erosion of confidence in major currencies. Bloomberg reports that the US dollar has fallen nearly 10% since President Trump took office, while the yen and euro have also weakened.
Investors are increasingly worried that erratic policy choices - from tariffs to budget standoffs - could undermine currency stability. Hard assets, such as gold and silver, have become the preferred hedge against this environment, anchoring portfolios where traditional currency hedges appear insufficient.
Some analysts push back on the narrative of broad debasement, arguing that continued global demand for US government debt contradicts claims of a meaningful shift away from the dollar. As one strategist observed, “If the dollar were truly being rejected, Treasury markets would be the first to show it.” Yet that reassurance has done little to stem renewed interest in metals, largely because they offer protection from policy missteps rather than from economic fundamentals alone.
Impact on markets and investors
The surge in silver is reshaping investor behaviour, with bars and coins increasingly treated as long-term holdings rather than trading assets. In the United States, much of the silver accumulated over the past 15 years has barely returned to the market, creating chronic tightness as industrial demand rises. Manufacturers in the solar, electronics, and automotive sectors are securing multi-year supply contracts to shield themselves from escalating costs and the risk of shortages.
Gold’s ascent is influencing both currency and bond markets as investors adjust to the prospect of lower US interest rates. While stronger jobs data last week lent temporary support to the dollar, most traders believe weakening financial conditions and rising geopolitical risks will sustain interest in gold. Trump’s comments on uncertainty surrounding Ukraine peace talks have reinforced a sense that geopolitical stability remains elusive, further boosting safe-haven flows.
Expert outlook
Most analysts expect gold and silver to remain supported into the early part of next year, though both face short-term sensitivity to inflation data and Treasury yields. Friday’s delayed US PCE report will be a critical test: a hotter reading could strengthen the dollar and temporarily cap gold’s advance. Even so, the broader direction of travel for policy points towards easing, which tends to underpin precious metals.
Silver’s outlook is underpinned by a deepening supply deficit, now in its fifth consecutive year and projected to reach up to 95 million ounces in 2025. Mine development leads times of a decade or more, and limited recycling capacity leaves the market exposed to further squeezes. India’s demand will remain a key variable; any sustained buying at current levels could push the market into even tighter territory. Gold, meanwhile, is expected to benefit from ongoing central-bank accumulation and heightened geopolitical uncertainty.
Key takeaway
Gold and silver are rising on a cocktail of currency anxiety, political instability, and tightening physical supply. The debasement trade - once a fringe idea - is now shaping mainstream asset allocation as investors seek protection from unpredictable policy. Supply deficits in silver and renewed gold accumulation by central banks give the rally deeper foundations than many expected. Inflation data and the Fed’s next move will decide how firmly the trend holds into 2026.
Gold and silver technical insights
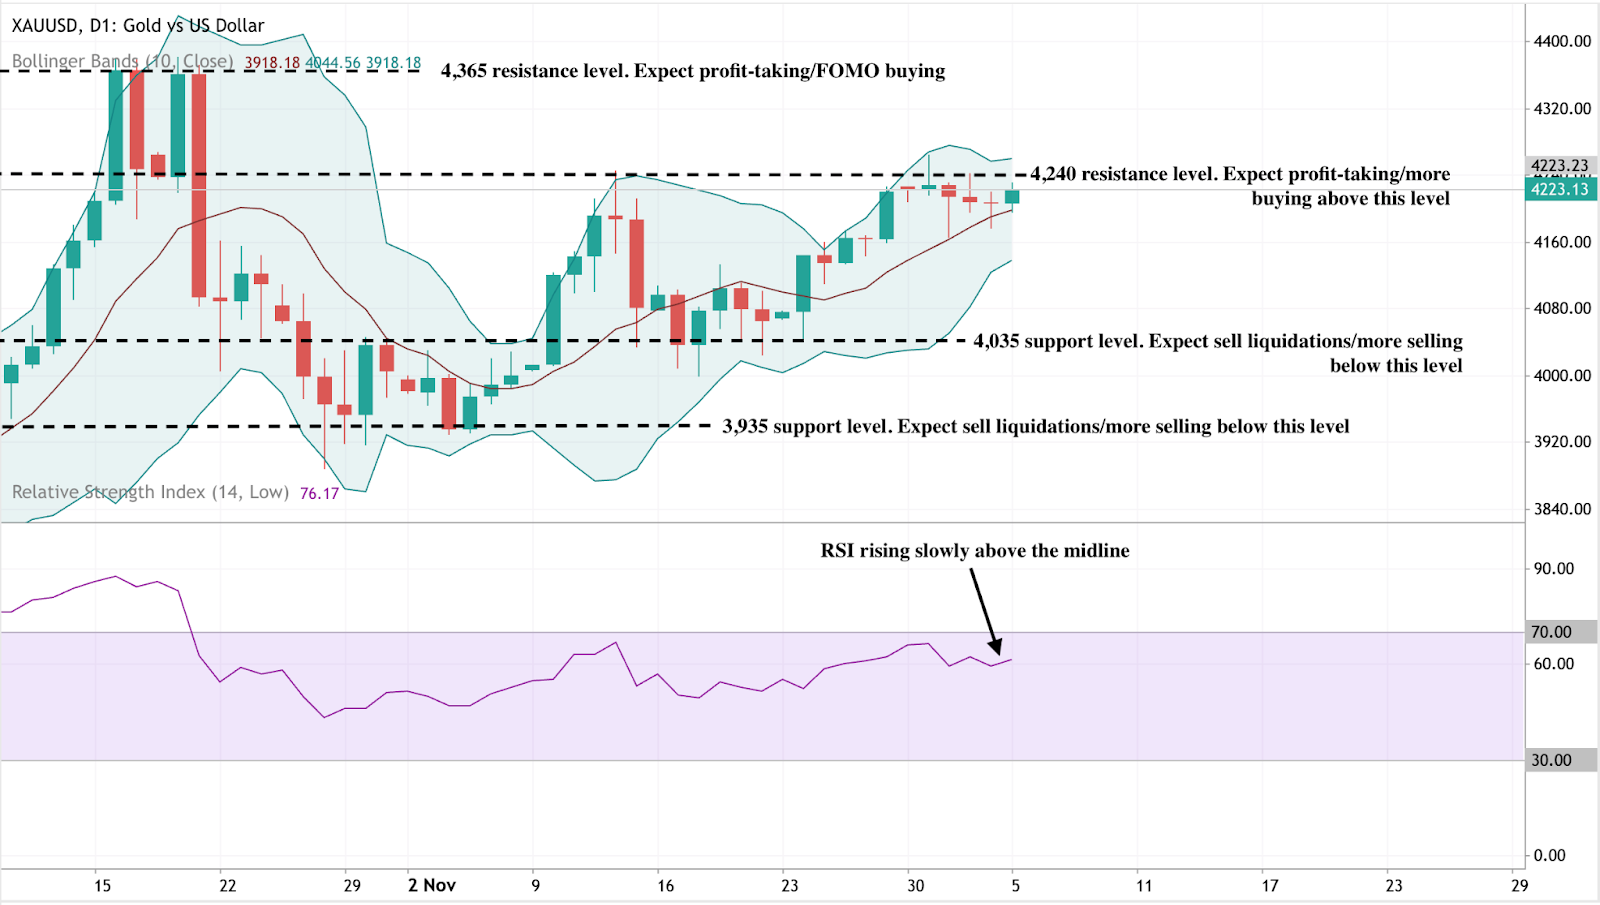
At the start of writing, Gold (XAU/USD) is trading near $4,223, consolidating just beneath the key $4,240 resistance level. This zone, along with the higher $4,365 barrier, is where traders typically anticipate profit-taking or potential FOMO-driven buying if bullish momentum accelerates. On the downside, support sits at $4,035 and $3,935, and a break below either would likely trigger sell liquidations and a deeper corrective phase.
Price action remains constructive overall, with gold continuing to trade within the upper half of its Bollinger Band range - a sign that buyers still maintain control despite slowing upside momentum. The recent tight clustering of candles suggests the market is pausing rather than reversing, awaiting fresh catalysts to spark the next move.
The RSI, now around 76, is rising gradually above the midline, indicating sustained bullish momentum but edging closer to overbought territory. While this supports the ongoing uptrend, it also hints at limited upside unless gold can decisively clear the $4,240 resistance.
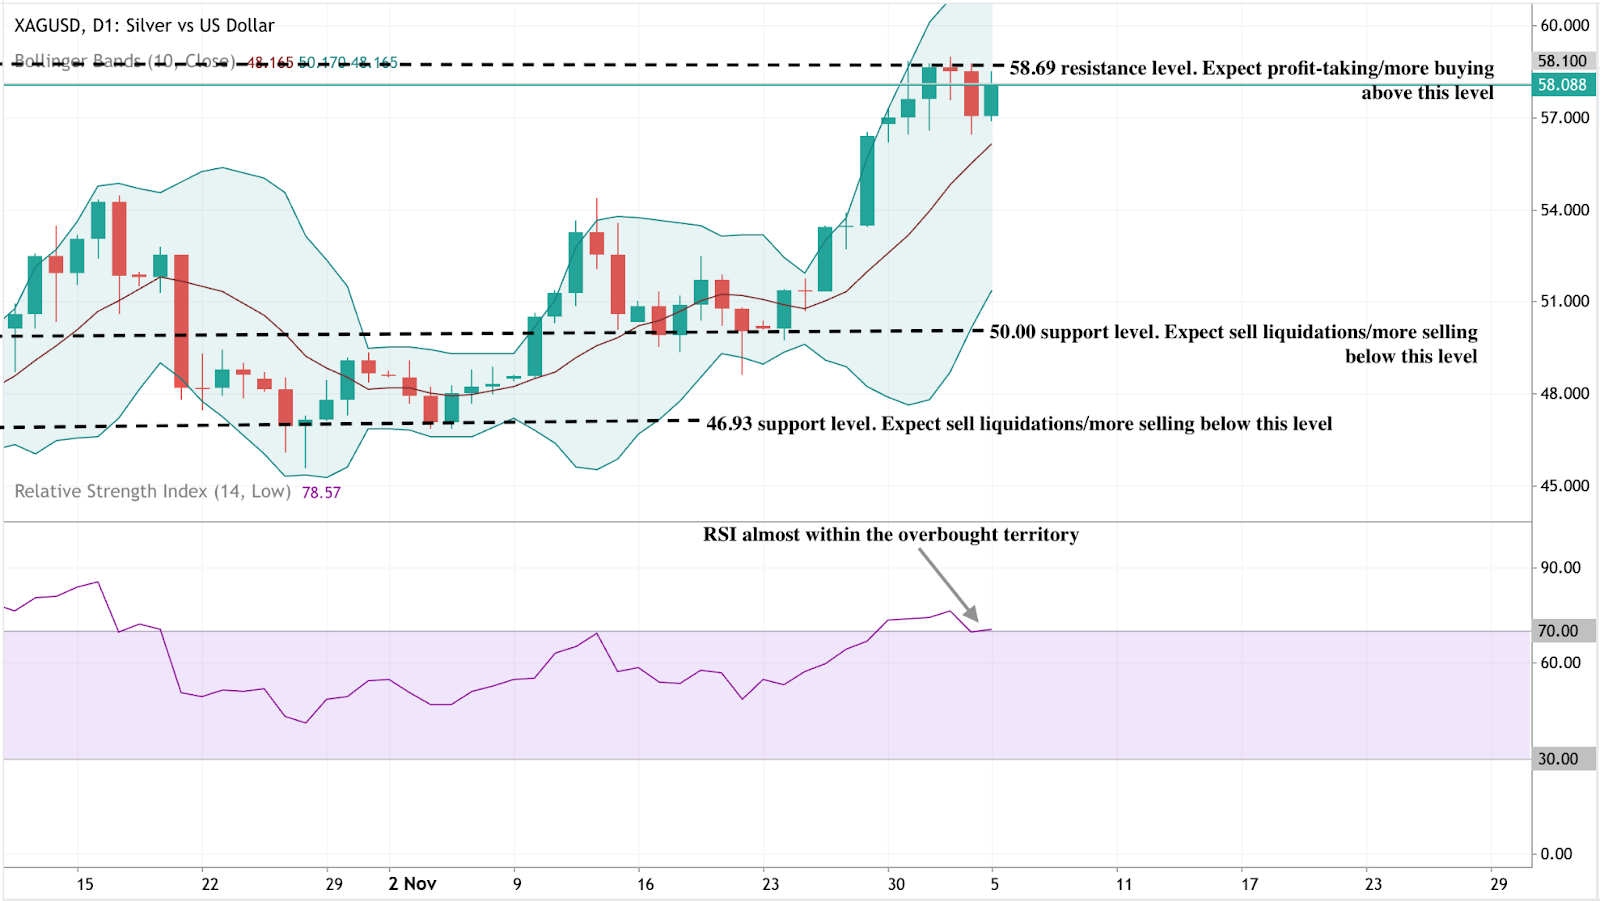
At the start of writing, Silver (XAG/USD) is trading around $58.08, consolidating just below the key $58.69 resistance level. This area often attracts early profit-taking, although a clear break could invite fresh long positioning as momentum traders look to extend the rally. On the downside, support sits at $50.00 and $46.93, and a move beneath either would likely trigger sell liquidations and deepen any corrective swing. Traders using Deriv MT5 may find this range particularly active, as the metal’s elevated volatility continues to create sharper intraday swings.
Price action stays firmly bullish, with silver holding near the upper Bollinger Band following a steep rally. This behaviour underscores persistent buy-side interest even as the market pauses under resistance. With volatility elevated, many traders rely on tools such as the Deriv trading calculator to map margin requirements and calibrate position sizes before entering the next leg of the move.
The RSI is hovering around 78.5, sitting just below overbought territory and highlighting strong yet stretched momentum. That supports the broader uptrend but also hints at possible short-term pullbacks unless silver can break resistance convincingly. A decisive move above $58.69 would likely reset momentum and attract trend followers back into the market.

Gold’s pullback deepens: Will PCE ignite the metal’s next surge?
Gold’s pullback has gathered momentum this week, challenging a market that has rarely paused during its record-setting climb this year.
Gold’s pullback has gathered momentum this week, challenging a market that has rarely paused during its record-setting climb this year. Spot prices slipped to about $4,190 per ounce in Thursday’s Asian session as traders booked profits and shifted into defensive mode ahead of Friday’s delayed PCE release - the inflation gauge the Federal Reserve relies on more than any other.
The tension is clear. Markets now assign a nearly 90% chance of a quarter-point rate cut next week, yet uncertainty surrounding inflation has held back fresh buyers. With real yields easing, the dollar weakening, and central banks quietly amassing gold, the question dominating the market is whether the PCE print will supply the spark required for gold’s next decisive move.
What’s driving gold?
The latest slide reflects a cooling of momentum rather than a shift in the underlying trend. Gold is coming off an extraordinary run, having gained more than 60% year-to-date and broken above $4,000 for the first time only last month.
After such rapid gains, even modest profit-taking can create significant intraday swings, particularly among traders who are reluctant to increase exposure before the Federal Open Market Committee confirms its next policy step.
The ADP employment report, revealing a 32,000 drop in private payrolls - the sharpest fall in more than two and a half years - underscores concerns about a softening labour market and fuels expectations of further easing.

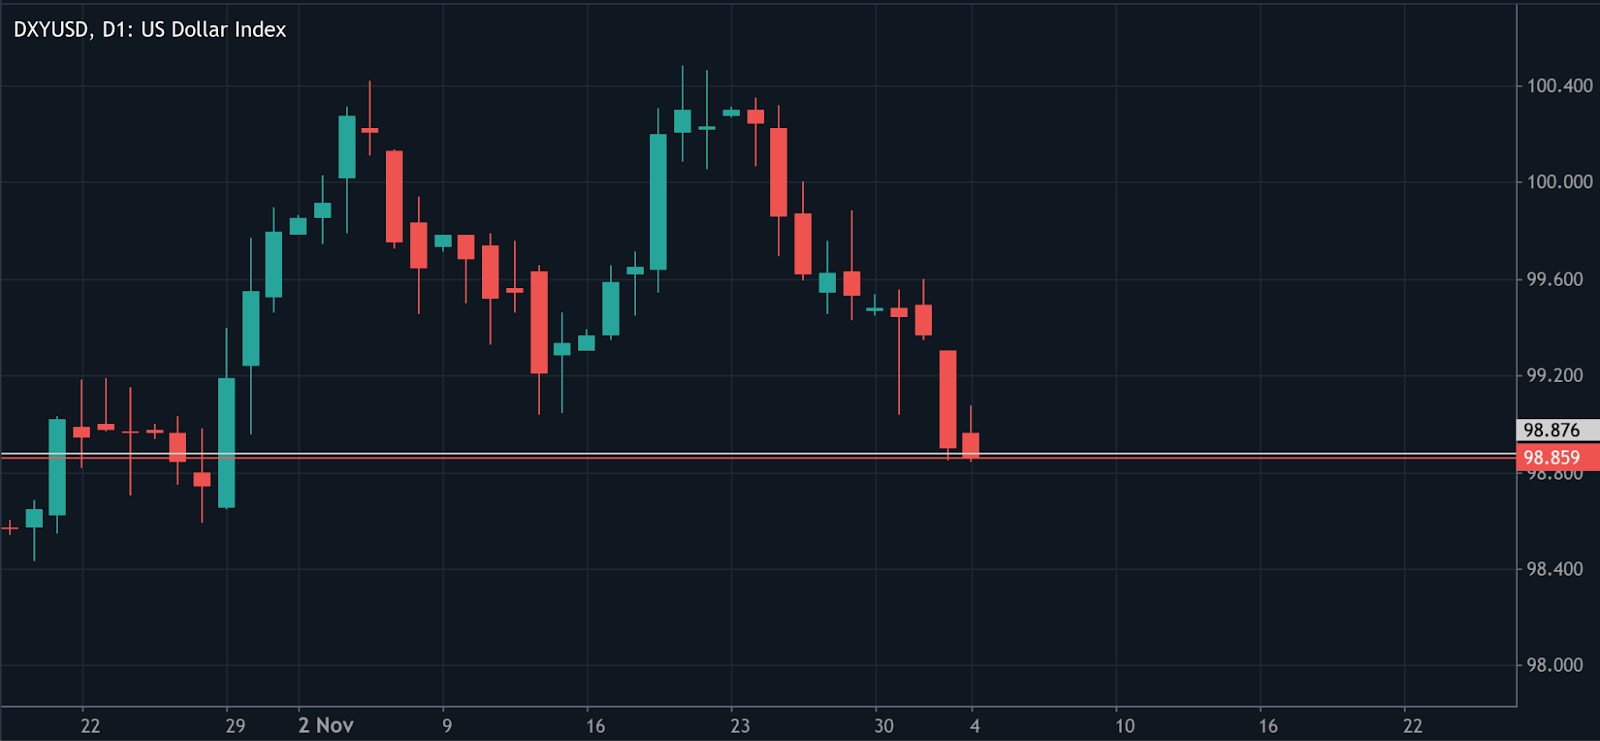
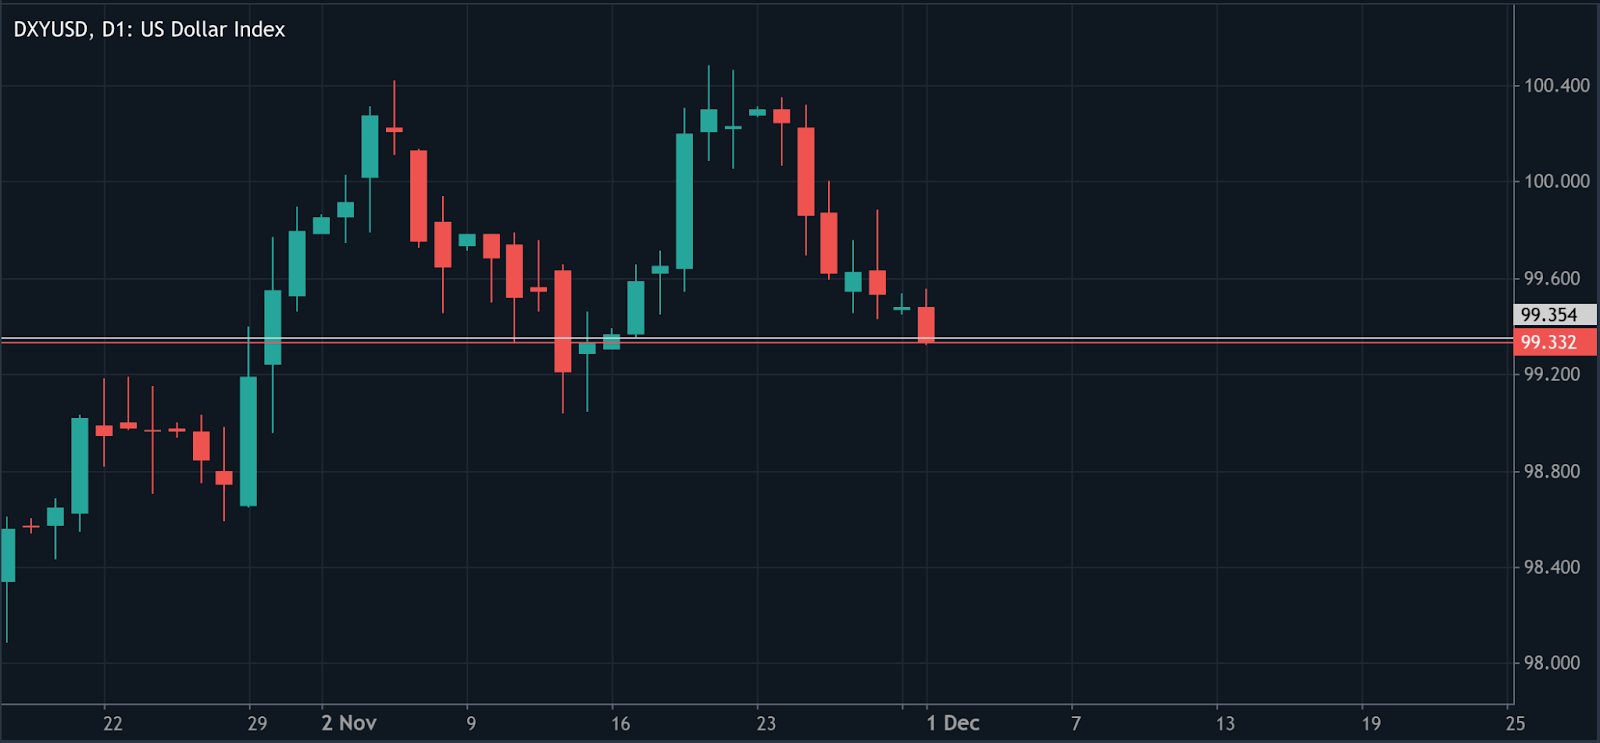
Pressure on the US dollar has added another layer to the story. Rumours that White House adviser Kevin Hassett could replace Jerome Powell pushed the greenback to its weakest level since October, with the Dollar Index sliding to 98.86.
A softer dollar typically supports gold, but the metal’s reaction has been muted as investors await stronger direction from macroeconomic data. Until PCE confirms a sustained cooling of inflation, traders appear unwilling to chase fresh highs.
Why it matters
This pullback is significant because it highlights how closely gold is now tied to monetary policy expectations. Real yields dipped to about 1.83%, down three basis points, offering a natural tailwind for bullion. Yet the reluctance of traders to act shows how sensitive the market has become to even minor shifts in inflation expectations.
ANZ strategist Soni Kumari argued this week that “the market needs a fresh trigger” to extend the rally, and that any slide towards $4,000 would likely attract a new wave of strategic buying.
Gold’s behaviour also reflects deepening investor scepticism about the balance of risks in the US economy. The ISM Services PMI held at 52.6, suggesting pockets of resilience, but slowing orders and weak employment highlight an uneven backdrop.
At the same time, with US fiscal concerns rising and the dollar losing momentum, gold has become a preferred hedge for institutions seeking insulation from policy uncertainty and currency volatility.
Impact on markets and investors
Financial markets are already recalibrating in anticipation of lower rates. Money markets price about an 87% chance of a December cut and nearly 89 basis points of easing by late 2026, implying a Fed Funds Rate of around 2.99%.

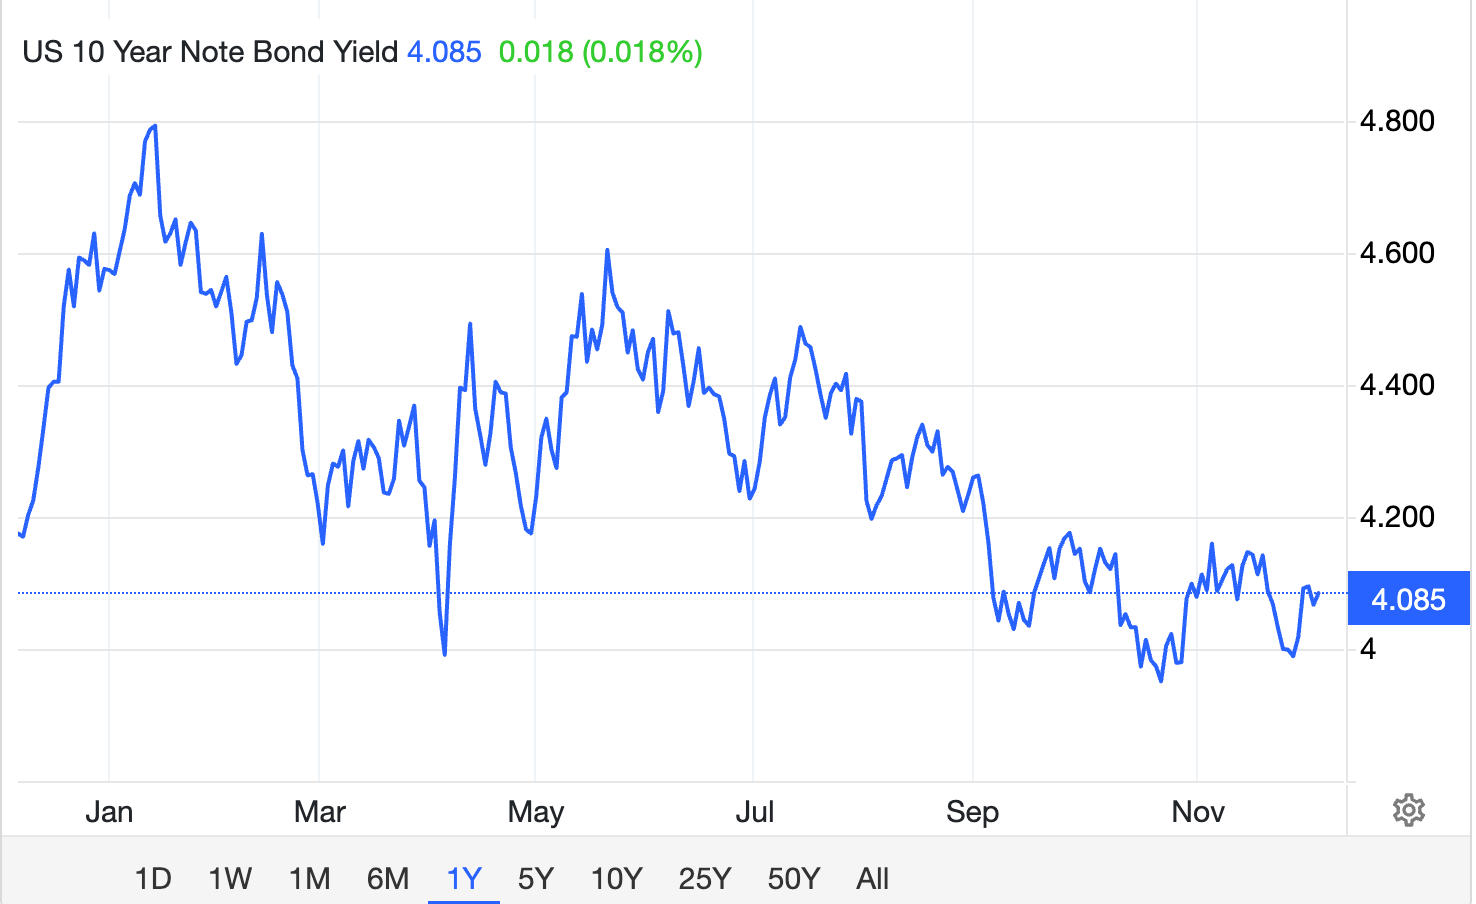
This repricing has dragged the 10-year Treasury yield to roughly 4.06%, reinforcing the appeal of non-yielding assets. Lower real rates reduce the opportunity cost of holding gold and strengthen its role as a core portfolio diversifier.
The impact is equally visible in structural flows. Central banks purchased a net 53 tonnes of gold in October - the strongest month of buying so far in 2025, according to the World Gold Council. Poland’s renewed accumulation led the trend, but the message is broader: reserve managers are diversifying away from dollar-denominated assets at a growing pace. For private investors, this creates a floor under prices during moments of market hesitation.
What makes this moment particularly important is the disconnect between short-term caution and long-term optimism. While traders trim their exposure ahead of the PCE, institutional surveys indicate that nearly 70% of global investors expect gold to rise again next year. This combination of tactical indecision and strategic conviction suggests that any data-driven trigger could set off a renewed push higher.
Expert outlook
Analysts remain broadly constructive on gold’s medium-term trajectory. Goldman Sachs expects gold to reach about $4,900 by the end of 2026, arguing that “sticky purchases”, particularly from central banks, are driving a structural revaluation of the asset. Its recent poll of more than 900 clients found that the largest share - 36% - foresee gold above $5,000 by 2026, with only a small minority expecting a retreat below $4,000.
JPMorgan shares this bullish view, projecting prices around $5,055 in the final quarter of 2026, while Morgan Stanley sees the yellow metal at $4,400 by the end of next year. That said, analysts caution that the path will be uneven. Friday’s PCE release, next week’s FOMC meeting, and jobless claims data will shape the immediate narrative. Markets are looking for confirmation that inflation remains on a slower trajectory; if the data cooperate, gold’s next surge may arrive sooner than expected.
Key takeaway
Gold’s pullback reflects caution rather than a change in its fundamental trajectory. Real yields are easing, the dollar is under pressure, and central banks continue to buy aggressively - all factors that support higher prices. The PCE Index now stands as the pivotal data release, capable of shaping expectations for next week’s Fed decision and determining whether gold’s next surge begins. Traders will be watching closely for confirmation that inflation is cooling and the rate-cut cycle is firmly underway.
Gold technical insights
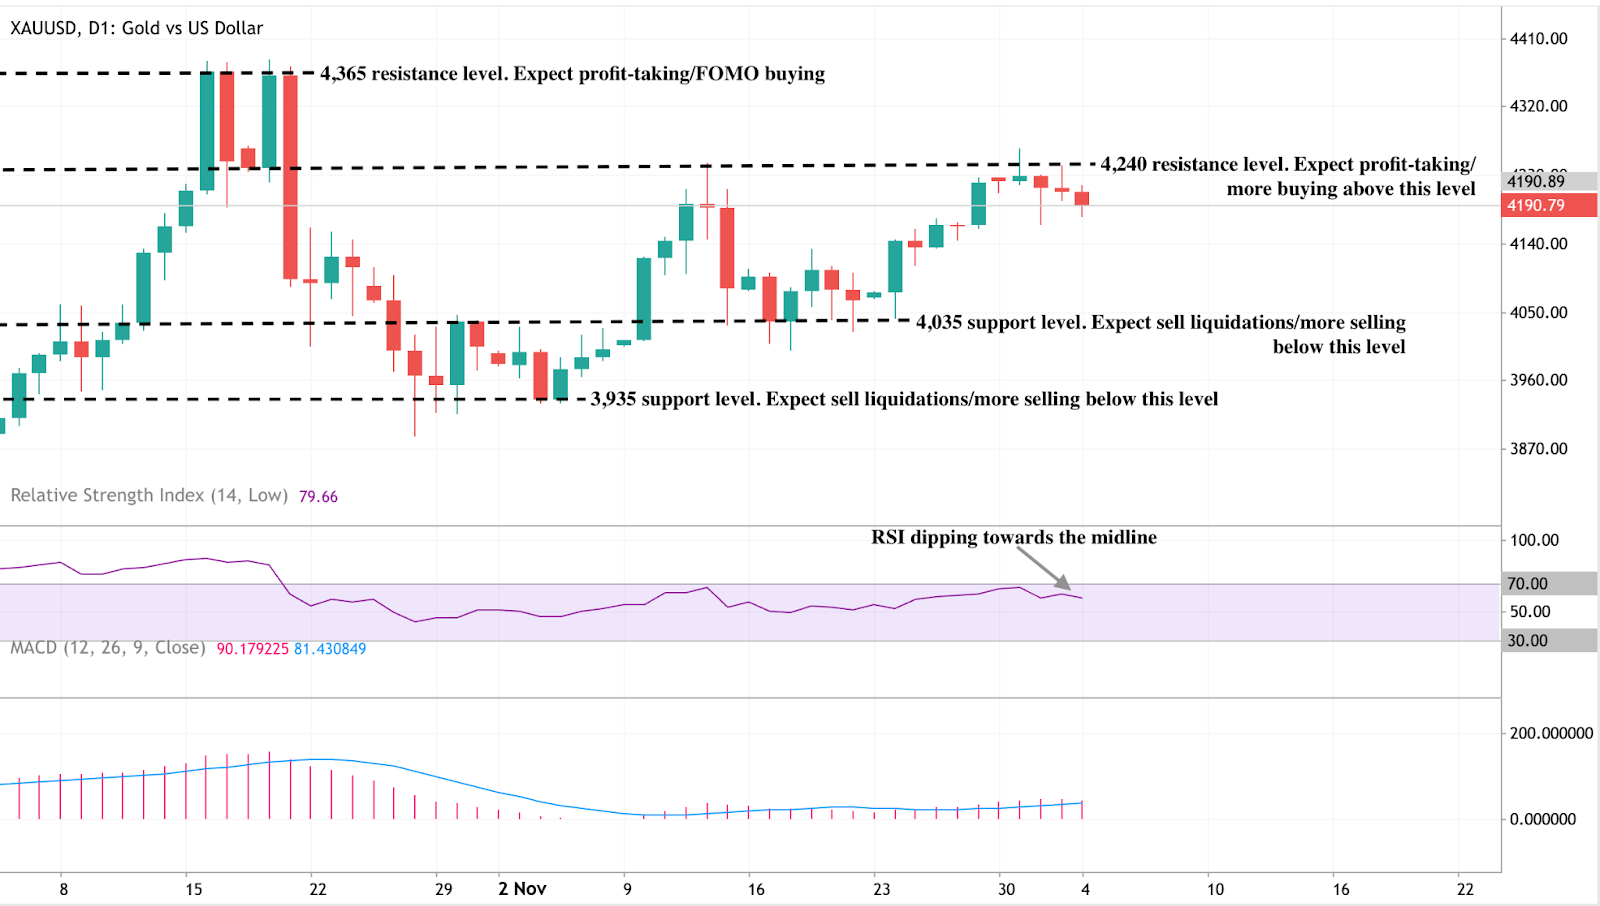
At the start of writing, Gold (XAU/USD) is trading around $4,190, easing slightly after failing to break above the $4,240 resistance level. This zone, along with the higher $4,365 resistance, is where traders typically look for profit-taking or FOMO-driven buying if momentum strengthens. On the downside, the nearest supports sit at $4,035 and $3,935 - with a break below either likely to trigger sell liquidations and deepen the correction.
Price action remains constructive overall, as gold continues to hold above its key support levels despite extended overbought conditions in previous sessions. The slight loss of upside steam suggests the market may be entering a short consolidation phase while waiting for new catalysts such as inflation data or central-bank commentary.
The RSI, previously deep in overbought territory, is now dipping towards the midline near 70, signalling that bullish momentum is cooling but not fully reversing. Meanwhile, the MACD remains positive, though its histogram is gradually flattening - another sign of slowing momentum rather than outright weakness. Overall, gold retains a bullish bias, but upside may be limited unless price can confidently break above $4,240.

Microsoft Copilot ARPU vs Nvidia GPU economics: Who wins the AI upside in 2025?
The battle for AI profitability in 2025 is unfolding along two very different economic frontiers.
The battle for AI profitability in 2025 is unfolding along two very different economic frontiers. Microsoft is increasing average revenue per user by embedding Copilot deeply into its subscription stack, while Nvidia is capturing extraordinary margins from the hardware required to support the AI boom.
Both companies are riding the same wave, yet each extracts value from a different layer of the ecosystem. The question now is whether software monetisation or compute dominance ultimately delivers the stronger upside as enterprise AI spending matures.
Early signals show both models accelerating. Microsoft reported 18% year-on-year revenue growth in its latest quarter, driven partly by Copilot’s integration into Microsoft 365. Nvidia’s reported three-year, 960% share price surge reflects insatiable demand for its Blackwell GPUs and CUDA stack. The next phase of AI adoption will show whether recurring subscription revenue or high-margin infrastructure economics holds the edge, according to market watchers.
ARPU vs GPU economics - The simple breakdown
Understanding the divide between Microsoft and Nvidia starts with a straightforward analogy, many analysts noted: who makes more money during a gold rush-the miners selling shiny nuggets, or the merchants selling the picks and shovels?
Microsoft is effectively selling the “finished” AI experience through Copilot: the productivity boost, the task automation, the chat interfaces that workers interact with every day. Each subscriber adds to Microsoft’s average revenue per user (ARPU), so the economic engine depends on millions of customers paying a bit more each month.
Nvidia is the pick-and-shovel merchant, according to analysts. Every AI model-from chatbots to Copilot itself, runs on GPUs that train, infer and serve billions of queries. The economics are completely different: instead of collecting small monthly fees from users, Nvidia earns large, upfront, high-margin revenue from hyperscalers buying hardware in vast quantities.
When AI adoption accelerates, GPU demand explodes; when budgets tighten, orders pause just as dramatically. Both companies profit from the same AI trend, but one generates revenue each month through subscriptions, while the other earns money when the world needs more computational horsepower.
What’s driving Microsoft Copilot ARPU vs Nvidia GPU economics
Microsoft has repositioned AI as a default layer of productivity, not an optional add-on. Reports showed the company’s decision to fold the £20 Copilot Pro subscription into a £19.99 Microsoft 365 Premium plan drives uptake, reduces churn, and materially increases ARPU. This shift occurs in a market already primed for higher SaaS prices, as sector-wide subscriptions rose 11.4% in 2025, surpassing G7 inflation several times over.
Copilot is becoming the centrepiece of Microsoft’s long-term revenue story, tightly binding AI utility to the daily workflows of its global base. Nvidia’s economics are powered by scarcity and scale. Generative AI has pushed demand for compute to historic highs, and Nvidia sits at the centre with its Blackwell GPU architecture and CUDA ecosystem. Hyperscalers rely on Nvidia for model training and inference, while a new partnership with Palantir pulls the company deeper into enterprise operational workflows.
Experts expressed this marks a shift from being the engine behind AI model development to a full-stack infrastructure provider supporting defence, healthcare, logistics and advanced analytics. Such breadth is expanding Nvidia’s total addressable market well beyond conventional silicon cycles.
Why it matters
Copilot’s monetisation model introduces both growth and fragility, according to analysts. Subscription inflation within the SaaS sector is drawing scrutiny as consumers question whether bundled AI tools consistently deliver meaningful value. Adobe and Google have faced similar scepticism after 16%–33% price adjustments tied to generative features.
One strategist put it bluntly this week: “the market is no longer willing to pay AI premiums without immediate productivity returns”. Microsoft must prove Copilot enhances real-world output at a pace that justifies higher prices.
Reports also revealed that Nvidia operates at a different pressure point. Its revenues are now a barometer for global AI investment, making the stock highly sensitive to any hint of slowing hyperscale demand. That dynamic was evident when rumours surfaced that Microsoft had cut targets for its AI agent products; AI shares from Nvidia to Micron fell sharply before Microsoft clarified the situation. Investors increasingly treat Nvidia as the pulse of enterprise AI budgets, meaning sentiment swings can be swift.
Impact on the industry, markets and consumers
Across the software industry, AI-powered pricing is reshaping economic expectations. By locking Copilot inside core Microsoft 365 bundles, Microsoft has effectively legitimised double-digit subscription increases.
Reported movements of competitors, including Slack, Salesforce, and Adobe showed they are following this path, swapping optional AI upgrades for compulsory rebrands with higher monthly fees. Consumers - especially creatives and SMEs - are pushing back, questioning whether tools like Firefly or Acrobat AI Assistant warrant the rising costs.
Market behaviour has begun reflecting this divide. Value stocks gained momentum when Microsoft’s AI quota scare briefly knocked confidence in high-multiple tech names. Meanwhile, Nvidia’s deepening integration with Palantir signals a strategic widening of compute-driven AI applications, from supply-chain modelling to advanced defence systems. This diversification not only supports GPU demand but bolsters Nvidia’s positioning as the backbone of agentic, real-time AI decision-making.
For consumers, pricing models remain the flashpoint. Subscription fatigue is spreading as AI features, once marketed as optional, become unavoidable. Hybrid structures that mix subscriptions with AI credits offer some relief, yet introduce new complexity and potential unpredictability. The perceived mismatch between cost and practical value is the core risk facing the SaaS sector.
Expert outlook
According to analystrs, two scenarios define the AI profit landscape in 2025. If enterprises adopt AI agents at scale, Microsoft’s ARPU expansion could continue to be a reliable growth engine. With 66% of CEOs reporting operational benefits from Copilot deployments, early productivity returns appear genuine. Yet the backlash against forced bundling means Microsoft must demonstrate sustained value rather than rely on pricing power alone.
Nvidia’s trajectory hinges on hyperscaler spending and competitive pressure. While demand for GPUs remains fierce, rivals such as Google and Amazon are increasing investment in custom AI chips.
Google’s £10 billion TPU partnership with Anthropic signals a meaningful shift toward in-house compute strategies. Even so, Nvidia’s expansion into operational AI through Palantir may insulate the company by embedding its hardware into mission-critical enterprise systems with long replacement cycles.
Investors will track enterprise AI budgets, regulatory commentary on compute intensity and the Federal Reserve’s next steps. These factors will determine whether software ARPU or hardware economics proves more resilient.
Key takeaway
Microsoft and Nvidia represent two dominant pathways to AI profitability: recurring software monetisation and capital-intensive compute economics. Copilot’s ARPU uplift demonstrates how software firms are extracting value through bundling, while Nvidia’s GPU dominance reveals the physical backbone that enables the AI boom. Both face pressure - Microsoft from consumer fatigue, Nvidia from escalating competition and hyperscaler caution. The deciding factor in 2025 will be how quickly enterprises scale AI beyond experimentation and into daily operations.
Microsoft vs Nvidia technical insights
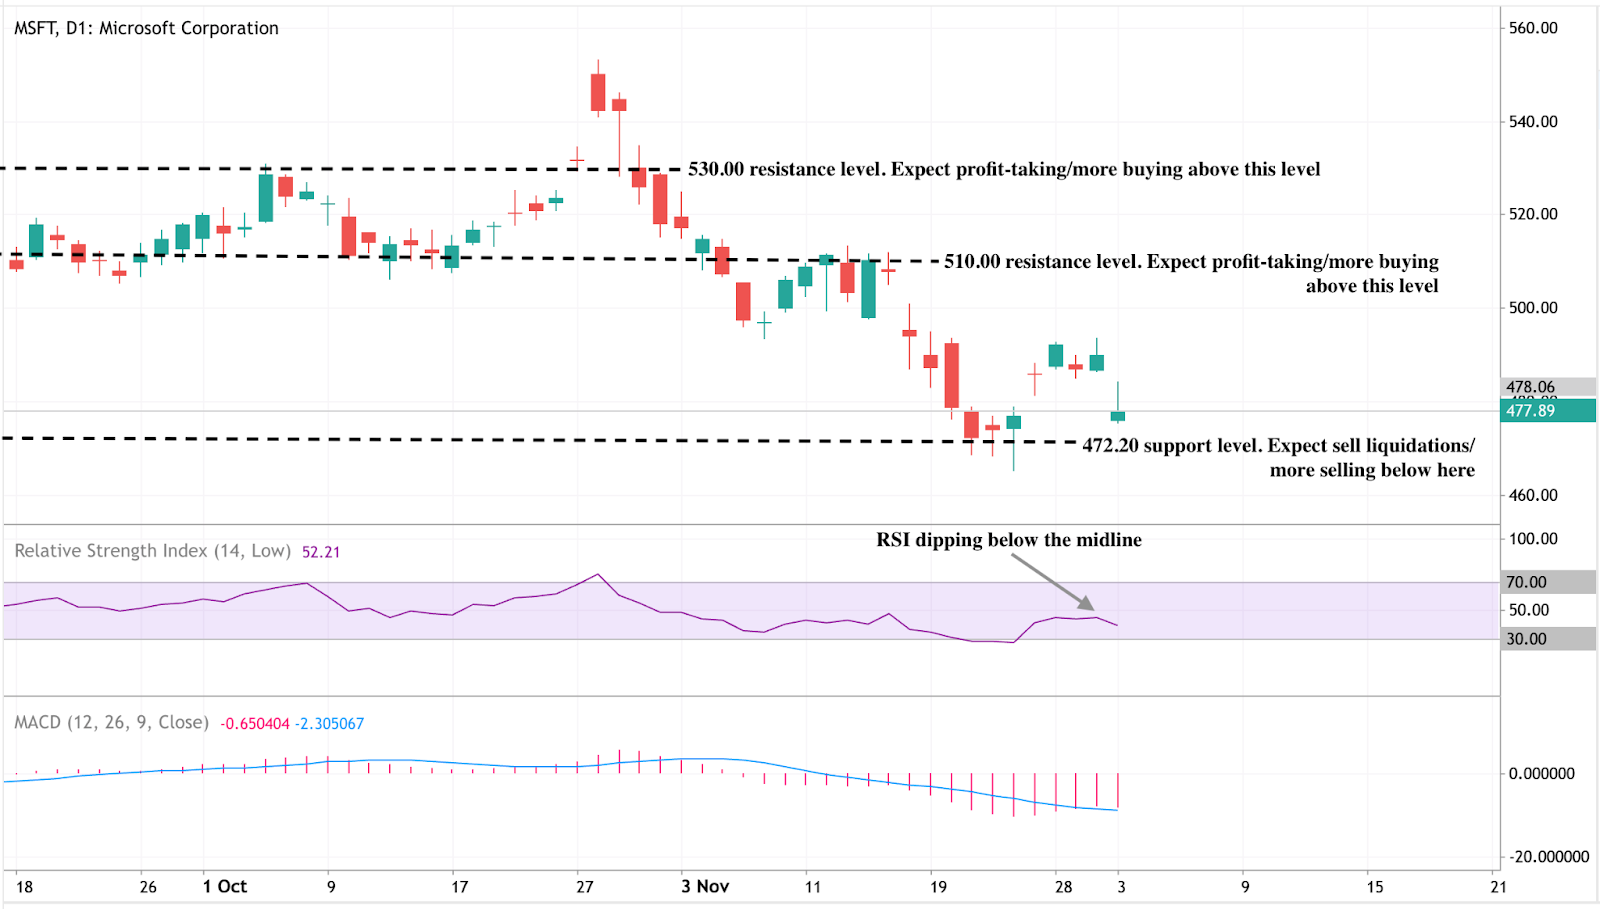
At the start of writing, Microsoft (MSFT) is trading around $478, attempting to stabilise after its recent decline. The nearest support level sits at $472.20, and a break below this level could trigger sell liquidations and open the door to deeper downside movement. On the upside, the stock faces two notable resistance zones at $510.00 and $530.00, where traders may look for profit-taking; however, a strong breakout above these levels would hint at a return of bullish momentum.
Recent price action indicates a market in consolidation, with MSFT struggling to regain altitude after the sharp decline from its early November highs. Candles remain mixed, showing hesitation as buyers and sellers vie for control.
The RSI has dipped slightly below the midline to around 52, signalling weakening momentum and a cautious tone among traders. Meanwhile, the MACD histogram remains negative, although the bars have begun to shorten, suggesting that bearish momentum may be waning. Altogether, the indicators suggest a market waiting for a catalyst - with direction likely to depend on broader tech sentiment and upcoming macro data.
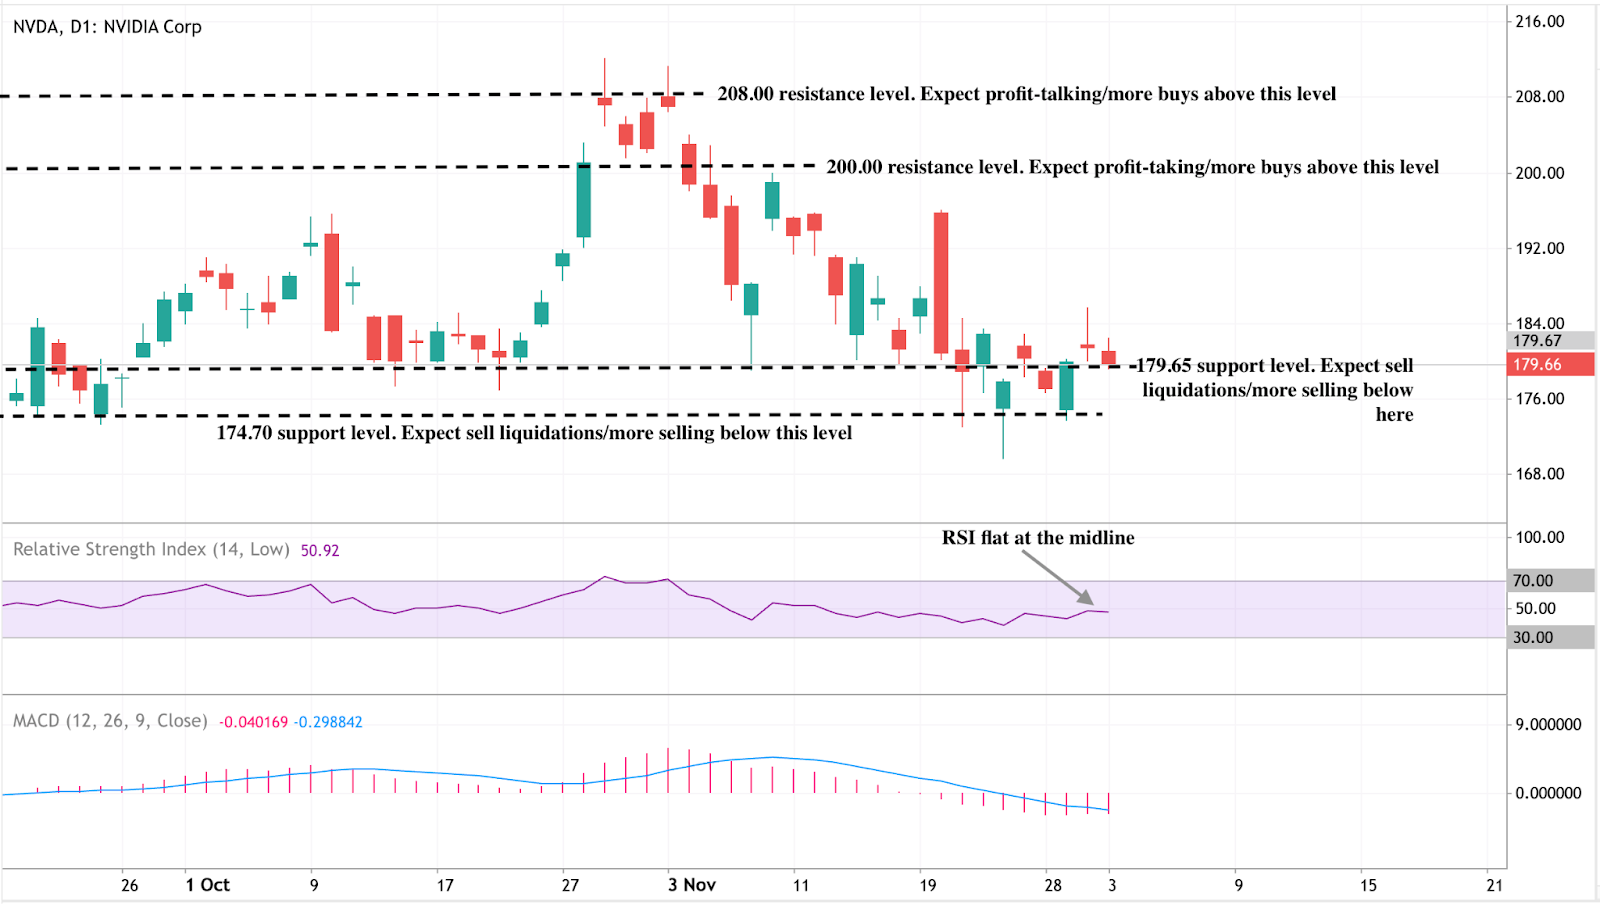
At the start of writing, NVIDIA (NVDA) is trading around $179.66, holding just above the immediate $179.65 support zone. A break below this level could trigger sell liquidations and expose the next major support at $174.70. On the upside, the price faces two key resistance levels at $200.00 and $208.00, both zones where traders may begin to take profits, although a strong breakout above either would signal renewed bullish momentum.
Recent price action reflects hesitation, with candles clustering tightly and volatility narrowing. This signals that NVDA is waiting for a catalyst - likely a macroeconomic data release or a shift in tech-sector sentiment - to dictate its next direction.
Momentum indicators also highlight the indecision. The RSI is flat at the midline around 51, indicating neutral sentiment with neither bulls nor bears in clear control. Meanwhile, the MACD histogram remains negative, although the bars are gradually shortening, suggesting a potential shift toward bullish momentum if buying pressure increases. Overall, NVDA sits at a crossroads, with upcoming moves in tech likely to determine whether it retests resistance or slides toward support.
%2520(1)%2520(1).png)
Sam Altman amebonyeza kitufe cha taharuki
The Wall Street Journal iliripoti siku ya Jumatatu kuwa Sam Altman alituma memo ya “Code Red” kwa kampuni nzima - tahadhari nyekundu ya kwanza kabisa katika historia ya OpenAI.
OpenAI imewasha kengele yake ya juu zaidi ya ndani. The Wall Street Journal iliripoti Jumatatu kuwa Sam Altman alituma memo ya “Code Red” kwa kampuni nzima - tahadhari nyekundu ya kwanza kabisa katika historia ya OpenAI - na kuwaambia kila mtu aache kila kitu ambacho hakiboreshi ChatGPT kwa kiasi kikubwa, sasa hivi. Hii ndiyo ishara ya wazi zaidi hadi sasa kwamba OpenAI inahisi uongozi wake unapungua.
Huku hasara inayotarajiwa ya 2025 ya dola bilioni 9 ikizidi mapato ya dola bilioni 13, himaya ya AI ya OpenAI inaonekana kuyumba, kulingana na ripoti.
Memo iliyotikisa mtandao
Altman hakung'ata maneno katika ujumbe wake wa Jumatatu: OpenAI iko katika hali "nyekundu", ikipanda kutoka tahadhari ndogo ya "chungwa" wiki chache zilizopita.
- Majibu ya haraka na yenye akili zaidi: Muda mfupi wa kupakia, makosa machache ya AI (hallucinations), na aina ya uaminifu ambayo haikufanyi utake kutupa simu yako.
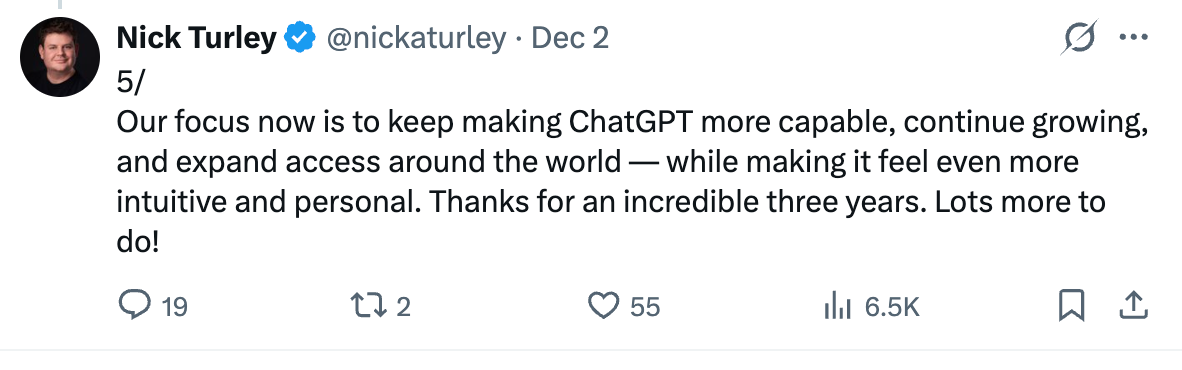
- Kubinafsisha zaidi: ChatGPT inapaswa "kuhisi asili na ya kibinafsi," kulingana na mkuu Nick Turley—fikiria kidogo kama roboti ya kawaida, na zaidi kama msomaji wa mawazo sahihi wa kutisha.
- Uwezo mpana wa kiakili: Kushughulikia maswali ya ajabu bila kisingizio cha "Samahani, Dave", pamoja na hoja bora zaidi kwa ujumla.
Ili kufanikisha hili? Kulingana na Altman, kupitia simu za kila siku za chumba cha vita na viongozi wa bidhaa, utafiti, na uhandisi. Mabadiliko ya timu yanahimizwa. Hakuna mambo yasiyoguswa - isipokuwa chanzo cha mapato ambacho kinaanza kukohoa. Hii inafuatia onyo la "chungwa" mnamo Oktoba, lakini nyekundu inamaanisha kazi: ugawaji kamili wa rasilimali ili kuzuia kupungua kwa watumiaji.
Je, ‘Code Red’ inabadilisha nini hasa?
Memo iliyovuja ya Altman inaonyesha kuwa OpenAI inahangaika kushughulikia masuala ya kasi na uaminifu ya ChatGPT, kufuatia Gemini 3 ya Google, ambayo ilitoa pigo kubwa.
| Kipimo | Namba | Muktadha |
|---|---|---|
| Mapato yanayotarajiwa 2025 | $13 bilioni | Juu kutoka ~$4B mwaka 2024, lakini bado mbali na kurudisha gharama |
| Hasara inayotarajiwa 2025 | ~$9 bilioni | Matumizi ya pesa sasa ≈70% ya mapato |
| Makadirio ya ufadhili unaohitajika 2025–2030 | $207 bilioni (kadirio la HSBC) | Hata kama mapato yatafikia kila lengo |
| Watumiaji hai wa kila wiki wa ChatGPT | Milioni 800+ | Ukuaji umepungua waziwazi |
Chanzo: Forbes, HSBC, Techcrunch
Ongeza Claude 4 ya Anthropic (kipenzi cha makampuni, ikiongoza kwa ubora wa biashara) na miundo ya Llama ya Meta inayokwenda kwa kasi, na hisa ya soko ya 70% ya OpenAI inahisi kama hadithi ya kufurahisha tu. Hata Marc Benioff wa Salesforce aliacha ChatGPT kwa ajili ya Gemini baada ya jaribio la saa mbili: "Hatua hiyo ni ya kichaa."

Matumaini? Muundo mpya unatoka hivi karibuni
Ripoti zaidi zilifichua kuwa OpenAI inatoa "muundo mpya kabisa wa kutoa hoja" (minong'ono ya "o3-pro" au "Orion") wiki ijayo. Ikiwa itatua, tarajia mabadiliko ya kuondoka kwa watumiaji, uwezekano wa kurudisha taji za viwango katika kutoa hoja, kuandika kodi, na hisabati.
Makamu wa Rais na mkuu wa programu ya ChatGPT, Nick Turley alihitimisha kwenye X: "Lengo letu sasa ni kuendelea kufanya ChatGPT iwe na uwezo zaidi... huku tukiifanya ihisi asili zaidi na ya kibinafsi." OpenAI imekaa kimya kuhusu memo hiyo, lakini vitendo vinapaza sauti zaidi. Aliongeza kuwa, na watumiaji wanaolipa milioni 220 wanaotarajiwa ifikapo 2030, hatari ni kubwa sana.
Wachambuzi wanasema hangaiko hili linaweza kumrudisha kwenye mstari jitu lililokengeushwa - au kufichua nyufa kubwa sana kuziba. Katika mashindano ya silaha ya AI, kiongozi wa leo ni hadithi ya tahadhari ya kesho, watazamaji wa soko walieleza.
Kwa nini hii ni muhimu
Wataalamu walieleza kuwa Code Red katika OpenAI sio tu zoezi la ndani la kuzima moto - ni ishara ya tasnia kufikia hatua muhimu ya mabadiliko. OpenAI imefurahia uongozi wa mwaka mzima, lakini kuongezeka kwa Gemini 3, utawala wa kibiashara wa Anthropic, na maendeleo ya haraka ya chanzo huria ya Meta yamepunguza pengo hilo kwa kasi ya kutisha. Wakati kampuni ya AI yenye thamani zaidi duniani inapopata hofu hadharani, inaashiria shinikizo kubwa la kiushindani na kifedha katika sekta nzima.
Kwa wengi, memo hiyo pia inaonyesha mabadiliko kutoka kwa kelele za miundo hadi utendaji wa bidhaa. Hii inamaanisha watumiaji wanazidi kujali kidogo kuhusu ni muundo gani "una akili zaidi" katika vipimo na zaidi kuhusu kasi (latency), uaminifu, gharama, na ubinafsishaji - maeneo ambapo ChatGPT imerudi nyuma hivi karibuni. Iliongezwa kuwa ikiwa OpenAI haiwezi kurudisha imani haraka, uasili wa makampuni, imani ya wawekezaji, na uaminifu wa watumiaji unaweza kuhamia kwingine ndani ya miezi michache.
Jambo kuu la kuzingatia
Code Red ya OpenAI inaashiria mabadiliko makubwa zaidi ya kampuni tangu kuzinduliwa kwa ChatGPT - kurudi kwa lazima kwenye misingi huku wapinzani wakiongeza kasi, kulingana na wataalamu. Wiki chache zijazo zitaamua ikiwa muundo mpya wa kutoa hoja unaweza kuimarisha idadi ya watumiaji na kurejesha uongozi wa OpenAI, au ikiwa Gemini, Claude, na Llama zitabadilisha kabisa mazingira ya ushindani. Mbio za AI si tena kuhusu nani alizindua kwanza - ni kuhusu nani anayebadilika haraka zaidi.
%2520(1).png)
Je, kuvuka kwa Bitcoin juu ya $92,000 kunaashiria awamu mpya ya soko?
Kupanda kwa Bitcoin hadi juu ya $92,000 kumehuisha mjadala ambao umefuata kila mabadiliko makubwa katika mzunguko huu.
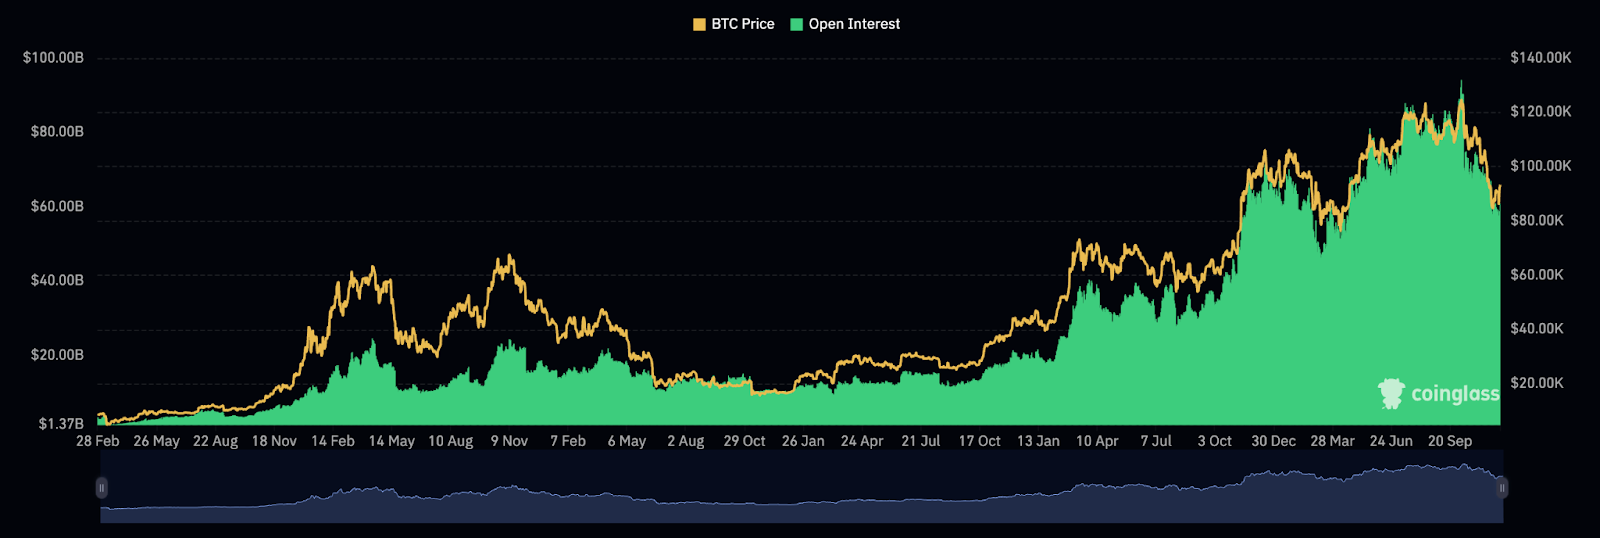
Kupanda kwa Bitcoin hadi juu ya $92,000 kumehuisha mjadala ambao umefuata kila mabadiliko makubwa katika mzunguko huu: je, soko linasahihisha tu mteremko wa kuuzwa kupita kiasi, au awamu mpya ya kasi inayoendeshwa na taasisi na mambo ya kiuchumi (macro) imeanza?
Ufufuaji huo ulitokea baada ya kipindi kigumu kilichoshuhudia bitcoin ikianguka kuelekea eneo la $80,000–$82,000, ikichochewa na hatua ya 'risk-off' iliyoongozwa na BOJ, uvamizi wa DeFi na wimbi la 'liquidations' za leverage. Kufikia wakati inarejea $92,000, wafanyabiashara walikuwa wakiangalia mpangilio mpana wa nguvu badala ya kichwa cha habari kimoja.
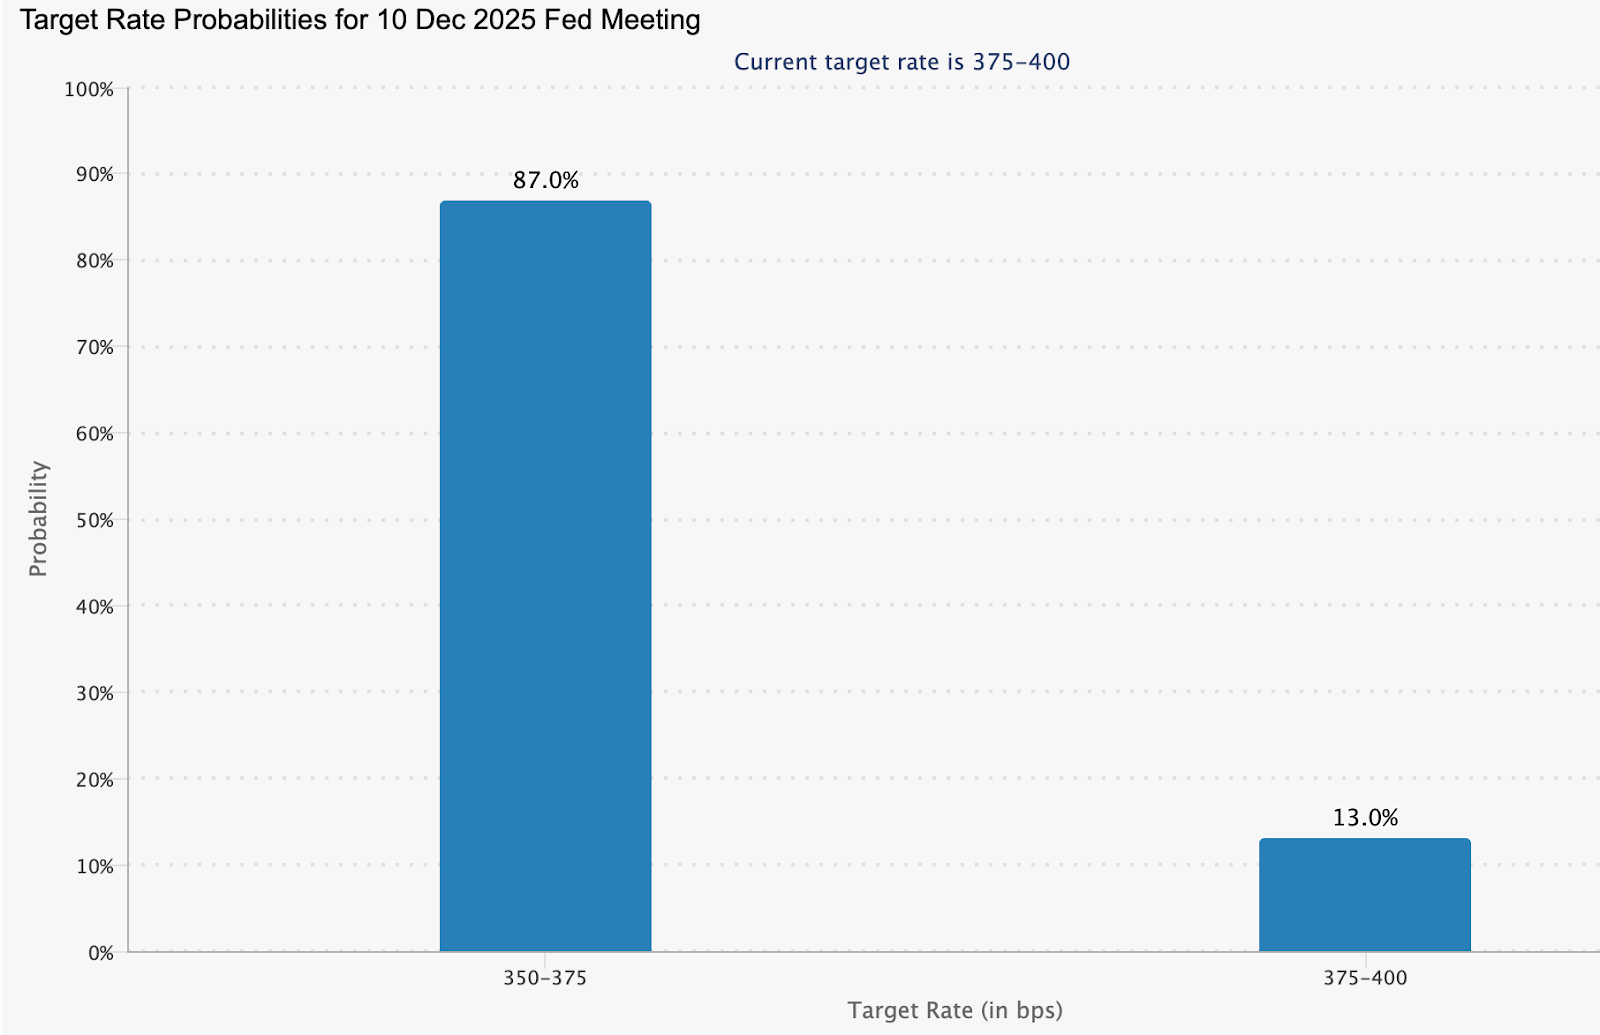
Kuvunja huko pia kuliwasili wakati matarajio ya kupunguzwa kwa viwango vya riba mwezi Desemba yakipanda kwa kasi. Masoko ya utabiri sasa yanaweka uwezekano wa 87% wa kupunguzwa kwa 25 bps, ikiongeza sauti kubwa ya kiuchumi (macro) kwenye soko ambalo tayari limezoea kuitikia mabadiliko ya ukwasi (liquidity).
Dhidi ya hali hiyo, ishara za taasisi - ikiwa ni pamoja na mabadiliko ya sera ya Vanguard, mwongozo wa Bank of America juu ya ugawaji wa portfolio na kuongezeka kwa mahitaji katika ETFs zinazohusiana na crypto - kwa pamoja zimeongeza hisia kwamba bitcoin inarudishwa katika mazungumzo mapana ya soko.
Nini kinachochochea kuvuka kwa Bitcoin juu ya $92K?
Ufufuaji huu ni matokeo ya vichocheo kadhaa vinavyoingiliana. Matarajio ya kupunguzwa kwa viwango yameongezeka katika wiki za hivi karibuni wakati data dhaifu ya wafanyakazi wa Marekani na maoni ya 'dovish' kutoka kwa maafisa wa Federal Reserve yalisukuma masoko kuelekea makubaliano kwamba kulegezwa kwa sera za fedha kunaweza kuanza katika mkutano wa Desemba.
Unyeti wa Bitcoin kwa matarajio ya ukwasi unabaki kuwa moja ya tabia zake thabiti, na mabadiliko hayo yamesaidia kujenga upya imani baada ya mauzo ya Novemba. Msimamo wa taasisi pia umekuwa ukibadilika kwa njia ambazo ni muhimu kwa muundo wa soko.
IBIT ETF ya BlackRock ilirekodi kiasi cha biashara cha $3.7 bilioni - ikipita ETF ya S&P 500 ya Vanguard yenyewe - wakati wawekezaji walitafuta uwekezaji wenye ukwasi wakati wa ufufuaji. Taarifa ya Bank of America, ikipendekeza kwamba wateja matajiri wanaweza kutenga 1-4% ya mali zao kwa mali za kidijitali, iliongeza kasi hiyo.
Uamuzi wa Vanguard wa kuruhusu biashara katika ETFs za bitcoin ni wa maana, lakini ni sehemu ya mtindo mpana wa taasisi zilizokuwa na tahadhari hapo awali kuzoea mahitaji ya wateja, badala ya kuwa kichocheo pekee cha mkutano huo.
Kwa nini ni muhimu
Mchanganyiko wa nguvu za kiuchumi (macro) na kimuundo hufanya wakati huu kuwa tofauti na 'relief rally' ya kawaida. Ufufuaji wa Bitcoin unafuata kushuka kwa 36% kutoka kilele hadi chini kutoka juu yake ya Oktoba karibu $126,000, kukiacha hali ya kuuzwa kupita kiasi na nafasi zikiwa zimesafishwa.
BTIG iliangazia kuwa Novemba kihistoria ni kipindi ambacho soko huelekea kufika chini kabla ya kuimarika kuelekea mwisho wa mwaka, na hali ya kiufundi inalingana kwa karibu na mtindo huo. Mwingiliano kati ya matarajio ya kupunguzwa kwa viwango na nafasi zilizosafishwa umetoa ufufuaji huo hisia ya kudumu zaidi.
Wafanyabiashara wanaofuatilia ufufuaji kwenye Deriv MT5 watakuwa wamegundua jinsi kushuka kwa hivi karibuni kulivyotengeneza muundo safi na pointi za wazi za majibu, na kuifanya iwe rahisi kufuatilia ikiwa hatua ya sasa inajenga kasi ya kweli au inarudi nyuma tu.
Hisia za taasisi zinabadilika kwa njia ambazo zinaweza kuathiri kina cha soko kwa miezi kadhaa. Brian Huang wa Glider alibainisha kuwa makampuni ambayo kwa muda mrefu yalionekana kuwa ya "shule ya zamani" katika mbinu zao za uwekezaji yanabadilika kwa sababu mahitaji ya wateja kwa mali za kidijitali yameendelea kupitia volatility. Mtazamo huu wa kulainika ni muhimu kama tangazo lolote lile. Unapanua njia ya mapato na kurekebisha uwekezaji wa bitcoin wakati ambapo mazingira ya kiuchumi (macro) yanaweza kuwa yenye kuunga mkono zaidi.
Kwa wafanyabiashara wanaosimamia ukubwa wa nafasi, zana kama Deriv Trading Calculator husaidia kupima viwango vya hatari wakati volatility inapoongezeka na viwango vya usaidizi vinapojaribiwa.
Athari kwa masoko na wawekezaji
Kupanda kwa Bitcoin hadi juu ya $92,000 kulibadilisha tabia ya hatari katika masoko yanayohusiana. Kiasi cha ETF kiliongezeka wakati wafanyabiashara walipohamia kwenye vyombo vyenye ukwasi, wakati hisa za crypto ziliitikia bila usawa.
Hisa zinazohusiana na Bitcoin zilipanda na ufufuaji, lakini makampuni ya uchimbaji yaliendelea kuhangaika - ishara kwamba wawekezaji wanatofautisha kwa ukali zaidi kati ya uwekezaji wa bei halisi na biashara zenye hatari za kiutendaji. Tofauti hii inasisitiza jinsi soko linavyozidi kuwa la kuchagua badala ya kuwa 'bullish' kwa ujumla.
Kwa wafanyabiashara, ufufuaji umeangazia jukumu la leverage kama kichocheo na hatari, kulingana na wachambuzi. Kushuka kwa mapema mwezi Desemba chini ya $90,000 kulifichua udhaifu wa nafasi zilizopanuliwa kupita kiasi, na kusababisha mamia ya mamilioni katika 'liquidations'. Wakati ufufuaji uliofuata uliimarisha hisia, soko bado linakabiliwa na njia nyembamba kati ya kasi ya kujenga na kulazimishwa kufunga nafasi tena.
Wawekezaji watakuwa wakiangalia ikiwa 'open interest' inapanda kwa utulivu kutoka viwango vya sasa - ambayo ingeunga mkono hatua hiyo - au inaongezeka haraka sana na kurejesha ukosefu wa utulivu.
Mtazamo wa wataalam
Wachambuzi wanabaki wamegawanyika juu ya ikiwa ufufuaji wa bitcoin unaashiria mwanzo wa awamu mpya au ni marekebisho ya kiufundi tu. Jonathan Krinsky wa BTIG anaamini hali ya kuuzwa kupita kiasi na mifumo ya msimu inaashiria "reflex rally" yenye nafasi ya kufikia kuelekea $100,000.
Wito huo ni wa kimbinu wazi, ukikubali kwamba mwelekeo mpana unabaki kupingwa na kutegemea uthibitisho wa kiuchumi (macroeconomic).
Matarajio ya muda mrefu yanaegemea zaidi kuwa 'bullish'. Huang anahoji kuwa wakati "maumivu ya muda mfupi yanaweza kuwa hayajaisha", mwelekeo wa muda wa kati bado unaelekeza kwa bitcoin hatimaye kufikia eneo la $150,000, ikidhaniwa kuwa mahitaji ya kimuundo yanaendelea kujengeka. Mkutano wa Desemba wa Federal Reserve sasa unasimama kama makutano makuu yanayofuata.
Kupunguzwa safi kwa 25 bps kunaweza kuhalalisha ufufuaji wa sasa, wakati kushikilia au lugha ya 'hawkish' kunaweza kupunguza kasi. Mtiririko wa ETF, hali ya leverage na kutokuwepo kwa matukio zaidi ya usalama kutaamua ikiwa ufufuaji huu utakomaa kuwa mabadiliko mapana ya mzunguko.
Maarifa ya kiufundi ya BTC
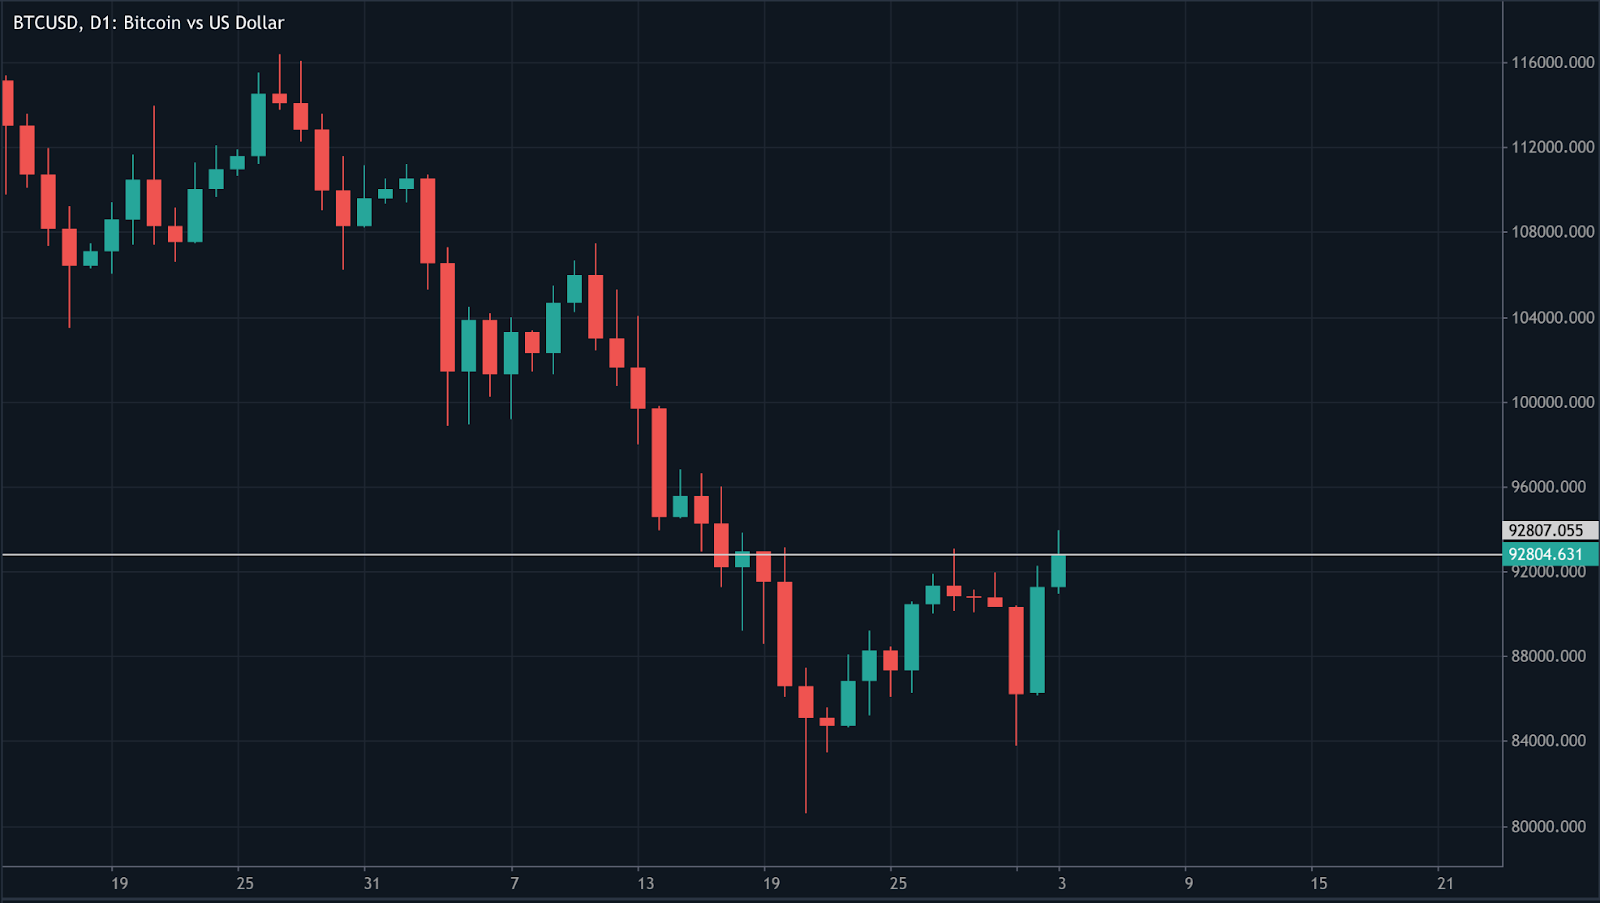
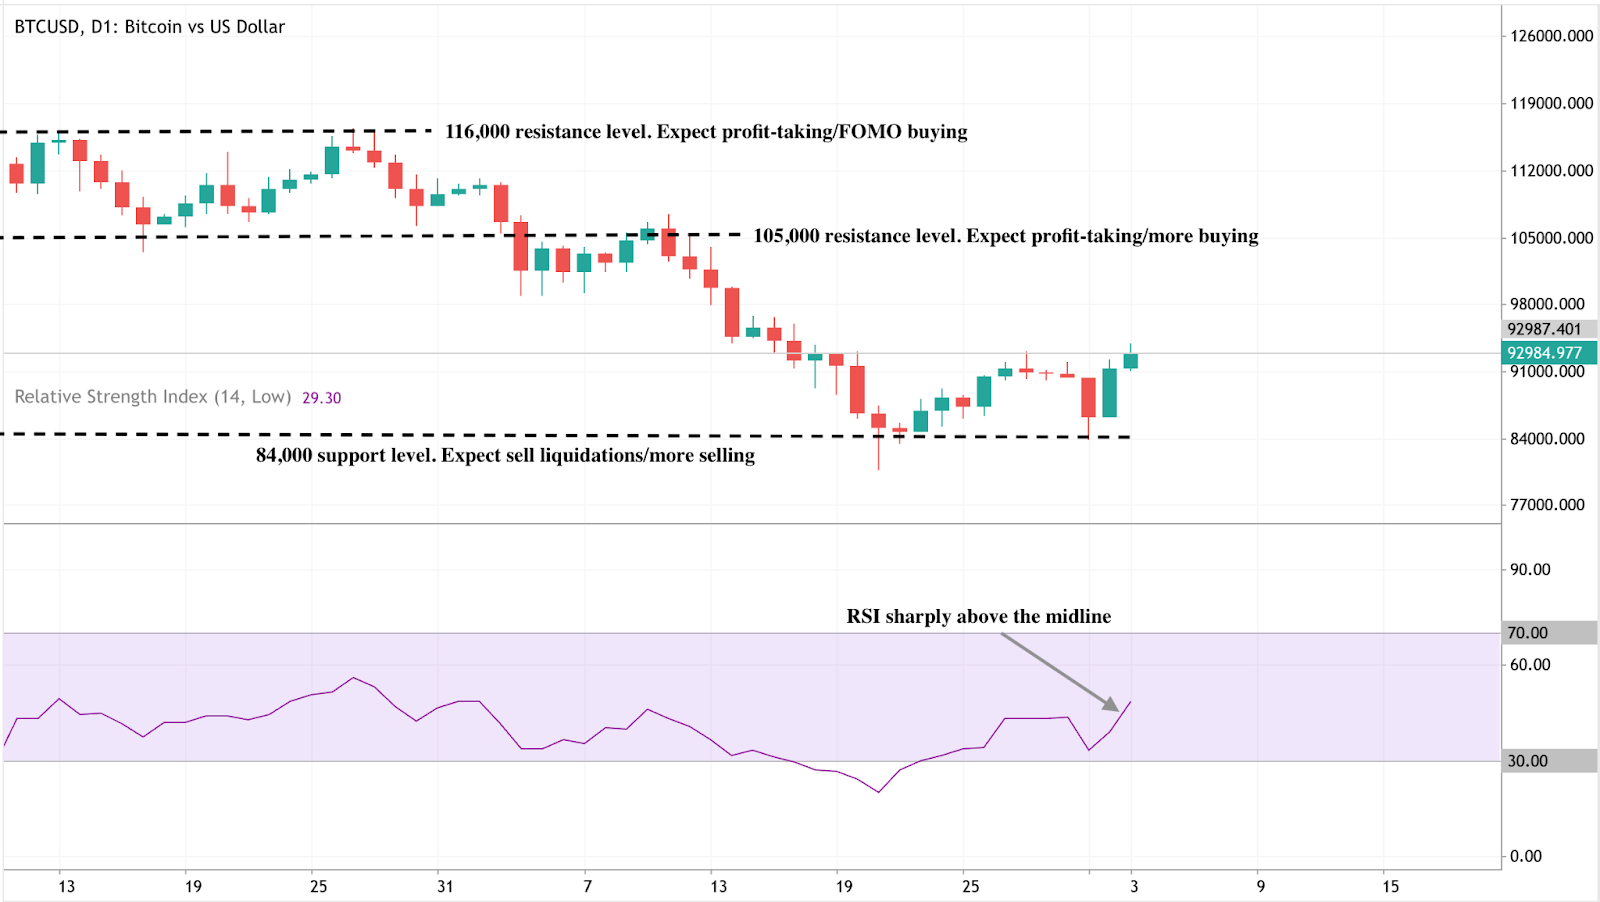
Mwanzoni mwa uandishi, Bitcoin (BTC/USD) inafanya biashara chini kidogo ya $93,000, ikiendeleza ufufuaji wake kutoka kiwango muhimu cha usaidizi cha $84,000 - eneo ambapo kushuka zaidi kunaweza kusababisha 'liquidations' za kuuza. Ufufuaji sasa unaleta BTC karibu na viwango vya upinzani vya $105,000 na $116,000. Maeneo yote mawili yanaweza kuvutia uchukuaji faida, wakati kuvunja yoyote juu yake kunaweza kuwasha ununuzi unaoendeshwa na FOMO wakati hisia za bullish zinaporejea.
Kupanda kwa hivi karibuni pia kunaashiria mabadiliko katika kasi ya muda mfupi baada ya mteremko wa muda mrefu. Mishumaa (Candles) sasa inajikusanya juu ya viwango vya chini vya awali, ikipendekeza wauzaji wanapoteza udhibiti wakati wanunuzi wanapata tena nguvu polepole.
RSI imeruka kwa kasi juu ya mstari wa kati kuelekea eneo la 60, ikiashiria kuboresha kwa kasi ya 'bullish' baada ya kuelea katika eneo dhaifu. Ingawa bado iko chini ya viwango vya kununuliwa kupita kiasi (overbought), kupanda huku kwa kasi kunaonyesha kuimarika kwa mahitaji na kupendekeza ufufuaji unaweza kuwa na nafasi ya kuendelea - mradi BTC inaweza kushikilia juu ya usaidizi wake wa karibu.
Jambo kuu la kuzingatia
Hatua ya Bitcoin juu ya $92,000 inaeleweka vyema kama makutano ya nguvu kadhaa: kubadilika kwa matarajio ya kiuchumi (macro), kukubalika kwa taasisi kunakoendelea, na urekebishaji muhimu wa kiufundi baada ya marekebisho makali. Hakuna kichocheo kimoja kinachoelezea ufufuaji. Badala yake, soko linaitikia mkusanyiko wa ishara za kuunga mkono wakati ambapo nafasi zimewekwa upya, na ukwasi unaweza kuwa unageuka kuwa mzuri zaidi. Jaribio kuu linalofuata linakuja na mkutano wa Desemba wa Federal Reserve, ambao utaamua ikiwa ufufuaji huu utapanuka au kukwama.
.png)
Dola chini ya shinikizo: Je, USD/JPY inaweza kupanda wakati EUR/USD inatulia?
Dola inabanwa kutoka pande zote mbili za wigo wa FX, ikiwalazimisha wafanyabiashara kutathmini upya mienendo iliyozoeleka ya mwisho wa mwaka.
Dola inabanwa kutoka pande zote mbili za wigo wa FX, ikiwalazimisha wafanyabiashara kutathmini upya mienendo iliyozoeleka ya mwisho wa mwaka. USDJPY imefanikiwa kunyanyuka kutoka kiwango cha chini cha wiki mbili karibu na 154.65 licha ya matarajio yanayoongezeka kwamba Bank of Japan inaweza kutoa ongezeko la viwango mwezi Desemba - mabadiliko ambayo yalisukuma yields za miaka miwili za JGB hadi 1% kwa mara ya kwanza tangu 2008.
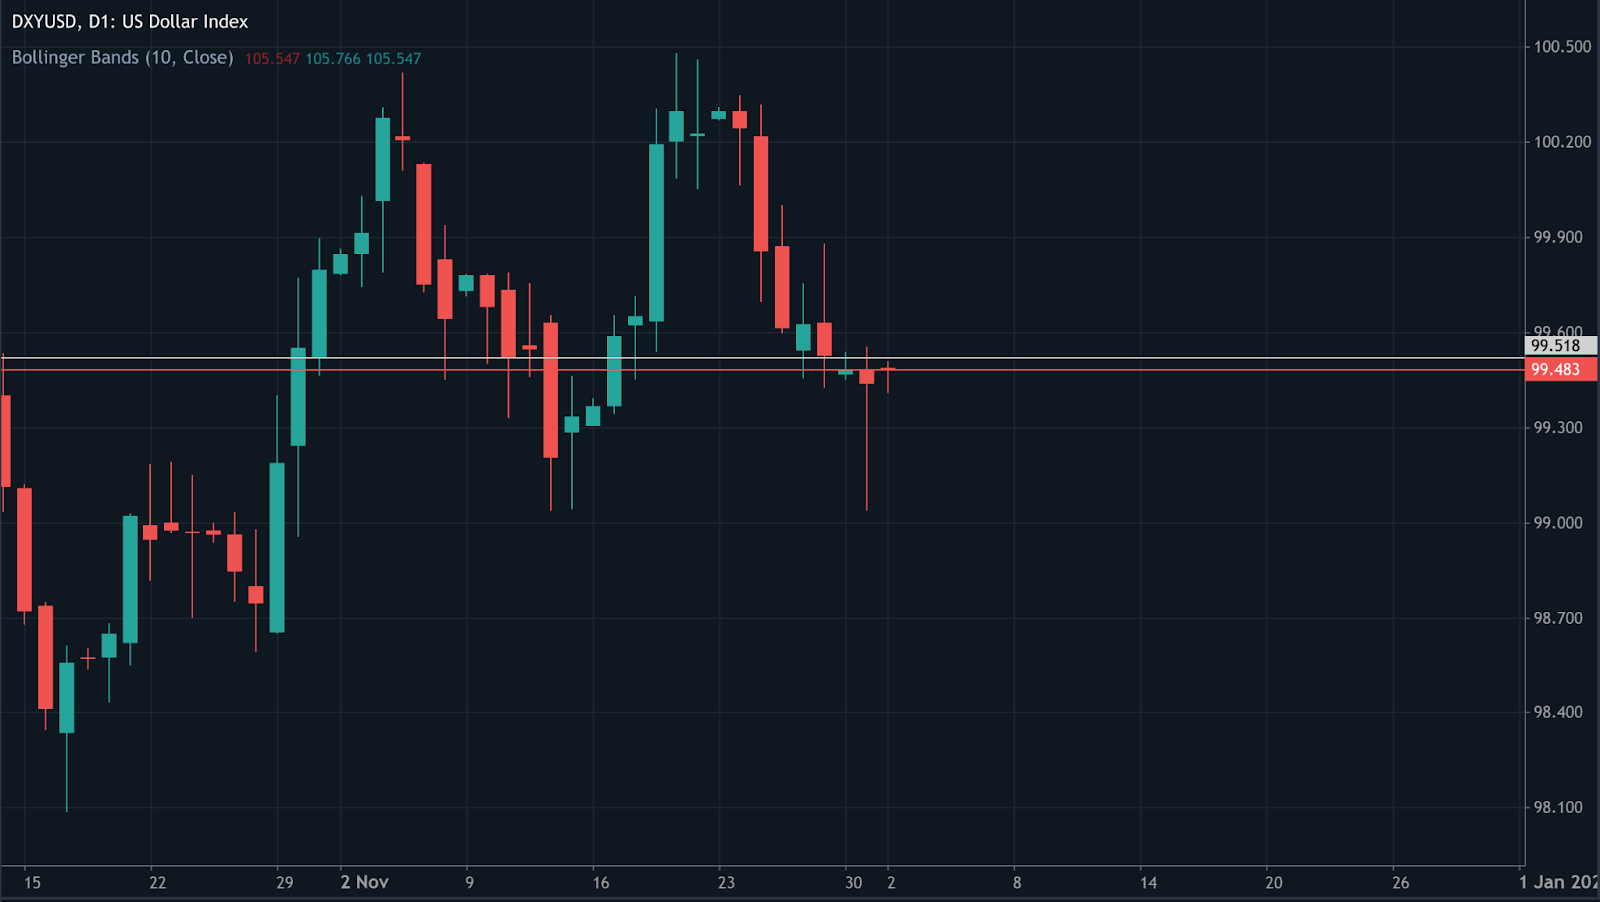
EURUSD, wakati huo huo, inatulia kwa sasa, huku index ya dola ikisalia karibu na 99.48, ikitishia kusogea kuelekea 100.50 ikiwa hisia zitabadilika. Mgawanyiko huu - yen inayoungwa mkono na kasi ya sera na euro inayoshikilia chini ya nafasi pana ya dola - inaweka 'greenback' katikati ya shinikizo.
Huku mkutano wa Fed ukikaribia na Japan ikiashiria kurejea kwa hali ya kawaida zaidi, vipindi vichache vijavyo vitaamua ikiwa USDJPY inaweza kusalia juu ya 155 au ikiwa mwenendo wa bei ya EURUSD utakuwa simulizi kuu kuelekea mwisho wa mwaka.
Nini kinachochochea mienendo ya jozi hizi mbili?
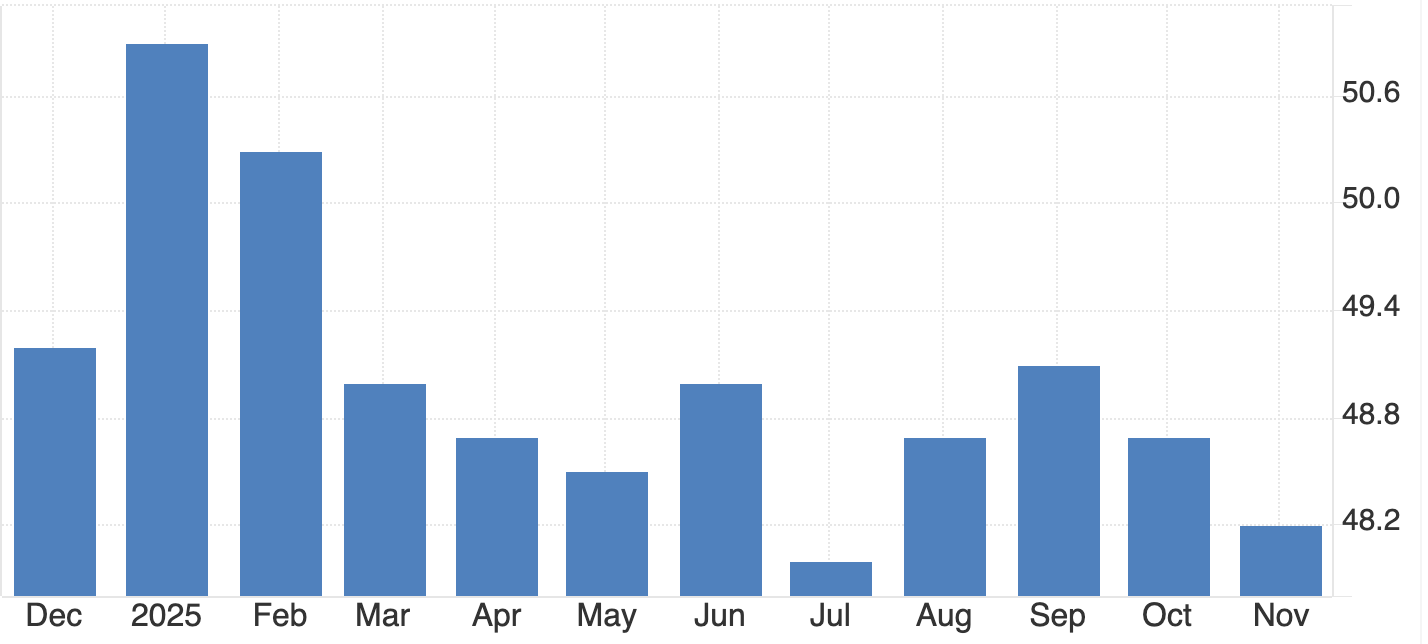
Biashara ya dola imenaswa kati ya nguvu mbili zinazoshindana. Kwa upande mmoja, data dhaifu za Marekani zimevuta yields za Treasury chini, huku ISM Manufacturing PMI ikianguka hadi 48.2 na uwezekano wa kupunguzwa kwa viwango vya Fed kwa Desemba ukiwa 87.2%.
Hiyo inapaswa, kinadharia, kuvuta USDJPY chini. Hata hivyo, hamu ya hatari imeimarika katika hisa za Asia, ikipunguza zabuni ya yen kama kimbilio salama na kupunguza athari ya BoJ yenye msimamo mkali zaidi. Hii inaelezea kwa nini USDJPY imerudi nyuma kuelekea 156 licha ya ishara kali zaidi katika miaka kwamba Japan inaweza kupandisha viwango.
EURUSD imeshikilia juu ya 1.16, licha ya shinikizo kwa dola. Wafanyabiashara wanatazama ikiwa index ya dola inaweza kushikilia juu ya 99.40, kiwango ambacho kingefanya euro kuwa hatarini zaidi kwa jaribio la 1.1550.
Mifumo ya msimu kwa kawaida ingependelea euro mapema na mwishoni mwa Desemba, lakini msimu unatatizika kuwa na umuhimu wakati sera na tofauti za yield zinaendesha mwelekeo.
Kwa nini ni muhimu
Kubanwa kwa dola kunaathiri zaidi ya wafanyabiashara wa sarafu. Kampuni za kimataifa hulinda (hedge) hatari zao za mwisho wa mwaka wakati wa Desemba, na kufanya mabadiliko makali ya FX kuwa ya usumbufu hasa. Wakati USDJPY inapozunguka karibu na 156–158, na EURUSD ikisogea kuelekea 1.1550, mifano ya ulinzi wa kampuni huanza kukaza, mara nyingi ikisababisha mtiririko wa kiufundi unaoongeza tete ya siku. Mkakati mmoja wa Tokyo aliiambia Bloomberg wiki hii kwamba “misingi na mtiririko vinagongana wakati mbaya zaidi,” akiangazia jinsi ukwasi mdogo unavyokuza kila hatua ndogo.
Kwa wafanyabiashara, hatari ni kubwa zaidi. Kupandishwa kwa viwango vya BoJ kungebadilisha miongo kadhaa ya sera legelege sana na kungeweza kutuma USDJPY chini kwa kasi. Kinyume chake, sauti ya Fed iliyo laini kuliko ilivyotarajiwa inaweza kudhoofisha dola kwa upana na kuharakisha kurejea kwa euro. Matokeo yote mawili yanawezekana, ndiyo maana masoko yanakuwa nyeti sana kwa kila data kabla ya maamuzi ya Fed na BoJ.
Athari kwa masoko na wafanyabiashara
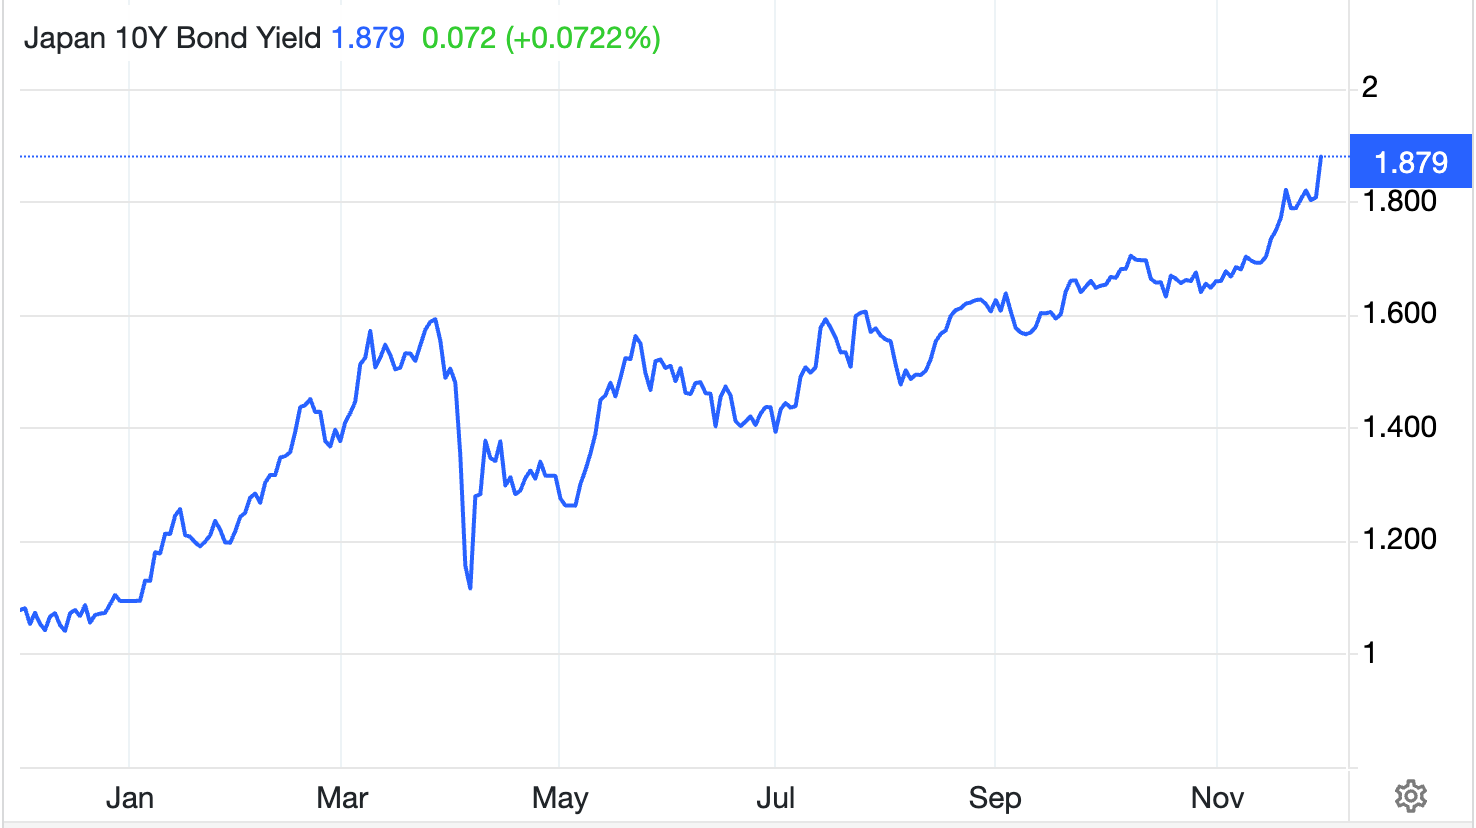
Mienendo ya yield inabaki kuwa njia iliyo wazi zaidi ya usambazaji. Yield ya bondi ya serikali ya Japan ya miaka 10, ambayo imepanda hadi kiwango cha juu cha miaka 17, imepunguza tofauti na Treasuries za Marekani kwa kiasi kikubwa.

Hiyo, kulingana na wachambuzi, inapunguza moja ya misingi ya kimuundo ya USDJPY, ambayo inaelezea kwa nini jozi hiyo ilitatizika kuongeza faida zake juu ya 158 mapema katika robo hii. Wafanyabiashara sasa wanaona kiwango cha bei cha 156 kama egemeo ambalo litaamua ikiwa urejeaji wa hivi karibuni utafifia au kuendelea.
EURUSD inakabiliwa na vikwazo vyake vya kimuundo. Kurejea kwa yields za Ujerumani kunapaswa kutoa msaada kwa euro; hata hivyo, jozi hiyo inaendelea kufuata mabadiliko katika index ya dola kwa karibu zaidi kuliko maendeleo ya ndani.
Kulingana na wachambuzi, kuvunjika kwa nguvu chini ya 1.16 kunaongeza hatari ya kushuka kuelekea 1.1550, na mifano inaonya juu ya hali za hatari ya ghafla ambazo zinaweza kusukuma jozi hiyo karibu na 1.1500 katika ukwasi mdogo. Nguvu ya kawaida ya euro ya Desemba kutoka 22–27 Desemba inaweza kusaidia kutuliza kasi, lakini mara chache hudumu wakati matukio makuu ya sera yanapokutana na mtiririko wa msimu.
Mtazamo wa wataalamu
Wachambuzi wanabaki wamegawanyika juu ya jinsi kubanwa kwa dola kutatatuliwa. Wengine wanatarajia USDJPY kulainika kuelekea mwisho wa mwaka ikiwa BoJ itaashiria imani katika mtazamo wake wa mfumuko wa bei. Gavana Kazuo Ueda tayari amedokeza kuwa uwezekano wa mfumuko wa bei kufikia lengo la 2% unaongezeka, na wafanyabiashara sasa wanatarajia takriban nafasi ya 80% ya kupandishwa kwa viwango mwezi Desemba. Hatua ya ukubwa huo ingevuta USDJPY haraka kuelekea 152, na labda 150 ikiwa mazungumzo ya uingiliaji kati yataongezeka.
Njia ya EURUSD inategemea karibu kabisa na Fed. Kupunguzwa kwa viwango mwezi Desemba kunatarajiwa kikamilifu, kukiacha dola hatarini kwa mshangao wa msimamo mkali. Ikiwa Fed itakataa kujitolea kwa mfululizo wa kupunguzwa, dola inaweza kurudi nyuma, ikisukuma EURUSD nyuma kuelekea 1.1650 kabla ya wauzaji kurudi. Ufunguo ni ikiwa data ya PCE kabla ya mkutano itabadilisha matarajio tena - au ikiwa Fed itaacha masoko yaende mbele yake kwa sasa.
Uchambuzi wa kiufundi wa USDJPY
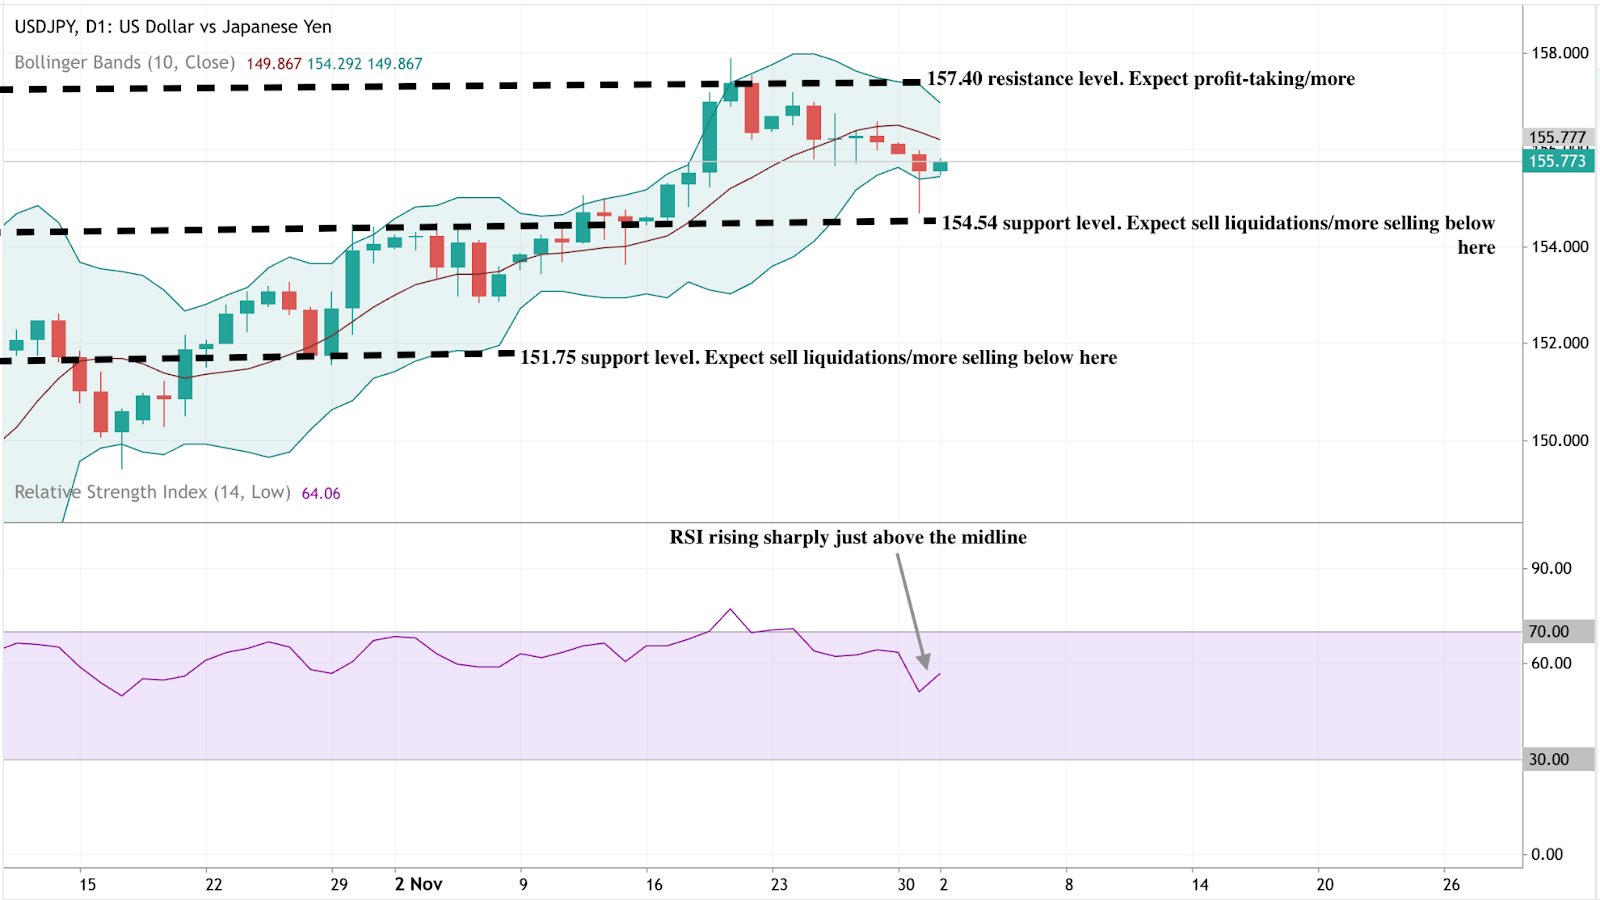
Wakati wa kuanza kuandika, USD/JPY inafanya biashara karibu na 155.77, ikijaribu kutulia baada ya kurudi nyuma hivi karibuni. Jozi hiyo inabaki imezuiwa na kiwango cha upinzani cha 157.40 - eneo muhimu ambapo uchukuaji faida kawaida hujitokeza, lakini kuvunja juu yake kunaweza kuwasha tena kasi ya bullish. Viwango vya chini vya mara moja vya kutazama viko 154.54 na 151.75; kuvunja chini ya yoyote kutaashiria kudhoofika kwa nguvu ya mwenendo na kunaweza kusababisha uuzaji wa kufunga nafasi wakati bei inateleza kupitia muundo wa chini wa Bollinger.
Licha ya kurudi nyuma, USD/JPY inaendelea kufanya biashara ndani ya nusu ya juu ya Bollinger Bands, ikipendekeza kuwa mwelekeo mpana wa kupanda unabaki thabiti kwa sasa. Jozi hiyo inaweza kuendelea kuunganisha isipokuwa kichocheo kipya cha uchumi mkuu, kama vile yields za Marekani au maoni ya Bank of Japan, yataisukuma kwa uamuzi katika mwelekeo wowote.
RSI imeruka kwa kasi hadi 64, ikipanda juu kidogo ya mstari wa kati baada ya kushuka chini kwa muda mfupi. Mabadiliko haya yanaonyesha uboreshaji katika kasi ya bullish, ingawa bado haijafikia viwango vya kununuliwa kupita kiasi. Kiashiria kwa sasa kinaunga mkono wazo la mwenendo unaotulia, na nafasi ya kupanda ikiwa wanunuzi watapata tena udhibiti.
Uchambuzi wa kiufundi wa EURUSD
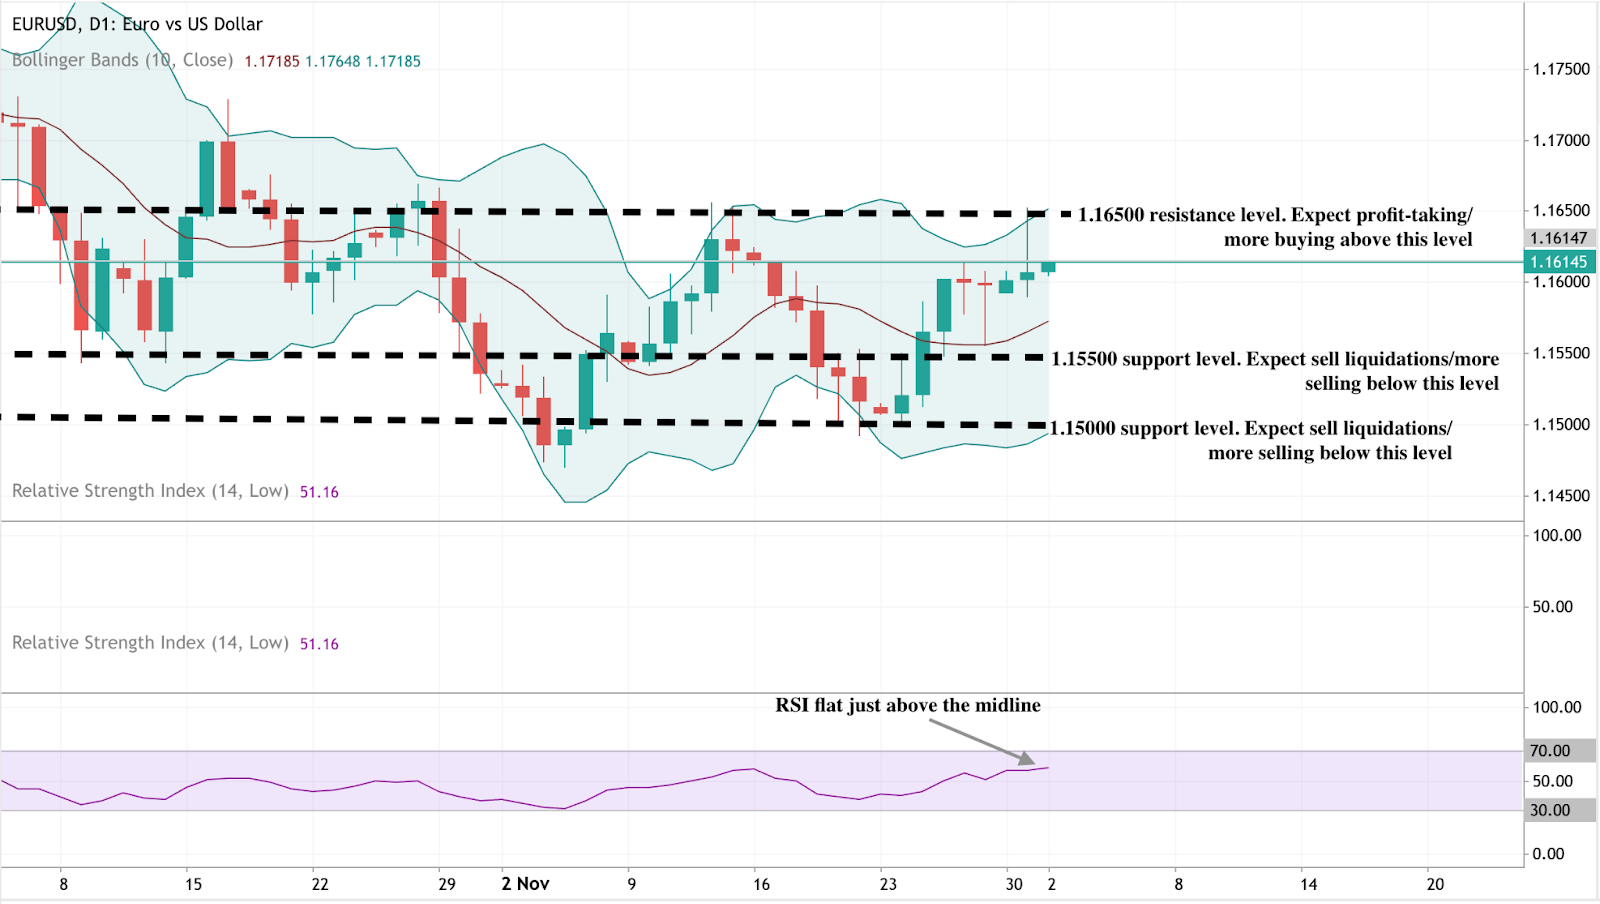
Wakati wa kuanza kuandika, EUR/USD inafanya biashara karibu na 1.1614, ikisogea polepole kuelekea eneo muhimu la upinzani la 1.1650. Kiwango hiki kimezuia mara kwa mara hatua za kupanda, na kuifanya kuwa eneo ambapo wafanyabiashara wanaweza kutarajia uchukuaji faida au uwezekano wa kuvunja kwa bullish ikiwa kasi itaendelea kuongezeka. Kwa upande wa chini, msaada wa mara moja uko 1.1550 na 1.1500, na kuvunja chini ya yoyote kuna uwezekano wa kusababisha uuzaji wa kufunga nafasi na kuongeza shinikizo la bearish.
Bei inabaki imezuiliwa ndani ya nusu ya juu ya anuwai ya Bollinger Band, ikiashiria upendeleo wa wastani wa bullish lakini bado sio mabadiliko ya mwenendo wa uamuzi. Jozi hiyo inaendelea kuyumba ndani ya muundo mpana wa uunganishaji, ikipendekeza kuwa vichocheo vya jumla - kama vile data ya Marekani au maoni ya ECB - vinaweza kuhitajika kuendesha uvunjaji endelevu.
RSI imekaa bapa juu kidogo ya 51, ikionyesha kasi ya neutral-hadi-bullish kidogo. Msimamo huu unaimarisha wazo la maslahi ya ununuzi thabiti lakini ya tahadhari, na nafasi ya kupanda zaidi ikiwa EUR/USD inaweza kuvunja kwa usafi juu ya upinzani.
Jambo kuu la kuzingatia
Dola inabanwa kutoka pande zote mbili za wigo wa FX wakati USDJPY ikipambana na matarajio ya kukaza kwa BoJ na EURUSD ikifyonza nafasi ya dola yenye msingi mpana. Mabadiliko ya yield na maamuzi yajayo ya benki kuu yataamua ni simulizi gani itatawala kuelekea mwisho wa mwaka. Wafanyabiashara wanapaswa kutarajia tete wakati ukwasi mdogo unapokutana na hatari kuu za sera. Hatua zinazofuata katika USDJPY na EURUSD zinaweza kufafanua mazingira ya mapema ya 2026.

Bitcoin slides below $87K: Is the crypto winter officially here?
Bitcoin sliding below $87,000 feels like the start of a new crypto winter, but the evidence suggests a more brutal, reset than the opening chapter of a multi-year freeze.
Bitcoin sliding below $87,000 feels like the start of a new crypto winter, but the evidence suggests a more brutal, macro-driven reset than the opening chapter of a multi-year freeze. Analysts report that after reaching above $126,000 in October, the world’s largest cryptocurrency has dropped more than 30% in a matter of weeks, with over $200 billion wiped from the broader market as Ethereum and other major cryptocurrencies fell 5–10% in a single session
That kind of move is painful and late-cycle, yet it still sits within the range of a violent correction in a long bull phase rather than a definitive turn into a deep, grinding bear market. What has changed is the backdrop. A sharp spike in Japanese bond yields, the slow unwinding of the yen carry trade, record ETF outflows and heavy derivatives liquidations have collided to drain liquidity from one of the most leveraged corners of global markets.
Whether this becomes a full-blown crypto winter depends less on Bitcoin itself and more on how far global funding costs rise, how quickly investors de-risk, and whether institutional buyers see this as a buying opportunity or a reason to step back further.
What’s driving Bitcoin’s latest slide?
Bitcoin’s drawdown is being driven by macro forces that sit far outside the blockchain. Japan’s government bond market has jolted higher, with 10-year yields surging towards 1.84–1.85% and two-year yields touching 1% for the first time since 2008 after Bank of Japan Governor Kazuo Ueda signalled a possible rate hike at the 18–19 December meeting.
That shift threatens to unwind the yen carry trade, where investors have borrowed cheaply in yen for decades and deployed capital into higher-yielding assets worldwide, including US bonds, equities and crypto. According to analysts, as Japanese yields rise and the yen strengthens, those trades become more expensive to sustain, forcing capital back home and reducing global liquidity.
Crypto sits at the sharp end of that adjustment. Over the last major leg down, total market capitalisation dropped by roughly 5% in 24 hours, with Bitcoin and Ethereum both sliding over 5%. Thousands of traders were liquidated as some $600–$640 million in leveraged positions were wiped out.
The immediate trigger was a break of support around the high $80,000s, which triggered stop-loss orders and margin calls on overextended long positions. The result was not a slow fade but a cascade: macro stress hit Japanese bonds, risk sentiment cracked, and leverage in the crypto complex did the rest.
Why it matters
As per experts, this episode is significant because it confirms Bitcoin's position in the global hierarchy of assets. Despite talk of “digital gold”, the market continues to treat BTC as a high-beta macro trade, extremely sensitive to shifts in liquidity and funding costs. When traditional markets move into “risk-off” mode, crypto is one of the first places investors reduce exposure.
The current sell-off is unfolding alongside growing concerns about US fiscal sustainability, record Treasury issuance, and the end of ultra-loose Japanese policy, which together signal that the post-2008 era of cheap leverage is being repriced.
It also lays bare the limits of the new institutional architecture around Bitcoin. Reports indicate that spot ETFs in the United States, which were hailed as the bridge between crypto and mainstream finance, have just recorded their worst month since launch, with around $3.5 billion in net outflows and repeated days of heavy redemptions.

The flagship IBIT fund alone saw withdrawals exceeding $500 million on its worst single day and more than $2.4 billion over the month, despite remaining one of the most successful ETFs globally in terms of assets and fees. That suggests institutional capital is willing to exit quickly when macro conditions turn, even if it remains structurally interested in Bitcoin over the long run.
Impact on markets, industry and investors
The ETF complex sits at the heart of how this correction is being transmitted. Analysts report that after months of near-constant inflows, the tide has turned: five straight weeks of net redemptions in November, a single day with roughly $900 million heading for the exits, and a notable change in tone from “buy every dip” to “wait for clarity”.
Bitcoin ETFs still hold over $70 billion in assets and represent a significant share of the total supply, so when they move in one direction for several weeks, they significantly influence price discovery, extending far beyond crypto-native exchanges.
The pressure is broad but uneven across the digital-asset space. Spot Ether ETFs registered around $1.4 billion in outflows over the month, marking their weakest stretch on record, while Solana products experienced more than 20 days of inflows before a new ETF launch led to a sizable single-day withdrawal. XRP vehicles, by contrast, have yet to see any net outflows and have accumulated hundreds of millions in fresh capital, whereas Dogecoin products have disappointed with muted debut volumes. The pattern suggests investors are becoming more selective, rotating away from crowded trades and towards assets perceived as having stronger or cleaner narratives.
On the trading side, the absence of aggressive dip-buyers has been striking. In prior corrections, lower prices were quickly met with demand from both retail and institutional desks eager to “buy the blood”. This time, nervousness ahead of key US data, Federal Reserve communication and the Bank of Japan’s meeting has kept many on the sidelines. With fewer standing bids under the market, leveraged positions have been unwound more violently. That has turned Bitcoin’s usual volatility into something closer to a macro shock absorber for the entire crypto complex.
Expert outlook
Analysts are divided on whether this marks the start of a true crypto winter or a severe shakeout within an ongoing cycle. On one side is the argument that Bitcoin’s surge above $120,000 was always stretched, fuelled by easy liquidity, ETF hype and a reach for yield in a world still adjusting to higher rates.
From that perspective, a 30% pullback that resets froth and flushes out leverage is not unusual within a broader bull market, especially for an asset as volatile as BTC. The $80,000–$85,000 band now stands out as a key support zone; if it holds and macro conditions stabilise, the recent drop may be remembered as a sharp correction rather than the start of a bear market.
The more bearish camp focuses on the structural shift in global funding. If the Bank of Japan continues to raise rates and the yen carry trade unwinds more broadly, liquidity could tighten across risk assets for longer than crypto bulls expect, according to analysts. Combined with heavy US debt issuance, a slowing Chinese economy and more cautious central banks, that scenario would leave less room for speculative excess across the board. In that world, Bitcoin might need to reprice to a level that reflects not just its supply schedule and adoption, but also a higher global cost of capital.
What both sides acknowledge is that the days of free money are over. The post-2008 bond bull market, where yields ground lower and leverage got cheaper year after year, looks to have ended. For Bitcoin, that creates a tension between its narrative and its behaviour. It still aspires to be a hedge against inflation and monetary debasement, yet in practice it trades like an amplified expression of risk sentiment. The next year will reveal whether institutional holders are prepared to keep allocating through a choppier macro regime, or whether they treat BTC as just another trade to exit when the cost of carry rises.
Bitcoin technical insights
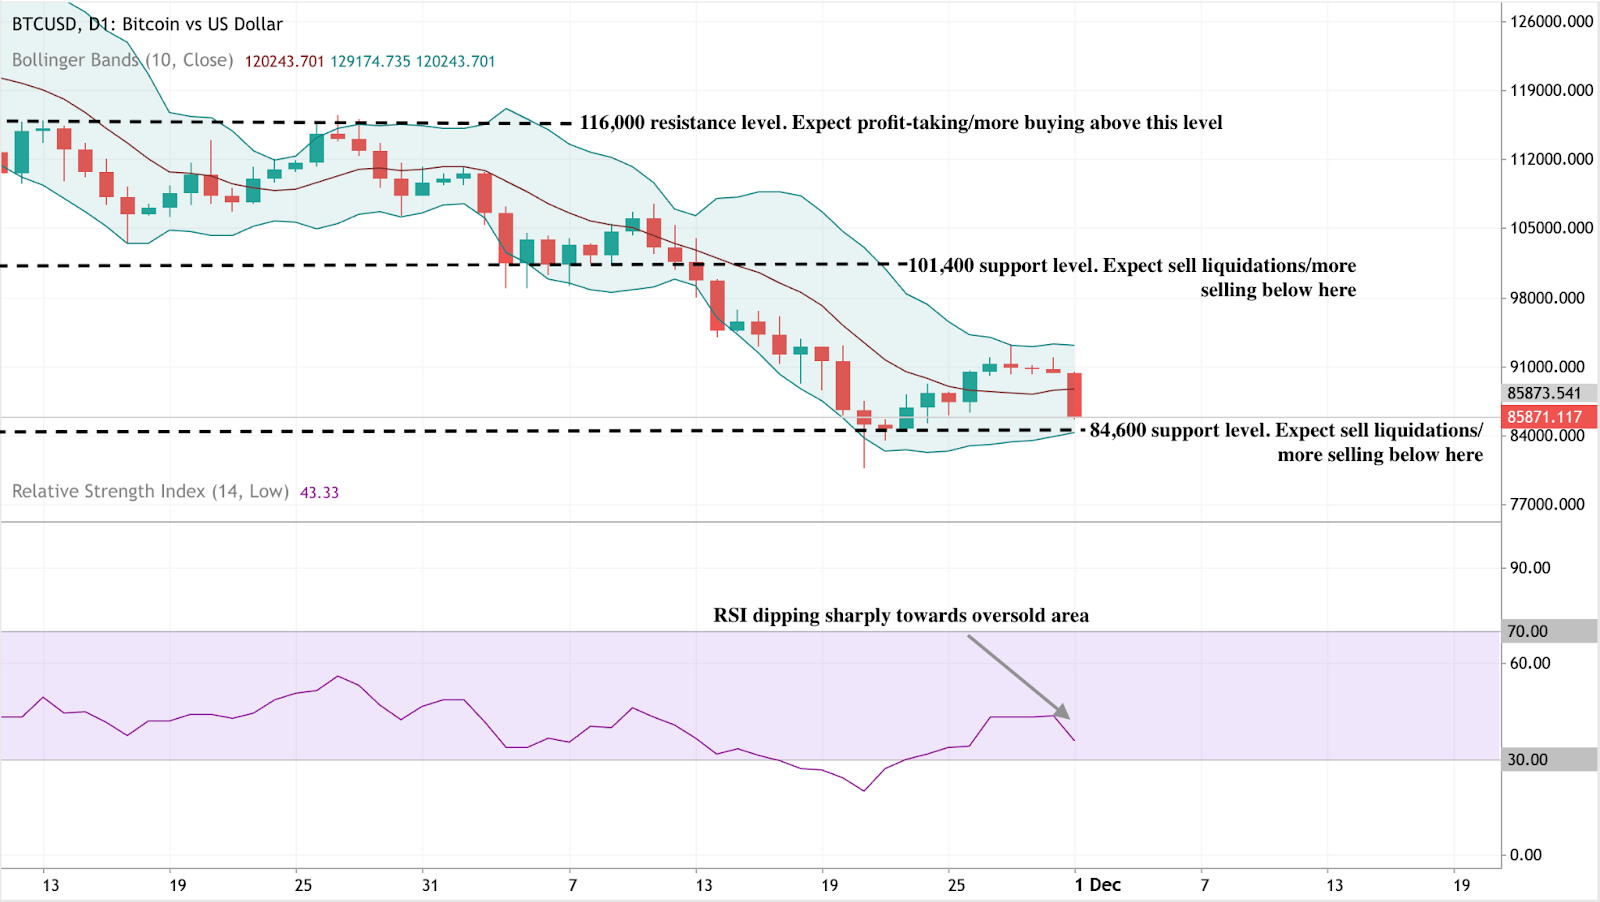
At the start of writing, Bitcoin (BTC/USD) has slipped back toward $85,800, losing momentum after a brief stabilisation phase. The immediate downside focus remains on the key $84,600 support zone - a level where a break could trigger sell liquidations and open the door to deeper declines. Above price, the next major thresholds sit at $101,400 and $116,000, where any recovery rally is likely to encounter profit-taking or renewed buying interest.
Price continues to track the lower Bollinger Band, reflecting persistent bearish pressure and a market still struggling to regain directional strength. Until BTC can reclaim the mid-band and hold above it, the broader trend remains tilted downward.
The RSI has dipped sharply to around 43, reversing from an earlier bounce and sliding back toward the oversold region. This shift signals a weakening of momentum and suggests that sellers remain in control. While oversold conditions could eventually attract bargain hunters, the current setup still favours caution as Bitcoin tests critical support.
Key takeaway
Bitcoin’s slide below $87,000 feels ominous, but it looks more like a violent macro-driven reset than a clear confirmation that a fresh crypto winter has begun. The move has been driven by rising Japanese yields, a tentative end to the yen carry era, heavy ETF outflows and cascading liquidations, not a loss of faith in the underlying technology. Whether this evolves into a deeper, longer downturn will depend on how far global funding costs rise and how institutions react to a world where money is no longer free. For now, the market is caught between two stories: a maturing asset adapting to a harsher macro climate, and a familiar boom-and-bust cycle that still has another chapter to write.

Kwa nini dhahabu na fedha zinavunja rekodi mwaka 2025
Dhahabu na fedha zinavunja rekodi mwaka 2025 kwa sababu mahitaji ya kimuundo, mabadiliko ya sera, na uhaba halisi vimetokea kwa wakati mmoja.
Dhahabu na fedha zinavunja rekodi mwaka 2025 kwa sababu mahitaji ya kimuundo, mabadiliko ya sera, na uhaba halisi vimetokea kwa wakati mmoja, na kusukuma metali zote mbili kufikia viwango vya juu vya wakati wote. Dhahabu imepanda karibu 60% mwaka huu na kufanya biashara karibu $4,200 kwa aunsi, baada ya kushuka chini ya $4,000 mwishoni mwa Oktoba/mapema Novemba. 4000 imekuwa sakafu ya bei kisaikolojia katikati ya Novemba. Wakati wa kuandika, dhahabu inafanya biashara katika kiwango cha 4200. Wakati fedha imeongezeka karibu mara mbili katika miezi 11, ikipanda hadi viwango vipya karibu $56. Hatua hizi sio milipuko ya kubahatisha - zinaonyesha nguvu kubwa zinazopishana zinazounda upya masoko ya kimataifa.
Hatua ya mabadiliko kwa metali za thamani
Utendaji huu wa hali ya juu umekuwa lengo kuu katika masoko ya fedha mwaka 2025, hasa kwa tofauti kubwa na utendaji wa kihistoria. Benki kuu zinaongeza kasi ya ubadilishaji wa akiba, wakati watengenezaji wanaotumia fedha kama malighafi wanashindania usambazaji mdogo wa kifizikia. Wawekezaji wanajiweka sawa kwa ulimwengu ambapo kupunguzwa kwa viwango vya riba kunarudi na mshtuko wa kijiografia na kisiasa unaendelea. Kuelewa mabadiliko haya ni muhimu kuona wapi dhahabu na fedha zinaweza kuelekea baadaye - na nini kupanda kwao kunaashiria kuhusu hali ya uchumi wa dunia.
Nini kinachochochea kupanda kwa dhahabu na fedha
Kupanda kwa dhahabu mwaka 2025 kunategemea misingi iliyojengwa kwa miaka kadhaa. Ununuzi wa benki kuu umekuwa kichocheo kikubwa cha mahitaji katika miezi ya hivi karibuni. Katika miezi 11 iliyopita, dhahabu imerekodi mapato chanya katika miezi 10, ikisaidia bei za papo hapo kupanda zaidi ya 60% na kuweka metali hiyo kwenye njia ya utendaji wake bora wa kila mwaka katika karibu nusu karne. Hii sio povu la kubahatisha bali ni bima ya muda mrefu ya kwingineko dhidi ya kuyumba kwa sarafu, hatari ya vikwazo na kuongezeka kwa matatizo ya kifedha.
Maendeleo katika mapato ya Treasury pia yamekuwa kichocheo kikuu. Matarajio ya kupunguzwa zaidi kwa viwango vya riba kutoka Federal Reserve ya Marekani na benki nyingine kuu yamesukuma mapato halisi chini, kudhoofisha dola na kufanya mali zisizo na mapato, kama vile dhahabu, kuvutia zaidi.
Wawekezaji wanaotafuta kujikinga dhidi ya mfumuko wa bei sugu, kuongezeka kwa nakisi na soko la hisa lililojikita kupita kiasi wanapata nanga chache za kuaminika. Dhahabu, ambayo inabaki juu ya alama muhimu kisaikolojia ya $4,000, inajithibitisha tena kama kinga rahisi zaidi dhidi ya picha ngumu ya kiuchumi.
Mkutano wa fedha unaochochewa na uhaba
Hadithi ya fedha, ingawa imeunganishwa na mkutano wa metali ya thamani ya dhahabu, ina hadithi tofauti. Katika miezi 11 tu, metali hiyo imepata takriban 94%, huku bei zikifikia rekodi za juu za karibu $56.60 kwa aunsi.

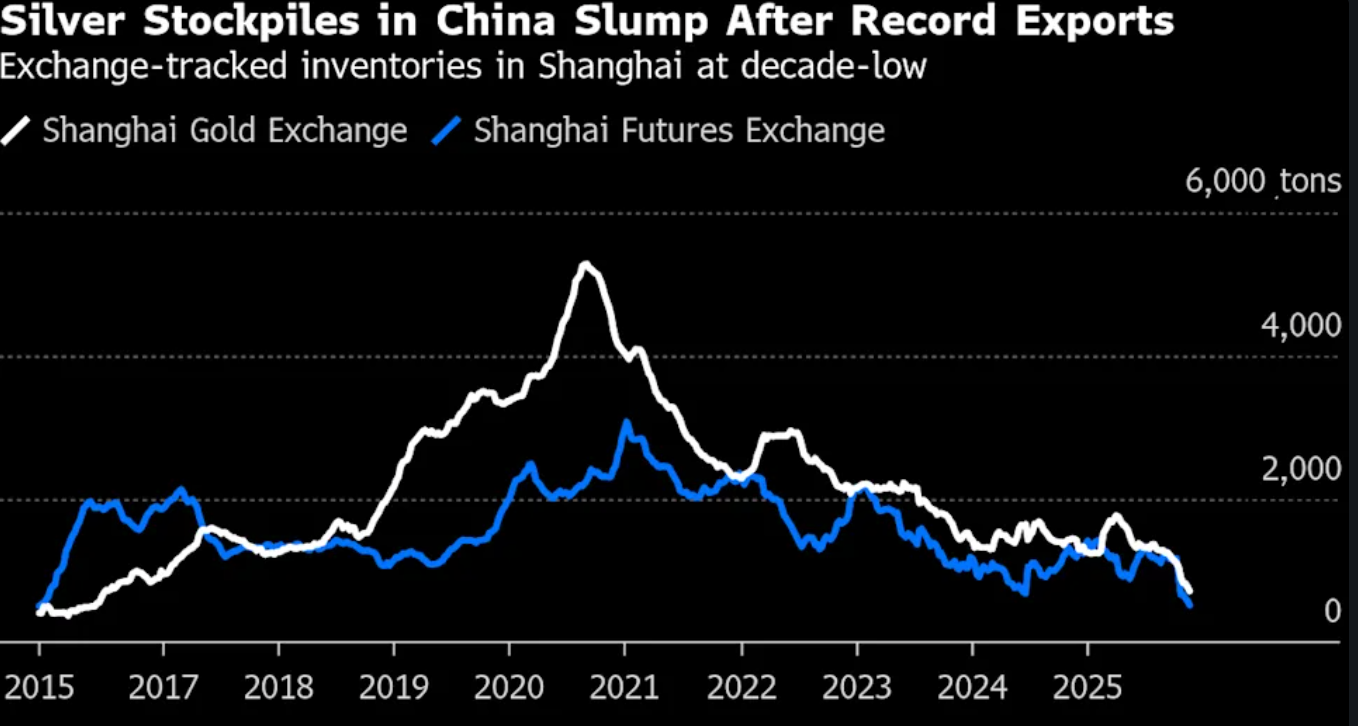
Kupanda kwa fedha kumeunganishwa na mahitaji ya kiviwanda ambayo yamekua kwa kasi kuliko usambazaji kwa miaka kadhaa. Orodha ya hifadhi za London imepungua kutoka takriban tani 31,000 katikati ya 2022 hadi karibu tani 22,000 mapema 2025. Mnamo Oktoba, viwango vya kukodisha vya usiku kucha vilipanda hadi sawa na 200% kwa mwaka wakati wafanyabiashara walipohangaika kupata metali - ishara tosha ya msongo wa soko. Hali ya London inafanana na ya China, kwani nchi hiyo pia iliona umiliki wake ukipungua, huku mauzo ya nje yakifikia rekodi ya juu ya tani 660.
Wakati huo huo, kuongezeka kwa ununuzi wa msimu nchini India na nguvu inayoendelea katika utengenezaji wa nishati ya jua, vifaa vya elektroniki na EV kumechukua kiasi kikubwa cha metali halisi. Wakati wafanyabiashara wanapoanza kutumia usafiri wa anga ili kukidhi makataa ya uwasilishaji, inaashiria sio furaha iliyopitiliza bali uhaba.
Kwa nini ni muhimu
Kupanda kwa rekodi kwa dhahabu na fedha kunawasukuma wawekezaji kutathmini upya mawazo yao kuhusu usalama, ubadilishaji, na thamani. Baada ya muongo ambapo dhamana za serikali na hisa za teknolojia za Marekani zilitawala mazungumzo juu ya maeneo salama, metali za thamani zinarudi katika jukumu zilizocheza wakati wa mizunguko ya awali ya mvutano wa kijiografia na kisiasa na msongo wa kifedha. Kama UBS ilivyobainisha, “kuendelea kudhoofika kwa dola, mapato halisi ya chini na hatari inayoendelea ya kijiografia na kisiasa” kumeifanya dhahabu kuvutia hata wakati wa mabadiliko mafupi ya matumaini ya soko.
Kwa watunga sera, mkutano huo una ujumbe wa wazi: imani katika nidhamu ya kifedha na sera ya fedha ya muda mrefu inapungua. Kupanda kwa dhahabu kuelekea $4,400 kunaashiria wasiwasi kuhusu nakisi, kushuka kwa thamani ya sarafu na athari za miaka ya kurahisisha kiasi (quantitative easing). Benki kuu zenyewe zinaongeza akiba zao za dhahabu huku zikijitolea hadharani kwa malengo ya mfumuko wa bei - utata ambao masoko hayajapuuza. Kupanda kwa fedha kuna athari kwa kundi tofauti la wadau, kutoka kwa watengenezaji wa nishati mbadala hadi makampuni ya elektroniki, ambao wote wanategemea uwezo wa metali hiyo wa kupitisha umeme na matumizi ya kiviwanda yasiyo na kifani.
Utendaji bora wa fedha ni muhimu hasa kwa uchumi unaoibukia kama India, ambapo fedha halisi inabaki kuwa njia inayopendekezwa ya kuweka akiba kwa kaya. Mahitaji yanayohusiana na mila za kitamaduni, mizunguko ya mapato ya kilimo na misimu ya sherehe yameongezeka wakati usambazaji wa kimataifa unapoimarika. Shinikizo hilo limesukuma bei za ndani kufikia rekodi za juu, na kufanya fedha kuwa kimbilio salama na chanzo cha msongo wa kifedha.
Athari kwa masoko, viwanda na watumiaji
Masoko ya fedha tayari yanahisi athari za utawala huu mpya wa metali za thamani. Uwiano wa dhahabu-fedha, ambao ulianza mwaka 2025 juu ya 100, sasa umeshuka hadi karibu 75 wakati fedha inapoipita dhahabu kwa asilimia.
Uwiano bado uko juu ya wastani wake wa muda mrefu karibu 70, ikipendekeza nafasi inayoendelea kwa fedha kupata faida ikiwa dhahabu itatulia. Mabadiliko haya yamegeuza uwiano wenyewe kuwa ishara ya soko - kipimo cha jinsi wawekezaji wanavyozunguka kwa ukali katika kinga za beta ya juu.
Mtiririko wa ETF na masoko ya hatima (futures) yamezidisha hatua hizi. Wakati bei za papo hapo zinapopanda, ETF zinavutia mapato yanayoendeshwa na kasi, wakati nafasi za hatima zilizokopwa zinakuza kila ongezeko na marekebisho. Fedha inakabiliwa zaidi na mabadiliko makali kwa sababu soko la msingi ni dogo na nyeti zaidi kwa ufilisi wa lazima. Kwa wawekezaji wa rejareja, hii inaunda mchanganyiko wa fursa na hatari: fedha inaweza kutoa faida kubwa katika soko lenye nguvu lakini inaweza kupungua haraka wakati hisia zinapogeuka.
Uchumi wa viwanda unakabiliwa na shinikizo la moja kwa moja zaidi. Mahitaji ya fedha duniani kwa matumizi ya kiviwanda yaliongezeka hadi takriban aunsi milioni 680.5 mwaka 2024, kutoka karibu milioni 644 mwaka mmoja kabla. Uzalishaji wa paneli za jua pekee ulitumia makadirio ya aunsi milioni 244 - zaidi ya mara mbili ya viwango vya 2020. Pamoja na Shirika la Nishati la Kimataifa kukadiria gigawati 4,000 za uwezo mpya wa jua ifikapo 2030, mahitaji yanaweza kuongezeka kwa aunsi nyingine milioni 150 kila mwaka.
Magari ya umeme (EVs) yanaongeza mkazo zaidi. EV za sasa zinatumia gramu 25–50 za fedha kila moja, lakini miundo inayoweza kutokea ya betri za hali imara inaweza kuhitaji hadi kilo moja ya fedha kwa kila gari. Ikijumuishwa na ukuaji wa AI, semiconductor, na miundombinu ya vituo vya data, hii inaunda mahitaji endelevu wakati ambapo usambazaji wa migodi duniani umekuwa ukipungua kwa karibu muongo mmoja.
Watumiaji wanapata uzoefu huu kwa njia mbili. Kupanda kwa gharama za pembejeo kunaweza kutafsiriwa kuwa usakinishaji wa gharama kubwa zaidi wa nishati ya jua, magari ya umeme na vifaa vya elektroniki. Wakati huo huo, kaya katika masoko muhimu, kama vile India, zinaendelea kuona fedha kama hifadhi ya thamani inayoaminika. Bei huko zilifikia rupia 170,415 kwa kilo mnamo Oktoba, ongezeko la 85% tangu kuanza kwa mwaka - ishara ya imani na mzigo kwa wanunuzi.
Mtazamo wa wataalamu
Benki nyingi kuu sasa zinakusanya utabiri wao wa dhahabu wa 2026 kati ya $4,000 na $4,600. Deutsche Bank hivi karibuni ilipandisha makadirio yake ya wastani ya 2026 hadi karibu $4,450 na kuelezea kiwango cha biashara kati ya $3,950 na $4,950. Goldman Sachs inaona “karibu 20% ya ongezeko zaidi” kutoka viwango vya sasa, ikimaanisha njia kuelekea takriban $4,900 kwa aunsi mwishoni mwa 2026 ikiwa ununuzi wa benki kuu utaendelea na dola kudhoofika. Bank of America, HSBC, na Société Générale zote zinachukulia $5,000 kama lengo la kweli la juu.
Taasisi zenye tahadhari zaidi zinatarajia mkutano huo kutulia badala ya kuendelea. Benki ya Dunia inaonya kwamba, baada ya faida ya takriban 40% inayoendeshwa na uwekezaji mwaka 2025, bei za metali za thamani zinaweza kupanda kwa kiasi kidogo tu mwaka 2026, zikiakisi uimarishaji badala ya kuongeza kasi. Chini ya hali hii, dhahabu ingefanya biashara kwa upande katika anuwai pana, na fedha ingetulia katika viwango vya juu lakini visivyo na mabadiliko makali wakati usambazaji unapoitikia hatua kwa hatua.
Mtazamo wa fedha unabaki kuwa na mabadiliko zaidi kwa sababu ya jukumu lake mbili kama metali ya thamani na ya kiviwanda. Wachambuzi wanatarajia soko kubaki katika nakisi kwa mwaka wa tano mfululizo, lakini ukubwa mdogo wa fedha na unyeti mkubwa kwa mtiririko uliokopwa unaweza kusababisha kurudi nyuma kwa kasi ikiwa kupunguzwa kwa viwango kutakatisha tamaa au dola kuimarika. Kama Paul Syms wa Invesco alivyona, msukumo wa usambazaji wa mwaka huu “uliwashangaza wawekezaji wachache”, na fedha mara chache hurudia mwelekeo bila kupima pande zote mbili kwanza.
Katika metali zote mbili, vichocheo vinavyofuata ni wazi: mkutano wa Desemba wa Federal Reserve, utabiri mpya wa ukuaji wa dunia, na data mpya za akiba za benki kuu. Hizi zitaamua ikiwa hali za kifedha zitaendelea kurahisishwa hadi 2026 au ikiwa masoko yataanza kufungua baadhi ya biashara zenye nguvu zaidi za mwaka.
Jambo kuu la kuzingatia
Dhahabu na fedha zinavunja rekodi mwaka 2025 kwa sababu mahitaji ya kimataifa yanaongezeka wakati usambazaji unajitahidi kwenda sambamba. Benki kuu zinatafuta kinga dhidi ya hatari za kifedha na kijiografia, wawekezaji wanatamani uaminifu katikati ya kutokuwa na uhakika wa sera, na viwanda vinahitaji metali zinazoendesha mabadiliko ya nishati. Shinikizo hizi zimegongana na kuunda moja ya mikutano yenye nguvu zaidi ya metali za thamani katika miongo kadhaa. Sura inayofuata inategemea maamuzi ya viwango vya riba, mwelekeo wa mahitaji ya kiviwanda na uimara wa ununuzi wa benki kuu wakati dunia inapoingia 2026.
Ufahamu wa kiufundi wa Fedha
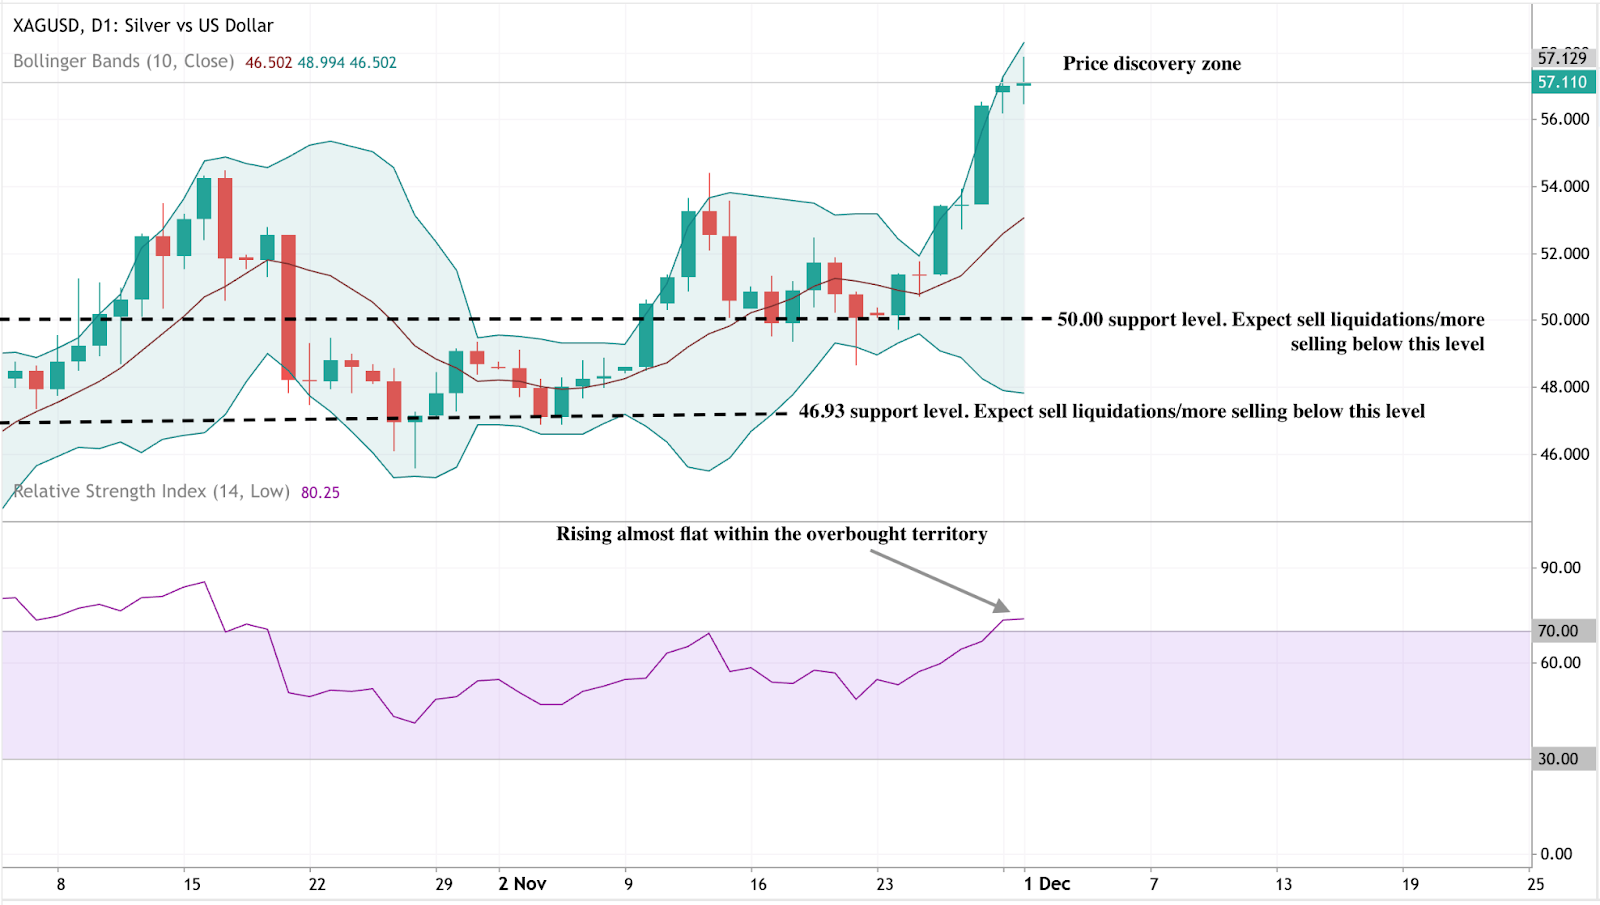
Mwanzoni mwa uandishi, Fedha (XAG/USD) imepanda hadi eneo la ugunduzi wa bei, ikifanya biashara juu ya $57 baada ya mlipuko mkali kutoka kwa uimarishaji. Hatua hiyo inaashiria ushawishi mkubwa wa kupanda kwa bei, na kasi ikibeba bei mbali zaidi ya anuwai ya awali. Viwango vya usaidizi vya mara moja sasa viko $50.00 na $46.93, viwango ambapo kurudi nyuma kunaweza kusababisha ufilisi wa kuuza na shinikizo la kina la kurekebisha ikiwa vitavunjwa.
Bei inabaki imepanuliwa kando ya Bollinger Band ya juu, ikiakisi maslahi makali ya ununuzi na soko linaloelekea kwa nguvu kwa upande wa wanunuzi. Kuzama kote kuelekea bendi ya kati kunaweza kutumika kama jaribio la kwanza la nguvu ya mwelekeo.
RSI inashikilia karibu 80, ikipanda lakini karibu tambarare ndani ya eneo la kununuliwa kupita kiasi. Hii inaonyesha wanunuzi wanabaki na udhibiti thabiti, lakini hatari ya kupoa kwa muda mfupi au uimarishaji wa upande inaongezeka. Wakati mwelekeo mpana uko juu kwa uamuzi, hali zilizopanuliwa kupita kiasi zinamaanisha wafanyabiashara wanapaswa kuangalia ishara za uchovu wakati fedha inapopita viwango vya juu visivyojulikana.

EUR/USD outlook: The dollar’s rate-cut reckoning
What began as a quiet Thanksgiving week has turned into the dollar’s steepest weekly decline in four months.
According to reports, the dollar’s rate-cut reckoning is now the defining force in EUR/USD, with traders pushing expectations for a December Federal Reserve cut to more than 85%, up sharply from 39% just a week earlier. What began as a quiet Thanksgiving week has turned into the dollar’s steepest weekly decline in four months, reshaping the balance of power across major currency pairs.
EUR/USD is rising not because the euro has rediscovered its strength, but because the dollar is losing the policy advantage it has enjoyed for most of the year. As markets confront the prospect of a softer Fed and political pressure on the institution intensifies, the pair is becoming a barometer for how much credibility the central bank is willing to risk in the months ahead.
What’s driving EUR/USD right now?
The Fed sits squarely at the centre of the story. Rate expectations have shifted at a pace not seen since early summer, with futures markets now assuming a December cut as the most likely outcome. Reuters reported a series of softer labour market indicators, dovish public remarks from key policymakers, and increased speculation around Kevin Hassett’s potential nomination as the next Fed Chair have accelerated the move. Thin U.S. liquidity over the Thanksgiving holiday added fuel, allowing even modest data points to push the dollar lower.
This recalibration has allowed EUR/USD to climb despite Europe’s mixed economic backdrop. The dollar index, still hovering near 99.72, is heading for its worst weekly performance since late July.

The euro briefly touched a 1½-week high of $1.1613 before easing, supported more by dollar fatigue than by renewed optimism in the eurozone. Even so, the narrowing of U.S.–European rate differentials has created space for euro bulls to test higher levels, something that looked unlikely just two weeks ago.
Why the dollar is facing its own reckoning
Political pressure is becoming an increasingly prominent part of the narrative. President Donald Trump has renewed calls for deeper rate cuts, arguing that the Fed must “move quickly” to support economic momentum.
The possibility that Kevin Hassett - a prominent advocate of looser policy - could become the next Fed Chair has forced traders to reassess the institution’s independence and long-term trajectory. Markets are now questioning whether December’s cut is simply another precaution or the start of a strategically driven easing cycle.
At the macro level, the dollar’s credibility premium is also being tested. Barclays’ global head of FX strategy, Themos Fiotakis, argued that Europe had benefited in recent months from supportive rate differentials and improving sentiment, but warned that these assumptions are now under reassessment. The euro’s valuation remains high by several metrics, while the U.S. economy continues to show pockets of resilience, particularly in services. The dollar’s decline, therefore, reflects less a loss of faith and more a repricing of what the next policymaking regime might look like.
What this means for EUR/USD traders
Positioning in EUR/USD has turned decisively constructive, according to analysts. With holiday-thinned liquidity amplifying moves, traders have been quick to unwind long-USD positions accumulated during the autumn rally. The shift has also been visible in cross-asset markets: U.S. 10-year Treasury yields briefly dipped below 4% before rebounding, while German bunds held steady, creating a more supportive environment for the euro.

For corporates, the recalibration matters. European exporters face a marginally stronger currency, which could tighten their margins if the trend persists, while importers benefit from reduced dollar-denominated costs. For investors, the EUR/USD is becoming a call on relative credibility: whether the Fed’s pivot is justified by economic factors or shaped by politics - and whether the European Central Bank can maintain stability as global conditions change.
The geopolitical backdrop adds another layer, analysts added. Markets are tracking every incremental update on Ukraine peace negotiations, with Vladimir Putin signalling that draft proposals could form the basis of future talks. While analysts caution against expecting a rapid “peace premium”, even the possibility of de-escalation has helped cap dollar demand against the euro.
Expert outlook
In the near term, market watchers stated the EUR/USD will remain closely tied to U.S. policy signals. A confirmed December rate cut, reinforced by dovish messaging, could send the pair back toward 1.17. But any upside surprise in U.S. labour or inflation data would temper enthusiasm and reintroduce volatility, particularly for leveraged positions - something traders often evaluate beforehand using the Deriv trading calculator to manage risk.
Medium-term dynamics remain more uncertain. The eurozone continues to wrestle with uneven growth and limited fiscal momentum, which could limit the sustainability of any rally built solely on dollar weakness. At the same time, bond markets remain a crucial indicator: if the U.S. 10-year yield breaks back above 4.1%, the dollar could regain some cyclically driven strength, according to experts.
The next trigger may come from a combination of Fed rhetoric, incoming U.S. data, and developments in Eastern Europe, all of which have the potential to redirect EUR/USD in the weeks ahead.
EUR/USD technical insights
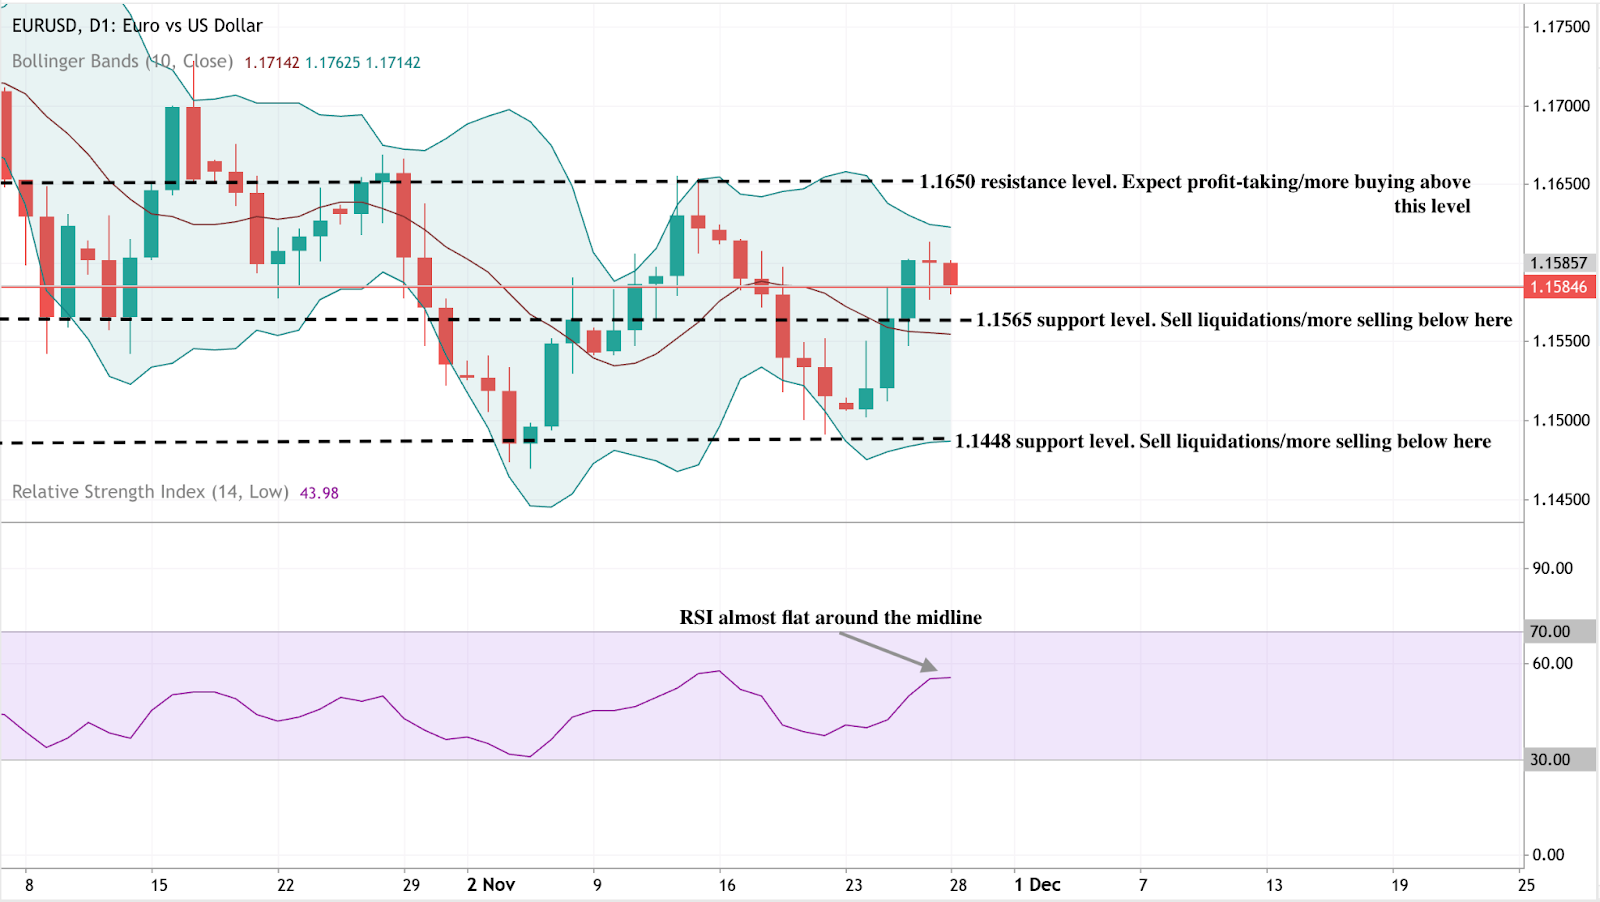
At the start of writing, EUR/USD is trading near 1.1585, moving sideways within a well-defined range. The pair continues to face overhead pressure from the 1.1650 resistance level, where traders may look for profit-taking or renewed buying if the price can break convincingly above it. On the downside, the first key support level sits at 1.1565, followed by a stronger base at 1.1448. A break below either level is likely to trigger sell liquidations and deeper downside momentum.
The price remains contained within the Bollinger Bands, indicating a market lacking strong directional conviction. This consolidative structure suggests EUR/USD may continue chopping within the range unless a macro catalyst - such as ECB or Fed commentary - forces a breakout.
The RSI is nearly flat, sitting around 44, close to the midline and signalling neutral momentum. Neither bulls nor bears currently dominate, reinforcing the idea that the pair is in a holding pattern while awaiting its next decisive move.
Key takeaway
EUR/USD is climbing because the dollar is undergoing a policy reckoning shaped by rapid shifts in rate expectations and rising political influence. The euro may not have a strong domestic story, but the repricing of U.S. monetary credibility has given it new momentum. The next leg depends on the Fed's decision in December, U.S. Treasury yields, and geopolitical developments. Traders on Deriv MT5 will closely watch those catalysts as they adjust their strategies.
Samahani, hatukuweza kupata matokeo yoyote yanayofanana na .
Tafuta vidokezo:
- Tafadhali angalia tahajia yako na ujaribu tena
- Jaribu neno lingine