Results for

Exploring the Oscar’s Grind strategy in Deriv Bot
Explore Oscar's Grind, a low-risk strategy, and how to implement it in Deriv Bot for automated trading, as well as effective risk management.
This article was updated on 17 January 2024
The Oscar's Grind strategy is designed to potentially gain a modest yet steady profit in each trading session. This strategy splits trades into sessions and has three principles.
Trade parameters
- Initial stake: The amount you pay to enter a trade.
- Profit threshold: The bot will stop trading if your total profit exceeds this amount.
- Loss threshold: The bot will stop trading if your total loss exceeds this amount.

Principle 1: The strategy aims to potentially make one unit of profit per session
The table above demonstrates this principle by showing that when a successful trade occurs and meets the target of one unit of potential profit, which is 1 USD in this example, the session ends. If trading continues, a new session will begin.
Principle 2: The stake only increases when a loss trade is followed by a successful trade
The table illustrates this principle in the second session. After a trade resulting in a loss in round 4, followed by a successful trade in round 5, the stake will increase to 2 USD for round 6. This is in line with the strategy’s rule of raising the stake only after a loss is followed by a successful trade.
Principle 3: The stake adjusts to the gap size between the current loss and the target profit for the session.
In round 7, the stake is adjusted downwards from 2 USD to 1 USD, to meet the target profit of 1 USD.
The stake adjustment: target session profit (1 USD) - current session profit (0 USD) = 1 USD
The second session concludes upon reaching the aim of one unit of potential profit per session, equivalent to 1 USD. If trading continues, a new session will commence again.
Profit and loss thresholds
With Deriv Bot, traders can set the profit and loss thresholds to secure potential profits and limit potential losses. This means the trading bot will automatically stop when the profit or loss threshold is reached. This form of risk management can potentially boost successful trades whilst limiting the impact of loss. For example, if a trader sets the profit threshold at 100 USD and the strategy exceeds 100 USD of profit from all trades, then the bot will stop running.
Summary
The Oscar's Grind strategy provides a disciplined approach for incremental gains through systematic stake progression. When integrated into Deriv Bot with proper risk management, like profit or loss thresholds, it offers traders a potentially powerful automated trading technique. However, traders should thoroughly assess their risk tolerance and try trading on a demo account to familiarise themselves with the strategy before trading with real funds.

Exploring the D’Alembert strategy in Deriv Bot
Discover how to implement the D'Alembert strategy and key tips for success when applying it with Deriv Bot's automated trading features.
This article was updated on 17 January 2024
The D'Alembert strategy involves increasing your stake after a losing trade and reducing it after a successful trade by a predetermined number of units.
These are the trade parameters used for the D’Alembert strategy in Deriv Bot.
Initial stake: The amount you pay to enter a trade. The amount you are willing to place as a stake to enter a trade. In this example, we will use 1 USD.
Unit: The number of units added in the event of a trade resulting in loss or the number of units removed in the event of a trade resulting in profit. For example, if the unit is set at 2, the stake increases or decreases by two times the initial stake of 1 USD, meaning it changes by 2 USD.
Profit threshold: The bot will stop trading if your total profit exceeds this amount.
Loss threshold: The bot will stop trading if your total loss exceeds this amount.
An example of D’Alembert Strategy

- Start with the initial stake. In this example, we’ll use 1 USD.
- Set your preferred unit. In this example, it is 2 units or 2 USD.
- If the first trade results in profit, the stake for the following trade will not reduce but remain at the initial stake. The strategy minimally trades at the initial stake of 1 USD. See A1.
- If the second trade results in a loss, the Deriv Bot will automatically increase your stake for the next trade by 2 USD. Deriv Bot will continue to add 2 USD to the previous round’s stake after every losing trade. See A2.
- If the next trades are profitable, the stake for the following trade will be reduced by $2. This can be shown above where the stake of 3 USD is reduced to 1 USD. See A3.
Profit and loss thresholds
With Deriv Bot, traders can set the profit and loss thresholds to secure potential profits and limit potential losses. This means that the trading bot will automatically stop when either the profit or loss thresholds are reached. It's a form of risk management that can potentially enhance returns. For example, if a trader sets the profit threshold at 100 USD and the strategy exceeds 100 USD of profit from all trades, then the bot will stop running.
Calculating your risk
The D’Alembert strategy is less risky than Martingale, but you can still determine how long your funds will last with this strategy before trading. Simply use this formula.
B = Loss threshold
s = initial stake
R = number of rounds
f = unit increment

For instance, if you have a loss threshold (B) of 100 USD, with an initial stake (s) of 1 USD and 2 units of increment (f), the calculation would be as follows:

This means after 10 rounds of consecutive losses, the trader will lose 100 USD. This reaches the loss threshold of 100 USD, stopping the bot.
Summary
The D'Alembert system offers more balanced trading through controlled stake progression. With prudent risk management like stake limits, it can be effectively automated in Deriv Bot. However, traders should thoroughly assess their risk appetite, test strategies on a demo account to align with their trading style before trading with real money. This allows optimising the approach and striking a balance between potential gains and losses whilst managing risk.
.webp)
What is margin in forex trading?
Learn how margin works, its significance in the forex market, and how to use it wisely to maximise your trading potential.
Brokers require minimum deposits, also known as margins, to open and maintain leveraged positions.

There is an inverse, proportional relationship between the margin required and the leverage provided. For example, higher leverage means you need a smaller margin to control a larger position size.
In this guide, we’ll cover:
- What forex margin is
- How to calculate forex margin
- What a margin level is
- What a margin call is
- Trading on margin
What is forex margin?
Margin is the amount of money required to open and maintain a trade. Think of it as a loan from the broker, allowing traders to open larger positions than their account balance would normally allow. Margin acts as collateral and is typically expressed as a percentage of the total position value. Deriv’s forex margin requirements can be found in our trading specifications page.
There are 2 types of margin. Used margin is the amount of capital that is currently being used as security to sustain open positions. Free margin is the remaining amount of capital available to open new positions. For example, if your total account balance is 5,000 USD and used margin is 3,800 USD, you will have 1,200 USD free margin to open new positions.

How to calculate margin in forex
Traders can use Deriv’s forex margin calculator which is based on the formula:
Margin = (Volume x Contract size x Asset price) / Leverage
For example, let’s say you want to trade 3 lots of EUR/USD with an asset price of 1.10 USD and a leverage of 30. You will require a margin rate of 11,000 USD to open the position.
(3 x 100,000 x 1.10) / 30 = $11,000
What is a margin level?
A margin level is a measure of how much of your own money remains in your trading account compared to the amount you've borrowed from your broker for leveraged trading. It's usually expressed as a percentage and calculated as:
Margin level = (Equity / Used margin) × 100
A higher margin level indicates that you have more margin available in your account relative to the borrowed funds, which is generally considered safer. On the other hand, a lower margin level means you're using a larger portion of borrowed funds, which can increase the risk of potential losses.
What is a margin call?
A margin call serves as an alert when your margin drops below 100%, indicating a low level of equity for your trades. In response, traders should take action by either depositing additional funds into their account or closing some of their open trades. Traders can find their margin levels on the Deriv MT5 platform on the Trade tab of the Toolbox.
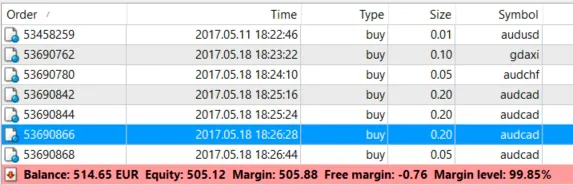
A stop-out level is a preset margin level below the call threshold. At Deriv, it is 50%. When reached, if you have several trades open, the system will start closing them one by one, starting with the trade that has the highest loss, until your margin level goes back up above 50%.
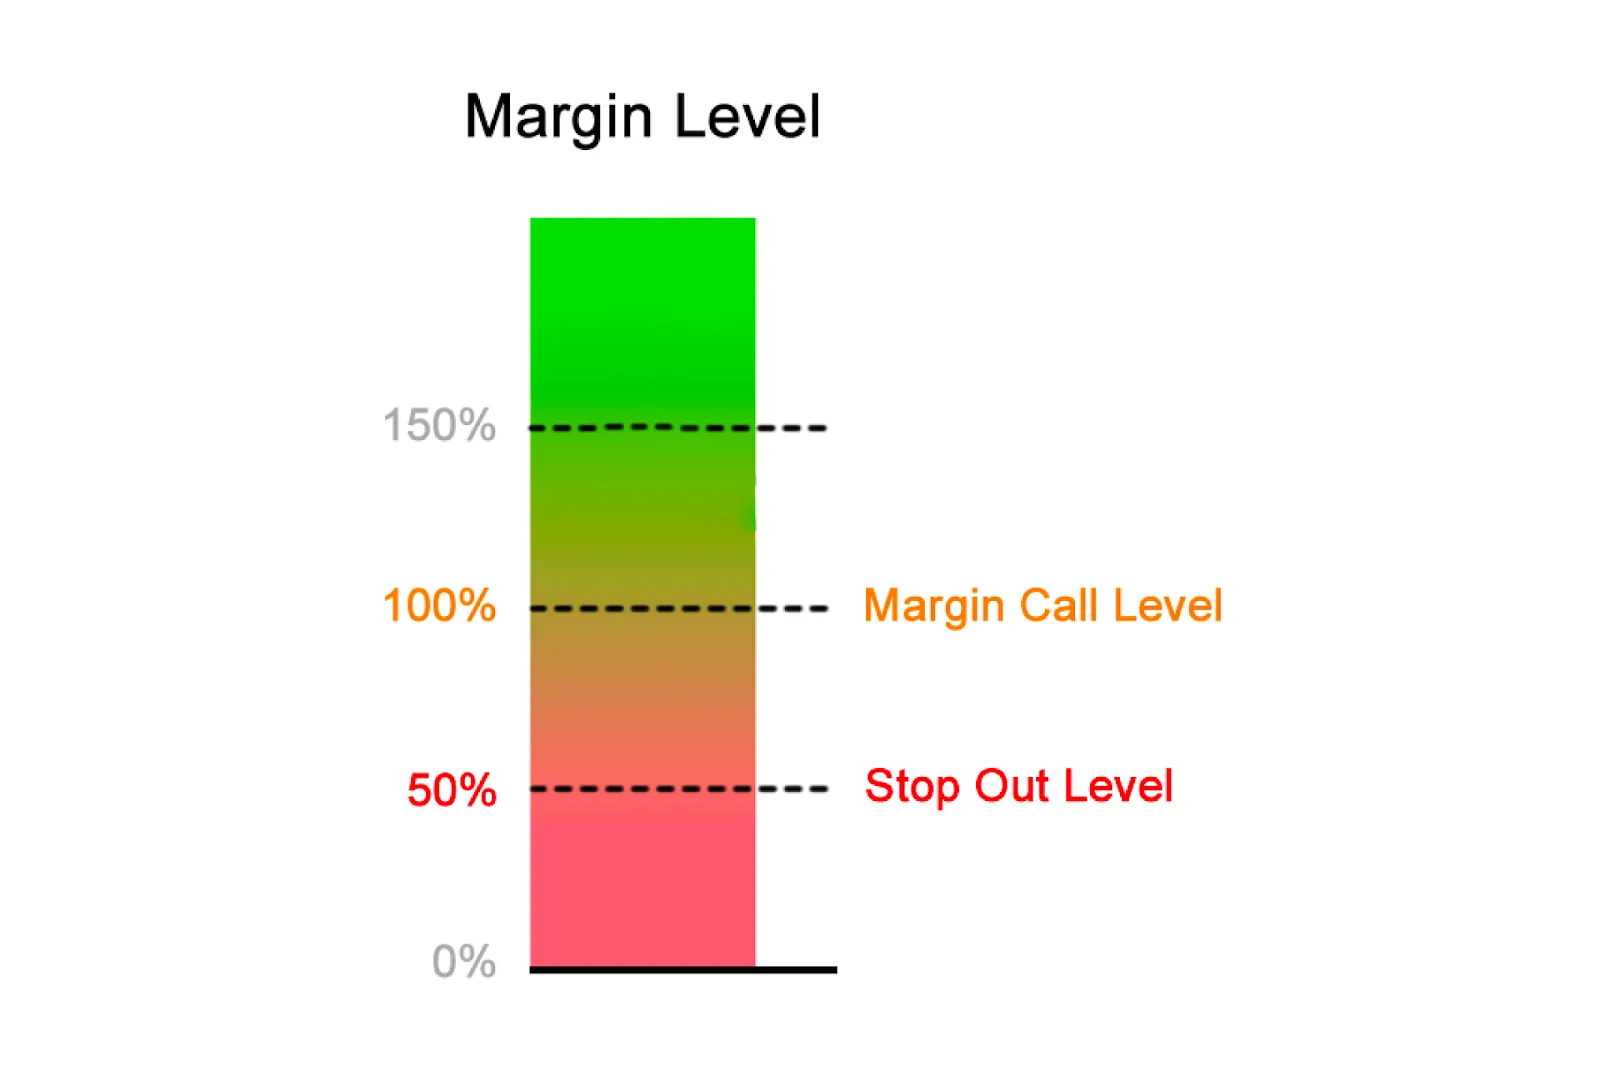
For example, if you have an account with 1,000 USD equity and you enter a trade with a margin requirement of 1,000 USD, in case the market moves against you, causing your account to drop to 500 USD or less (50% margin level), your trade will close automatically.
Trading on margin
Leverage is a double-edged sword in trading. On the one hand, it provides the ability to take on much larger market exposures than one’s capital would normally permit, vastly amplifying profit potential from favourable market movements. However, leverage also dramatically magnifies potential losses from adverse market swings.
It’s important for newer traders to respect this double-edged nature. Starting with more modest leverage while building skills will help avoid being cut by the razor’s edge. If used judiciously over time, leverage can be a tool for seasoned traders to execute strategies not otherwise possible.
Conclusion
Margin trading demands careful risk management, as leverage can amplify losses if trades don't go as planned. In the fast-paced world of trading, it's essential to monitor your margin level diligently in order to prevent margin calls and forced trade closures.
You can open a demo or real trading account with Deriv to practise trading forex with margin today.

An introduction to cTrader: Your gateway to modern trading
Experience the world of modern trading with Deriv cTrader, a comprehensive platform designed to enhance your trading journey.
Looking to step up your trading game? Meet cTrader — the sleek, customisable platform built for traders, by traders.
cTrader is a one-stop shop that uses precision tools to give you an edge. We're talking about an intuitive interface, robust charting, and advanced order flow analysis.
For traders looking for a sturdy, full-featured trading platform, cTrader is an excellent option to consider. It provides trading access to all markets offered by Deriv, including forex, indices, stocks, commodities, derived indices, and more.
In this post, we’ll provide an overview of cTrader and its key features.
What is cTrader?
cTrader is an online trading platform developed by Spotware Systems specifically for CFD trading. It offers complete charting tools, algorithmic trading, and level II pricing. cTrader aims to provide traders with transparency and control over their trading.
Some of the key features of cTrader include:
- Advanced charting tools: cTrader provides powerful charting capabilities, including a wide range of indicators, drawing tools, and timeframes. Charts can be fully customised, allowing traders to conduct in-depth technical analysis.
- Level II pricing: cTrader provides a detailed view of the order book, promoting transparency into market depth. This helps traders make better-informed decisions.
- Copy trading: Traders can connect and copy successful strategies from other strategy providers. This allows less experienced traders to replicate strategies.
- Automated trading: cTrader supports trading bots, expert advisors, and custom indicators to automate your trading.
- Comprehensive order management: cTrader provides complete control over orders with features like OCO (one-cancels-the-other) orders, market depth visualisation, and order modification/cancellation.
- Secure trading infrastructure: cTrader invests heavily in security measures like data encryption, DDoS protection, and authentication procedures.
With its focus on transparency, automation, and performance, cTrader aims to provide traders with an institutional-grade trading experience. The platform is well-suited for manual traders, algorithmic traders, and those looking to copy successful strategies.
However, it's important to remember that trading on financial markets inevitably carries risks. You can lose some or all of your invested capital if market conditions move against your positions. Always make sure you fully understand the risks and trade within your means before investing.
Overall, cTrader delivers professional-level tools for CFD trading while maintaining an intuitive user experience. The combination of advanced capabilities and ease of use makes cTrader a top choice for active traders looking for more control over their trading.
With advanced features like Level II pricing, cTrader has a lot to offer traders who are ready to step up their game. But a platform is only part of the equation — you also need the right broker behind you. That's where Deriv comes in.
Deriv cTrader – Embrace your trading potential
As an award-winning trading broker, Deriv provides tight spreads and fast execution to help you maximise cTrader and capture your best trades.
When you choose to trade on Deriv cTrader, you gain access to a diverse range of global financial markets, including forex, stocks, stock indices, commodities, ETFs, and derived indices. Moreover, our platform allows you to trade around the clock, 24/7, even on weekends and holidays, thanks to our proprietary synthetic indices.
So, if you're eager to explore all that Deriv cTrader can do for your trading, we have you covered. With Deriv cTrader's next-level technology and trusted services, you have everything you need to elevate your trading. By understanding the risks involved, trading prudently, and managing your capital responsibly, you can trade on Deriv while being aware of the potential for losses.
Practise by creating a demo account today before trading with real money and discover how Deriv cTrader can take your trading to new heights. The future of trading is here.
.webp)
Market recap: Week of 06–10 Nov 2023
Stay informed with our weekly market recap from 6th to 10th November, 2023. Get insights on the latest trends and developments in the financial world.
Taming inflation
Bloomberg: Former Treasury Secretary Lawrence Summers cautions against premature confidence in the Federal Reserve's success in taming inflation.
He notes that hasty declarations and recent market reactions suggest the battle may not be over.
Meanwhile, former Barclays CEO Bob Diamond prepares for further challenges in corporate debt, anticipating more credit issues ahead.
Gold and jobs
DoD and US Bureau of Labor Statistics and Reuters: Gold prices rose on Friday as the U.S. dollar and Treasury yields dipped following weak U.S. jobs data, reinforcing expectations that the Federal Reserve won't raise interest rates further.
Amid ongoing tension in the Israel-Hamas conflict, the U.S. Department of Defense confirmed the presence of special forces in Israel.
Nonfarm payroll employment increased by 150,000 in October, with some job gains in healthcare, government, and social assistance but a decline in manufacturing due to strikes.
The data strengthens the case for a Fed pause, supporting gold prices, according to Phillip Streible, chief market strategist at Blue Line Futures in Chicago.
UK inflation
Bloomberg and Reuters: Bank of England Chief Economist Huw Pill anticipates UK inflation aligning with global lower rates due to reduced energy costs.
He expects a "sharp further fall" in October, bringing inflation below 5% and narrowing the gap between the US and the eurozone.
Interest rate cuts may wait until mid-next year from their 15-year high.
Investor sentiment
CNBC: To sustainably push above $2,000/oz, gold may await a clearer Fed signal on potential cuts and a resurgence of ETF investors, says Heraeus Metals.
Traders are indicating a 90% chance of unchanged rates in December, per CME FedWatch.
Speculators raised net long positions in COMEX gold futures by 15,661 contracts to 106,343 in the week ending Oct. 31, according to CFTC data.
Rate hikes
The Guardian: The RBA board's decision to raise its cash rate by 25 basis points to 4.35%, marking a 12-year high, was in line with economist expectations.
This marks the 13th rate hike since May 2022.
New governor Michele Bullock and the board had consistently signalled their intention to resume rate increases if inflation didn't align with their projections.
Notably, among the big four banks, only the National Australia Bank is forecasting another rate increase, projecting a 4.6% peak in February.
US credit card debt
CNBC and Bloomberg: Recent data from the Federal Reserve Bank of New York reveals that Americans' credit card debt has reached a staggering $1.08 trillion.
In addition, credit card delinquency rates have increased.
Approximately one-tenth of credit card users are stuck in "persistent debt," where interest and fees surpass their principal payments.
The average annual percentage rate has also hit an all-time high, exceeding 20%.
Fed governor Michelle Bowman aims to use the federal funds rate to address inflation, but market sentiment suggests potential rate cuts next year.
EU recession
GBNews: The former president of the European Central Bank (ECB) has expressed concern, predicting a potential recession in the European Union (EU) by year-end. This warning comes amid the EU's challenges in recovering from the pandemic and Russia's ongoing conflict with Ukraine.
He emphasizes the need for a more unified and robust EU, encompassing foreign policy and defence capabilities alongside economic policies to ensure the union's survival. However, his prediction is more pessimistic than recent forecasts from the ECB or IMF.
Gold economics
Reuters: Gold prices retreated for a third consecutive session today, with investors closely monitoring cues from the U.S. central bank on interest rates.
According to Daniel Ghali, a commodity strategist at TD Securities, the direction of gold will be influenced by economic data and the U.S. central bank's actions. The risk premium associated with the Israel-Hamas conflict is also diminishing.
However, any escalation in the conflict could drive gold prices higher, as noted by Phillip Streible, chief market strategist at Blue Line Futures in Chicago.
Inflation
Reuters: Federal Reserve officials, including Chair Jerome Powell, expressed uncertainty about whether current interest rates are sufficient to combat inflation.
Powell noted the limited impact of supply improvements on curbing price increases.
Interim St. Louis Fed President Kathleen O’Neill Paese emphasized the ongoing economic uncertainty, stating, "It would be unwise to suggest that further rate hikes are off the table."
The stock market’s winning streak came to an end on 09 Nov 2023.
Australian economy
Wall Street Journal: The Reserve Bank of Australia raises near-term core inflation forecasts, highlighting slower-than-expected cooling of inflation pressures.
Despite passing its peak, inflation remains persistently high, exceeding earlier expectations.
The economy's unexpected resilience prompts the RBA's upward revisions in GDP growth and unemployment projections.
While soft GDP growth is anticipated, a gradual strengthening is forecasted from mid-2024, reaching around 2.25% by end-2025.
.webp)
What's expected in gold after the recent rally
Gold prices have surged recently, but will the rally last? We analyse the factors driving the latest gold market rally and if it continues.
Disclaimer: This content is not intended for EU residents.
The recent Israel-Hamas conflict sparked a gold rally, primarily driven by short-covering. The question now is whether this rally will be sustainable.
Before the Israel-Hamas War, the COT (Commitment of Traders) Report indicated that large speculators were taking short positions in the gold futures market. However, following the conflict, within just two weeks these short positions were largely covered, and there was a modest increase in long positions. Assessing how much risk premium has been factored into the price of gold is challenging. Given the ongoing situation's uncertainty, short-term speculators are likely to remain cautious and refrain from shorting gold until the situation becomes clearer.
Large speculator net holdings from COT report of Commodity Futures Trading Commission (CFTC)

Gold as a safe-haven commodity
Gold is often considered a safe haven asset; however, according to the ABN Amro report released on 10 March 2022, the reliability of gold's safe haven status is inconsistent. There are times when it behaves as a secure investment and other times it exhibits characteristics of a risk asset.
Reflecting on historical events such as the 9/11 terror attack in 2001, the Crimea war in 2014, and the Russia-Ukraine conflict in 2022, gold market experienced notable surges of 6.5%, 11%, and 11%, respectively. Presently, the Israel-Hamas conflict has reached an advanced stage, with Israel yet to deploy ground troops. Additionally, should other nations become embroiled in this conflict, gold market has already seen a 7.5% increase in value. In the event of further escalation, the likelihood of gold experiencing additional surges remains a distinct possibility.

The question arises: Have demand-side dynamics played a prominent role in shaping the direction of the gold market?

The supply of gold remains relatively stable, with a consistent quarterly range of around 1,100 to 1,250 tonnes. What predominantly influences the price of gold is the demand side, particularly the investment demand.
Gold ETFs play a crucial role in maintaining the balance of supply and demand for gold. When there is an outflow of funds from ETFs, it often triggers a decline in the price of gold.


Looking at the chart above, it becomes evident that gold demonstrates stronger performance during periods of ETF inflows. Although we've heard reports of gold purchases by entities like the Chinese Central Bank, the Turkish Central Bank, and individuals in China this year, as of September 29, a net outflow from the ETF still exists. The demand in Asia has not been sufficient to offset the outflows from the rest of the world. And gold didn’t perform very well.


What factors influence the demand for gold, particularly in terms of investment? Is its appeal as a safe haven, as a protection against inflation, or the impact of monetary policies driving the demand for gold?
- Safe haven
As mentioned previously, the ABN Amro reports indicate that the safe haven characteristics of gold are inconsistent.
- Inflationary hedge


Based on the chart above, during the low inflation period from 2000 to 2006, gold exhibited a weak correlation with the US CPI, showing a correlation coefficient of -0.055. Similarly, from 2007 to 2023, gold did not demonstrate a strong correlation with inflation, with a correlation coefficient of 0.36.
For instance, when we compare the peak gold price of 2020, which was 2,075 USD, and the inflation rate of 2% in 2023, the peak gold price remains at 2,075 USD while inflation has risen to over 7%. If gold were an effective hedge against inflation, we expect its value to have surpassed the 2020 peak.
- Monetary policy

The chart above illustrates the connection between gold and the US three-month yield, revealing a historical pattern where gold rallies when yields decline, notably since 2006.
The question now arises: Are we approaching a turning point? Will the Fed persist with rate hikes? If market sentiment begins to factor in the possibility of a rate cut by the Fed, it could signal the beginning of a gold rally.
According to the model from the Atlanta Fed, the three-month yield is anticipated to begin decreasing, with the earliest projection in January 2024 and no later than June 2024.

While the comparison between gold and JPY as well as gold and GBP has reached all-time highs, it doesn't necessarily guarantee that gold will establish a new record high against the USD. However, it does suggest that gold is likely to continue strengthening when measured against other currencies.
On certain occasions, both the USD and gold have risen simultaneously, as illustrated in the lower chart depicting XAU/USD vs. USD/EUR. The shaded area represents periods when both USD and gold experienced concurrent rallies.

Technical Analysis
Chart pattern: On the long-term gold chart, a cup and handle pattern is taking shape, with the left side of the cup forming in 2011. Gold appears to be currently in the process of forming the handle. If gold manages to breach the resistance level at 2,080, we can anticipate a further rally. It's important to note that support is expected to arrive around 1,800.


Market recap: Week of 30 Oct - 03 Nov 2023
Stay informed with our weekly market recap from 30th October to 3rd November, 2023. Get insights on the latest trends and developments in the financial world.
US Banks
Reuters and The Daily HODL: JPMorgan Chase CEO Jamie Dimon to sell shares for the first time in 18 years for financial diversification and tax planning.
Meanwhile, US commercial banks' deposits witnessed a $100 billion decline in three weeks, per Federal Reserve Economic Data (FRED).
UK economy
The Guardian: The Bank of England, keeping a close eye on labour market trends, now sees signs of cooling.
Economist George Buckley highlights concerning indicators: falling consumer confidence, retail sales slowdown, construction output decline (especially in housing), and manufacturing contraction.
The Monetary Policy Committee (MPC) is likely considering these factors. Buckley suggests an MPC decision to maintain the current policy seems imminent.
Europe’s monetary policy
Reuters: Recent data indicates that the European Central Bank (ECB) will not likely raise interest rates in December unless there are significant surprises, commented Simkus.
ECB policymakers Gediminas Simkus and Peter Kazimir, both of whom advocate tighter policy, emphasize that the ECB is not expected to lower rates during the first half of the following year.
Stock market
Reuters: JP Morgan’s Marko Kolanovic is concerned about consensus earnings growth amid economic challenges. Meanwhile, Morgan Stanley’s Mike Wilson maintains a year-end target of 3,900 for the S&P 500, citing a unique market setup.
Yield curve control
CNBC: BOJ maintains a -0.1% short-term policy rate despite 18 months of core inflation exceeding the 2% target. The 10-year Japan Government Bond yield target remains 0%, with a 1% upper bound as a reference.
BOJ cites 'extremely high uncertainties' in domestic and global economies and financial markets, leading to increased flexibility in YCC policy.
Gold demand
Gold.org: Q3 gold demand (excluding OTC) surpassed the five-year average by 8% but was 6% weaker YoY at 1,147t.
Net central bank buying at 337t marked the third strongest quarter in Gold Council data. Global gold ETFs experienced a smaller outflow of 139t in Q3 compared to Q3'22 (-244t).
Yen intervention
Reuters: Japan's top currency diplomat, Masato Kanda, stated authorities are ready to address 'one-sided, sharp' yen movements. This comes as the currency drops below a crucial level, emphasizing the warning against speculators.
Federal policy
Federal Reserve: Fed Chair Powell announced the decision to maintain the federal funds rate target range at 5.25% to 5.5% and continue reducing securities holdings.
The significant rate hike and over $1 trillion reduction in holdings since last year are having a restrictive impact on economic activity and inflation.
Apple earnings
CNBC and Skynews: Apple reported a net income of $23B on $89.5B in revenue for the quarter ending September 30. This marks the 4th quarter decline.
While revenues dropped 1% from the previous year, forex rate changes caused a 2% revenue dip. Net income was $22.96B ($1.46/share) compared to $20.72B ($1.29/share) last year. iPhone 15 outperformed iPhone 14, but Mac and iPad businesses declined in the quarter.
Bank of England
CNBC, The Guardian and The BOE: The Bank of England maintains its benchmark rate at 5.25%, aligning with the Fed and European Central Bank in keeping key rates stable.
BOE foresees no cuts until the third quarter of the following year, prioritizing a prolonged restrictive stance. UK GDP likely remained flat in 2023 Q3, below prior projections. Inflation, measured by twelve-month CPI, stood at 6.7% in both September and 2023 Q3.
.png)
Commodity prices: What drives them and how to trade
Learn about the factors that affect commodities market prices, such as supply and demand, economic conditions, and political events.
Commodity prices move mainly due to real-world supply and demand factors such as weather, geopolitics, inventories, energy costs, currency movements, policy shifts, and technology changes. They also react to speculative forces including sentiment, liquidity, positioning, and technical patterns. Understanding how these factors interact helps traders choose the right instruments: CFDs or options, and the most suitable Deriv platform to express their market views effectively.
Quick summary
- Fundamentals set direction, speculation amplifies moves.
- The Structural, Seasonal, and Shock regime lens helps identify conditions.
- CFDs suit flexible positions; options suit defined-risk, time-boxed views.
- Recent developments such as gold’s highs, cocoa’s spike, OPEC+ unwind, and shipping disruptions, continue to shape market setups.
- A two-minute pre-trade checklist ensures discipline.
How do commodity market forces shape prices?
Commodity charts reveal an ongoing tug-of-war between fundamentals and speculation. Fundamentals set the trend direction, while speculative flows often dictate how quickly prices move. A strong long-term supply deficit may push a market higher over months, yet a single unexpected headline can still cause sharp intraday reversals.
Commodity markets also react strongly to how quickly new information spreads. In fast-moving environments—such as energy outages, crop condition updates, or surprise macro announcements—prices may temporarily overshoot their fundamental value as traders rebalance exposure. This may create short-term swings that traders should approach with caution. On Deriv, the ability to reduce size, scale in gradually, or switch to defined-risk options helps traders manage their exposure more deliberately.
Shivank Shankar, Marketing Paid Acquisition Specialist at Deriv, adds:
“In commodities, long-term direction comes from fundamentals, but short-term movement comes from surprise.”
In addition, correlations between commodities and other asset classes can shift unexpectedly. For example, industrial metals may decouple from equity trends during periods of policy uncertainty, while energy markets may respond more closely to shipping or weather-related disruptions. Understanding these shifting relationships helps traders avoid outdated assumptions and maintain flexibility in their strategy.
What drives supply and demand shifts in commodities?
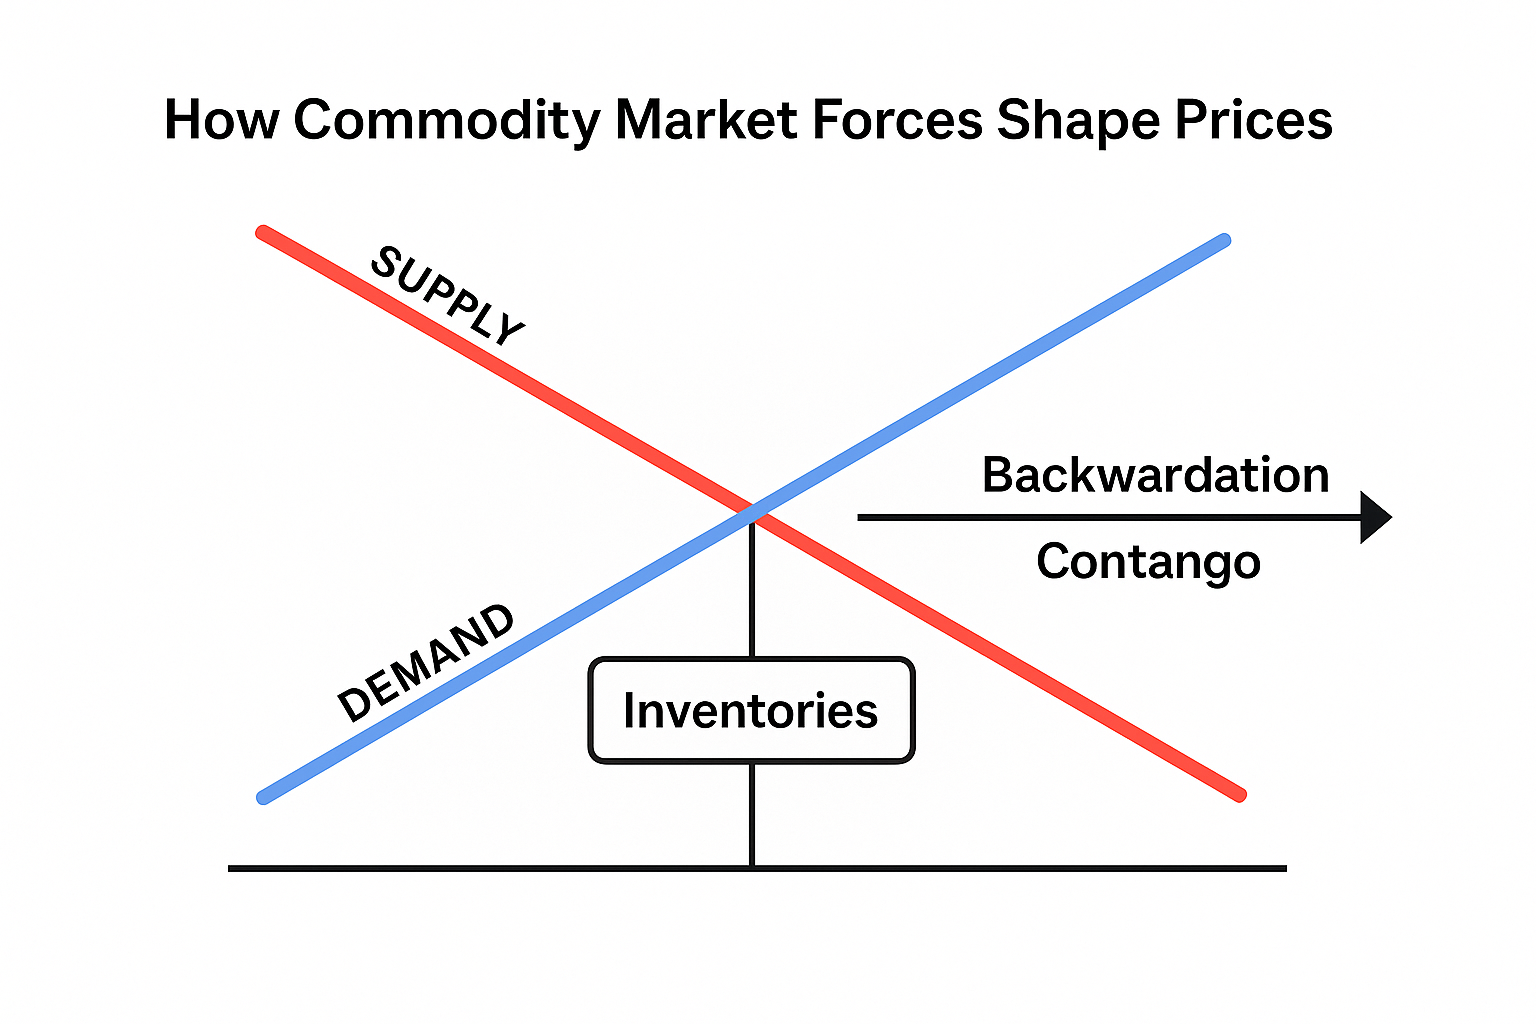
Supply, demand, and inventories form the core of commodity pricing. When demand outpaces supply, inventories fall, and near-term prices often rise faster than later prices (backwardation); when supply exceeds demand, inventories build and forward prices tend to sit above spot (contango).
Weather and climate: Weather remains one of the biggest short-term market movers. Droughts, heat waves, floods, and storms all affect agricultural yields and energy demand. If unusual weather persists, it can shift from a short-term pattern into a structural trend.
Geopolitics and logistics: Shipping routes act as key arteries for commodity flows. Disruptions such as those in the Red Sea or Panama Canal increase transport costs, delay deliveries, and tighten regional supply. These effects ripple into futures curves and spot spreads.
Macro and USD effects: Because commodities are largely priced in USD, a stronger dollar often weighs on prices for non-dollar buyers. At the same time, growth expectations, changes in inflation, and interest rate outlooks reshape demand for industrial metals and transport fuels. On Deriv, CFDs allow traders to adjust positions dynamically when macro data causes sudden sentiment shifts.
Policy and technology: Regulations, tariffs, emissions rules, and extraction innovations all move cost curves. For metals and energy markets, technological upgrades such as improved drilling methods or refining processes, can lower production costs and reshape global competitiveness.
Table - Regime lens for commodity trading
Beyond these core drivers, long-term investment cycles also shape supply. Many commodities, particularly metals and energy, require years of capital expenditure before production capacity changes meaningfully. When investment stalls—because of low prices, tighter financing conditions, or regulatory hurdles—future supply can fall short even when current inventories look stable. This mismatch often leads to structural price uptrends.
On the demand side, consumption patterns evolve as industries modernise. Electric vehicles, renewable energy infrastructure, and data centres have increased demand for copper, lithium, and other specialised materials. Traders who track these transitions early often build stronger directional theses.
How can traders use market regimes to build commodity strategies?
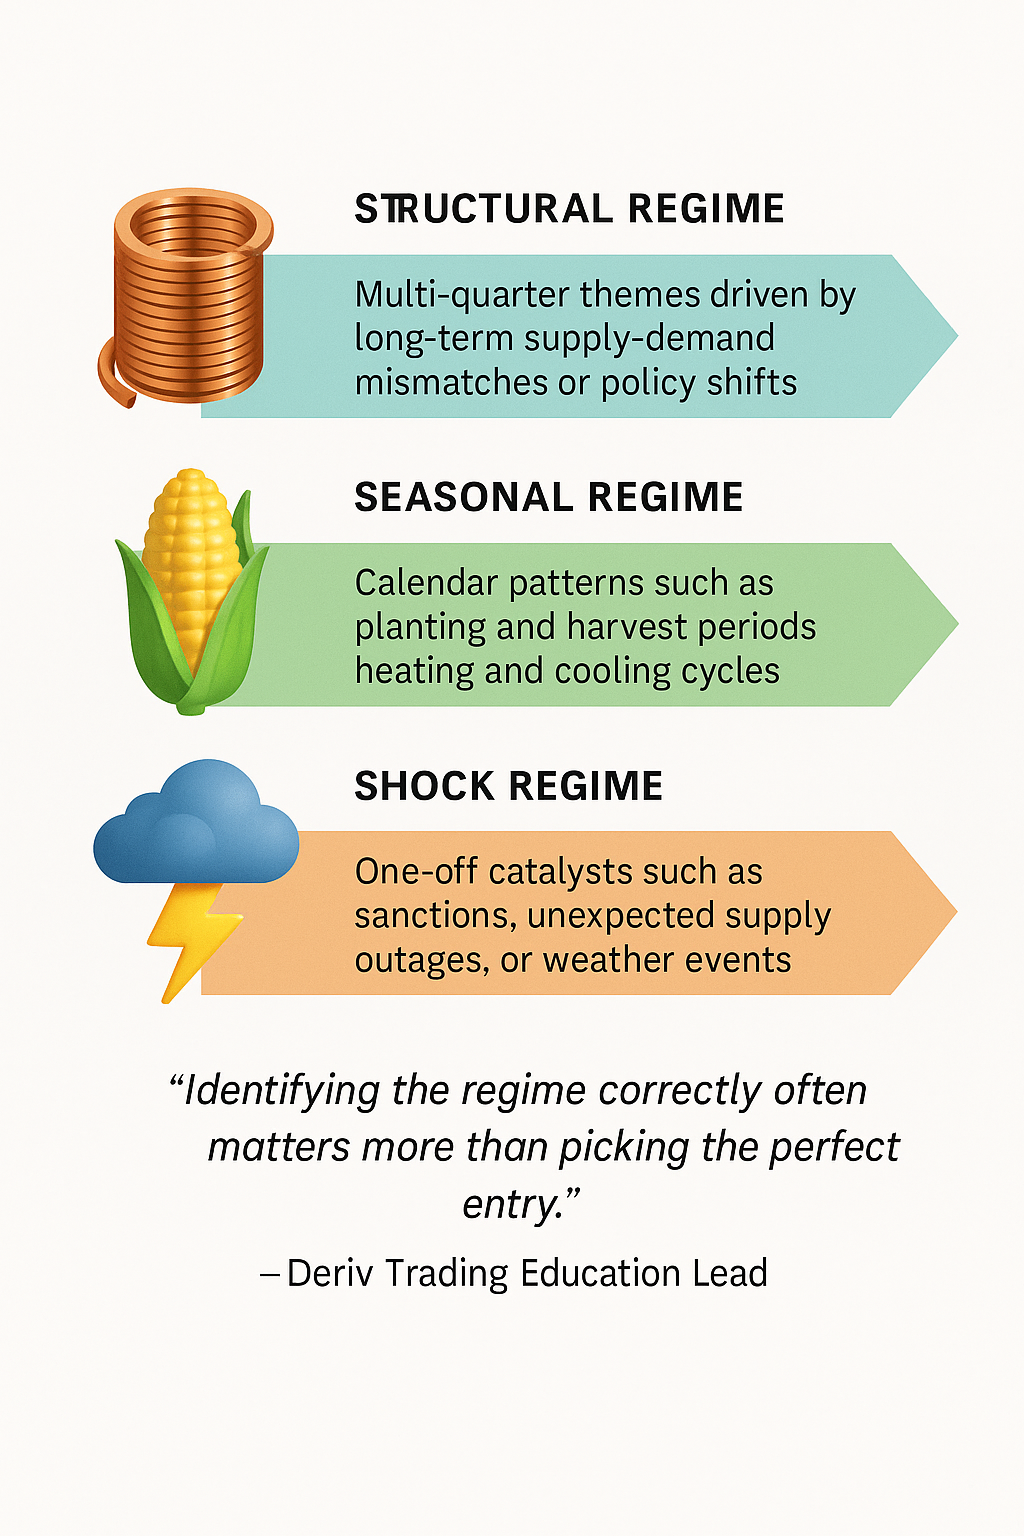
- Structural regime: Multi-quarter themes driven by long-term supply-demand mismatches or policy shifts. For instance, electrification and renewable infrastructure continue to increase demand for copper and other metals.
- Seasonal regime: Calendar patterns such as planting and harvest periods, heating and cooling cycles, and predictable shifts in demand. Climate patterns like El Niño often create seasonal imbalances.
- Shock regime: One-off catalysts such as sanctions, unexpected supply outages, or weather events. Cocoa’s surge, triggered by production losses, is a recent example of a shock that evolved into a new structural base.
Deriv Trading Education Lead elaborates:
“Identifying the regime correctly often matters more than picking the perfect entry.”
These regimes guide choices around holding periods, risk budgets, and the suitability of CFDs versus options.
Successful application of the regime framework requires consistency. Many traders misclassify markets by focusing too heavily on short-term candles instead of the underlying drivers. A structural market with slow pullbacks may appear range-bound on lower timeframes, while a shock regime may look like a sustainable trend if viewed too narrowly.
Keeping a simple regime log—structural, seasonal, or shock—helps avoid overreacting to noise. Deriv’s charting tools across Deriv MT5, Deriv cTrader, and Deriv Trader make it straightforward to compare timeframes and validate whether the current behaviour matches the intended regime.
How can I trade commodities on Deriv using CFDs and options?
CFDs (Deriv MT5 and Deriv cTrader): Flexible tools that let traders scale positions, add or cut size, and trail stops behind trends. They work best in structural or seasonal markets where trends evolve gradually.
Options (Deriv Trader and SmartTrader): Structured for defined-risk outcomes. They are especially useful in shock regimes or when traders want to express short-term, time-boxed views.
Syed Mustafa Imam, Data Engineering specialist at Deriv, explains:
“Defined-risk structures can help beginners understand their maximum possible loss upfront, though trading still carries significant risk.”
Rule of thumb: Some traders prefer options when they want the potential loss to be limited to the stake and the trade to run for a set duration, while CFDs may suit those who want more flexibility to adjust positions as conditions change.
When should I use CFDs vs options in commodity trading?
- CFDs: Suitable when traders want path flexibility. They allow partial closes, trailing stops, and trade adjustments during volatile sessions.
- Options: The stake defines the maximum loss, making them appropriate for event-heavy periods or markets prone to sharp reversals. Rise/Fall and Touch/No Touch contracts help express directional or level-based ideas.
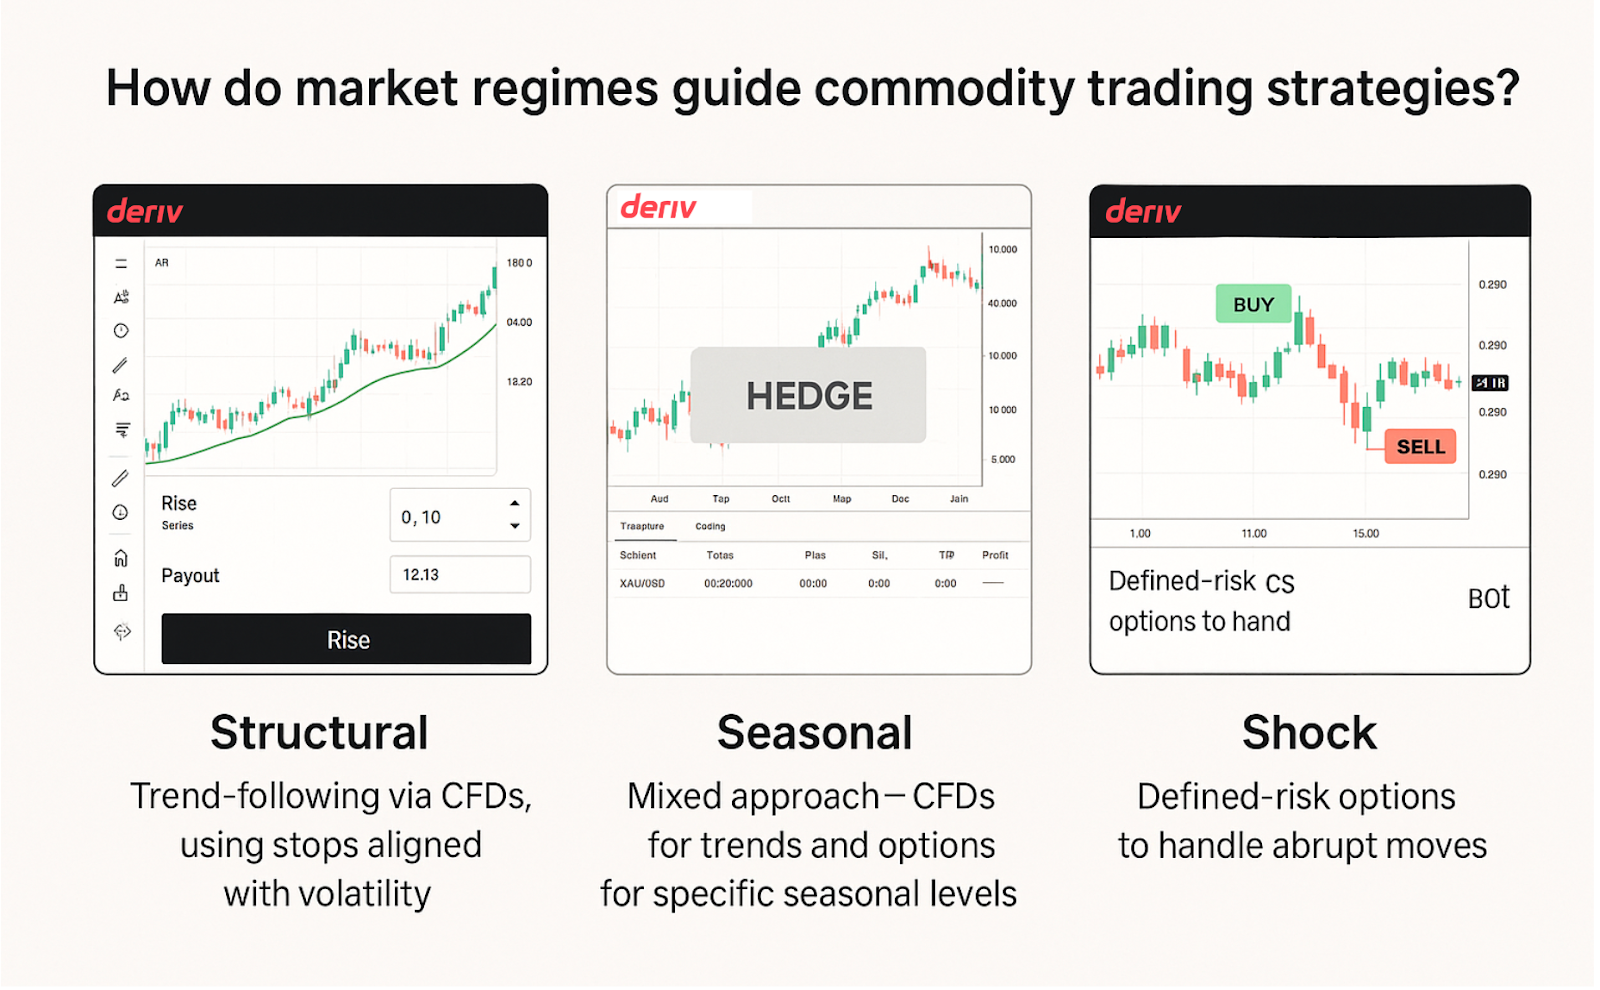
How do market regimes guide commodity trading strategies?
Market regimes determine whether a trader should prioritise trend-following, level-based options, or range plays.
- Structural: Trend-following via CFDs, using stops aligned with volatility.
- Seasonal: Mixed approach—CFDs for trends and options for specific seasonal levels.
- Shock: Defined-risk options to handle abrupt moves.
What Deriv examples show these strategies in practice?
- Example 1: Deriv Trader trend-following
Some traders use Deriv Trader to express time-limited market views with predefined parameters, without needing to manage the position continuously.
- Example 2: Deriv Trader short-horizon decisions
Short-horizon trades are sometimes used to practise translating a market view into a clear, time-bound decision, while keeping the stake amount limited.
- Example 3: Deriv MT5 event hedge
Other traders prefer platforms like Deriv MT5 or Deriv cTrader when they want to actively monitor a position and adjust exposure as new information emerges.
- Example 4: Deriv Bot discipline
Automation tools can be used to apply pre-set conditions consistently, which may support discipline and reduce ad hoc decision changes.
These examples highlight how traders can turn broad concepts into rule-based actions. Consistency matters more than complexity. A beginner does not need a complicated system, only a process that can be repeated without emotional interference. For instance, a trader may commit to trading only during higher-liquidity sessions, or to avoiding entries five minutes before scheduled economic releases.
Deriv’s platforms support these habits with features such as trade limits, predefined stop-loss levels, and automated workflows in Deriv Bot. By combining a structured approach with modest position sizes, traders can observe how different markets behave while managing their exposure, though losses remain possible at all times.
How do current commodity developments shape trading strategies now?
- Gold: Safe-haven flows and shifting rate expectations maintain a structural bid.
- Cocoa: Supply constraints continue to support elevated price levels.
- Oil: Gradual adjustments in OPEC+ output may continue creating event-driven volatility.
- Shipping: Disruptions to global routes keep freight costs elevated, affecting energy and agricultural delivery times.

How can traders turn a market view into a Deriv trade?
- Identify the current regime.
- Choose the appropriate instrument (CFDs or options).
- Express the thesis with level-based, drift-based, or range-based structures.
- Set up risk parameters and position sizing.
- Confirm no near-term events contradict the idea.
Aisha Rahman, Senior Market Strategy at Deriv, explains:
“A clear invalidation point is what separates a thesis from a guess.”
What pre-trade checklist should I follow?
- Define the regime.
- State the invalidation fact.
- Choose between time-fixed or flexible management.
- Set your stop or maximum loss.
- Note any relevant economic releases or logistical issues.
How can I practise commodity trading safely on a Deriv demo account?
Start with one market: gold, oil, or volatility indices. Practise by applying the regime lens, set clear invalidation levels, and track outcomes. The Deriv demo mirrors live market conditions, allowing traders to test strategies without using real funds.
When you can summarise your last five trades clearly, you may feel more prepared to consider trading with real funds, provided you understand the risks involved.

Commodity market rates: Speculative factors in focus
We explore insights into how speculative capital flows can cause dramatic pricing distortions in commodities like oil, gold, and crops.
Have you ever wondered what makes the prices of commodities like gold and oil rise and fall? The answer lies in a fascinating interplay of speculative factors that create the unpredictable landscape of commodity market rates. These are not directly related to the underlying value of a commodity but can still have a major impact on its price.
From the psychology of investors to the impact of hedge funds, we'll take a look at some of the reasons behind the fluctuations in commodity rates.

Investor sentiment
Commodities market trading is heavily influenced by the sentiment of investors and traders. Positive news or market optimism can drive speculative buying, pushing prices higher.
Gold volatility and investor sentiment have a complex relationship. For instance, an increase in the trading volume of gold call options, especially those with strike prices above the current market price (out-of-the-money calls), can indicate bullish sentiments.
Conversely, negative sentiment can trigger selling and price declines, affecting your gold trading strategy.
Hedge funds and speculators
Large institutional investors, such as hedge funds and commodity trading advisors (CTAs), can have a significant impact on commodity prices’ volatility. Their trading strategies and positions can amplify price movements.
Market liquidity
The level of trading activity and market liquidity can affect price stability. Thinly traded commodities with fewer market participants may experience more significant price swings due to large trades.
Technical analysis
Many traders use technical analysis, which involves studying historical price charts and patterns, to make trading decisions. Technical factors, such as moving averages and support/resistance levels, can influence trading strategies.
Options and futures contracts
The commodities market relies heavily on derivatives such as options. The trading of these financial instruments can impact the spot prices of commodities. The relationship between spot prices and future prices for a commodity can then be described by 2 terms — backwardation and contango. We will explore these terms further in another blog.
Speculative bubbles
Commodities markets can experience speculative bubbles where prices rise far above their intrinsic values due to excessive buying. These bubbles often burst, leading to sharp price corrections. Commodity options, such as those for oil, gas, metals, etc., are speculative instruments, and investors can lose more money than they invest.
Ultimately, what affects commodity prices can vary. Speculative factors, including investor sentiment, market liquidity, and trading strategies, can amplify or dampen these price movements. Successful commodity traders and investors carefully analyse and navigate these factors to make informed decisions in this ever-evolving market.
On Deriv, you can trade commodities on a variety of trading platforms, each with its own unique advantages — Deriv MT5 and Deriv X for CFDs, and Deriv Trader, Deriv Bot, and SmartTrader for digital options.
Sign up for a free demo account to start exploring the commodities market. It comes preloaded with 10,000 USD virtual currency so that you can practise trading commodities online risk-free.
Sorry, we couldn’t find any results matching .
Search tips:
- Check your spelling and try again
- Try another keyword