Results for

Navigating the Fed's cautious stance and global economic events
Gain insights into the Federal Reserve's approach and its ripple effects across global economies, currencies, and stock investments.
The US Federal Reserve's minutes from its October 31-November 1 meeting indicate a continuation of its restrictive monetary policy, with no signs of reducing interest rates soon.
FOMC minutes show participants noted that further tightening of monetary policy ‘would be appropriate’ if incoming information indicated that progress toward the Committee's inflation objective was insufficient.

This cautious stance caused gold prices to ease below 2,000 USD an ounce on Wednesday, 22 November. Despite this, gold has gained about 3% in over a week, driven by growing expectations that US interest rates might start falling next year after a series of softer-than-expected economic data.
The Fed, which has paused rate hikes since July 2023, is largely expected to maintain rates through much of the first half of next year.
Impact on global currencies: Australian dollar and Japanese yen
- The Australian dollar fell against the US dollar to around 0.655 USD, reacting to the Fed's stance and domestic economic data. The Reserve Bank of Australia (RBA) increased its cash rate by 25 basis points to 4.35% in November, addressing persistent inflation. Interestingly, the RBA has changed its tone, now indicating future rate hikes will depend on upcoming data.

- The Japanese yen depreciated past 148 per dollar, influenced by the Fed's restrictive outlook. Japan is focusing on upcoming manufacturing and services Purchasing Managers’ Index (PMI) figures and inflation data for economic guidance. Recent data revealed Japan’s economy contracted faster than expected in Q3 due to slowing global demand and rising domestic inflation. The Bank of Japan remains committed to accommodative policies, with minor adjustments to its yield curve controls.

Investment trends: Hedge funds and tech stocks
A Goldman Sachs report highlights that hedge fund crowding reached record highs, largely due to increased bets on the "Magnificent 7" tech stocks. Analysis of 735 hedge funds with 2.4 trillion USD in gross equity positions shows an average allocation of 70% of their long portfolio to their top 10 holdings.
Stock market movers
Nvidia, the most valuable chipmaker globally, announced an expected revenue of about 20 billion USD for the current period in its Tuesday 21 November statement. This figure exceeded the average Wall Street forecast of 17.9 billion USD. However, the company acknowledged an anticipated adverse effect in Q4 due to US export restrictions impacting sales to China. As a result, the company's shares dipped by 1.7% in extended trading.
Upcoming global economic events
- UK’s fiscal outlook: The UK Autumn Statement on Wednesday, 22 November, is expected to shed light on the country’s fiscal strategies during turbulent economic times.
- Japan’s inflation data: Japan’s upcoming Consumer Price Index (CPI) data release on Thursday, 23 November, is critical for its monetary policies and currency valuations.
What this means for you
The Fed's cautious approach to rate hikes is likely to support economic growth in the near term, but high inflation remains a concern. The contrasting strategies of the RBA and the Fed in tackling inflation reflect different global economic responses.
A shortened trading week in the US, with markets closed on Thursday, 23 November, for a holiday, provides a timely opportunity for investors to pause and reassess their strategies and portfolios.
We’ll keep you informed as key economic events and market developments shape dynamics in financial markets in the coming months.

Copy trading on Deriv cTrader
A beginner's guide to copy trading on Deriv cTrader - learn how it works, choosing traders to copy, managing your portfolio, risks and fees involved, and tips for getting started.
Copy trading is a popular trading strategy that allows individuals to automatically replicate the trades of experienced and successful traders, known as strategy providers. This approach enables less experienced traders, known as followers or copiers, to benefit from the expertise of others without actively engaging in market analysis or decision-making.
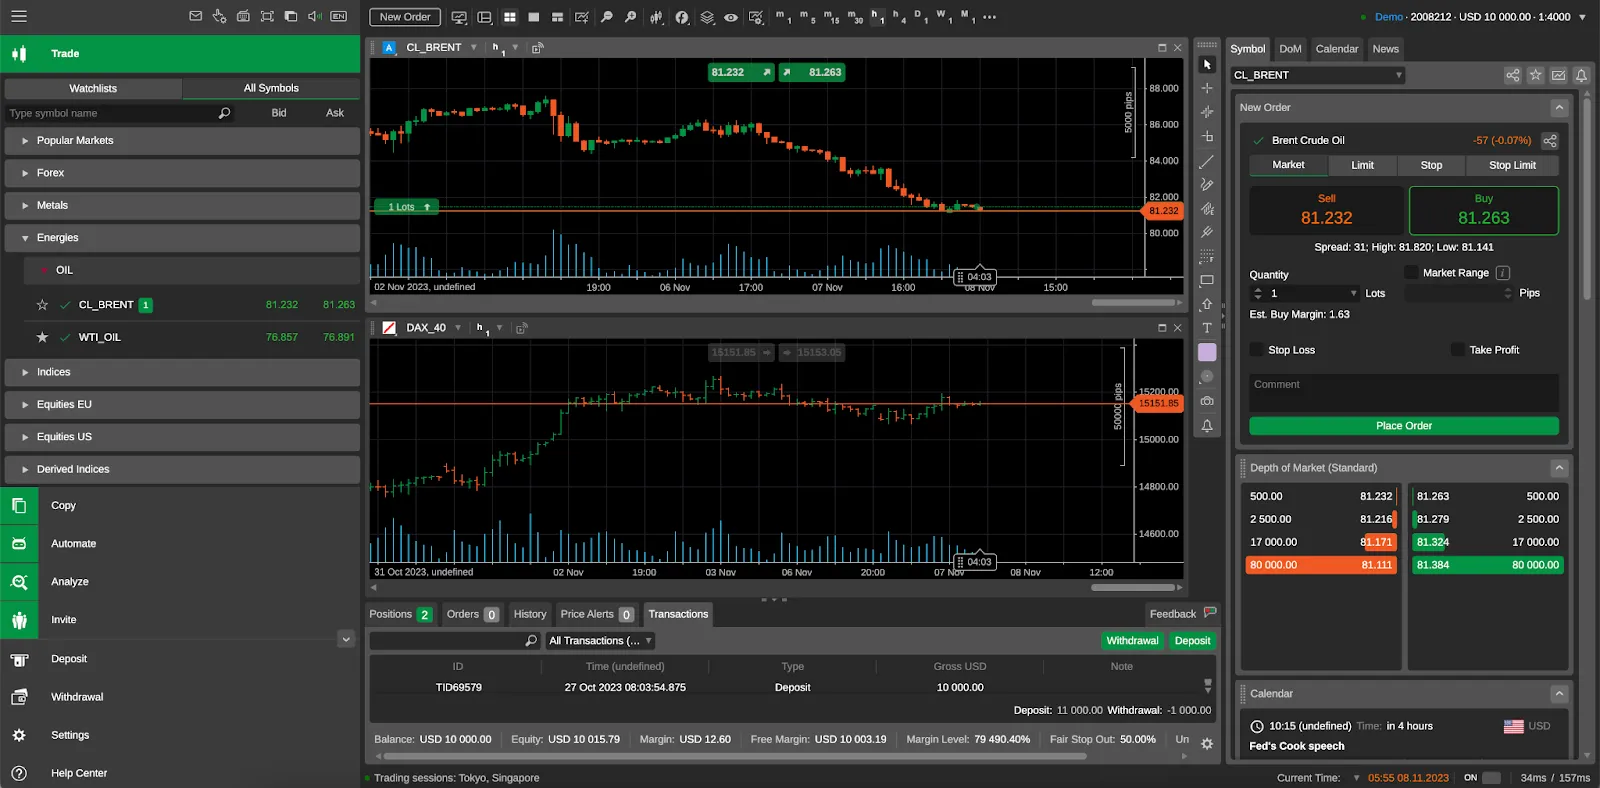
With Deriv, traders can engage in copy trading on Deriv cTrader, a popular feature-rich CFDs trading platform that comes equipped with copy trading facilities. You’ll also get to trade global financial markets such as forex, exchange-traded funds (ETFs), stocks and indices, as well as derived indices which are available to trade 24/7.
In this article, we’ll go through a step-by-step guide to get you started on copy trading with Deriv cTrader.
How copy trading works
On the cTrader platform, you’ll be able to see a selection of traders who are offering their strategies to be copied — they are also known as strategy providers. Have a look at their trading performances, and choose a trader you’d like to follow and copy.
Once you select a trader to follow, your account will automatically replicate your selected trader’s trades in real-time. This means that whenever the strategy provider executes a trade, it will be mirrored in your account proportionally to your capital. Do note that these strategies are provided at a fee.
How to start copy trading on Deriv cTrader
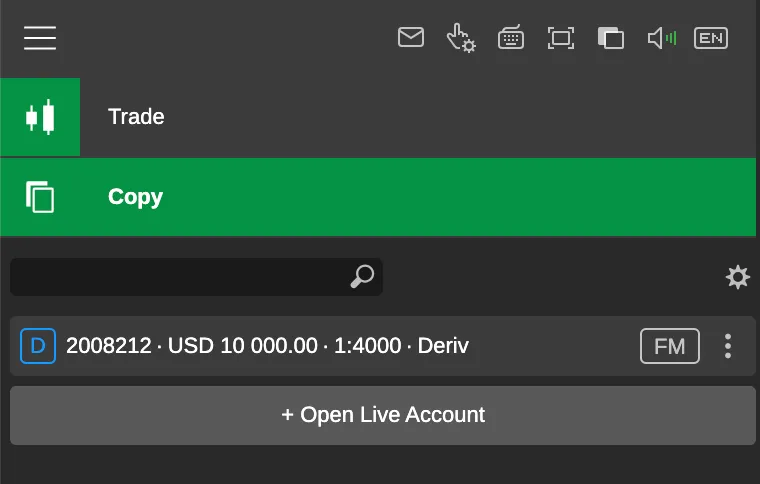
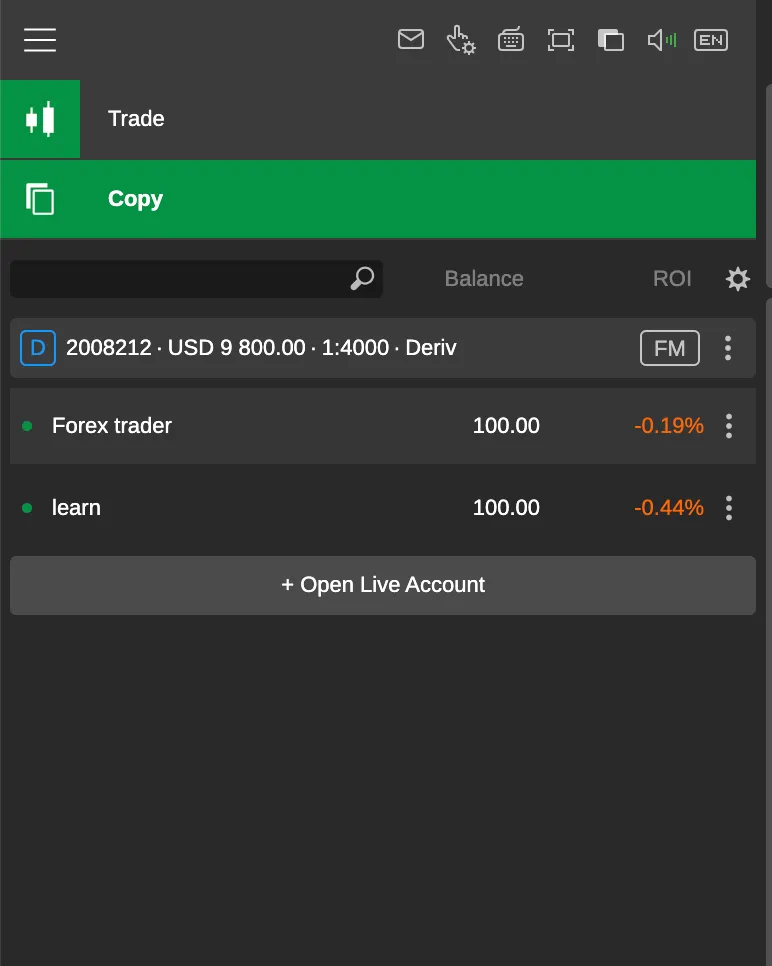
On cTrader, you’ll be able to find the copy trading feature under the 'Copy' tab in the menu on the left.
Navigation
1. Navigate to the left side of the cTrader platform.
2. Click on ‘Copy’.
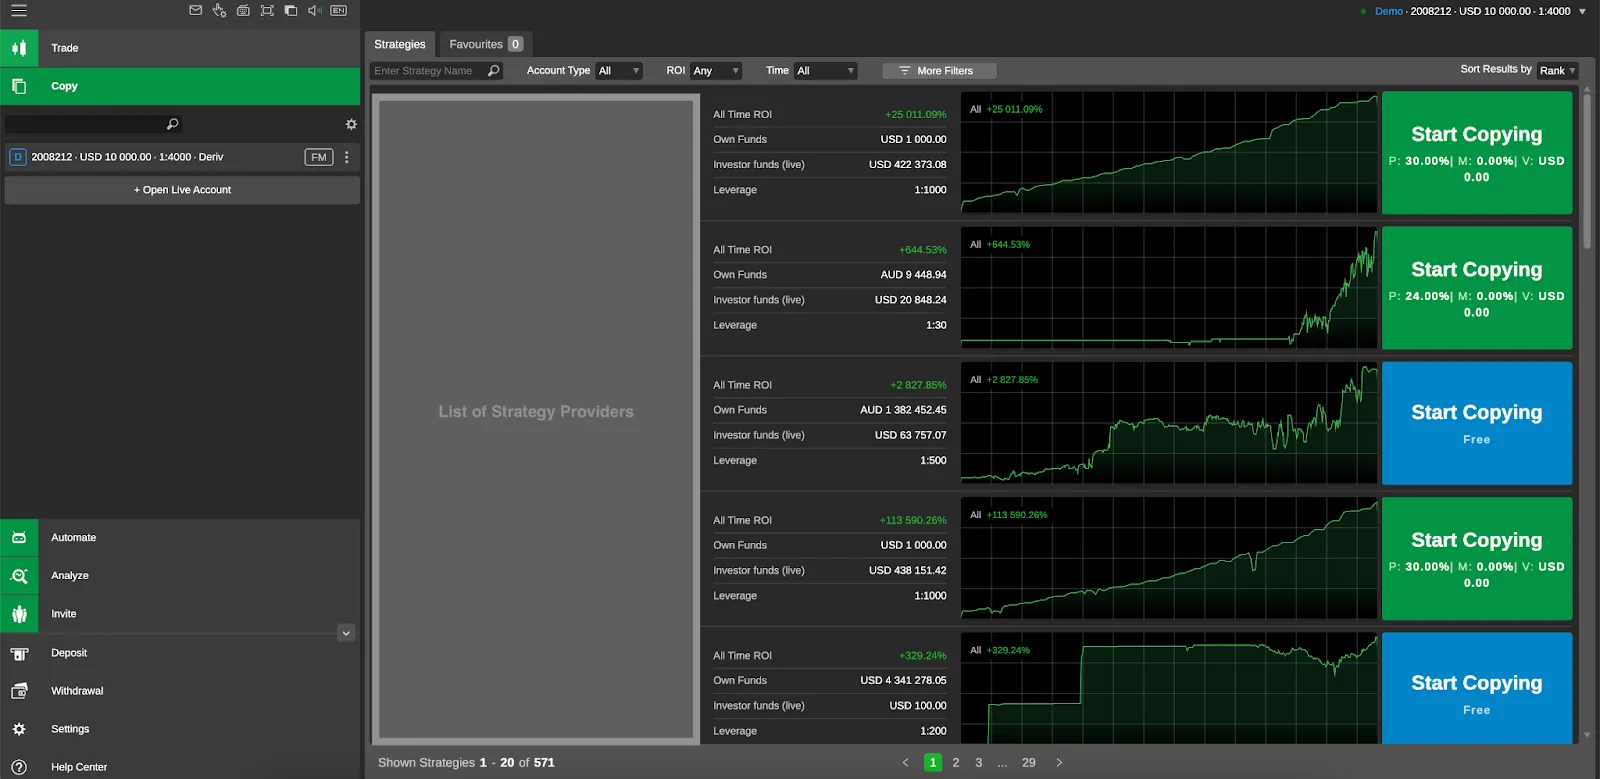
Choosing a strategy provider to copy
3. You can find a list of strategy providers that are placed under the “Strategies” tab. Go through the list of strategy providers, or use the search bar to filter and select a suitable strategy provider based on your trading preferences. You can also create a list of your favourite strategy providers under the “Favourites” tab.

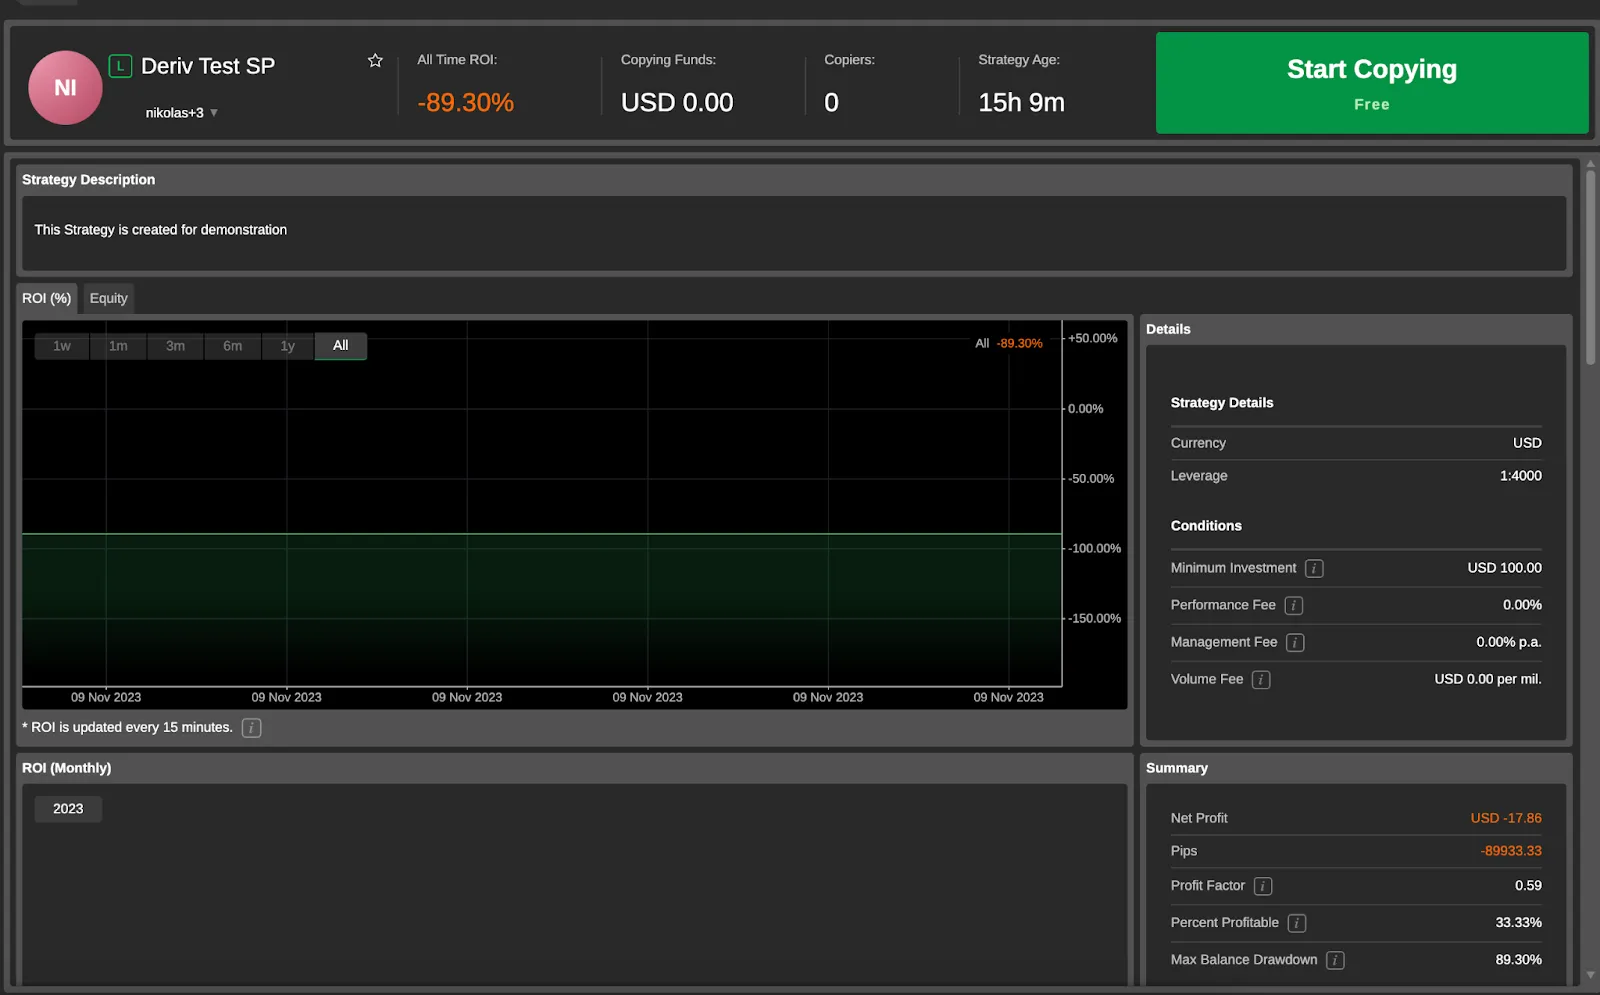
Reviewing the selected strategy provider
4. It’s also important to check each strategy’s ‘Fees and Conditions’. This includes the minimum investment, performance fee, management fee, and volume fee.You can hover your mouse over the “i” button for more detailed information.

Review copy trading fees
5. It’s also important to check each strategy’s ‘Fees and Conditions’. This includes the minimum investment, performance fee, management fee, and volume fee.You can hover your mouse over to the “i” button for more detailed information.
A brief definition of these fees:
Minimum investment: The minimum amount of funds required to be allocated for copying this strategy.
Performance fee: A fee based on the percentage of the net profit you made.
Management fee: The annual percentage of your equity calculated daily. It is charged on the first day of each month after you start following the strategy.
Volume fee: The amount you will be charged per one million of volume copied. It is calculated per side and added to each position.
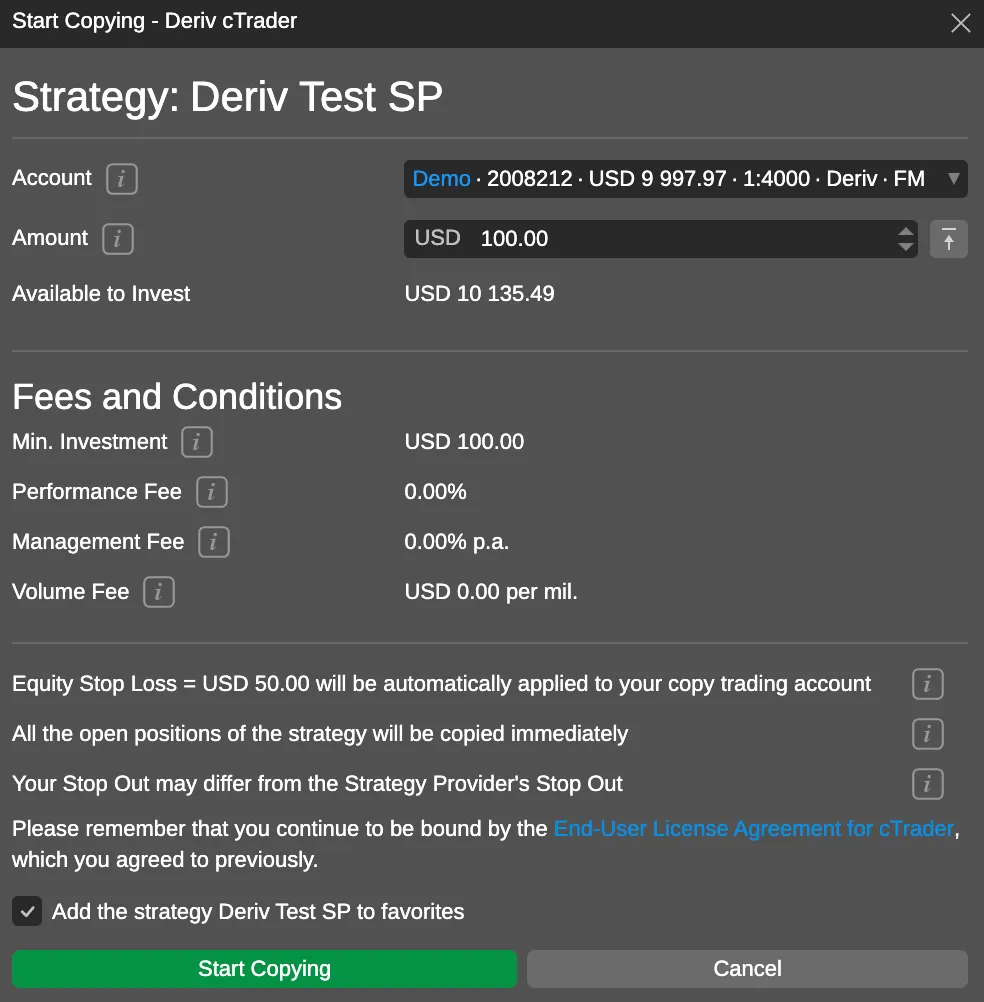
Confirm strategy selection
6. Once you’ve decided to follow a specific strategy provider, select the account you would like to trade from and enter your desired amount. Then, click the ‘Start Copying’ button next to their profile.
Equity Stop Loss means you will limit losses when copying strategies. If your equity drops below the specified level, all copying will stop and any open positions copied from the strategy provider will be closed.
Monitoring and reviewing selected strategy
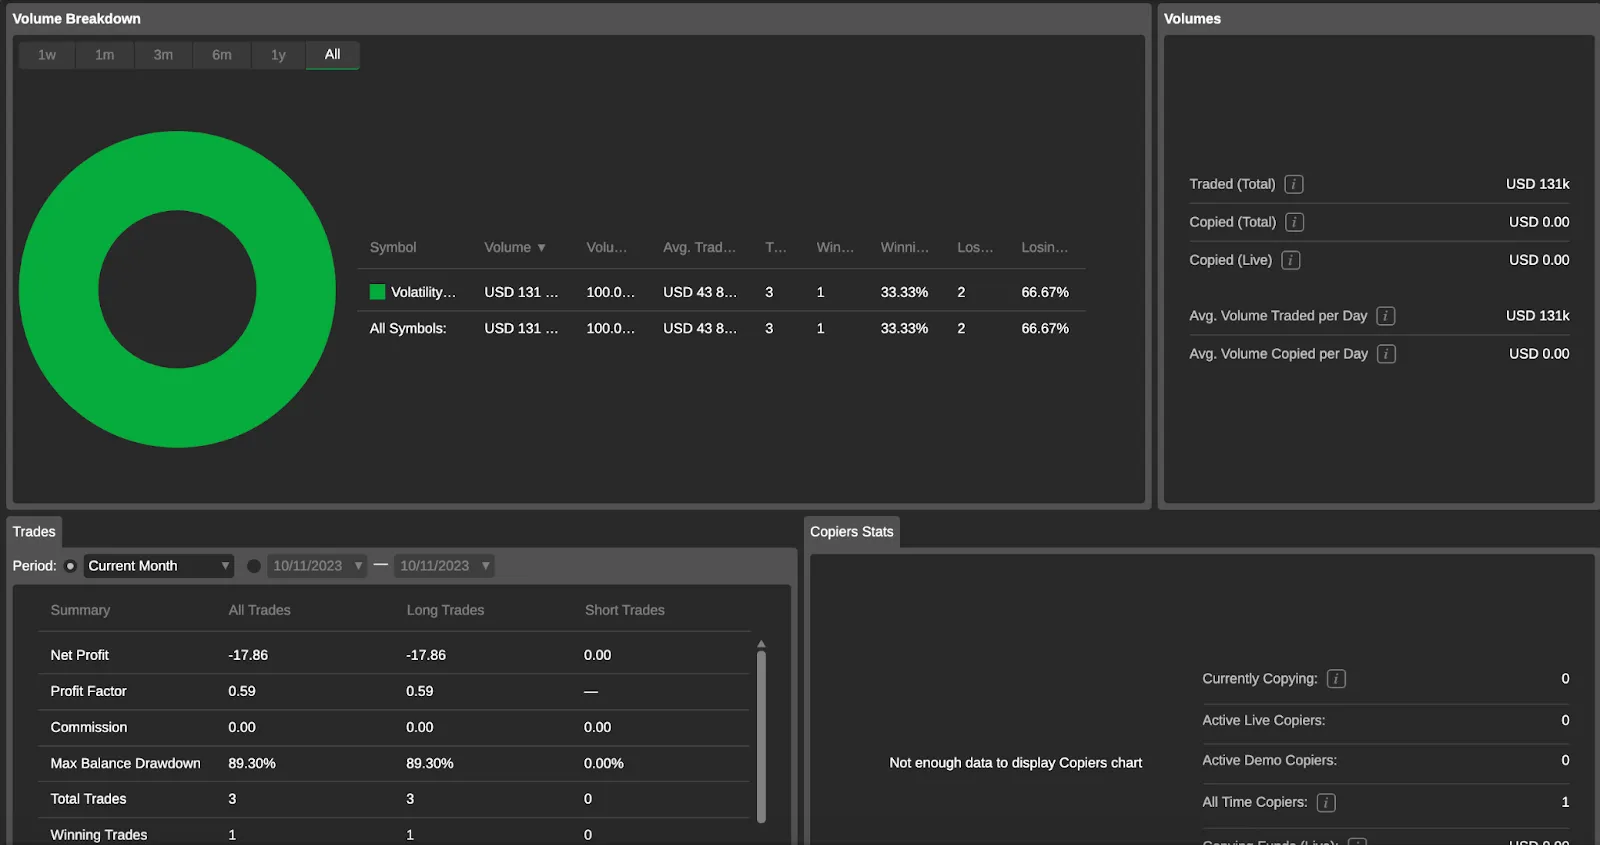
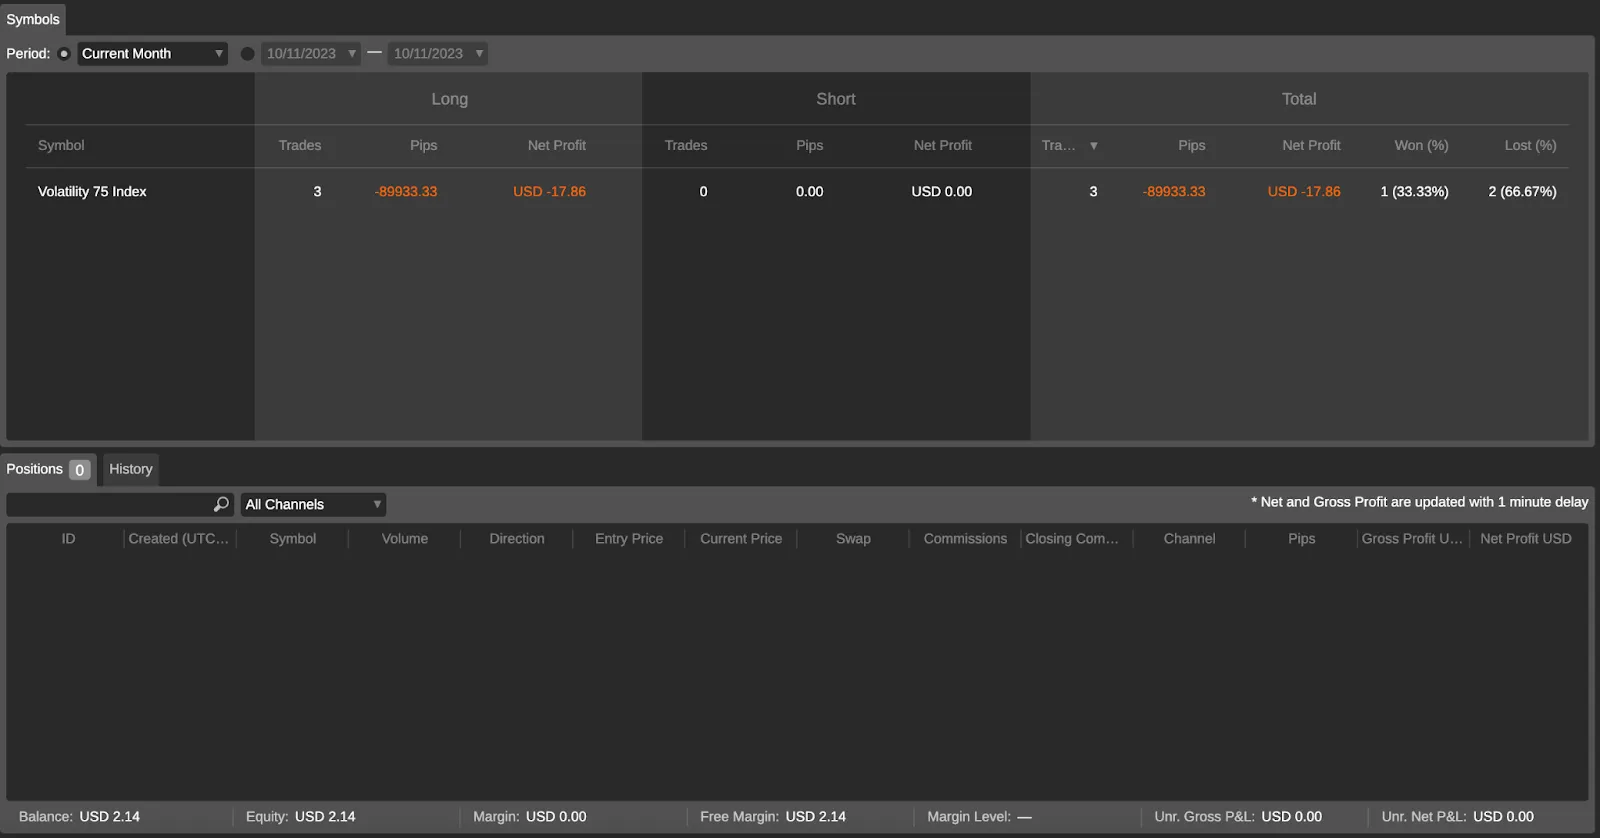
7. Monitor your copied trades in the ‘Copy’ tab to stay updated on the provider’s performance and your progress.
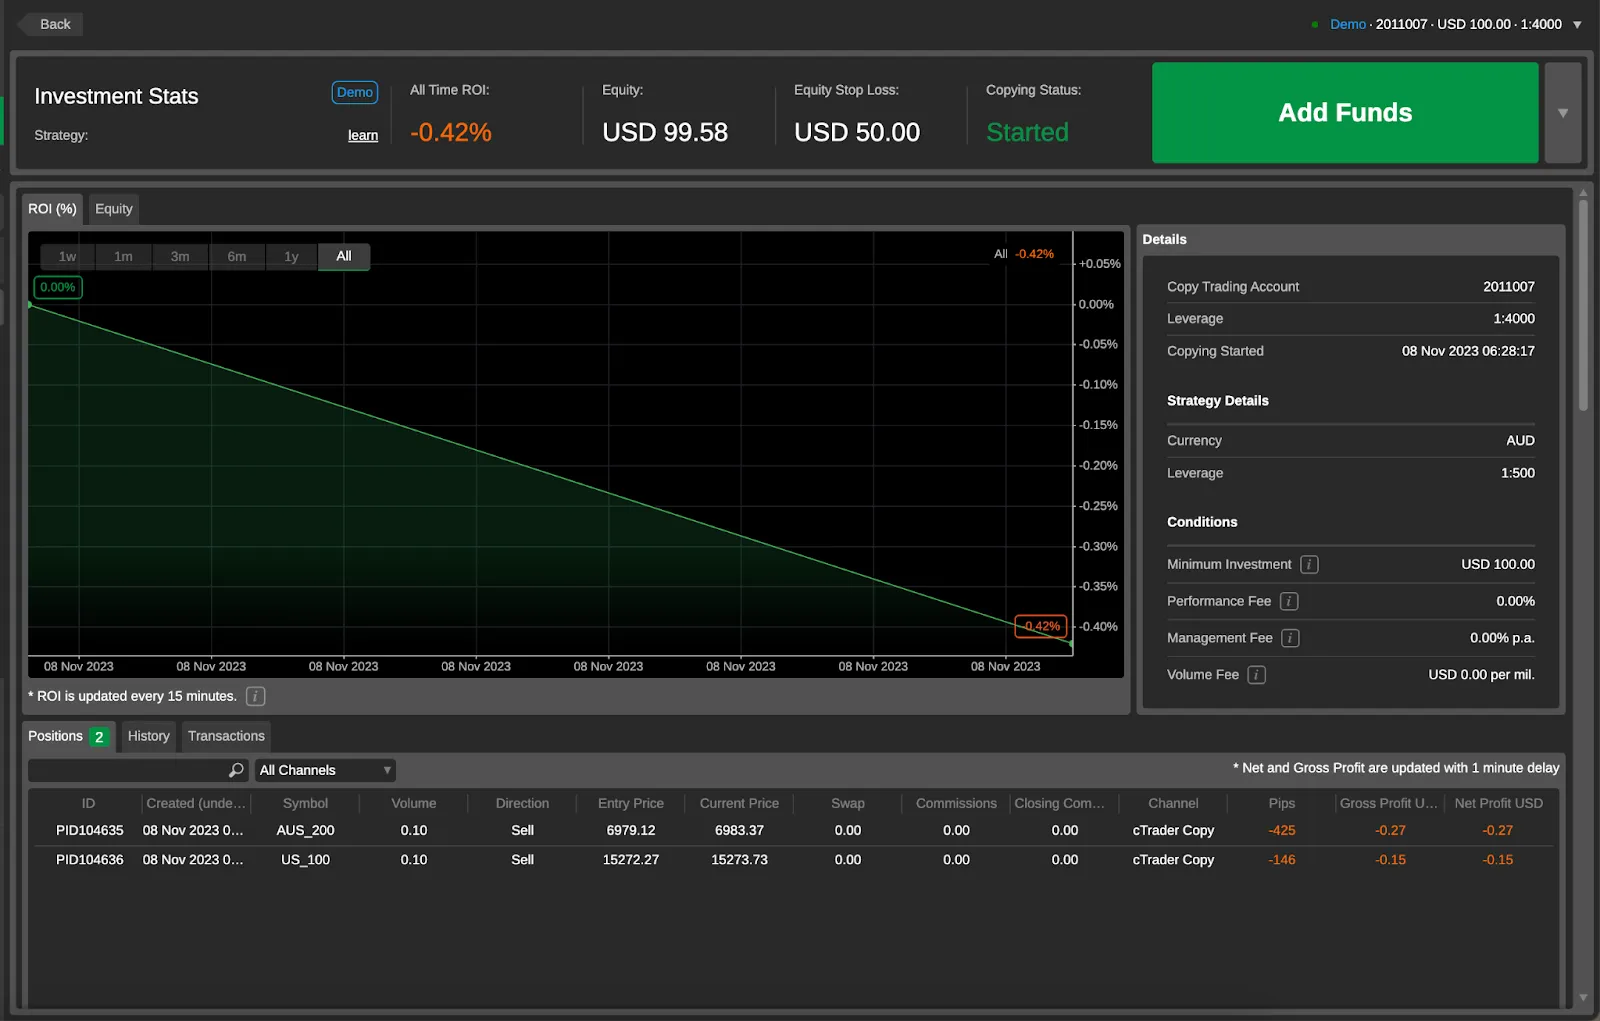
8. Navigate among the list of active copy trades in the left column within the Copy tab. For each copy trade, you can click on the three dots to see the options available, such as adding funds, removing funds, stopping copying, and setting equity stop loss.

Do remember to regularly review and adjust your copying settings based on the strategy provider's performance and market conditions.
How to stop copying a strategy
If you want to stop copying a strategy, you'll need to:
- Select Stop copying in the strategy settings menu. You can also find it in the drop-down menu beside the Add funds button.
- Confirm your details - you'll be able to see the estimated amount of unrealised performance and management fees that will be charged to you when you stop copying the selected strategy.
- Select Stop copying to confirm. You will see an orange indicator on the strategy that is not being copied.
If you stop copying a strategy while the market is closed, you will see a Stopping status and a grey indicator beside the strategy. When the market opens, the open positions are closed and the relevant fees are charged, and the strategy status will be updated to Stopped and marked with an orange indicator automatically.
Understanding your fees
To enhance the guide on cTrader copy trading, we plan to include a sample fee calculation to provide additional assistance throughout the process.
Example
Strategy name: "Sample Strategy"
Minimum investment: $1,000
Volume Fee: $5 per one million USD
Performance Fee: 20% of net profit using a High-Water Mark model
Management Fee: 5% of investor's equity
Now, let's calculate the fees for a scenario where an investor copies the "Sample Strategy" and earns a net profit of $1,500.
1. Volume Fee calculation:
Formula: Volume Fee = (Total Volume Copied / 1,000,000) * Volume Fee Rate
Assuming the total volume copied is $3,000,000:
Volume Fee = ($3,000,000 / 1,000,000) * $5 = $15
The Volume Fee is charged based on the trading volume copied by the investor. It's applied as the copier engages in trading activities within the strategy. The fee is deducted in real time as the copier executes trades within the copied strategy.
2. Performance Fee calculation:
Formula: Performance Fee = Net Profit * Performance Fee Rate
Assuming the investor's net profit is $1,500
Performance Fee = $1,500 * 20% = $300
The Performance Fee is calculated based on the net profit made by the copier using a High-Water Mark model. This fee is not applied immediately but is calculated and applied periodically. The exact frequency and timing may depend on the platform's settings. It's applied at intervals and calculated based on the copier's net profit during that period.
3. Management Fee calculation:
Formula: Management Fee = (Investor's Equity / 100) * Management Fee Rate
Assuming the investor's equity is $10,000:
Management Fee = ($10,000 / 100) * 5% = $50
Similar to the Performance Fee, the Management Fee is also applied periodically. It's calculated based on the investor's equity or account balance. The exact timing and frequency of Management Fee deductions may vary based on the platform's settings.
So, in this example, the fees applied to the investor copying the "Sample Strategy" would be as follows:
- Volume Fee: $15
- Performance Fee: $300
- Management Fee: $50
In summary, the Volume Fee is deducted in real-time as the copier engages in trading activities, while the Performance Fee and Management Fee are calculated and applied periodically based on the copier's performance and equity. The specific timing and frequency of these fee deductions may vary based on the platform's settings and policies. Copiers should refer to the platform's documentation and fee schedule for precise details on when and how these fees are applied.
These fees are calculated based on the specified rates and the investor's activity in copying the strategy. Keep in mind that the actual fees may vary based on the strategy's terms and the investor's performance.
Special notes for Deriv clients
The cTrader Copy platform at Deriv provides transparent fees and strategy performance history for an informed copy trading experience.
Strategy providers available for copying must meet the minimum requirements laid down by the cTrader platform.
Investors can freely manage their investments and risk levels with user-friendly tools and real-time data.
Note: This is a brief manual to serve as a fundamental resource for both new and experienced clients looking to engage with copy trading on Deriv’s cTrader platform. It shall be enriched with visual aids to facilitate comprehension and enhance the user experience.

Nvidia Q3 earnings — Tuesday, 21 November
Nvidia will report its fiscal third quarter 2023 earnings on 21 November. Gain insight into performance in the AI-driven sector.
Artificial intelligence continues to take centre stage in this season of technology company earnings as demand for AI microchips and semiconductors keeps growing at an exponential rate. At the forefront of this landscape is Nvidia, which is currently producing 70% of the chips and semiconductors used in AI applications globally.
As anticipation builds, Nvidia's upcoming earnings report, scheduled for release at 4:00 pm New York time on Tuesday, 21 November, is poised to provide critical insights into the company's performance and the broader trajectory of the AI-driven technology sector.
What to expect from the Nvidia earnings report?
According to Bloomberg, Nvidia’s third-quarter revenue is expected to rise to 16.04 billion USD from 13.5 billion USD last quarter, while earnings per share (EPS) is expected to rise from 2.70 USD in the last quarter to 3.36 USD.
Investors will also be looking at Nvidia's forward guidance, especially in light of the recent US export controls, which have restricted the export of Nvidia’s A800 and H800 chips to China. According to the Financial Times, Nvidia is planning to release three new chips, H20, L20 and L2, tailored for China that comply with US export controls.
Nvidia has also just announced the unveiling of its upgraded H200 AI chip, boasting enhanced memory bandwidth and capacity compared to the H100. Investors will also be analysing the new chip sales projections, which are scheduled for release in the second quarter of 2024.
Nvidia's Second Quarter Financial Report
In the second quarter, Nvidia beat market expectations, showcasing significant growth across key indicators. Notably, the company reported an EPS of 2.70 USD, surpassing Bloomberg's expected 2.07 USD. Revenue for the quarter reached 13.51 billion USD, up 88% from the previous first quarter and exceeding Bloomberg’s estimate of 11.04 billion USD. Nvidia also announced a stock buyback of 7.5 million shares and the distribution of dividends totalling 3.38 billion USD. Their shares climbed 6% in extended trading after the release.
During the post-earnings press conference, Nvidia's CEO, Jensen Huang, highlighted the proactive embrace of faster computing and AI technologies by companies worldwide. The company’s success was particularly driven by its data centre business, fueled by the demand for its A100 and H100 AI chips, crucial for developing and running artificial intelligence applications like ChatGPT.
Analyzing Nvidia's Q3 Earnings: Implications for Stock Direction and the AI-Tech Sector
The stock has been the top performer in the S&P 500 index this year, up 230%. It recently has been consolidating within a 100 USD range, approaching a strong resistance level around the 500 USD mark.
The earnings report should help traders clarify whether Nvidia is a buy or a sell at these all-time high levels. With weaker results, we may see a decline towards the support levels of 470 USD and 450 USD. However, a positive report may propel the stock to new highs above 500 USD.

It is important to also consider that Nvidia has a price-to-earnings ratio above 113, causing some investors to say the stock is overpriced.
Comparing this ratio to Qualcomm, one of its smaller competitors reveals a stark contrast. Qualcomm’s price-to-earnings ratio is at 18.73, much lower than Nvidia's. In their most recent earnings report, Qualcomm’s EPS came in at 2.02 USD, beating Bloomberg’s estimate of 1.92 USD. Revenue came in at 8.67 billion USD, higher than the expected 8.51 billion USD. They also gave a strong forecast for the current quarter and rose over 3% in extended trading after the release. In fact, many investment banks, such as JP Morgan, have a strong buy rating on the stock.
Regardless of whether you think Qualcomm is a better buy or not, the upcoming third-quarter earnings report from Nvidia is positioned to offer crucial insights into the overall direction of the AI-driven technology sector. Keep an eye out for whether their EPS and revenue beat market expectations and what forward guidance is given for the future growth of the company. Stay tuned.

Global markets witness mixed trends: Nikkei peaks, China holds rates, US eyes Fed moves
Global markets witness mixed trends as Nikkei peaks, China holds rates, and investors eye US Fed Reserve moves for clues amidst volatility.
Amidst a whirlwind of global market activities, Japan's Nikkei 225 index briefly hit a 33-year high, highlighting the fluctuating nature of current global financial markets.
Spotlight on Nikkei Market: A Rollercoaster Monday and Soaring Trends
In an eventful day for Asian markets, Japan's Nikkei 225 index soared today, Monday 20 November, momentarily reaching a high not seen since the 1990s, before dipping over 1.7% at the time of writing to 33,280.
This month, the Nikkei index has experienced an upward trend of nearly 9%, setting it on track for its most significant monthly rise since November 2020. This surge in the Japanese stock market is being attributed by analysts to robust domestic earnings and a growing belief that US interest rates have reached their highest point, with a potential decline anticipated next year.
Traders are now turning their attention to the upcoming minutes from the Federal Reserve's policy meeting for insights on future rate trends. Additionally, they are keenly awaiting preliminary manufacturing and services PMI numbers and inflation figures from Japan to assess the nation's economic vitality.

Asia's Diverse Market Moves: Cautious Optimism Amid Economic Pressures
The Hang Seng index in Hong Kong rose by 1.6%, closing at 17,732.36, signalling a robust rebound. In contrast, the Shanghai Composite index in China saw a modest gain of 0.5%, ending at 3,068.32, following China's announcement to keep its benchmark lending rates unchanged. This decision reflects a cautious approach, balancing economic growth with currency stability amid global uncertainties.
Elsewhere in Asia, South Korea's Kospi climbed by 0.9% to 2,491.20, and Australia’s S&P/ASX 200 edged up 0.1% to 7,058.40. Taiwan’s Taiex remained relatively unchanged. However, Thailand's SET index in Bangkok dropped 0.1% following news of the country's slower-than-expected economic growth, impacted by weakening exports and agriculture sectors, despite a rise in consumer spending and tourism recovery.
This panorama of global financial markets demonstrates a blend of cautious optimism and strategic responses to economic pressures, with investors and policy-makers alike navigating a landscape shaped by fluctuating currencies, interest rate speculations, and geopolitical developments.
%252520(1).webp)
Market Radar: RBA and FOMC minutes, UK Autumn statement, and Japan inflation rate release
This week's market radar: RBA and FOMC meeting minutes releasing amidst rate hike outlooks providing insights into key economies.
Dive into this week's Market Radar for key financial market insights.
On Tuesday, get ready for the Reserve Bank of Australia and Federal Open Market Committee's latest moves – could they flip the script on the Aussie and US dollars?
Midweek, the UK's Autumn statement looms, with potential to rattle election-year strategies. And Thursday, look out for the update on Japan's inflation – a potential catalyst for policy shifts.
For more sharp analysis and foresight on the news and US stock markets, follow blog.deriv.com.

Market recap: Week of 13–17 Nov 2023
Stay informed with our weekly market recap from 13th to 17th November, 2023. Get insights on the latest trends and developments in the financial world.
US fiscal concerns
The Guardian: The credit ratings agency Moody's shifts its outlook on the US government from stable to negative, citing DC division and fiscal risks. Concerns include persistent deficits amid rising interest rates and potential hurdles in reaching a consensus on fiscal plans due to political polarization. With a looming shutdown, bipartisan cooperation is crucial for the House, Senate, and White House to secure funding this week.
Energy news
Energy.gov: Brent and WTI register third consecutive weekly losses since May, but exit oversold territory. Analysts cite shifting concerns from Middle East production fears to demand worries. Iraq supports OPEC+'s oil cuts, while U.S. energy firms reduce operating rigs for the second consecutive week. The U.S. DOE's Office of Petroleum Reserve plans monthly oil purchases for the Strategic Petroleum Reserve through May 2024 at or below $79 per barrel, aiming to secure cost-effective deals for taxpayers.
Spending bill
The Hill: Senate Majority Leader Chuck Schumer expresses satisfaction with Speaker Mike Johnson's plan to avert a government shutdown.
Schumer acknowledges the 'laddered' stopgap spending bill's imperfections but sees it as a 'clean' measure to fund the government for the next two months.
US consumer price index
Factset: October 2023 CPI Estimate: 3.3% YoY. If realized, it signals the first decline since June. Last month saw a 3.7% increase.
Meanwhile, the current effective Fed fund rate at 5.33% stands 2% above the forecasted CPI. On 27 Oct, Oppenheimer's investment chief predicts an 18% surge in the S&P 500 by year-end.
Economy update
Yahoo Finance, CNBC, Barrons and Fortune: The Dow Jones Industrial Average was up about 490 points, or 1.4%. The S&P 500 was up 1.9%. The Nasdaq Composite was up 2.4%. In a surprising twist, US October CPI comes in at 3.2% and last month's 3.7%.
Bank of America’s Fund Manager Survey reveals an unprecedented 80% of respondents predicting falling bond yields in 2024, marking a significant shift in sentiment towards lower inflation and rates. Investors are now overweight equities for the first time since April 2022.
Cryptocurrency news
Market Watch: Cryptocurrencies, including Bitcoin, lag behind as stocks and gold surge on positive U.S. inflation data hinting at a potential halt in Fed interest rate hikes.
Bitcoin has slipped 2% to under $36,300, retreating from last week's peak near $38,000.
UK consumer price index
The Guardian and Forbes: The UK's inflation rate took a significant dip to 4.6% in October, marking a two-year low, thanks to reduced costs in gas and electricity.
This decline from September's 6.7% exceeded economists' predictions at 4.8%.
The smallest increase in two years is steering investor expectations towards potential BoE rate cuts in the coming year.
Notably, HSBC, Halifax Intermediaries, and Virgin Money are responding with adjusted rates, offering competitive fixed rates for home purchases and remortages.
US retail sales
The Wall Street Journal: According to the Commerce Department, U.S. retail sales slipped 0.1% in October, marking the first downturn since March after a 0.9% increase in September.
Higher interest rates impacted auto sales, and lower gas prices reduced station spending.
Even excluding these categories, sales only advanced 0.1%, following a 0.6% average gain in the prior six months.
Home Depot reported a 3.1% drop in same-store sales, and Target's comparable sales fell 4.9% in the three months ending Oct. 28.
Rising borrowing costs and economic uncertainties may contribute to restrained consumer spending.
Gold economy
Reuters: Gold prices saw a notable uptick of over 1% today, driven by a dip in the dollar and Treasury yields.
The surge followed higher-than-expected U.S. weekly jobless claims, reinforcing expectations of a Federal Reserve pause in its interest rate hikes.
The rise in unemployment claims may contribute to the Fed's efforts to curb inflation.
Additional economic indicators include a 3.5-year low in U.S. producer prices for October, and steady U.S. consumer prices reported earlier this week.
European economic risks
ECB and SPGlobal: ECB President Christine Lagarde warns of potential significant hits to EU banks if forced to sell bonds for cash.
Risks, including high inflation affecting households' disposable income, a sharp fall in asset prices, and a deteriorating economy, could amplify each other's impact.
NPLs are low, but challenges persist.

How to manage risk while copy trading
Learn how to manage risk and get the most out of copy trading. Set stop losses, diversify your portfolio, track performance and more.
Copy trading involves replicating the trading decisions of strategy providers, which means that the performance of your portfolio is directly linked to the choices of others. While this can be a powerful tool for diversification and learning new trading strategies, it also exposes you as a copier to various risks, such as the emotions and biases of a strategy provider, as well as market uncertainties.
The key to mastering copy trading lies in implementing good risk management strategies that can help safeguard your trades against unexpected market fluctuations and potential losses. While there's no foolproof method to eliminate all risks, there are several fundamental principles that you can follow to manage your risks while copy trading.
Diversify copy portfolios
Instead of copying a single trader, diversify your copy portfolios by copying multiple strategy providers with different trading strategies. Diversification helps spread the risk across various trading styles and assets.
Set maximum equity stop loss
Although you cannot set stop loss orders on individual positions, you can set a maximum loss limit for your entire copy trading portfolio. If your portfolio reaches this limit, consider stopping copying until you reassess your strategy.
This option allows you to limit losses when copying strategies. If your equity drops below the specified level, all copying will stop, and open positions copied from the strategy provider will be closed.
Example: Your account balance is 10,000 USD, and you have set your equity setting to 9,000 USD. When your equity drops to 9,000 USD, all copying will stop, and all your copied positions will be closed. In this case, you will be risking 1,000 USD.
Adjust position size
The volume of the copied positions follows the ratio between the strategy provider's (SP) equity and the copy trader's (CT) equity.
For example, if SP has a balance of 10,000 USD, and CT has equity (in the copy account) of 500 USD, the ratio is 1:20. In this case, if SP opens a 1 lot EUR/USD = volume of 100,000 EUR, on the copier’s account the opened position would be of volume 100,000/20 = 5,000 USD = 0.05 Lots.
What this means is that the copier can 'adjust' the position size by the amount that the copier has in their account in relation to the SP's amount.
Stay informed and learn continuously
Staying informed about financial markets, trading strategies, and factors influencing asset prices is crucial. Market knowledge enables informed decision-making. Continuously educate yourself about copy trading and risk management. Understanding the mechanics and associated risks will empower you to make better choices.
Do regular reviews
As copiers, you should regularly review your copy trading settings and the consistency of the strategies’ performances. Don’t fully rely on strategy providers, especially during periods of market volatility. Adjusting settings based on market conditions and the performance of strategy providers is essential for effective risk management.
While Deriv cTrader provides the convenience of copying experienced traders, it's essential for you to take an active role in managing your risk and portfolio. These strategies can help you limit potential losses and achieve a more balanced and responsible copy trading experience.

Financial markets rally as US inflation data comes close to expected
Read our latest blog for details on the CPI release on 14 Nov 2023, market reactions, and key developments leading to global impact.
With the US inflation data coming in close to expected and increasing the potential for easing by the end of 2024, the subsequent market reactions suggest expectations were on the stronger side. Stocks continued their optimistic rally, and the US dollar weakened, triggering a wave of optimism and speculation about a potential easing in the Federal Reserve's (Fed) rate hike trajectory.
Key developments
- US Consumer Price Index (CPI): The CPI for October remained unchanged, defying forecasts of a 0.1% increase. This critical indicator's stability suggests a potential shift in the Fed’s monetary policy stance.
- Core CPI: The core CPI saw a modest rise of just 0.2%, lower than the anticipated 0.3%.
- Stock market response: This data spurred a rally in global stocks, with significant gains in Asian markets and a strong performance by the Nasdaq Composite. Notably, the US500 index edged closer to the upper end of its recent range, standing at around 4524.
Market responses
- Bond market: Bond prices surged, inversely affecting yields and reflecting a market recalibration of interest rate expectations. The US yield curve is pricing in no further rate hikes and instead, the probability of a rate cut in 2024 is increasing.
- Currency movements: The US dollar weakened, particularly against risk-sensitive currencies. In forex markets, the USD/JPY pair fell to a low of 150.153 but didn’t drop as much as expected, showing signs of continued JPY weakness. Meanwhile, GBP/USD rallied to just above 1.25.
- Yields: Two-year Treasury yields dropped, mirroring the market's reassessment of the Fed’s imminent policy decisions.
Analyst insights
- Some financial analysts are optimistic, viewing these trends as signs of easing inflationary pressures. Others are not so optimistic, pointing to wars in Ukraine and Gaza as further stimulus for inflationary pressures. The Fed will no doubt want to receive more data before they provide the markets with a stronger signal for easing.
Global impact
- China: The People's Bank of China has responded by increasing liquidity and maintaining a steady interest rate policy.
- Japan: The Bank of Japan adjusted its bond purchasing strategy, reflecting a global reaction to the US data.
Looking forward
- Retail sales data: October's retail sales figures are attracting significant attention following their impressive performance in September. A weaker reading could prompt speculation about slowing growth contributing to reduced inflation, potentially influencing expectations for a more cautious approach from the Fed. However, it's worth noting that US economic data has frequently outperformed expectations. Therefore, it may still be too early to anticipate a series of weaker economic indicators.
- The financial market remains sensitive to economic indicators, seeking to understand the direction of both the US and global economies.
Conclusion
Following yesterday’s US inflation release, there might be a potential for a policy shift, however, it's still too early to determine exactly what direction this might take. Presently, stocks continue their upward trajectory, buoyed by optimism. If markets are too hasty in anticipating easing, it could potentially lead to some trading opportunities.
Deriv’s Market Radar, 14 November
%2520(1).webp)
Market Radar: 14 Nov 2023 - Brace for impact from US CPI
Today's 'Market Radar' zeroes in on the highly anticipated US CPI data release and potential ripple effects across global markets.
Today's 'Market Radar' zeroes in on the highly anticipated US CPI data release and potential ripple effects across global markets. Join us as we delve into expert predictions about the inflation figures and analyse their likely impact on key investment domains, including stocks, currencies, and commodities.
In this comprehensive update, we're not just looking at numbers but deciphering what they mean for traders like you. We'll dissect how the latest CPI data could steer market sentiment and strategy, primarily focusing on significant movers such as the USD/JPY pair.
Moreover, we'll spotlight pivotal UK economic data and other crucial market levels that could signify turning points for investors. Stay ahead in the trading game with our in-depth analysis and strategic insights.
Whether you're a seasoned trader or just starting, understanding these market dynamics is critical to navigating the trading world successfully.
Please visit blog.deriv.com for more such insights.
Sorry, we couldn’t find any results matching .
Search tips:
- Check your spelling and try again
- Try another keyword