Risultati per

USD/JPY in bilico nella zona di pericolo: il Giappone può fermare la salita a 160?
L'USD/JPY si aggira in quella che i trader ora chiamano la «zona di pericolo», l'intervallo 155-160 che in precedenza aveva forzato la mano del Giappone.
L'USD/JPY si aggira in quella che i trader ora chiamano la «zona di pericolo», il range 155-160 che in precedenza aveva forzato la mano del Giappone. La coppia sta testando livelli che, se superati, potrebbero costringere Tokyo a intervenire ancora una volta per difendere lo yen, secondo gli analisti. Per i mercati, questa non è solo una soglia psicologica; è una linea tracciata dalla storia. Ogni avvicinamento a 160 fa rivivere i ricordi degli interventi passati e delle speculazioni su quanto il Giappone lascerà indebolire la sua valuta prima di intervenire.
I rapporti hanno affermato che al centro della tensione c'è una crescente divergenza tra l'espansione fiscale del Giappone e il suo prudente orientamento monetario. Il piano di stimolo del primo ministro Sanae Takaichi da 21,3 trilioni di yen (112 miliardi di sterline) ha spinto i rendimenti al rialzo e indebolito ulteriormente lo yen, proprio mentre gli Stati Uniti mantengono alti i tassi di interesse.
La domanda ora è se il Giappone può o vuole agire in tempo per fermare la crescita dell'USD/JPY prima che superi i 160 e metta alla prova la determinazione di Tokyo sulla scena globale.
Cosa sta guidando l'USD/JPY?
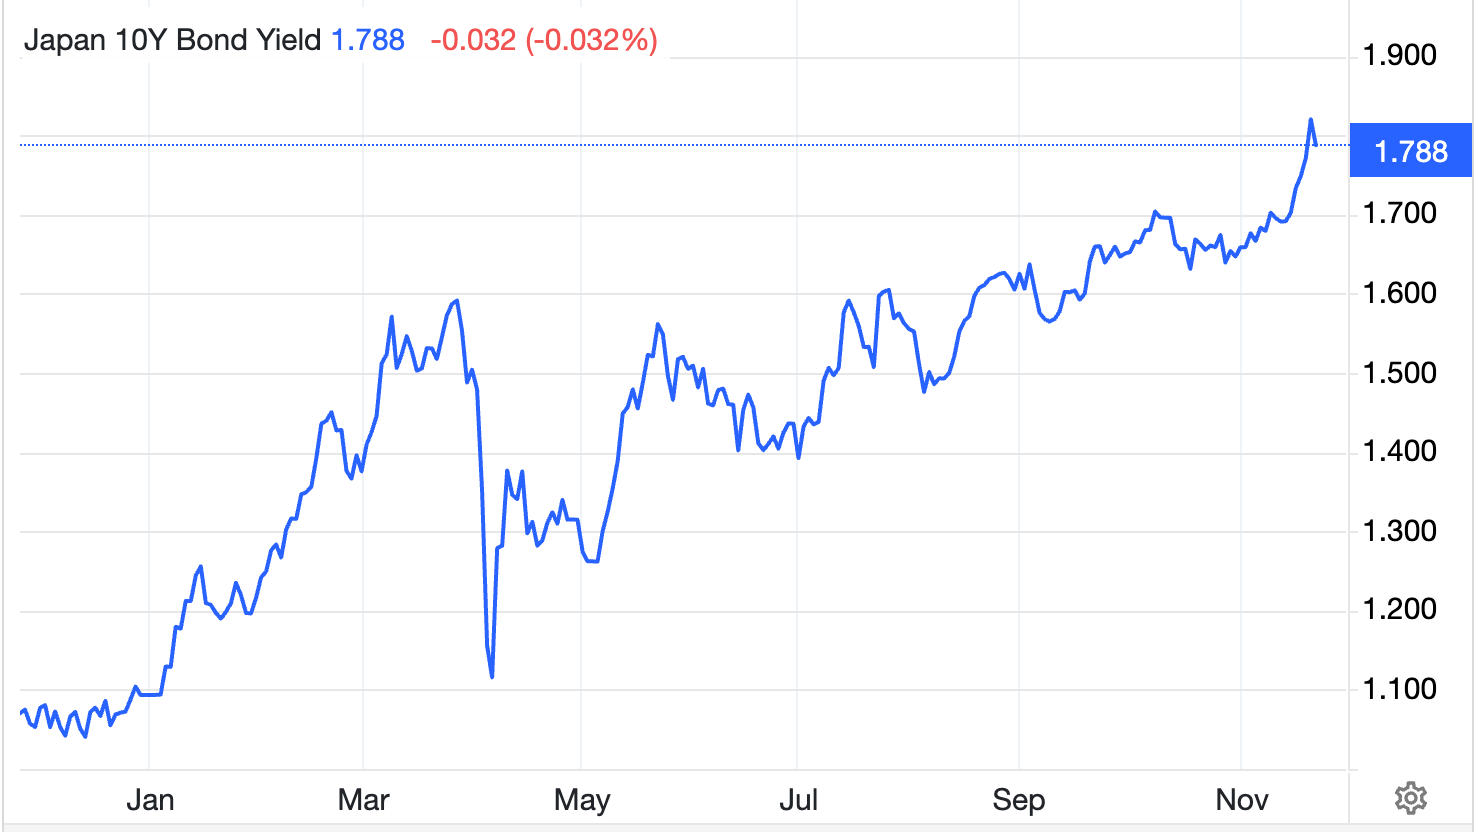
L'ultimo calo dello yen è dovuto al crescente divario politico del Giappone con gli Stati Uniti. Lo stimolo di Takaichi, il maggiore dopo la pandemia, include la spesa per gli sgravi energetici, le agevolazioni fiscali e le erogazioni di denaro. Mira ad allentare le pressioni sul costo della vita, eppure gli investitori lo considerano inflazionistico e fiscalmente imprudente. Bloomberg ha riferito che i rendimenti dei titoli di Stato giapponesi (JGB) sono saliti ai massimi dal 2008, con l'aggravarsi delle preoccupazioni sul debito e il calo della fiducia nella disciplina fiscale a lungo termine
L'atteggiamento prudente della Banca del Giappone ha solo amplificato la pressione. Il governatore Kazuo Ueda continua a sostenere che la crescita dei salari deve stabilizzarsi prima di qualsiasi importante cambiamento politico, anche se l'inflazione rimane al di sopra dell'obiettivo del 2%.

Al contrario, la Federal Reserve ha mantenuto i tassi di interesse statunitensi elevati e rimane riluttante a tagliare rapidamente. Questo differenziale di rendimento rende più remunerativo detenere dollari, facendo defluire capitali dallo yen e mantenendo l'USD/JPY vicino ai massimi pluriennali.
Perché è importante
Gli osservatori del mercato affermano che la debolezza dello yen incide in entrambe le direzioni. Una valuta più debole avvantaggia esportatori come Toyota e Sony, i cui guadagni all'estero si traducono in maggiori profitti. Tuttavia, per gli importatori e le famiglie, il dolore è immediato. Il Giappone dipende fortemente dai carburanti e dagli alimenti importati, il che significa che ogni centimetro in più in USD/JPY rende la vita quotidiana più costosa. «Lo yen giapponese in termini reali effettivi è debole quasi quanto la lira turca», ha avvertito Robin Brooks della Brookings Institution, descrivendo l'orientamento fiscale del governo come una «negazione del debito».
Oltre i confini del Giappone, lo yen funge da barometro globale del sentimento di rischio. Quando si indebolisce bruscamente, segnala una crescente fiducia nel dollaro e incoraggia le strategie di carry trade finanziate in yen. Ma aumenta anche il rischio di brusche inversioni in caso di intervento di Tokyo. I mercati ricordano ancora il periodo di metà anno, quando il Giappone avrebbe speso oltre 60 miliardi di dollari per difendere la propria valuta dopo che l'USD/JPY aveva superato brevemente i 160. Questa eredità fa sì che ogni mossa all'interno di questa band sembri un conto alla rovescia.
Impatto sui mercati e sulla strategia
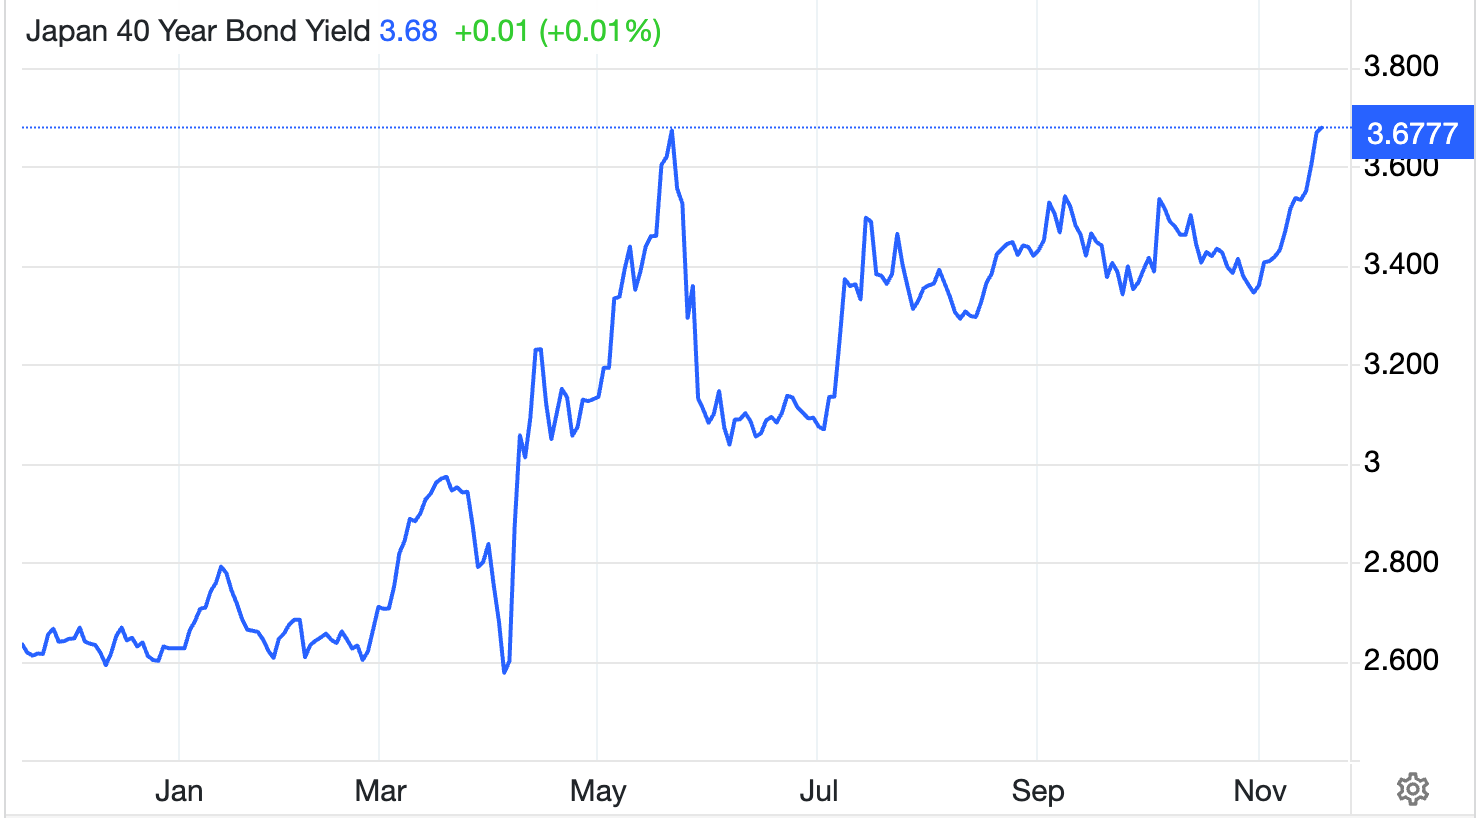
Nei mercati obbligazionari, gli investitori chiedono rendimenti più elevati per compensare il rischio fiscale, spingendo i tassi JGB decennali sopra l'1% e i rendimenti a quarant'anni oltre il 3,6%. L'aumento riflette la preoccupazione che il debito del Giappone, già più del doppio della sua economia, possa aumentare ulteriormente nell'ambito dell'agenda a favore della crescita di Takaichi.
Il ministro delle Finanze Satsuki Katayama ha già avvertito che il governo «agirà contro le mosse disordinate», una frase che i trader ora interpretano come una velata minaccia di intervento.
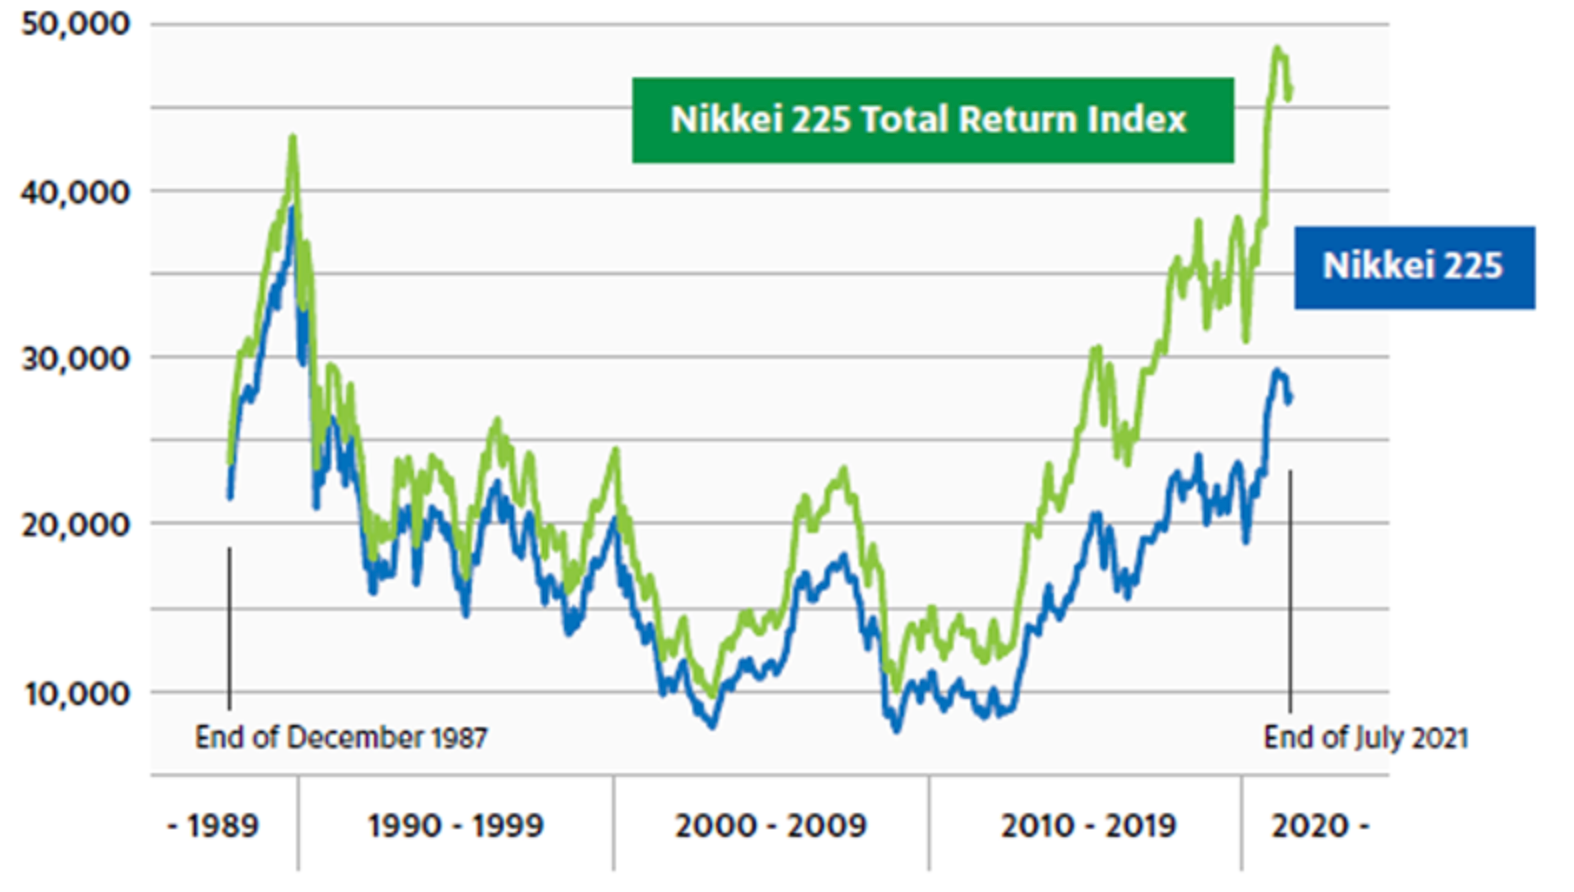
Per gli investitori azionari, lo yen più debole ha dato una spinta a breve termine. Il Nikkei 225 è salito al livello più alto degli ultimi decenni, sostenuto dai titoli fortemente esportati e dagli utili inaspettati all'estero.
Tuttavia, ciò ha un costo: la fiducia dei consumatori è diminuita e le aspettative di inflazione sono in aumento. A livello globale, la debolezza dello yen alimenta la propensione al rischio, carburante per le azioni e persino per le criptovalute, ma lascia i mercati vulnerabili a una brusca correzione se Tokyo o la BoJ dovessero cambiare improvvisamente posizione.
Per i trader al dettaglio, questa volatilità presenta opportunità e rischi in egual misura. Con un'elevata volatilità attorno ai livelli chiave, il dimensionamento disciplinato delle posizioni e il monitoraggio dei margini diventano essenziali: strumenti come Calcolatrice Deriv può aiutare i trader a stimare i valori dei pip, le dimensioni dei contratti e i potenziali profitti o perdite prima di entrare nel mercato.
Prospettiva degli esperti
Le previsioni per l'USD/JPY dipendono dai tempi. Se la BoJ alzasse i tassi allo 0,75% a dicembre, come prevede una risicata maggioranza degli economisti, lo yen potrebbe registrare un rally di sollievo verso quota 150.
Tuttavia, se la banca centrale ritarda e i dati statunitensi rimangono invariati, i trader potrebbero continuare a testare il limite superiore dell'intervallo. «Lo stimolo in stile Abenomics di Sanae Takaichi aumenterà la liquidità globale e rafforzerà il dollaro: King Dollar è vivo e vegeto», ha dichiarato James Thorne di Wellington Altus.
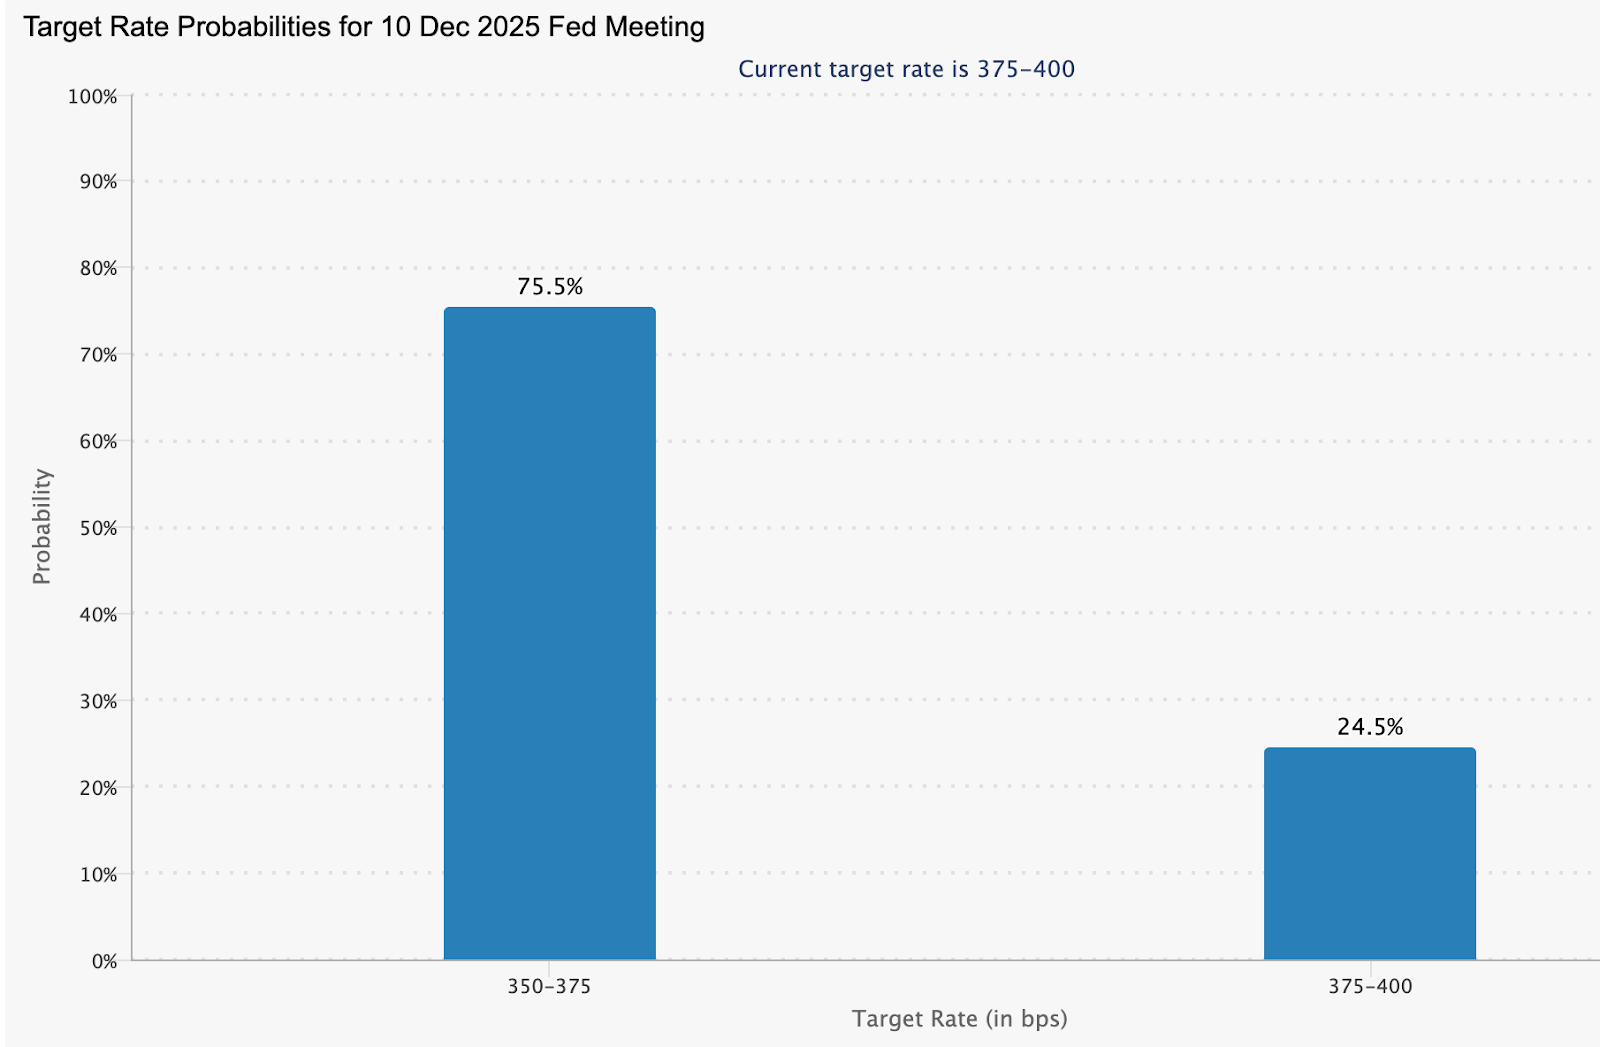
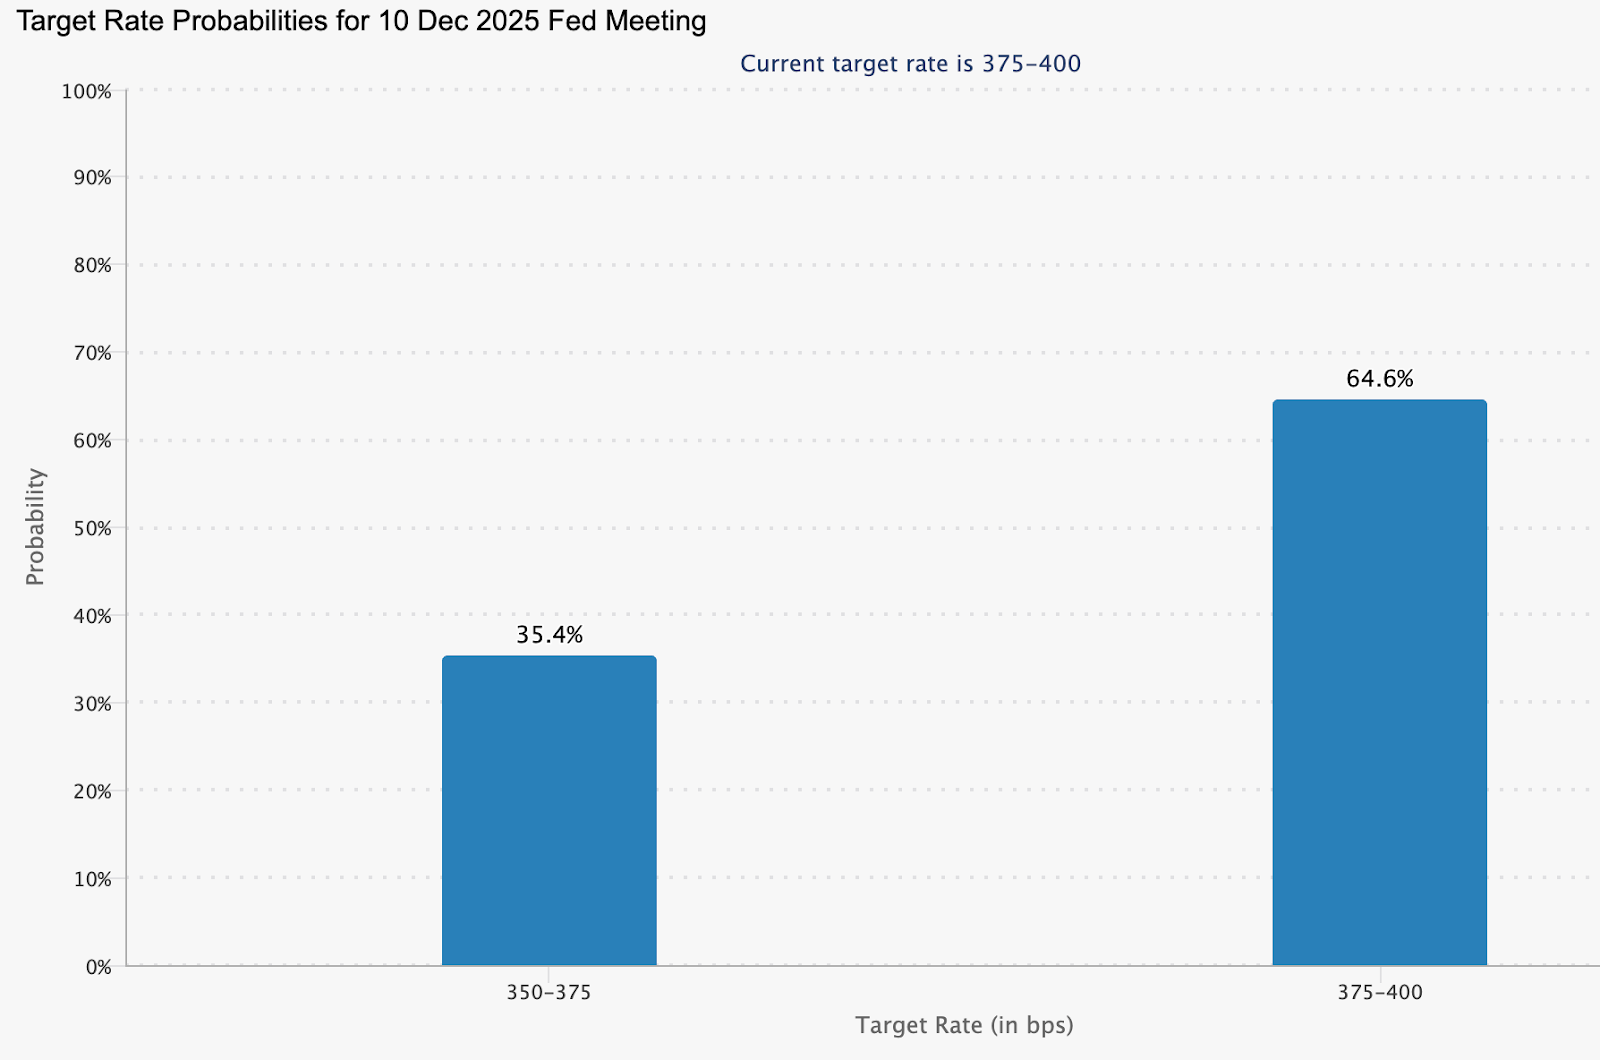
Molto dipende dal fatto che la Fed cambi rotta prima della BoJ. Attualmente i mercati dei futures prevedono una probabilità del 75,5% di un taglio dei tassi negli Stati Uniti a dicembre.
Gli analisti hanno anche aggiunto che un atteggiamento accomodante Fed potrebbe ridurre il divario di rendimento e innescare l'acquisto di yen. Ma in assenza di ciò, la valuta giapponese rimane ostaggio dell'inerzia politica e del sentimento globale. Più a lungo l'USD/JPY rimane vicino a 160, maggiore è la pressione su Tokyo perché dimostri di essere ancora rispettata dal mercato.
Approfondimenti tecnici sull'USD/JPY
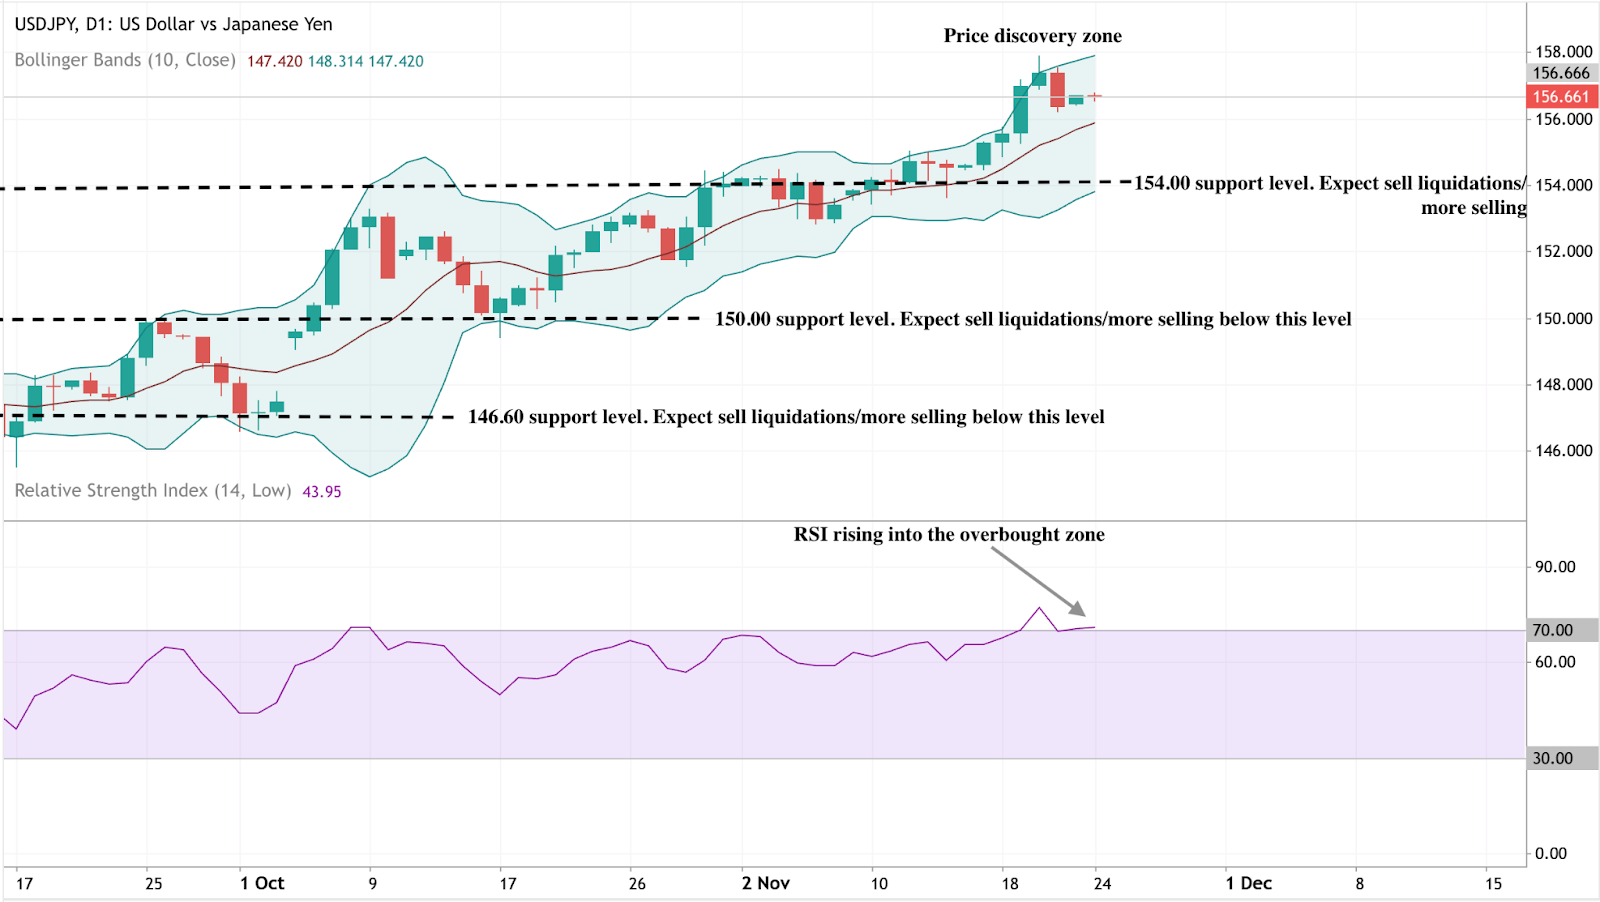
Al momento, la coppia USD/JPY viene scambiata vicino a 156,66, consolidandosi all'interno di una zona di scoperta dei prezzi dopo un prolungamento rialzista correre. Le bande di Bollinger (10, chiusura) si stanno allargando, mostrando una maggiore volatilità e una propensione alla continuazione poiché l'azione dei prezzi rimane vicina alla banda superiore, segno di un forte slancio rialzista ma anche di un aumento del rischio di esaurimento a breve termine.
Le principali zone di supporto si collocano a 154,00, 150,00 e 146,60, dove una rottura al di sotto di ciascuna potrebbe innescare liquidazioni delle vendite e correzioni più profonde. Al rialzo, la scoperta di prezzi superiori a 156,00 lascia una resistenza limitata, il che significa che i prossimi pullback potrebbero attirare acquirenti in calo a meno che la volatilità non aumenti.
Le RSI (14) sta salendo nella zona di ipercomprato, suggerendo che la forza rialzista potrebbe essere vicina al suo picco. Se l'RSI dovesse mantenere una lettura superiore a 70, il momentum potrebbe aumentare; tuttavia, qualsiasi inversione al di sotto di questo livello potrebbe indicare una presa di profitto o una futura pressione di vendita anticipata.
La chiave da asporto
Secondo gli analisti, il ritorno dell'USD/JPY nel corridoio 155-160 è più di un semplice schema grafico; è un referendum sul mix di politiche del Giappone. L'espansione fiscale senza un corrispondente aggiustamento monetario ha lasciato lo yen vulnerabile e gli investitori sono scettici. L'intervento può stabilizzare i mercati per un breve periodo, ma solo un inasprimento decisivo o una restrizione fiscale ripristineranno la fiducia. Fino ad allora, la coppia si trova esattamente nella zona di pericolo, dove ogni rialzo mette alla prova non solo la tolleranza di Tokyo, ma anche la fiducia del mondo nella capacità del Giappone di controllare la propria valuta.

Il trimestre da record di Nvidia riceve un'accoglienza fredda dal mercato
Nonostante l'impennata di Nvidia e la guidance rivista al rialzo a circa 65 miliardi di dollari per il prossimo trimestre, la reazione del mercato è stata stranamente contenuta.
Quando Nvidia Corporation ha riportato ricavi per il terzo trimestre pari a 57 miliardi di dollari - in aumento del 62% su base annua - sembrava un'altra vittoria impeccabile nella corsa all'hardware AI. Eppure, nonostante l'impennata e la guidance rivista a circa 65 miliardi di dollari per il prossimo trimestre, la reazione del mercato è stata stranamente contenuta.
In una riunione generale trapelata, il CEO Jensen Huang ha ammesso: “Il mercato non l'ha apprezzato.” Questo scollamento tra esecuzione e entusiasmo rivela quanto le aspettative elevate - e l'euforia per l'AI - abbiano alzato l'asticella anche per i migliori performer.
Cosa guida il trimestre da record di Nvidia
Il motore dei risultati di Nvidia resta la domanda dei data centre - la spina dorsale dell'infrastruttura AI. Solo questo segmento ha generato circa 51 miliardi di dollari di ricavi, in crescita del 66% su base annua e del 25% rispetto al trimestre precedente.

Prodotti di punta come la piattaforma Blackwell continuano a dominare gli ordini aziendali, mentre la guidance ora indica un altro trimestre da record - 65 miliardi di dollari di ricavi, crescita del 65% su base annua. Nvidia non sta semplicemente crescendo; sta definendo il ritmo dell'intero ciclo di spesa in conto capitale del settore.
Forze geopolitiche e strutturali amplificano questa crescita. Con il cloud, la robotica e i sistemi autonomi che si espandono a livello globale, l'hardware di Nvidia si trova al centro dell'innovazione - e al collo di bottiglia dell'offerta. Ma con il successo arriva la fragilità: quando la perfezione diventa la norma, anche la minima incertezza sembra un terremoto. “Quando hai abituato il mercato ad aspettarsi la perfezione,” ha scherzato un analista, “anche l'eccellenza non basta.”
Perché è importante
Nvidia ora rappresenta circa il 7,31% del peso totale dell'S&P 500, rendendola il singolo barometro più influente del sentiment sull'AI. Un titolo di queste dimensioni che si muove lateralmente dopo un trimestre da record suggerisce che gli investitori non stanno mettendo in dubbio i dati, ma la narrazione.
FinancialContent l'ha definito “un momento cruciale per l'AI e il mercato più ampio.” Se l'eccellenza di Nvidia non entusiasma più, il resto del settore tech sentirà il gelo.
Lo stesso Huang l'ha detto chiaramente: se consegni un trimestre negativo, ti accusano di aver fatto scoppiare la bolla; se ne consegni uno ottimo, ti accusano di alimentarla. Questa trappola percettiva evidenzia una nuova fase nel commercio AI - una in cui i risultati devono essere oltre l'eccezionale per muovere i mercati. Riflette anche un cambiamento sottile: dall'hype e dalle promesse alla disciplina e alla concretezza.
Impatto sull'ecosistema tech & AI
La pubblicazione dei risultati di Nvidia ha inizialmente sollevato le azioni tech su tutta la linea, con AMD, Broadcom e i fornitori di memoria che hanno cavalcato l'ottimismo. Ma con il passare della giornata, quei guadagni sono svaniti - prova che l'entusiasmo è diventato fragile.
Secondo gli analisti, se risultati eccezionali non innescano più un rally, significa che gran parte della crescita dell'infrastruttura AI è già scontata nei prezzi. Gli investitori potrebbero ora premiare l'efficienza operativa più che la semplice espansione. È un'evoluzione naturale: quando la crescita matura, subentra la disciplina nella valutazione.
Per gli acquirenti di hardware e gli utenti aziendali, questa evoluzione potrebbe significare condizioni di fornitura leggermente più facili ma prezzi più rigidi. La sfida di Nvidia sarà mantenere i margini mentre aumenta la produzione - un passaggio dalla crescita visionaria alla precisione industriale.
Prospettive degli esperti
Gli osservatori di mercato dicono che ci sono due strade davanti. Se Nvidia continua a eseguire - ampliando nuove linee di prodotto, aumentando la capacità produttiva e gestendo i rischi di esportazione - potrà mantenere la leadership e prolungare la sua corsa. L'azienda detiene ancora un fossato tecnologico che pochi possono superare.
L'altro scenario è quello di un reset della valutazione: se gli investitori iniziano a chiedersi se la crescita dell'hardware possa superare indefinitamente l'inflazione dei costi e la concorrenza, Nvidia potrebbe affrontare una fase di stallo. Come ha detto un analista di Bernstein: “Non so cos'altro si possa chiedere, almeno sui risultati.”
Per i trader, i segnali da monitorare sono le tendenze della guidance, gli aggiornamenti sul backlog (soprattutto in Cina) e il ritmo di lancio dei chip Rubin e Blackwell. Una variazione di capitalizzazione di mercato di mezzo trilione di dollari in poche settimane mostra quanto il sentiment sia diventato sensibile.
Approfondimenti tecnici su Nvidia
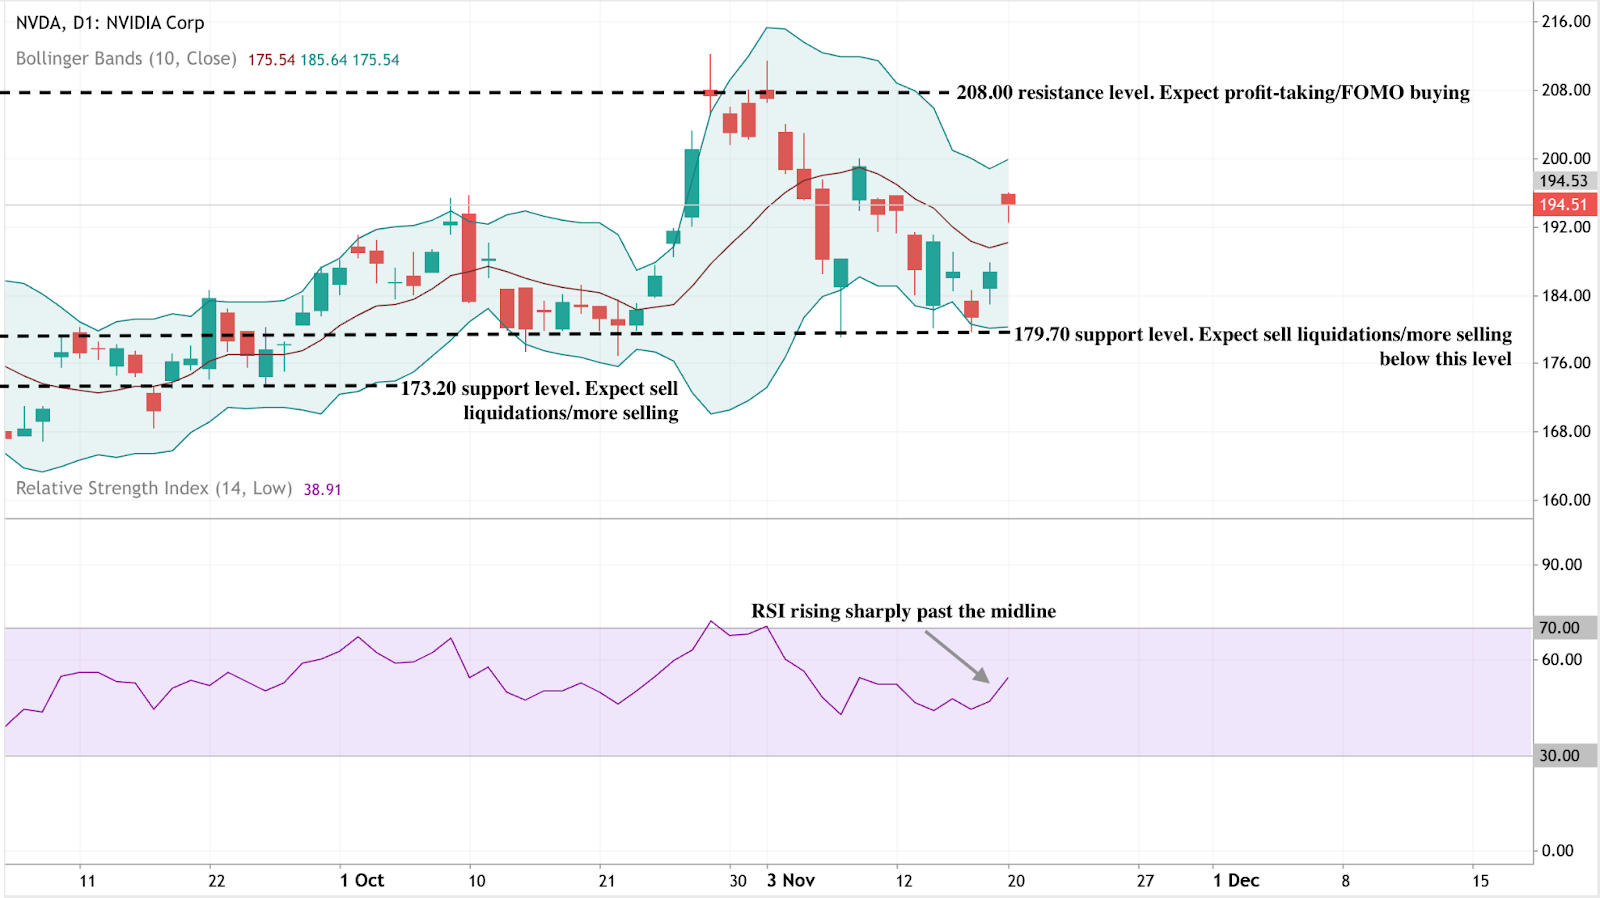
Al momento della scrittura, Nvidia (NVDA) scambia intorno a 194,50 dollari, rimbalzando dalla banda inferiore di Bollinger dopo aver testato il livello di supporto a 179,70 dollari. Le Bande di Bollinger (10, close) si stanno moderatamente allargando - segno di una volatilità in aumento - con il prezzo che gravita verso la linea mediana. Questo suggerisce una possibile continuazione verso la banda superiore nel breve termine.
Il livello di 173,20 dollari si distingue come prossimo supporto chiave; una rottura al di sotto potrebbe innescare liquidazioni e amplificare la pressione ribassista. Al contrario, i 208,00 dollari formano una forte zona di resistenza dove potrebbero emergere sia prese di profitto che acquisti FOMO di fine ciclo se il rally dovesse continuare.
Gli indicatori di momentum rafforzano la tesi rialzista. L'RSI (14) è salito bruscamente, superando la linea mediana intorno a 50 - un segnale tecnico di rinnovata pressione d'acquisto. Un movimento sostenuto sopra quel livello, supportato dalla stabilità sopra i 179,70 dollari, rafforzerebbe un trend rialzista di breve periodo e riattiverebbe l'interesse dei trader focalizzati sui movimenti di momentum.
Per chi mappa scenari, il calcolatore Deriv può essere utile per simulare profitti e perdite in diversi contesti di volatilità - un complemento essenziale all'analisi grafica nella pianificazione delle operazioni NVDA su Deriv MT5.
Conclusione chiave
Gli investitori vedono Nvidia come il nucleo del boom dell'infrastruttura AI - finanziariamente ineguagliata e tecnologicamente dominante. Tuttavia, la risposta tiepida del mercato segna un punto di svolta: gli investitori non premiano più le promesse, ma solo le prove concrete. In questa nuova fase del commercio AI, esecuzione, resilienza dei margini e ritmo dell'innovazione definiranno la leadership. Per i trader, il grafico di Nvidia può suggerire un rialzo di breve periodo, ma la storia più ampia è quella di aspettative in evoluzione - dove la perfezione è ora la base, non la sorpresa.

Prospettive sul prezzo dell'oro: le banche centrali stanno fornendo un piano minimo
Dietro il rumore delle deboli scommesse sul taglio dei tassi e della forza del dollaro si nasconde una forza strutturale più profonda: l'incessante acquisto di oro da parte delle banche centrali mondiali.
La notevole stabilità dell'oro vicino ai 4.050 dollari l'oncia non è un caso, secondo i rapporti. Dietro il rumore delle deboli scommesse sul taglio dei tassi e della forza del dollaro si nasconde una forza strutturale più profonda: gli acquisti incessanti da parte delle banche centrali di tutto il mondo. Da Pechino ad Ankara, i politici stanno riscrivendo silenziosamente le regole di sicurezza monetaria, utilizzando l'oro come copertura contro il rischio politico, l'instabilità valutaria e la perdita di fiducia nell'ordine finanziario statunitense.
Questa domanda è diventata la mano invisibile che sostiene i lingotti, secondo gli analisti. Anche se i trader speculativi si ritirano e i flussi degli ETF si appiattiscono, gli acquirenti sovrani stanno contribuendo ad ancorare il mercato.
Con la People's Bank of China che ha esteso la sua serie di acquisti di oro per 12 mesi e le altre banche centrali che stanno seguendo l'esempio, il rischio di ribasso dell'oro ora sembra più una pausa che un crollo: un pavimento rafforzato dalle nazioni, non dai fondi.
Cosa sta guidando l'oro in questo momento?
Gli ultimi dati sull'occupazione negli Stati Uniti hanno azzerato le aspettative nei mercati globali. Il rapporto di settembre sui salari non agricoli ha mostrato un aumento di 119.000 posti di lavoro, più del doppio di quanto previsto dagli economisti, mentre la disoccupazione è salita al 4,4%.

In apparenza, i dati sembrano contrastanti (forti assunzioni ma rallentamento dello slancio), ma sono stati sufficienti a spingere gli investitori a respingere le loro richieste di un taglio dei tassi di dicembre da parte della Federal Reserve.
Questa ricalibrazione ha alzato i rendimenti del dollaro e degli Stati Uniti, in genere una combinazione tossica per l'oro. Ma il metallo ha resistito a malapena. Il motivo è che la domanda delle banche centrali ha alterato la sensibilità dell'oro ai cicli politici.
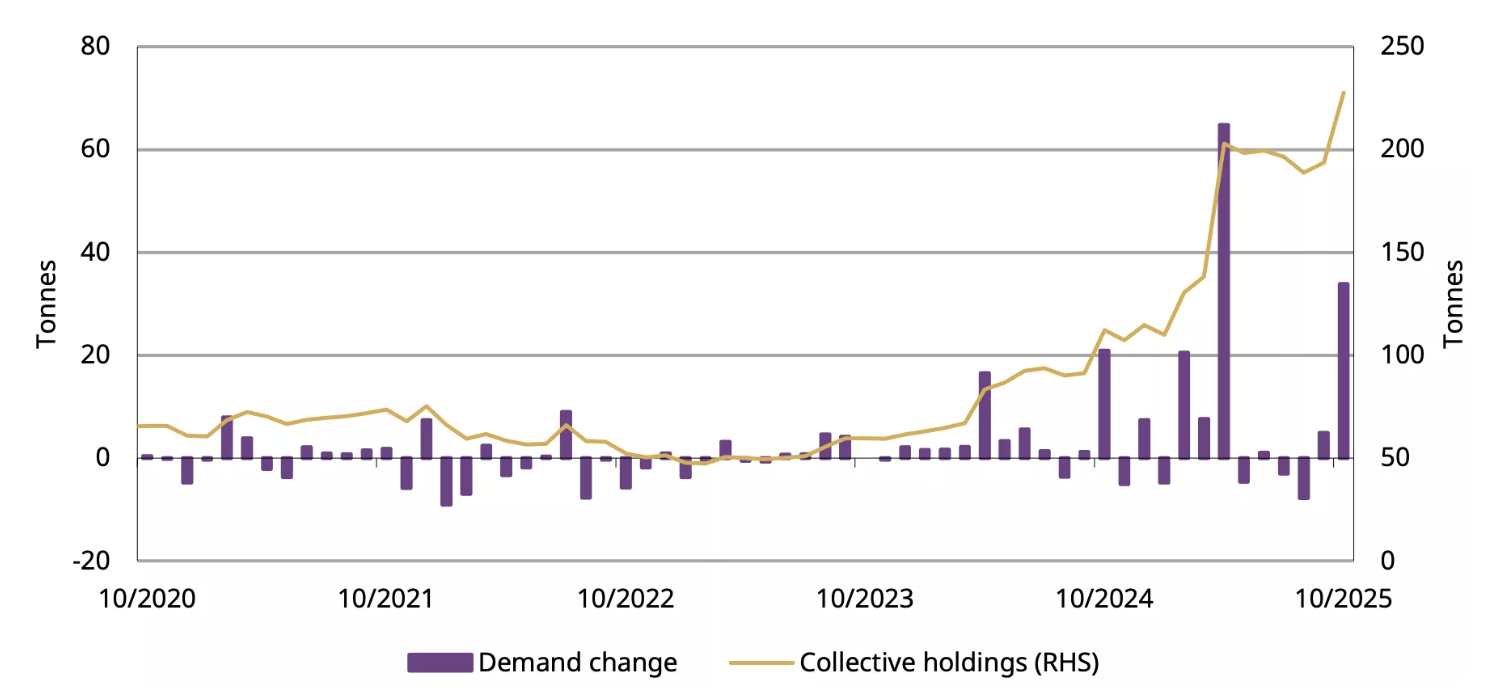
Secondo i dati del World Gold Council, gli acquisti ufficiali del settore rappresentano ora quasi un quarto della domanda annua, un cambiamento strutturale rispetto a dieci anni fa. Quando la Fed esita, le banche centrali no.
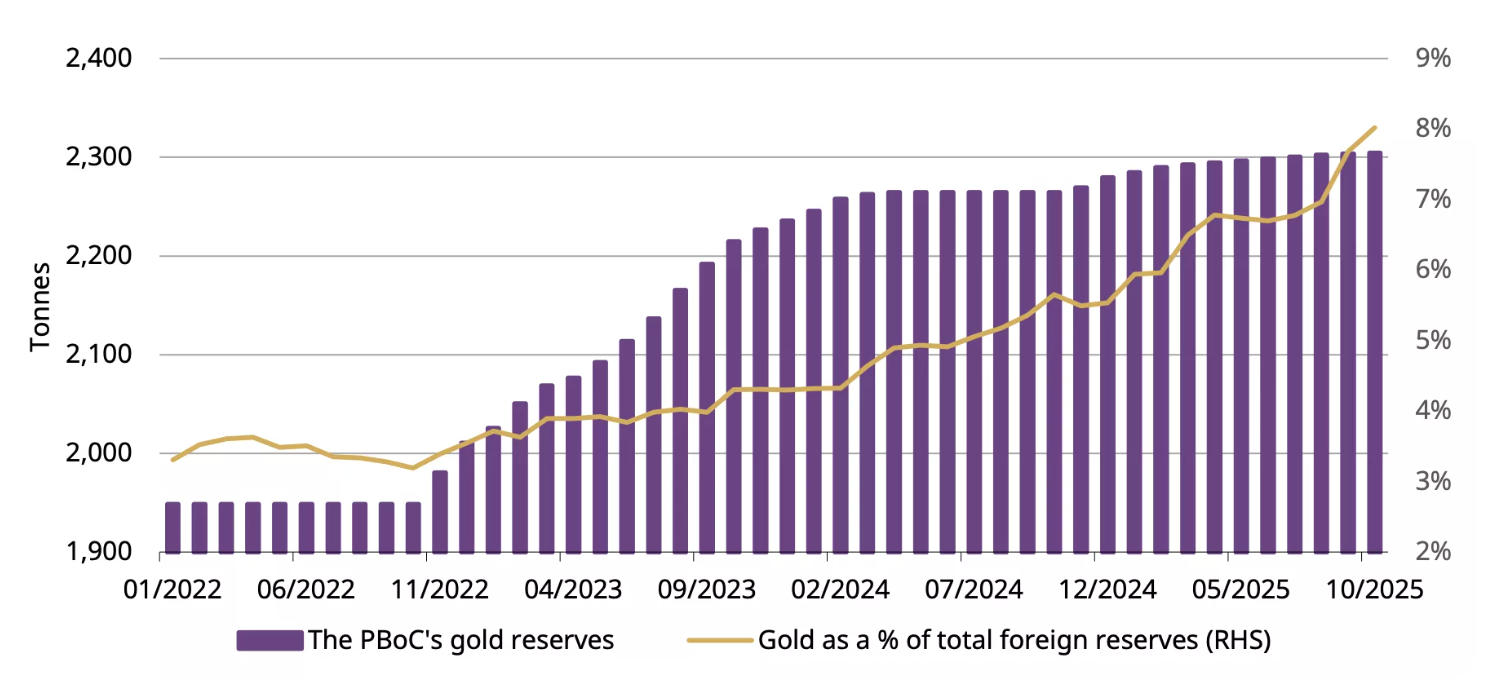
La People's Bank of China (PBoC) ha registrato acquisti di oro per 12 mesi consecutivi, aggiungendo 0,9 t a ottobre, portando il totale a 2.304 t, pari all'8% delle riserve valutarie cinesi e segnando un anno intero di acquisti ininterrotti. Turchia, Polonia e India hanno tutte aderito alla tendenza all'accumulazione.
Perché è importante
Gli osservatori del mercato affermano che questa silenziosa accumulazione sovrana sta rimodellando il ruolo dell'oro nel sistema finanziario globale. Quello che prima era un commercio «avverso al rischio» fa ora parte della strategia delle riserve nazionali. Il congelamento degli asset esteri russi nel 2022 ha spinto i governi a rivalutare la loro esposizione al sistema dominato dal dollaro e l'oro è emerso come alternativa neutrale.
Come afferma Peter Grant, stratega di Zaner Metals, gli ultimi dati sull'occupazione negli Stati Uniti «confermano un mercato in rallentamento ma stabile, ma ciò non riduce la propensione alla sicurezza».
Per i responsabili politici dei mercati emergenti, l'oro offre qualcosa che gli asset cartacei non possono offrire: isolamento dalle sanzioni, dall'inflazione e dalla politica valutaria. Per gli investitori, ciò significa che il prezzo dell'oro non è più solo una funzione dei tassi di interesse o della propensione al rischio. È un indicatore geopolitico, uno specchio di quanta fiducia rimane nell'attuale ordine monetario.
Impatto sui mercati e sugli investitori
Il cambiamento più evidente di questo ciclo è che l'oro si mantiene vicino ai massimi storici anche se l'indice del dollaro USA (DXY) viene scambiato al livello più forte da mesi. La tradizionale relazione inversa si è indebolita. Secondo gli analisti, entrambi gli asset vengono acquistati per lo stesso motivo: la sicurezza. Questa dinamica mette in discussione l'idea che l'oro aumenti solo quando i tassi scendono.
Per i trader, ciò complica il posizionamento a breve termine. Con l'oro ora inferiore di circa il 7% rispetto al record di ottobre di 4.380 dollari, il momentum si è raffreddato, ma la domanda strutturale rimane intatta. I flussi degli ETF, sebbene leggermente negativi nelle ultime settimane, non mostrano segni di panico.
Gli investitori al dettaglio hanno ridotto l'esposizione, ma il settore ufficiale li ha sostituiti come acquirenti marginali. Per gli investitori a lungo termine, questo cambiamento suggerisce che i pullback possono offrire opportunità anziché avvertimenti, soprattutto se l'incertezza macroeconomica si aggrava fino al 2026.
Prospettiva degli esperti
Gli analisti rimangono divisi su quanto questa offerta della banca centrale possa portare il metallo. Goldman Sachs vede ancora la recente debolezza come «un rallentamento, non un'inversione», sostenendo che sia la domanda di investimenti sovrani che quelli privati sosterranno i prezzi fino al 2026. UBS prevede una possibile ascesa a 4.900 dollari l'oncia entro i prossimi due anni, ipotizzando una continua diversificazione a favore delle riserve in dollari.
Il rischio principale per tale prospettiva risiede nell'autocompiacimento monetario. Se i dati statunitensi restano solidi e la Fed riafferma la sua posizione «più alta più a lungo», l'interesse speculativo potrebbe svanire ulteriormente. Ma per ora, la resilienza dell'oro parla da sé. Il mercato si sta adattando a una nuova realtà, in cui sono le banche centrali, e non i trader, a dare il tono.
Informazioni tecniche sull'oro
In questo momento, l'oro (XAU/USD) viene scambiato intorno alla regione di 4.030$, in bilico vicino al livello di supporto di 4.020$. Il RSI è piatto e vicino alla linea mediana, il che indica una mancanza di forte slancio in entrambe le direzioni, un segno di indecisione del mercato.
Nel frattempo, Bande di Bollinger hanno iniziato a restringersi, riflettendo una minore volatilità dopo le recenti oscillazioni. Il prezzo oscilla vicino alla fascia media, suggerendo una potenziale fase di consolidamento prima del prossimo breakout.
Al rialzo, 4.200 e 4.365 dollari rimangono livelli di resistenza chiave, dove i trader possono aspettarsi prese di profitto o un rinnovato interesse all'acquisto in caso di ritorno del sentimento rialzista. Al contrario, una rottura al di sotto dei 4.020 dollari potrebbe aprire la porta al supporto di 3.940 dollari, dove potrebbero verificarsi maggiori pressioni di vendita o liquidazioni.

Conclusioni chiave
La resilienza dell'oro alla fine del 2025 non è un mistero, è un messaggio espresso dagli analisti. Le stesse istituzioni che un tempo si fidavano dei titoli del Tesoro degli Stati Uniti stanno ora acquistando lingotti per assicurarsi contro politiche, politiche e incertezze. I trader possono attenuare il rally, ma le banche centrali non stanno esitando. In quanto Fed in una prospettiva politica divisa e le riserve globali continuano a spostarsi verso est, il minimo sotto l'oro sembra solido quanto le mani che lo tengono.
.png)
Bitcoin’s harsh reset: Flows, fear and two lines that matter
The world’s largest cryptocurrency has shed nearly a third of its value since its October peak, slipping toward critical technical levels as headwinds take effect.
Bitcoin’s harsh reset has arrived. The world’s largest cryptocurrency has shed nearly a third of its value since its October peak, slipping toward critical technical levels as exchange-traded fund outflows and macroeconomic headwinds take effect.
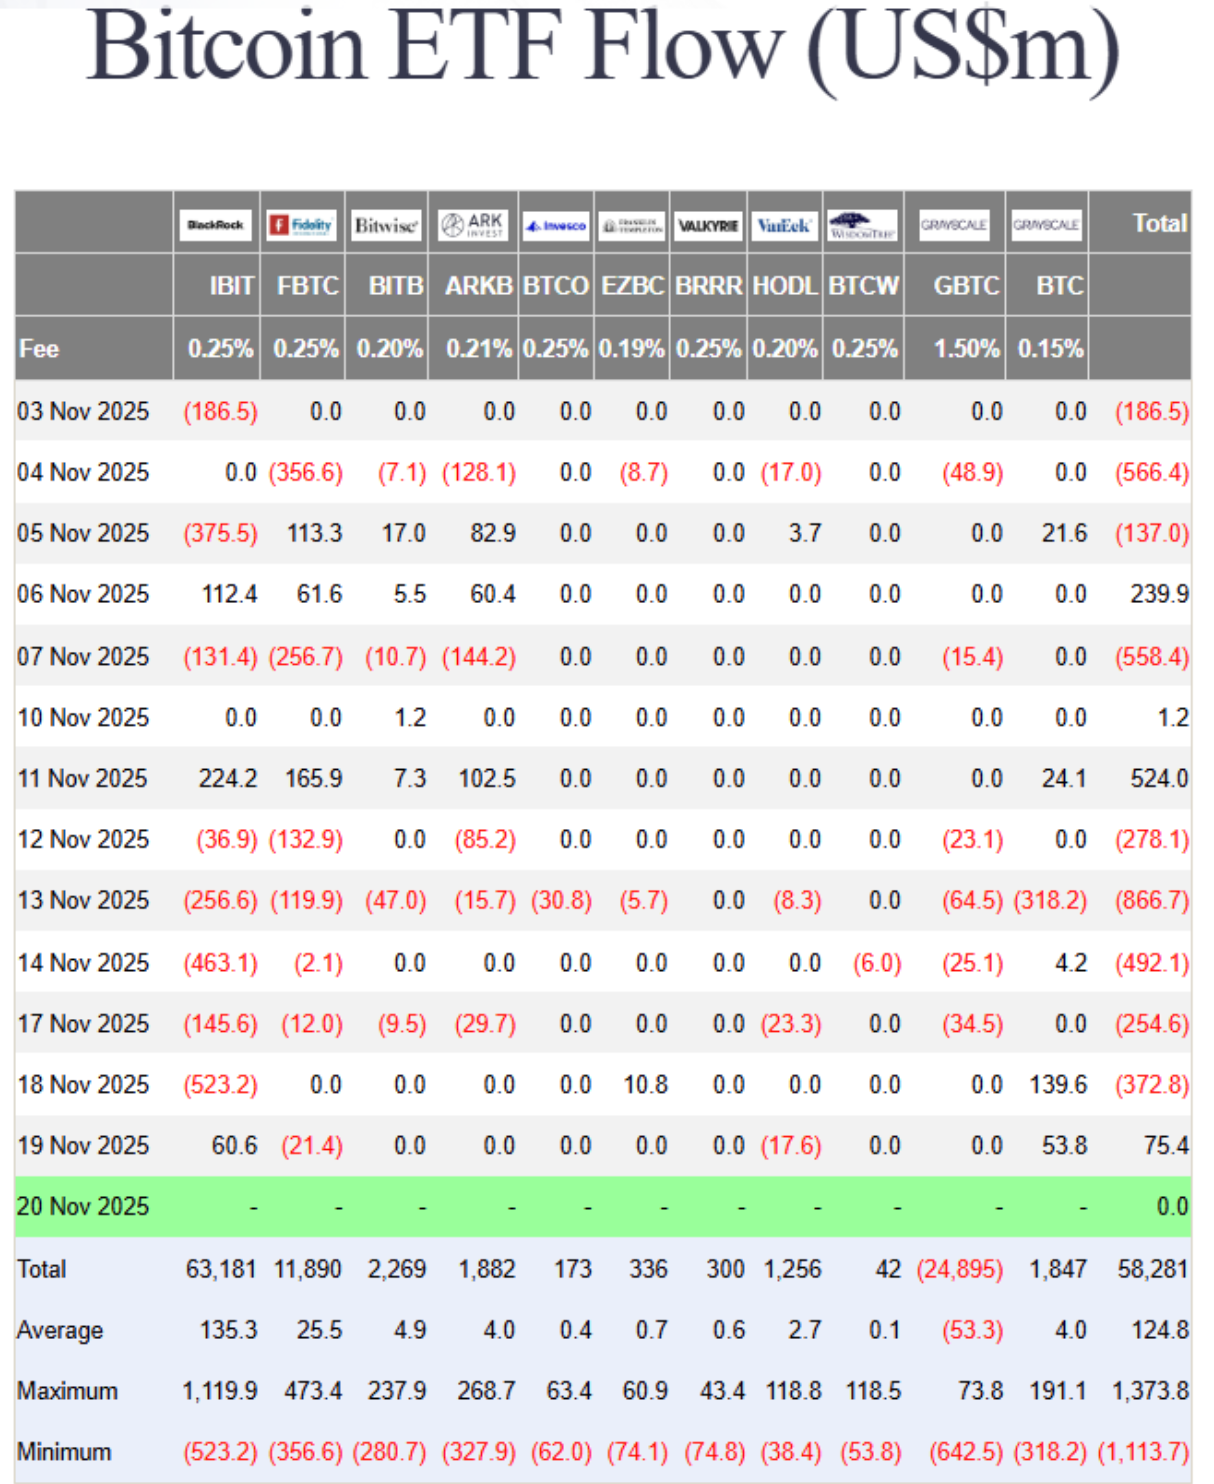
Recent data showed nearly $3 billion has exited Bitcoin ETFs this month alone, turning the same institutional flows that once fuelled the rally into a feedback loop of redemptions and retreat.
Behind the selloff lies a mix of fading Fed-rate-cut hopes, tightening liquidity, and a market paralysed by “extreme fear”. With prices hovering near $85,600 and the one-year low at $74,000 looming, the question is simple but urgent: is this correction a passing flush - or the start of a deeper shift in Bitcoin’s new ETF era?
What’s driving Bitcoin’s correction
Bitcoin’s 30% slide isn’t being driven by scandal or shock - it’s the result of structural forces finally reversing, according to analysts. After two years of relentless inflows, spot Bitcoin ETFs are now experiencing capital outflows. Institutional investors, once hailed as crypto’s stabilisers, are showing how quickly sentiment turns when markets wobble.
According to Farside data, ETF redemptions have occurred on all but four days this month, stripping nearly $3 billion in net outflows.
Part of that retreat stems from shifting macro conditions. The Federal Reserve’s reluctance to confirm rate cuts has strengthened the US dollar, drawing liquidity away from speculative assets.
Past movements have shown that a stronger dollar typically weighs on Bitcoin, and with inflation readings still sticky, traders are reassessing the narrative of “easy money” returning in December. The result is a market where rallies are met with selling rather than enthusiasm - a sharp turn from the euphoria that drove Bitcoin to $126,000 just weeks ago.
Why it matters
Bitcoin’s selloff is revealing just how tightly traditional and digital markets are now intertwined. ETFs opened the floodgates for institutional exposure, but they also linked Bitcoin to broader risk trends. When investors pull money from ETF products, the effect ricochets through liquidity pools and sentiment alike.
As Matt Williams of Luxor explained, “The drop to $86,000 is largely driven by macro forces - rate expectations, inflation - and by large holders cutting exposure after breaking key technical supports.”
For traders, this is a psychological turning point. The same retail crowd that once flooded exchanges during Thanksgiving 2017 - when Bitcoin first crossed $10,000 - is largely silent now.
Social data from Santiment shows sentiment evenly split between predictions of a plunge below $70,000 and wild optimism for a rally to $130,000. The divide signals indecision, not conviction. In this phase, fear - not fundamentals - is setting the tone.

Impact on markets and investors
The selloff has spilled beyond the crypto space. Bitcoin’s correlation with equity indices, such as the Nasdaq 100, has climbed above 0.8 at times, meaning that moves in tech stocks and digital assets now feed off the same macro triggers. When rate optimism fades, both markets suffer. That link cuts against Bitcoin’s long-standing claim as a hedge against monetary risk.
ETF outflows are another pressure point. As funds are redeemed, liquidity providers are compelled to unwind their positions in futures and spot markets, thereby deepening volatility.
The Crypto Fear & Greed Index, which plunged to 14 this week - its lowest since February - underscores how rapidly sentiment has deteriorated. Analysts like Rachael Lucas of BTC Markets warn that momentum, money flow, and volume trends “all reflect a sharp deterioration in sentiment,” driven by macro tightening and risk-off positioning.

In the background, liquidity providers are struggling. Tom Lee of Fundstrat compared crypto market makers to “central banks” of digital liquidity - and right now, those banks are running dry.
Following October’s $20 billion liquidation wave, market makers are operating with smaller balance sheets, which limits their ability to absorb order flow. It’s a reminder that crypto’s plumbing, though more sophisticated, is still fragile.
Expert outlook
Analysts are torn between caution and curiosity. Nic Puckrin of Coin Bureau describes the current landscape as a “bull-bear tug of war,” with macroeconomic pessimism offset by resilience in the tech sector.
Nvidia’s earnings beat briefly lifted risk appetite, but Bitcoin failed to follow through, suggesting traders are still unwinding rather than reloading. Puckrin pegs the next resistance at $107,500, if a rebound can gain traction.
Andre Dragosch of Bitwise sees parallels to past mid-cycle corrections, noting that the depth and duration of this decline “remain consistent with interim pullbacks in previous bull markets.” His base case still anticipates the cycle extending into 2026, driven by gradual global monetary easing.
For now, though, short-term risk remains tilted lower, with $85,600 and $74,000 as the two critical levels to watch. Hold those, and Bitcoin could form a base; lose them, and the next flush could be swift.
The bigger picture: Could Bitcoin trigger a financial crisis?
Despite the panic, Bitcoin remains relatively small compared to the real financial system. The total crypto market stands around $3–4 trillion, with Bitcoin representing roughly half. In contrast, global financial assets exceed $400 trillion. Past collapses, such as FTX in 2022 and Terra in 2021, caused chaos within the crypto industry but barely rippled across global markets.
That said, every cycle pulls crypto closer to traditional finance. ETFs, corporate holdings, and stablecoins backed by US Treasuries have created real linkages. A severe Bitcoin crash could trigger ETF redemptions, hurt balance sheets at companies holding BTC, and pressure stablecoins to liquidate their Treasury assets. None of that would cause a 2008-style crisis today - but as the overlap grows, the line between “crypto crash” and “financial contagion” gets thinner.
Bitcoin technical insights
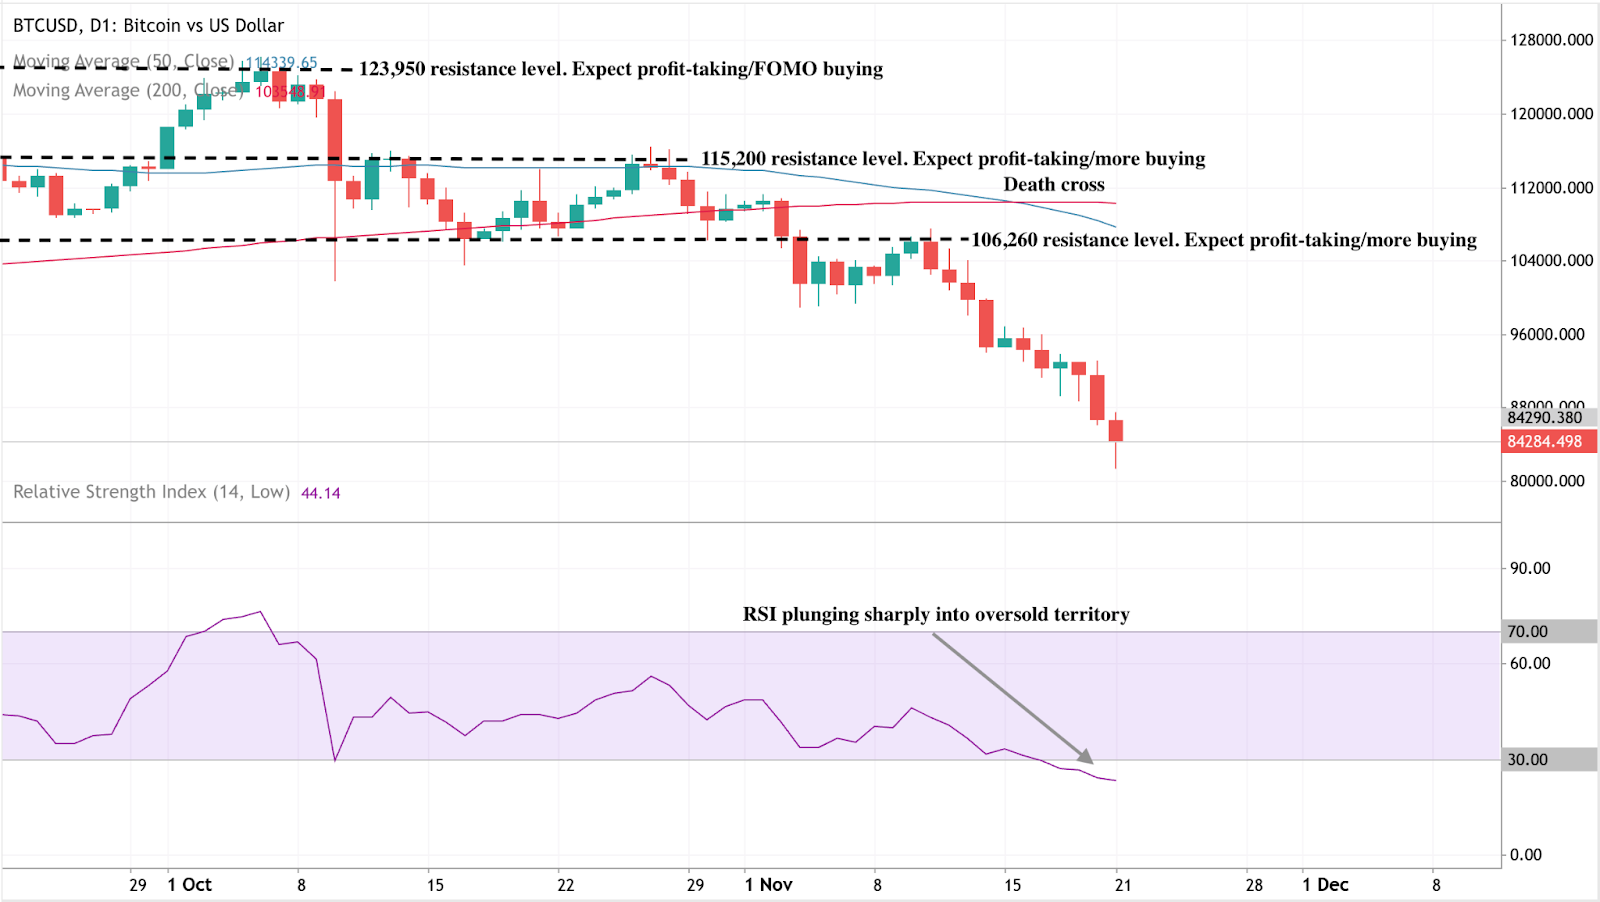
At the time of writing, Bitcoin (BTC/USD) is trading around the $84,200 mark after an extended downtrend. The RSI has plunged sharply into oversold territory, signalling intense bearish momentum and the potential for a short-term relief bounce if buyers step in.
A death cross - where the 50-day moving average has fallen below the 200-day moving average - reinforces the bearish bias, suggesting further downside pressure in the near term.
Key resistance levels sit at $106,260, $115,200, and $123,950, where traders may expect profit-taking or renewed buying interest if recovery attempts occur. Failure to reclaim these zones could see Bitcoin remain under pressure, with sentiment staying fragile amid persistent selling.
Key takeaways
Bitcoin’s decline isn’t an accident - it’s a stress test of its new reality. The ETF era has tied the cryptocurrency closer to the global financial system, for better and worse. Liquidity, once a tailwind, now cuts both ways. Fear dominates, but deep corrections are part of Bitcoin’s DNA.
If those two lines - $85,600 and $74,000 - hold firm, many say this reset may end up looking like just another cleansing phase before the next wave of institutional demand. Lose them, and Bitcoin’s harsh reset could turn into something much deeper.

Nvidia earnings reality check: Is the AI boom back on track?
Nvidia’s latest earnings didn’t inflate another round of hype; they restored confidence that artificial intelligence is entering its scale phase.
Yes - the AI boom is back on track, according to analysts, just in a different gear. Nvidia’s latest earnings didn’t inflate another round of hype; they restored confidence that artificial intelligence is entering its scale phase, not its speculative one.
Nvidia investors are bracing for a $300 billion surge in market value after the chipmaker reported its first sales acceleration in seven quarters, signalling that AI demand isn’t fading - it’s normalising into a sustainable growth cycle.
For months, markets were haunted by talk of “peak AI.” However, Nvidia’s results - record data centre revenue, renewed partnerships, and a 5% share spike in after-hours trading - show the story isn’t one of collapse, but calibration. This isn’t a bubble bursting; it’s the industry learning how to breathe again.
What’s driving Nvidia’s momentum
At the core of Nvidia’s dominance in artificial intelligence architecture is its data centre segment, which surpassed $50 billion this quarter, a milestone reached earlier than analysts expected.
This reflects an industrial-scale buildout, not a speculative frenzy. The surge in demand from AI workloads has transformed GPUs from niche products into the backbone of modern computing, powering everything from ChatGPT to enterprise cloud systems.
CEO Jensen Huang captured it best: “We’re in every cloud.” That ubiquity underpins Nvidia’s stability. Its chips are not optional - they’re essential infrastructure. With Blackwell GPUs offering up to 40 times faster inference speeds than the previous generation, the company isn’t chasing hype; it’s engineering the next leap in computational efficiency.
Why it matters
Nvidia’s report acts as a barometer for the AI economy. The stock’s post-earnings rally wasn’t just about profits; it was about validation. The market had priced in fear after days of tech sell-offs, but Nvidia’s blowout numbers reintroduced realism.
Analysts like Julian Emanuel of Evercore ISI summed up the pre-earnings tension: “The angst around ‘peak AI’ has been palpable.” Those fears evaporated when Nvidia showed that demand isn’t flattening - it’s broadening.
The company’s performance has become closely tied to the trajectory of U.S. equities. With AI now a structural growth driver, Nvidia’s consistency reassures investors that this is an economic revolution in progress, not a fleeting mania. Its $5 trillion valuation last month wasn’t an aberration; it was a preview of scale yet to come.
Impact on global markets
The aftershocks were immediate. Tech indices that had stumbled under the weight of “AI fatigue” rebounded as Nvidia reignited investor faith. Asian markets opened higher, and S&P futures turned positive, driven by renewed conviction that the AI trade still has legs. Even after a period of correction - Meta down 19%, Oracle off 20% - Nvidia’s performance reaffirmed that the long-term AI thesis remains intact.
Beyond markets, Nvidia’s results signal a new capital cycle. Its multibillion-dollar partnerships with Microsoft, OpenAI, and Anthropic aren’t one-off investments; they’re structural commitments to an AI-driven infrastructure era. Every dollar of GPU spending feeds into an ecosystem that’s building capacity for the next generation of models, data centres, and intelligent services.
Expert outlook
Forecasts are being rewritten. McKinsey estimates $7 trillion in AI infrastructure spending by 2030, with $5.2 trillion going toward data centres. According to McKinsey, we will also see significant incremental AI capacity added every year through to 2030.
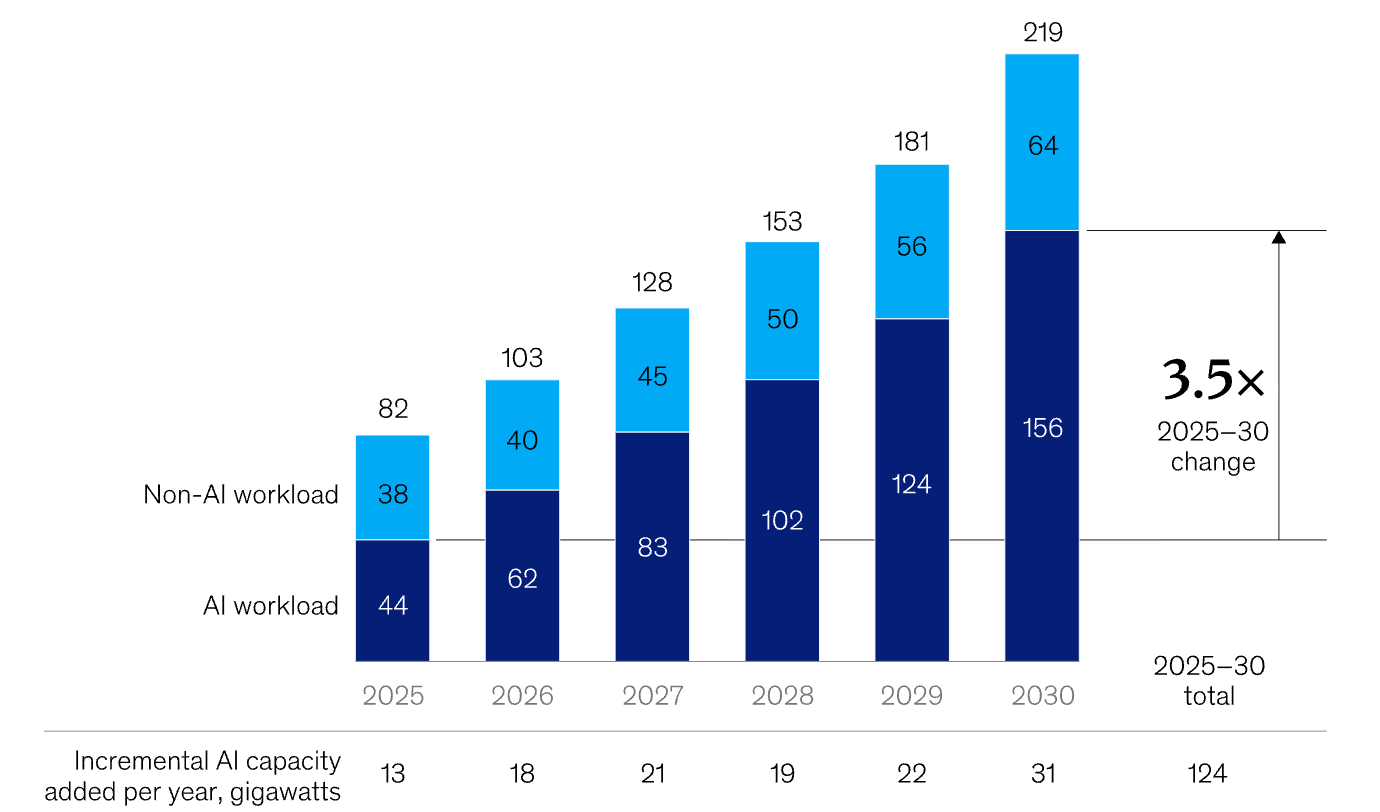
Nvidia’s share of that pie could exceed 50%, given its current dominance and design lead. Some analysts even project a $20 trillion market capitalisation by 2030 if the company maintains its pace of innovation.
Still, this is not a frictionless ascent. Export restrictions to China and the rise of custom silicon from rivals like AMD and Google pose challenges. Yet Nvidia’s edge isn’t just its hardware - it’s the CUDA software ecosystem, which locks developers and enterprises into its platform. As long as AI workloads require versatility and performance across models and frameworks, Nvidia’s moat will hold.
Nvidia technical analysis
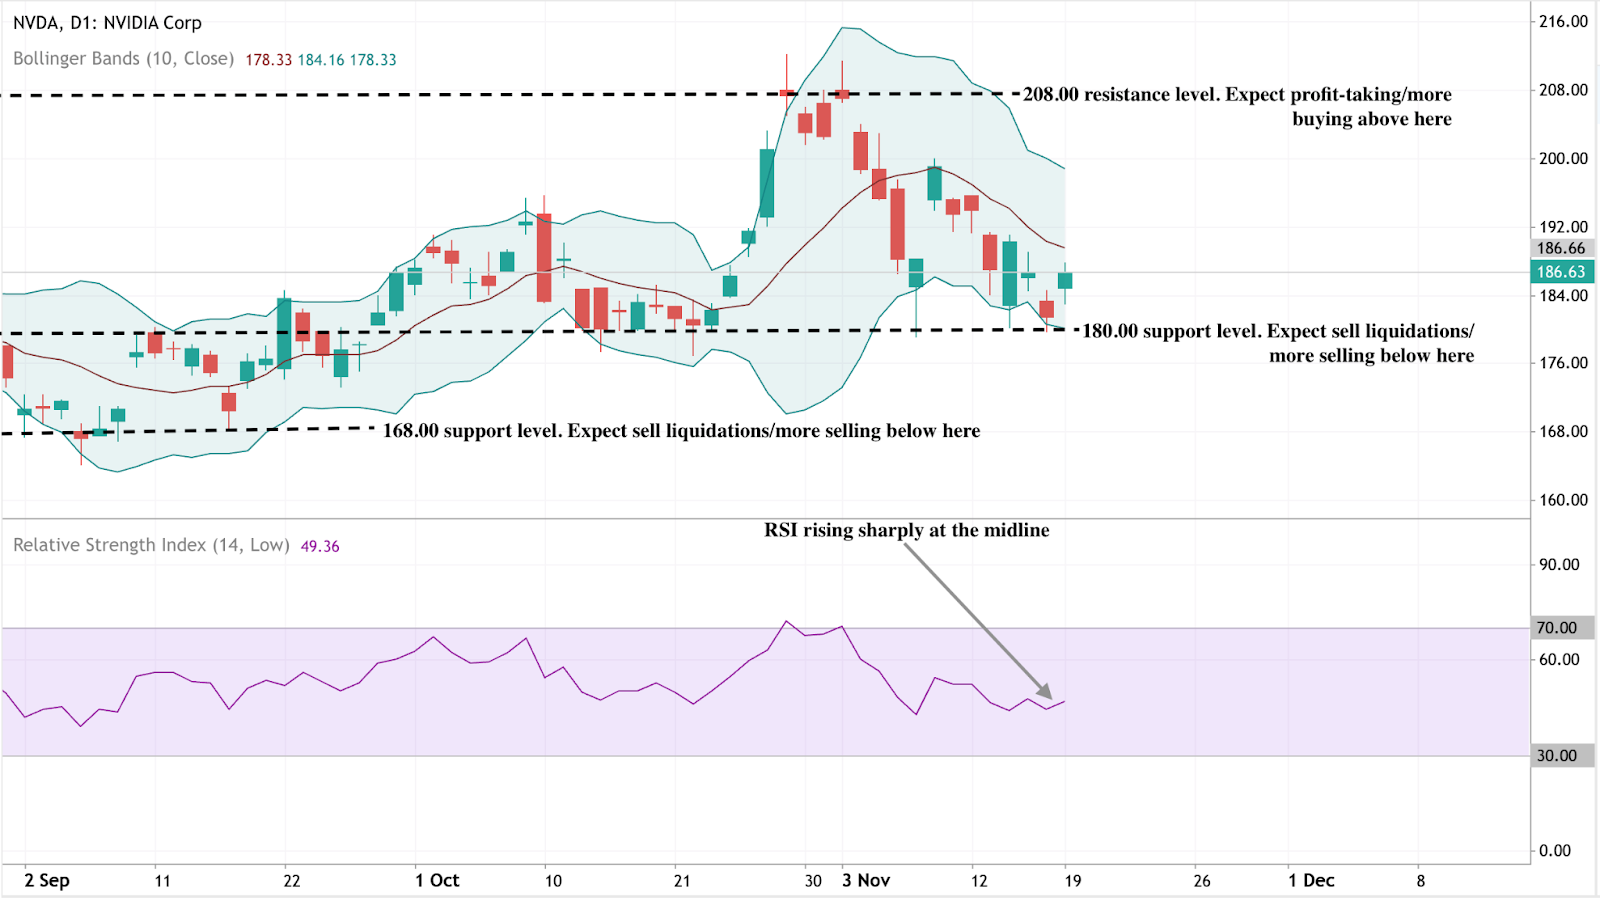
At the time of writing, Nvidia’s stock (NVDA) is hovering around $186, showing early signs of recovery after a short-term pullback. The RSI is rising sharply from the midline near 50, indicating that bullish momentum may be building as buying pressure intensifies.
Meanwhile, the Bollinger Bands are starting to narrow slightly, signalling a potential volatility squeeze that could precede a directional breakout. The price is currently positioned around the middle band, indicating a balance between buying and selling forces.
On the downside, support levels lie at $180 and $168. A drop below $180 may trigger further selling or stop-loss liquidations, while a break under $168 could confirm a deeper correction. On the upside, the key resistance sits at $208, where profit-taking and fresh buying activity are likely to intensify if the price breaks above it.
Key takeaway
Nvidia’s potential $300bn surge isn’t a sign of euphoria - it’s a reality check for those betting on an AI crash. The company’s results confirm that artificial intelligence has moved beyond the phase of promise into proof. As capital shifts from prototypes to platforms, the question isn’t whether AI will endure - it’s how fast it will reshape every market it touches. For now, Nvidia remains the pulse of that transformation.
For traders navigating that transformation, platforms like Deriv MT5 offer exposure to the tech rally’s next phase - while tools such as the Deriv trading calculator provide the precision to manage risk as the AI-driven market matures.

Sanctions vs supply glut: The battle defining Oil prices
Oil prices are caught in a tug-of-war that defines the entire energy narrative right now - sanctions versus surplus.
Oil prices are caught in a tug-of-war that defines the entire energy narrative right now - sanctions versus surplus. As Washington’s latest restrictions on Russian oil giants, such as Rosneft and Lukoil, take effect, traders are wondering whether this will finally squeeze supply enough to lift prices or if swelling inventories and record U.S. output will keep them grounded.
WTI crude has hovered near $60 in recent sessions, reflecting that same indecision. Every headline about sanctions sparks a flicker of optimism; every inventory report snuffs it out. The outcome of this standoff - between geopolitics and fundamentals - will decide whether oil’s next move is a breakout or another false dawn.
What’s driving the rebound
According to analysts, the recent oil bounce is largely fuelled by heightened concern over Russia’s export flows. In a press release issued by the U.S. Department of the Treasury, the United States and allied countries have imposed sweeping sanctions targeting major Russian oil producers, including Rosneft and Lukoil, along with hundreds of vessels from the “shadow fleet”.
These measures are designed to choke off Russia’s oil revenues and, by extension, reduce its export volumes. The logic is simple: fewer barrels from Russia = tighter global supply = higher prices. But the counter-force is significant: global supply remains robust, and demand isn’t bouncing back as expected.
According to the International Energy Agency (IEA), non-OPEC+ production is forecast to grow by 1.7 million barrels per day (bpd) in 2025, while demand growth is projected at just 0.79 million bpd, signalling a structural surplus unless changes occur.
Meanwhile, data show that Russia’s output and export adapt-workarounds remain effective so far - Russian production rose by about 100,000 bpd even after sanctions. Thus, the rebound is caught between a genuine supply shock narrative and a stubborn demand/stock overhang, and whether prices break out depends on which side prevails.
Why it matters
For traders, producers and consumers, this dynamic is far from academic. A sustained rally driven by supply constraints would favour oil-heavy portfolios, refining margins, and exporting nations. Conversely, if oversupply persists and demand disappoints, even the sanction narrative won’t save prices. As one senior energy analyst noted: “The market doesn’t expect much lost supply until enforcement becomes indisputable.”
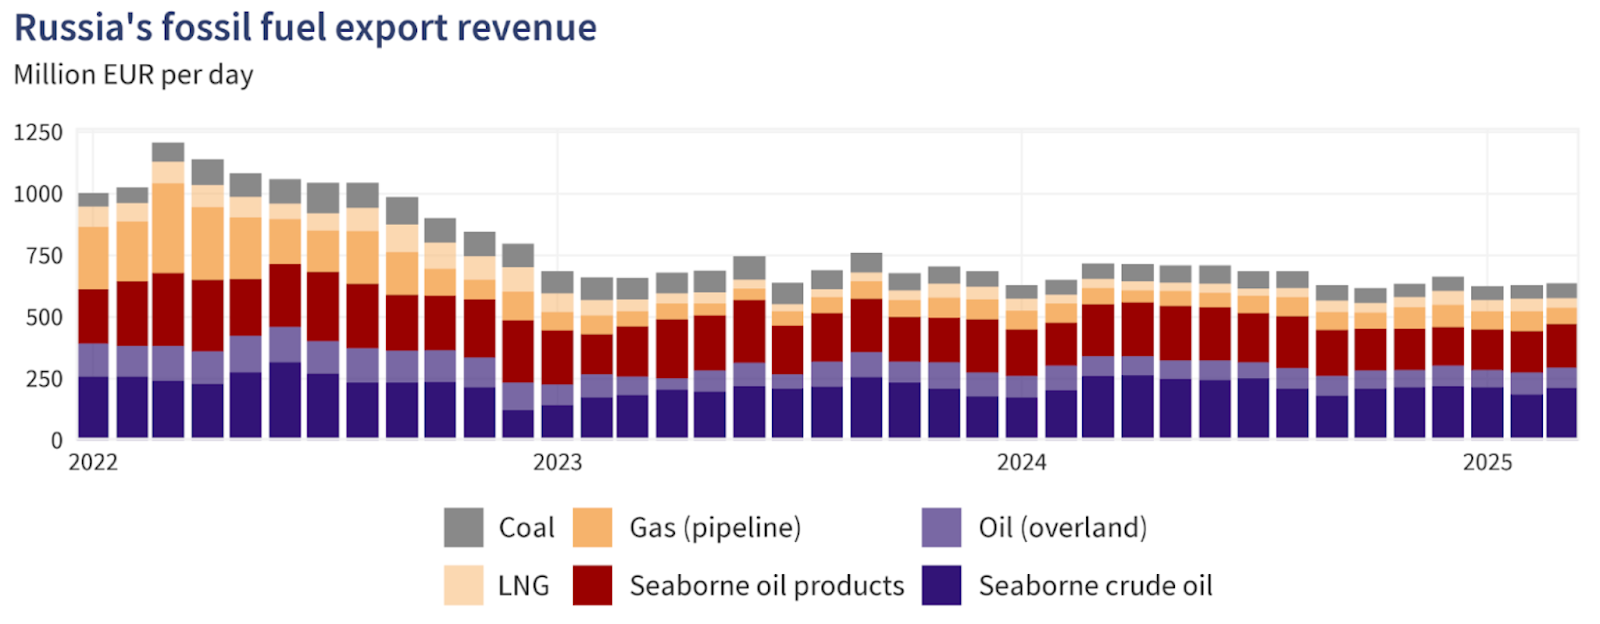
For Russia and its global buyers, the stakes are high. Russia’s oil and gas revenues plunged by 27% in October 2025 compared to the same month a year earlier, reflecting the pressure of sanctions even as volumes held up through workarounds.
At the same time, major oil importers such as India and China have been increasing their Russian cargoes in recent months before the November plunge, which has cast doubts about continued oil flows to those countries.
So, if importers continue to absorb discounted Russian barrels, global supply may remain ample even though the narrative suggests otherwise. On the consumer end, if oil prices are kept low due to oversupply, fuel costs remain manageable. If supply loss dominates, refined-product prices (diesel, gasoline) could rise, feeding inflation and impacting economic growth - a risk to be watched for in both developed and emerging markets.
Impact on the market
In practical terms, the battle lines are drawn according to analysts. On the supply-risk side, if sanctions bite and Russian exports drop materially, markets may tighten quickly, and oil prices could rally.
The risk premium is already reflected in crude spreads: the discount for Russian Urals crude versus global benchmarks jumped to around US$19 per barrel by early November, as buyers shunned Russian cargoes, according to a report by Meduza. That suggests the sanction effect may be starting to crack.
But on the flip side, tracking data suggest that Russian flows are still being rerouted, and global producers (especially shale, Brazil and the U.S.) are responding. With U.S. production at record levels and inventories increasing, the oversupply story remains viable, according to industry commentators. If demand remains weak - for instance, from China or the global industry - then any supply-shock rally may be short-lived, and prices could retreat.
Refining and trade flows are also adjusting. Dealers and refiners are now considering discounted Russian crude, longer shipping routes, and higher freight and insurance costs - all of which increase complexity but don’t necessarily immediately reduce volumes. Until actual barrel losses show up in export data, the market may remain in limbo, reluctant to commit to strong upward momentum.
Expert outlook
According to analysts, the most probable scenario is a market stuck in a range-bound trading pattern, punctuated by bursts of volatility. That is, oil may temporarily rally on rumours of sanctions or supply disruptions, but unless demand proves stronger and supply genuinely tightens, the move may lack legs. Reuters reported that the IEA continues to expect supply growth outpacing demand this year.
If enforcement of sanctions tightens - for example, if shadow-fleet tankers are blocked, insurance costs spike or major importers pull back from Russian oil - then we could see a meaningful rally.
On the demand front, counter-signals to watch include refining run-rates (which remain under pressure), travel and mobility trends, and China’s petro-chemical demand. Until one of these breaks clearly favourably, the oversupply story will likely keep a lid on prices.
In short, the supply risk is real, but it hasn’t yet overridden the oversupply/weak-demand backdrop. Until that happens, the rally remains tentative.
Oil technical insights
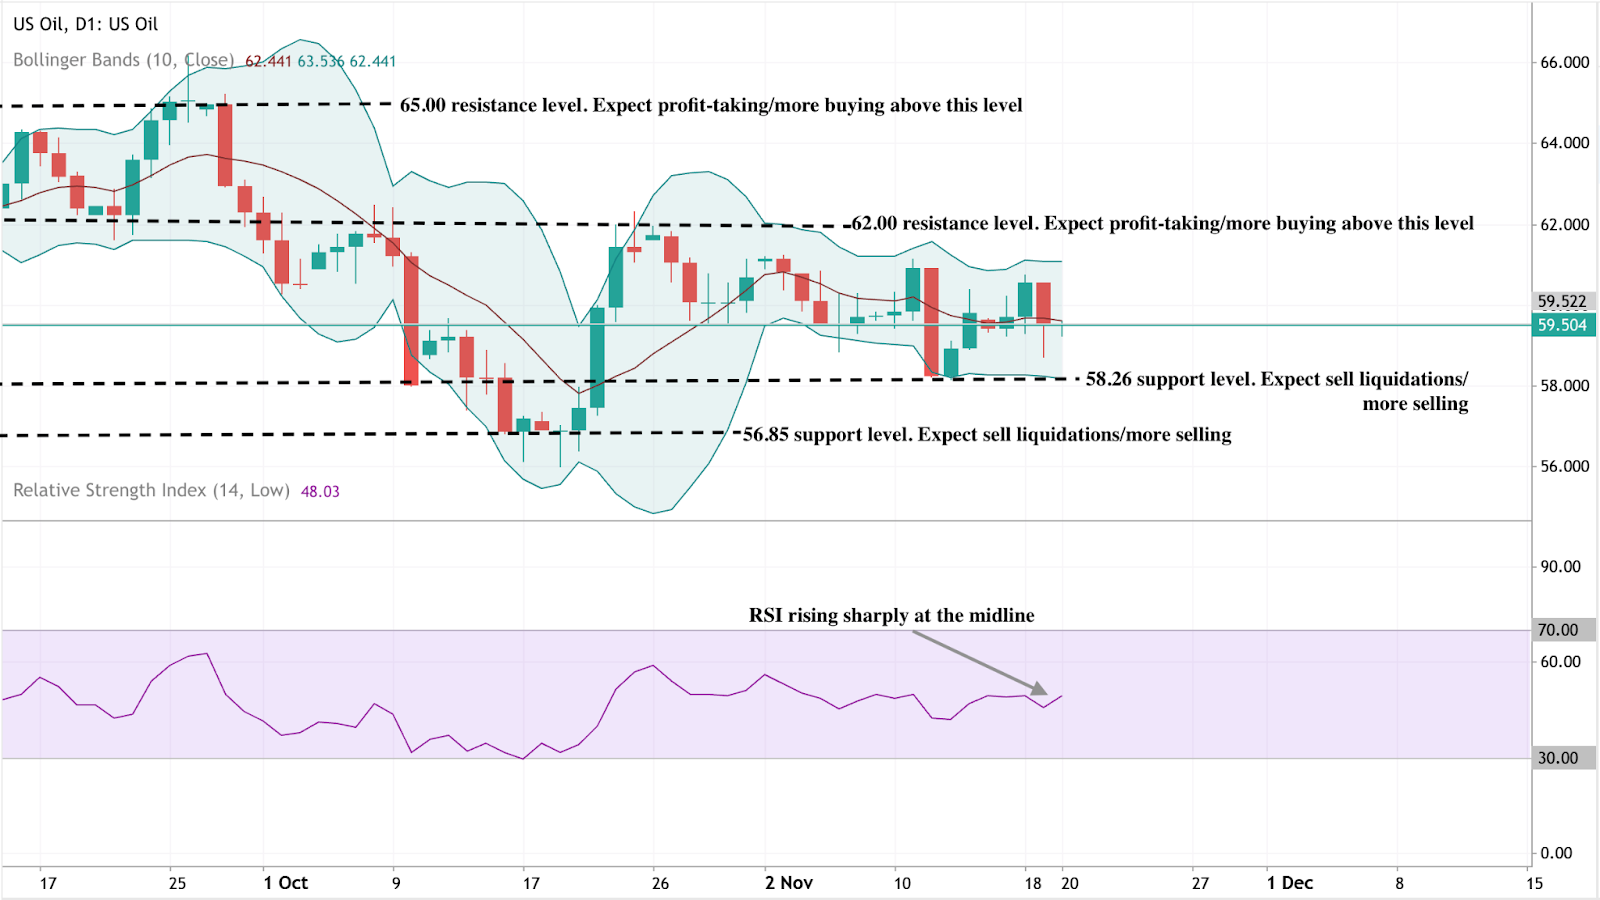
At the time of writing, US Oil is trading around $59.50, consolidating within a narrow range as momentum starts to stabilise. The RSI is climbing sharply from the midline near 50, hinting at strengthening bullish momentum and suggesting that buyers may be regaining short-term control.
The Bollinger Bands (10, close) are relatively tight, signalling reduced volatility and the potential for a breakout. Price action remains centred around the middle band, showing indecision but with a slight upward bias as buyers attempt to push above the mid-range.
Key support levels are found at $58.26 and $56.85, where a break lower could trigger further selling pressure or stop-loss liquidations. On the upside, resistance sits at $62.00 and $65.00 - levels where profit-taking and stronger buying activity could emerge if the market breaks higher.
Key takeaway
The oil market is at a crossroads where the sanction-driven supply-risk narrative clashes with the solid structural reality of oversupply and weak demand. While the latest Russian sanctions have sharpened the risk premium, global production and inventories remain elevated and demand remains fragile.
Unless export losses are real and demand picks up, the oversupply story will likely keep oil prices pinned. The next key signals to monitor: export data from Russia, inventory changes globally and demand indicators from Asia and the U.S. Stay alert - this is a high-stakes battle that could tip either way.
For traders navigating the oil market, Deriv MT5 offers exposure to both WTI and Brent. Meanwhile, tools such as the Deriv trading calculator provide the precision needed to manage risk as the AI-driven market matures.

USD/JPY outlook: Can the Yen hold its ground amid Japan’s policy tug-of-war?
Reports indicate that the Japanese yen is struggling to maintain its stability as Japan’s fiscal and monetary priorities diverge in opposite directions.
Reports indicate that the Japanese yen is struggling to maintain its stability as Japan’s fiscal and monetary priorities diverge in opposite directions. A massive ¥25 trillion stimulus plan from Prime Minister Sanae Takaichi has reignited concerns about inflation and weighed on the currency, while the Bank of Japan’s cautious stance on rate hikes offers little support. The result is a yen pinned near a nine-month low, with the USD/JPY pair hovering around ¥155.
Many say Japan’s policy tug-of-war is tilting decisively against the yen. Unless the government and central bank find common ground, traders may see further weakness - especially if the dollar remains buoyed by a patient but firm Federal Reserve.
What’s driving USD/JPY
The yen’s weakness stems from a widening policy divide inside Japan’s leadership. Prime Minister Takaichi’s administration has revived Abenomics-style stimulus, prioritising fiscal expansion to boost wages and consumer demand.
Lawmakers have proposed a supplementary budget exceeding ¥25 trillion, stoking concerns over rising debt issuance and sending 40-year Japanese government bond yields to record highs.
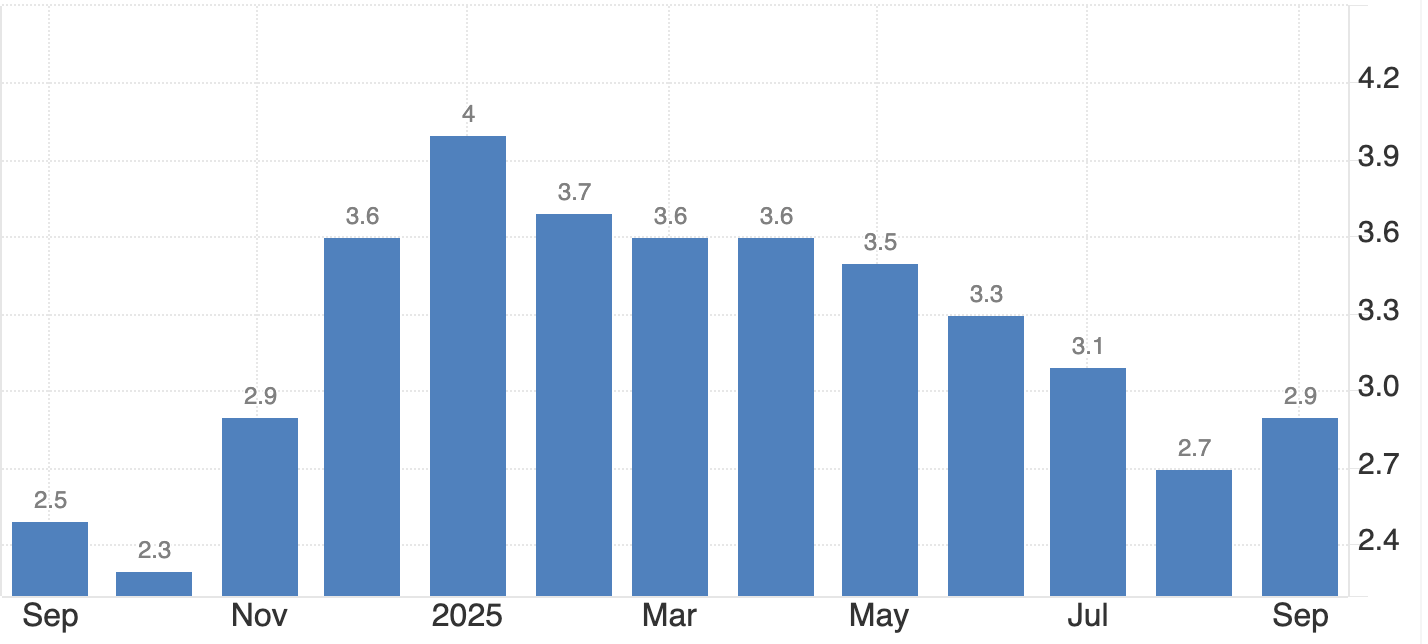
Meanwhile, the Bank of Japan (BoJ) is caught between political pressure and macroeconomic caution. Inflation, currently around 2.9%, remains above target, yet the prime minister insists on keeping rates low until wage growth - not food or energy costs - drives price stability.
Governor Kazuo Ueda has hinted at tightening if inflation persists, but uneven growth complicates matters: GDP grew 1.1% year-on-year, yet contracted 0.4% quarter-on-quarter. This tug-of-war has left investors unsure whether Japan’s policies are reflating the economy or eroding its currency.
Why it matters
This internal conflict is redefining how global markets view the yen. Once seen as a safe-haven anchor, it’s now behaving more like a risk currency, moving with rather than against global sentiment. “Japan has added a tumultuous element - they’re a little more wild, a little more volatile,” said Juan Perez of Monex USA. That volatility reflects a new reality: fiscal expansion is now Japan’s dominant narrative, while monetary prudence takes a back seat.
For traders, the risk is that verbal intervention replaces actual action. Finance Minister Satsuki Katayama has expressed concern over the yen’s sharp depreciation, but Tokyo has so far refrained from stepping into the market. Intervention is likely only if USD/JPY breaches ¥156 decisively - a level seen as politically sensitive rather than economically critical by analysts.
Impact across markets
According to reports, the consequences of Japan’s fiscal-monetary split are evident across its bond and currency markets. The yield curve has steepened sharply as investors price in heavier debt issuance, while near-zero short-term rates keep domestic liquidity abundant. This imbalance encourages capital outflows, as investors seek higher yields abroad, further putting downward pressure on the yen.
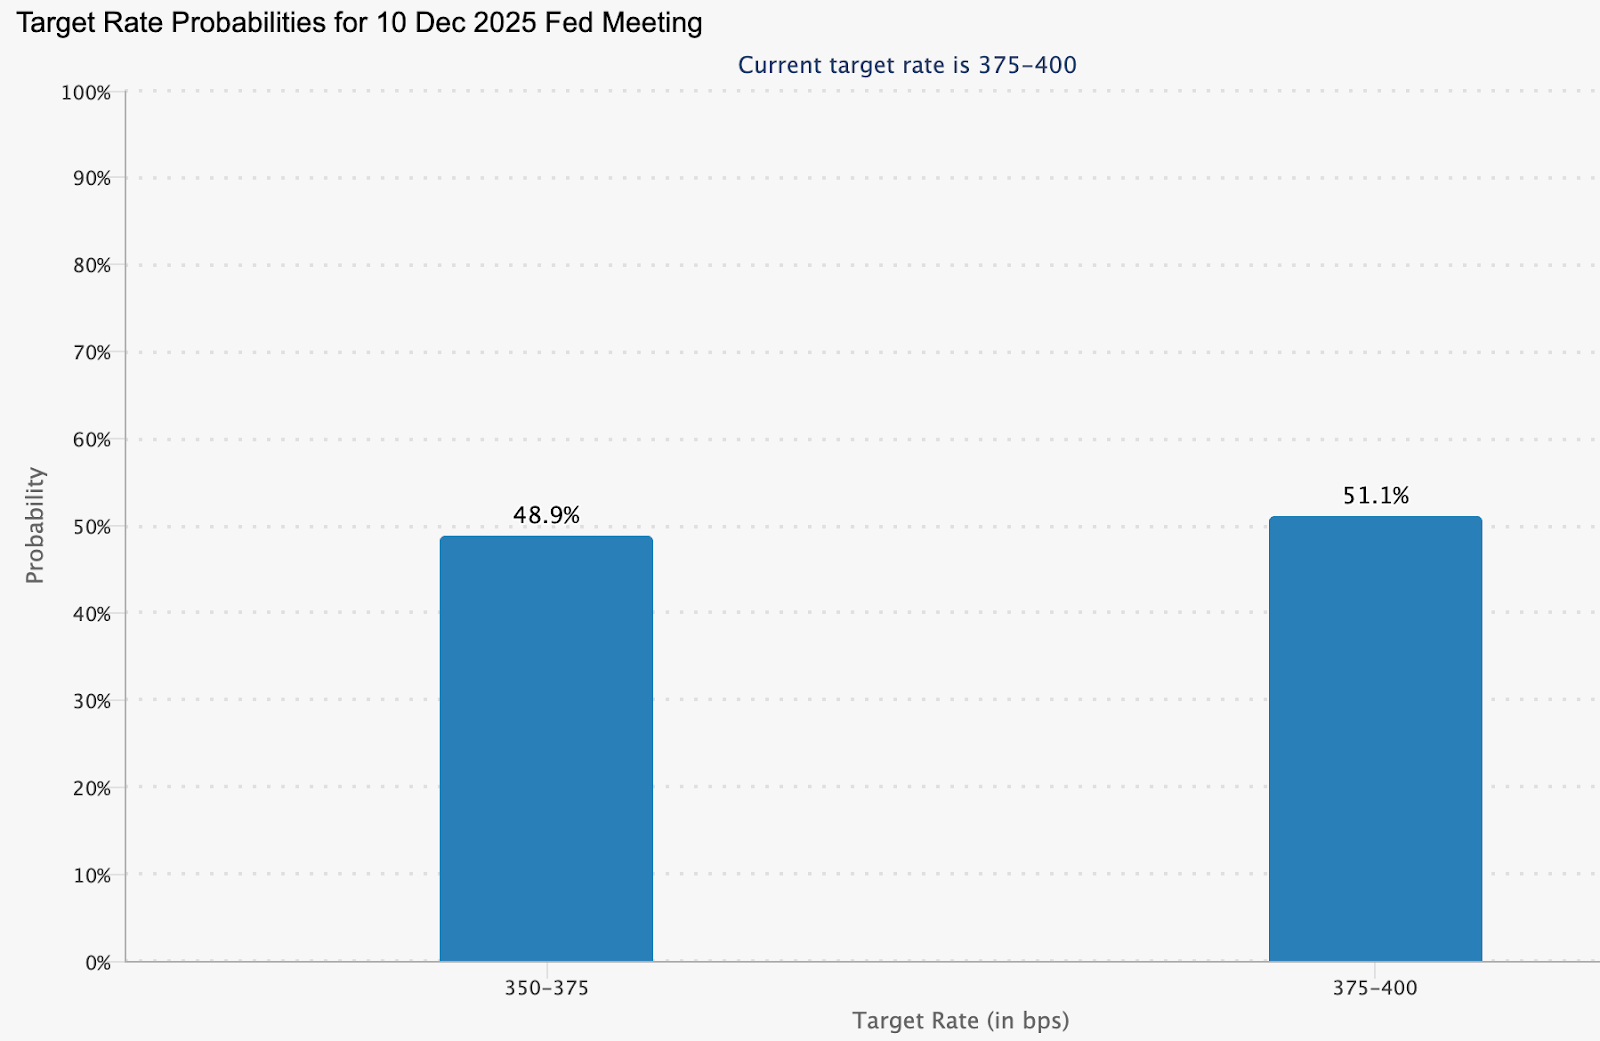
Across the Pacific, the Federal Reserve’s steadiness has reinforced dollar strength. Officials such as Philip Jefferson and Christopher Waller continue to advocate patience on rate cuts, trimming the probability of a December reduction to around 48%, down from 60% last week (CME FedWatch).
According to analysts, as long as this interest-rate gap persists, the dollar will remain structurally favoured against the yen, - and any yen rallies will likely prove temporary.
Expert outlook
Analysts see little relief for the yen in the near term. Barclays recommends holding a long position on the dollar against the yen, arguing that Takaichi’s expansionary agenda will suppress domestic yields and maintain downward pressure on the currency. Still, a sustained climb beyond ¥156 could test Tokyo’s resolve and force coordinated intervention.
The next key event is the delayed US Non-Farm Payrolls report, expected to provide fresh insight into labour market conditions. A weaker reading could trigger short-term dollar selling, allowing the yen to recover briefly. Yet without a policy shift in Japan, that reprieve may be short-lived. For now, the yen’s trajectory is dictated less by data and more by the dissonance between fiscal ambition and monetary caution.
USD/JPY technical insight
At the time of writing, USD/JPY is trading around 155.45, extending gains within a price discovery zone as bullish momentum persists. The pair is hugging the upper Bollinger Band, signalling strong buying pressure but also hinting at a possible overextension.
The RSI is climbing toward the overbought region, reinforcing the risk of a short-term pullback or profit-taking. Immediate support lies at 152.96, followed by 146.45, where a breakdown could trigger sell liquidations and accelerate downside movement.
However, as long as prices hold above the middle Bollinger Band and 153.00, the broader uptrend could remain intact, supported by policy divergence between the Federal Reserve and the Bank of Japan.

Key takeaway
Japan’s yen problem isn’t just about markets - it’s about messaging. Expansionary fiscal policy collides with a hesitant central bank, leaving investors unsure which signal to follow. The result is a currency under sustained strain, with verbal intervention doing little to stop the slide. Unless Tokyo finds alignment between stimulus and stability, the yen’s effort to hold its ground may remain more symbolic than successful.

Gold’s reversion to the mean: A pause before the next rally?
Gold has climbed back above $4,050 per ounce, stabilising after a sharp two-week selloff that pulled the metal down from record highs.
Gold has climbed back above $4,050 per ounce, stabilising after a sharp two-week selloff that pulled the metal down from record highs. The move reflects what analysts increasingly describe as a reversion to the mean - a natural correction following a steep run from $3,450 to $4,380 earlier in the quarter.
With the long-delayed US Non-Farm Payrolls (NFP) report now in focus, traders are watching whether this consolidation is a breather before the next leg up. The broader backdrop remains tense. Hawkish Federal Reserve remarks, delayed data from the US government shutdown, and continued geopolitical stress are all reshaping sentiment. Yet, behind the noise, gold’s pullback looks less like weakness - and more like equilibrium returning.
What’s driving gold’s mean reversion
The latest correction follows months of relentless buying, fuelled by soft US data, de-dollarisation flows, and record central-bank accumulation. Gold’s sprint from $3,450 to $4,380 outpaced fundamentals, leaving technical indicators stretched and sentiment euphoric.
Now, as traders recalibrate expectations for a December rate cut - pricing in a 48.9% chance according to CME FedWatch - the metal has slipped back toward its midrange, around $4,050–$4,100, where short-term and long-term averages converge.
This retreat also mirrors a psychological reset. Markets are digesting the Fed’s cautious tone, with Vice Chair Philip Jefferson urging a “slow approach” to policy changes and regional presidents Bostic and Schmid signalling preference for steady rates. Those comments, paired with delayed macro data, have thinned speculative positions and allowed gold to breathe. In effect, the market is rediscovering balance - a hallmark of mean reversion after an overextended move.
Why it matters
Gold’s mean reversion tells a deeper story about trust and monetary fatigue. As Citadel’s Ken Griffin noted, the rising price of gold reflects “a loss of trust first in US Treasuries, then in G7 bond markets.” Investors are responding not to short-term volatility, but to structural concerns about government debt and the stability of fiat currency.
Analysts at Deutsche Bank maintain that the medium-term trend remains intact, projecting an average gold price of $4,000 per ounce next year. They highlight “elevated official demand” - a reference to sustained central-bank buying.
In October, China’s central bank added 0.9 tonnes to its reserves, marking its 12th straight month of accumulation. Ongoing purchases throughout 2025 have lifted China’s official gold reserves to 2,304.5 tonnes.
This underlines that while traders may be reverting to the mean, nations are not - they’re steadily diversifying away from the dollar.
Impact across markets
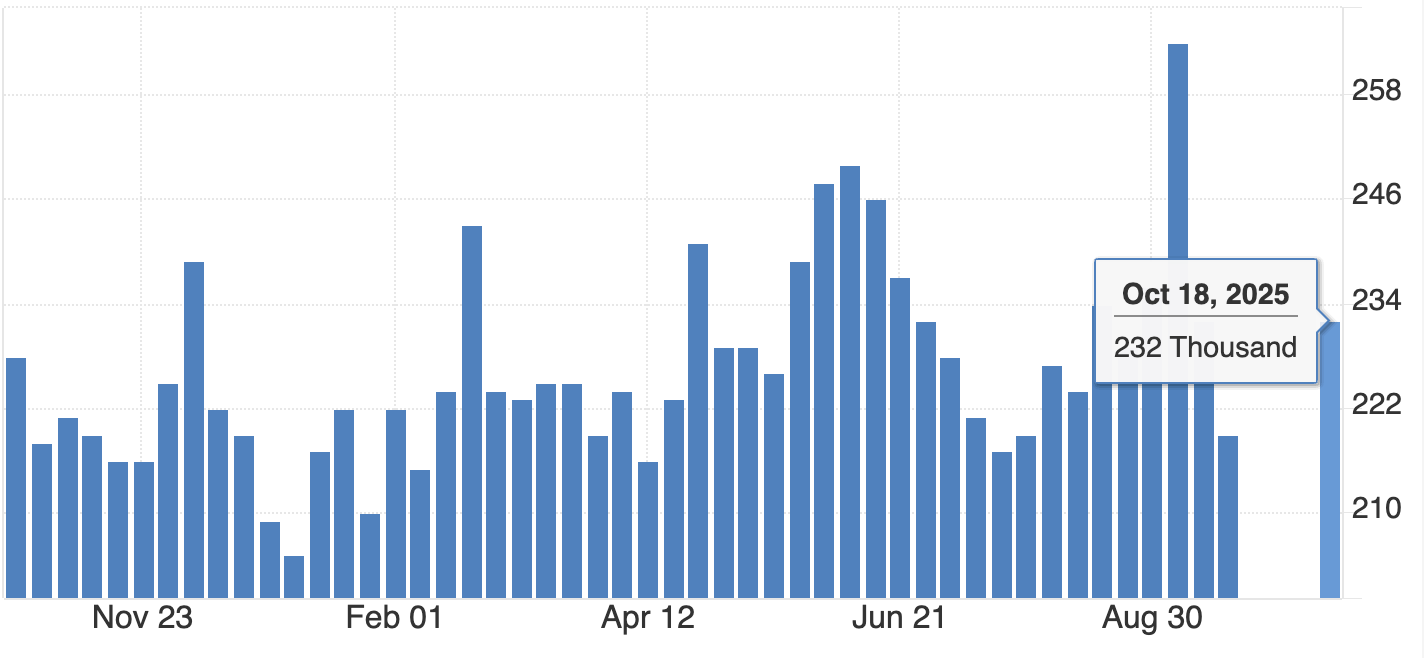
In China, investor appetite for gold remains vigorous even during the correction. ETF inflows jumped RMB 32 billion (US$4.5 billion) in October, pushing total holdings to a record 227 tonnes.
Physical demand, measured by withdrawals from the Shanghai Gold Exchange, rose 17 tonnes year-on-year to 124 tonnes, defying seasonal softness. The data suggests that investors see dips as opportunities, not red flags.
Globally, the story is similar. Soft US employment data and climbing jobless claims have tempered the dollar’s strength, nudging investors back into gold and silver.
Still, there’s awareness that a stronger NFP print or easing geopolitical risk could stall momentum. Even so, mean reversion isn’t a bearish event - it’s the market’s way of restoring order after a speculative sprint. And order, in uncertain times, is the most bullish foundation of all.
Expert outlook
Most analysts agree that gold’s medium-term trajectory remains higher, although near-term volatility will hinge on the US jobs data and the Fed’s stance in December. Independent trader Tai Wong says, “soft data is slightly boosting hopes for a December cut - helping gold and silver, which are trying to break a three-day losing streak.” That sentiment captures the current equilibrium: cautious optimism tempered by macro prudence.
If the NFP report underperforms, gold could swiftly retest $4,200, according to analysts. If it surprises to the upside, a dip toward $3,950 would complete a textbook mean reversion cycle before stabilising. Either way, the long-term bull case - driven by de-dollarisation, AI-driven labour disruption, and inflation inertia - remains intact. The question isn’t whether gold rises again, but when.
Gold technical analysis
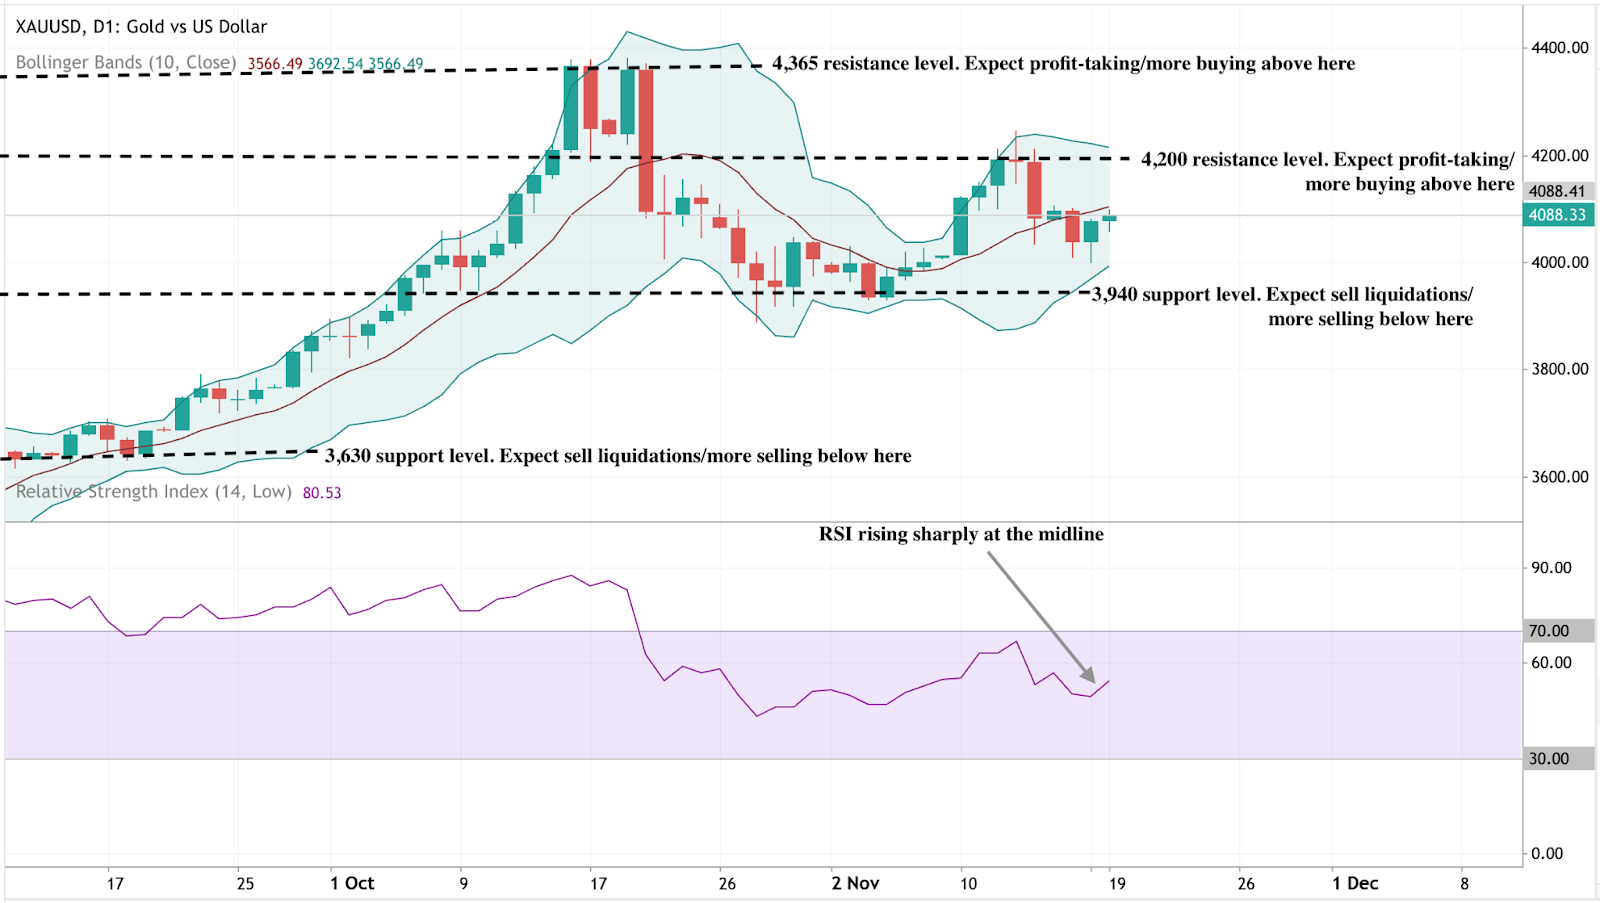
At the time of writing, XAU/USD is trading near $4,088, rebounding from the lower Bollinger Band as buyers re-enter the market. The Bollinger Bands are beginning to widen after a period of contraction, suggesting that volatility may be returning.
The RSI is rising sharply from the midline, signalling improving bullish momentum. Key resistance levels are seen at $4,200 and $4,365, where profit-taking or further buying could occur if gold breaks higher. On the downside, a fall below $3,940 would likely trigger sell liquidations, exposing deeper support at $3,630.
Overall, gold appears to be in the early stages of a potential bullish continuation, with the technical setup hinting at renewed upside pressure if momentum sustains above the mid-Bollinger Band.
Key takeaway
Gold’s pullback to the $4,000 zone isn’t weakness - it’s rhythm. A reversion to the mean after a parabolic rise is how sustainable trends reset. Beneath short-term volatility, the drivers of this bull phase - de-dollarisation, central-bank accumulation, and macro distrust - remain fully in play. As the US jobs data and Fed decisions unfold, this pause could mark the quiet before gold’s next major rally.

Bitcoin crashes under $90K as ‘death cross’ bites
Spot prices printed as low as 89,420 dollars, the weakest level since February, only six weeks after setting a record near 126,250 dollars.
Bitcoin slipped below 90,000 dollars on Tuesday, extending a selloff that has erased its 2025 gains and pushed sentiment toward the bleak end of the spectrum. Spot prices printed as low as 89,420 dollars, the weakest level since February, only six weeks after setting a record near 126,250 dollars.
The breakdown coincided with a bearish technical crossover known as a death cross and increasingly hesitant fund flows into U.S. spot ETFs.
Together with macro anxiety around the rate path, these factors have tightened liquidity and amplified swings across majors. The next phase hinges on whether price can quickly reclaim lost support and whether ETF prints stabilise from recent choppiness.
What’s driving the slide
The proximate trigger is technical: Bitcoin fell back through reclaimed support near 93,700 dollars, lost its 200-day moving average, and then registered a death cross as the 50-day slipped beneath the 200-day.
On its own the signal is imperfect, but in weak liquidity regimes it often coincides with multi-week drawdowns as momentum traders de-risk.
Flows add fuel. U.S. spot ETF activity has turned choppy after heavy intake earlier in the year, with trackers showing sequences of outflows or flat prints that blunt marginal demand. When the incremental demand fades, price tends to chase lower liquidity pockets until new buyers emerge. Recent dashboards corroborate the stop-start nature of ETF demand. CoinDesk+1.
The Mt. Gox repayments - a trigger, not the cause
Adding fuel to the fire, over 10,600 BTC (worth roughly $953 million) were transferred from Mt. Gox wallets on 18 November 2025, marking the first such movement in eight months.

The long-running repayment saga, stemming from the 2014 collapse of the world’s then-largest exchange, has left creditors waiting over a decade for compensation.
While some feared that repayments could unleash fresh supply, blockchain data shows these movements were administrative, not market sales. Still, perception alone was enough to unsettle sentiment, sparking liquidations and feeding the broader risk-off tone. Analysts now estimate over 230,000 trading accounts were liquidated within 24 hours, totalling more than $1 billion in forced sell orders.
Why this matters
Sentiment has swung hard into fear. CoinDesk flagged “extreme fear” conditions into the weekend and early week, aligning with widely followed gauges that punish downside volatility and negative breadth. In past cycles, similar extremes have marked acceleration phases within larger drawdowns or short-lived exhaustion points.
The macro overlay is not helping. Traders are parsing shifting expectations for U.S. rate cuts and inflation risks tied to policy developments, a mix that reduces risk appetite and tightens crypto liquidity. Reuters’ read-across captures the mood: a near 30 percent retreat from the October peak and growing caution among institutions.
Impact on markets and participants
Price leadership rotated back to bitcoin as traders sold altcoins to manage risk, a pattern visible when social attention and volumes consolidate in the benchmark asset during stress. Ether and other large caps have tracked lower alongside, while crypto-linked equities have generally underperformed on drawdown days, transmitting crypto volatility into listed proxies.
For allocators, ETF prints serve as the cleanest real-time barometer of spot demand. Multi-day flat or negative flows often coincide with fragility in order books and heavier slippage, which is why desks are laser-focused on whether the next sequence turns positive again. If it doesn’t, the unfilled liquidity pocket toward 86,000–88,000 dollars cited by traders continues to be a live risk.
Expert outlook
CoinDesk’s market desk notes that fear spikes of this magnitude have sometimes preceded relief rallies, particularly when realised-loss pressure begins to stabilise and ETF outflows slow. That requires confirmation: a swift reclaim of broken support and evidence of renewed net inflows. Until then, technicals and positioning argue for elevated two-way volatility.
Long-horizon investors continue to point at structural adoption and institutional participation as reasons to stay constructive on multi-year horizons. Dan Tapiero, whose 50T platform backs later-stage crypto companies, frames short-term turbulence as noise against a secular build-out, a view he has reiterated while forecasting a much larger digital-asset economy over the next decade.
Bitcoin price technical insight
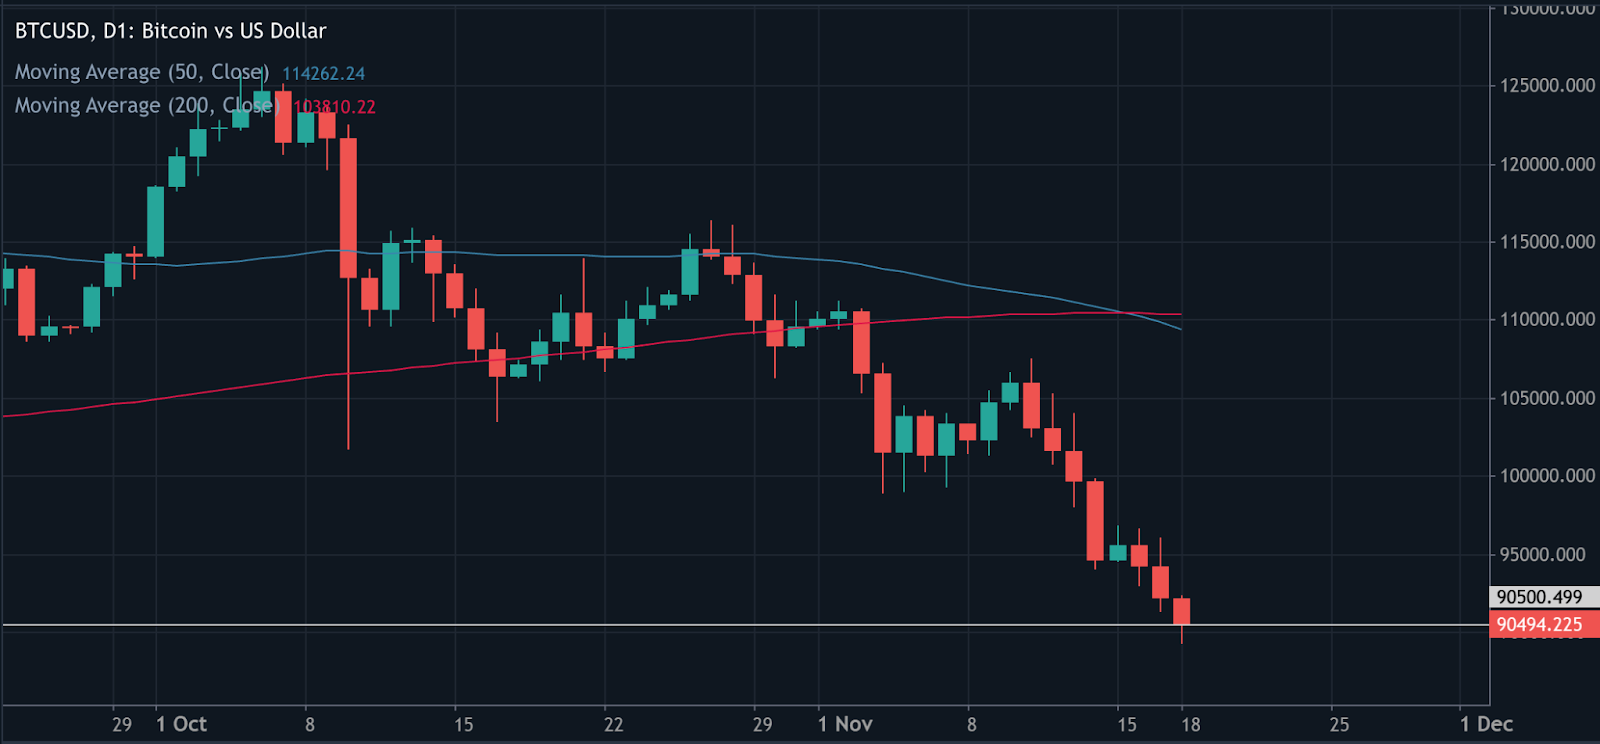
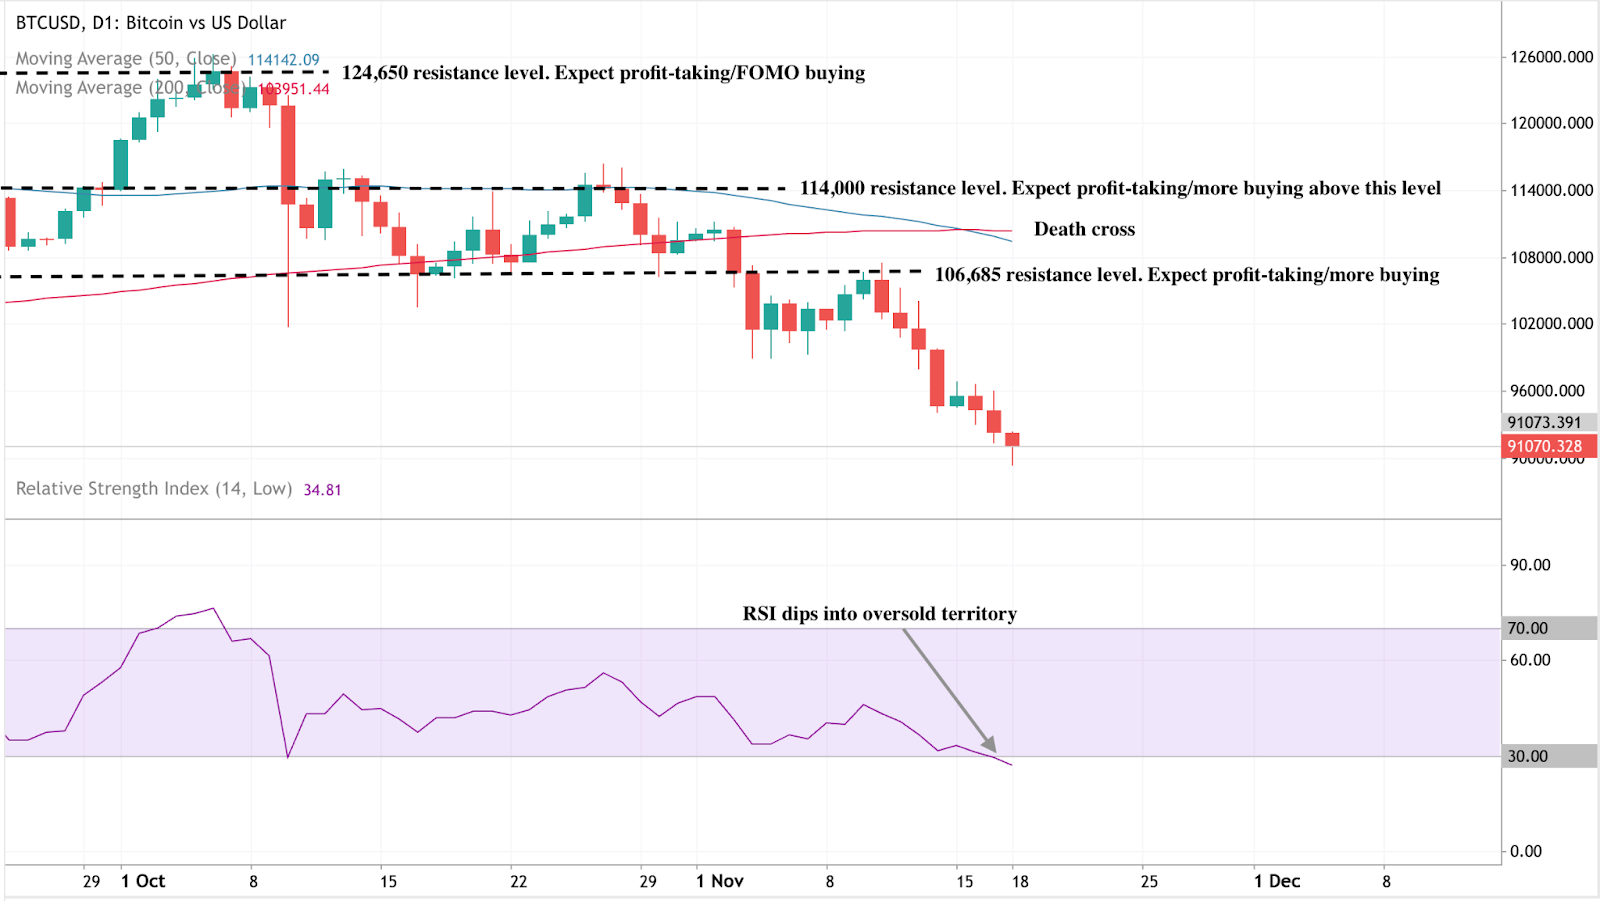
Bitcoin (BTC/USD) continues its downward trajectory after forming a death cross, with the 50-day moving average (MA) crossing below the 200-day MA - a classic bearish signal suggesting extended downside pressure. The price is currently hovering near $91,000, after repeatedly failing to hold above key resistance levels at $106,685, $114,000, and $124,650, where prior rallies saw heavy profit-taking and FOMO-driven buying.
The Relative Strength Index (RSI) has dipped into oversold territory, indicating that selling momentum may be overextended and a short-term technical rebound could occur. However, as long as BTC remains below the 50-day MA, the broader trend remains bearish, with traders likely to view any bounce as a chance to sell into strength.
Key takeaway
Bitcoin’s slide below $90,000 reflects a convergence of technical breakdown, hesitant ETF demand, and a risk-off macro tone. The resulting fear spike is typical of late-stage selloffs, but it needs flow confirmation before calling a durable low. Watch for a quick reclaim of the $ 90,000 - $93,000 zone and a run of positive ETF prints to validate any rebound attempt. Until then, expect elevated volatility and tighter liquidity conditions.
Spiacenti, non abbiamo trovato alcun risultato corrispondente a .
Suggerimenti per la ricerca:
- Controlla che l'ortografia sia corretta e riprova
- Prova con un'altra parola chiave