Risultati per

EUR/USD outlook: The dollar’s rate-cut reckoning
What began as a quiet Thanksgiving week has turned into the dollar’s steepest weekly decline in four months.
According to reports, the dollar’s rate-cut reckoning is now the defining force in EUR/USD, with traders pushing expectations for a December Federal Reserve cut to more than 85%, up sharply from 39% just a week earlier. What began as a quiet Thanksgiving week has turned into the dollar’s steepest weekly decline in four months, reshaping the balance of power across major currency pairs.
EUR/USD is rising not because the euro has rediscovered its strength, but because the dollar is losing the policy advantage it has enjoyed for most of the year. As markets confront the prospect of a softer Fed and political pressure on the institution intensifies, the pair is becoming a barometer for how much credibility the central bank is willing to risk in the months ahead.
What’s driving EUR/USD right now?
The Fed sits squarely at the centre of the story. Rate expectations have shifted at a pace not seen since early summer, with futures markets now assuming a December cut as the most likely outcome. Reuters reported a series of softer labour market indicators, dovish public remarks from key policymakers, and increased speculation around Kevin Hassett’s potential nomination as the next Fed Chair have accelerated the move. Thin U.S. liquidity over the Thanksgiving holiday added fuel, allowing even modest data points to push the dollar lower.
This recalibration has allowed EUR/USD to climb despite Europe’s mixed economic backdrop. The dollar index, still hovering near 99.72, is heading for its worst weekly performance since late July.

The euro briefly touched a 1½-week high of $1.1613 before easing, supported more by dollar fatigue than by renewed optimism in the eurozone. Even so, the narrowing of U.S.–European rate differentials has created space for euro bulls to test higher levels, something that looked unlikely just two weeks ago.
Why the dollar is facing its own reckoning
Political pressure is becoming an increasingly prominent part of the narrative. President Donald Trump has renewed calls for deeper rate cuts, arguing that the Fed must “move quickly” to support economic momentum.
The possibility that Kevin Hassett - a prominent advocate of looser policy - could become the next Fed Chair has forced traders to reassess the institution’s independence and long-term trajectory. Markets are now questioning whether December’s cut is simply another precaution or the start of a strategically driven easing cycle.
At the macro level, the dollar’s credibility premium is also being tested. Barclays’ global head of FX strategy, Themos Fiotakis, argued that Europe had benefited in recent months from supportive rate differentials and improving sentiment, but warned that these assumptions are now under reassessment. The euro’s valuation remains high by several metrics, while the U.S. economy continues to show pockets of resilience, particularly in services. The dollar’s decline, therefore, reflects less a loss of faith and more a repricing of what the next policymaking regime might look like.
What this means for EUR/USD traders
Positioning in EUR/USD has turned decisively constructive, according to analysts. With holiday-thinned liquidity amplifying moves, traders have been quick to unwind long-USD positions accumulated during the autumn rally. The shift has also been visible in cross-asset markets: U.S. 10-year Treasury yields briefly dipped below 4% before rebounding, while German bunds held steady, creating a more supportive environment for the euro.

For corporates, the recalibration matters. European exporters face a marginally stronger currency, which could tighten their margins if the trend persists, while importers benefit from reduced dollar-denominated costs. For investors, the EUR/USD is becoming a call on relative credibility: whether the Fed’s pivot is justified by economic factors or shaped by politics - and whether the European Central Bank can maintain stability as global conditions change.
The geopolitical backdrop adds another layer, analysts added. Markets are tracking every incremental update on Ukraine peace negotiations, with Vladimir Putin signalling that draft proposals could form the basis of future talks. While analysts caution against expecting a rapid “peace premium”, even the possibility of de-escalation has helped cap dollar demand against the euro.
Expert outlook
In the near term, market watchers stated the EUR/USD will remain closely tied to U.S. policy signals. A confirmed December rate cut, reinforced by dovish messaging, could send the pair back toward 1.17. But any upside surprise in U.S. labour or inflation data would temper enthusiasm and reintroduce volatility, particularly for leveraged positions - something traders often evaluate beforehand using the Deriv trading calculator to manage risk.
Medium-term dynamics remain more uncertain. The eurozone continues to wrestle with uneven growth and limited fiscal momentum, which could limit the sustainability of any rally built solely on dollar weakness. At the same time, bond markets remain a crucial indicator: if the U.S. 10-year yield breaks back above 4.1%, the dollar could regain some cyclically driven strength, according to experts.
The next trigger may come from a combination of Fed rhetoric, incoming U.S. data, and developments in Eastern Europe, all of which have the potential to redirect EUR/USD in the weeks ahead.
EUR/USD technical insights
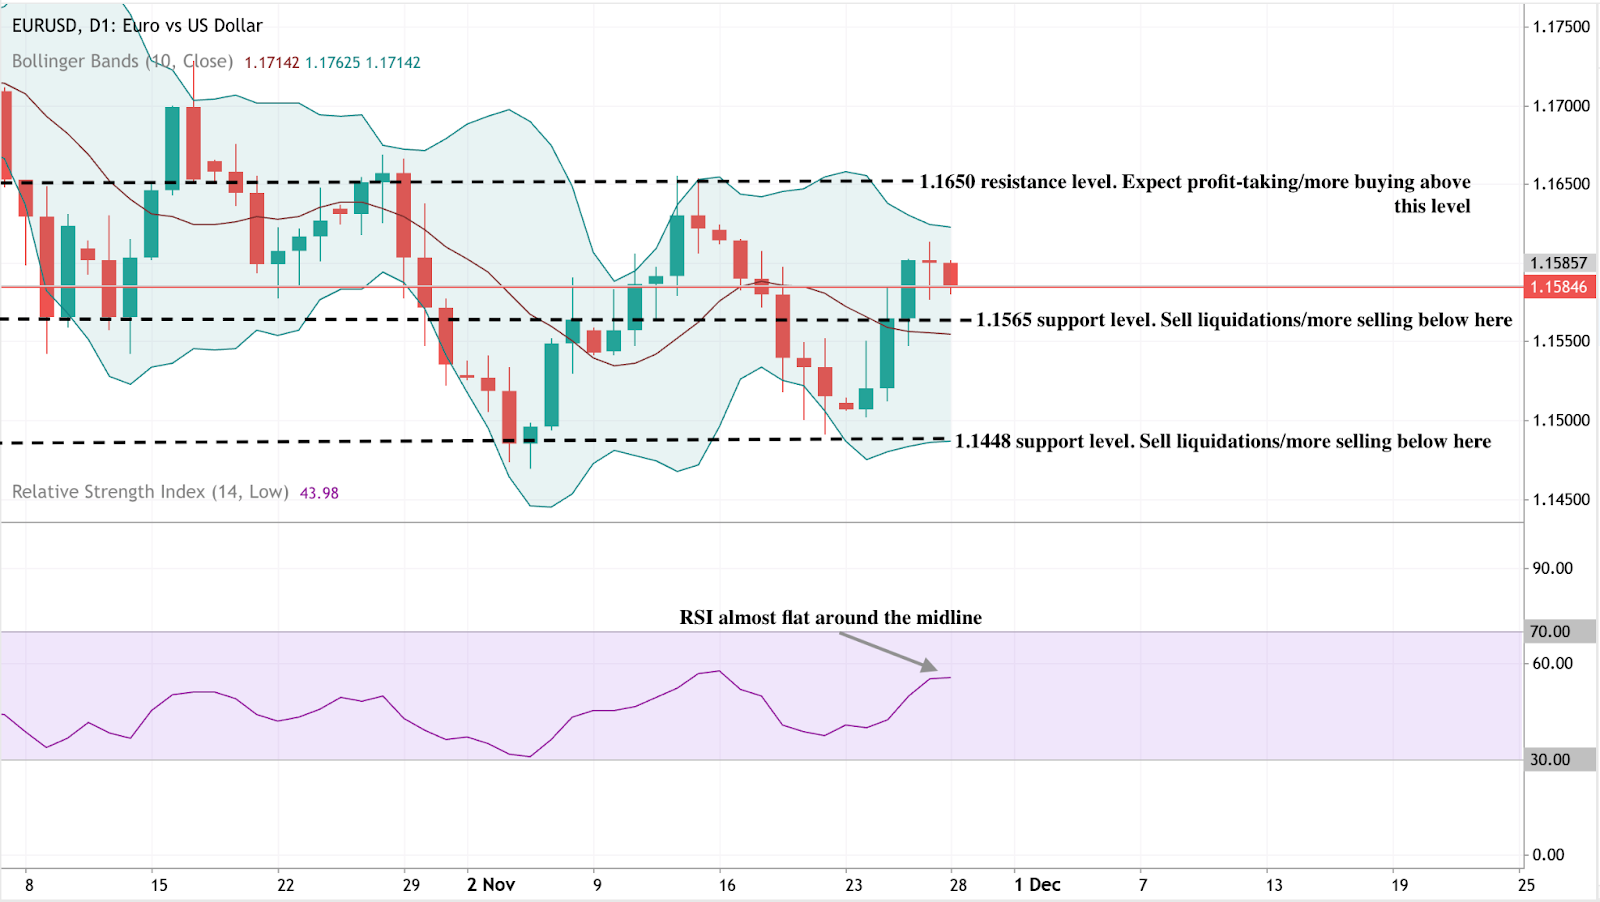
At the start of writing, EUR/USD is trading near 1.1585, moving sideways within a well-defined range. The pair continues to face overhead pressure from the 1.1650 resistance level, where traders may look for profit-taking or renewed buying if the price can break convincingly above it. On the downside, the first key support level sits at 1.1565, followed by a stronger base at 1.1448. A break below either level is likely to trigger sell liquidations and deeper downside momentum.
The price remains contained within the Bollinger Bands, indicating a market lacking strong directional conviction. This consolidative structure suggests EUR/USD may continue chopping within the range unless a macro catalyst - such as ECB or Fed commentary - forces a breakout.
The RSI is nearly flat, sitting around 44, close to the midline and signalling neutral momentum. Neither bulls nor bears currently dominate, reinforcing the idea that the pair is in a holding pattern while awaiting its next decisive move.
Key takeaway
EUR/USD is climbing because the dollar is undergoing a policy reckoning shaped by rapid shifts in rate expectations and rising political influence. The euro may not have a strong domestic story, but the repricing of U.S. monetary credibility has given it new momentum. The next leg depends on the Fed's decision in December, U.S. Treasury yields, and geopolitical developments. Traders on Deriv MT5 will closely watch those catalysts as they adjust their strategies.

L'argento sta silenziosamente superando l'oro: la corsa può continuare?
Dati recenti hanno mostrato che l'argento è salito di oltre il 7% questa settimana, portandolo a un passo dal suo massimo storico.
L'argento supera silenziosamente l'oro - ma la corsa può continuare? Dati recenti hanno mostrato che il metallo è salito di oltre il 7% questa settimana, portando XAG/USD a un passo dal suo massimo storico mentre la scarsa liquidità del Giorno del Ringraziamento amplifica ogni movimento. L'oro, solitamente protagonista, ha visto la sua volatilità diminuire, mentre l'argento sta rubando la scena con un'impennata che appare tutt'altro che stagionale.
Gli osservatori del mercato hanno espresso che le forze dietro questa rottura sono reali: vendite al dettaglio USA deboli, aspettative dei consumatori in crollo e una probabilità implicita di mercato dell'84% di un taglio dei tassi da parte della Fed a dicembre hanno turboalimentato la domanda di asset rifugio. I trader stanno ora valutando se questa impennata rifletta una dislocazione temporanea dovuta alle festività o le fasi iniziali di una rivalutazione strutturale. Questa domanda - se la sovraperformance dell'argento possa durare - dà il tono al resto dell'analisi di mercato.
Cosa guida l'impennata dell'argento?
L'ultima corsa dell'argento si trova all'incrocio tra stress macroeconomico e liquidità ridotta. Le vendite al dettaglio USA sono aumentate nominalmente dal 2021, segnalando un motore dei consumi bloccato che lascia poco spazio alla crescita. L'indice delle aspettative del Conference Board è precipitato a 63,2, un livello che storicamente ha preceduto recessioni, rafforzando la corsa verso asset difensivi.

Con gli investitori che rivalutano il percorso della domanda USA, i metalli sensibili ai cambiamenti economici hanno reagito più rapidamente - l'argento più di tutti.
La svolta della Federal Reserve ha accelerato questo cambiamento. I mercati hanno rapidamente ricalcolato le probabilità di un taglio dei tassi, passando dal 50% all'84% in pochi giorni.
I commenti del presidente della New York Fed John Williams e di altri funzionari hanno segnalato la disponibilità a un allentamento se il momentum continuerà a indebolirsi. Con i rendimenti del Treasury che si ritirano verso i minimi di un mese e il dollaro che si indebolisce, gli asset senza rendimento godono di un vantaggio sproporzionato. La leva dell'argento su queste condizioni aiuta a spiegare perché il suo movimento è stato così immediato - e così drammatico.
Perché è importante
Secondo gli analisti, la crescita dell'argento è importante non solo per la velocità della corsa ma per ciò che riflette. Nonostante la reputazione dell'oro come rifugio ultimo, l'argento lo ha superato di gran lunga, salendo del 163% da ottobre 2023 e raggiungendo un massimo storico di 54,38$ all'inizio di questo mese. Questa sovraperformance è sempre più difficile da ignorare per le istituzioni perché l'argento si trova all'incrocio tra copertura monetaria e utilità industriale.
Avvertono inoltre che l'azione del prezzo sta esponendo ansie più profonde. Tim Waterer, Chief Market Analyst di KCM Trade, osserva che il mercato sta reagendo a “un coro di commenti accomodanti” mentre si accumulano indicatori macro deboli. La sua valutazione indica un problema più ampio: l'argento sta salendo non perché la crescita sia forte, ma perché la fiducia nella traiettoria dell'economia USA sta diminuendo. I metalli stanno assorbendo questa incertezza in tempo reale.
Impatto su mercati e industria
Per i trader, l'impennata dell'argento complica il posizionamento mentre i mercati si assottigliano per il periodo festivo. La minore partecipazione amplifica i movimenti intraday, rendendo più difficile coprire i rischi direzionali. Su piattaforme come Deriv MT5, dove la velocità di esecuzione e la dimensione precisa delle operazioni sono cruciali durante condizioni volatili, questo ambiente richiede ai trader di rimanere vigili. Molti si affidano sempre più a strumenti come il calcolatore di trading Deriv per misurare il potenziale profitto, le commissioni di swap e l'esposizione della posizione prima di affrontare le brusche oscillazioni intraday dell'argento.
Ma la storia più profonda si trova nel settore industriale. La domanda di argento dalla produzione di pannelli solari è salita a 243,7 milioni di once nel 2024, rispetto ai 191,8 milioni del 2023 e più del doppio rispetto al livello del 2020.
Con la capacità solare globale destinata a raggiungere quasi 1.000 GW all'anno entro il 2030, la domanda dovrebbe aumentare di altri 150 milioni di once all'anno. L'offerta, tuttavia, rimane limitata: la maggior parte della produzione globale di argento è un sottoprodotto della produzione di rame, zinco, piombo o oro, rendendo lenta l'adattabilità ai segnali di prezzo. Mining Technology stima che la produzione globale potrebbe scendere a 901 milioni di once entro il 2030 - un deficit strutturale che rafforza il caso a lungo termine per prezzi più alti.
Prospettive degli esperti
I trader professionisti hanno espresso che la sostenibilità della corsa dell'argento dipende da tre fattori chiave: la prossima mossa della Fed, la traiettoria dei consumi USA e il ritmo dell'espansione industriale. Se i responsabili politici confermeranno la svolta di dicembre, la combinazione di rendimenti più bassi e un dollaro più debole potrebbe fornire il catalizzatore necessario per portare i prezzi a nuovi massimi storici. E con i segnali di recessione che si fanno più evidenti, la domanda di asset rifugio difficilmente svanirà rapidamente.
Tuttavia, nulla è certo. Una ripresa improvvisa dell'attività dei consumatori o una sorpresa inflazionistica potrebbero rallentare le aspettative di allentamento della politica. Gli utenti industriali potrebbero infine reagire contro prezzi più alti, anche se la domanda solare sembra abbastanza robusta da assorbire la volatilità a breve termine. Per ora, i trader monitorano da vicino i dati macroeconomici in arrivo e le comunicazioni della Federal Reserve. Una rottura decisiva al di sopra del picco precedente potrebbe segnalare che il mercato vede un regime di prezzo fondamentalmente nuovo per l'argento.
Punto chiave
L'impennata dell'argento è radicata in segnali economici reali, dal peggioramento dei dati USA all'aumento delle aspettative di tagli dei tassi a breve termine. Il metallo ha sovraperformato l'oro e ora si avvicina a massimi storici, supportato sia dai flussi rifugio sia da una potente storia industriale. Se la corsa continuerà dipende dai messaggi della Fed e dalla resilienza delle famiglie USA, ma la tendenza più ampia punta verso un'offerta più stretta e una domanda duratura. Le prossime settimane riveleranno se l'argento sta semplicemente correndo - o se si sta riprezzando per un nuovo ciclo del tutto.
Approfondimenti tecnici sull'argento
All'inizio della scrittura, l'argento (XAG/USD) viene scambiato intorno a 53,79$, spingendosi aggressivamente verso l'alto mentre si avvicina al livello di resistenza principale a 54,22$. Questa zona probabilmente attirerà prese di profitto, anche se una rottura netta potrebbe innescare nuovi acquisti di momentum data la forza della corsa attuale.
Al ribasso, i supporti chiave si trovano a 50,00$ e 47,00$. Un ritorno al di sotto di uno di questi indicherebbe una pressione rialzista in calo e potrebbe scatenare liquidazioni di vendite o un ritracciamento più profondo, specialmente se il prezzo scivola attraverso il punto medio del canale Bollinger Band.
Il momentum rimane forte, con il RSI che sale bruscamente intorno a 80, saldamente in territorio di ipercomprato. Questo segnala che gli acquirenti sono al comando ma avverte anche di un possibile esaurimento a breve termine. Pur mantenendo intatta la tendenza al rialzo, l'argento potrebbe essere vulnerabile a ritracciamenti o consolidamenti laterali se le condizioni di ipercomprato persistono.


L'arco di redenzione di Bitcoin: può davvero reggere la rottura a 90.000$?
L'arco di redenzione di Bitcoin è arrivato in piena vista mentre risale sopra i 90.000$, sollevando la domanda se questa rottura possa davvero reggere.
L'arco di redenzione di Bitcoin è arrivato in piena vista mentre la più grande criptovaluta al mondo risale sopra i 90.000$, sollevando la domanda se questa rottura possa davvero reggere. Il movimento segue un forte rimbalzo dal minimo di circa 80.400$ registrato solo pochi giorni prima, spinto in gran parte dalle crescenti aspettative che la Federal Reserve possa tagliare i tassi a dicembre e da un più ampio spostamento verso asset a rischio, secondo i rapporti.
Tuttavia, il rally di Bitcoin poggia su basi fragili, con gli ETF spot che continuano a registrare flussi deboli e una performance mese su mese che mostra BTC in calo di quasi il 19%, sottolineando la natura incerta del rimbalzo.
Gli analisti hanno espresso che questa tensione tra rinnovato ottimismo e deterioramento della liquidità definisce ora l'umore del mercato. Se Bitcoin vuole trasformare questa ripresa in qualcosa di duraturo, deve superare una forte resistenza nella zona tra 92.000$ e 95.000$ e attrarre un deciso ritorno di volume retail e partecipazione degli ETF. Se queste condizioni si manifesteranno - o se la rottura svanirà in un altro calo correttivo - determinerà il prossimo capitolo del cosiddetto arco di redenzione di Bitcoin.
Cosa guida l'ultimo movimento di Bitcoin
L'ultima ascesa di Bitcoin è stata alimentata in parte da un cambiamento delle aspettative macro. I trader ora assegnano maggiori probabilità a un taglio dei tassi della Federal Reserve a dicembre, il che sta contribuendo a alimentare un rimbalzo dell'appetito per il rischio nei mercati azionari e delle criptovalute.
Questo cambiamento di sentiment ha aiutato BTC a riconquistare la soglia dei 90.000$ dopo essere sceso nella regione degli 80.000$ la scorsa settimana. Tuttavia, il contesto è più complicato: l'inflazione rimane elevata, spingendo gli analisti di QCP Capital a mettere in guardia che “l'offerta probabilmente limiterà BTC nella fascia media dei 90.000$,” suggerendo che il rally potrebbe essere vicino all'esaurimento.
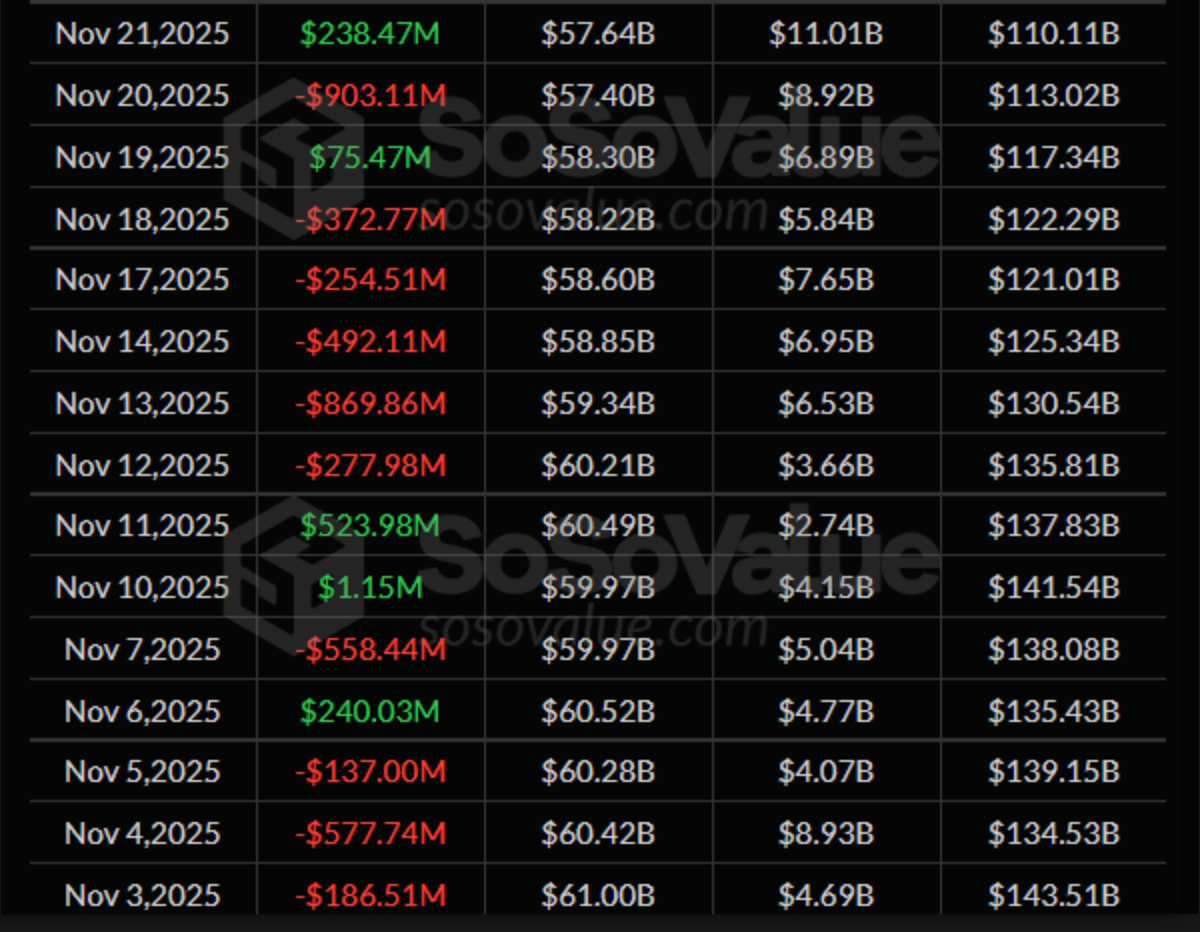
Il panorama degli ETF aggiunge un ulteriore livello. Dopo settimane di deflussi record, gli ETF bitcoin statunitensi hanno faticato ad attrarre flussi costanti. Gli analisti osservano che la liquidità rimane scarsa e la domanda degli investitori è esitante.
MicroStrategy - uno dei maggiori detentori aziendali di Bitcoin - ha appena raggiunto livelli di pareggio ed è ora nella watchlist di delisting di MSCI, amplificando l'incertezza sull'esposizione istituzionale. Queste tensioni rimangono sotto la superficie, anche mentre i prezzi si riprendono, rivelando un rally costruito più sul posizionamento macro che su forti afflussi di capitale.
Perché è importante
La divergenza tra l'azione del prezzo e le metriche strutturali è diventata un punto focale per gli investitori. Torsten Slok, capo economista di Apollo, osserva che la tipica correlazione di Bitcoin con il Nasdaq si è indebolita nelle ultime settimane, poiché BTC è calato più rapidamente rispetto ai principali benchmark tecnologici.

Questo disaccoppiamento solleva interrogativi su problemi di liquidità specifici delle crypto in un momento in cui le azioni si stanno stabilizzando. Nel frattempo, gli analisti di 10X Research avvertono che il mercato potrebbe riporre troppa fiducia in un taglio dei tassi a dicembre. Il loro lavoro suggerisce che Bitcoin reagisce più alla comunicazione e al tono della Fed che alle effettive mosse di politica monetaria.
Se Powell dovesse segnalare cautela o minimizzare il ritmo del futuro allentamento, i mercati potrebbero invertire rapidamente. La società mette anche in discussione le ipotesi riguardo alla spesa del Treasury General Account (TGA) come catalizzatore per la liquidità crypto, osservando che i precedenti rilasci del TGA hanno impiegato fino a due mesi per riflettersi nel prezzo di Bitcoin - se mai lo hanno fatto.
Impatto su industria, mercati e consumatori
Dati recenti hanno rivelato che la risalita di Bitcoin sopra i 90.000$ potrebbe aver ripristinato una certa fiducia psicologica, ma il quadro strutturale rimane incerto. L'asset è ancora in calo del 5% da inizio anno e i prodotti ETF si sono stabilizzati solo di recente dopo pesanti deflussi che hanno contribuito alla caduta di BTC intorno agli 80.000$. Il rimbalzo ha offerto sollievo, ma il mercato è lontano dal segnalare una tendenza al rialzo netta.
I flussi istituzionali offrono segnali di un cambiamento. Il CEO di VALR, Farzam Ehsani, ha dichiarato che gli ETF spot hanno registrato afflussi martedì per la prima volta in settimane - “un segnale precoce che la liquidità istituzionale sta tornando.” I trader che monitorano il comportamento del prezzo tramite Deriv MT5 hanno notato l'importanza dei 90.000$ come punto di svolta strutturale, con timeframe più brevi che mostrano volatilità tra tentativi rialzisti e ondate di presa di profitto. Nel frattempo, il calcolatore di trading Deriv è diventato sempre più utile per i trader che cercano di stimare i costi di posizione e il rischio mentre BTC si confronta con una resistenza importante.
Secondo gli osservatori di mercato, la performance di Bitcoin continua a influenzare il più ampio complesso degli asset digitali. Un mantenimento deciso sopra i 90.000$ potrebbe aumentare la liquidità nei mercati di altcoin e stablecoin. Un cedimento dei rischi potrebbe riaccendere vendite forzate ed erodere la fiducia nel settore.
Prospettive degli esperti
QCP Capital vede una chiara fascia di resistenza tra 92.000$ e 95.000$, avvertendo che la riduzione della liquidità potrebbe limitare ogni tentativo di spinta verso l'alto. Identificano la fascia 80.000$–82.000$ come un'area di supporto cruciale che gli acquirenti hanno difeso durante l'ultima svendita. Gli analisti di 10X Research aggiungono che se i ritardi storici della liquidità TGA si confermano, Bitcoin potrebbe consolidarsi fino a fine gennaio 2026, riducendo le probabilità di una rottura rapida.
Non tutti gli strateghi credono che sia stato raggiunto un minimo. L'analista di Compass Point Ed Engel sostiene che i mercati orso spesso presentano “rapidi rally di sollievo seguiti da vendite aggressive nei momenti di forza.” Vuole vedere un'accumulazione netta da parte dei detentori a lungo termine e un posizionamento short più deciso nei mercati futures prima di diventare costruttivo. Senza questi segnali, Engel identifica il rischio che BTC possa incontrare una forte resistenza se si avvicina a 92.000$-95.000$, potenzialmente innescando un nuovo ribasso.
Punto chiave
Gli analisti osservano che la risalita di Bitcoin sopra i 90.000$ segna un punto di svolta simbolico nel suo arco di redenzione in corso, ma le fondamenta di questo rally rimangono fragili. La resistenza vicino a 92.000$–95.000$, i deboli afflussi negli ETF e un contesto di liquidità storicamente fragile a fine anno sfidano la sostenibilità della rottura.
La fase successiva dipenderà da come i mercati digeriranno i messaggi della Fed di dicembre, se i trader retail torneranno e se gli afflussi istituzionali si rafforzeranno. Queste forze determineranno se la rinascita di Bitcoin continuerà o si fermerà a una resistenza già vista.
Approfondimenti tecnici su Bitcoin
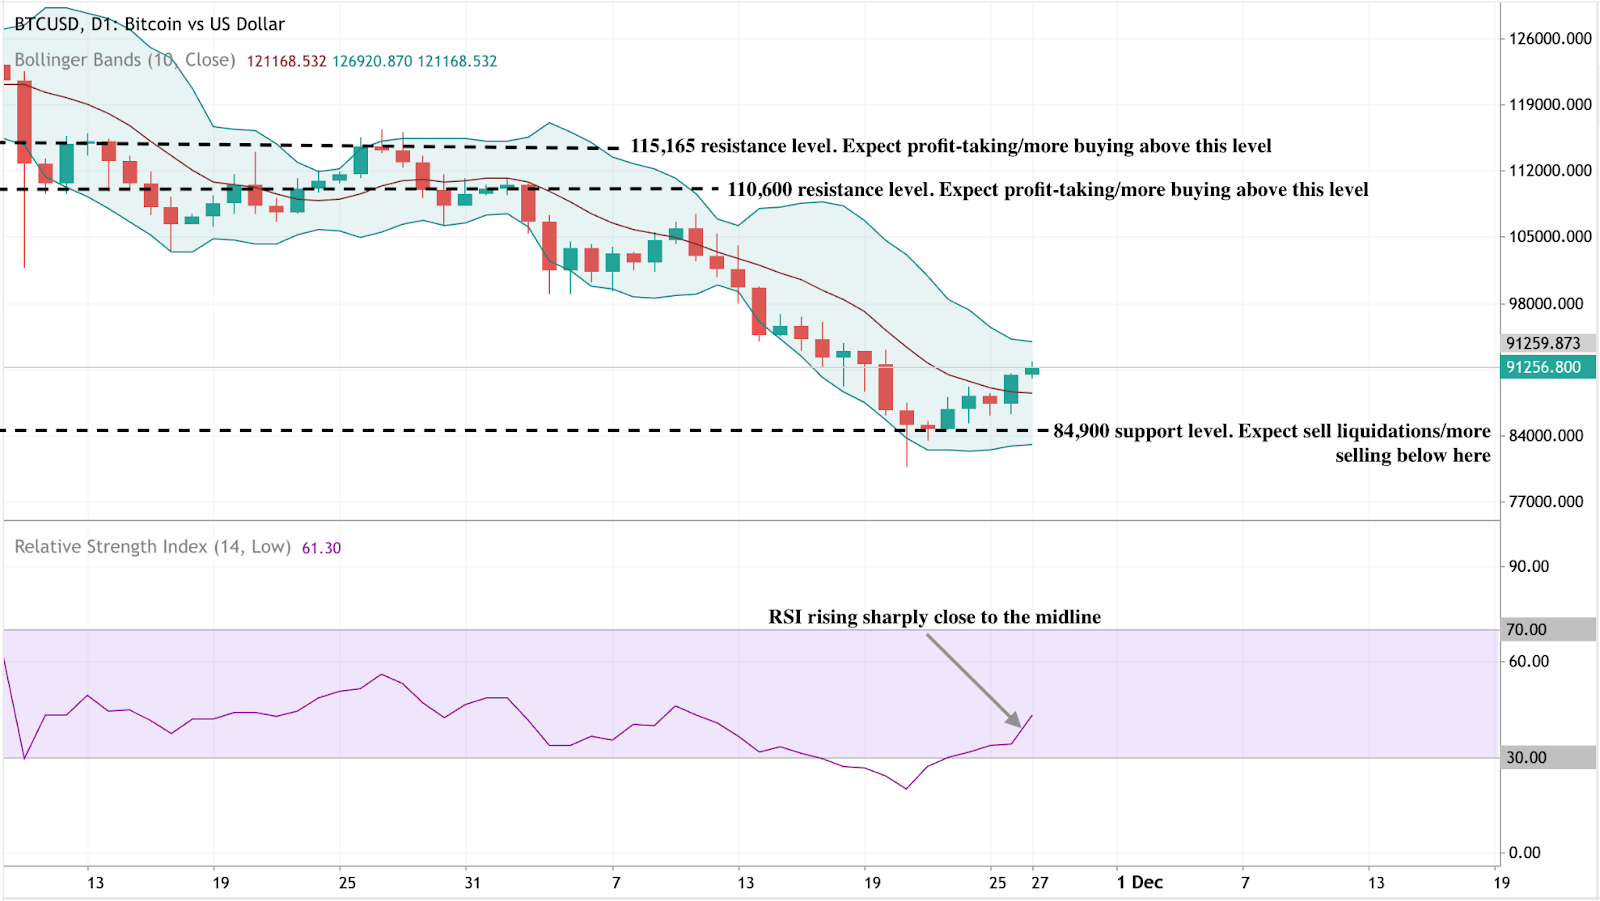
All'inizio della scrittura, Bitcoin (BTC/USD) sta tentando una ripresa dai recenti minimi, scambiando poco sopra i 91.200$ dopo un rimbalzo dalla zona di supporto chiave a 84.900$. Mantenere questo livello è cruciale - una rottura al di sotto potrebbe innescare liquidazioni di vendita e riaprire la tendenza al ribasso. Al rialzo, BTC ora affronta due importanti livelli di resistenza: 110.600$ e 115.165$, dove i trader potrebbero cercare prese di profitto o un rinnovato interesse all'acquisto se il prezzo riuscisse a costruire abbastanza slancio per ritestarli.
L'azione del prezzo rimane contenuta all'interno delle Bollinger Bands, con BTC che inizia a spingersi verso la banda centrale dopo un lungo periodo di debolezza. Questo suggerisce i primi segnali di stabilizzazione, anche se la tendenza più ampia rimane cauta fino a una rottura netta sopra le zone di resistenza.
L'RSI è salito bruscamente a circa 61, risalendo verso la linea mediana dopo aver trascorso del tempo in condizioni di ipervenduto. Questo cambiamento evidenzia un miglioramento del momentum rialzista, ma con ancora molto margine prima di raggiungere livelli di ipercomprato, suggerendo che la ripresa potrebbe avere ancora spazio per proseguire se gli acquirenti continueranno a intervenire.

BoJ vs Fed: How December decisions could shatter the yen’s fragile range
A potential BoJ rate hike clashing against near-certain Fed easing could finally tip the scales
December 2025 is poised to deliver a high-stakes policy showdown between the Bank of Japan (BoJ) and the US Federal Reserve, with USD/JPY hovering in a precarious 154–158 band, suggesting intervention is likely.
As of 27 November 2025, the pair trades around 155.91, down slightly from recent highs near 157.89 but still vulnerable to a break in either direction. A potential BoJ rate hike clashing against near-certain Fed easing could finally tip the scales - yen bulls are banking on a downside rupture, while bears eye a dollar rebound if either central bank disappoints.
The yen’s tightrope: USD/JPY’s November range
USD/JPY has been confined between the 154.00 support price and 158.00 danger zone price through much of November, a tug-of-war between persistent US yield strength propping up the dollar and mounting speculation on policy divergence.
The upper end-157-158-marks familiar "intervention territory," where Tokyo has deployed verbal and actual yen support in past episodes of rapid depreciation. This range persists amid a backdrop of weak yen-fueled inflation risks in Japan and cooling US data, which is tilting toward Fed cuts.
BoJ: A December hike edges into focus
BoJ rhetoric has sharpened on yen weakness as an inflation accelerant, with import costs now a key concern. A Reuters poll from 11-18 November revealed a slim majority - 53% (43 of 81 economists) - anticipating a 25 basis point hike to 0.75% at the 18-19 December meeting, up from prior surveys. All polled forecasters see at least that level by March 2026.
Easing political friction has helped: Prime Minister Sanae Takaichi’s recent nod to gradual normalisation, following talks with Governor Kazuo Ueda, has reduced near-term hurdles. Ex-BoJ insiders echo this, citing current levels as a catalyst for action sooner than later.
Fed: Overwhelming odds on a December cut
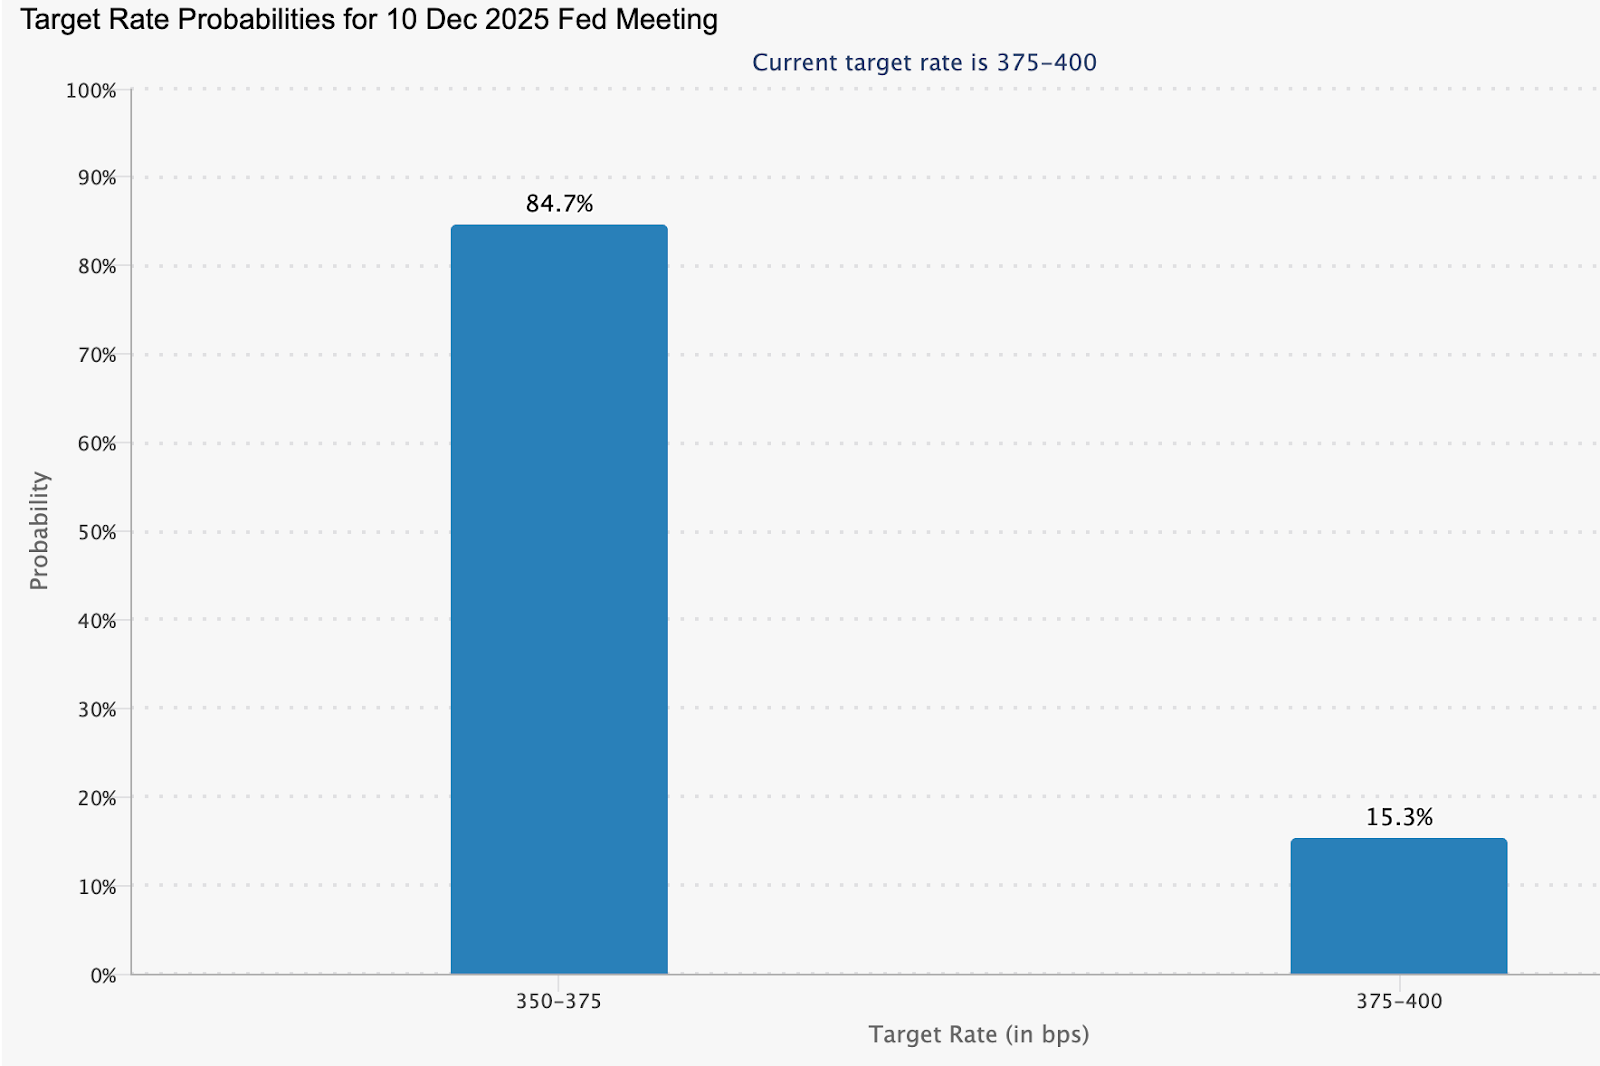
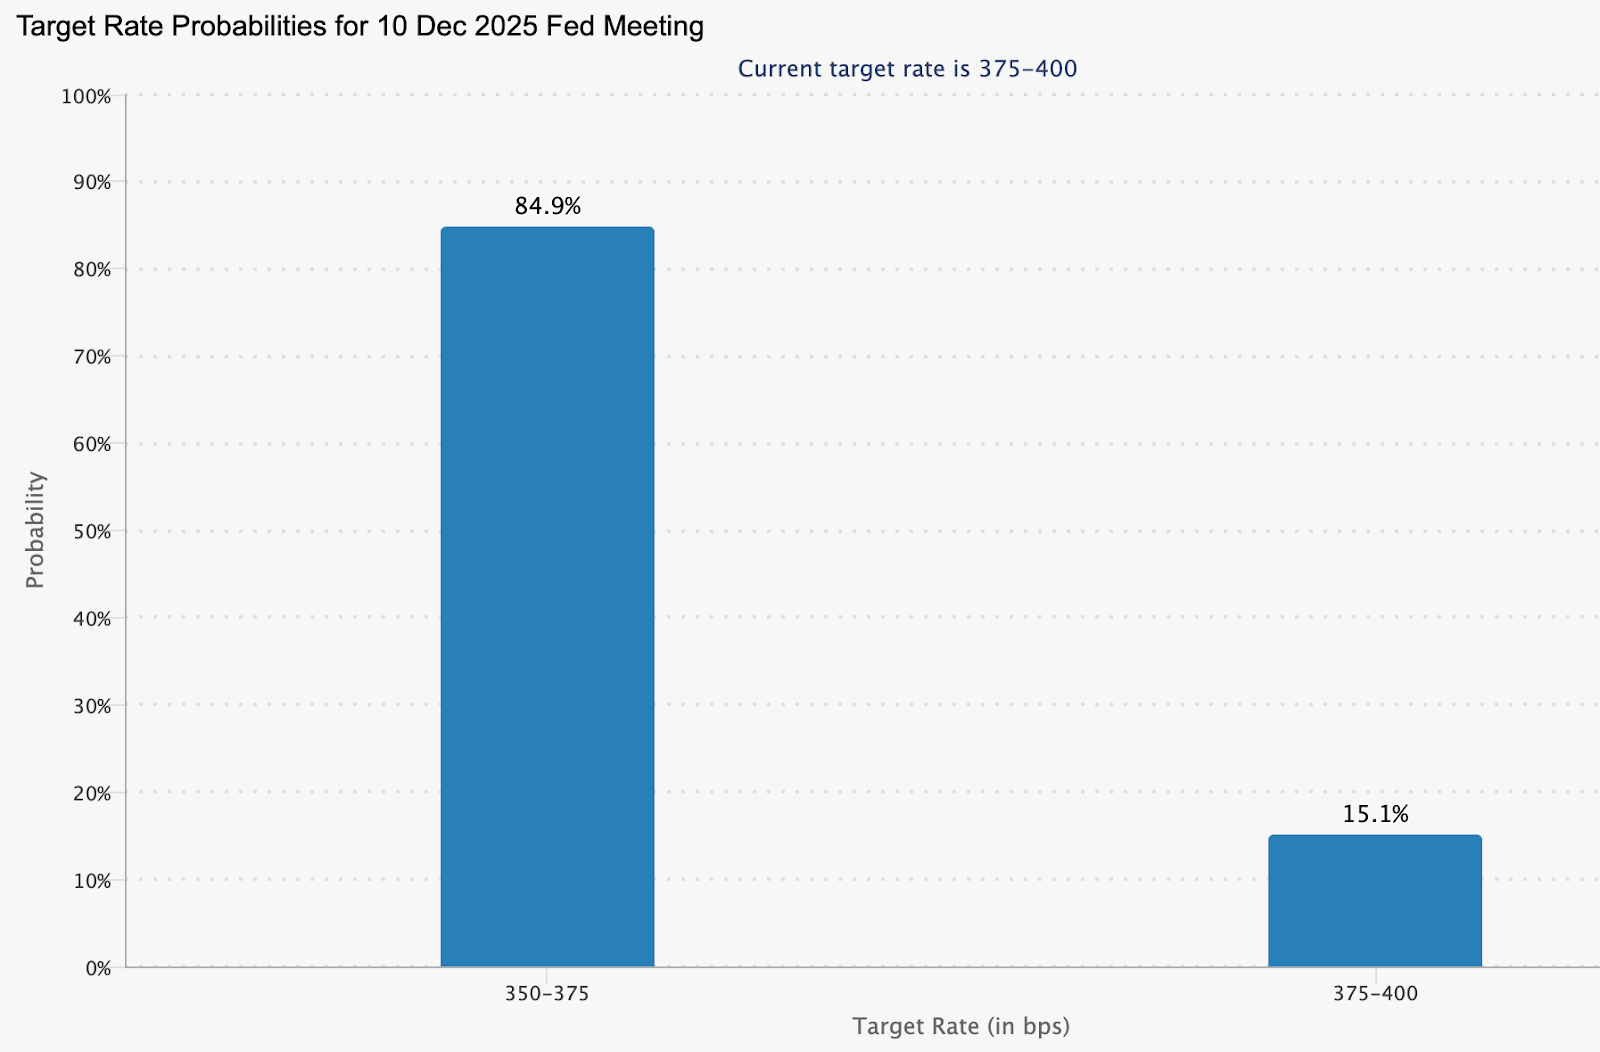
Market pricing leans heavily toward Fed easing, with the CME FedWatch Tool data as of 26 November showing an 84.9% probability of a 25-basis-point reduction at the 10 December FOMC meeting.
This reflects softer US indicators, including recent jobs data that hasn't derailed cut expectations despite some internal Fed debate. Such a move would trim the US–Japan yield gap modestly, offering tailwinds to the yen independent of BoJ moves.
Why it matters
The December decisions will determine whether the yen’s months-long stasis finally resolves into a trend - a critical shift for traders, Japanese policymakers, and multinational firms managing currency exposure. A break from the 154–158 range would influence capital flows, hedging strategies, and carry-trade dynamics at a time when global FX volatility is already rising.
For Japan, the stakes are especially high. A stronger yen would ease imported inflation and energy-cost pressures, while a renewed slide would intensify political scrutiny and prompt the Ministry of Finance to consider direct intervention. For the US, the Fed’s decision will signal how confidently it believes inflation is returning to its target, shaping global risk appetite as the year-end approaches.
Breakout scenarios: Two paths for USD/JPY
These outcomes hinge on post-meeting commentary - hawkish BoJ signals or dovish Fed dots could exaggerate moves.
What to monitor closely
- Event timeline: Fed decision on 10 December; BoJ on 18–19 December.
- Volatility gauges: One- and two-week option-implied vol expected to spike, signaling hedge flows.
- The intervention threshold of 157–160 remains a political flashpoint for Ministry of Finance action.
USDJPY technical insights
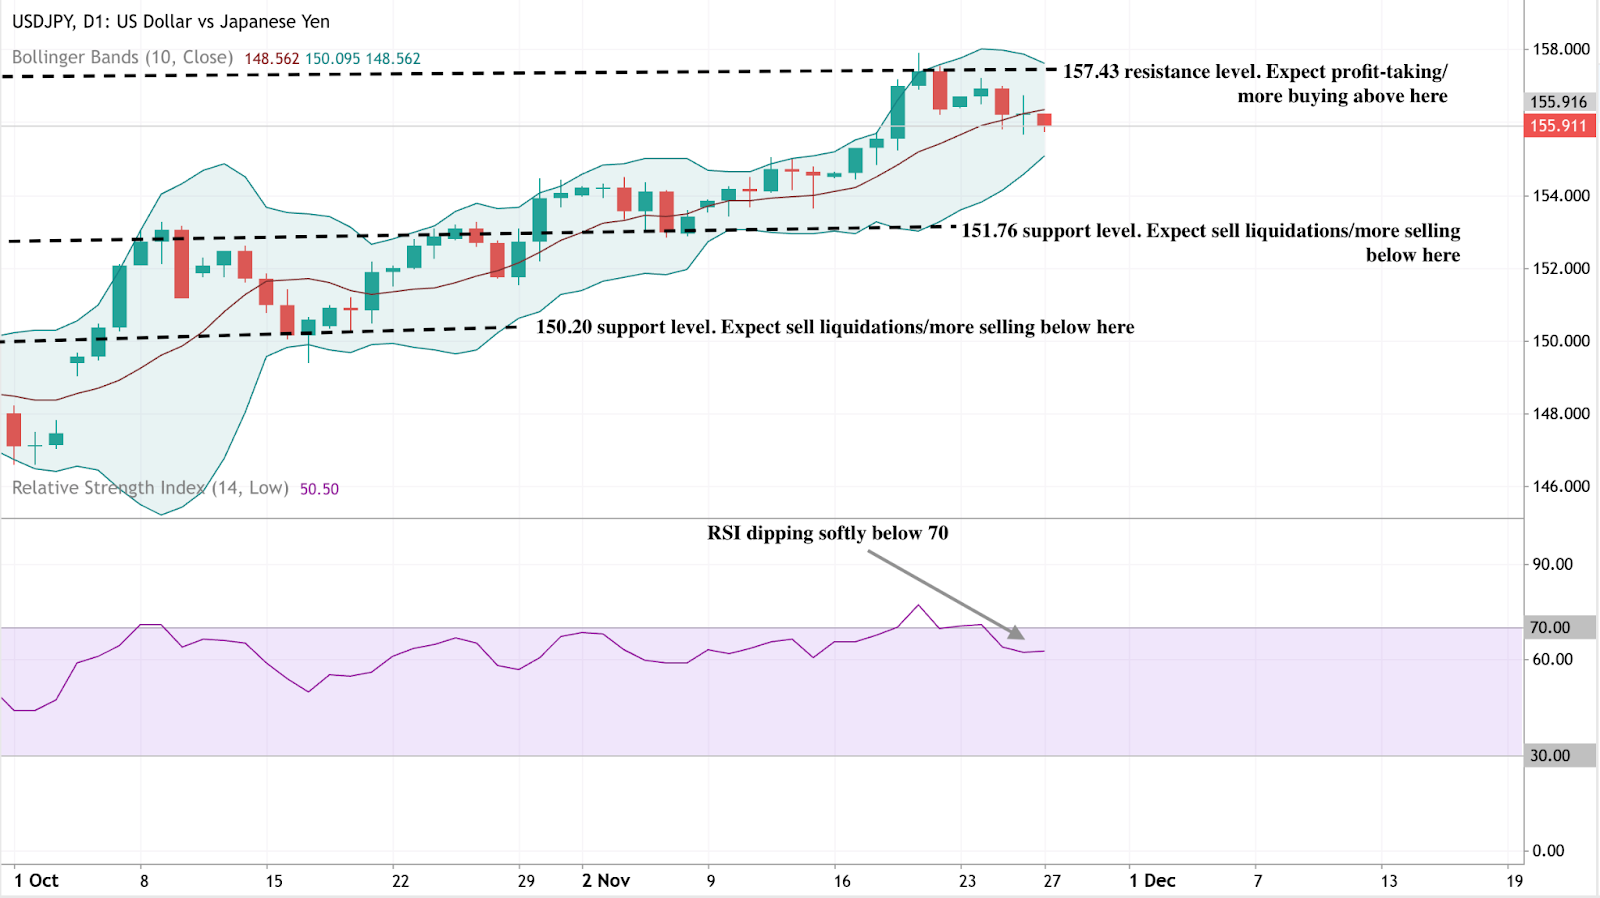
At the start of writing, USD/JPY is trading just below 156, easing slightly after failing to hold levels near the 157.43 resistance zone - an area where traders typically look for profit-taking or fresh upside breakouts. The pair now sits above two key supports at 151.76 and 150.20; slipping below either level could trigger sell liquidations and a deeper corrective move toward the lower Bollinger Band.
Despite the recent pullback, price action remains broadly constructive, with the pair still riding the middle Band and holding below the short-term moving averages.
The RSI, meanwhile, has dipped gently below 70, signalling that bullish momentum is cooling after a stretch of overbought readings. This soft decline hints at consolidation rather than a full reversal, suggesting the pair may trade sideways while the market waits for new catalysts, such as U.S. data or Bank of Japan commentary, to determine its next leg.

La corsa al capex AI del 2025 delle big tech: Amazon guida il gruppo con oltre 125 miliardi di dollari di investimenti
I numeri sono impressionanti. Nel 2025, Amazon, Microsoft, Alphabet e Meta prevedono collettivamente tra 360 e 400 miliardi di dollari in spese in conto capitale.
I numeri sono impressionanti. Nel 2025, Amazon, Microsoft, Alphabet e Meta prevedono collettivamente tra 360 e 400 miliardi di dollari in spese in conto capitale – un aumento di circa il 60% anno su anno, con la stragrande maggioranza destinata a infrastrutture legate all’AI (data centre, chip personalizzati, cluster GPU/Trainium).
Il 24 novembre 2025, BNP Paribas Exane ha avviato la copertura su Amazon con un rating Outperform e un target price di 320 dollari - attualmente il più alto tra i principali broker e che implica un potenziale rialzo di circa il 39% rispetto alla chiusura del 26 novembre di circa 230 dollari.
Previsioni capex 2025 - Le quattro grandi
| Azienda | Previsioni Capex 2025 | Principali aree di focus AI |
|---|---|---|
| Amazon | >125 mld $ (aumentato più volte nel 2025) | Cluster hyperscale AWS, chip Trainium/Inferentia, cloud sovrani e governativi |
| Microsoft | 80–121 mld $ (FY che termina a giugno 2026) | Espansione Azure, infrastruttura OpenAI, GenAI aziendale |
| Alphabet | ~91 mld $ (aumentato da 85 mld $) | Google Cloud TPU, recupero dei deficit storici di capacità |
| Meta | 70–72 mld $ | Modelli Llama, pubblicità guidata dall’AI, data centre single-site di grandi dimensioni |
Fonti: Company filings, earnings calls, BNP Paribas Exane, BBC, Bloomberg, Reuters
Perché BNP Paribas Exane vede Amazon in modo diverso
Gli analisti di BNP Paribas Exane sostengono che le preoccupazioni riguardo a un sotto-investimento di Amazon o a un suo ritardo nell’AI siano “esagerate” alla luce delle spese dichiarate e della pipeline dell’azienda. Il team finanziario di Amazon ha discusso una prospettiva di capex per il 2025 di circa 125 miliardi di dollari, con aspettative di una cifra ancora più alta nel 2026, e ha indicato che la stragrande maggioranza è focalizzata su infrastrutture dedicate all’AI come data centre, networking e acceleratori proprietari per AWS.
La nota evidenzia diversi punti che differenziano Amazon in questo ciclo di capex:
- Integrazione verticale: Progettando i propri chip AI come Trainium e Inferentia, il management ha indicato potenziali vantaggi in termini di costi ed efficienza rispetto all’affidarsi esclusivamente a GPU di terze parti, il che potrebbe aiutare sia sui prezzi che sulla flessibilità di capacità nel tempo.
- Molteplici canali di monetizzazione: L’infrastruttura AI è posizionata per supportare non solo i carichi di lavoro enterprise e governativi di AWS, ma anche miglioramenti nella rilevanza pubblicitaria, ottimizzazione logistica e servizi rivolti ai consumatori, offrendo ad Amazon diversi modi per tradurre l’infrastruttura in ricavi.
- Narrazione sui margini di lungo termine: La tesi della società fa riferimento a scenari in cui la crescita di AWS accelera nuovamente verso la fascia media del 20% e la pubblicità cresce del 20–25%+ annuo, contribuendo a una potenziale espansione del margine operativo a livello di gruppo su un orizzonte pluriennale, anche se i risultati effettivi dipenderanno dall’esecuzione e dalla domanda.
Principali dibattiti e rischi per gli investitori
| Dibattito / Rischio | Prospettiva “Bull” rappresentativa | Prospettiva “Bear” rappresentativa |
|---|---|---|
| Entità del capex | Il capex AI su larga scala è visto come necessario per garantire la domanda di lungo termine nel cloud, nei servizi AI e nella pubblicità, con l’idea che la spesa attuale rifletta una crescita strutturale dei carichi di lavoro. | Alcuni investitori temono uno scenario di overbuild in cui la capacità viene aggiunta più velocemente della domanda, riducendo i rendimenti sul capitale investito e lasciando asset sottoutilizzati. |
| Tempistica dei ritorni | Gli osservatori favorevoli si aspettano che l’utilizzo e la monetizzazione aumentino tra il 2026 e il 2027, man mano che i progetti di AI generativa passano dai piloti alla piena implementazione, soprattutto nel cloud e nel software aziendale. | Le opinioni scettiche evidenziano pressioni sul free cash flow nel breve termine e incertezza su quanto velocemente la sperimentazione si tradurrà in una spesa AI ricorrente e significativa. |
| Posizionamento competitivo | I sostenitori vedono la strategia full-stack di Amazon (dai chip al cloud alle applicazioni consumer) come un vantaggio duraturo rispetto ai concorrenti focalizzati su singoli livelli dello stack. | I critici sottolineano il forte slancio di Microsoft Azure e Alphabet/Google Cloud e si chiedono se una singola azienda possa mantenere un vantaggio netto. |
| Sensibilità macro | Alcuni sostengono che la spesa cloud e AI stia diventando “simile a un’infrastruttura”, rimanendo resiliente anche in caso di rallentamento dei consumi, soprattutto per i carichi di lavoro mission-critical. | Altri temono che un rallentamento economico più ampio possa pesare sui budget pubblicitari digitali e sui volumi dell’e-commerce—principali motori di ricavo per Amazon e Meta. |
Prossimi catalizzatori/punti dati
- AWS re:Invent - inizio dicembre 2025
Gli operatori di mercato probabilmente seguiranno gli annunci su nuovi servizi AI, offerte di modelli e ampliamenti di capacità, oltre a case study dei clienti che illustrano carichi di lavoro su scala produttiva.
- Risultati Amazon Q4 2025 - attesi tra fine gennaio / inizio febbraio 2026
Le metriche chiave da monitorare includono i tassi di crescita dei ricavi AWS, il reddito operativo per segmento e i commenti del management sulla domanda guidata dall’AI e sui piani capex per il 2026.
- Risultati dei peer e guidance aggiornata - inizio 2026
I risultati di Microsoft, Alphabet e Meta previsti per l’inizio del 2026 dovrebbero fornire nuovi dettagli sulle traiettorie di capex, sull’adozione dei prodotti AI e su come ciascuna azienda stia bilanciando gli investimenti con il free cash flow.
Questi eventi potrebbero offrire maggiore chiarezza su quanto rapidamente gli investimenti in AI si stiano traducendo in ricavi e se i livelli di capex rimarranno elevati, si modereranno o aumenteranno ulteriormente nel 2026.
Approfondimenti tecnici su Amazon
All’inizio della stesura, Amazon (AMZN) è scambiata intorno a 229 dollari, in ripresa dai minimi recenti e mantenendosi sopra i supporti chiave a 218,45 e 213 dollari. Una discesa sotto queste zone potrebbe innescare liquidazioni, mentre una spinta al rialzo riporterebbe in focus la resistenza a 250,15 dollari - un’area dove i trader potrebbero prendere profitto o cercare nuovi acquisti.
L’RSI rimane piatto intorno a 50, segnalando un momentum neutrale e suggerendo che il mercato stia ancora cercando una direzione dopo il recente ritracciamento.


Prospettive sul prezzo di XRP: cosa succederà ora che lo slancio degli ETF si scontra con le vendite?
Le prospettive sul prezzo di XRP sono diventate insolitamente tese poiché il forte slancio degli ETF si sta ora scontrando frontalmente con un’ondata di pesanti vendite.
Le prospettive sul prezzo di XRP sono diventate insolitamente tese poiché il forte slancio degli ETF si sta ora scontrando frontalmente con un’ondata di pesanti vendite. Il token dovrebbe salire grazie alle numerose approvazioni di ETF negli Stati Uniti il 21 novembre – alcuni dei quali hanno registrato oltre 50 milioni di dollari di volume nel primo giorno di negoziazione, secondo l’analista di mercato Eric Balchunas – eppure XRP è invece sceso a 2,18, in calo dai massimi di 2,29, in mezzo a vendite diffuse nel mercato crypto. Questa contraddizione tra progresso strutturale e pressione di mercato sta definendo lo scenario attuale.
Lo scontro solleva una domanda cruciale per gli investitori: l’arrivo dei flussi regolamentati degli ETF rappresenta la base per una rivalutazione a lungo termine, oppure le vendite persistenti finiranno per sopraffare il sentiment e trascinare il mercato verso un reset più profondo? XRP si trova ora a un punto di svolta tecnico e psicologico, e la risoluzione di questa tensione determinerà la sua prossima mossa importante.
Cosa sta guidando il recente cambiamento di XRP?
Secondo i report, le recenti dinamiche di prezzo di XRP sono influenzate da due narrazioni contrapposte. Da un lato, analisti che da tempo sostengono obiettivi ambiziosi – come 24HrsCrypto e il fondatore di Black Swan Capitalist Versan Aljarrah – continuano ad affermare che il valore di XRP è legato in ultima analisi alla domanda di regolamento globale piuttosto che all’hype retail.
Secondo loro, Bitcoin sale per speculazione, mentre il potenziale di XRP nel lungo termine dipende da “utilità, domanda di regolamento e necessità di liquidità globale.” Questi analisti sostengono che l’accumulazione paziente e l’adozione istituzionale restano centrali per la creazione di valore di XRP.
Questo tema si è scontrato con un importante sviluppo normativo: l’approvazione formale di diversi ETF su XRP negli Stati Uniti. La certificazione NYSE dell’ETF di Franklin Templeton e il lancio di prodotti da parte di Bitwise, 21Shares e altri hanno creato un canale pulito e conforme per gli investitori tradizionali.
I primi afflussi riflettono un interesse reale – Bitwise ha registrato 22 milioni di dollari di volume nel giorno di apertura, mentre il prodotto XRPC di Canary Capital ha segnato 58 milioni, uno degli inizi più forti dell’anno. Questi prodotti ampliano la base potenziale di domanda per XRP, anche se il mercato spot resta volatile.
Perché è importante
Gli analisti di mercato hanno dichiarato che le approvazioni degli ETF rappresentano un impulso strutturale per la credibilità di XRP nel lungo termine. Bitwise ha descritto il debutto del proprio ETF come un “momento storico”, sottolineando che i prodotti regolamentati hanno peso presso consulenti finanziari e gestori di fondi pensione ancora cauti sugli asset digitali. Questi investitori spesso decidono mesi dopo l’approvazione normativa, suggerendo che afflussi significativi potrebbero materializzarsi nel 2026 man mano che i portafogli si adeguano.
Ma il sentiment di breve termine racconta una storia diversa. Il calo di XRP sotto i 2 dollari nonostante il traguardo degli ETF mostra quanto l’ambiente di mercato immediato resti fragile. I dati di Glassnode indicano che il 41,5% dell’offerta circolante è attualmente in perdita, creando pressione mentre i trader capitolano.

L’attività delle whale ha intensificato il calo, con oltre 200 milioni di XRP venduti nei due giorni successivi alla notizia degli ETF. Questa divergenza tra guadagni strutturali e debolezza di breve termine è ora centrale nelle prospettive di XRP.
Impatto su mercati e investitori
Dai report recenti, la strategia istituzionale di Ripple aggiunge un’altra dimensione alla traiettoria di XRP. L’acquisizione da 1,25 miliardi di dollari di Hidden Road, rinominata Ripple Prime, segna la prima volta che una società crypto-native possiede un prime broker globale multi-asset.
La piattaforma compensa 3 trilioni di dollari all’anno, e i dirigenti di Ripple riportano una crescita significativa dall’acquisizione. XRP e RLUSD sono destinati a essere utilizzati come collaterale per clienti istituzionali, segnalando la volontà di ancorare il token all’interno delle infrastrutture professionali di trading e regolamento.
Gli osservatori considerano questo cambiamento cruciale perché il prime brokerage funge da centro nevralgico per i flussi di capitale istituzionale. Integrare XRP nei canali di collaterale e regolamento rafforza i percorsi di liquidità che non dipendono dall’entusiasmo retail. La rapida espansione di Hidden Road suggerisce che la domanda di strumenti digitali conformi continua a crescere. Per gli investitori, ciò crea lo scenario insolito in cui la struttura di base migliora anche se il grafico di breve termine si indebolisce, un modello comune nelle fasi di transizione del mercato.
Prospettive degli esperti
Gli analisti tecnici descrivono XRP come vicino a una soglia cruciale. Il recupero di 2,195 dollari segnalerebbe una stabilizzazione e potrebbe aprire la strada verso 2,6 dollari, mentre la perdita di quota 2 rischia un calo verso 1,5 dollari, dove gli investitori di lungo periodo potrebbero tentare di riaccumulare. L’obiettivo, un tempo popolare, di 3,6 dollari ora appare distante a meno che il sentiment crypto generale non si inverta.
Il dibattito di lungo termine resta polarizzato. I sostenitori della tesi dei 100 dollari sostengono che il futuro di XRP si basa su canali di liquidità e regolamento istituzionale piuttosto che su cicli speculativi. I critici ritengono che veri afflussi potrebbero non emergere finché consulenti e fondi regolamentati non investiranno seriamente – probabilmente nel 2026. I venti contrari macro e la direzione di Bitcoin restano determinanti: un rimbalzo generale del mercato potrebbe amplificare la domanda di ETF, mentre una debolezza persistente potrebbe mantenere XRP vicino ai supporti.
Punto chiave
Molti affermano che le prospettive di XRP sono plasmate dallo scontro tra l’ottimismo trainato dagli ETF e la pressione delle forti vendite. Gli analisti hanno espresso che l’ecosistema sottostante si sta rafforzando grazie all’integrazione istituzionale; tuttavia, il prezzo resta vulnerabile mentre le whale distribuiscono e le condizioni macroeconomiche pesano sugli asset rischiosi. La prossima mossa importante dipende dal fatto che XRP riesca a riconquistare la zona dei 2 dollari, attrarre afflussi ETF sostenuti e cavalcare un eventuale rimbalzo crypto più ampio. L’equilibrio di queste forze definirà la traiettoria fino al 2026.
Approfondimenti tecnici su XRP
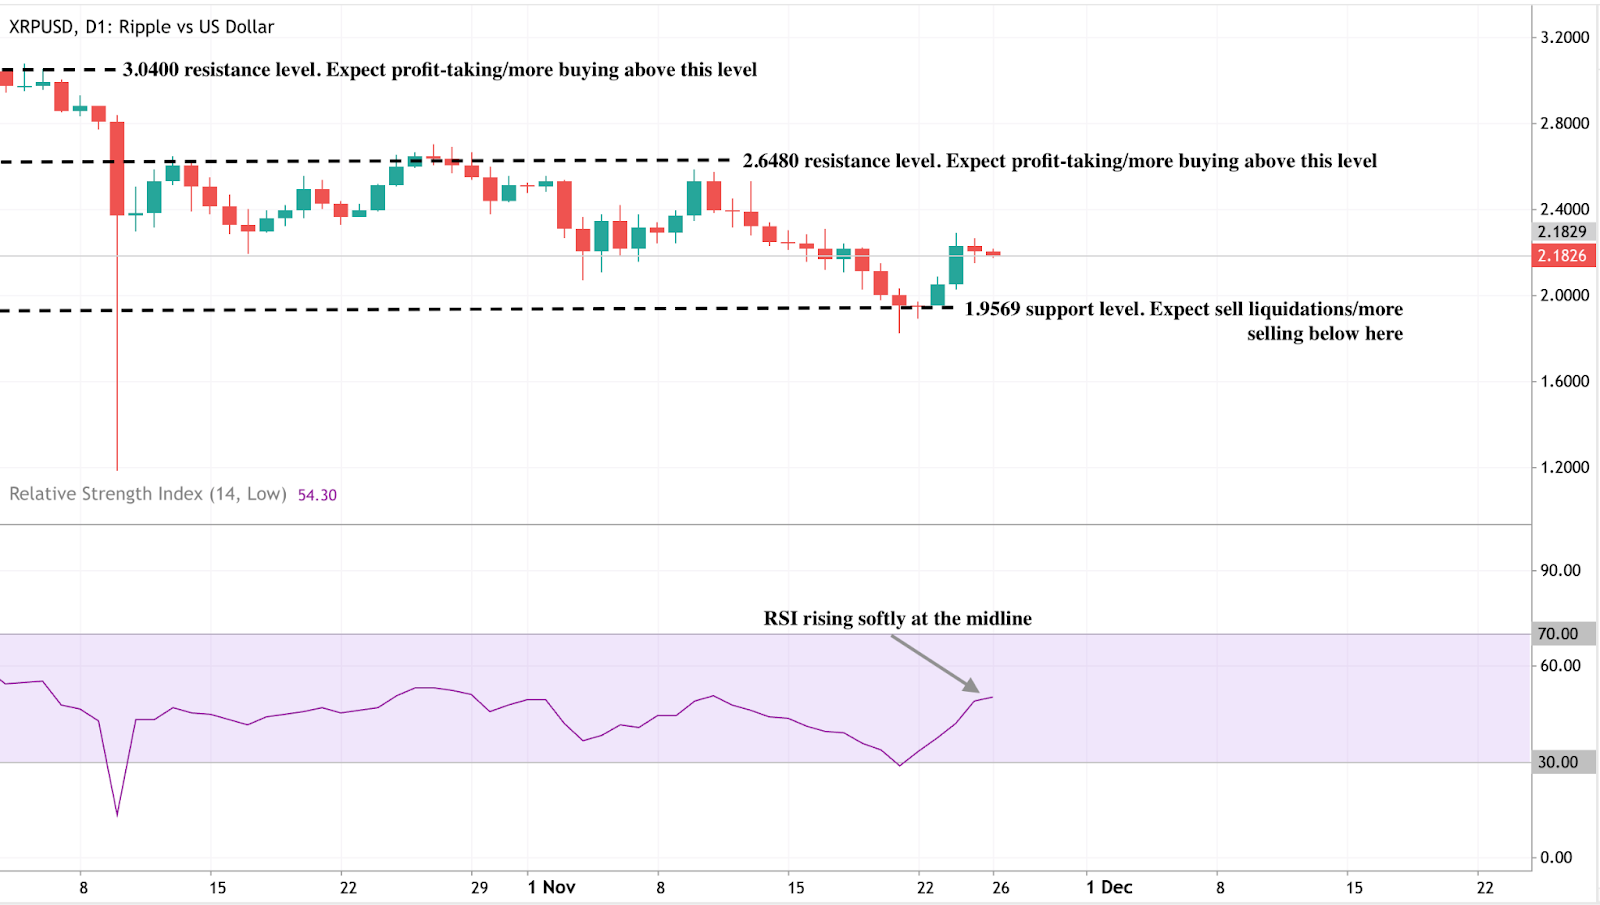
All’inizio della stesura, XRP/USD si aggira intorno a 2,1800 dollari, scambiando tra una resistenza chiave a 2,6480 e un forte supporto a 1,9569. Una rottura sotto il supporto potrebbe innescare liquidazioni, mentre movimenti sopra 2,6480 o 3,0400 potrebbero attirare prese di profitto o nuovo interesse all’acquisto.
L’RSI sta salendo leggermente dalla linea mediana intorno a 54, segnalando una lieve ripresa del momentum ma senza ancora indicare condizioni di ipercomprato.
.png)
Google’s AI comeback: Has the sleeping giant finally awoken?
Google has been criticised for years for lagging behind OpenAI, especially after ChatGPT exploded in late 2022 and reshaped the AI landscape.
Google has been criticised for years for lagging behind OpenAI, especially after ChatGPT exploded in late 2022 and reshaped the AI landscape. Yet the company’s recent streak of breakthroughs has triggered a dramatic reappraisal.
At the centre of this shift is Gemini 3, Google’s newest flagship AI model, which has impressed analysts with its performance in reasoning, coding and specialised tasks that traditionally stump chatbots. As demand grows for both cloud compute and Google’s custom AI chips, investors are beginning to question whether Google’s comeback is already underway - and whether the AI race is entering a new phase.
What’s driving Google’s resurgence
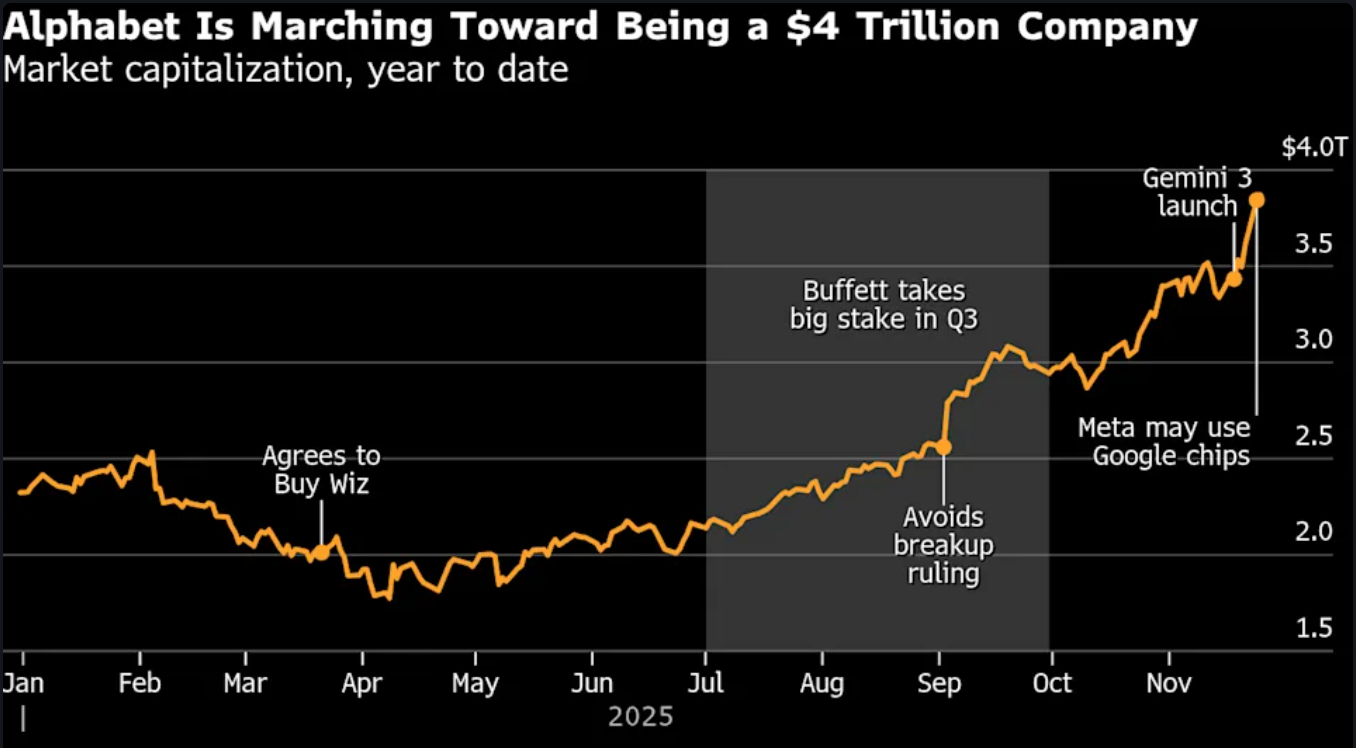
Alphabet has gained substantially since mid-October, sending shares to $323.64 and bringing it within reach of the $4 trillion club.
Google’s return to form is rooted in a combination of technical breakthroughs and strategic repositioning. The launch of Gemini 3 captured global attention after the model surged to the top of AI leaderboards such as LMArena and Humanity’s Last Exam, winning praise from analysts and technologists for its reasoning ability and performance on complex science tasks
Its improved reliability in generating images with accurate embedded text - a challenge that has plagued many chatbots - signals a maturity necessary for enterprise adoption. At the same time, Google has refreshed its AI product suite, including updates to its viral Nano Banana generator, which reinforces momentum across both consumer and developer segments.
The second force propelling Google forward is its deep investment in infrastructure. Once criticised for falling behind Microsoft, OpenAI and Nvidia, the company now benefits from rising demand for Google’s Tensor Processing Units (TPUs) - a specialised chip architecture Google has refined for over a decade.
Reports that Meta is in talks to deploy Google’s chips in its data centres by 2027 triggered a rally in Alphabet stock, demonstrating that Google’s hardware ecosystem may finally offer a meaningful alternative to Nvidia’s dominant GPUs. Partnerships with Anthropic - potentially involving up to 1 million TPUs - further signal a structural shift in AI compute preferences.
Why it matters
Google’s resurgence has implications far beyond its own balance sheet. As Neil Shah of Counterpoint Research put it, “Google has arguably always been the dark horse in this AI race — a sleeping giant now fully awake.” . If Gemini 3 continues to outperform expectations, it may reshape competitive dynamics between the three pillars of modern AI: OpenAI for model innovation, Nvidia for hardware, and Microsoft for cloud and enterprise distribution. A strengthened Google challenges this equilibrium, creating new strategic options for companies seeking alternatives to Nvidia’s high-cost GPUs or Microsoft’s deep integrations with OpenAI.
The return of competitive balance is also important for consumers and regulators. Google escaped the most severe outcome in a US antitrust case partly because AI competition has intensified. If Google proves it can innovate at scale, it may relieve pressure on regulators while accelerating the adoption of AI products beyond search advertising.
Units like Waymo, which is expanding into multiple cities and now supports highway driving, illustrate how Alphabet’s deep research pipeline fuels progress beyond software. The question is whether Google can convert technical superiority into commercial leadership - something it has historically struggled with outside advertising.
Impact on industry, markets and consumers
Google’s ascent poses both opportunity and disruption across the tech landscape. Nvidia, which lost $150 billion in market value on the day Meta’s chip discussions were reported, now contends with the prospect of a viable alternative for certain AI workloads. While Nvidia insists its GPUs remain the industry’s Swiss Army knife - flexible, widely supported, and essential for model training - TPUs give Google a niche advantage. As ASIC-based designs gain traction, analysts expect custom silicon to grow faster than the GPU market over the next several years.
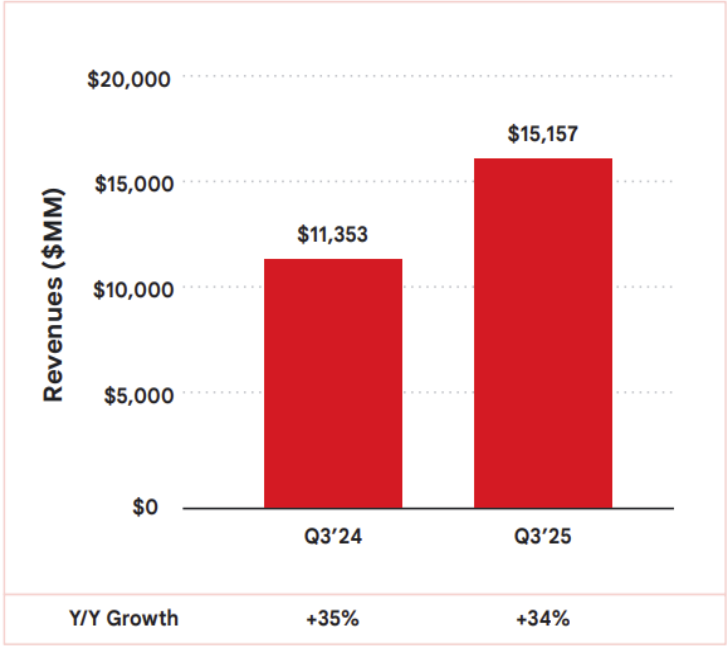
This shift has a significant impact on the broader cloud industry. Google Cloud, which generated $15.2 billion in third-quarter revenue - up 34% year-on-year - remains behind AWS and Microsoft Azure, but the demand for generative-AI compute is narrowing the gap.
Companies attracted by TPUs' cost efficiency may choose Google Cloud for specialised workloads, while still relying on Nvidia GPUs for general tasks. For consumers, the competition translates into better AI experiences: models with stronger reasoning, fewer errors, and safer behaviour.
Across financial markets, Alphabet’s rally affects index weightings and rotation patterns. As traders reassess Google’s valuation, volatility in Nvidia, AMD, Microsoft and Meta increases - creating opportunities for directional and event-driven strategies on platforms like Deriv MT5, where both tech stocks and index CFDs see heightened activity during AI-driven shifts. Tools such as the Deriv Trading Calculator help quantify margin impact and manage exposure as market reactions intensify.
Expert outlook
Forecasts for Google’s next phase remain divided. Some analysts argue that Google’s resurgence marks a long-awaited payoff from its “full-stack” strategy - controlling data, models, chips, cloud and applications. CEO Sundar Pichai emphasised during the last earnings call that this unified approach “really plays out” when scaling frontier models that integrate reasoning, multimodal capabilities and advanced coding. If Google continues to refine its ecosystem, it could rival or surpass OpenAI in enterprise adoption while weakening Nvidia’s dominance in hardware.
Yet uncertainties persist. Data revealed consumer adoption of Gemini still lags behind that of ChatGPT, with 650 million users compared to ChatGPT's 800 million weekly users, and monthly downloads of 73 million, which trail ChatGPT’s 93 million. Google Cloud, although accelerating, is still half the size of AWS and Azure.
It was noted that if Google cannot convert its technological strength into sustained commercial traction, the gap could widen again. Much will depend on whether Meta and other AI-intensive companies formalise their TPU commitments and whether Gemini 3 continues outperforming rivals in real-world deployments. The next six to nine months will be decisive, according to analysts.
Key takeaway
For market watchers, Google’s rapid AI resurgence suggests the company has moved far beyond its defensive posture of recent years. Gemini 3’s strong performance, rising TPU adoption and fresh cloud momentum have revived Alphabet’s standing in the global AI race. Yet the outcome is far from settled.
The next phase hinges on whether Google can scale its breakthroughs commercially while sustaining hardware and model performance. Traders and analysts await confirmation from enterprise adoption, chip-supply agreements and quarterly cloud-revenue growth - the indicators that will decide whether this comeback becomes a lasting transformation.
Alphabet technical insights
At the start of writing, Alphabet (GOOG) has broken into a price discovery zone above $323, signalling strong bullish momentum after an extended run along the upper Bollinger Band. Key supports sit at $268.75 and $240, where a drop below either level could trigger sell liquidations or deeper pullbacks.
The RSI, now around 74, is approaching overbought territory, highlighting stretched conditions that may lead to short-term cooling or consolidation, even as the broader trend remains firmly upward.


Gold’s November surge: From $4,000 barrier to all-time highs. What’s really happening?
Imagine waking up to headlines screaming 'Gold Smashes Past $4,300,' and no, it’s not a dream; it has been the reality of October 2025.
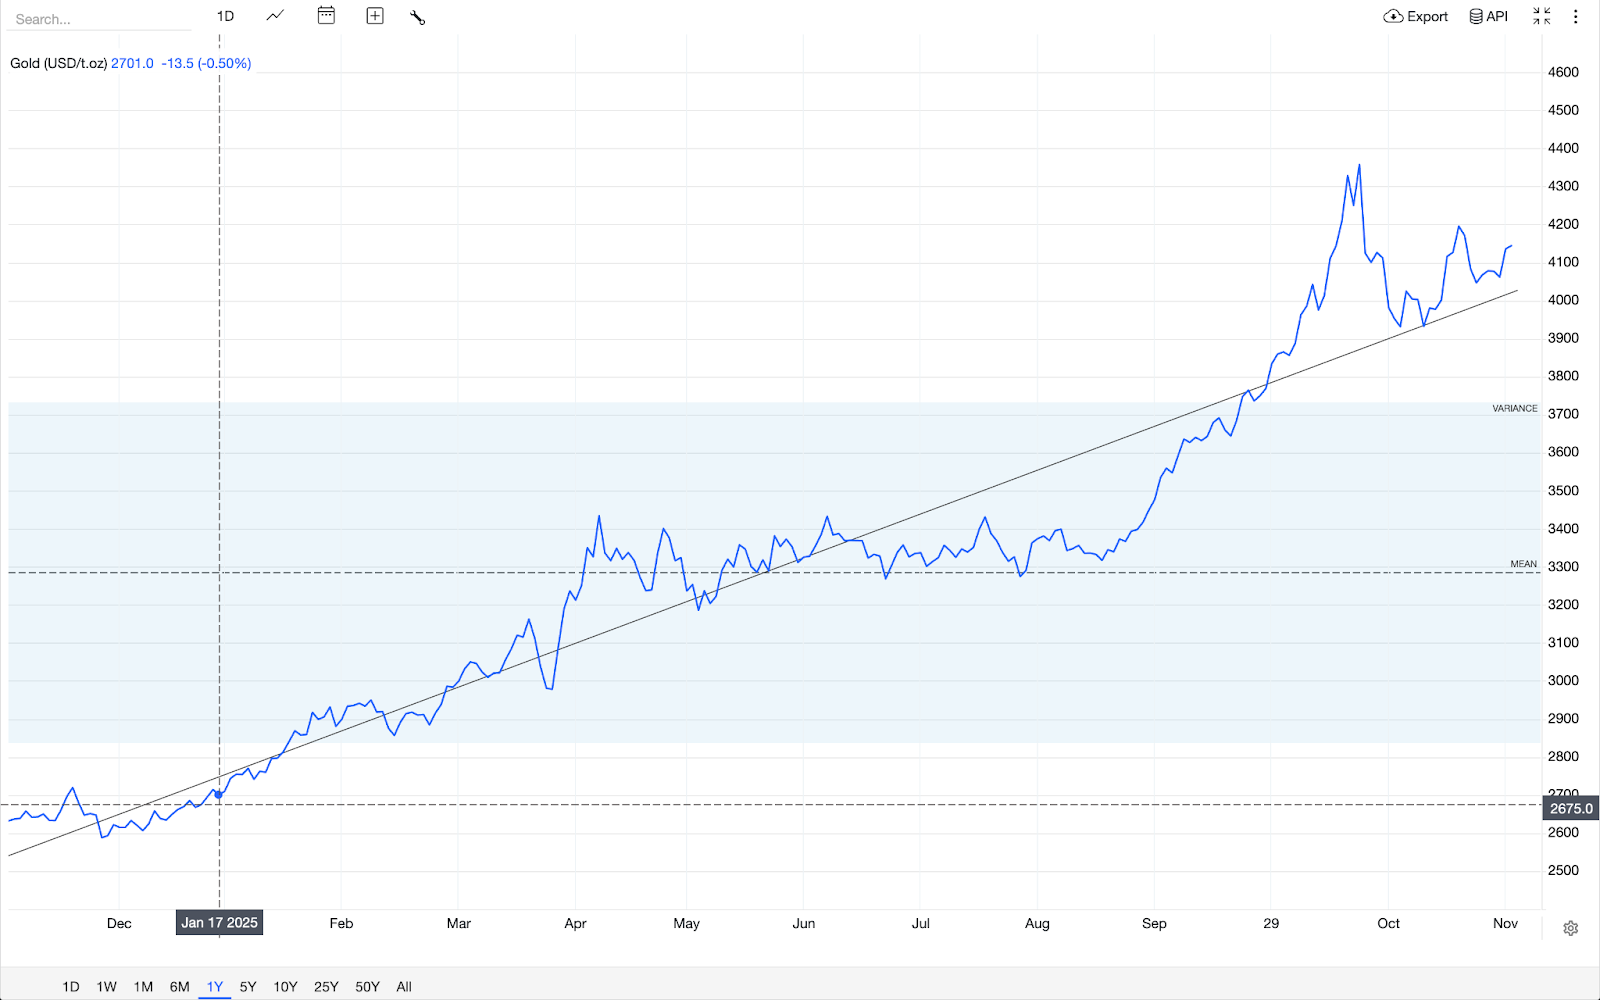
Imagine waking up to headlines screaming 'Gold Smashes Past $4,300,' and no, it’s not a dream; it has been the reality of October 2025. Now, November’s keeping the momentum alive with prices hovering near $4,132 as of 25 November 2025. If you’re wondering whether this shiny metal remains a smart addition to your financial mix, stick around. We’re breaking down the fresh data, historical peaks, and practical takeaways without the hype.
Why is gold climbing so sharply in late 2025?
The gold spot price breached $4,100 per ounce on November 24, a 1.65% increase from the prior day, driven by investor bets on U.S. Federal Reserve rate cuts amid cooling inflation signals. This isn't random volatility; it's a response to broader economic jitters. Geopolitical tensions, like ongoing Russia-Ukraine talks, add a layer of safe-haven demand, pushing prices up even as crude oil dips on "peace" rumours.
Breaking it down: Central banks worldwide are projected to acquire over 900 tons of gold in 2025, according to reports, surpassing demand for jewellery and technology. This institutional buying creates a floor under prices - think of it as a global vote of confidence in gold as a hedge against currency wobbles.
For everyday folks, it means reviewing your asset allocation might reveal whether gold’s 58% year-to-date gain (from -$2,600 in January) aligns better with your risk tolerance now than it did during last year’s flatline.
How close is gold to its historic peaks, and what do the charts say?
Gold’s all-time high? $4,379.13 on October 17, 2025, eclipsing the inflation-adjusted 1980 record of about $3,400 (when an ounce topped $850 nominally). Fast-forward to November: Spot prices traded between $4,046 and $4,145 on 24 November, coiling in a bull pennant pattern on daily charts - a setup that hints at continuation if it breaks upward, based on Kitco’s intra-day analysis.
Visualise this: On a 5-minute Comex futures chart, gold is hugging the 50-period moving average as support around $4,010, with resistance at $4,108. Zoom out to weekly: It’s testing the upper Bollinger Band after a 3.7% monthly rise.

Historically, such consolidations after highs (like the post-2020s $2,070 peak) often precede 10-15% corrections or fresh legs up - a reminder to track these levels when assessing gold’s role in long-term savings, such as in a retirement portfolio.
Expert take: "Gold’s resilience stems from its inverse correlation to real yields,” notes FX Empire analyst Yoav Niv, who points to the metal’s consolidation amid delayed U.S. data releases. Actionable angle? If inflation reports this week nudge yields lower, gold could revisit its October high - use that as a cue to compare gold’s performance against your bond or cash holdings.
Gold’s role in everyday portfolios
Hypothetically, let’s consider a mid-40s couple in Chicago, facing 7% inflation that ate into their savings in 2024. So, they shifted 5% of their nest egg to a gold ETF in early 2025; by November, that slice would have grown 58%, offsetting spikes in grocery and housing costs. Nothing magical here, but gold acting as a diversifier when stocks wobble.
Or take an example of a small business like a jeweller who rode out November’s uptick by locking in supplier rates at $4,000, buffering against dollar strength that hammered imports. The insight? Gold isn’t just for vaults; it’s a tool for smoothing cash flow volatility.
Scan your expenses - if currency fluctuations hit suppliers or travel, a modest gold exposure (via accessible ETFs) could stabilise planning without overcomplicating things.
November’s gold action underscores its enduring appeal: a buffer against the unpredictable. Whether eyeing historic charts or current consolidations, the key is integration - weave it into your financial story thoughtfully.
Gold technical insights
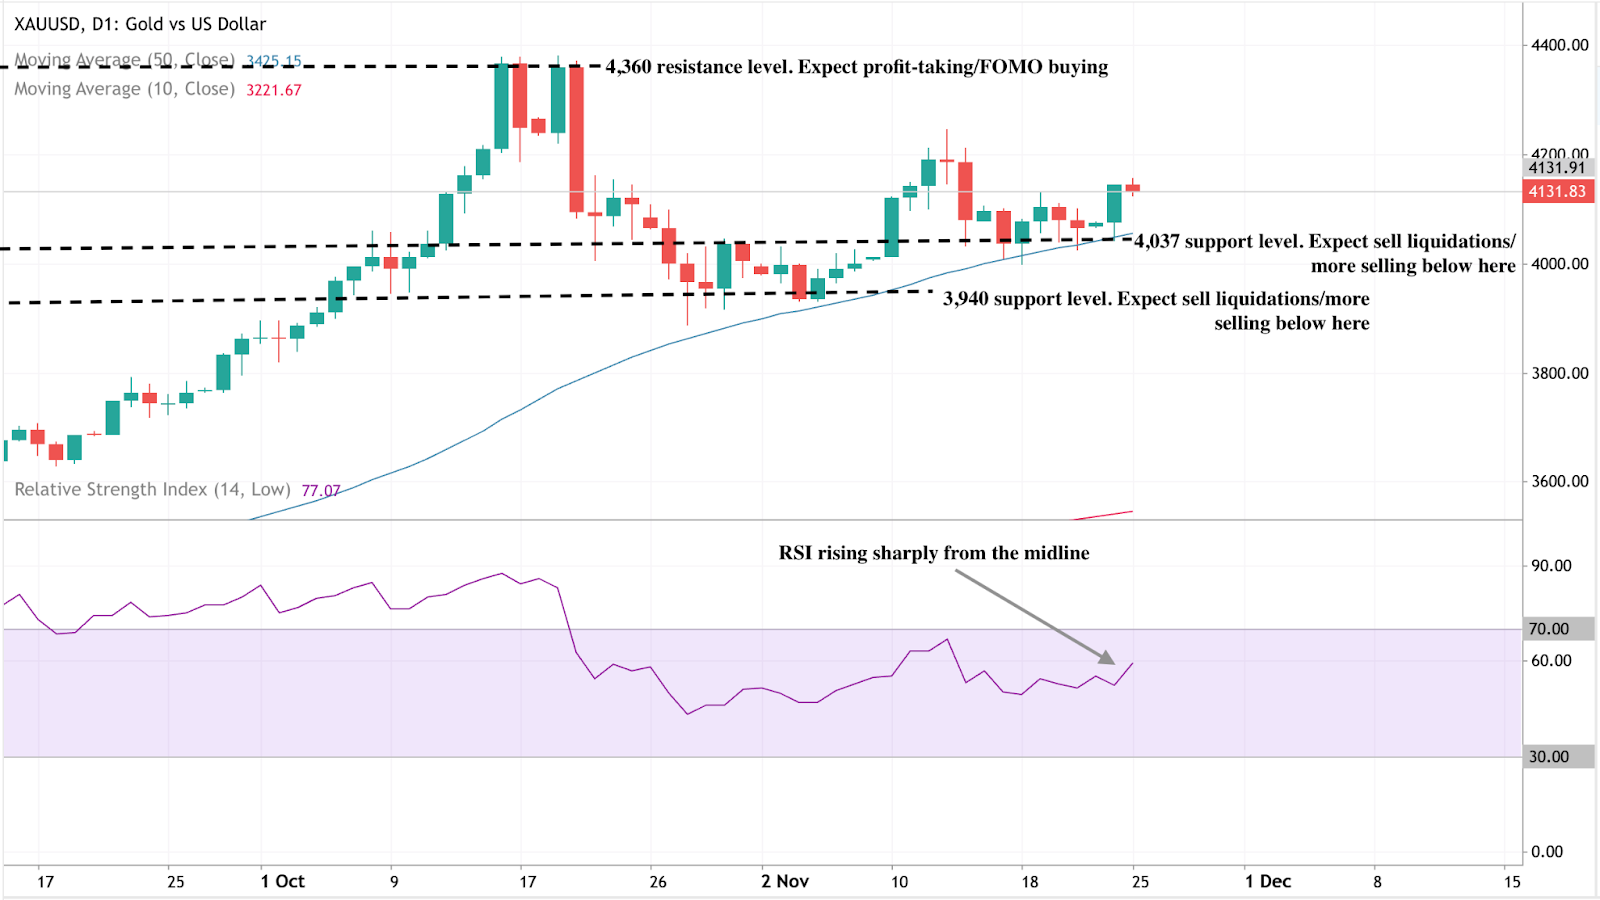
At the start of writing, Gold (XAU/USD) is trading near $4,132, maintaining bullish momentum above key supports at $4,037 and $3,940. A sustained move above these levels suggests buyers remain in control, though a drop below either could trigger sell liquidations.
The $4,360 level stands out as a major resistance, where traders may take profits or new buyers could enter on FOMO sentiment. Meanwhile, the RSI has surged to around 77, rising sharply from the midline - a signal of strengthening momentum but also a potential sign of overbought conditions that could invite short-term pullbacks.

The tech stock rally: Is this the start of a new cycle?
This week’s sharp rebound in tech stocks poses a compelling question: Is this more than just a bounce?
This week’s sharp rebound in tech stocks poses a compelling question: Is this more than just a bounce? With the Nasdaq Composite jumping 2.7% and the S&P 500 up roughly 1.5% as investors embraced both AI momentum and hopes for a December rate cut, the tone has shifted, according to reports.
The deeper issue, however, is whether this marks the beginning of a new tech cycle, underpinned by accelerating AI deployment and cheaper capital, or simply a rally within an existing one. The following insights examine what drives the move, its significance, its impact on markets, and what comes next.
What’s driving the tech stock rally
Market watchers say that at the heart of the current advance lie two forces: renewed confidence in AI-led innovation and fresh traction in monetary policy expectations. On the policy side, signals from the Federal Reserve, including Governor Christopher Waller and President John Williams of the New York Fed, have bolstered expectations for a December rate cut, helping to lift growth-stock valuations.
The reduction in discount rates on long-term earnings tends to favour tech firms, which rely on high forward-rate growth. Parallel to that, the AI story remains central. Firms such as Alphabet Inc. surged after enthusiasm for its Gemini model, while the “Magnificent Seven” pulled the broader tech cohort higher.
The market appears to be reconciling the earlier pullback (driven by bubble fears) and repositioning into stocks that benefit from the AI infrastructure build-out, including chips, cloud, and software. The question now is whether this is the launch of a new growth wave or simply the next leg of the existing one.
Why it matters
If tech is entering a new cycle, the implications extend far beyond a handful of large-cap stocks. These companies increasingly lag behind not only in market weight but also in shaping index trajectory, sector rotation, and investor psychology. As one analyst observed: “Scepticism around AI cap-ex might be a contrarian positive” for the trade in the long term.
For institutional and retail investors alike, the timing could matter: a true cycle shift may favour growth and innovation over value, alter asset-allocation flows, and provide a greater runway for risk assets. Conversely, if this is not a new cycle, then mispricing valuations could lead to sharp reversals. For corporates - from chip fabricators to SaaS startups - the cost of capital, demand for AI services, and global semiconductor supply chains all hinge on how the cycle evolves.
Impact on the market and industry
A credible new tech cycle would signal substantial real-world change: surging investment in data-centres, exponential scaling of AI models, and ecosystem shifts toward cloud-native, AI-first companies. We’re seeing some of that. Analysts estimate that AI could add $5-19 trillion in incremental revenue to US companies, although many warn that much of this may already be priced in.
In market terms, a cycle change could reinvigorate under-weight tech portfolios, trigger rotation out of value/cyclicals and reshape the “growth vs. value” trade. For the industry, this means that winners will likely emerge among firms that scale AI profitably, while laggards will face margin pressure, heavier capital expenditure burdens, and competitive erosion. The stakes are high: the surge could be transformative - but the infrastructure and competitive demands are intense.
For the market, that means volatility is likely to stay elevated. Traders balancing positions on platforms like Deriv MT5 can use advanced order types, leverage settings and stop-loss controls to navigate sharp swings. Understanding margin impact and exposure - via the Deriv Trading Calculator - is increasingly essential as the cycle matures.
Expert outlook
Looking ahead, professional traders note that key signals to monitor include inflation trajectories, clarity on Fed policy, earnings from major tech companies, and progress on supply-chain goals in the AI build-out. Markets currently price in a high probability of a December rate cut, but if inflation proves persistent or earnings disappoint, momentum could stall.
Some strategists caution that we may simply be in yet another leg of the initial tech-cycle rather than in the dawn of a fresh era. For instance, Goldman Sachs analysts suggest much of the potential upside from AI is already embedded in current valuations.
This means that while the upside exists, the risk-reward becomes less attractive. The best scenario: a renewed tech cycle with broad-based participation. The risk: concentrated gains, fading momentum and underlying disillusionment. Either way, the next few months will be critical.
Key takeaway
The surge in tech stocks carries more than a feel-good bounce - it could mark the opening stages of a new cycle where AI deployment and supportive policy drive sustained growth. However, the caveats remain substantial: valuations are stretched, execution risk is real, and macroeconomic headwinds loom. Investors should watch upcoming inflation data, Fed commentary and earnings from tech heavyweights as signals to validate the shift. The moment is promising, but not yet definitive.
Alphabet technical insights
At the start of writing, Alphabet’s stock (GOOG) has entered a price discovery zone above $318, signalling strong bullish momentum. The $280 and $238 levels act as key supports - a break below these zones could trigger sell liquidations or deeper corrections.
Meanwhile, the RSI has climbed to around 74.5, pushing into overbought territory, suggesting that the stock may face short-term profit-taking or consolidation before attempting further upside.

Spiacenti, non abbiamo trovato alcun risultato corrispondente a .
Suggerimenti per la ricerca:
- Controlla che l'ortografia sia corretta e riprova
- Prova con un'altra parola chiave