Risultati per

Yen carry trade in reverse: Japan’s yield shift and its impact on USD/JPY
As domestic yields rise, Japanese investors are increasingly repatriating funds from abroad, strengthening the yen and unsettling one of the world’s longest-standing funding trades.
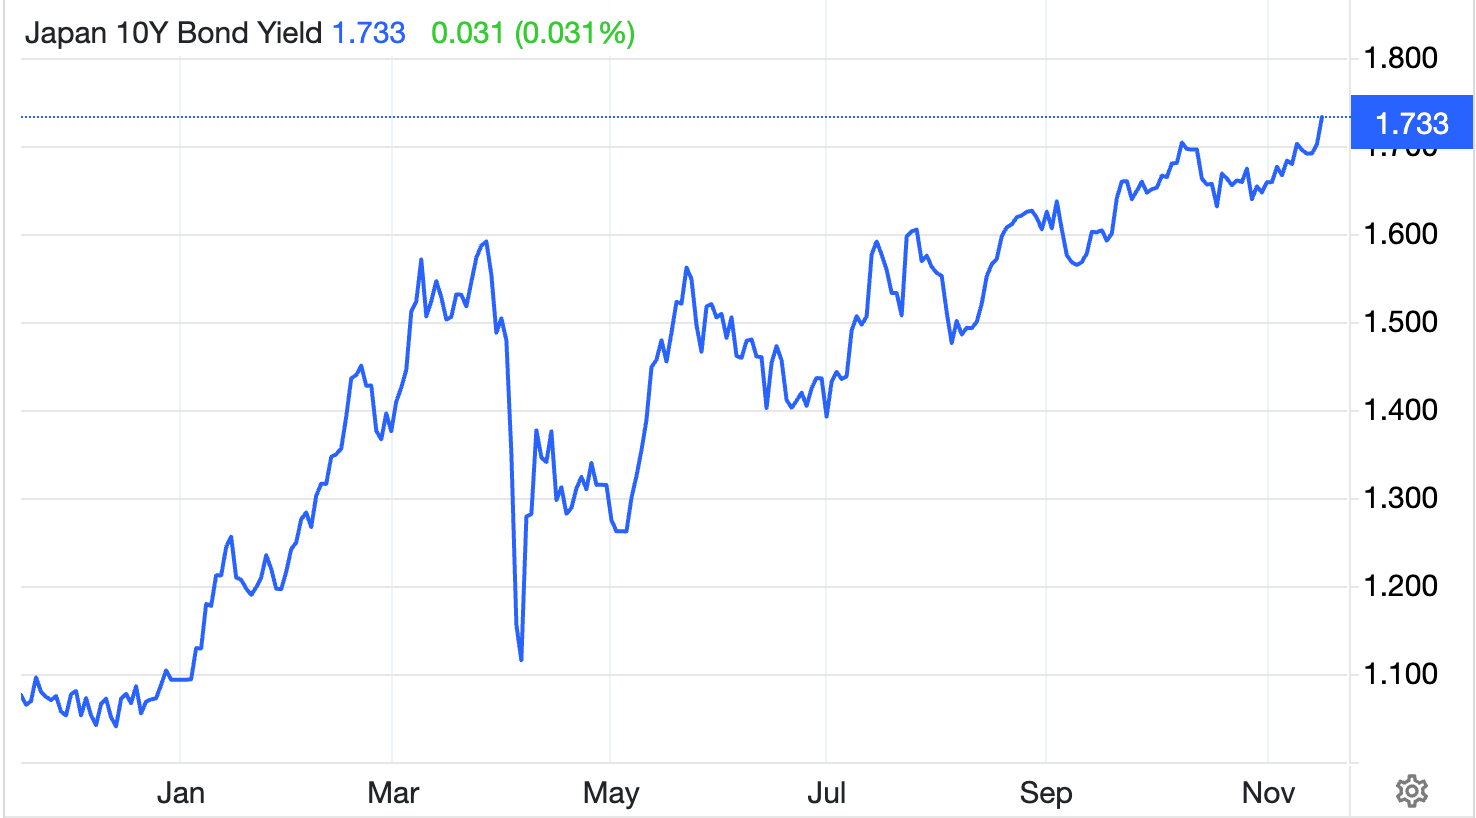
Japan’s bond market is rewriting the rules of the global foreign exchange market. The country’s 10-year government bond (JGB) yield has surged to 1.73% - its highest level since June 2008 - as markets brace for a ¥17 trillion (£88 billion / $110 billion) fiscal stimulus and a further reduction in Bank of Japan (BoJ) bond purchases. The move signals the beginning of a new phase: the yen carry trade in reverse.
As domestic yields rise, Japanese investors are increasingly repatriating funds from abroad, strengthening the yen and unsettling one of the world’s longest-standing funding trades.
The question now dominating markets is clear - will this shift pull USD/JPY back from its multi-decade highs near 156, or force the BoJ and Ministry of Finance (MoF) to intervene once again to stabilise the currency?
Key takeaways
- Japan’s 10-year bond yield has reached 1.73%, the highest since 2008, as markets price in rising inflation, fiscal stimulus, and reduced BoJ support.
- The BoJ’s gradual normalisation - with short-term rates now at 0.5% - is driving a global reassessment of the yen’s funding role.
- A planned ¥17 trillion stimulus aims to offset Japan’s 0.4% GDP contraction in Q3 but risks adding inflationary pressure.
- Rising yields are drawing capital back into Japan, prompting a partial unwinding of the yen carry trade.
- USD/JPY faces key resistance near 155–156, a zone where past interventions have been triggered.
Japan bond yields go up to breach the 1.7 mark
After nearly two decades of near-zero yields, Japan’s bond market is finally moving under its own weight.
The 10-year JGB yield, which stayed below 1% for years due to the BoJ’s Yield Curve Control (YCC), has now broken decisively higher - a sign that investors expect sustained inflation, more fiscal spending, and a lighter BoJ hand in the market.
Several forces have converged:
- The BoJ is tapering bond purchases, reducing artificial demand for JGBs.
- Short-term policy rates have been raised to 0.5%, marking the end of an era of negative rates.
- A massive stimulus plan under Prime Minister Sanae Takaichi is expected to inject over ¥17 trillion into the economy through tax cuts, infrastructure spending, and household support.
Together, these dynamics have pushed bond yields to levels unseen since the global financial crisis, marking what analysts describe as the end of Japan’s “zero-cost money” era.
Higher yields despite Japan’s fragile economy
Despite higher yields, Japan’s economy remains fragile. Data from the Cabinet Office show that GDP contracted by 0.4% in Q3, its first decline in six quarters. Weak residential investment and subdued consumer demand dragged growth lower, even as exports rebounded slightly in September.
BNP Paribas economist Ryutaro Kono noted that while the contraction is not “particularly serious”, it highlights uneven recovery momentum. Still, the forthcoming stimulus package - expected to be approved soon - aims to restore confidence and support households facing rising living costs.
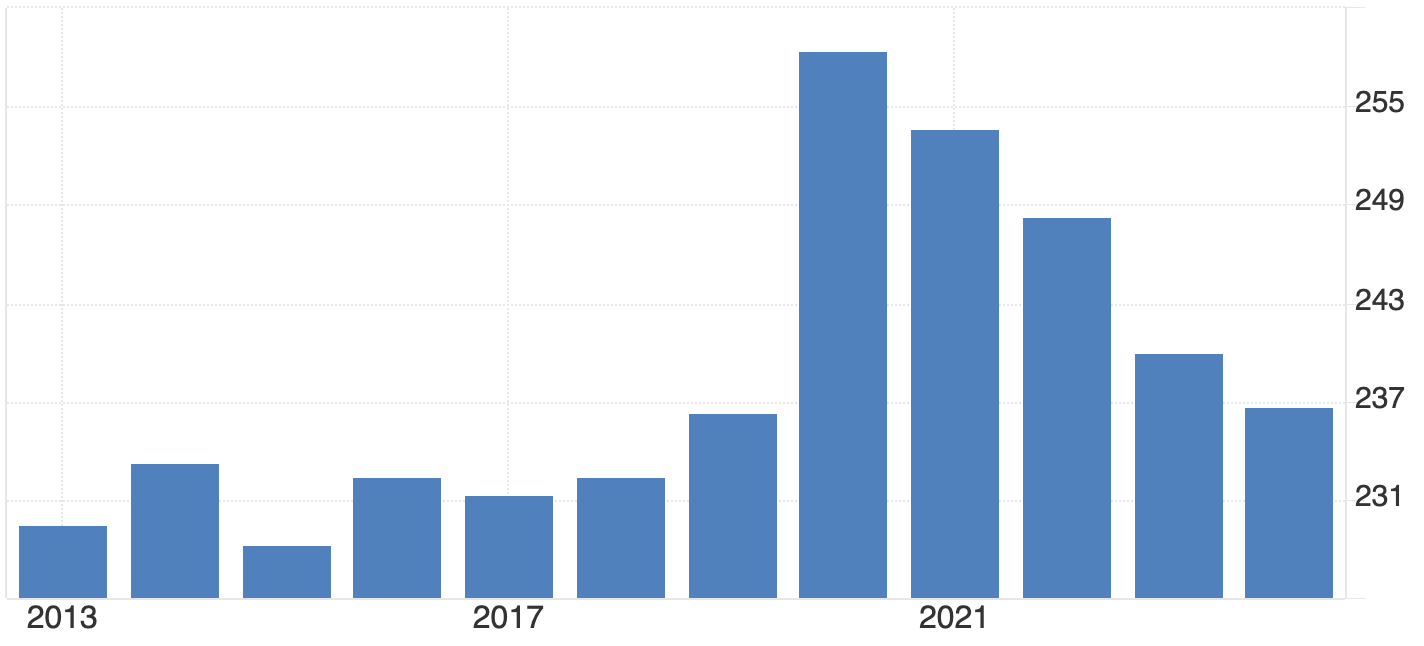
Yet the market reaction suggests scepticism. Investors view fiscal expansion as inflationary and debt-heavy. With Japan’s public debt exceeding 230% of GDP, every new round of spending increases pressure on the bond market - and by extension, the yen.
The mechanics: Why higher yields strengthen the yen
The surge in Japanese yields has immediate foreign exchange implications, particularly for the USD/JPY exchange rate.
1. Repatriation of capital
Japan’s institutional investors - who collectively hold trillions of dollars in foreign bonds - are now finding better returns at home. As domestic yields climb, they begin selling U.S. Treasuries, European debt, and emerging market assets to reinvest in JGBs. This process increases demand for yen, supporting its value against major currencies.
2. Unwinding the carry trade
The yen carry trade - borrowing in low-yielding yen to buy higher-yielding assets abroad - has been a cornerstone of global markets for years. With Japanese rates rising, this trade becomes less profitable. Traders must buy yen to repay loans, triggering powerful short-term rallies.
3. Yield Differentials and Global Comparison
Even with U.S. 10-year yields near 4–5%, Japan’s rapid shift from near-zero to 1.7% is significant. For Japanese investors who once earned nothing on domestic bonds, the new yield environment is competitive enough to slow outflows and boost inflows, tilting currency dynamics in favour of the yen.
Yen policy trade-offs: Growth, debt, and stability
For the BoJ, this shift poses a major challenge. Governor Kazuo Ueda must balance a weak economy, rising inflation, and market volatility. The ¥17 trillion fiscal push could revive domestic demand, but it also risks fueling inflation expectations and adding strain to already high debt levels.
If yields rise too high, the BoJ may need to intervene in bond markets again or issue verbal guidance to temper speculation. Finance Minister Satsuki Katayama has already warned she is “watching FX moves with a sense of urgency”. Historically, such language has preceded yen-supportive interventions, particularly when USD/JPY nears 155–156 - a zone Credit Agricole analysts flag as Tokyo’s soft intervention threshold.
Geopolitics: China tensions and trade headwinds
External risks compound Japan’s policy dilemma. Relations with China have deteriorated following Takaichi’s remarks on Taiwan, prompting mutual travel warnings and raising fears of trade retaliation.
Economists such as Marcel Thieliant at Capital Economics warn that restrictions on rare earth exports or Japanese goods could escalate into a broader trade dispute - one that hurts exporters already under pressure from Chinese electric vehicle competition.
These tensions could trigger safe-haven inflows into the yen, but they also risk weakening Japan’s export engine - another reason why policymakers may resist further currency volatility.
USD/JPY forecast: Scenarios for late 2025
In the near term, a test of 145–148 remains plausible as capital returns home. But if the U.S. Federal Reserve delays rate cuts - keeping U.S. yields high - USD/JPY could stay anchored closer to 150–153.
Either way, the BoJ’s tolerance threshold around 156 is becoming a critical line for traders to watch. Traders can monitor these levels directly on Deriv MT5, which offers live market depth and advanced charting to track yen volatility in real time.
USD/JPY technical analysis

At the time of writing, USD/JPY is trading around 154.72, holding just below a fresh price discovery zone. The RSI sits flat just below the overbought threshold, signalling that bullish momentum remains strong but may be nearing exhaustion if no further upside breakout occurs.
Meanwhile, Bollinger Bands are expanding, indicating an increase in volatility. The price is hugging the upper band, reflecting sustained buying pressure - though such positioning often precedes short-term pullbacks or consolidation phases.
On the downside, immediate support lies at 153.00, with further key levels at 150.00 and 146.45. A break below these levels could trigger sell liquidations or panic selling, especially if sentiment turns against the dollar.
Overall, momentum currently favours the bulls, but with the RSI nearing overbought territory and price extended along the upper Bollinger Band, traders should watch for possible short-term corrections before any continuation higher.
Global ripple effects of yen
Japan’s yield shift is not an isolated story. As the world’s largest creditor nation, any repatriation of Japanese funds can affect global bond markets:
- U.S. Treasuries: Selling pressure from Japanese investors could lift U.S. yields.
- Europe and Australia: Investors may rebalance towards JGBs, driving global yield convergence.
- Emerging markets: Funding costs could rise as yen liquidity tightens.
The implications are profound - the end of Japan’s zero-yield era may gradually unwind two decades of global risk-taking built on cheap yen funding.
Investment and trading implications of yen
For traders, Japan’s bond market is now the most important variable in the yen equation.
- Short-term outlook: Higher JGB yields and repatriation flows could push USD/JPY lower towards 145–148, especially if U.S. yields stabilise.
- Medium-term: Fiscal stimulus and persistent inflation may keep yields elevated but volatile, anchoring USD/JPY near 150–153.
Intervention watch: If the pair nears 156, expect stronger verbal warnings and possible BoJ/MoF coordination.

Prospettive EUR/USD in vista dei dati sull'inflazione e sul lavoro negli Stati Uniti
EUR/USD rimane in un intervallo ristretto mentre i mercati attendono chiarezza dai dati sull'inflazione statunitense ritardati.
EUR/USD rimane in un intervallo ristretto mentre i mercati attendono chiarezza dai dati sull'inflazione statunitense ritardati. La coppia ha oscillato tra 1,156 e 1,166, con i trader esitanti a impegnarsi fino a quando i dati sull'Indice dei Prezzi al Consumo (CPI) non riveleranno se la Federal Reserve manterrà la sua posizione accomodante o sospenderà ulteriori allentamenti.
L'assenza di dati ha ridotto la volatilità e mantenuto stabile l'euro rispetto a un dollaro in indebolimento, mentre i mercati valutano i rallentamenti della crescita, le aspettative sui tassi in evoluzione e il miglioramento del sentiment globale sul rischio.
Punti chiave
- EUR/USD si mantiene stabile vicino a 1,1642, oscillando in una stretta fascia tra 1,156 e 1,166 mentre i trader attendono i dati CPI.
- I ritardi nei dati statunitensi a seguito della chiusura del governo hanno congelato la direzione del mercato e indebolito lo slancio del dollaro.
- La divergenza di politica monetaria si sta riducendo, con la Fed che si avvicina a tagli mentre la BCE mantiene la posizione.
- La stabilità dell'Eurozona e il miglioramento del sentiment contrastano con l'incertezza negli Stati Uniti, sostenendo la resilienza dell'euro.
- La compressione della volatilità indica un potenziale breakout una volta pubblicati i dati sull'inflazione.
Mercato in stallo mentre persistono i ritardi nei dati sull'inflazione e sul lavoro negli USA
La pubblicazione ritardata dei dati sull'inflazione e sul lavoro negli Stati Uniti ha lasciato il mercato senza direzione. Il Bureau of Labor Statistics (BLS) sta ancora affrontando le interruzioni causate dalla recente chiusura del governo, aumentando la possibilità che alcuni dati di ottobre non vengano mai pubblicati.
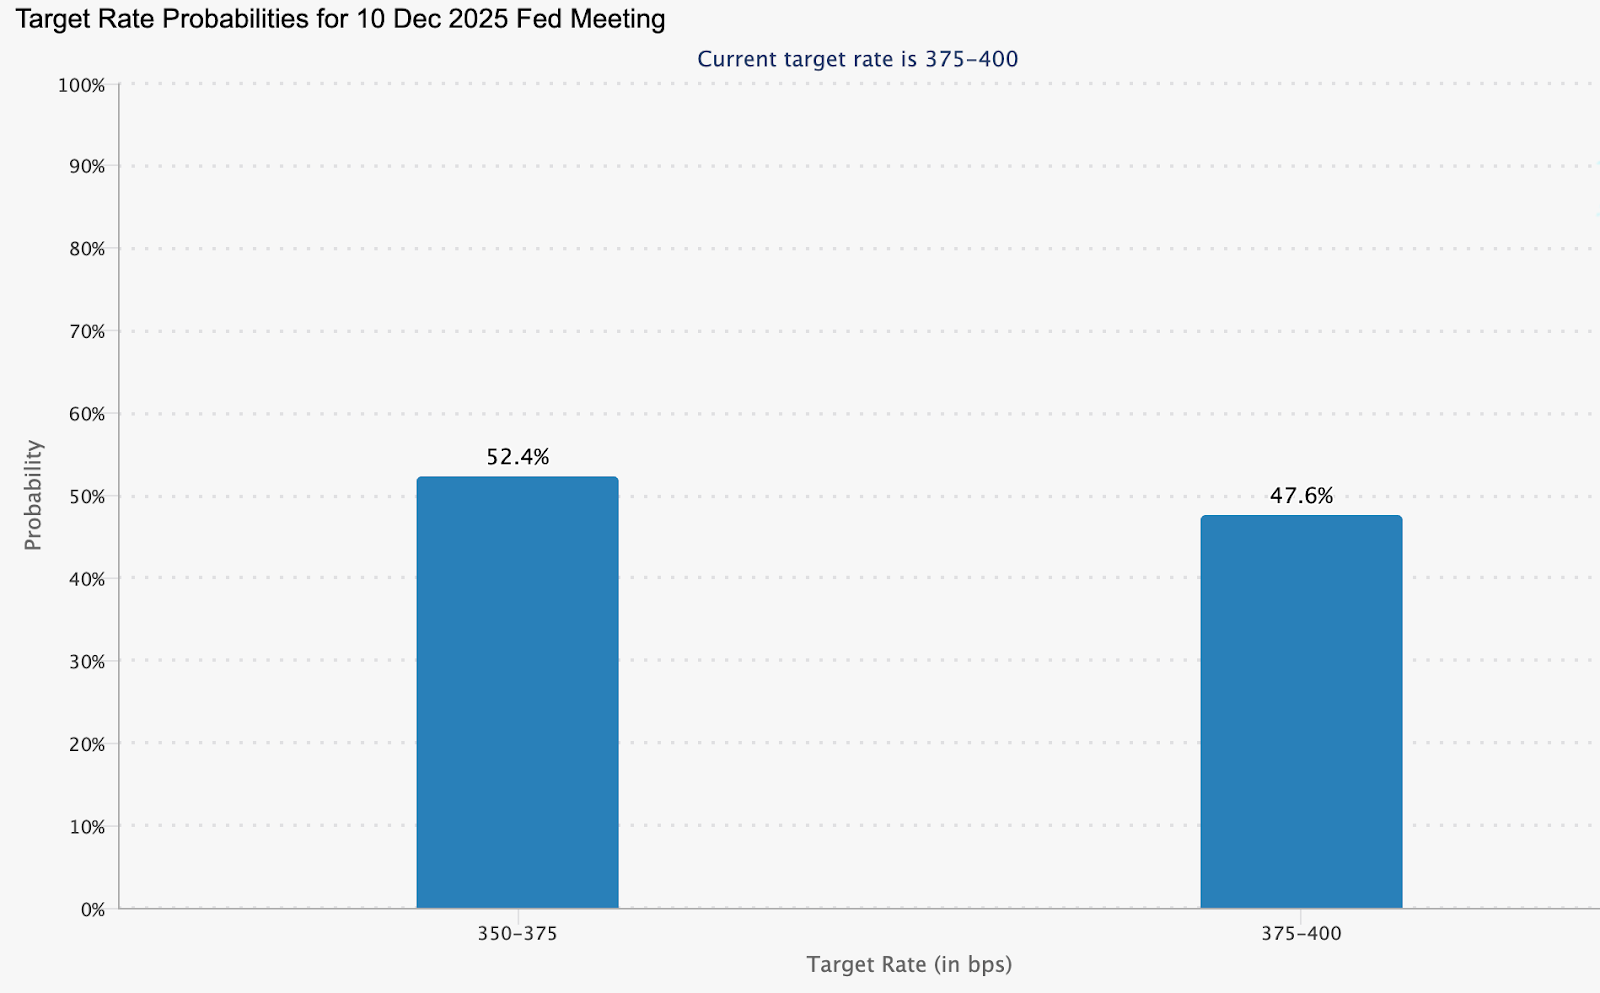
Questa mancanza di visibilità ha paralizzato sia i trader che i responsabili politici. Senza i dati CPI o Non-Farm Payrolls, le decisioni della Fed si riducono a congetture. Secondo il CME FedWatch Tool, i mercati ora prezzano una probabilità del 52,4% di un taglio dei tassi di 25 punti base a dicembre, ma la convinzione sta rapidamente diminuendo.
Nel frattempo, l'appetito per il rischio sta migliorando, mentre gli indici europei sono stabili - una combinazione che tipicamente indebolisce il dollaro. Con la diffusione del sentiment risk-on, l'euro guadagna un supporto passivo grazie a flussi di capitale migliorati e a una domanda ridotta di asset rifugio.
L'euro guadagna terreno mentre si riducono il divario di politica tra BCE e Fed e la divergenza di crescita
Oltre al blackout attuale dei dati, i fondamentali più ampi stanno inclinando a favore del supporto all'euro. Il FMI prevede che la crescita del PIL statunitense rallenti dal 2,8% al 2,0% nel 2025, mentre il tasso di crescita dell'Eurozona dovrebbe salire dallo 0,9% all'1,2%. Questo restringimento del divario di crescita erode una delle tradizionali forze del dollaro.
Anche la politica monetaria sta convergendo. La Banca Centrale Europea (BCE) ha probabilmente concluso la sua fase di allentamento, mentre la Federal Reserve sembra più vicina a tagliare i tassi mentre lo slancio negli USA si raffredda. Il differenziale di rendimento in riduzione è storicamente positivo per EUR/USD.
Allo stesso tempo, la stabilità dell'Eurozona sta diventando un asset. I rischi energetici sono diminuiti, la volatilità politica si è attenuata e la fiducia dei consumatori mostra lievi segnali di ripresa. Con meno rischi strutturali e una politica monetaria stabile, l'euro non ha più bisogno di rally basati sull'ottimismo - deve semplicemente mantenersi costante mentre il dollaro fatica a trovare direzione.
Impatto dei dati CPI: il punto cieco più grande del mercato
L'inflazione rimane il punto di svolta. Se il CPI statunitense sorprende al rialzo, i mercati potrebbero rivedere le aspettative per una pausa della Fed, spingendo EUR/USD al ribasso. Una lettura più debole, invece, confermerebbe le prospettive accomodanti e rafforzerebbe la posizione dell'euro.
Per ora, l'assenza di dati sull'inflazione è diventata essa stessa un catalizzatore. Senza nuovi numeri, i trader si affidano sempre più al sentiment e ai segnali tecnici piuttosto che ai fondamentali. Questo ha compresso la volatilità e ridotto la convinzione, ma più dura, più forte potrebbe essere il breakout finale.
Implicazioni per l'investimento in EUR/USD: lo slancio incontra la resistenza
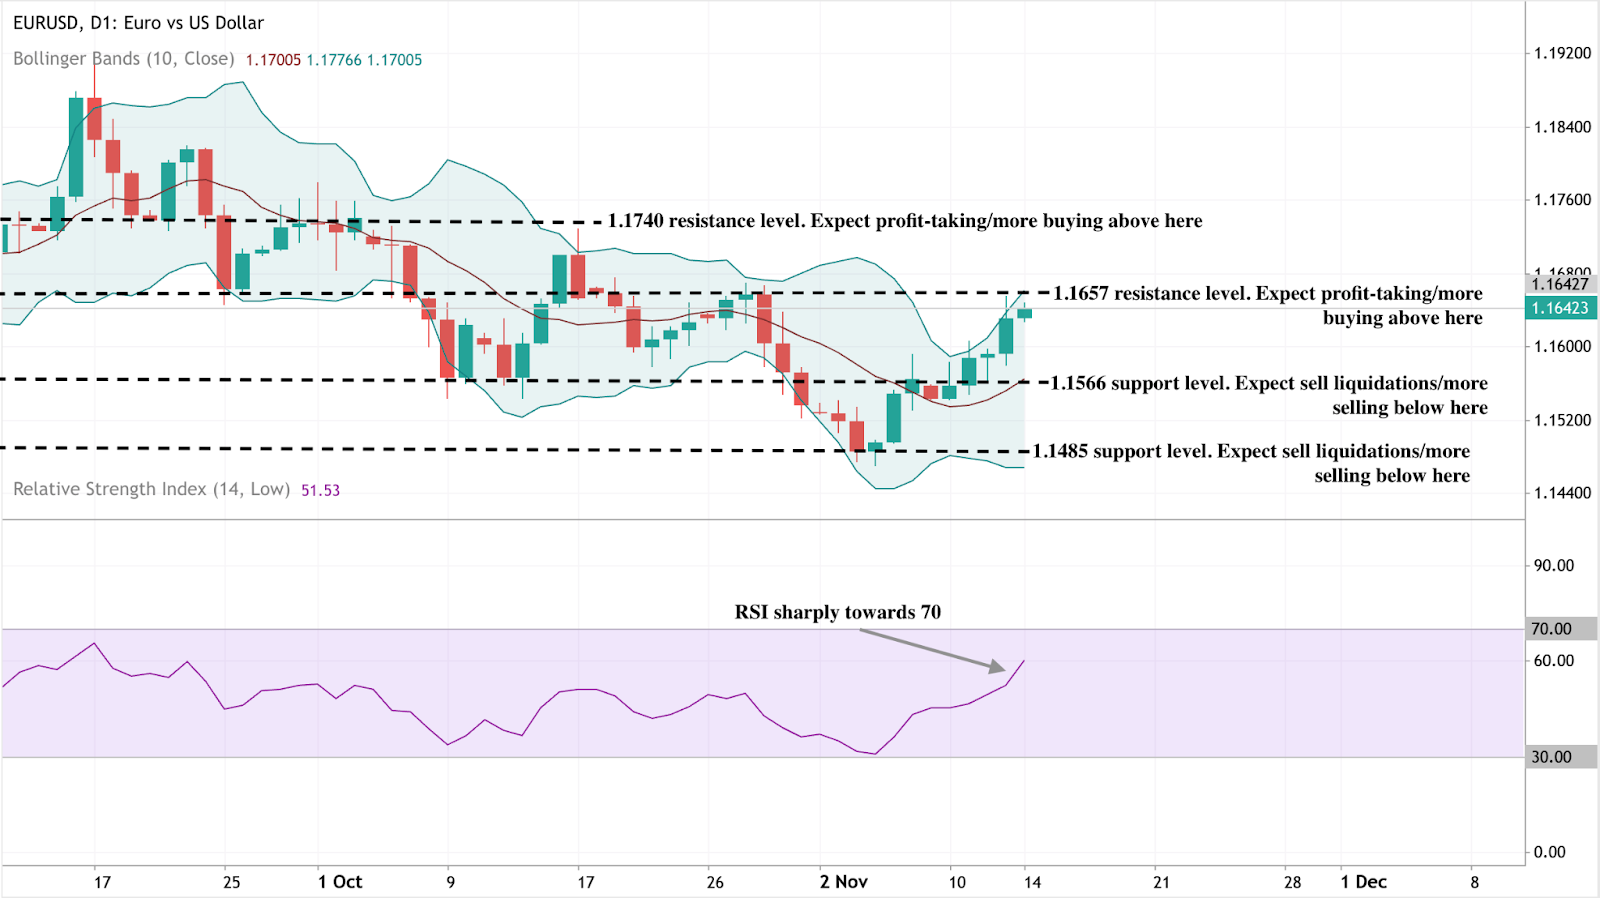
Al momento della stesura, EUR/USD è scambiato vicino a 1,1642, con uno slancio orientato al rialzo ma che si trova di fronte a una zona di resistenza critica.
Le Bande di Bollinger indicano che l'azione del prezzo sta premendo contro la banda superiore, suggerendo una volatilità aumentata e una forte pressione d'acquisto. Tuttavia, mentre la coppia si avvicina a 1,1657, i trader potrebbero prevedere prese di profitto o una consolidazione a breve termine prima di un ulteriore movimento al rialzo.
Un breakout deciso sopra 1,1740 potrebbe rafforzare il sentiment bullish e attirare ulteriori interessi di acquisto. Al ribasso, il supporto immediato si trova a 1,1566, con un livello più profondo intorno a 1,1485. Una rottura al di sotto di questi livelli probabilmente innescherebbe liquidazioni di vendite e una rinnovata pressione al ribasso.
Nel frattempo, il RSI si avvicina a 70, segnalando che la coppia si sta avvicinando a territori di ipercomprato. Ciò suggerisce una possibile correzione a breve termine prima che la tendenza riprenda la sua traiettoria al rialzo.
Implicazioni per l'investimento in EUR/USD
Per i trader, questo è un mercato definito dalla pazienza più che dall'aggressività. Il trading in range tra 1,156 e 1,166 rimane valido, ma sono essenziali stop stretti dato il rischio di un breakout guidato dai dati.
Gli investitori a medio termine dovrebbero notare che la stabilità sottostante dell'euro, il restringimento dei divari di crescita e il rischio ridotto nell'Eurozona potrebbero sostenere un momentum graduale al rialzo verso 1,18–1,20 se il dollaro continua a indebolirsi fino all'inizio del 2026.
Con la compressione della volatilità, la gestione del rischio diventa cruciale. Utilizzando il Deriv trading calculator, i trader possono stimare i valori dei pip, i requisiti di margine e il potenziale profitto o perdita prima di aprire una posizione. Questa precisione aiuta a gestire l'esposizione intorno a livelli critici, come il supporto a 1,156 o la resistenza a 1,174 - un vantaggio importante in mercati a bassa volatilità.
Con EUR/USD che si aggira vicino a livelli tecnici chiave, i trader possono monitorare i movimenti di prezzo in tempo reale su Deriv MT5 e pianificare ingressi basati sui dati utilizzando il Deriv Trading Calculator. Quando il rapporto CPI sarà pubblicato, entrambi gli strumenti saranno fondamentali per identificare lo slancio del breakout e gestire l'esposizione in tempo reale.

Previsioni sul prezzo dell'argento: perché il rally del metallo ha forza questa volta
Il rally dell'argento negli ultimi cinque giorni non è un falso inizio: è un movimento basato sui fondamentali, non sulla paura, secondo gli analisti.
Il rally dell'argento negli ultimi cinque giorni non è un falso inizio: è un movimento basato sui fondamentali, non sulla paura, secondo gli analisti. A differenza dei precedenti picchi speculativi, questa impennata riflette una convergenza di aspettative di allentamento monetario, condizioni di offerta ristrette e una domanda industriale in forte crescita proveniente dalle energie rinnovabili e dalla produzione di semiconduttori.
Con il dollaro sotto pressione e i trader che prezzano un taglio dei tassi a dicembre, la recente forza dell'argento segnala l'inizio di una fase guidata dai fondamentali piuttosto che un'altra breve ondata di ottimismo.
Punti chiave
- L'argento viene scambiato vicino a 54,40$, estendendo il suo rally più forte da ottobre.
- Le probabilità di un taglio dei tassi Fed sono salite al 68%, spingendo gli investitori a spostarsi verso asset senza rendimento, come l'argento.
- L'offerta mineraria è diminuita del 7% dal 2016, mentre la domanda industriale supera la produzione.
- La domanda da energie rinnovabili e veicoli elettrici ora rappresenta oltre la metà del consumo totale di argento.
Cambio di politica sull'argento e debolezza dei dati spingono gli acquisti
L'ultimo rally dell'argento è stato innescato da un netto cambiamento nelle aspettative sui tassi di interesse. I recenti dati USA hanno mostrato un rallentamento dell'economia: la creazione di posti di lavoro nel settore privato è diminuita di circa 11.000 unità a settimana fino a fine ottobre, secondo ADP. Il rallentamento ha aumentato la fiducia del mercato che la Federal Reserve taglierà i tassi a dicembre, con le probabilità che sono salite dal 62% al 68%, come rilevato dal CME FedWatch Tool.
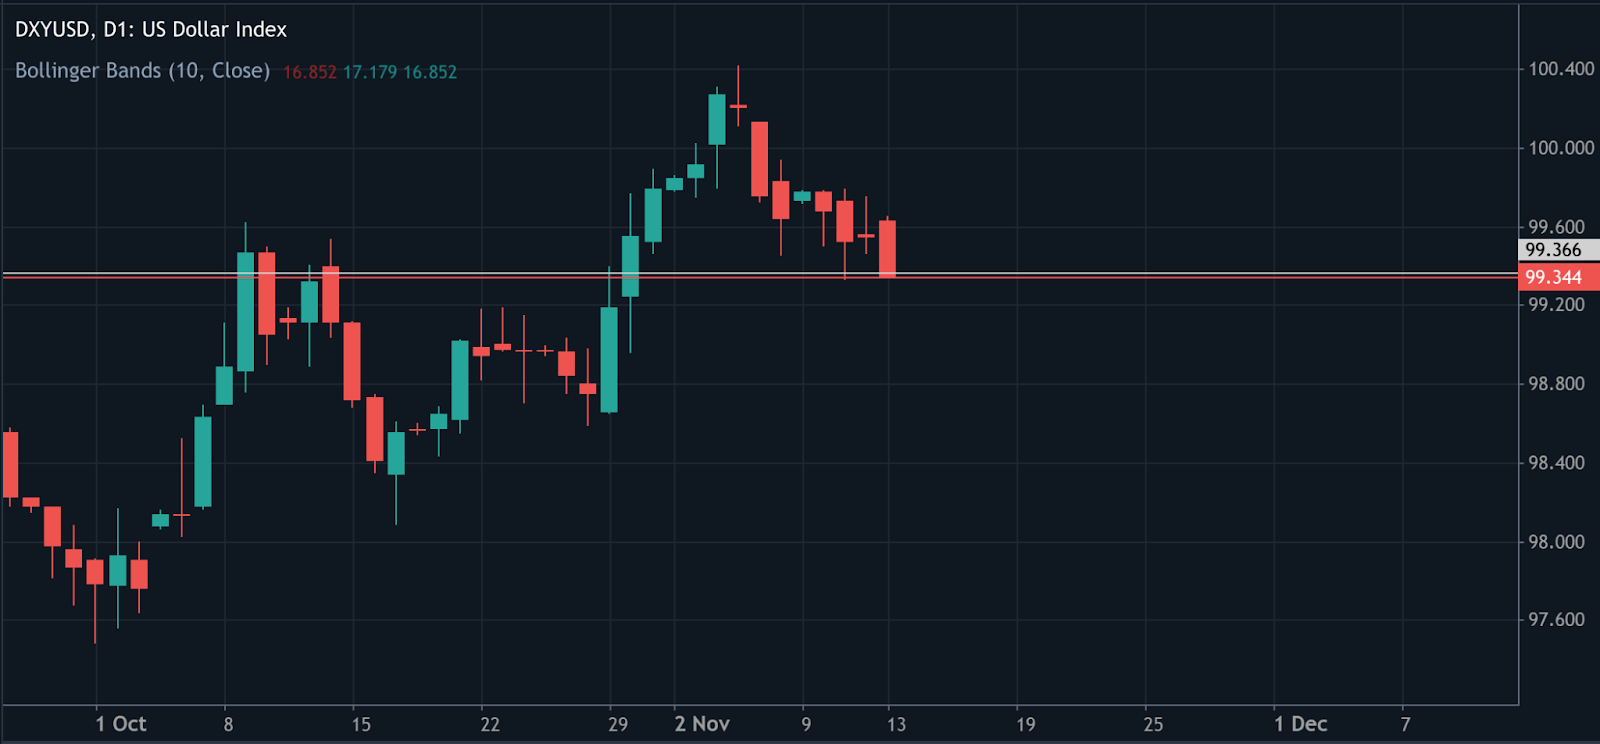
Tassi più bassi indeboliscono tipicamente il dollaro e aumentano la domanda di asset rifugio senza rendimento. L'Indice del Dollaro USA (DXY) è sceso a circa 99,60, amplificando i guadagni di oro e argento mentre gli investitori cercano alternative al denaro a basso rendimento.
Normalmente, i progressi sulla chiusura del governo USA avrebbero raffreddato la domanda di rifugio sicuro, ma questa volta le aspettative di politica monetaria hanno prevalso sulla politica. Il mercato sta reagendo a una storia più ampia: crescita rallentata e una Fed costretta ad allentare.
Dalla paura ai fondamentali: il deficit di offerta e la domanda dell'argento
Questo rally segna una deviazione rispetto agli episodi precedenti guidati dal trading speculativo. Secondo Sprott Asset Management, la forza dell'argento ora si basa su deficit strutturali di offerta e sull'espansione industriale, non sull'hype. La produzione mineraria totale è diminuita del 7% dal 2016, mentre la domanda da energie rinnovabili, veicoli elettrici (EV) ed elettronica è cresciuta costantemente.
La domanda industriale di argento continua a superare la crescita dell'offerta
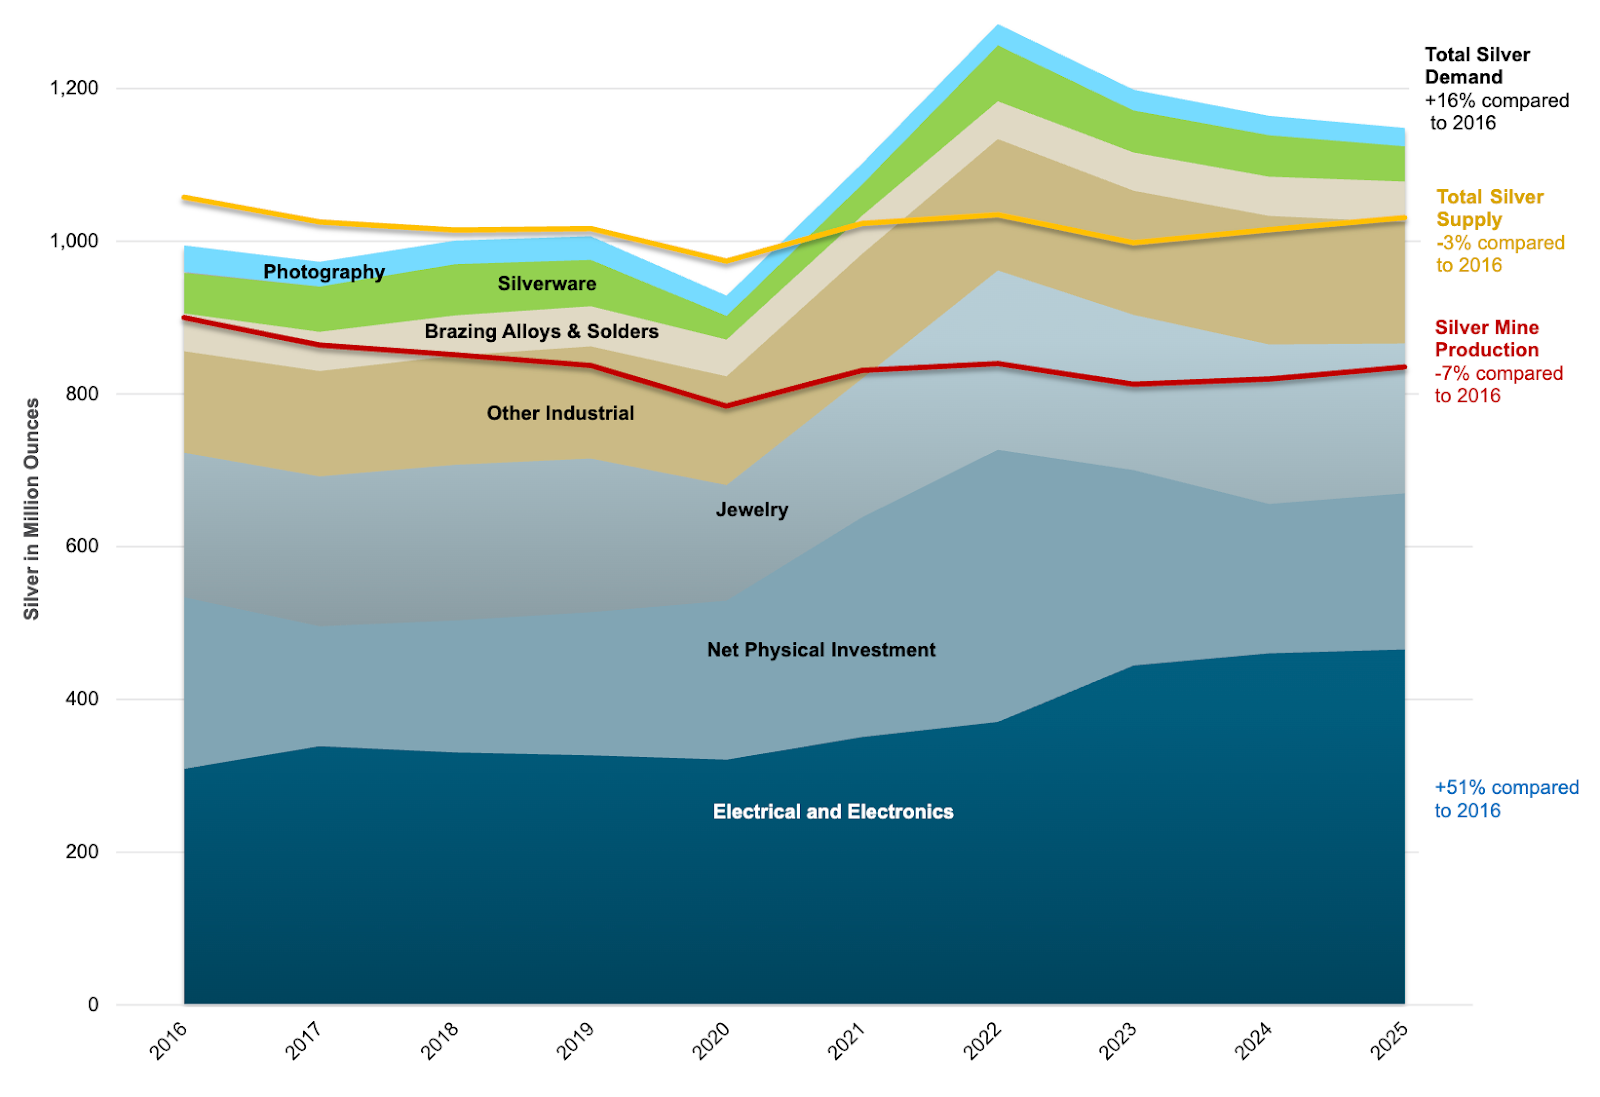
Oltre la metà della domanda totale di argento proviene ora da applicazioni industriali - principalmente produzione di pannelli solari, semiconduttori e componenti per veicoli elettrici. L'offerta, tuttavia, non ha tenuto il passo. I volumi di riciclo sono cresciuti solo modestamente e gli investimenti minerari nuovi rimangono limitati, lasciando il mercato sempre più ristretto.
Come ha osservato un analista, “Questo è il primo rally dell'argento in anni guidato più dalle fabbriche che dalla paura.”
Se stai pianificando il tuo ingresso nel trading, il calcolatore di trading Deriv ti aiuta a stimare margine, swap e potenziali profitti sulle piattaforme Deriv, come Deriv MT5.
Il contesto macro: debolezza del dollaro e politica accomodante
L'ambiente più ampio rafforza la forza dell'argento. La combinazione di un dollaro più debole, rendimenti in calo e indicatori economici deboli ha creato una configurazione ideale per i metalli preziosi. L'Indice di Fiducia dei Consumatori dell'Università del Michigan è sceso al livello più basso dal 2022, mentre l'attività al dettaglio si è indebolita, segnalando che il ciclo di inasprimento della Fed ha raggiunto il suo limite.
Sentimento dei consumatori USA


Anche l'oro ha contribuito al momentum del settore, salendo brevemente sopra i 4.300$ l'oncia in ottobre. L'argento, tradizionalmente più volatile, ha beneficiato del trasferimento di interesse mentre gli investitori diversificano tra i metalli in previsione di un prolungato allentamento monetario.
Parallelamente, la stretta dell'offerta del rame rafforza l'argomento che l'intero complesso dei metalli stia entrando in una fase di rivalutazione guidata dall'offerta. Le stesse carenze strutturali viste nel rame stanno ora emergendo nell'argento, sottolineando una narrazione condivisa: la crescita della domanda supera la produzione nelle materie prime critiche.
Forza industriale: il nuovo motore del ciclo dell'argento
Il duplice ruolo dell'argento - metallo rifugio e industriale - lo rende unico tra le materie prime.
Mentre l'oro dipende in gran parte dalla domanda di investitori e banche centrali, l'argento beneficia del suo ruolo nelle catene di approvvigionamento dell'energia pulita e della tecnologia. Le installazioni solari dovrebbero raggiungere livelli record nel 2025, mentre l'adozione di veicoli elettrici continua ad accelerare.
Gli analisti stimano che la domanda da energie rinnovabili ed elettronica crescerà più rapidamente della produzione mineraria per almeno i prossimi due anni, portando a guadagni di prezzo previsti del 34% nel 2025 e dell'8% nel 2026. Anche aumenti modesti nei consumi ora scatenano risposte di prezzo sproporzionate a causa dei deficit persistenti.
Approfondimenti tecnici sull'argento
Al momento della stesura, l'argento (XAG/USD) sta testando il livello di resistenza a 54,30$, una zona chiave dove la presa di profitto potrebbe aumentare dopo un forte rally rialzista. Il RSI si aggira intorno a 69, avvicinandosi alla zona di ipercomprato, che segnala un potenziale esaurimento del momentum d'acquisto e una probabilità di consolidamento a breve termine o di ritracciamento.
Le Bande di Bollinger mostrano che l'azione del prezzo si attacca alla banda superiore, indicando una forte pressione rialzista ma anche un rischio di sovraestensione a breve termine. Una rottura decisiva sopra i 54,30$ potrebbe invitare ulteriori acquisti, puntando a nuovi massimi.
Tuttavia, il mancato superamento di questo livello potrebbe innescare un ritracciamento verso il supporto a 47,00$, dove i compratori potrebbero riemergere. Sotto questo, il prossimo livello chiave si trova a 41,28$, segnando una zona di supporto più profonda legata ad accumuli precedenti.

Rischi e potenziali inversioni dell'argento
Nonostante le prospettive positive, permangono alcuni rischi:
- Un rimbalzo del dollaro su dati USA più forti potrebbe temporaneamente limitare i guadagni.
- Una ripresa industriale più lenta o un ridotto sviluppo delle rinnovabili potrebbe indebolire la crescita della domanda.
- La presa di profitto a breve termine potrebbe innescare volatilità nell'intervallo 50–52$.
Tuttavia, è probabile che si tratti di correzioni temporanee piuttosto che inversioni di tendenza. Le condizioni di offerta ristrette e i solidi fondamentali industriali forniscono un supporto duraturo al mercato.
Prospettive per l'argento: un rally sostenuto dalla sostanza
L'ascesa dell'argento riguarda meno la speculazione e più il cambiamento strutturale. Con la politica monetaria che diventa accomodante e l'accelerazione della domanda industriale, il mercato sta passando da un trade reattivo a una rivalutazione a lungo termine.
Gli analisti prevedono che l'argento rimarrà sopra i 50$ l'oncia nel 2025, con un potenziale retest del picco di ottobre a 54$ se i tagli dei tassi si concretizzeranno e l'attività industriale si stabilizzerà. L'allineamento tra allentamento macroeconomico, espansione dell'energia verde e deficit di offerta fornisce a questo rally la base più credibile da oltre un decennio.
In parole semplici, la paura potrebbe averlo innescato - ma ora sono i fondamentali a guidarlo.

La crescente domanda di AI, veicoli elettrici ed energia trasformerà il rame nel nuovo petrolio?
Il ruolo del rame nell'economia globale sta passando da input industriale a risorsa strategica a supporto delle transizioni energetiche e tecnologiche.
Sì - e i dati supportano sempre più questa visione. Il ruolo del rame nell'economia globale sta passando da input industriale a risorsa strategica a supporto delle transizioni energetiche e tecnologiche. I prezzi si attestano vicino a 11.000 dollari per tonnellata sul London Metal Exchange (LME), in aumento di circa il 27% da gennaio 2025, mentre la domanda da parte dei data center AI, dei veicoli elettrici (EV) e delle infrastrutture per energie rinnovabili cresce rapidamente.
Con l'offerta globale che fatica a tenere il passo, gli analisti ritengono che il rame potrebbe presto diventare centrale per la crescita moderna come lo è stato il petrolio nel XX secolo - alimentando tutto, dalle reti ad alta tensione ai server AI dell'era digitale.
Punti chiave
- I prezzi del rame rimangono vicino ai massimi storici, sostenuti dalla domanda di data center AI, veicoli elettrici e progetti di energia rinnovabile.
- Le interruzioni di fornitura in Cile e Perù, combinate con il calo della qualità del minerale e i ritardi nei progetti, stanno restringendo la produzione globale.
- I flussi istituzionali da fondi pensione e fondi sovrani hanno trasformato il rame in un asset strategico di investimento.
- JPMorgan prevede che il rame raggiungerà i 12.000 dollari per tonnellata all'inizio del 2026, mentre Morgan Stanley proietta un deficit di offerta in crescita fino al 2029.
- L'incertezza sulle politiche commerciali e la prudenza della Fed potrebbero creare volatilità a breve termine, ma i fondamentali strutturali restano fortemente rialzisti.
La carenza di offerta di rame incontra la domanda in crescita
A differenza dei precedenti boom delle materie prime, il rally del rame non è frutto di speculazione, ma una risposta a squilibri profondi e strutturali. La produzione globale continua a faticare, con circa il 6% dell'offerta attualmente offline a causa di scioperi, condizioni meteorologiche avverse e colli di bottiglia infrastrutturali in Sud America.
Cile e Perù, che insieme rappresentano circa il 40% della produzione mondiale di rame, stanno affrontando gravi pressioni operative. Reti logistiche danneggiate, programmi di manutenzione ritardati e capacità di trasporto limitata hanno ridotto il movimento del minerale, mentre le fonderie invecchiate operano sotto capacità.
A complicare la situazione è la geologia. I nuovi giacimenti di rame stanno rendendo minerali con gradi più bassi - tipicamente con un contenuto di rame dello 0,3–0,8%, rispetto al 2–5% delle decadi precedenti. Ciò significa che i minatori devono processare più roccia per ottenere la stessa quantità di metallo, aumentando così sia i costi che l'impatto ambientale.
Nel frattempo, i tempi di sviluppo delle miniere si sono allungati tra i sette e i diciotto anni, limitando la velocità con cui la nuova offerta può rispondere alla domanda crescente. Morgan Stanley prevede un deficit globale di 590.000 tonnellate nel 2026, destinato ad ampliarsi a 1,1 milioni di tonnellate entro il 2029 - il più grande in oltre due decenni.

Rivoluzione della domanda di rame: AI, veicoli elettrici ed energia pulita
La domanda di rame del prossimo decennio non proverrà da costruzioni o manifattura tradizionale, ma dalle tecnologie che alimentano le transizioni energetiche e digitali globali.
I data center AI sono diventati una nuova importante fonte di domanda. Secondo il Dipartimento dell'Energia degli Stati Uniti e le ricerche del Lawrence Berkeley National Laboratory, i data center potrebbero consumare dal 6,7% al 12% dell'elettricità totale degli USA entro il 2028, rispetto al 4,4% nel 2023. Ogni nuova struttura richiede grandi quantità di rame per cablaggi, trasformatori e distribuzione dell'energia.
I veicoli elettrici (EV) sono un altro importante motore di crescita. Ogni EV contiene circa 40–50 chilogrammi di rame, circa quattro volte più di un'auto a benzina. Con la produzione di EV in espansione globale, il ruolo del rame nella produzione automobilistica cresce rapidamente.
Nel frattempo, il settore delle energie rinnovabili - in particolare eolico e solare - continua ad assorbire quantità senza precedenti di rame. Una singola turbina eolica offshore da 2–3 megawatt utilizza 5–7 tonnellate di rame nelle bobine del generatore, nei cablaggi e nei sistemi di controllo. La modernizzazione delle reti e gli investimenti in accumulo di batterie aumentano ulteriormente questa intensità di rame.
Insieme, queste forze alimentano quella che molti analisti descrivono come una trasformazione della domanda che si verifica una volta ogni generazione - che posiziona il rame come il collegamento critico tra elettrificazione, digitalizzazione e decarbonizzazione.
Slancio del rame: da metallo industriale ad asset strategico
Il rame non è più solo un metallo industriale - è ora un asset finanziario e strategico. Il London Metal Exchange rimane il principale punto di riferimento per la quotazione globale, ma i volumi di trading di futures sul rame e ETF sono aumentati durante tutto il 2025.
Gli investitori istituzionali, inclusi fondi pensione e fondi sovrani, hanno aumentato la loro esposizione al rame come copertura contro la transizione energetica globale. Questa domanda istituzionale si somma alle pressioni sull'offerta esistente, creando un circolo vizioso in cui l'aumento dei prezzi attira ulteriori flussi di capitale.
Gli strateghi delle materie prime osservano che questo ciclo sta diventando auto-rinforzante: “finché i deficit persistono, gli investitori continueranno a comprare la scarsità”, ha osservato un analista.
Su Deriv MT5, i trader possono monitorare i movimenti di prezzo del rame (XCU/USD) direttamente tramite grafici avanzati e indicatori tecnici - accedendo a strumenti di analisi di livello istituzionale usati in ambienti di trading professionali.
Tariffe sul rame, politiche e prudenza della Fed
Nonostante i solidi fondamentali, la performance a breve termine del rame è ancora influenzata dalle politiche commerciali e monetarie.
La politica tariffaria variabile dell'amministrazione Trump sul rame raffinato all'inizio di quest'anno ha creato volatilità tra i benchmark CME e LME. Quando le tariffe sono state inizialmente proposte, i prezzi del rame negli USA sono saliti rapidamente mentre gli importatori cercavano di assicurarsi l'offerta. Una volta esentato il rame raffinato, i prezzi si sono corretti - ma il divario ha evidenziato come il rischio politico ora muova i mercati dei metalli.
La revisione tariffaria del 2026 resta un evento di rischio chiave, e i trader si aspettano ulteriori dislocazioni se l'esenzione verrà revocata. Analisti come Roukaya Ibrahim di BCA Research ritengono che “la possibilità persistente di tariffe sul rame raffinato continuerà a influenzare il mercato,” mantenendo i prezzi USA a un premio.
Nel frattempo, il tono prudente della Federal Reserve riguardo ai tagli dei tassi ha temporaneamente rallentato i flussi speculativi nelle materie prime. Tuttavia, per gli investitori a lungo termine, la stretta strutturale nell'offerta di rame sovrasta il rumore politico a breve termine.
Prospettive di investimento nel rame: verso i 12.000 dollari e oltre
JPMorgan Chase prevede che i prezzi del rame potrebbero raggiungere i 12.000 dollari per tonnellata all'inizio del 2026, rappresentando un aumento dell'11% rispetto ai livelli attuali. Le sue previsioni rialziste sono supportate da:
- Investimenti in espansione nelle energie rinnovabili, nei veicoli elettrici e nelle infrastrutture AI.
- Risposta limitata dell'offerta a breve termine da parte dei principali produttori.
- Cicli di sviluppo delle miniere lunghi che ritardano la nuova produzione.
- Domanda istituzionale sostenuta per l'esposizione alle materie prime.
Analogamente, Morgan Stanley prevede che il mercato entrerà nel suo deficit più grave degli ultimi 22 anni, mentre Goldman Sachs ha descritto il rame come “l'opportunità a lungo termine più interessante nel complesso dei metalli industriali”.
Se queste previsioni si realizzeranno, il rame potrebbe mantenere un nuovo livello minimo di prezzo sopra i 10.000 dollari per tonnellata, anche di fronte a rallentamenti macroeconomici temporanei.
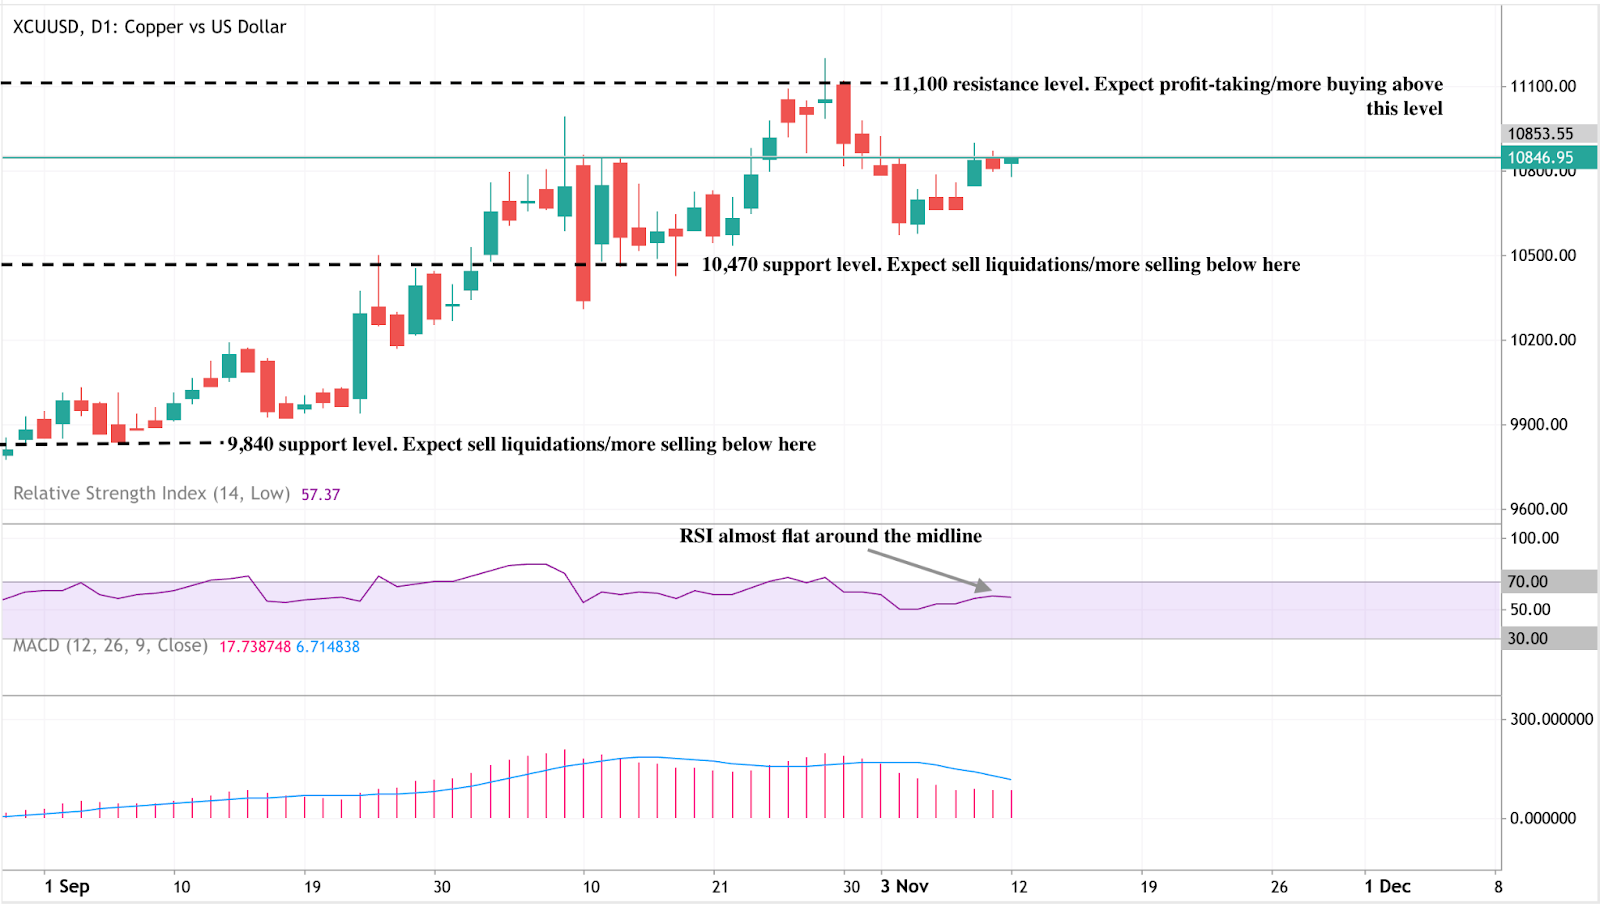
Analisi tecnica del rame
Al momento della stesura, il rame (XCU/USD) è scambiato vicino a 10.850, consolidando tra una zona di supporto chiave a 10.470 e un livello di resistenza a 11.100. Una rottura sopra 11.100 potrebbe innescare un rinnovato slancio rialzista, mentre una discesa sotto 10.470 potrebbe attirare nuove pressioni di vendita. Il prossimo supporto inferiore si trova intorno a 9.840, dove potrebbe verificarsi ulteriore liquidazione se il sentiment dovesse diventare risk-off.
L'RSI si aggira intorno a 57, quasi piatto vicino alla linea mediana, suggerendo un bias neutro - né fortemente ipercomprato né ipervenduto. Ciò indica un mercato in attesa, con uno slancio privo di direzione chiara.
Nel frattempo, la linea MACD rimane leggermente sopra la linea di segnale ma mostra un momentum in calo, riflettendo un indebolimento dell'impulso rialzista. Se il MACD dovesse incrociare sotto la linea di segnale, potrebbe confermare un sentiment ribassista a breve termine.
I trader possono utilizzare il calcolatore di trading Deriv per stimare i requisiti di margine e il potenziale di profitto nel trading di rame e altri metalli. Per approfondire la comprensione delle strategie di trading sulle materie prime, esplora le dettagliate guide al trading di materie prime di Deriv - ideali sia per trader principianti che avanzati.
Volatilità a breve termine del rame vs convinzione a lungo termine
Nonostante la tendenza rialzista a lungo termine, persistono venti contrari a breve termine. Il rallentamento del settore immobiliare cinese continua a pesare sul sentiment per i metalli industriali, mentre condizioni finanziarie più restrittive potrebbero ritardare i flussi speculativi.
Tuttavia, gli analisti ritengono ampiamente che qualsiasi correzione dei prezzi sarà di breve durata, poiché i fondamentali a lungo termine restano solidi. I ritracciamenti verso la fascia 9.000–9.500 dollari sono visti come opportunità di acquisto da parte dei fondi che si posizionano per la prossima tendenza rialzista nel 2026.
Analisi: Cosa guida il rally parallelo dei prezzi dell'oro e delle azioni USA?
Il rally parallelo sia dei prezzi dell'oro che delle azioni statunitensi è piuttosto insolito, poiché tradizionalmente l'oro è considerato un bene "rifugio".
Il rally parallelo sia dei prezzi dell'oro che delle azioni statunitensi è piuttosto insolito, poiché tradizionalmente l'oro è considerato un bene "rifugio" che tende a performare bene durante periodi di incertezza economica, mentre le azioni sono più legate alla crescita economica e all'appetito per il rischio. Diversi fattori stanno spingendo entrambi i mercati verso l'alto simultaneamente, secondo gli analisti.
I trader vedono una probabilità del 63% di un taglio di 25 punti base a dicembre, secondo lo strumento FedWatch del CME. Questa singola narrazione - denaro più economico - sta sollevando asset che solitamente si muovono in direzioni opposte: l'oro, il classico bene rifugio, e le azioni, il tradizionale investimento a rischio.
Entrambi i mercati si alimentano di ottimismo guidato dalla politica monetaria piuttosto che dalla forza economica. Dati deboli sull'occupazione, sentiment dei consumatori fiacco e segnali di tensione fiscale spingono i trader a posizionarsi per un percorso monetario più morbido, alimentando un rally di liquidità che sfuma la linea tra sicurezza e speculazione.
Punti chiave
- L'oro si mantiene sopra i 4.100 dollari l'oncia, il livello più alto da due settimane, mentre i trader anticipano l'allentamento della Fed.
- Anche le azioni USA stanno salendo poiché le aspettative di tassi più bassi aumentano le valutazioni degli utili futuri.
- Il rally riflette la fiducia nella liquidità, non nella crescita - un mercato guidato dalle banche centrali, non dai fondamentali.
- L'ansia fiscale e l'aumento dei rendimenti dei Treasury USA aggiungono un secondo livello di supporto per l'oro.
- La forte domanda fisica dall'India e dalle banche centrali sostiene i prezzi al di sotto dell'onda speculativa.
Le richieste di taglio dei tassi della Fed spingono oro e azioni USA
Il rally congiunto deriva da un chiaro cambiamento macroeconomico. I recenti dati economici USA hanno indicato una perdita di slancio - l'occupazione privata si è indebolita in ottobre, sono calati i posti di lavoro nel settore pubblico e retail, e il sentiment dei consumatori è sceso ai minimi da mesi. I mercati hanno interpretato questo come conferma che la Fed si orienterà verso tagli dei tassi a dicembre.
I tassi di interesse più bassi influenzano entrambi i lati del mercato simultaneamente:
- Per le azioni, rendono il prestito più economico e aumentano il valore attuale degli utili aziendali.
- Per l'oro, riducono il costo opportunità di detenere un bene che non produce rendimento.
Il risultato è un rialzo sincronizzato. Gli investitori non stanno scegliendo tra sicurezza e rischio; stanno comprando entrambi, uniti da un'unica aspettativa - il ritorno del denaro facile.
Per i trader su Deriv MT5, queste dinamiche cross-asset hanno creato nuove opportunità di diversificazione, poiché la volatilità in indici, materie prime e metalli risponde tutta allo stesso impulso politico.
La politica fiscale USA riemerge come fattore nascosto
La chiusura del governo USA e la sua risoluzione provvisoria hanno accentuato l'attenzione sulla stabilità fiscale. Il compromesso bipartisan del Senato per riaprire il governo - sostenuto dal Presidente Donald Trump - ha alleviato lo stress di breve termine sui mercati ma ha ricordato agli investitori il problema del debito a lungo termine dell'America.
Come ha osservato Ole Hansen di Saxo Bank, “L'aumento dei rendimenti guidato dall'ansia fiscale, piuttosto che dalla forza economica, è storicamente stato di supporto per i metalli per investimento.” Rendimenti obbligazionari più alti, in questo contesto, riflettono preoccupazioni sulla sostenibilità del debito, non un'economia più forte - rafforzando il motivo per detenere oro come copertura contro l'incertezza fiscale.
La riapertura delle agenzie governative ripristinerà anche l'accesso ai dati economici ufficiali, fornendo ai mercati maggiore chiarezza. Tuttavia, con quei dati probabilmente destinati a confermare un rallentamento dell'attività, i trader vedono ancora più giustificazioni per un intervento della Fed.
Oro e azioni: una rara impennata tandem nei mercati
Oro e azioni tradizionalmente si muovono in direzioni opposte. Uno rappresenta la paura, l'altro la fiducia. Tuttavia, il comportamento del mercato nel 2025 suggerisce che entrambi sono ora espressioni delle aspettative di liquidità.
Quando gli investitori si aspettano un allentamento monetario, tutto ciò che beneficia del denaro a basso costo sale - dall'oro alle azioni tecnologiche di crescita. Questo cambiamento di correlazione evidenzia una trasformazione strutturale nel funzionamento dei mercati: l'anticipazione della politica ha superato i fondamentali come principale motore dei prezzi.
La capacità dell'oro di salire anche mentre il dollaro USA si rafforza rafforza questo cambiamento. Le dinamiche valutarie sono state oscurate dal dominio della politica delle banche centrali nella determinazione dei prezzi degli asset globali.
La domanda di oro aggiunge profondità al rally
Oltre alla narrazione speculativa, la crescita dell'oro ha un forte sostegno nel mondo reale. La domanda fisica rimane robusta, in particolare in India e tra le banche centrali:
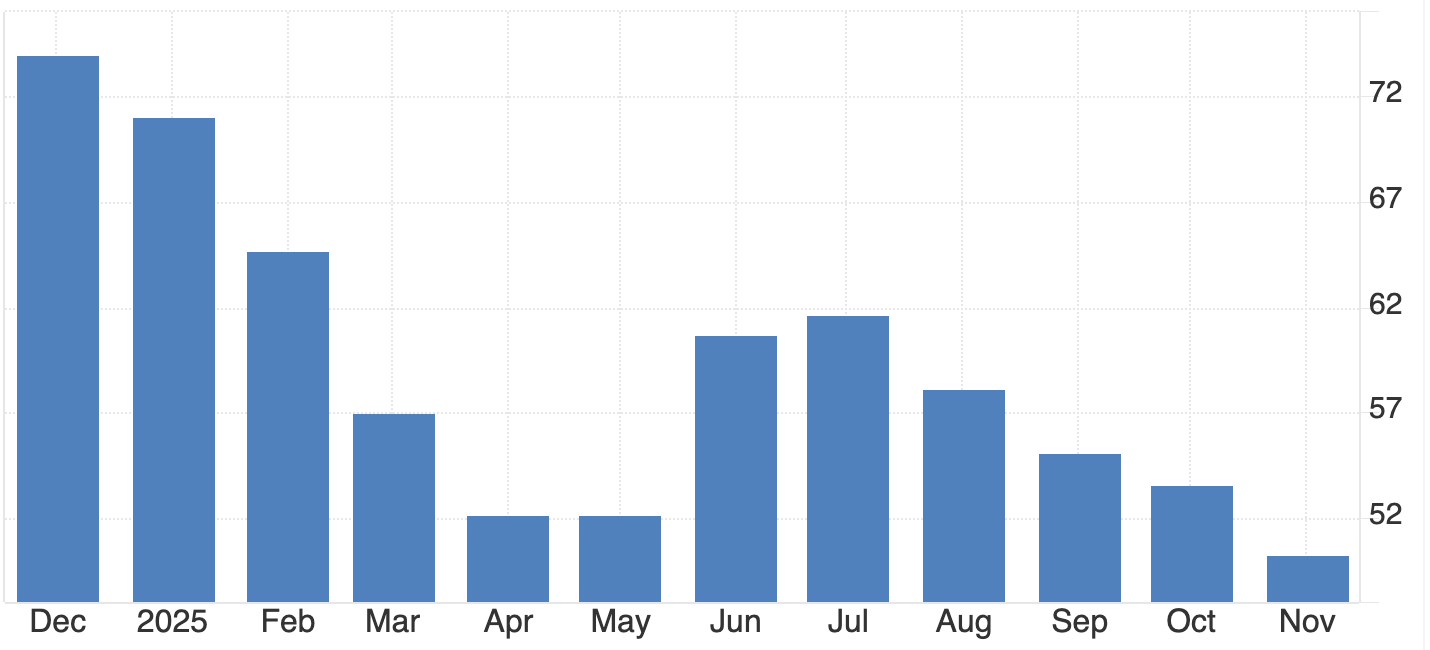
- Gli afflussi negli ETF sull'oro in India hanno raggiunto 2,9 miliardi di dollari nei primi 10 mesi del 2025 - equivalenti a 26 tonnellate di oro, quasi pari al totale dal 2020 al 2024 combinati.
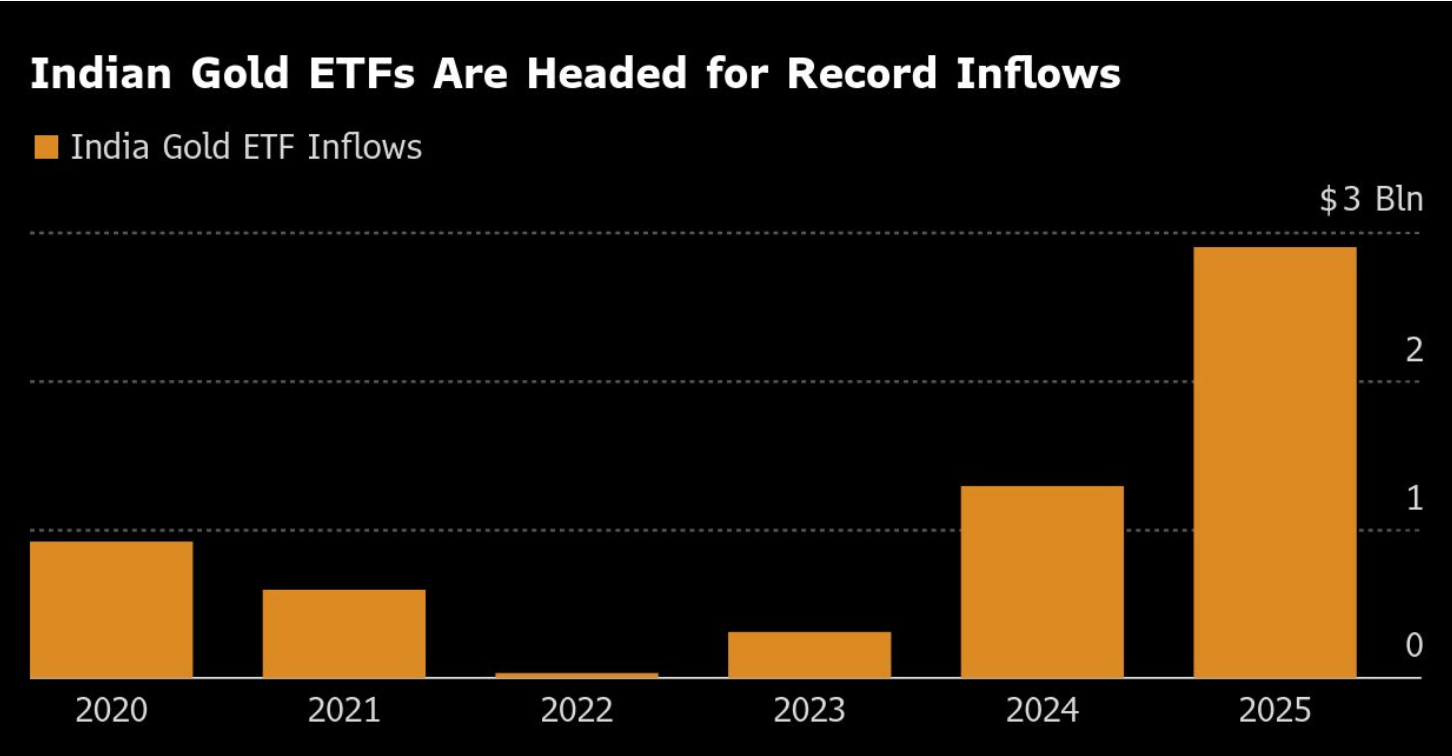
- Solo a ottobre si sono registrati 850 milioni di dollari di nuovi afflussi, dopo un record di 942 milioni a settembre.
- Le detenzioni totali di ETF in India ora ammontano a 83,5 tonnellate, per un valore superiore a 11 miliardi di dollari.
Questa domanda suggerisce che il rally non è puramente speculativo. Riflette un genuino appetito globale per l'oro come riserva di valore a lungo termine - un contrappeso all'incertezza monetaria e fiscale.
I produttori d'oro rispecchiano la fiducia degli investitori
Il lato corporate del mercato dell'oro rispecchia questo sentimento. Barrick Gold (ABX.TO), uno dei maggiori produttori mondiali, ha aumentato il dividendo trimestrale del 25% ed esteso il programma di riacquisto azionario da 500 milioni di dollari dopo aver riportato un utile rettificato superiore alle attese.
- Prezzo medio realizzato dell'oro: 3.457 dollari l'oncia, in aumento rispetto ai 2.494 dell'anno precedente.
- La produzione è scesa da 943.000 a 829.000 once, mentre i costi totali di mantenimento sono leggermente aumentati a 1.538 dollari l'oncia.
Nonostante le sfide operative e una svalutazione di 1 miliardo di dollari legata alla perdita della miniera in Mali, la svolta strategica di Barrick verso la produzione nordamericana segnala fiducia in prezzi dell'oro sostenuti elevati.
Tuttavia, la disputa in Mali - che include la detenzione di dipendenti e restrizioni alle esportazioni - sottolinea la fragilità geopolitica dell'offerta globale di oro, un fattore che potrebbe ulteriormente stringere i mercati se non risolto.
Contesto di mercato: debito, rendimenti e il paradosso della politica
L'aumento di oltre il 50% dell'oro quest'anno non è semplicemente una riflessione delle paure inflazionistiche. È una risposta alla fragilità fiscale e alla dipendenza del mercato dalla liquidità.
L'aumento dei rendimenti dei Treasury è meno un segno di salute economica e più un avvertimento sulla sostenibilità del debito. Gli investitori acquistano oro come copertura contro questi rischi strutturali mentre contemporaneamente spingono al rialzo le azioni assumendo che la liquidità continuerà a fluire.
Questo comportamento duale - cercare sicurezza e rischio simultaneamente - è il paradosso definitorio della psicologia di mercato del 2025.
Scenari per oro e azioni USA nei prossimi mesi
- Rottura rialzista
Se la Fed taglierà i tassi a dicembre e accennerà a ulteriori allentamenti, l'oro potrebbe superare rapidamente i 4.200 dollari, supportato da preoccupazioni fiscali e domanda costante delle banche centrali.
- Consolidamento a breve termine
Una posizione prudente o ritardata della Fed potrebbe vedere l'oro oscillare tra 4.050 e 4.150 dollari, con le azioni probabilmente mantenendo i guadagni finché le aspettative di liquidità non si affievoliranno.
In ogni caso, la conclusione chiave è che oro e azioni ora rispondono allo stesso motore macroeconomico - il prezzo del denaro - piuttosto che a forze emotive opposte.
Approfondimenti tecnici sull'oro
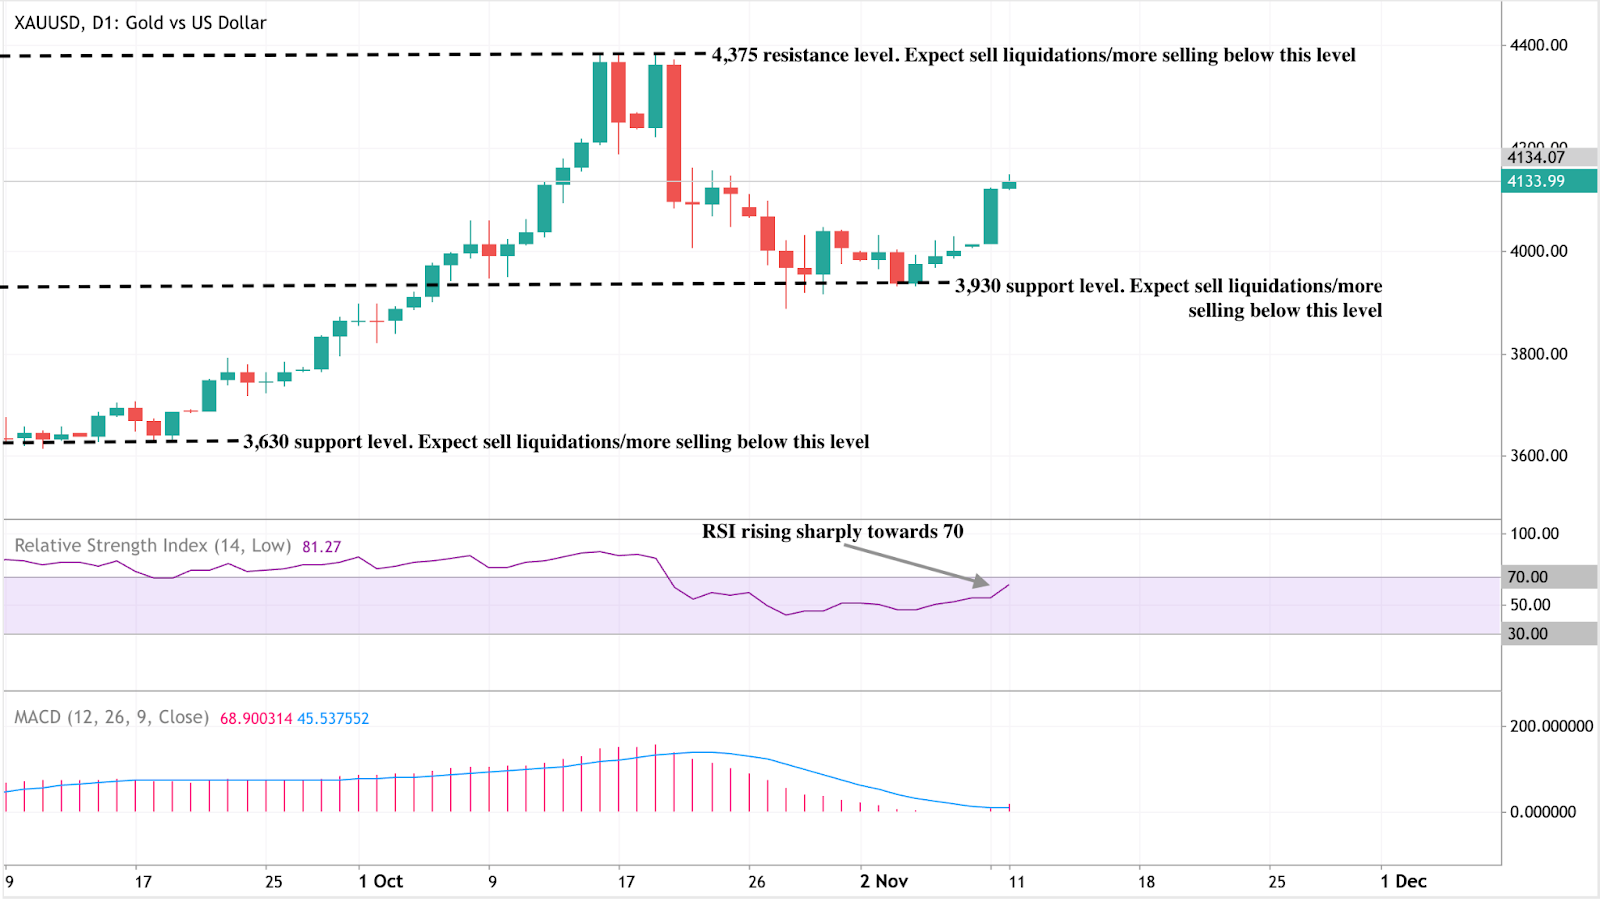
L'oro (XAU/USD) sta trattando intorno a 4.134 dollari, consolidandosi tra livelli chiave - resistenza a 4.375 e supporto a 3.930. Una rottura sopra 4.375 potrebbe estendere il rally, mentre una discesa sotto 3.930 rischia una nuova vendita verso 3.630.
L'RSI (81) indica un forte momentum rialzista ma segnala condizioni di ipercomprato, suggerendo un possibile consolidamento o ritracciamento a breve termine. Nel frattempo, il MACD rimane in crossover rialzista, confermando la pressione d'acquisto in corso.
Nel complesso, il bias dell'oro resta positivo sopra 3.930, ma i trader dovrebbero monitorare un possibile raffreddamento del momentum vicino alle zone di ipercomprato. È possibile seguire questi livelli direttamente su Deriv MT5 o sperimentare configurazioni di margine e rischio utilizzando il Deriv Trading Calculator per pianificare posizioni su metalli e indici.
Prospettive di investimento sull'oro
- Trader a breve termine: La zona 4.100–4.200 dollari è l'intervallo chiave da monitorare in vista della decisione della Fed di dicembre.
- Investitori a medio termine: Lo stress fiscale, la volatilità dei rendimenti reali e la domanda indiana sono i fattori principali per la forza continua.
Gestori di portafoglio: La correlazione in evoluzione dell'oro con le azioni significa che ora si comporta come un asset parallelo sensibile alla politica, non come una copertura pura. Le strategie di diversificazione dovrebbero tenere conto di questo cambiamento strutturale.
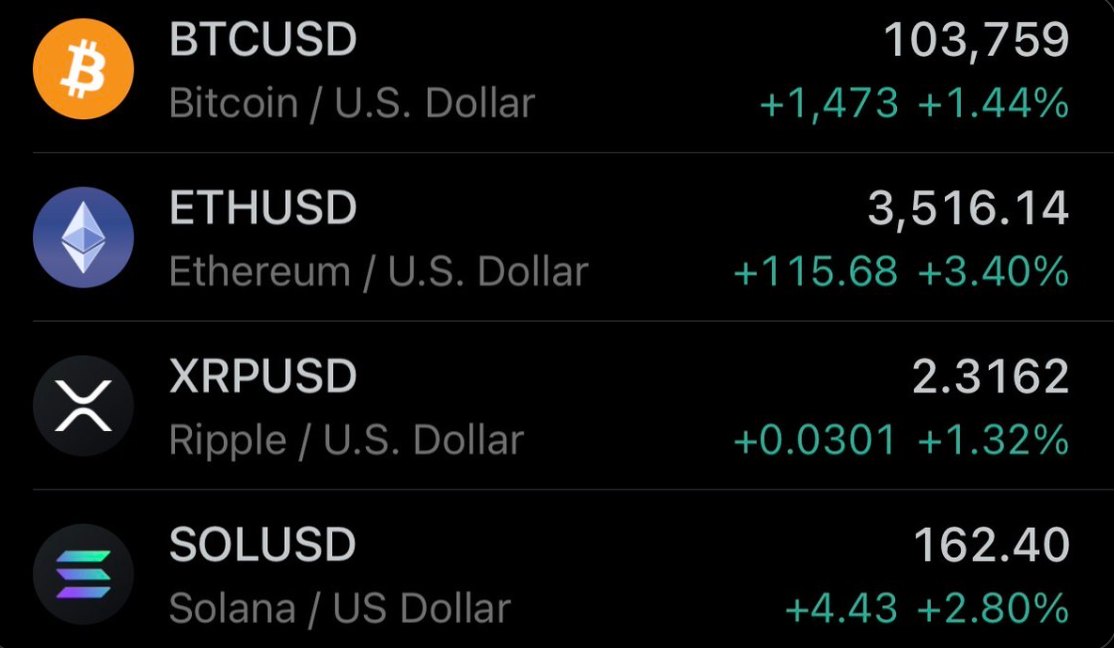
Can a tariff dividend create a new liquidity cycle for Bitcoin in 2025?
Analysts suggest that President Donald Trump’s proposed $2,000 “tariff dividend” has fuelled a wave of market optimism rather than a genuine injection of liquidity.
Yes - but only in sentiment, not in substance. Analysts suggest that President Donald Trump’s proposed $2,000 “tariff dividend” has fuelled a wave of market optimism rather than a genuine injection of liquidity.
The announcement triggered a short-lived crypto rebound, lifting Bitcoin back above $104,000, as traders drew parallels with the 2020 pandemic payments that helped fuel the last major bull run. Yet with limited fiscal backing and political obstacles, many believe this rally may be driven more by sentiment than by substance.
Key takeaways
- Trump’s $2,000 “tariff dividend” prompted a brief rally in Bitcoin and Ethereum, despite serious doubts over its feasibility.
- Funding gap: The proposed payout would cost around $300 billion, but tariff revenues generate only about $90 billion net.
- Institutional demand remains strong, with $2.7 billion in ETF inflows and BlackRock’s IBIT managing close to $100 billion in BTC.
- The Federal Reserve’s 25-basis-point rate cut and improved risk appetite continue to support Bitcoin above the $100K mark.
- Analysts see two paths: A climb towards $120K–$125K if optimism holds, or a slide below $100K once political enthusiasm fades.
- Crypto’s sensitivity to liquidity narratives underscores how sentiment - not policy - often leads market direction.
Trump’s tariff dividend promise and the market reaction
In a Truth Social post, President Trump claimed that the United States was generating “trillions of dollars” from tariffs and could use those funds to both reduce its $38 trillion national debt and finance a “dividend” for most Americans, excluding high earners.
The statement triggered a modest crypto rally as traders priced in the possibility of more household liquidity.
Markets quickly drew comparisons to the pandemic-era stimulus cheques that helped spark a historic bull market. Traders, long conditioned to respond to any hint of fresh money supply, reacted instinctively - even though the policy remains more political talking point than fiscal plan.
Why the maths don’t add up
Despite the excitement, the numbers simply do not work. Fiscal experts note that Trump cannot unilaterally authorise such payments; they require Congressional approval and a new funding bill.
The funding shortfall is also substantial:
- A $2,000 payment for 150 million adults would cost around $300 billion.
- Tariff collections to date total $120 billion, and after factoring in slower economic growth and lower tax receipts, net revenue sits closer to $90 billion.
As Erica York, Vice President of Federal Tax Policy, explained: “Each dollar raised through tariffs offsets about 24 cents in income and payroll tax revenue.” In short, the government lacks both the legal authority and the financial headroom to execute this plan, making any near-term payout highly unlikely.
Stimulus Déjà Vu: Why markets still care
The crypto rally reflects not fiscal reality but liquidity psychology. Even without concrete policy action, the mere suggestion of a “dividend” rekindles traders’ belief in free-flowing money and renewed risk-taking.
This mirrors 2020, when stimulus payments coincided with a surge in Bitcoin and altcoins as retail investors redirected government cheques into digital assets.

Although the scale is smaller this time, the pattern remains: crypto markets respond instantly to liquidity cues - whether real or imagined.
Bitcoin ETF inflows and structural strength
Beyond political headlines, Bitcoin’s structural outlook remains solid. Institutional inflows into U.S. spot Bitcoin ETFs exceeded $2.7 billion in early November, led by BlackRock’s IBIT and Fidelity’s FBTC. IBIT alone now holds $80.47 billion, cementing its position as the fastest-growing ETF in U.S. history.
Macroeconomic conditions are also supportive:
- The Federal Reserve’s 25-basis-point rate cut has lifted risk appetite.
- Trump’s pardon of Binance founder Changpeng Zhao signalled a more conciliatory stance towards crypto.
- Thailand and Malaysia are exploring the inclusion of Bitcoin in national reserves, marking a step towards mainstream adoption.
These developments indicate that even if Trump’s “dividend” proves politically untenable, the underlying liquidity narrative remains alive.
Market impact and price scenarios
If bullish sentiment and ETF inflows persist, Bitcoin could extend towards $120,000, driven by institutional accumulation and looser policy. However, should enthusiasm fade, a pullback below $100,000 remains a possibility as traders reassess the fundamentals.
So far, Bitcoin’s stability above $100,000 reflects confidence from institutional investors - although analysts warn that the rally is driven more by belief than by financial logic.
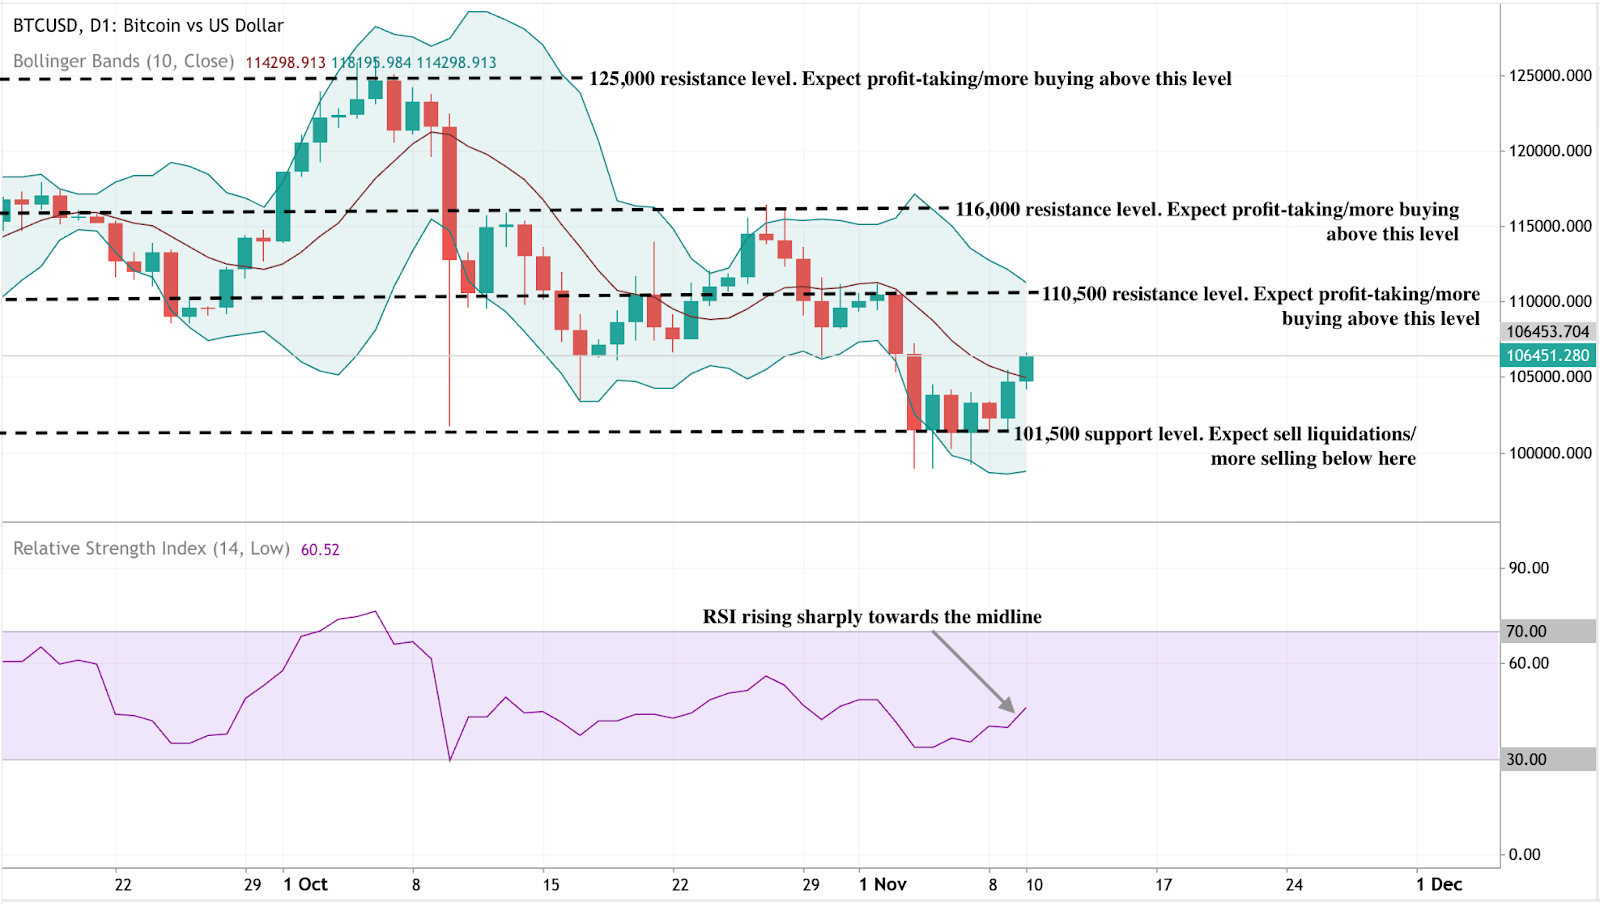
Bitcoin technical insights
Bitcoin’s price action shows early signs of recovery after holding above the key $101,500 support level, where sellers appear to have exhausted their momentum. This level remains crucial - a decisive break below could trigger further liquidations. On the upside, $110,500 serves as the first major resistance, followed by $116,000 and $125,000, where profit-taking is likely to intensify.
The Bollinger Bands are beginning to narrow after a period of strong volatility, suggesting potential consolidation before the next breakout. The price is also attempting to climb back toward the middle band (the 10-day moving average), signalling an improving short-term outlook.
Meanwhile, the RSI (14) has risen sharply to around 60, pointing to strengthening bullish momentum without yet entering overbought territory. If RSI continues upward past 60–70, it would confirm a shift in market sentiment toward renewed buying pressure.
Investment implications
For traders, sentiment remains the main short-term driver. Bitcoin’s $100K level represents the critical dividing line between bullish conviction and renewed caution.
Those trading crypto through Deriv MT5 can access advanced charting tools and cross-market analysis, making it easier to track correlations between Bitcoin, gold, and the U.S. dollar - especially during policy-driven volatility.
Meanwhile, traders can use the Deriv Trading Calculator to estimate potential profits, required margin, and swap rates before entering a position, ensuring tighter risk control in fast-moving conditions.
- Short term: Tactical buying opportunities exist above $102K–$104K if ETF inflows remain robust.
- Medium-term: Expect volatility tied to political announcements and monetary policy signals.
Long-term: Institutional accumulation and steady global adoption continue to underpin a structurally bullish outlook, even if near-term hype cools.
Is Filecoin’s price surge the start of a broader crypto market recovery?
According to experts, Filecoin’s 50% surge could mark the early stages of a broader recovery across the cryptocurrency market, driven by renewed interest in utility-based blockchain assets.
According to experts, Filecoin’s 50% surge could mark the early stages of a broader recovery across the cryptocurrency market, driven by renewed interest in utility-based blockchain assets. The decentralised storage token’s sharp rebound above the $2 level has placed it at the forefront of the DePIN (Decentralised Physical Infrastructure Network) rally - a niche sector that has gained roughly 11% overall in recent days.
Analysts point to rising network activity, strong developer funding, and growing institutional focus on real-world blockchain utilities as reasons why Filecoin’s latest move may represent more than just a speculative bounce. Still, whether the rally extends further will depend on broader market sentiment and sustained adoption within the decentralised storage ecosystem.
Key takeaways
- Filecoin leads crypto recovery: Up over 50% in 24 hours, Filecoin is outperforming most major tokens and driving gains in the DePIN sector.
- DePIN sector strength: Decentralised infrastructure projects have collectively gained 11%, signalling investor interest in tokens with tangible use cases.
- Ecosystem investment expanding: Protocol Labs has launched RetroPGF Round 3, allocating 585,000 FIL to support developer projects from November 2024 to September 2025.
- Market capitalisation: Filecoin’s valuation now stands at $1.52 billion, ranking it among the top 50 public blockchains.
- A short-term focus on maintaining momentum above $2 could pave the way for a move to $3, a key technical resistance level.
- Long-term outlook: Experts see Filecoin as a leading project in the growing Web3 infrastructure and decentralised storage economy.
Filecoin rally leads the market’s structural recovery
Filecoin’s performance is part of a broader market trend where investors are shifting capital towards utility-based projects - tokens that provide real-world functionality. Within this trend, DePIN networks stand out. These projects bridge physical resources such as computing power, energy, and data storage with blockchain incentive mechanisms, creating measurable productivity within decentralised systems.
The DePIN sector’s 11% rise reflects a shift in sentiment from speculative trading towards functional blockchain services. Filecoin’s 50% rally to above $2.00 has cemented its status as the flagship token for decentralised storage and one of the strongest indicators that the market is rediscovering value in blockchain infrastructure.

Filecoin vs traditional cloud storage
Launched in October 2020 by Protocol Labs, Filecoin provides a peer-to-peer marketplace for data storage. It enables users to rent out unused hard drive space, earning FIL tokens in exchange. Unlike traditional storage services such as Google Drive, iCloud, or Dropbox, Filecoin’s system operates without a central authority - meaning that pricing, availability, and access are determined entirely by the network.
The system relies on two unique consensus mechanisms:
- Proof-of-Replication (PoRep): Verifies that storage providers hold exact copies of the data they claim to store.
- Proof-of-Spacetime (PoSt): Confirms that the data remains stored for the entire agreed period.
Together, these mechanisms make Filecoin’s network verifiable, secure, and tamper-resistant, addressing long-standing challenges in data storage trust and transparency.
Decentralised storage: From research to real-world impact
Filecoin’s origins date back to 2014, when Protocol Labs developed the InterPlanetary File System (IPFS) - a decentralised file-sharing protocol designed to replace centralised web servers. Filecoin was later introduced as the economic layer of IPFS, incentivising users to store and maintain data using blockchain rewards.
In August 2017, Filecoin completed one of the largest token offerings in crypto history, raising $257 million in its Initial Coin Offering (ICO). Major investors, including Sequoia Capital, Union Square Ventures, and Digital Currency Group, backed the project.
By the time its mainnet launched in October 2020, Filecoin had become one of the most anticipated blockchain networks globally. Its price soared to an all-time high of $236.97 in 2021 before correcting sharply alongside the broader market downturn. Despite that decline, the network has continued to expand and maintain strong developer interest, positioning it as one of the most credible decentralised storage solutions in the Web3 space.
Filecoin’s ecosystem expansion reinforces fundamentals
While price volatility has dominated headlines, Filecoin’s ecosystem growth has been quietly strengthening. Protocol Labs recently launched RetroPGF Round 3, allocating 585,000 FIL to projects that contributed to the ecosystem between late 2024 and 2025.
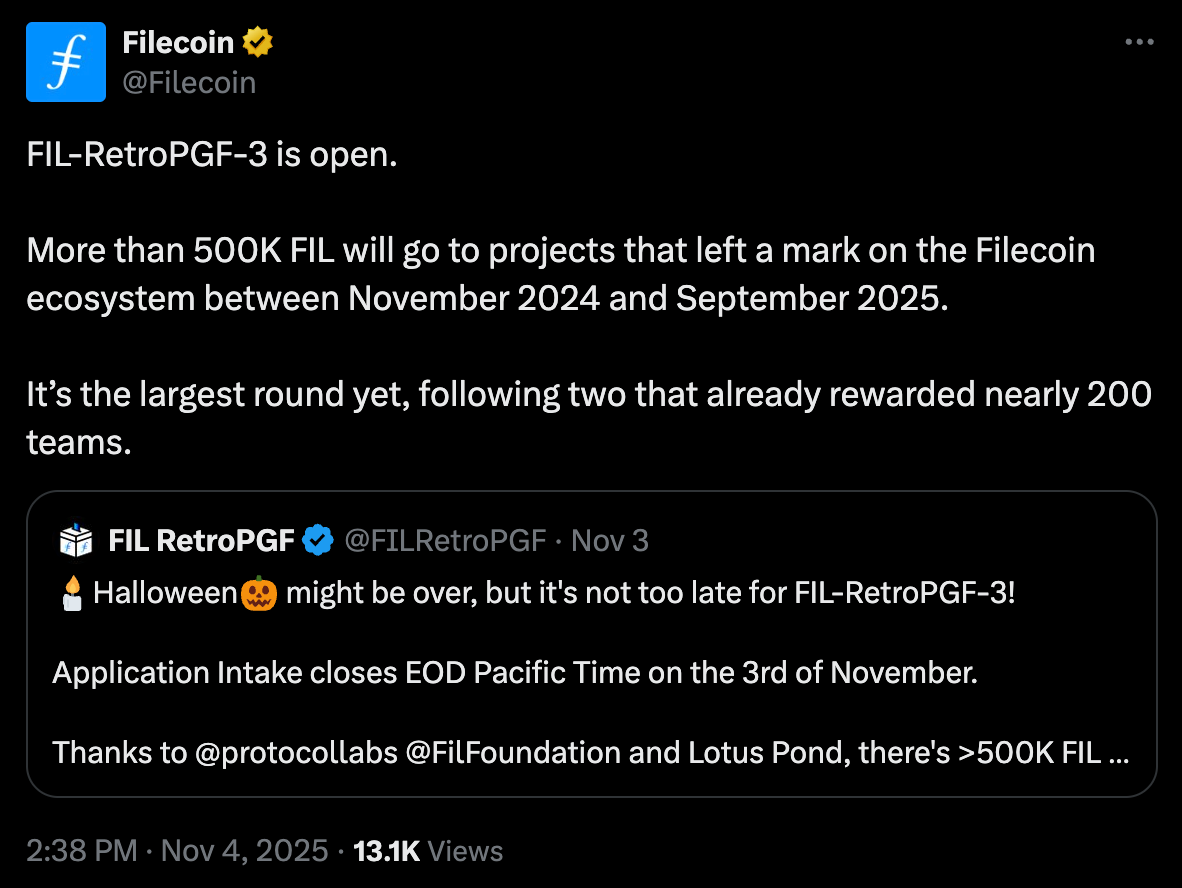
This round follows two earlier programmes that rewarded nearly 200 development teams, supporting innovations in decentralised computing, data retrieval, and dApp integration. The funding initiative underscores Filecoin’s commitment to sustainable growth - a key differentiator in a market often driven by short-term speculation.
Such ecosystem support not only encourages innovation but also signals confidence to institutional investors who are increasingly assessing Web3 infrastructure projects as long-term opportunities.
Market outlook: Can Filecoin sustain momentum?
Breaking past the $2 psychological level marks a pivotal moment for Filecoin. The next major resistance sits near $3, a level last tested in mid-2023. Technical analysts suggest that continued momentum could propel prices toward this mark if trading volumes remain high and the DePIN rally sustains.
However, Filecoin still trades far below its 2021 highs, underscoring both its potential for recovery and its vulnerability to market sentiment. Short-term corrections are possible as traders take profits, but experts say the latest surge is supported by more robust fundamentals than previous speculative rallies.
With a market cap of $1.52 billion and growing integration across decentralised applications, Filecoin is viewed as a key player in Web3’s evolving infrastructure layer. Its combination of utility, decentralisation, and developer support could allow it to benefit from the next major rotation into functional crypto assets.
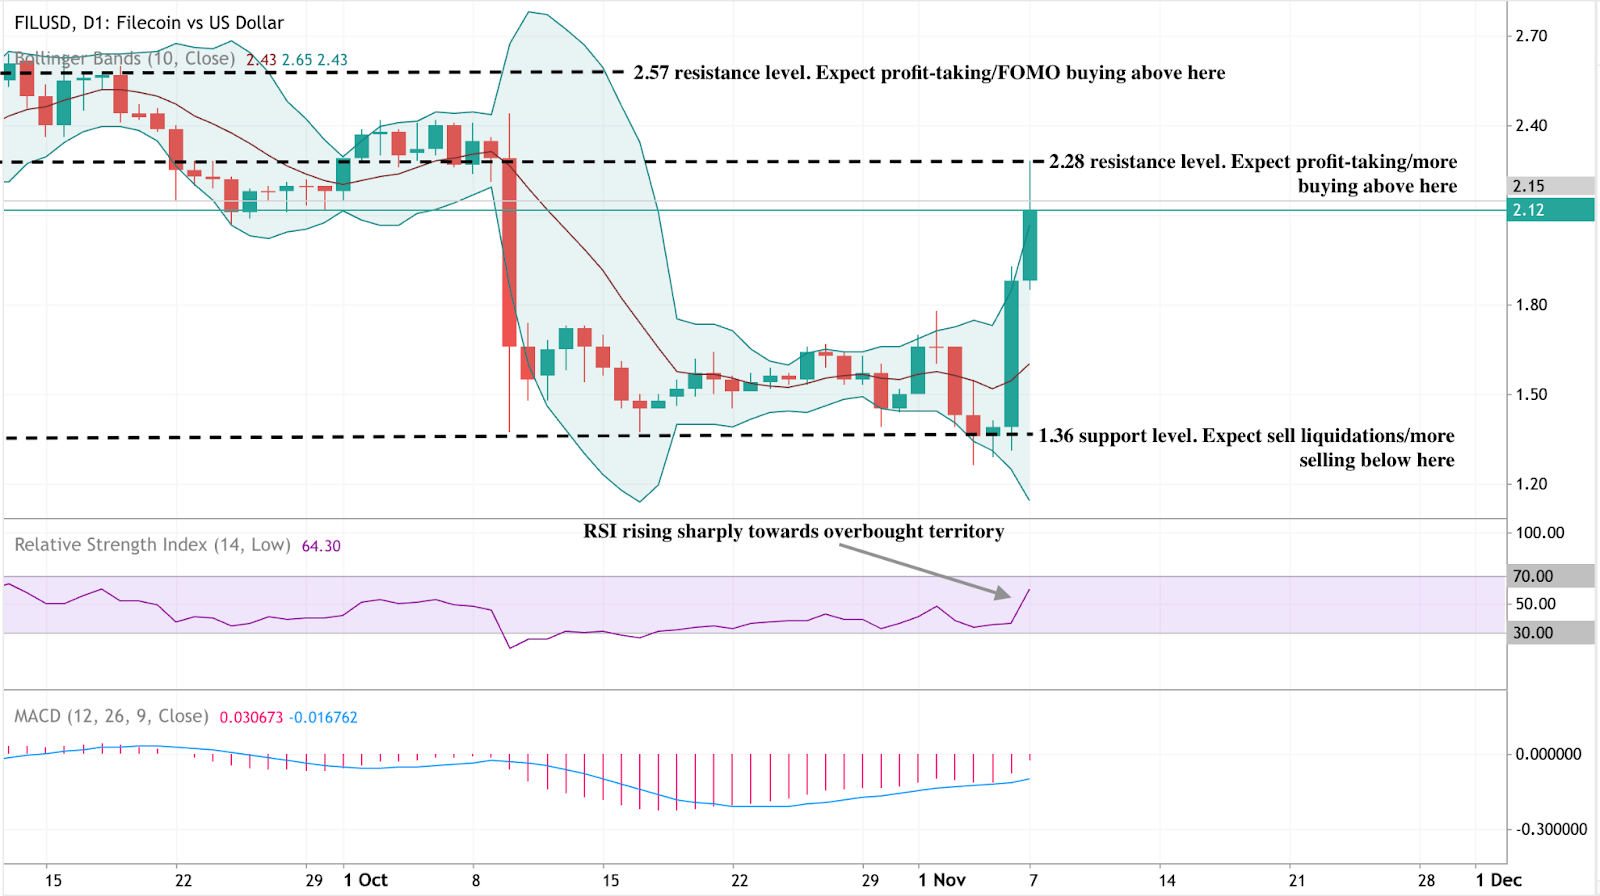
Filecoin technical analysis
At the time of writing, Filecoin (FIL/USD) is trading around $2.12, extending its rally after rebounding from the $1.36 support level. The Bollinger Bands have expanded, reflecting heightened volatility, with price now testing the upper band - often a sign of short-term exhaustion. The RSI, at 64.3, is rising sharply toward the overbought zone, suggesting momentum remains strong but could soon face a cooling period.
Meanwhile, the MACD has turned positive with a fresh bullish crossover, reinforcing the current uptrend. However, traders should monitor momentum closely as the histogram begins to flatten. The next key resistance levels sit at $2.28 and $2.57, where profit-taking or renewed buying may occur. On the downside, $1.36 remains the critical support level - a break below it could trigger another wave of selling.
To explore and analyse these setups in real-time, traders can track Filecoin price action directly on Deriv MT5, which provides advanced charting tools, indicators, and multi-asset trading access for crypto, forex, and commodities markets.
Filecoin’s short-term outlook is bullish but nearing overbought territory, hinting at a potential cooldown if resistance levels hold.
Filecoin investment implications
For traders, Filecoin’s recent breakout offers short-term momentum opportunities above the $2 level, with upside potential towards $3 if DePIN sector strength continues. Caution remains warranted given crypto market volatility, but the technical setup favours buyers as long as Filecoin holds its newly reclaimed support zone.
For long-term investors, Filecoin stands out as one of the few blockchain networks with clear real-world use cases. Its robust developer base, institutional backing, and role in the decentralised data economy make it an appealing bet on the future of Web3 infrastructure.
Competition from centralised cloud giants and other blockchain storage protocols could cap growth if adoption plateaus. Filecoin’s success will depend on scaling efficiently, maintaining ecosystem incentives, and integrating more deeply into decentralised application frameworks.
Before entering Filecoin positions, traders can use the Deriv trading calculator to estimate potential profit and loss based on position size, leverage, and price movement - an essential tool for managing risk in volatile crypto markets.
Trading Filecoin on Deriv
- Momentum trading: Traders can use RSI and MACD crossovers on Deriv MT5 to capture short bursts of volatility during rallies above key breakout levels.
- Range trading: When Filecoin consolidates between $1.80–$2.50, short-term traders may use Bollinger Band reversals to enter positions at range extremes.
- Breakout strategy: A sustained move above $2.57 could signal a new bullish leg toward $3.00 - traders can confirm signals using MT5’s volume indicators and EMA crossovers.

How Solana’s real-world integrations are redefining crypto in 2025
From institutional ETFs to payment infrastructure and decentralised finance (DeFi) applications, Solana is reshaping what it means for a blockchain to operate at scale in 2025.
Solana’s expanding real-world integrations - ranging from institutional ETFs to payment infrastructure and decentralised finance (DeFi) applications - are redefining what it means for a blockchain to operate at scale in 2025. The network’s steady ETF inflows, validator reforms, and partnership activity show that Solana’s growth story is no longer simply about price volatility; it is about building financial and operational depth across both on-chain and institutional layers.
Key takeaways
- Institutional inflows remain steady: Solana ETFs have recorded six consecutive days of positive inflows, signalling confidence from long-term investors.
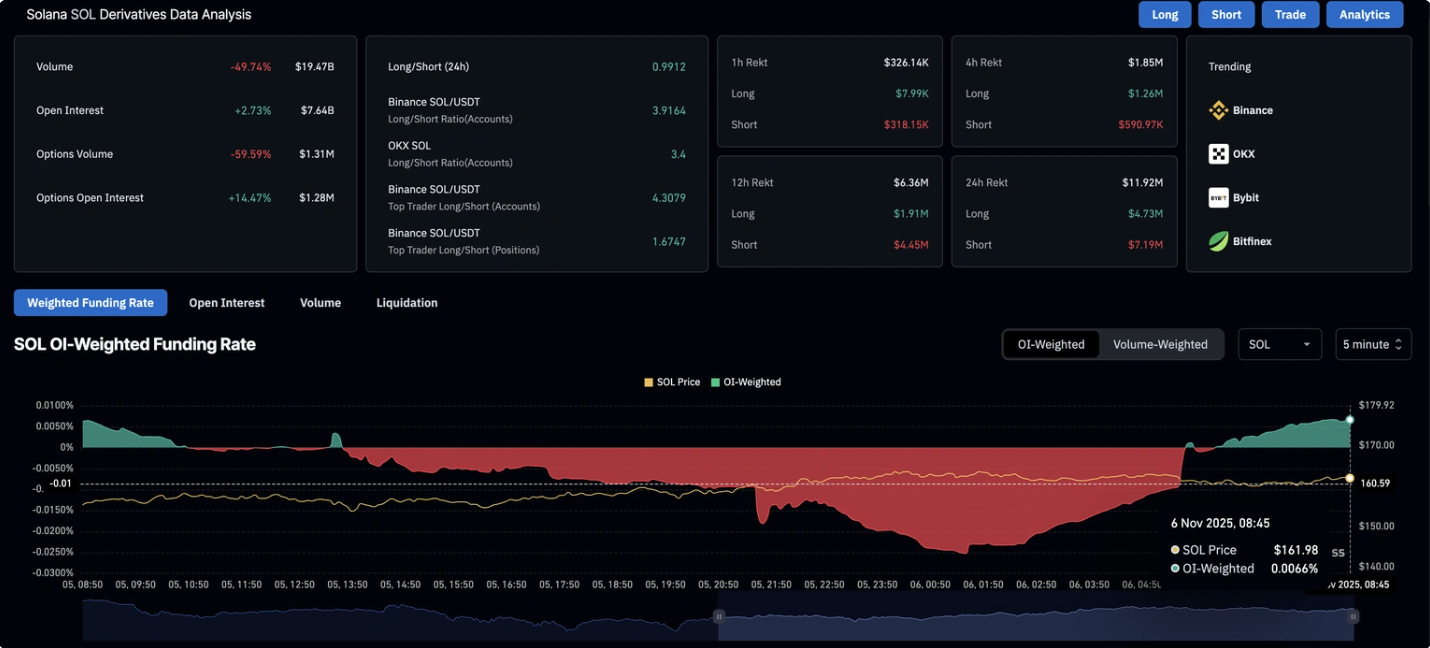
- Retail activity returns: Futures open interest has climbed to $7.64 billion, up 2.73% in 24 hours, while funding rates have turned positive - a sign of renewed retail optimism.
- Real-world integration grows: Solana is under evaluation for Western Union’s blockchain-based remittance pilot, positioning it for mainstream financial use.
- Network efficiency improves: Validator count has fallen 64% since early 2023, yet performance has strengthened as outdated operators were removed.
- Liquidity risks persist: Despite Solana total value locked (TVL) rising to $10.2 billion, stablecoin liquidity has declined 8.16% in a week - a warning for on-chain demand.
Solana institutional investment anchors Solana’s 2025 momentum
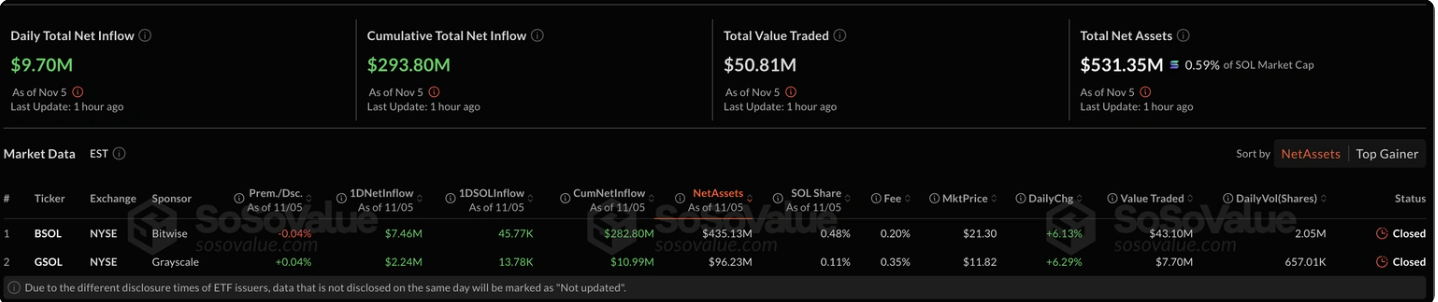
Institutional interest has become the foundation of Solana’s resilience this year. The Bitwise Solana Staking ETF (BSOL) drew $417 million in its debut week - outpacing even Bitcoin and Ethereum products - while the Grayscale Solana Trust (GSOL) attracted more than $1 million on its first day.
This consistent flow marks Solana’s shift from speculative trade to structured investment vehicle. For the sixth consecutive day, Solana ETFs have reported net inflows totalling $9.7 million mid-week, as professional investors position for long-term exposure despite macroeconomic uncertainty.
The rise of ETFs also introduces new liquidity and transparency. Each inflow represents a vote of confidence in Solana’s sustainability, particularly significant in a market shaped by cautious institutional allocators following the turbulence of 2022–23.
Solana retail traders re-engage as on-chain data strengthens
Following a weak start to the week, retail interest in Solana has picked up. According to CoinGlass, open interest in Solana futures increased 2.73% within 24 hours, and funding rates flipped from negative to positive territory. This indicates an expansion in leveraged long positions as traders bet on a continued rebound from the $155 support zone, with potential tests at $174–$177.
Short liquidations totaling $7.19 million exceeded long liquidations of $4.73 million, indicating that bearish positions were squeezed out and adding upward pressure on the price. The long-to-short ratio of 0.9912 indicates a market leaning cautiously bullish, yet still balanced.
Solana validator reforms make the network leaner and faster
Solana’s validator count has declined from around 2,500 to under 900 since 2023 - a 64% reduction - but this contraction reflects strategic consolidation rather than weakness. Many of the removed validators were outdated, slow, or linked to exploitative trading behaviours such as “sandwich” attacks.
The Solana Foundation has restructured its subsidy programme, now removing three subsidised validators for every new one added. The result: lower congestion, smoother transaction flow, and a healthier infrastructure.
As Tomas Eminger, Chief Infrastructure Officer at RockawayX, noted, this shift improves hardware quality and eliminates inefficiencies that previously slowed the network.
Solana real-world adoption: From DeFi to payments
Beyond market speculation, Solana is strengthening its institutional relevance through real-world adoption. Western Union has officially partnered with Solana to develop and test blockchain-powered cross-border transfer systems.
If adopted, the integration could channel significant transactional volume through Solana’s ecosystem, lifting both TVL and stablecoin demand. Simultaneously, developers are expanding Solana’s DeFi and asset-listing infrastructure:
- New perpetual markets are live.
- Launchpads are enabling faster token distribution.
- A revised asset-listing process simplifies onboarding for fintech and DeFi projects.
Together, these improvements suggest that Solana’s next growth phase will be driven less by speculative yield-farming and more by functional adoption - a shift reminiscent of how cloud computing matured from experimentation to enterprise utility.
Solana’s liquidity constraints: The risk beneath the rally
Despite these advances, the network faces liquidity constraints. DeFiLlama data shows Solana’s TVL rose 2.27% in 24 hours to $10.215 billion, but its stablecoin market capitalisation fell 8.16% over the week to $13.816 billion.

Falling stablecoin liquidity often signals shrinking capital reserves for decentralised applications, potentially reducing on-chain activity even as price metrics remain elevated.
If this decline continues, Solana may require stronger external inflows, such as ETF-driven liquidity or new payment-related transactions, to sustain ecosystem growth.
Comparing Solana’s institutional path to gold’s macro role
Solana’s 2025 performance mirrors gold’s cautious yet persistent rally amid uncertainty from the Federal Reserve. Both assets now reflect investor demand for alternatives that combine liquidity with long-term value preservation.
Just as gold ETFs legitimised physical gold as a mainstream portfolio component in the early 2000s, Solana’s regulated ETFs are giving institutions a compliant channel to access crypto exposure.
If the Fed’s December meeting signals prolonged policy tightness, risk assets could falter - yet steady institutional inflows suggest Solana is maturing into a digital asset capable of weathering policy-driven volatility.
Solana trading strategies on Deriv
- Breakout trading: Use Bollinger Bands or trendlines on Deriv MT5 to identify volatility-driven price movements. A confirmed breakout above resistance levels, such as $178 could indicate a bullish momentum continuation.
- Swing trading: Analyse Solana’s RSI and moving averages to time short- to medium-term entries. Combining this with the Deriv Trading Calculator can help manage position sizes and margin efficiently.
- Range trading: During consolidation, consider buying near support and selling near resistance using smaller lot sizes to manage risk effectively.
Deriv provides tight spreads, flexible leverage, and 24/7 access to crypto markets, allowing traders to act swiftly as Solana’s price responds to institutional flows or network developments.
Solana technical insights
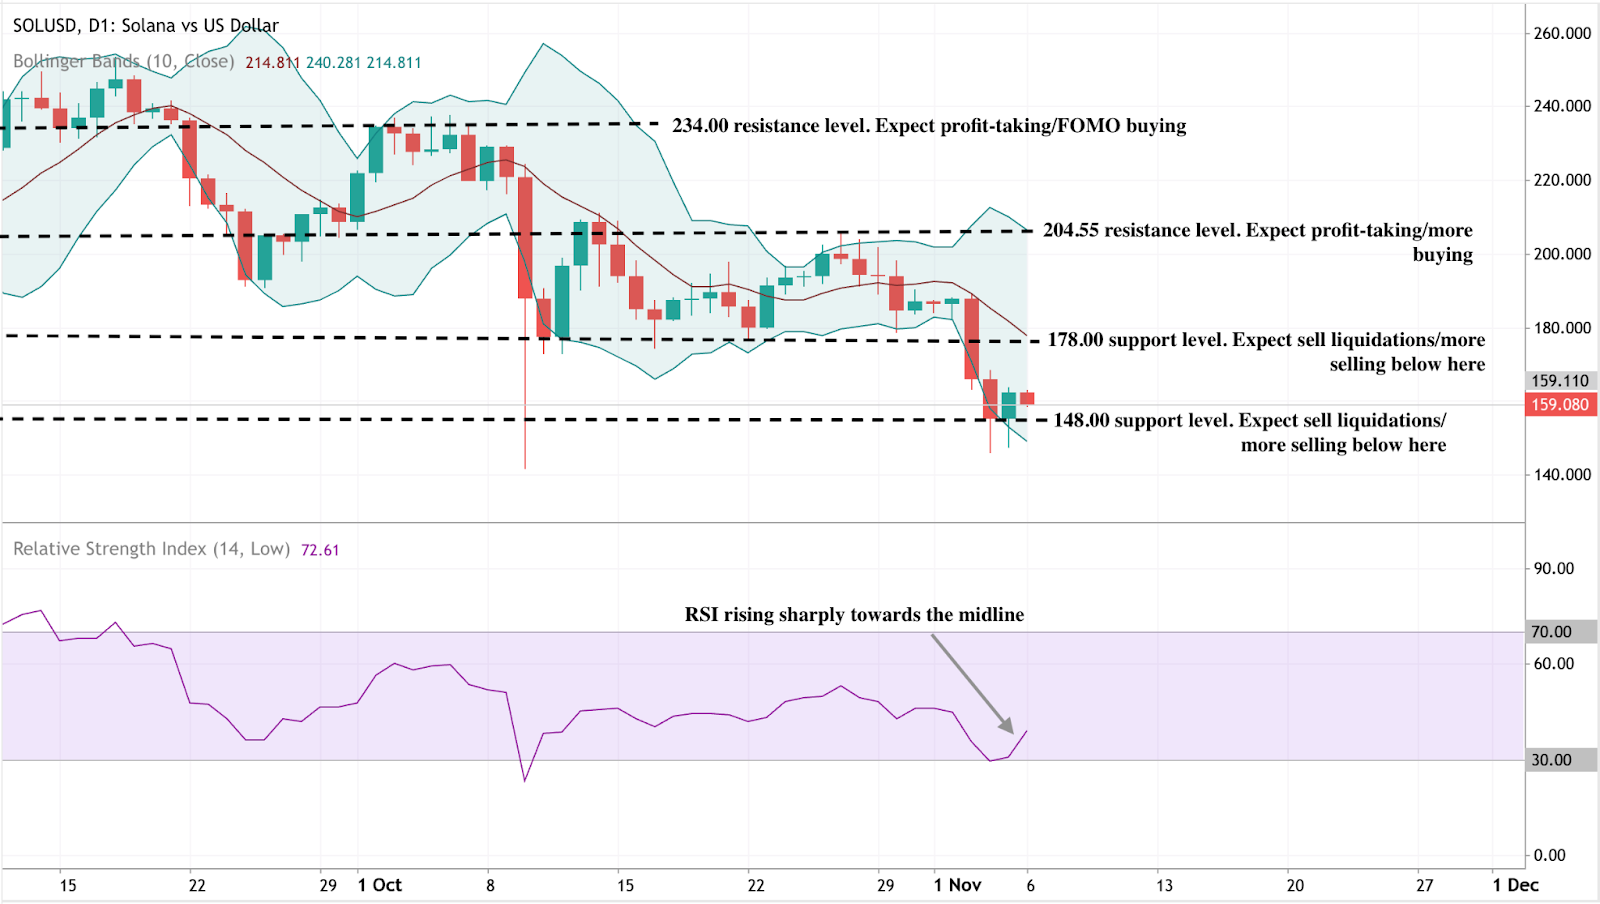
Solana is consolidating around $159 after bouncing from the $148 support, a key level where further sell-offs could accelerate if breached. The RSI at 72.6 is rising sharply towards the midline, signalling improving momentum and the potential for a short-term rebound.
The Bollinger Bands indicate that the price is hugging the lower band, suggesting oversold conditions with room for mean reversion if buying pressure strengthens. Immediate resistance lies at $178, followed by $204.55, where profit-taking is likely. A sustained break above $178 could signal a move towards $200–$210, while a failure to hold $148 risks a slide towards $135.
For traders interested in capitalising on such opportunities, Solana CFDs are available on Deriv MT5.
Solana price prediction and investment outlook
For portfolio managers, Solana’s transformation signals a gradual shift from a speculative token to an institutional-grade digital infrastructure.
- In the short term, price performance may remain tied to macroeconomic sentiment and ETF flows.
- Medium-term: The adoption of payment rails and DeFi applications could deepen liquidity.
- In the long term, continued integration with global finance and efficient network scaling may establish Solana as one of the few crypto assets offering both utility and institutional credibility.
In 2025, the real story is not the daily price chart - it is the quiet institutional infrastructure forming beneath it.

Ethereum price crash: Are we in a crypto winter or just a profit-taking phase?
Ethereum’s sharp fall below $3,500 looks less like the beginning of a crypto winter and more like a large-scale profit-taking reset.
Ethereum’s sharp fall below $3,500 looks less like the beginning of a crypto winter and more like a large-scale profit-taking reset. Data across on-chain, derivatives, and institutional flows suggest the market is undergoing a correction after months of aggressive gains, rather than entering a prolonged bearish cycle.
While retail traders and exchange-traded funds (ETFs) are showing fear, whales and institutional treasuries are using the pullback to accumulate - hinting that the current phase could set the foundation for a late-year recovery.
Key takeaways
- Ethereum trades at around $3,312, down 8.92% over the past month.
- Over $1.1 billion in leveraged positions were liquidated within 24 hours, as 303,000 traders were forced out.
- The Crypto Fear & Greed Index dropped to 20 (“Fear”), down from 59 (“Greed”) a month ago.
- Whale wallets added 1.64 million ETH (~$6.4 billion) in October, despite declining prices.
- The Fusaka hard fork upgrade scheduled for 3 December 2025 introduces PeerDAS, expected to cut Layer-2 fees by up to 95%.
- November has historically been Ethereum’s best-performing month, with an average return of +6.9% over the past eight years.
Crypto Market sentiment turns fearful
The Crypto Fear and Greed Index has plunged to 20, signaling widespread unease among investors.
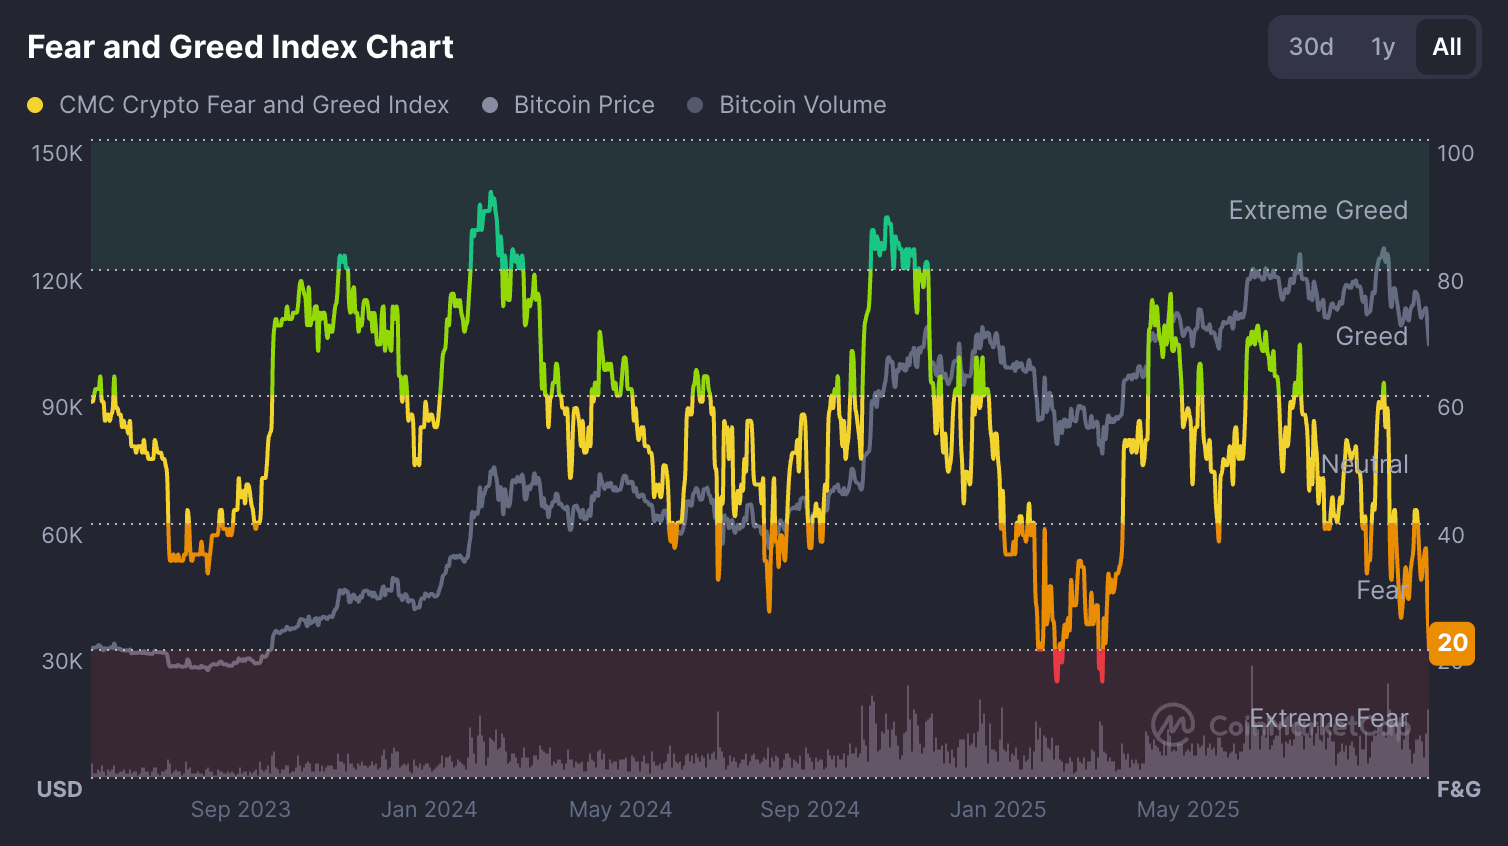
Just a month ago, readings above 50 showed moderate greed. The shift underscores a dramatic shift in sentiment as traders move from optimism to caution.
Across the broader market, nearly every major asset has turned red. Bitcoin fell 2.8% to $104,577, Solana dropped 11%, BNB lost 8.3%, XRP fell 6.7%, and Cardano slid 7.4% in the past 24 hours. The total cryptocurrency market cap has slipped 4% daily, erasing over $140 billion in value.
The macro backdrop compounds the pressure. The Federal Reserve’s uncertain rate outlook and a strengthening U.S. dollar are draining liquidity from risk assets - a dynamic often associated with crypto drawdowns.
ETH Whale accumulation intensifies while retail retreats
While fear dominates headlines, blockchain data reveals that the largest holders are quietly accumulating Ethereum. According to analytics firm Santiment, wallets holding between 1,000 and 100,000 ETH increased their balance from 99.28 million to 100.92 million ETH during the month of October.

This buying occurred even as Ethereum fell around 7% that month - a strong sign that institutional and high-net-worth investors view current prices as attractive entry points.
In contrast, long-term retail accumulation has slowed. Glassnode data show that the Holder Accumulation Ratio has declined from 31.27% to 30.45% since late October.
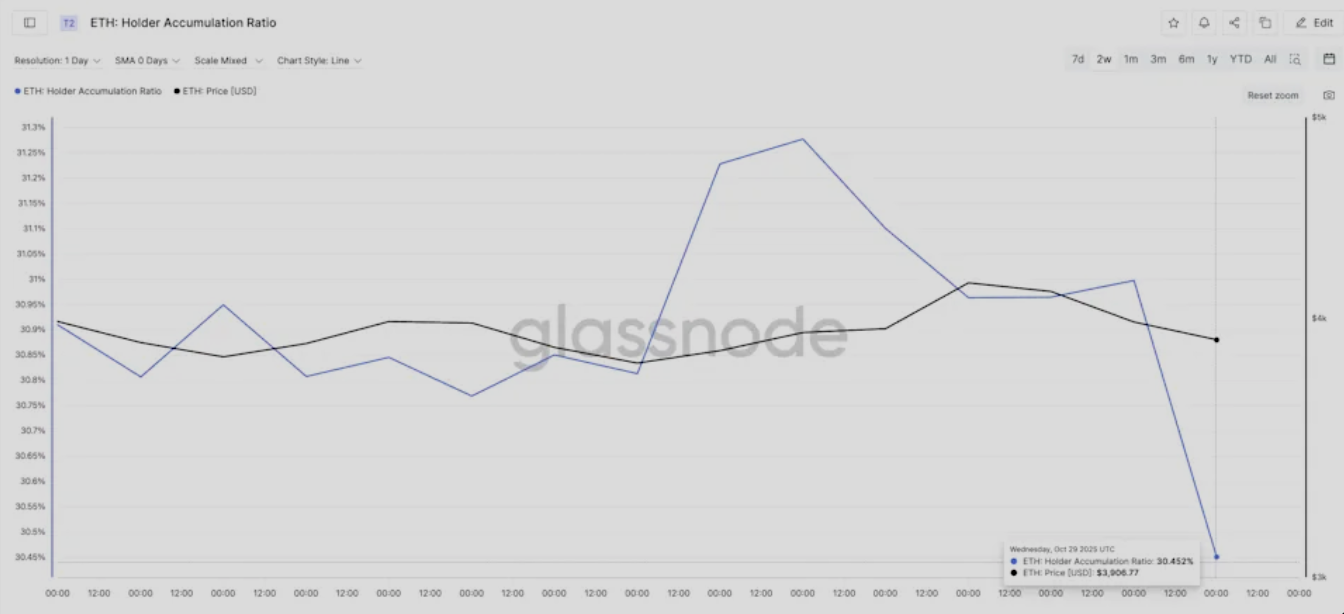
Retail investors are reducing exposure, waiting for clearer signals before re-entering. This divergence between whale buying and retail caution has become the defining feature of the current correction.
Institutional positioning: ETFs and treasuries diverge
Institutional flows paint a mixed picture. On the one hand, U.S. spot Ethereum ETFs experienced $135.76 million in outflows on 3 November.
- BlackRock’s ETHA: −$81.7 million
- Fidelity’s FETH: −$25.1 million
- Grayscale’s ETHE: −$15 million
These redemptions came alongside $186.5 million in Bitcoin ETF outflows, as institutional desks reduced exposure amid heightened volatility.
On the other hand, corporate treasuries are accumulating. Publicly traded BitMine Immersion Technologies (BMNR) added 82,353 ETH last week - worth roughly $294 million - bringing its total holdings to 3.39 million ETH, or 2.8% of Ethereum’s circulating supply. The company’s average purchase price stands around $3,909, suggesting confidence in long-term upside.
BMNR’s chairman, Tom Lee, told CNBC that the market is “consolidating after a reset,” adding that fundamentals such as stablecoin volume and application revenues are at all-time highs. Lee predicts a possible rally toward $7,000 for Ethereum before the end of the year, framing current conditions as a healthy correction rather than a crisis.
Liquidations reveal a market reset
The most dramatic signal of the correction came from the derivatives market. Data from Coinglass shows that over 303,000 traders were liquidated in just 24 hours, resulting in a total of $1.1 billion in forced positions. Within a single hour, more than $300 million was wiped out - $287 million of which were long positions.
This scale of liquidation reveals how over-leveraged bullish bets unraveled once prices broke below key support levels. Ethereum and Bitcoin accounted for the bulk of the wipeout, while high-beta altcoins like Solana and BNB saw even sharper declines.
The outcome is paradoxically constructive: leverage has been purged, funding rates have normalised, and open interest now reflects disciplined accumulation rather than speculative excess. Ethereum’s open interest remains high at $19.9 billion, but funding rates are flat - an equilibrium that often precedes a more stable recovery phase.
Fusaka upgrade offers long-term optimism
While short-term traders react to price volatility, developers are preparing for one of Ethereum’s most ambitious upgrades yet.
The Fusaka hard fork, confirmed for 3 December 2025, introduces Peer Data Availability Sampling (PeerDAS) - a technology that increases block capacity from 6 to 48 per block. This upgrade could reduce Layer-2 transaction fees by up to 95%, significantly improving scalability for DeFi and rollup networks.
Such infrastructure improvements strengthen Ethereum’s long-term competitiveness against alternative Layer-1 chains. With stablecoin transactions on Ethereum hitting $2.8 trillion in October, network fundamentals remain robust despite price turbulence.
Ethereum’s November historical pattern: a bullish bias
Seasonality may soon lend support. Over the past eight years, Ethereum has averaged a monthly return of +6.9 % in November. In 2024, it recorded a remarkable 47.4% rally, marking one of its strongest months ever.
The Net Unrealised Profit/Loss (NUPL) ratio - which measures the percentage of investors in profit - has fallen from 0.43 to 0.39, near the monthly low of 0.38 that last triggered a 13% rebound from $3,750 to $4,240.
This trend suggests selling pressure may be fading as investor incentives to take profits decline.
Macro context: profit-taking, not panic
Ethereum’s downturn mirrors the broader behavior of risk assets. After months of double-digit gains across cryptocurrencies, profit-taking has accelerated amid global liquidity concerns. The U.S. dollar index strengthened sharply, and Fed officials have hinted at slower rate cuts, encouraging investors to rotate out of speculative assets.
Unlike prior bear-market conditions, however, there is no collapse in network activity or developer engagement. DeFi revenue remains strong, stablecoin velocity is high, and whale inflows indicate rotation rather than retreat. The sell-off, therefore, aligns more with profit-locking behavior than the sustained capital flight that characterised the 2022–2023 crypto winter.
Traders on Deriv MT5 can track these shifts across multiple assets, from cryptocurrencies to forex, to gauge broader market sentiment in real-time.
Ethereum technical insights: Stabilisation vs. further weakness

Ethereum is currently trading near $3,313, rebounding after a sharp decline that tested the $3,745 support level. This zone has acted as a key area where sell liquidations intensified, but the recent bounce suggests early signs of buyer interest.
The Bollinger Bands have widened significantly, indicating elevated volatility, while price action remains near the lower band - typically a sign of short-term oversold conditions. A sustained close above the middle band could confirm a recovery in momentum.
Meanwhile, the Relative Strength Index (RSI) has risen sharply from 33, signaling improving bullish momentum after near-oversold readings. A further RSI move above 50 would reinforce a potential short-term reversal.
Resistance levels remain at $4,250 (where profit-taking and more buying may emerge) and $4,700, marking a stronger ceiling for any extended rally. Overall, ETH shows early signs of recovery but still faces strong resistance ahead.
The near-term outlook depends on whether ETF outflows stabilise and whether the whale accumulation trend continues through November. With fear levels elevated, contrarian traders are closely watching for a potential bottoming process similar to past mid-cycle corrections. The Deriv trading calculator can help traders assess potential profit and margin exposure before taking positions in such volatile environments.
Ethereum investment implications
For short-term traders, Ethereum’s setup suggests a high-volatility environment with tactical entry opportunities near the $3,500–$3,700 support range. Upside targets into December sit between $4,400 and $4,600, assuming sentiment stabilises and ETF outflows slow.
For medium-term investors, current levels represent an accumulation window. Whale buying, the Fusaka upgrade, and seasonal patterns point to improving fundamentals beneath the surface fear. Institutional participation is likely to return once macroeconomic uncertainty eases and on-chain stability confirms a bottom.
In essence, Ethereum’s decline is a market normalisation, not a meltdown. As leverage unwinds and fundamentals strengthen, the groundwork for the next leg higher may already be forming.
Spiacenti, non abbiamo trovato alcun risultato corrispondente a .
Suggerimenti per la ricerca:
- Controlla che l'ortografia sia corretta e riprova
- Prova con un'altra parola chiave