Results for

A practical guide to commodities trading on Deriv
Trade commodities on Deriv via CFDs for active trends or digital options for fixed-risk views on global energy and metals.
Commodities trading on Deriv gives retail traders cash-settled exposure to energy, metals, and softs without owning the underlying asset. In 2025, most clients choose between CFDs on Deriv MT5 or Deriv cTrader for actively managed positions, or digital options on Deriv Trader or SmartTrader for time-boxed, defined-risk views. This guide explains how each instrument works, when to use them, typical costs and risks, and practical setups for oil, gold, gas, and selected softs, helping you match your idea, time window, and risk limits to the right contract.
Quick summary
- Commodities like oil and gold move with supply and demand, geopolitics, rates, and inventories.
- Deriv offers CFDs for managed trades and digital options for defined-risk ideas.
- Options are often associated with time-based or level-based setups, while CFDs are typically linked to more flexible trade management.
- Risk control, position sizing, and awareness of market events are key to long-term consistency.
What is commodities trading on Deriv?
On Deriv, traders speculate on commodity prices through contracts for difference (CFDs) and digital options without owning physical assets. Any position is purely financial and settled according to the price movement of the underlying instrument. This makes it possible to engage with global markets even without direct access to commodity exchanges.
Commodities behave differently from equities or forex because their prices often respond quickly to real-world events: production changes, political decisions, adverse weather, or shifts in consumer demand. For beginners, Deriv’s platforms simplify access by focusing on price exposure rather than physical delivery, allowing traders to express their ideas while controlling the risk level.
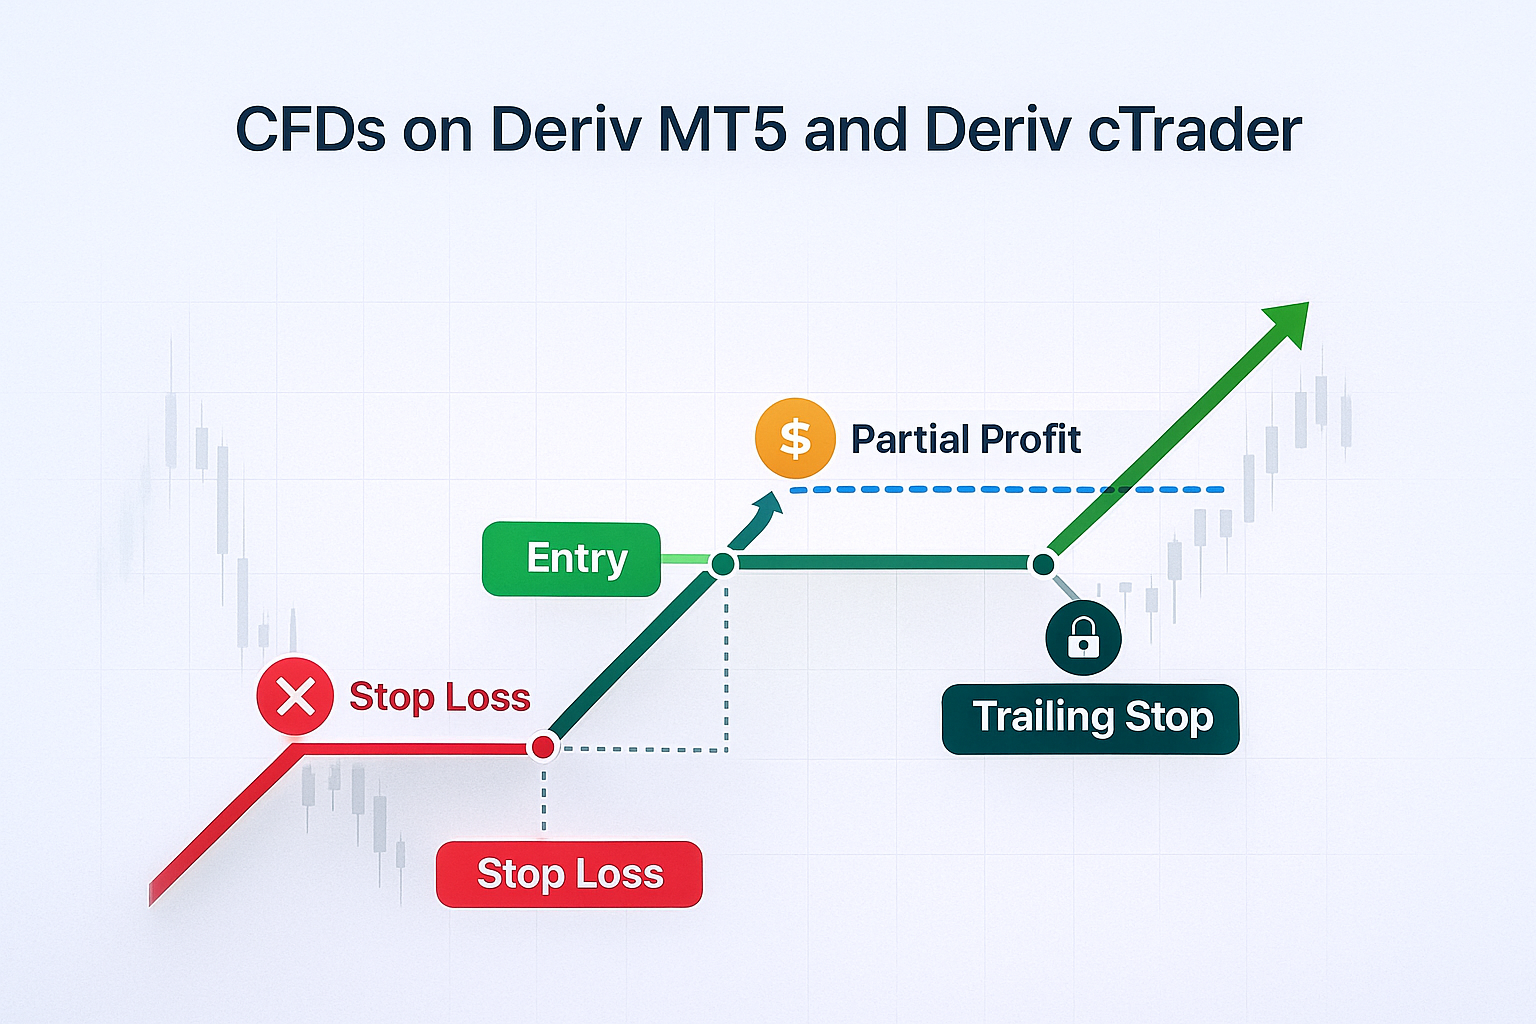
CFDs on Deriv MT5 and Deriv cTrader
CFDs allow traders to open Buy or Sell positions and manage them dynamically. This appeals to traders who want to fine-tune their execution, position size, and exit strategy. With CFDs, you can control exactly where your stop sits, take partial profits, and trail the remainder if the market continues in your favour.
CFDs mimic the ebb and flow of market structure, so they make sense when you want to capture multi-hour trends, trade pullbacks, or respond to emerging volatility. They also allow a high degree of precision — from scaling-in on confirmation to protecting profits with a carefully placed stop adjustment. However, this flexibility also carries responsibility, especially around leverage and overnight swap charges.
Digital options on Deriv Trader and SmartTrader
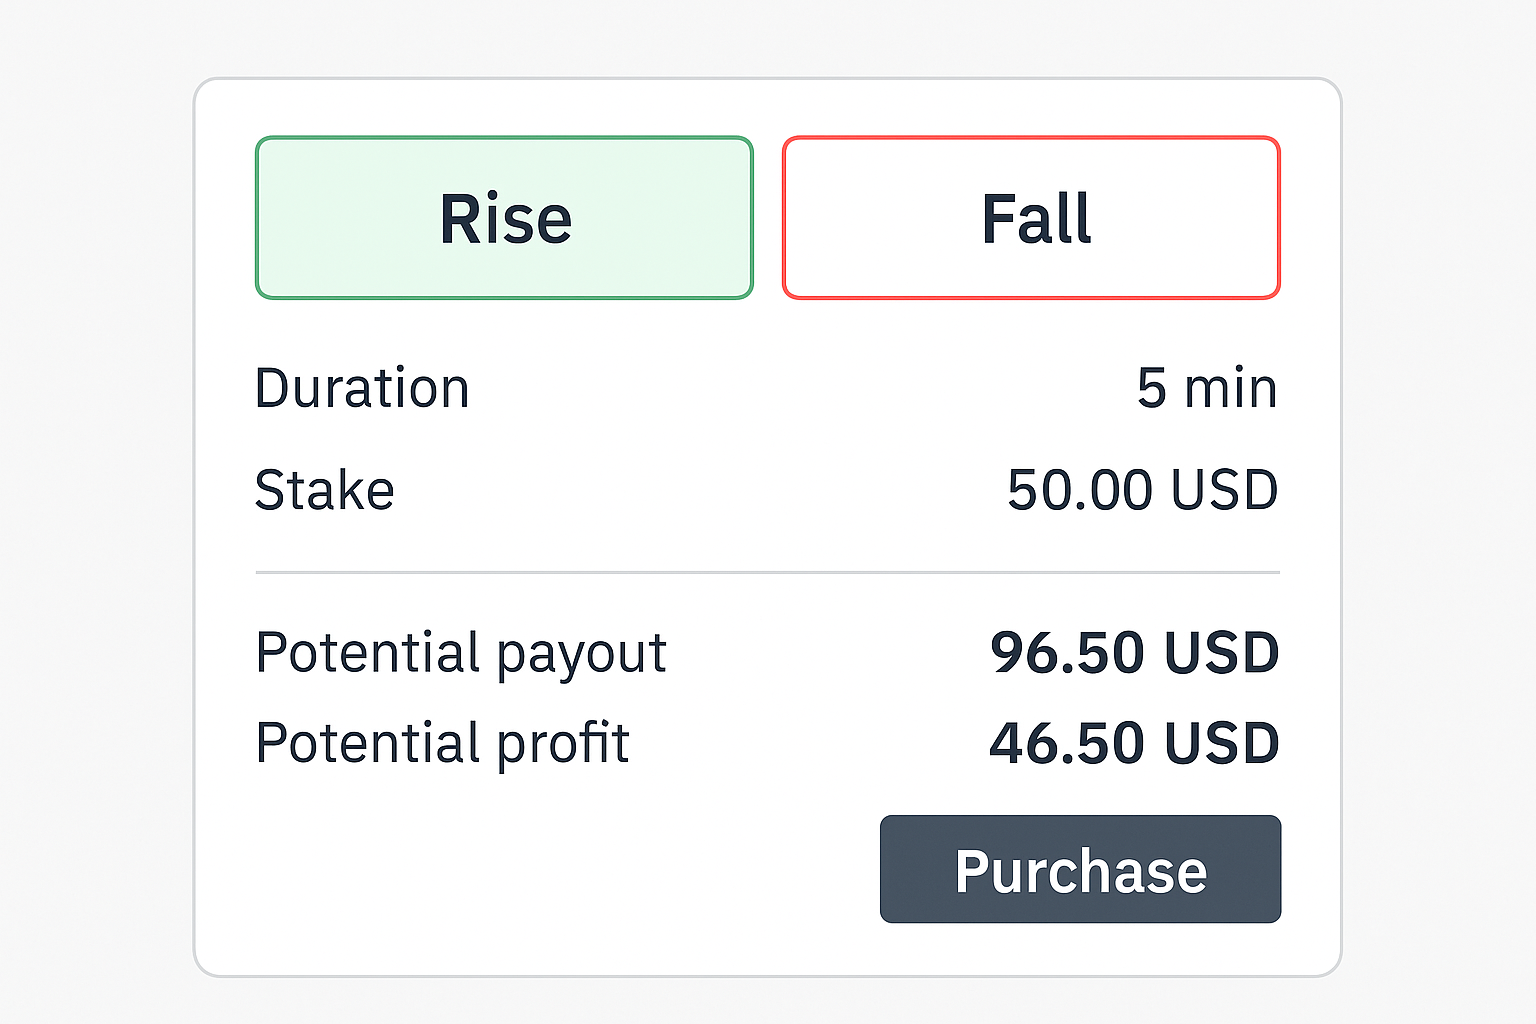
Digital options offer a very different experience. Each contract expresses a clear question: Will the market rise or fall? Will it finish above or below a level? Will it touch a specific price before time runs out? Because you decide your stake upfront, your maximum loss is fixed.
For many beginners, this structure reduces second-guessing. If you expect a short-term momentum burst or believe price will respect a level, you choose the relevant contract and let it play out. There is no need to manage stops or adjust positions during a trade. Options are especially useful around scheduled events where volatility might cause price spikes but you still want controlled risk.
How to choose between CFDs and options?
Instrument choice often comes down to whether your idea is mainly about direction over a short window, finishing relative to a level, whether a level is reached, or active trade management.
- Short-term direction (up or down) is commonly expressed with Rise/Fall.
- A view on finishing above or below a level is often expressed with Higher/Lower.
- A view on whether a specific level will be reached (or not) is often expressed with Touch/No Touch.
- Ideas that involve ongoing position management (for example, adjusting stops or taking partial profits) are typically handled with CFDs.
Thinking in this way helps you avoid forcing trades into unsuitable instruments. The clearer your question, the more naturally the instrument choice follows.
What are practical use cases for commodities trading?
Gold micro-trend (Options)
Gold often forms short-lived bursts of momentum when macro sentiment shifts. In these scenarios, price behaves cleanly for a few candles before settling back into a range. Rise options for 10–15 minutes lets you focus on capturing that precise window without worrying about stop placement. It’s a simple way to practise timing and to build a feel for momentum decay.
WTI pullback setup (CFDs)
Oil frequently retraces to minor support levels before continuing its trend. A CFD pullback strategy is common among pros because it allows placing a limit order where price is likely to pause, set a stop below the structure, and manage the position as the trend resumes. This structured approach trains discipline: you could take partial profits, protect the rest, and allow the market to decide how far the move extends.
Commodities Strategist from Independent Research elaborates:
“Energy markets react first to supply signals and only later to macro tone. Traders who monitor inventories and shipping flows tend to stay ahead of large moves.”
What market-specific guidance applies to commodities trading?
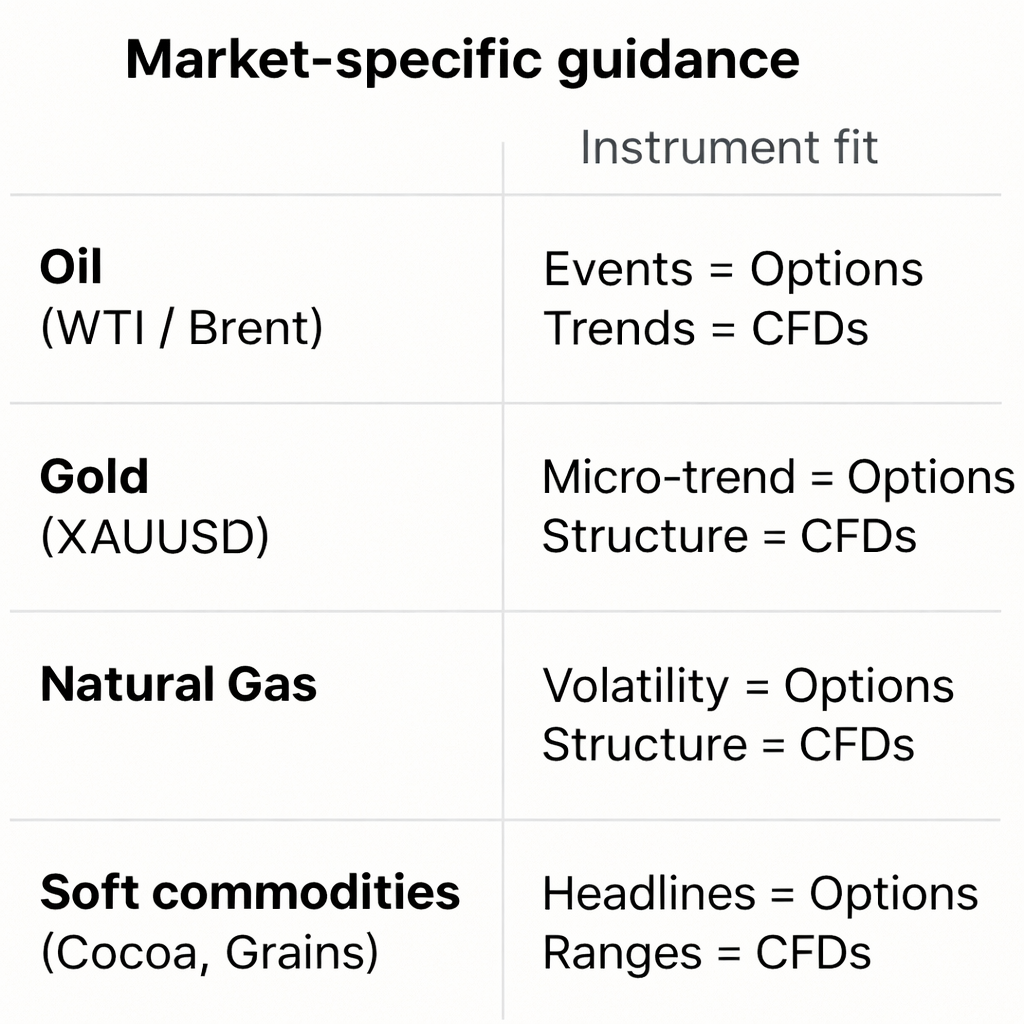
US Oil and UK Brent Oil
Oil reacts quickly to weekly inventory releases and OPEC+ announcements. During these events, options help you limit risk while expressing a directional or level-based idea. After the dust settles, CFDs become useful for capturing extended trends, especially during the London–US session overlap where liquidity improves.
Gold (XAUUSD)
Gold is sensitive to interest-rate expectations and USD movement. Short bursts of momentum fit Rise/Fall options well, while structured pullbacks in established trends are often better expressed through CFDs.
Natural gas
Natural gas can shift abruptly due to weather forecasts or storage data. When conditions become noisy or unpredictable, small-stake No Touch options keeps risk contained. CFDs is an alternative when structure is clear and volatility is manageable.
Soft commodities (cocoa, grains)
Softs respond heavily to weather patterns and regional supply issues. Options help keep risk controlled when headlines dominate, while CFDs is leveraged by traders on quieter intraday conditions with defined ranges.
Why does Deriv offer multiple commodities platforms?
Expert insight (Deriv): “Platforms aren’t interchangeable. MT5 and cTrader support structured risk management, while Trader and SmartTrader are built for precise, time-defined questions.” — Product Lead, Deriv Trading Platforms
Each platform has a purpose. MT5 and cTrader give you flexibility for CFD management: charting, indicators, pending orders, partials, and alerts. Trader and SmartTrader simplify options execution by focusing on direction, barrier, duration, and stake. Deriv Bot allows simple automation for rule-based setups, while Deriv GO keeps you aligned with your plan even when away from the desk.
What market drivers and expert context matter in commodities trading?
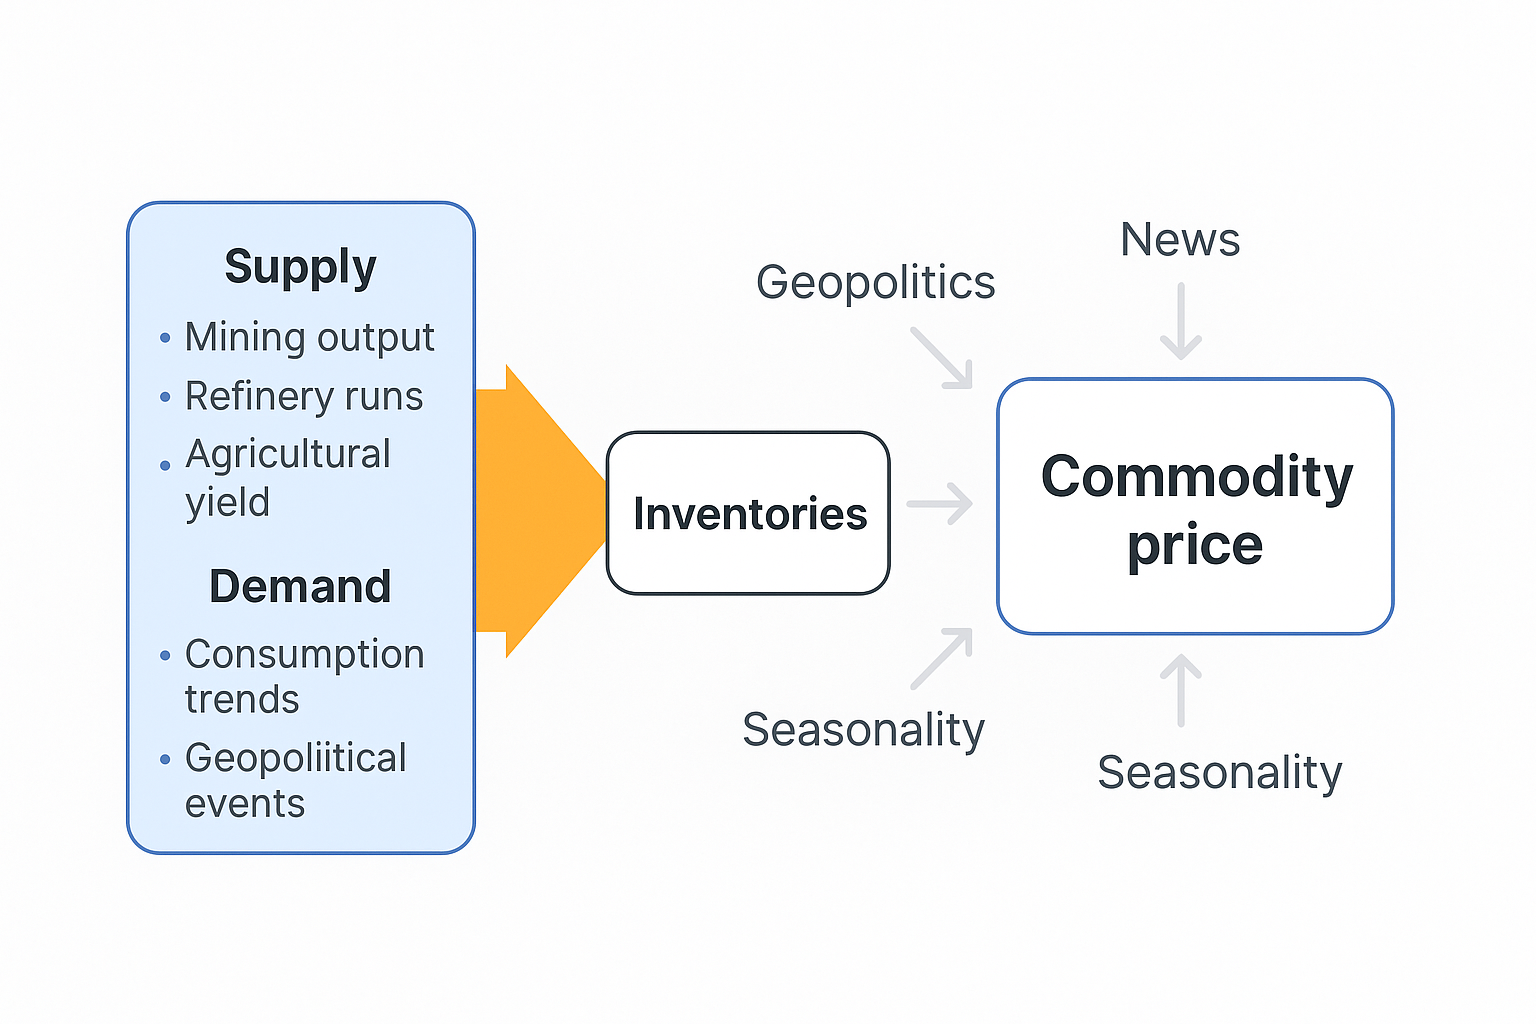
Commodities respond to a blend of fundamental and macro forces.
- Supply and demand: Inventory data, refinery runs, mining output, and consumption trends.
- Geopolitics: Conflict, sanctions, route blockages, and diplomatic shifts.
- Macro drivers: Interest-rate expectations, global growth, and currency strength.
- Seasonality: Winter energy demand, planting and harvest cycles, and weather anomalies.
- Agricultural supply: Drought, disease, and logistics disruptions can cause significant price swings.
Understanding how these factors interact helps you filter noise and size trades appropriately.
Senior Economist from Global Markets institute explains:
“Geopolitical shocks rarely move all commodities the same way. Understanding cross-market effects is essential for active traders.”
How do you improve steadily as a Deriv trader?
Improvement comes from combining fundamentals and technicals, trading one regime at a time, keeping risk rules constant, and recording each decision. Reviewing screenshots and notes builds pattern recognition, while cooldowns and loss caps prevent emotional spirals. Over time, your focus shifts from predicting markets to executing with discipline.
Deriv trading education team mentions:
“Consistency is the true edge. Smaller size, fixed rules, and weekly reviews outperform rapid strategy hopping every time.”
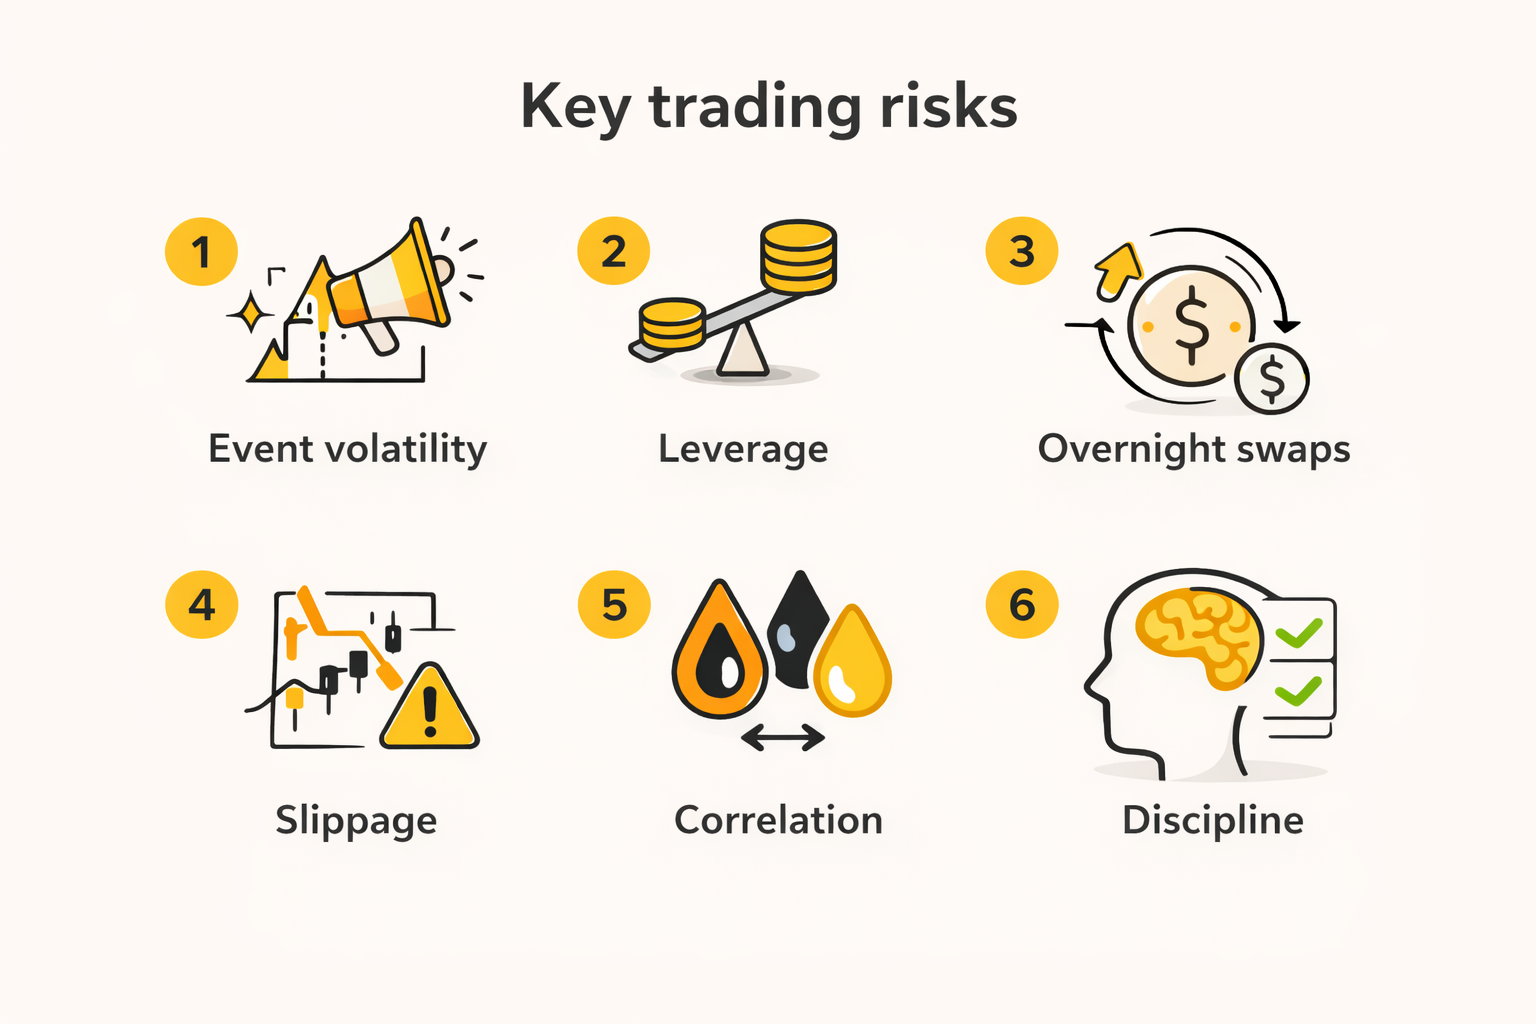
What are the key risks in commodities trading, and how do you manage them?
- Event volatility and gaps: Headlines and data releases can trigger sharp moves; some traders favour predefined-risk structures during these windows.
- Leverage and position size: Leverage amplifies outcomes; exposure is often measured against a stop distance and a maximum acceptable loss.
- Overnight swaps: Holding CFDs past rollover can add financing costs (or credits), which may affect outcomes over time.
- Slippage and execution: In fast or illiquid conditions, fills can differ from expected prices; order type and liquidity conditions matter.
- Correlation risk: Related commodities can move together, increasing concentration in a single theme (e.g., energy).
- Psychological discipline: Large swings can drive impulsive decisions; structured limits and routines can support consistency.
What are the takeaways and next steps?
Commodities on Deriv offer flexible ways to express market views. CFDs are known for structured trade management and digital options when you prefer defined risk and simpler questions. Start small on a demo account, build consistency, review your decisions, and scale gradually only when your process becomes repeatable.

Weekly market report – 28 Mar 2022
The weekly recovery of the US dollar failed to advance further north of the $99.00 mark over the weekend. Over the past few days, the US dollar index's (DXY) volatility was moderate, with prices attempting to consolidate around the $98.75 area.
Forex
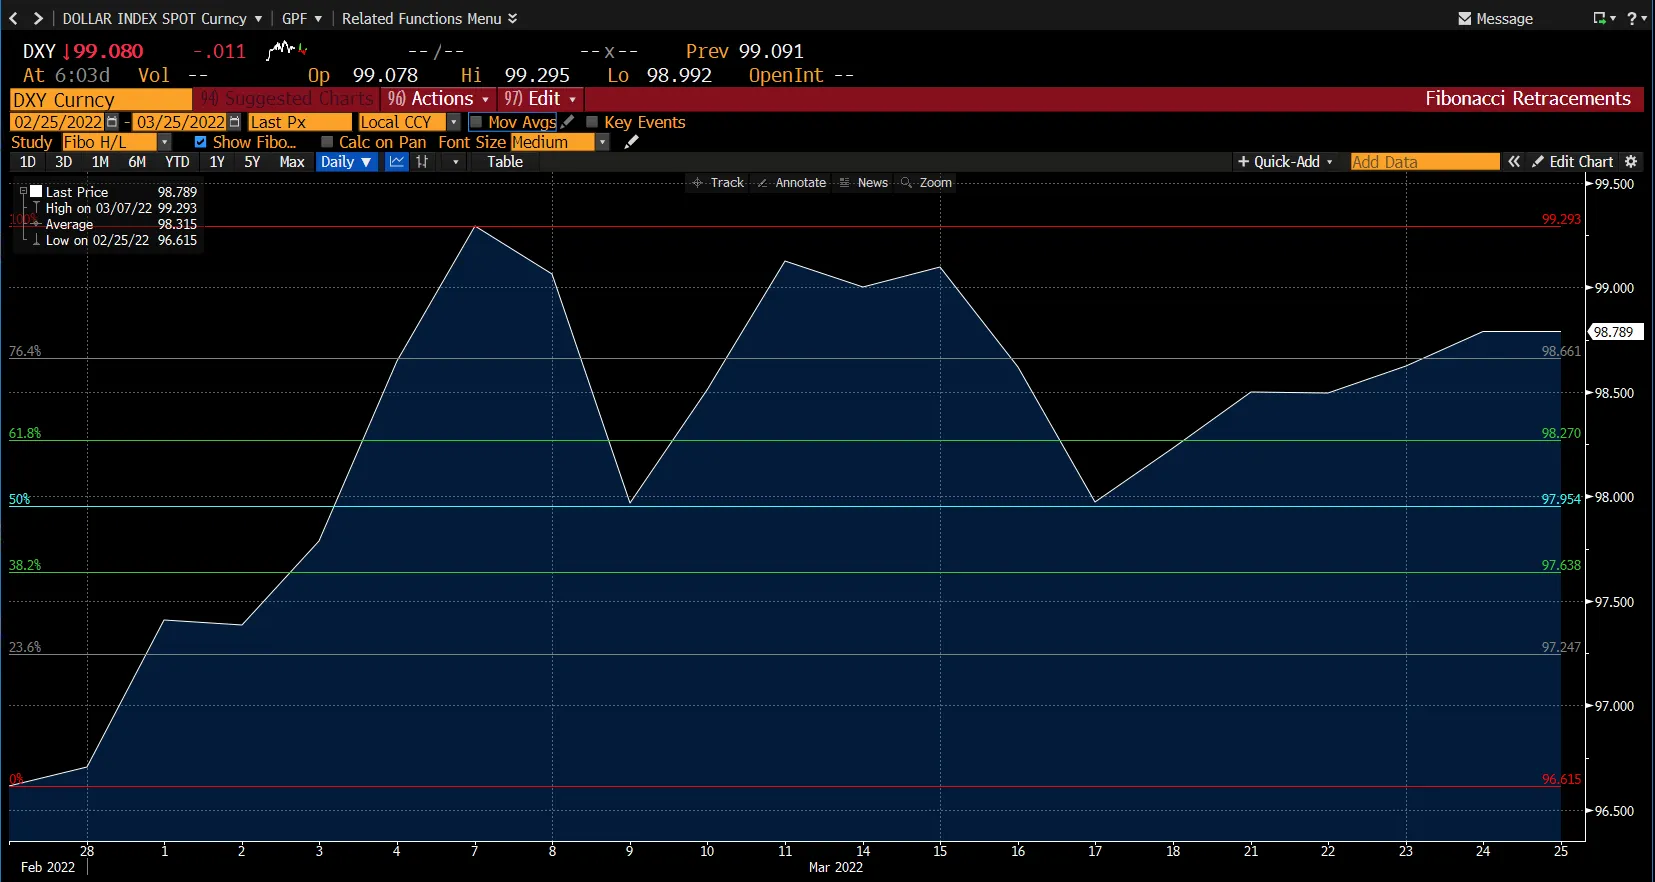
The weekly recovery of the US dollar failed to advance further north of the $99.00 mark over the weekend. Over the past few days, the US dollar index's (DXY) volatility was moderate, with prices attempting to consolidate around the $98.75 area. Concerns surrounding the geopolitical landscape are expected to keep propping up the demand for the US dollar, along with prospects of extra tightening by the Fed.
The 1-month chart above shows that the asset is currently trading over its support level at the 76.4% retracement level of $98.65, followed by a second support level at the 61.8% retracement level of $98.30 level. Since the start of March, the asset has held an upward trend and is trading under its resistance level at the $99.30 level.
How did other pairs react?
The ramping up of hawkish Fed comments continues to apply downward pressure on the EUR/USD, which was clinging to the $1.1000 level on Friday, 25 March 2022.
The British pound rebounded from its intraday losses but failed to reclaim the $1.3200 mark, due to factors like a risk-on market mood, Fed hawkishness, and the Bank of England's rate hike being perceived as a dovish increase. Technically speaking, on Friday, 25 March 2022, GBP/USD was trading at the $1.3180 level.
The USD/JPY pair has remained one of the top performers for traders and has been rallying after surpassing the level of ¥120.00 in the past few days. The Bank of Japan (BoJ) provided a bullish signal on Friday, 25 March 2022 and refrained from stepping into the markets to control the continuous rise in yields. In fact, even after the yield on the 10-year Japanese government bond (JGB) rose, the BoJ continued to buy an unlimited amount of bonds. Elevated US Treasury bond yields also attracted some USD dip-buying and further contributed to limiting the downside for the USD/JPY pair.
This week brings many high-impact US economic reports, including the February Personal Consumption Expenditure (PCE) data and the latest NFP figures. In light of the packed calendar, volatility is likely to pick up, setting the stage for large moves in the DXY index and financial markets in general.
Commodities

In the first half of the week, gold fluctuated above $1,920 within a relatively tight range but regained its momentum after crossing $1,950 on Thursday, 24 March 2022. Although the yellow metal struggled to maintain its bullish momentum due to the surge in US Treasury bond yields and FOMC policymakers indicating an aggressive policy tightening, it increased by around 1.16% on a weekly basis.
Traders are getting increasingly anxious about the global economic consequences of a prolonged Russia-Ukraine conflict. Moreover, an increase in international tensions could aid the yellow metal in limiting its losses and vice versa.
As seen in the chart above, the recovery from sub-$1,900 levels paused around a resistance marked by the 38.2% retracement levels. A following drop below the 23.6% retracement level around the $1,941 mark may have altered the bias in favour of pessimistic traders, implying that more losses are likely. On the flip side, if gold finds its momentum, the next resistance level could again be 38.2% retracement near the $1,966 mark and accelerate towards the next resistance level at 50% retracement around the $1,986 mark.
On the other hand, oil prices rose amid supply concerns as Houthi rebels attacked Saudi Arabia's energy assets and Russia maintained its military offensive in Ukraine. Oil ended at around $113 a barrel on Friday, 25 March 2022. Oil prices have also increased since global demand has outpaced crude production as economies recover from coronavirus.
Additionally, during a meeting with US President Joe Biden last week, EU members were split on whether or not to boycott Russian oil and gas. However, they failed to agree on a ban, and while refusing to agree to it may bring temporary relief, it does not alter the trend of rising demand and decreasing supply.
Cryptocurrencies

While the entire crypto market pumped higher, Bitcoin and Ethereum in particular spiked on Sunday, 27 March 2022, pushing through their recent price resistance levels. Bitcoin was up by 14% in the past week, and Ethereum was up by 15%. However, on Sunday, Bitcoin was trading above the $44,600 level, whereas Ethereum topped the $3,100 mark.
Several factors have contributed to the increase in the crypto space:
- The S&P 500 has risen for a week straight, and Bitcoin's correlation with stocks is at a 17-month high.
- Bitcoin balances on exchanges are also at their lowest in more than 3 years, signalling increased demand and an interest in moving Bitcoin off exchanges via cold storage methods like hardware wallets.
- Ukraine officially legalised cryptocurrencies and continued accepting donations (more than $100 million to date) in Bitcoin, Ethereum, Polkadot, and Dogecoin.
One of the best performing cryptocurrencies on the market was Terra (LUNA) which gained worldwide acclaim in light of its highly impressive price hike in the last 30 days. As a result, its management has announced plans to soon add nearly $10 billion worth of Bitcoin to its project's reserves. They believe this action would create a new monetary era for the global Bitcoin standard.
The chart above represents the upward trend in its prices since the beginning of March. The asset ended the week trading right in between its resistance at the 76.4% level of $92.50 and its support at the 61.9% level at $88.70.
Altcoins have been a preferred pick over the past week, but none more than Cardano (ADA). This Ethereum competitor had a rough go of it when it introduced smart contracts in 2021; the founder Charles Hoskinson said earlier this week that he was wrong about how quickly the network would accrue decentralised apps (dapps). That slow adoption stunted ADA in the initial months of 2022. However, things are now turning around, and today, the network hosts hundreds of dapps and millions of native NFTs.
The UK government will soon reveal plans to regulate the cryptocurrency market, focusing on a fast-growing type of token known as stablecoins. Stablecoins have seen exponential growth in terms of usage over the past few years, in tandem with rising interest in cryptocurrencies more broadly.
US Indices
.webp)
*Net change and net change % are based on the weekly closing price change from Monday to Friday.
The S&P 500 and NASDAQ 100 both gained 1.84% and 2.63% last week, respectively, while the Dow gained 0.89%. Despite falling far short of the previous week's surge, the results marked the second positive week in a row for stocks amid growing expectations of steep interest-rate increases ahead.
Concerns about the Federal Reserve's increasingly hawkish stance weighed on equity sentiment early in the week, prompting a bond market sell-off. The sharp year-to-date decline in bond prices accelerated, sending the 10-year US Treasury bond yield to levels not seen since May 2019. The 10-year yield jumped to 2.49% on Friday, 25 March 2022, after finishing the previous week at 2.15%.
Additionally, the housing industry in the United States received some bad news ahead of the often bustling spring home-buying season, as pending house sales fell for the fourth month in a row, according to a study released on Friday, 25 March 2022. Compared to the previous month, pending sales declined by 4.1% in February – a drop that coincided with the recent climb in mortgage rates.
The monthly labour market update will be released this week in the United States and reveal whether the strong growth seen in February continued into March. February's report showed that the economy added 678,000 jobs, the highest in seven months, and the unemployment rate dropped to 3.8%.
Trade the financial markets with options and multipliers on Deriv Trader or CFDs on Deriv X Financial account and Deriv MT5 Financial and Financial STP accounts.

How to avoid trading scams
Trading scams are more common than people think. That’s why it’s crucial to be familiar with the different types of trading hoaxes out there and learn to distinguish the real from the fake. Here are a few tips from us.
Trading scams are more common than people think. That’s why it’s crucial to be familiar with the different types of trading hoaxes out there and learn to distinguish the real from the fake. Here are a few tips from us.
Common types of trading scams
The signal seller scam
This is one of the most common types of scams in online trading. A signal seller will offer a system that allegedly signals favourable trades with guaranteed profits for a fee. After a trader has paid the fees, these fake signal sellers usually disappear with the money, or they might offer false signals that only profits the broker.
The good news is that legitimate signal providers do exist. They will not promise guaranteed returns and might have independently audited records that are easy to find with some research.
The pump & dump scam
This happens when scammers spread false news to boost the value of certain assets (pump), resulting in huge buys and an inevitable increase in their value. When this happens, scammers will sell their assets (dump) and rake in the profits while traders are left to deal with the crash.
Other scams
Other online trading scams are brought about by high yield investment programs, false bots for traders, and other schemes that promise traders high returns.
Identifying legitimate brokers
With all the scammers on the online market, we need to take every precaution to avoid falling in their trap. So how do you distinguish genuine online trading platforms? Here are our recommendations:
They are generally regulated
Always make sure that the trading platform and broker is regulated. There are various regulatory bodies that monitor online trading brokers to protect traders. Unregulated brokers do not have to comply with any rules, which means you risk being unprotected from any possible misconduct by the broker.
They verify your identity
All regulated trading brokers make it compulsory for traders to verify their personal information before trading. This is required to comply with the laws and regulations set out by the regulatory bodies. Traders typically undergo a strict verification process to authenticate their identity — this is known as a KYC (know your customer) procedure, and it varies from country to country.
To ensure this isn’t another scam to collect your personal information, find out everything you can about a broker to determine its legitimacy and to know who exactly is collecting your information.
They have a proven track record
Make sure you do your research on a broker's reputation. Check reviews, look at what other traders are talking about in trading forums, and find out everything you can about a broker before trading.
They are not “too good to be true”
If a platform’s or broker’s promises of high returns or consistent profits seem too good to be true, they usually are. Trust your instincts, and don’t fall for flashy advertisements. Legitimate trading platforms never promise high profits. Remember — in trading, nothing is guaranteed.
They have reliable customer support
Genuine trading platforms and brokers will always be ready to answer your questions and help resolve any issue you may have. Plus, they will provide proper and practical ways for you to contact them.
---
After you’ve identified a legitimate broker to trade with, check out our top 3 tips on how to be a smart trader, and find out why you should start your trading journey with a demo account.
Deriv is fully licensed and regulated by the Malta Financial Services Authority (MFSA), Vanuatu Financial Services Commission, British Virgin Islands Financial Services Commission, and Labuan Financial Services Authority. For complete regulatory information, visit deriv.com/regulatory.

Weekly market report – 11 Apr 2022
The US dollar index advanced to $100 for the first time in nearly 2 years, reaching as high as $100.19 – its best level since May 2020.
Forex

The US dollar index advanced to $100 for the first time in nearly 2 years, reaching as high as $100.19 – its best level since May 2020.
The main driver of the USD’s strength was Fed hawkishness. The Federal Reserve March meeting minutes on Wednesday, 6 April 2022, resulted in an interest rate hike of 25-bps. However, the minutes showed strong support for getting rates back up quickly, supporting market expectations that the Fed will lift rates in 50-bps intervals at upcoming meetings.
During the trading week, the Euro dropped significantly, reaching the $1.0850 level. The main reason for this fall was the interest rate differences between the bond markets of the European Union and the United States, which continue to put downward pressure on the Euro.
However, the pair continues to be one that cannot find a reason to go up, and beyond the interest rate difference, there are a lot of other reasons to think that the Euro is going to struggle. The European Union is almost certainly going to go into a recession, as the energy issues alone are going to cause problems. Moreover, Germany reduced their economic growth forecast for 2022 from 4.6% to 1.8%, due to geopolitical risks in France with the French presidential election, and the war in Ukraine.
Meanwhile, the ECB President will face a particularly challenging meeting next week as she aims to strike a balance between dampening inflation while supporting a weak growth outlook. This comes at a time when other major central banks are already tightening monetary policies and are prepared to hike interest rates in ever-increasing increments.
As shown in the chart as well, EUR/USD had a downward trend for the week touching its lowest point on Friday, 8 April 2022, below the $1.085 mark. However, the pair showed a small upward movement and is currently at around $1.0877 just near its 5-day moving average.
During the early session on Friday, 8 April 2022, GBP/USD hit its lowest level since November 2020 at $1.29820, due to the strengthening of the US dollar. However, the currency pair did rebound to the $1.3030 level by the end of the trading day, posting a weekly loss of about 0.6%. The price movement this week was not heavily influenced by UK factors. This is because the upside of GBP is currently being limited by expectations that the Bank of England (BoE) will turn more dovish in its next meeting. In the coming week, GBP/USD traders will be focused on the results of the UK Consumer Price Index, US Consumer Price Index and US Producer Price Index, which are to be published this Tuesday and Wednesday.
USD/JPY ended last week in the green at ¥124.34. Strong US data and the Japanese government bond’s limited upside to defend its 0.25% yield target helped the pair rise. It will be interesting to see how the incoming geopolitical headlines drive risk sentiment and demand for the safe-haven JPY.
Commodities

For most of the week, gold against the US dollar was unable to make a decisive move in either direction. Despite broad-based dollar strength and a sharp increase in US Treasury bond yields, gold managed to hold its ground on safe-haven flows, closing in the upper half of its weekly range above $1,940.
Furthermore, gold against the Euro rose by nearly 1.65% this week (based on the difference between Monday’s close and Friday’s close), indicating that the metal was able to capture some of the capital flowing out of the Euro as well.
As per the hourly chart for the week above, gold against the US dollar rose in the first 2 days of the week and surpassed the $1,940 mark only to fall towards the end of the second day, below the $1,925 mark and stay around it. As days passed by, we noticed an upward trend for the same and it ended the week at around the $1,947 mark which is above the 5-day moving average of $1,944 that is acting as the current support level for the week.
This week, the US Bureau of Labor Statistics will release the Consumer Price Index (CPI) data on Tuesday, April 12, 2022. CPI is expected to rise to a new multi-decade high of 8.3% in March, up from 7.9% in February. A stronger-than-expected CPI could increase the likelihood of 2 consecutive 50-basis-point Fed rate hikes, pushing US T-bond yields even higher, and vice versa. On Thursday, April 14, 2022, the European Central Bank (ECB) will announce its monetary policy decisions. The bank is widely expected to maintain its current policy settings, but a hawkish shift in forward guidance could pave the way for a decisive recovery in EUR/USD and weigh on the US dollar. In that case, the XAU/USD pair should be able to rise. On the other hand, the bank could become more cautious, focusing on the potential negative impact of a protracted Russia-Ukraine conflict on economic activity rather than inflation. In such a case, the EUR/USD could face bearish pressure, making it difficult for gold against the US dollar to gain traction.
Oil, on the other hand, fell for the second week in a row as a result of multiple countries announcing their strategic reserve releases. Another reason for oil’s uncertain position is the European allies who rely heavily on Russian oil and are still unsure of how or whether to sanction the Kremlin. Furthermore, the expansion of COVID lockdowns in China, particularly in Shanghai, has also contributed to the bearish trend. However, it remains to be seen how long it will take for disruption fears to resurface.
Cryptocurrencies

Last week, cryptocurrencies traded on a downward trend, mirroring the movements of the US equity markets. The price of Bitcoin declined by 8% from Monday through to Friday, reflecting a net change of almost $3,500.
Some major altcoins also followed suit, with Ether and Binance coin losing 9.3% and 5.8%, respectively.
The world’s largest cryptocurrency was trading close to $42,815 by Friday’s close, reverting from previous highs that were above $46,000 earlier in the week. At the time of writing, Bitcoin is trading close to $43,135, slightly below its primary resistance level of $43,316 at the 23.6% retracement level.
Whilst Bitcoin has recovered a portion of its last week’s losses, the digital asset is searching for the momentum to clear its initial resistance level. If the crypto can rally, its new primary resistance will move to the $44,012 level. On the downside, Bitcoin finds initial support at $42,192.
In other crypto-related news, Facebook’s parent company, Meta is continuing to explore its own version of digital money, internally referred to as “Zuck Bucks”, as reported by The Financial Times.
The company abandoned its efforts to create a global cryptocurrency – first known as Libra and later rebranded as Diem – following a heated backlash from regulators, worldwide. Meta’s digital currency efforts are still in its initial stages and could easily be changed or dropped. However, its plans to integrate NFTs into its apps are coming closer to fruition.
US Index
.webp)
*Net change and net change % are based on the weekly closing price change from Monday to Friday.
Stocks closed in the red last week as traders weighed up yet another rise in bond yields along with future expectations for the Federal Reserve's next policy move.
The Dow Jones Industrial Average shed 200 points to close -0.57% lower. Meanwhile, the S&P 500 declined by 94 points, equalling a -2% drop. The tech-heavy Nasdaq Composite took the largest hit, plummeting by 832 points to end -5.5% lower.
Markets struggled as US treasury yields continued to spike late last week. On Friday 8 April 2022, the benchmark US treasury note climbed to its 3-year high of 2.77%. Higher treasury yields helped in pulling down the Nasdaq Composite, as technology stocks, in particular, are sensitive to a rise in yields.
It was a positive week for pharmaceuticals, with Pfizer gaining 8.56%. Traders rushed to reliable revenue stream pharmaceuticals as a safe bet against economic and political turmoil, pushing healthcare stocks to record highs last week.
Fresh commentary from Federal Reserve officials was also in focus but appeared to offer mixed signals. James Bullard, St. Louis Fed President shared his thoughts on bringing the Fed Funds rate between 3% – 3.25% by the second half of 2022, implying more aggressive short-term hikes. Meanwhile, Atlanta Fed President, Raphael Bostic, stated that it would be better to move the benchmark rate “closer to a neutral position”.
This week, traders will be eyeing the release of some fresh earnings reports and amongst the big names of the investment banking world Goldman Sachs, J.P Morgan, Citigroup and Morgan Stanely will appear on the list.
The markets are also set for the release of fresh economic data, including the latest US retail sales figures, initial jobless claims, business inventories and the monthly consumer sentiment report from the University of Michigan.
Trade the financial markets with options and multipliers on Deriv Trader or CFDs on Deriv X Financial account and Deriv MT5 Financial and Financial STP accounts.

Weekly market report – 18 Apr 2022
The EUR/USD pair plummeted for the second week in a row, hitting a new two-year low of $1.0758 before settling a few points over $1.0800. The key bearish catalyst was that the European Central Bank announced President Christine Lagarde would make no adjustments to their monetary policy.
Forex

The EUR/USD pair plummeted for the second week in a row, hitting a new two-year low of $1.0758 before settling a few points over $1.0800. The key bearish catalyst was that the European Central Bank announced President Christine Lagarde would make no adjustments to their monetary policy. On the other hand, US Federal Reserve officials continue to expect a 50 bps hike in May 2022, paving the way for a balance-sheet reduction. As a result, the imbalance between the two central banks will almost certainly continue to weigh on the EUR/USD.
Meanwhile, GBP/USD recovered earlier in the week after falling to its lowest level since November 2020 – $1.2974. Although broad-based US dollar strength prevented GBP/USD from gaining further bullish momentum in the second half of the week, the pair ended the week above $1.3050, snapping its two-week losing streak.
As measured by the Consumer Price Index (CPI), the annual inflation in the United States jumped to a new four-decade high of 8.5% in March, comparing to 7.9% in February, according to the US Bureau of Labor Statistics. According to the report's additional details, the Core CPI, which excludes volatile food and energy prices, increased from 6.4% to 6.5% in the same period, compared to the market expectation of 6.6%. Although the initial market reaction to the US inflation report weakened the US dollar, hawkish Fed commentary triggered a rally in US T-bond yields late on Tuesday, 12 April 2022.
Whereas in the UK, the annual CPI rose from 6.2% in February to 7% in March, exceeding analysts' expectations of 6.7%. Despite the hot UK inflation data, GBP/USD struggled to gain traction until the US dollar came under heavy selling pressure amid falling US yields during the US trading hours on Wednesday, 13 April 2022.
GBP/USD extended its recovery to a new nine-day high of $1.3150 in the early European session on Thursday, 14 April 2022, after rising more than 100 pips on Wednesday, 13 April 2022. However, with the European Central Bank (ECB) maintaining its policy settings, the greenback regained its strength, forcing the GBP/USD to fall.
As per the hourly chart for the week seen above, GBP/USD had been moving around $1.300 (the psychological mark). However, due to heavy selling of the US dollar on Wednesday, 13 April 2022, the pair picked up and stayed alongside but could not sustain itself further. As of Thursday, 14 April 2022, the pair ended at around $1.3071 above the 50% retracement level near the $1.306 mark. If the pair continues to find its momentum, its next resistance level would be at a 61.8% retracement level, approximately at $1.3081. But if the pair spirals down, then the next support level would be at the 38.2% retracement level near $1.304.
The USD/JPY reached a high of ¥126.32 in Friday's holiday-shortened market, capping a 0.41% (close over close) gain for the week. Inflation-boosted US Treasury yields, combined with the risks of a stalled but still dangerous Ukraine war and the Bank of Japan's (BoJ) seemingly permanent liquidity policy, have created a near-ideal environment for the greenback against the yen.
In the coming week, there will be no high-level data releases. However, the focus will be on the Bank of England (BoE) and the Federal Reserve. The BoE has a more difficult balancing act than the US Federal Reserve in terms of policy tightening. Both central banks are battling inflation, but the BoE is growing increasingly anxious about the growth outlook in the context of a protracted Russia-Ukraine conflict.
Commodities

Safe-haven asset, gold saw a weekly gain. Due to the Ukraine crisis and mounting inflation, traders preferred the precious metal to park their funds on the long Easter weekend.
Gold's prices rallied for 6 days in a row until the yellow metal eased off on Thursday, 14 April 2022. The momentum came after the US dollar strengthened and yields rose as traders geared up for US interest rate hikes. However, the bullion kept on track for its weekly gain and ended the trading week above the $1,970 level.
As per the hourly chart, gold started the week at around $1,948 and ended at around the $1,974 mark. We see an upward trend for the week, with the price ending just above the 5-day moving average at around $1,792. Even though we see a few spikes on the downside, gold maintained enough traction to post gains for the week.
Gold still maintains a strong and strengthening demand as a hedge against inflation despite the expectation that the Fed will continue to raise rates aggressively to combat detrimental price pressures through the end of 2022 and beyond.
In the oil market, prices rose by approximately 10%, with the instrument closing the week at the $106 level as traders weighed news of a possible European ban on Russian oil imports.
However, on Thursday, 14 April 2022, the trading conditions for the global oil markets were fairly thin ahead of the long weekend in the major North American and European markets due to the tightening global supply. Last week, the EU took its first steps in response to the war on Ukraine by banning Russian energy imports and agreed to stop coal imports completely, starting later this year.
Recent news from IEA members on the release of 240M barrels of crude oil reserves over the next 6 months has dampened expectations for a return to last month's $120 levels. Additionally, if the US and Iran reach an agreement on easing sanctions, more than 1M barrels per day in Iranian supply may return to the market.
In the upcoming months, market conditions are expected to remain tight as global oil markets adjust to significant disruptions in Russian exports due to sanctions over the country's invasion of Ukraine.
Make the most of these market opportunities by sharpening your trading strategy and trade the financial markets with options and multipliers on DTrader.
Cryptocurrencies

Bitcoin traded on a marginal uptrend during last week, by starting the week at $39,846.47 and trading at $40,273.09 at Sunday’s close, marking a 1.07 % increase.
At the time of writing, the largest cryptocurrency in the world was trading at $40,277.39, close to its primary resistance level of $40,605.51 at the 38.2% retracement level. If it breaks through that level, its primary resistance will shift to $41,007.73 at the 50% retracement level. While Bitcoin saw some volatility during the first half of the week, it traded sideways for the latter part. However, Bitcoin has stuck to its overall decline since the beginning of April.
Altcoins such as Ethereum, Binance coin and Dash have replicated Bitcoin’s trend, having hit a peak midweek and declining ever since, to finish the week slightly higher than they started on Monday, 11 April 2022. Ethereum, Binance coin and Dash experienced nearly a 0.3%, 3.6% and 4.2% increase, respectively.
Doge experienced the ‘Musk-effect’ when Elon Musk, the newly established largest shareholder of Twitter, urged Doge as one of the payment options for Twitter Blue, resulting in an 8% increase midweek.
Cryptocurrency, in general, has been on the decline since the start of the month. However, trader sentiment is that a reversal in the trend is imminent.
Cryptocurrency has been a hot topic during the previous week and leaders of major cryptocurrency companies have expressed that regulators have started to look at digital currencies positively. For instance, the UK government announced that it would introduce stablecoins to track existing currencies' prices. Additionally, the US President signed an executive order advocating the coordination across governments for digital assets.
In other crypto-related news, the Wikipedia community, on Tuesday, 12 April 2022, voted against all cryptocurrency donations to the platform, owing to its environmental impact. Also, in an interview with CNBC on Thursday, 14 April 2022, the Amazon CEO said that the e-commerce giant does not have plans to add cryptocurrency as a payment option soon.
US Indices
.webp)
*Net change and net change % are based on the weekly closing price change from Monday to Friday.
It was a short trading week with the markets closed for Good Friday. All the major US stock indices closed lower on Thursday, 14 April 2022, capping off a losing week as traders took in a mixed set of earnings reports and rising inflation figures.
The Dow Jones Industrial Average closed the short trading week 0.42% higher at 34,541. Meanwhile, the S&P 500 closed at 4,394, ending the week down by 0.45%. The tech-heavy Nasdaq 100 declined by 0.7% to finish around 13,893 for the week.
Stocks retreated as fresh inflation data took hold of traders’ thoughts last week. On Tuesday, 12 April 2022, the March Consumer Price Index (CPI) showed an 8.5% increase for the month.
Supplier prices have also risen above expectations. The Purchasing Price Index (PPI), which measures prices paid by wholesale suppliers, gained 11.2% from a year ago, marking its hottest yearly increase since November 2010. Meanwhile, Jobless Claims rose to 185,000 for the week ending on 9 April 2022.
As traders assessed rising inflationary pressures last week, treasury yields climbed to multi-year highs. On Thursday, 14 April 2022, the benchmark 10-year note climbed by 13-basis points to reach above 2.8%.
Both inflation fears and rising bond yields drove down technology shares late last week, as traders prioritised stable assets over high-risk growth stocks. For the week, Microsoft declined by 6.8%, Google slipped by 6.5%, and Apple tumbled by 3.7%.
Now that you’re up-to-date on how the financial markets performed last week, you can improve your strategy and trade CFDs on Deriv X Financial account and Deriv MT5 Financial and Financial STP accounts.

Deriv’s trading API: Your solution to personalised trading
We use an API on a daily basis without even realising it. For example, every time you click the 'Continue with Facebook' button to log in to an app, API gets involved.
We use an API on a daily basis without even realising it. For example, every time you click the 'Continue with Facebook' button to log in to an app, API gets involved. A weather app on your phone works with the help of API as well. And even online shops work via API. So how does it work?In this blog, we'll explain what an API is, how it works, and how you can use Deriv API to your benefit.
What is an API
API stands for application programming interface. It may sound a little complicated for non-technical people, but it simply refers to a way of communication designed specifically for computers.A good example of an API in action would be a flight aggregator like Skyscanner – a website that displays flights and airlines available on dates you select. This website communicates with numerous airline websites and retrieves data from them, such as flight times and prices, using an API.In trading, an API is mostly used by trading apps and platforms to fetch data like live quotes and trading conditions from the brokers.Deriv API does exactly the same – provides access to Deriv's trading conditions and assets available for trading to third-party software, like your trading app or platform.
How an API works
Similar to human communication, programming communication requires an exchange of information between two sides — a requestor and a respondent.In our earlier example, the aggregator website acts as a requester, asking for flight data, while the airlines' websites act as the respondents that provide the requested information.API users commonly refer to the requesting side as a client and the responding side as a server. An API is no more than software that enables a client and a server to communicate with each other by sending requests and responses.Each request and response is called an API call and can be written in different programming languages, depending on the requirements of the server – Java or Python.
What you can do with Deriv API
With Deriv API, you have the freedom to personalise your trading experience. Just build your own trading app or platform, add the features you like, and connect it to the Deriv server via our API. The API will transmit data from our server to your app, enabling you to trade just the way you want.Moreover, besides adding a unique personal touch to your trading journey, you can take your API activities even further and monetise them.
How you can earn with Deriv API
Here are the 3 opportunities to earn with Deriv API:
- Build your app, sign up as a Deriv affiliate, and get commissions on trades completed via your app and the affiliate plan you select.
- Register your trading app or platform with Deriv, add a markup to the contract prices, and profit from every purchased contract.
- Sign up as a payment agent, build your custom website to process payments for Deriv’s clients, and earn commission on every transaction completed via your website.

Undoubtedly, creating an app or a website requires a set of skills that not everyone may have, such as knowing programming languages and having coding experience. But if you don't have those skills, you can hire a developer to create an app or platform for you – all you'll need to do is promote it once it's done and build your network.
If you need help with software development, the Deriv developers’ community can be a great place to find the right person. And if you need help with promoting your product, Deriv offers an extensive selection of marketing materials exclusively to our partners.
Comfortable building your own product? Head to our API guide to find Deriv API's technical specifications. Deriv API offers you a whole new level of opportunities to stand out as a trader or a partner and make some additional income. Moreover, it is absolutely free of charge – so, give it a try?

Forex trading on Deriv
The forex (or foreign exchange) market is where you can trade global currencies. It’s the world's largest and most liquid financial market, with daily transactions totaling over 6 trillion US dollars.
The forex (or foreign exchange) market is where you can trade global currencies. It’s the world's largest and most liquid financial market, with daily transactions totaling over 6 trillion US dollars.
The high liquidity and volatile nature of the market allow traders to easily buy and sell currencies, providing them more short-term trading opportunities and greater potential gains.
On Deriv, you can trade forex by predicting an asset’s price movement without actually buying or owning the underlying asset (currency). This will be explained further in the latter part of this blog. First, let's go over the currency pairs available to trade on our trading platforms.
Forex assets to trade
On Deriv, the forex assets available for you to trade are currency pairs and basket indices.
In forex trading, currencies are traded in pairs. The first currency is called base, and the second one is called quote. In the GBP/USD pair, for example, the British pound sterling is the base currency, while the US dollar is the quote currency. The price of this pair represents how much one British pound sterling is worth in USD.
Currency pairs are divided into 3 groups — major, minor, and exotic pairs.
Major pairs are the most actively traded in high volume (e.g. GBP/USD, EUR/USD, USD/JPY, and USD/CHF). Minor pairs are less popular and not as liquid as major pairs (e.g. EUR/CHF, CAD/JPY, and GBP/AUD), while exotic pairs are a major currency paired with a currency of an emerging economy (e.g. GBP/TRY, NZD/SGD, and EUR/ZAR).
In addition to these currency pairs, you can also trade forex basket indices.
Basket indices are weighted indices that measure the value of one currency against a basket of major currencies (each currency in the basket is weighted by 20%). On Deriv, these indices include the Australian dollar basket, Euro basket, British pound sterling basket, and US dollar basket.
- The AUD Basket measures the Australian dollar’s value against a basket of 5 global currencies (USD, EUR, GBP, JPY, CAD).
- The EUR Basket measures the Euro's value against a basket of 5 global currencies (USD, AUD, GBP, JPY, CAD).
- The GBP Basket measures the British pound’s against a basket of 5 global currencies (USD, EUR, AUD, JPY, CAD).
- The USD Basket measures the US dollars’ value against a basket of 5 global currencies (EUR, GBP, JPY, CAD, AUD).
Let’s now go through the trade types that apply to forex.
Contract types
You can trade forex on Deriv with 3 different trade types (also referred to as contract types) — CFDs, multipliers, and options. These trading contracts do not require you to actually own or buy the currencies that you want to trade, they allow you to enter into a contract that predicts which way you think the market will move.
How to trade forex with CFDs
CFD stands for contract for difference. Essentially, it is an agreement between a broker and a trader to exchange the difference between the open and close price of an asset.
If you think the price of an asset will go up, you can buy a CFD and benefit from that rise. If you think that its price will go down, you can sell a CFD and profit from that fall. The potential profit only applies when the market moves in favour of your prediction.
You can trade forex with CFDs on Deriv MT5 and Deriv X. Check out our video on CFDs for more information.
Deriv MT5 is a popular multi-asset CFD trading platform packed with innovative features as well as superior technical and fundamental analysis tools. Deriv X is another superb platform that lets you customise your trading experience with drag-and-drop widgets and intuitive tools. Both platforms offer high leverage and low spreads.
How to trade forex with multipliers
Multipliers allow you to amplify your potential profits without increasing your potential losses.
You can also further limit your risk with multipliers. Its stop out function ensures that you will not lose more than your initial stake. Additionally, multipliers have risk management features that let you better manage your trade: stop loss, take profit, and deal cancellation.
Multipliers trading is available on Deriv Trader and Deriv GO.
Deriv Trader offers you flexibility with stakes as low as $0.50, and the Deriv GO mobile app lets you enjoy a smooth trading experience wherever you go.
How to trade forex with options
Options let you potentially earn a payout from predicting market movements within a specific time period. On Deriv, you can trade forex with digital options on Deriv Trader, Deriv Bot, and SmartTrader.
Deriv Bot allows you to build a trading bot and automate your trades without coding skills, while SmartTrader is yet another user-friendly platform that gives you access to your favourite markets.
Give forex trading a go with a free demo account after you sign up on Deriv. It comes pre-loaded with 10,000 USD of virtual money so you can practise trading before using real money.

Weekly market report – 4 Apr 2022
After a shaky start to the week, the US dollar rose on the jobs data as the unemployment rate fell to a two-year low and wages accelerated once again.
Forex
After a shaky start to the week, the US dollar rose on the jobs data as the unemployment rate fell to a two-year low and wages accelerated once again.
The US economy added 431k jobs, which was less than the expected 490k and the previous print of 750k. However, the record low unemployment rate at 3.6% cushioned the greenback.
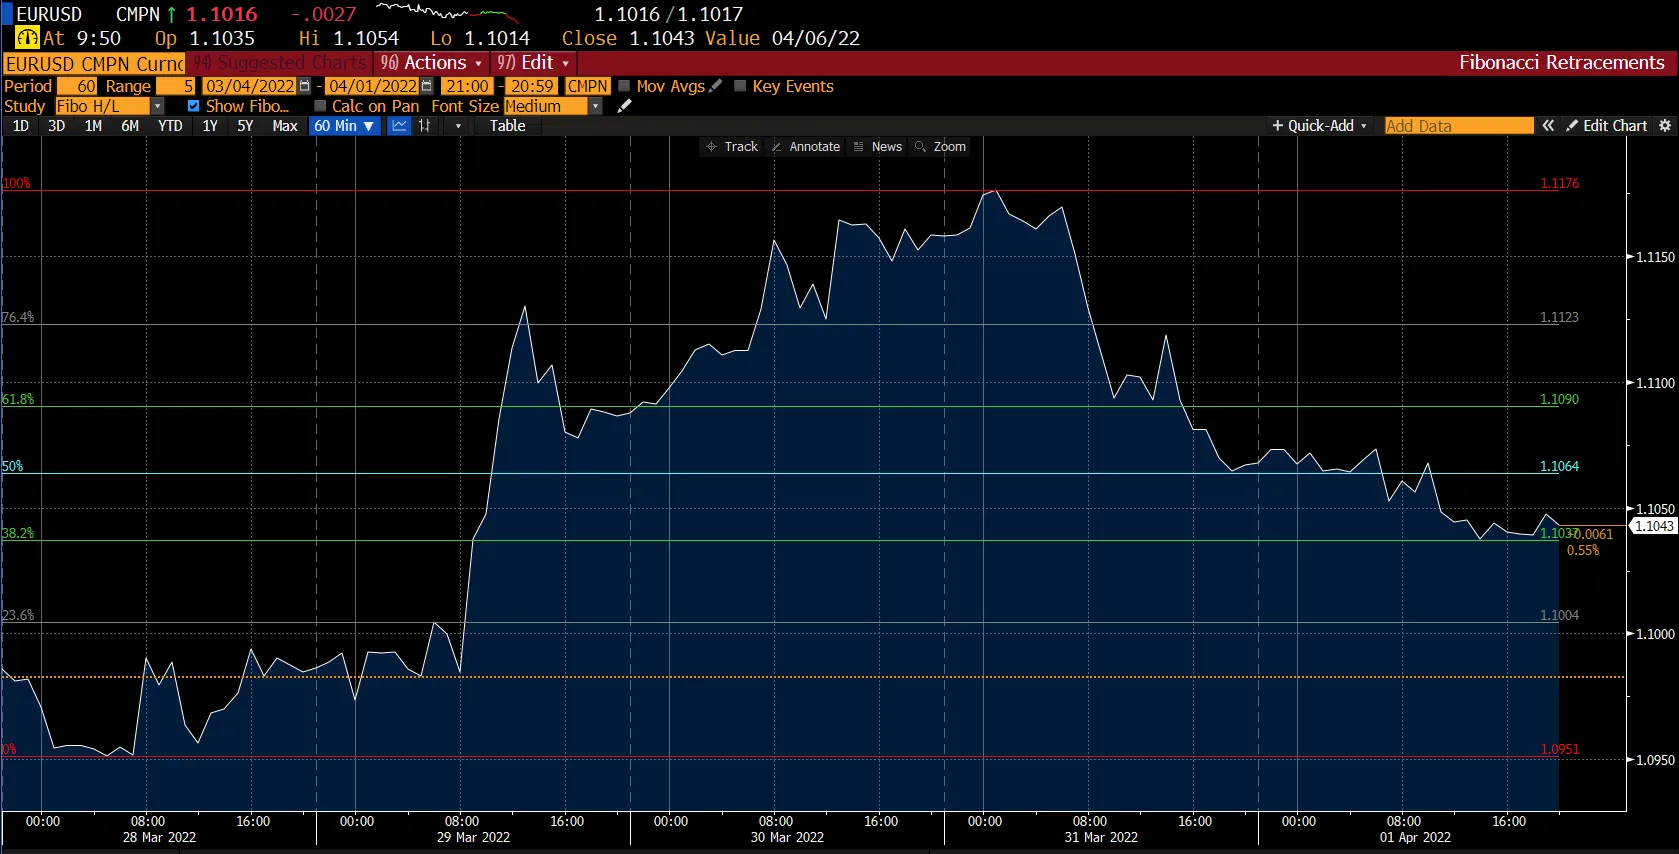
With the US dollar gaining momentum, the EUR/USD fell further and reached a new three-day low at the $1.1020 level during the American session. Moreover, an increase in the Euro unemployment rate led to a decent sell-off of the EUR/USD. The Eurostat reported the unemployment rate at 6.8%, which remained in between the mid-market consensus at 6.7% and the prior figure of 6.9%. At the same time, traders increased bets that the European Central Bank (ECB) would raise interest rates after rising inflation numbers.
Last week was a bumpy ride for EUR/USD. Since it was recovering from the previous week's lows, it fell towards the end and closed the week just above its support at 38.2% retracement at the $1.1035 level. If it continues to fall lower, the next support will be at 23.6% retracement at the $1.1005 level.
Despite the absence of a new trigger, GBP/USD continued to trade flat around the $1.3100 level. For now, traders are waiting for Gov. Andrew Bailey's speech to learn more about what the Bank of England will do with its monetary policy in May.
USD/JPY recovered after dipping 350-pips in the week, rallying above the ¥122.00 mark on a buoyant market mood as peace talks between Russia and Ukraine developed further, and US macroeconomic data lifted the US dollar.
This week, traders eagerly await the FOMC meeting minutes on Wednesday, 6 April 2022, since it will be the first meeting following the interest rate hike in March.
Commodities
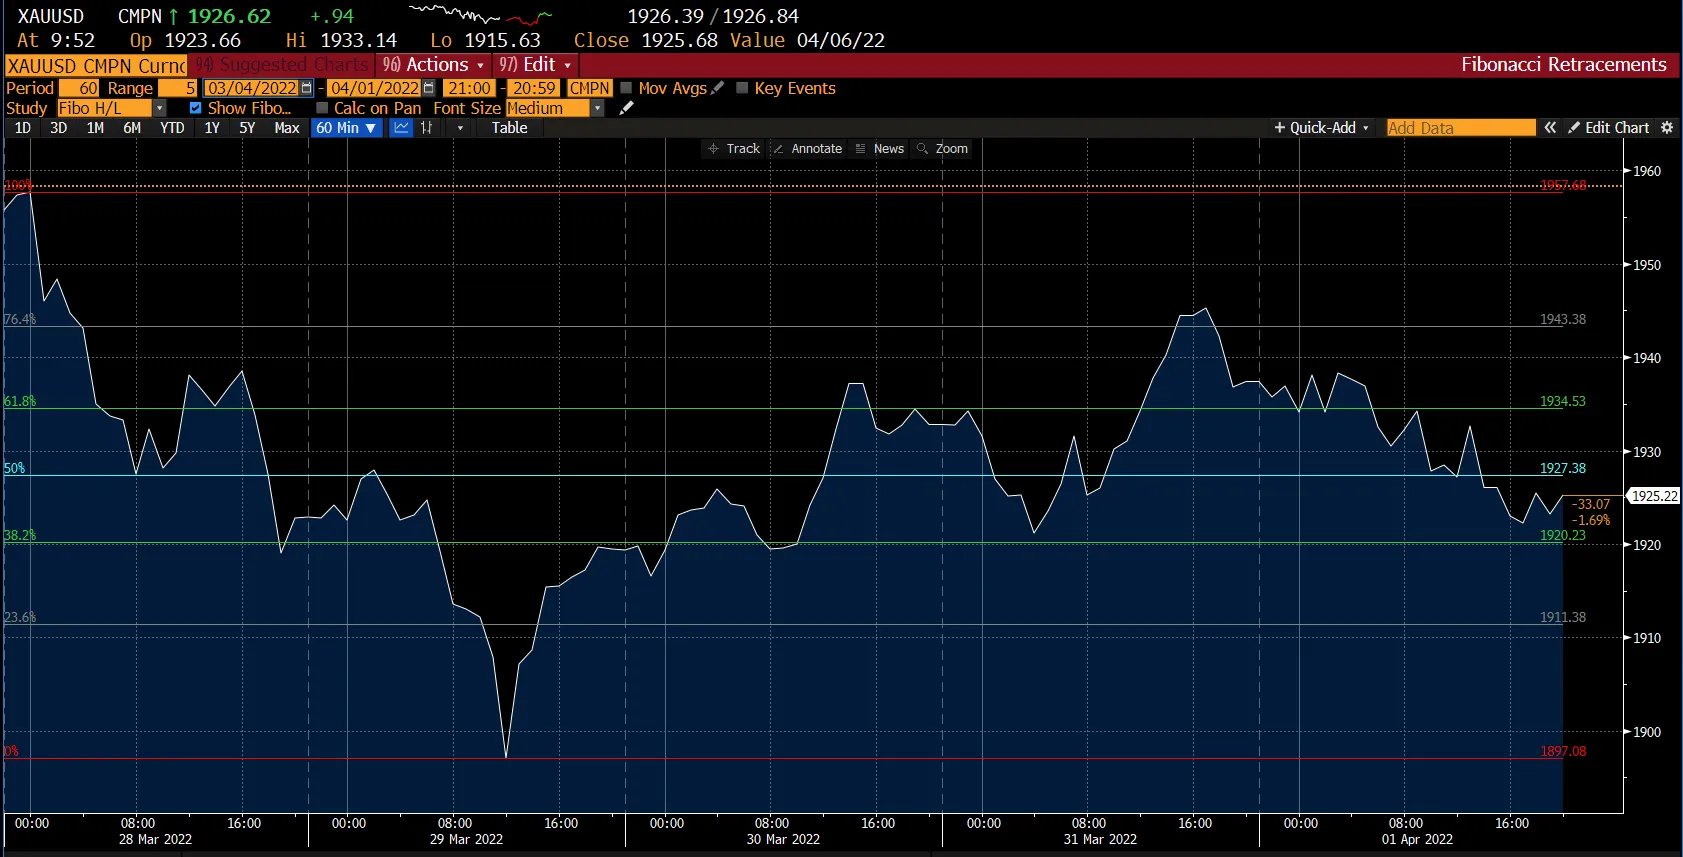
At the start of the week, gold lost a lot of ground due to rising US Treasury bond yields but recovered by the middle of the week. However, with the greenback gaining momentum ahead of the weekend, XAU/USD could not maintain its gains and closed the week with losses.
The release of the US monthly jobs report on Friday, 1 April 2022, reinforced market expectations that the Fed would adopt a more aggressive policy stance to combat persistently high inflation. As a result, the yield on the two-year US government bond, which is highly sensitive to rate hike expectations, reached a three-year high, dragging down the non-yielding yellow metal at the end of the week.
As per the hourly chart for the week, we see the price fluctuating near the 38.2% – 61.8% retracement levels at around the $1,920 and $1,934 mark. Gold ended the week at around $1,925, just below the 50% retracement level, which is also acting as the current resistance level. If gold finds an uptrend, its next resistance level would be at the 61.8% retracement level, and if it continues to trend downwards, its next support level would be the 23.6% retracement level at around $1,911.
The FOMC minutes this week may impact the market pricing of Fed rate hikes. If policymakers are willing to keep raising the policy rate aggressively in the coming sessions, US Treasury bond yields may continue to rise, putting pressure on gold.
Oil was down by around -6.30% for the week, extending its losses from Thursday, 31 March 2022, when President Joe Biden authorised the release of 1 million barrels of oil per day from the US Strategic Petroleum Reserve for the next 6 months – the largest release ever.
Additionally, members of the International Energy Agency (IEA), which includes the United States, most of Europe, Canada, Mexico, Japan, and South Korea, announced on Friday, 1 April 2022, that they have decided to release oil from their emergency stockpiles to support the United States' decision. The IEA intends to provide more information about the release early this week.
Although the move may keep prices under control in the short term, it should be viewed as only a temporary fix for tight global supplies, especially as the war in Ukraine continues.
Cryptocurrencies

Bitcoin was able to break through a key resistance level last week that had kept it within the same trading range since the beginning of the year. The world's largest cryptocurrency by market capitalisation surged to a three-month high on Tuesday, 29 March 2022, reaching above $48,000 during a bullish overnight run.
These recovered gains for Bitcoin follow a recent price rally that saw the digital asset rise by more than $10,000 in the previous 2 weeks. Since then, Bitcoin settled from Tuesday's highs to consolidate around the $45,000 mark. As of 18:30 Friday 1 April 2022 UTC, Bitcoin was trading at around $46,390.
At the time of writing, Bitcoin is currently trading at around the $46,392 mark. Its primary support level is around $46,194 at the 50% retracement level, followed by its secondary support level of 45,769 at 32.8% retracement. An additional upward price momentum would test Bitcoin's first resistance level of $46,618, and a breach would bring the $47,143 level into account.
It is the first time Bitcoin has hit this mark since December 2021 and provides renewed optimism that a longer-term bull market could be forming. Analysts have attributed the cryptocurrency price rally to the bullish trends formulated throughout March, such as the dwindling supply of Bitcoin on crypto exchanges and rumours of other countries following Al Salvador's move to adopt Bitcoin as legal tender.
Furthermore, other altcoins mirrored Bitcoin's gains with Ether, Cardano and Solana’s price momentum helping to push the overall crypto market capitalisation above the $2 trillion mark.
US Indices
.webp)
*Net change and net change % are based on the weekly closing price change from Monday to Friday.
Last week, stocks performed modestly as traders assessed a rocky first trading quarter and an unnerving recession indicator from the bond markets.
The Dow Jones Industrial Average traded lower at around $34,818, whilst the S&P 500 dipped by 0.65% to close around $4,545. Meanwhile, the Nasdaq Composite posted a -0.84% loss on the week. On the whole, stocks closed on Friday 1 April 2022 around session highs.
Despite a strong performance in March, Wall Street witnessed its first negative quarter in over 2 years and traders are now assessing what quarter 2 will bring for the markets.
Most notably, a significant part of the US Treasury yield curve inverted briefly on Friday, 1 April 2022. For the first time since 2019, the spread between the 2-year and 10-year yields varied multiple times last week. This rare phenomenon has come to be known as the prelude to a recession, with each of the last 8 recessions since 1969 being preceded by a yield curve inversion.
On Friday, 1 April 2022, the yield on the 10-year note closed at 2.38%, 6 basis points below the 2-year treasury note, which was at 2.44%.
Market players also assessed the latest figures from the US Labor Department’s monthly jobs report, which shows the strength of the jobs market across the US economy. The report showed that employers added 431,000 jobs in March, well below the Bloomberg consensus estimates of 490,000.
While the latest figures indicate a slowdown from February’s 678,000 gain, the March jobs report marked a sustained increase above pre-pandemic levels, contributing to expectations of aggressive monetary policy action from the Federal Reserve in the coming months.
For the week ahead, the market focus should remain directly on developments around the Ukraine-Russia conflict and the Federal Reserve, which is scheduled to release the minutes of its March meeting on Wednesday, 6 April 2022.
Trade the financial markets with options and multipliers on Deriv Trader or CFDs on Deriv X Financial account and Deriv MT5 Financial and Financial STP accounts.

Fundamental analysis for beginners
Fundamental analysis is one of the ways to analyse financial markets and identify the best time to open a trade. Unlike technical analysis, which evaluates past price movements, fundamental analysis focuses on current and upcoming economic and political events that affect price movements.
Fundamental analysis is one of the ways to analyse financial markets and identify the best time to open a trade. Unlike technical analysis, which evaluates past price movements, fundamental analysis focuses on current and upcoming economic and political events that affect price movements.
The main purpose of fundamental analysis is to determine whether the current market price of an asset reflects its real value. The discrepancies between the two numbers provide buy and sell signals:
- If a market price is higher than the estimated real value, traders anticipate a price drop and sell an asset.
- If a market price is lower than the estimated real value, traders anticipate a price spike and buy an asset.
How does fundamental analysis determine the real value of an asset?
The asset’s real value also referred to as true or intrinsic value, can be influenced by many factors, both local (microeconomic) and international (macroeconomic). Fundamental analysis takes into account all these factors and combines the findings to predict market price movements.
Microeconomic analysis studies factors that affect the performance of businesses and companies. Macroeconomic analysis, by contrast, examines broader factors that affect the national, regional, or international economy as a whole.
Moreover, each market has its own set of market-specific factors to evaluate.
How does fundamental analysis evaluate each financial market?
Fundamental analysis is especially popular among stock traders because publicly traded companies have a lot of information easily accessible to anyone, making market evaluation much easier. However, you can also perform fundamental analysis on all the other financial markets using data from different sources.
Fundamental analysis of stocks
One of the most important documents to study when evaluating individual stocks is a company’s balance sheet – a summary of the company’s financial activities.
The other 2 important documents that can supplement the balance sheet analysis are the income and cash flow statements.
Once a company is studied internally, it’s important to compare it with its competitors and evaluate the entire industry’s health and the country’s economy. This will give you a complete overview of the stock’s real value.
Fundamental analysis of stock indices
As a stock index represents a collection of individual stocks, the first step in analysing an index is to evaluate each stock individually. Once you have an overview of each stock, the next step is to compare it with a whole index.
This will give you a chance to identify the top-performing stocks you need to pay close attention to and the stocks that don’t play a significant role in the index.
The last step is to evaluate the industry or the country’s economic situation, depending on the index you analyse.
Fundamental analysis of forex
The fundamental analysis of forex pairs measures the strength of a currency, so the main data to analyse is the country’s economic state. Numbers such as GDP (gross domestic product), inflation, and the central bank’s interest rate are important indicators of the economy’s health.
In addition, it’s crucial to keep abreast of political and social events that may influence the currency’s price movement. For example, Brexit caused a significant fall of the GBP, and mass demonstrations in the US in May-June 2021 resulted in the drop of the USD’s value.
Fundamental analysis of commodities
Since the commodity market is primarily made of natural resources, its prices are driven by physical supply and demand. This means the price movements are influenced not only by political and economic events but also by natural disasters.
For example, droughts and floods have a significant effect on agricultural resources, causing shortages and decreasing supply, which leads to increasing prices.
One of the main sources of information about the supply and demand of commodity assets is the Commitments of Traders (COT) report, published by the Commodity Futures Trading Commission. This report provides weekly updates on the state of the commodity market, offering a valuable indication of the upcoming price movements.
Fundamental analysis of cryptocurrencies
As the cryptocurrency market is still very new, performing its fundamental analysis with the same tools as other financial markets is quite challenging. For example, you can’t find out the real value of Bitcoin by analysing a balance sheet of a company that issues it because it is decentralised, and there is no such company.
However, there are still some indicators that can forecast an upcoming price change of cryptocurrencies. Government regulations and news have the most significant effect on its pricing. Every time a country officially legalises or bans cryptocurrencies, their prices tend to swing.
Other factors to pay attention to, are market capitalisation, the number of transactions, and how widely a particular cryptocurrency is accepted. The higher each of these indicators is, the more popular the coin is, and the more likely its price will increase.
To help you evaluate financial markets, Deriv releases a weekly market report every Monday, where you can find an analysis of the previous week’s market performance and information on trending and falling assets.
More data gives you a more accurate prediction, regardless of which market you choose. For better results, you can combine both fundamental and technical analysis. But keep in mind that both fundamental and technical analysis predictions are not 100% accurate and only indicate potential price movements.
Sorry, we couldn’t find any results matching .
Search tips:
- Check your spelling and try again
- Try another keyword