Results for

Most common chart patterns in technical analysis
While trying to understand how prices move in different markets, technical analysis pioneers have discovered that the price often moves in a certain direction after forming a certain pattern. This discovery has soon turned into a trading discipline, commonly used by traders nowadays.
While trying to understand how prices move in different markets, technical analysis pioneers have discovered that the price often moves in a certain direction after forming a certain pattern. This discovery has soon turned into a trading discipline, commonly used by traders nowadays.
There are a lot of chart patterns you can use in your technical analysis, but they all follow the same logic: the support trend line is at the bottom, and the resistance trend line is at the top. All the patterns are generally divided into 3 main categories:
- Reversal patterns
- Continuation patterns
- Bilateral patterns
Essentially, every group is used to predict whether the price will continue to move in the same direction as before the pattern started. Let’s see how each one of them works.
Reversal chart patterns
Reversal chart patterns are likely to indicate that the trend is about to change its direction.
Here are some of the most common reversal chart patterns:
- Double top and double bottom
These price patterns are made of 2 peaks or 2 drops, where the price bounces between support and resistance levels and then breaks out, moving in the opposite direction from the previous trend.

- Head and shoulders and inverse head and shoulders
These 2 patterns are very similar to double top and double bottom but are made of 3 price peaks or drops, with the biggest one in the middle. After the third one, the price tends to break out and move in the opposite direction from the previous trend as well.

Continuation chart patterns
Continuation chart patterns tend to signal that the trend will resume its previous direction.
Here are some of the most common continuation chart patterns:
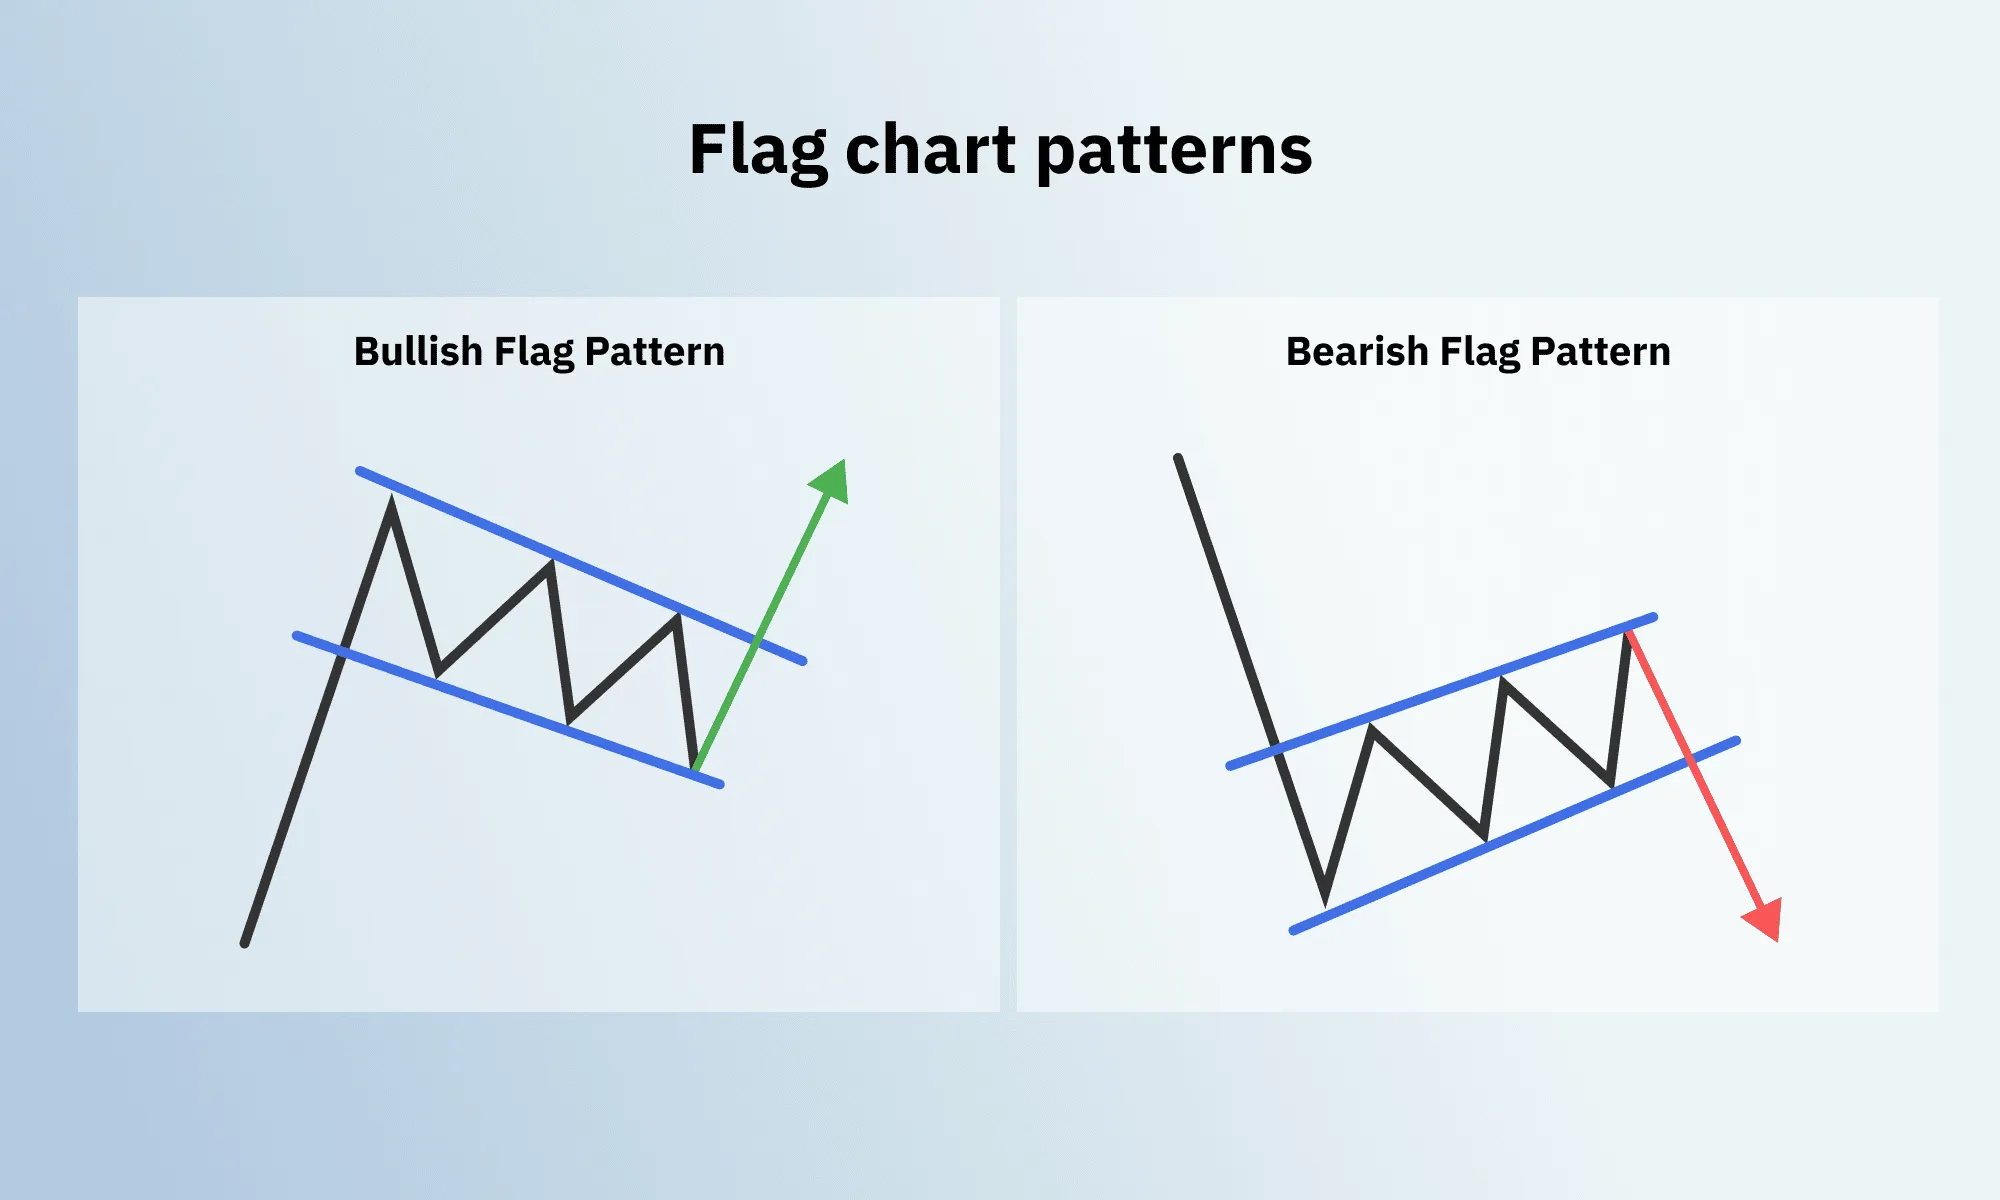
- Flag
The flag chart pattern is made of a distinct flag ‘pole’, which indicates the previous trend, and 2 parallel lines – support and resistance, that suggest either rising (bullish) falling (bearish) upcoming price movement. Once the price breaks through one of the lines, it tends to follow the direction of the previous trend.
- Pennant
The pennant chart pattern is very similar to the flag. It also has a well-defined ‘pole’, but its support and resistance trend lines meet in the middle horizontally. The price usually breaks out, following the direction of the previous trend.

- Wedge
The wedge chart pattern is very similar to the pennant, but its support and resistance trend lines can be rising or falling instead of meeting strictly in the middle of the pattern and forming a horizontal shape. In either case, the price is highly likely to move in the same direction as a previous trend.

Bilateral chart patterns
The bilateral chart patterns give 50/50 chances of the trend reversing or continuing, which gives traders an excellent opportunity to place 2 trades simultaneously.
All 3 types of bilateral patterns resemble the previously described continuation patterns, with 3 significant differences:
- Ascending triangle has a strictly horizontal resistance trend line
- Descending triangle has a strictly horizontal support line
- Symmetrical triangle doesn’t have a distinct ‘pole’, unlike the flag pattern. The price preceding the symmetrical triangle shape is usually built up gradually.

How to improve your trading strategy using chart patterns?
Having a clear idea of how these basic chart patterns work will help you predict where the price is going to move next more accurately. Professional traders use a wide range of patterns, but the trading strategy is the same, whichever pattern you find in your price chart. As soon as the price breaks out of the resistance or support line, you place your buy or sell trade, based on the predicted direction.
However, it's important to keep in mind that while these patterns can help indicate a market’s future price movement, they are still only predictions and don't give you 100% accuracy. There is always a chance of a false breakout when the price breaks through the line and then returns shortly after without forming a new trend.
Consequently, you should carefully assess your risk and practise on a risk-free demo account before trading with real money. And if you want to take your technical analysis skills one step further, in our next blog post, we will walk you through the automatically calculated tools to help you refine your trading strategy.

Weekly market report – 25 Apr 2022
After reaching a high of $1.0936 on Thursday, 21 April 2022, the EUR/USD pair bounced for the second week in a row from around $1.0761 to settle near $1.08 for the week. On the week's final trading day, risk concerns overshadowed positive macroeconomic developments, bringing the greenback back into favour.
Forex

After reaching a high of $1.0936 on Thursday, 21 April 2022, the EUR/USD pair bounced for the second week in a row from around $1.0761 to settle near $1.08 for the week. On the week's final trading day, risk concerns overshadowed positive macroeconomic developments, bringing the greenback back into favour.
The initial spike in the pair’s price was caused by an unexpected hawkish shift from some European policymakers. Luis de Guindos, Vice President of the European Central Bank said the inflation is close to a peak but a rate hike in the 2nd half of the year is feasible, depending on macroeconomic data.
Traders continued to desire safety amid concerns about a US recession and the Eastern European crisis, so the enthusiasm was short-lived. The yield on the 10-year Treasury note in the United States was under 3% this week. Additionally, inflation in the United States reached a four-decade high, touching 8.5% YoY in March. While in the European Union, inflation was verified at 7.4%, also a multi-decade record, but slightly lower than previously predicted. Here, inflationary expectations are stronger than macroeconomic indicators of easing price pressures.
Hawkishness among central bankers has become the new norm. Except for the Bank of Japan, virtually every central bank plans a more aggressive monetary policy tightening, which does not seem sufficient to contain the situation. Such a scenario creates an ideal ground for a US dollar rise, which will continue in the weeks ahead since none of the market's bearish reasons are expected to fade anytime soon. High-yielding equities are also expected to fall, while US markets are expected to fare better since the US Federal Reserve has been laying the groundwork for an aggressive rate hike for a while, the majority of which has already been priced in.
It's still unclear whether the European Central Bank (ECB) will act in July (as expected this week) or opt for a 25-bps or 50-bps hike, leading to the possibility of a short-term strengthening of the common currency.
As per the technicals, the hourly chart for the week seemed to be skewed to the right for the reasons mentioned above and is currently just above the 5 and 10 SMA's at around $1.0789 and $1.0796, respectively. Also, EUR/USD was trading at its psychological level of around $1.0810 when it broke through the level on Wednesday, 20 April 2022 and traded at its highest level on Thursday, 21 April 2022. However, it fell below its psychological level towards the end of the week.
GBP/USD was down, ending the week at around the $1.2839 level and making the previous week's rally appear to be a one-off in an ongoing trend. GBP bulls sought to regain the $1.31 level in the second half of the week, but the US dollar remained dominant. In the coming week, the pair will brace itself for critical US economic releases. However, the UK data releases appear to be relatively quiet.
Level up in your trading strategy with the latest market information and trade CFDs on the Deriv X Financial account.
Commodities
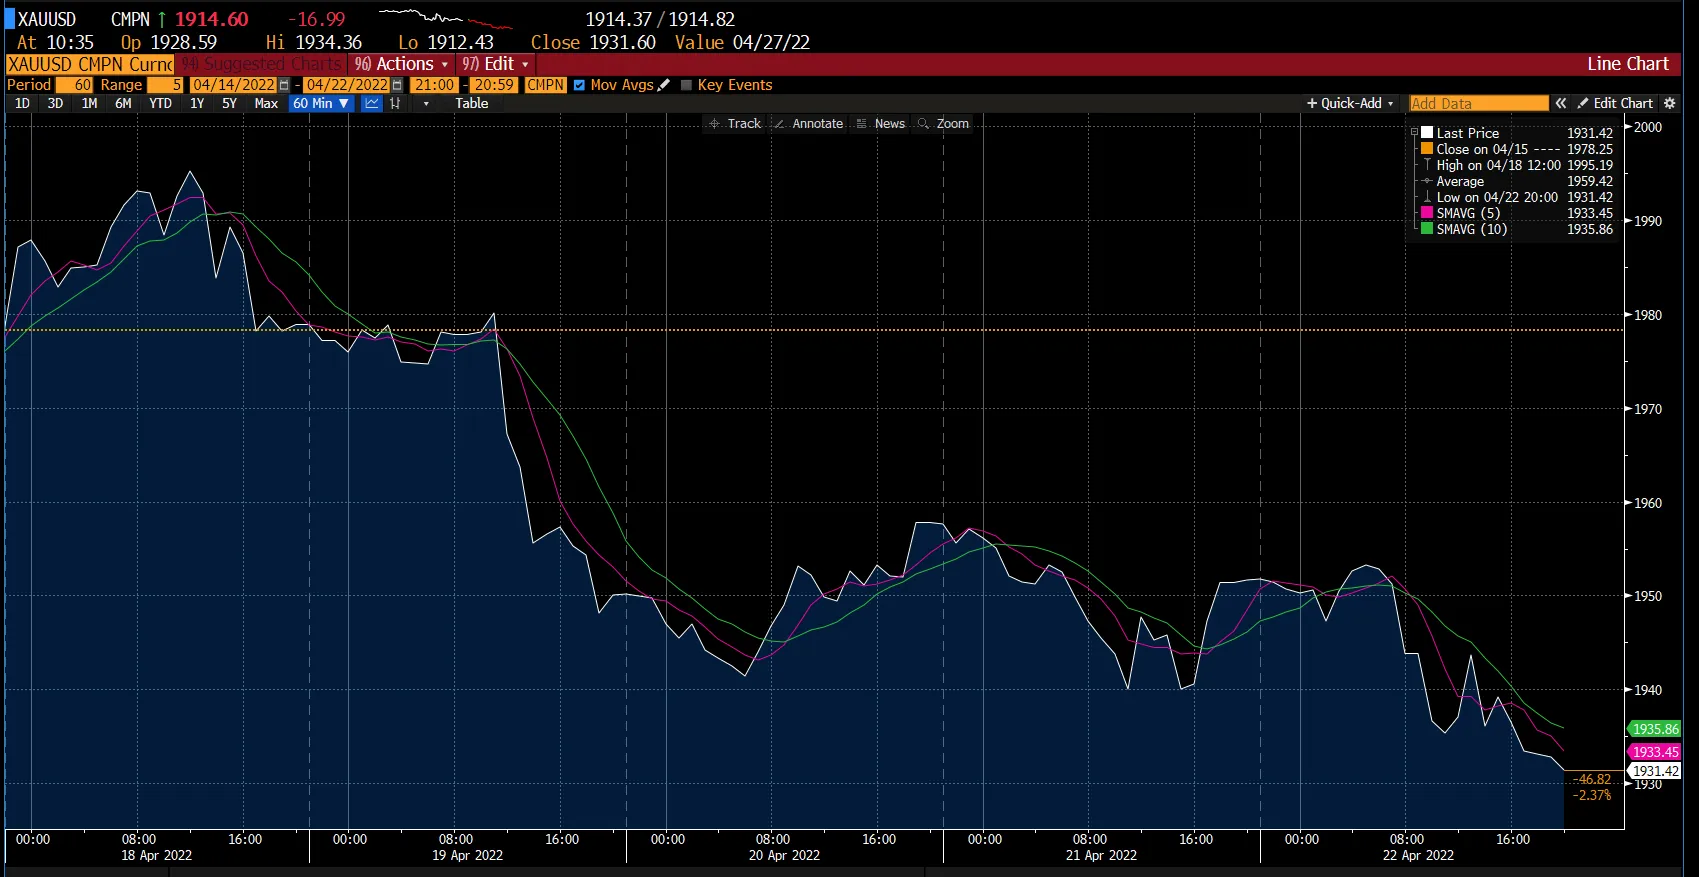
Gold saw a change in the overall trend for the first time since the beginning of April. The trading conditions on Easter Monday gave way to a strong upward movement. As you can see in the chart above, the yellow metal started the week on a bullish note, reaching close to $2,000, its highest in over a month. Later, gold prices bounced around the psychological level of $1,980 before breaking free into a downward trend. The bullion saw a heavy decline on Tuesday, 19 April 2022, owing to dominating risk flows in the global financial markets.
Whilst the treasury yields and the greenback were lifted due to faster policy tightening by the Federal Reserve, the precious metal ended the week close to $1,930. Gold saw its biggest weekly decline since mid-March, having dropped below its SMA 5 and SMA 10, which now act as resistances. Overall, gold showed a similar decline against the US dollar and the Euro, having dropped by around 2.4% during the week.
The safe-haven asset is highly susceptible to the rising US short-term interest rates and higher yields, which increases the opportunity cost of holding non-yielding bullion. However, it is a safe place to park your funds during rising political and economic tensions.
Even though gold has come off its recent highs, inflation and geopolitical concerns continue to have a buoyant effect on gold prices. It’s only safe to say that gold should hold above the $1,900 level till there is a significant change in the Russia-Ukraine dispute.
Oil followed gold’s footsteps and added to its losses from last week. On Monday, 18 April 2022, oil prices dropped to nearly a two-week low due to the growing concerns over reduced fuel demand owing to the prolonged COVID-19 lockdowns in Shanghai. Overall, oil prices fell by nearly 4% last week.
Furthermore, crude oil prices are around $20 lower than last month’s peak. President Biden recently tapped into the Strategic Petroleum Reserve and reopened oil leases on public land. However, this development has not impacted the asset and fuel prices remain high.
As the Ukraine crisis deepens, oil prices are not expected to drop below the $90-a-barrel mark as the European Union weighs a ban on Russian oil. If that were to happen, the even shorter supply would catapult oil prices in the opposite direct.
Make the most of these market opportunities by sharpening your trading strategy and trade the financial markets with options and multipliers on Deriv Trader.
Cryptocurrencies
Bitcoin (BTC), the world's largest crypto by market capitalisation, dipped below the $40,000 mark, while Ether plunged below the $3,000 level.
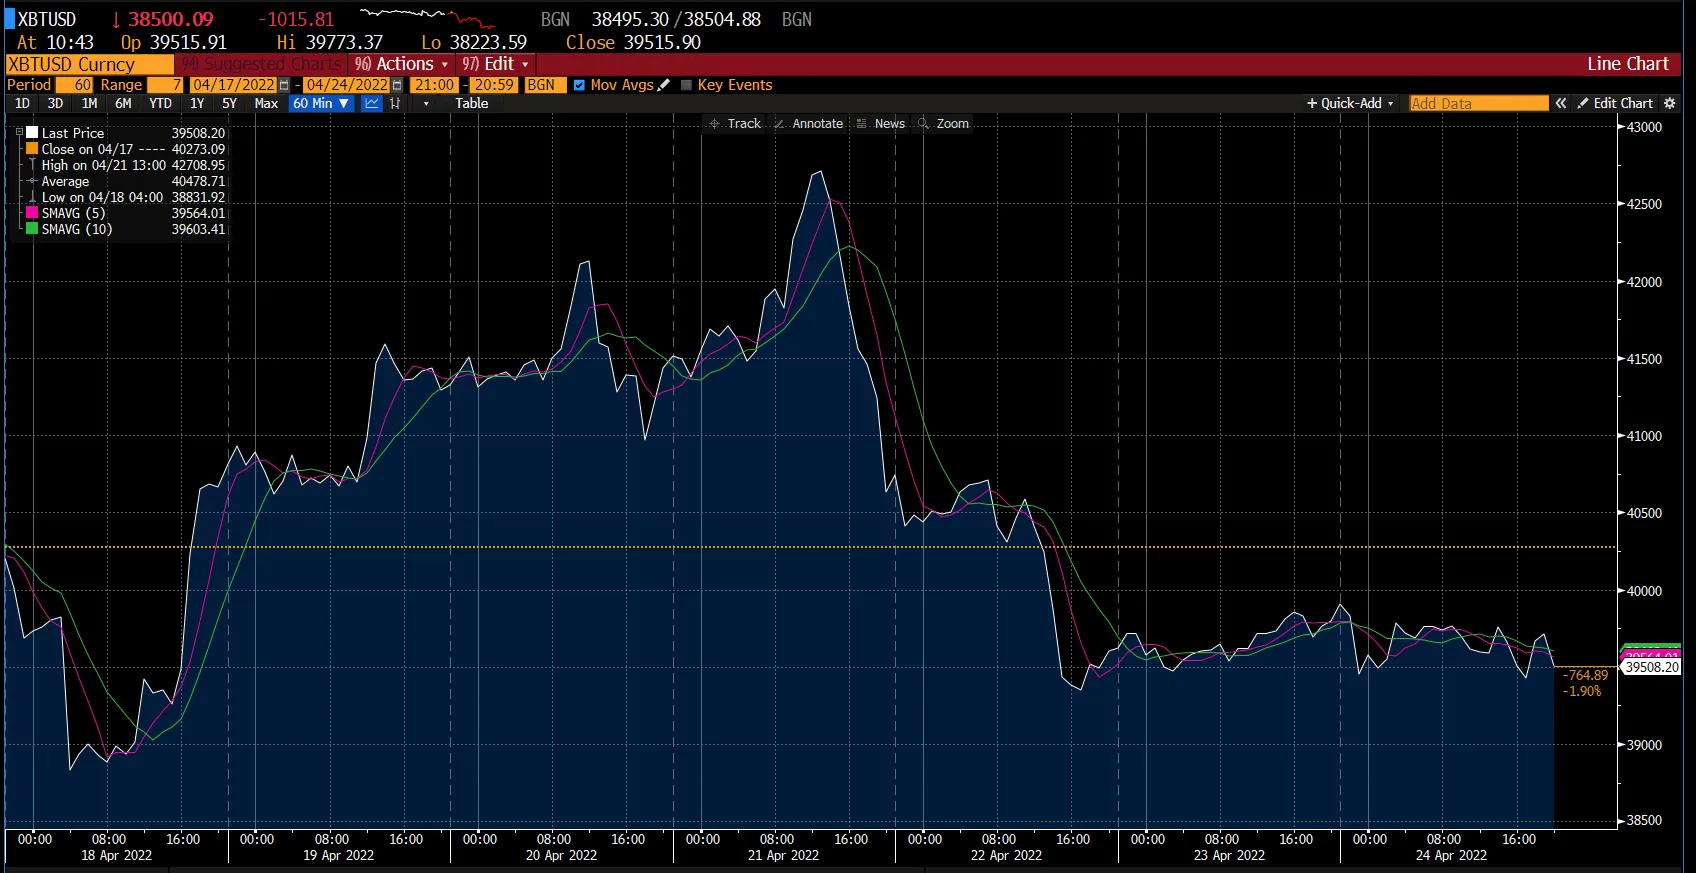
The rising correlation between BTC and stocks resulted in Bitcoin plunging more than 3% on Friday, 22 April 2022, when the US stock indexes fell. Powell's speech from the previous night weighed on US markets and echoed on the cryptocurrency market, leaving an emerging breakaway from a critical support line. This movement is evident on the chart, where we see a dip in BTC/USD that dropped below the $39,500 mark after it reached its high for the week, which was above the $42,500 mark. Bitcoin then stayed along the lines for the rest of the week. Based on the hourly chart for the week, BTC/USD was at around $39,508, below the 5 and 10 SMA at around $39,564 and $39,603, respectively, which are currently acting as the resistance levels.
Furthermore, Ethereum was down by over 2.4%, while other leading altcoins in the top 10 were down by 0.4% (Terra) and 4.7% (Polkadot).
The total cryptocurrency market capitalisation, according to CoinMarketCap, fell overnight by 2.2% to $1.88 trillion.
Meanwhile, on Friday, 22 April 2022, Twitter Inc. announced that it is working with digital payment processor Stripe Inc. on a trial program for cryptocurrency payouts for its monetisation products. To reach out to the "creator economy" and boost revenue, Twitter added monetisation features last year. In addition to this, users who receive cryptocurrency payments can keep their earnings in crypto wallets on the Polygon network, a crypto infrastructure firm based on the Ethereum blockchain.
US Indices
.webp)
*Net change and net change % are based on the weekly closing price change from Monday to Friday.
Stocks plunged on Friday, 22 April 2022, with the Dow Jones Industrial Average tumbling by more than 900 points and posting its worst day since 2020, as the latest weaker-than-expected corporate earnings and the prospect of rising rates caused a wave of selling.
The Dow notched its fourth consecutive weekly loss, and the S&P 500 posted its third. The Dow fell by 1.9% for the week, the S&P 500 fell by 2.8%, and the Nasdaq declined by 3.8%. Moreover, Goldman Sachs, Home Depot and Visa were big downside contributors.
In addition to reacting to the weaker-than-expected earnings reports, traders' sentiment was influenced by the Federal Reserve's tightening policy. Fed Reserve Chair Jerome Powell outlined his most aggressive approach to taming inflation and highlighted that a 50 basis point hike is on the table for May. Furthermore, the 10-year Treasury note yield rose to a fresh three-year high of just under 3% as the global bond market sell-off continued.
Earnings season is just getting underway, and results have been mixed across different sectors. Among these, Netflix, Inc. fell sharply after its unexpected subscriber decline weighed on the Communications Services sector, which was the worst performer of the week.
Next week may be the busiest of this corporate earnings season, with dozens of prominent companies across various market sectors reporting earnings. Apple, Amazon, Microsoft, Meta Platforms, and Google, the five of the largest technology companies, will report earnings in the upcoming week.
Now that you’re up-to-date on how the financial markets performed last week, you can improve your strategy and trade CFDs on Deriv MT5 Financial and Financial STP accounts.

CFD trading vs options trading on Deriv
Trading CFD and options allow traders to speculate on the price movement of an asset without physically buying or owning it. Plus, both require relatively little capital to open a trade. However, though very similar to each other, these derivatives differ in how they work.
Trading CFD and options allow traders to speculate on the price movement of an asset without physically buying or owning it. Plus, both require relatively little capital to open a trade. However, though very similar to each other, these derivatives differ in how they work.
In this blog, we’ll be explaining the differences between CFD trading vs options trading on Deriv and the advantages of trading them.
4 key differences between CFD trading and options trading on Deriv
1. The trade
CFD trading allows traders to trade on the difference between the opening and closing price of an asset. To put it simply, you speculate on the direction of the market — whether the asset’s price will rise or fall. Your potential gain or loss is determined by the price difference of the underlying asset.
Options allow traders to trade on the future value of an asset. If you anticipate that an asset’s price will rise, you place a call option to purchase it at a lower price than its market value. If you think the price will fall, you place a put option to sell the asset at a higher price than its market value. You can exercise either of these options at any time while your trade is running.
To help you better understand how call and put options work, have a read of our “What is options trading” blog.
2. Leverage
CFDs are traded with leverage. Leverage allows you to open larger positions for a fraction of the contract’s value. It increases your market exposure and can amplify your potential gains and losses.
In an options trade, you only place your stake. If the market moves against your prediction, your loss is limited to your stake.
3. Trade duration
CFDs do not expire. A trade can continue running as long as you have sufficient funds to maintain the required margin level. Your margin is the amount of capital you must have in your account to keep your trade open.
However, trade on options runs on a set timeframe that you set yourself. For example, 3 ticks, 40 minutes, 5 days, or more.
4. Trade outcome
In a CFD trade, you’ll only know your potential gain or loss once you close your trade.
In an options trade, you know the potential payout of your trade beforehand.
Now that we’ve covered the key differences between CFD trading and options trading, let’s explore some of the advantages of trading them. So, what are they?
Two advantages of trading CFDs on Deriv
Negative balance protection
When trading CFDs, you get to enjoy negative balance protection which simply means you cannot lose more than the amount in your account. When your trade reaches the stop out level (which is set at a specified percentage), it will be closed. If your balance reaches negative, the negative balance protection kicks in, and it will be automatically reset to zero.
The stop out level refers to the point at which your trading account has insufficient funds to sustain open positions. When this occurs, your open positions carrying the biggest losses are closed automatically due to the decrease in margin level.
The margin level is the percentage of your balance and profit with margin added together. It indicates how much funds you have available to open new trades or maintain the old ones. Please note that the negative balance protection doesn’t apply to the Deriv MT5 Financial account.
Risk management
Trading CFDs on assets with high volatility comes with risks. One of the main advantages of trading it on Deriv is the risk management features available, such as stop loss and take profit. Using these features, you can handle high volatility trades more effectively.
Take profit allows you to close your trade automatically as soon as it reaches the profit level you’ve set. With this feature, you decide on a specific profit to close your position in advance if the market shifts and goes against your prediction.
Stop loss works similarly, except it limits your potential losses. When the asset price reaches the stop loss level you’ve set, your trade automatically closes.
Two advantages of trading options on Deriv
Limited risk
In options trading, your risk is limited to your stake amount. If the market moves against your prediction, you’ll never lose more than your stake.
More choices
With options, there’s an array of choices available since it offers a greater range of contract alternatives. You can choose from 3 options contracts — digital options, lookbacks, and call/put spreads. These contracts have different conditions, allowing you to create positions you feel will be advantageous to you.
Which trade type is better suited to you?
CFD trading offers the opportunity to spread your capital across a wide range of assets, allowing you to diversify your portfolio. If you prefer low margin requirements, no fees, as well as no day-trading restrictions, this trade type is for you.
Options trading offers different strategies giving you more ways to navigate around risks. The flexibility it offers lets you recreate other positions, allowing you to generate higher potential returns from your trades. If you want to explore more ways to trade better, then this is the trade type for you.
If you’d like to explore CFD and options more, we’ve covered these trade types extensively in our “What is CFD trading?” and “What is options trading?” blog posts. But, if you’d like to practice trading risk-free, you can head straight to creating your demo account that’s pre-loaded with 10,000 USD virtual money.

Weekly market report – 2 May 2022
EUR/USD fell to $1.0472 during European trading hours, its lowest level since January 2017. Even though the major pair was able to recover from the mentioned level, it was unable to extend its recovery, hovering at a low note towards the end of the week.
Forex

EUR/USD
EUR/USD fell to $1.0472 during European trading hours, its lowest level since January 2017. Even though the major pair was able to recover from the mentioned level, it was unable to extend its recovery, hovering at a low note towards the end of the week.
Traders continue to flee from high-yielding assets in favour of the safe-haven US dollar and US Treasuries. European stocks are also rising as earnings reports are encouraging; however, news out of Eastern Europe has dampened the rally, as Moscow has cut off gas supplies to some EU states.
The US Dollar Index surged to near 20-year highs around the $103.60 level ahead of this week’s FOMC meeting, where rates are widely expected to increase 50 basis points despite a negative preliminary GDP report of -1.4% vs the forecast of 1.1% last week. The Fed's main concern remains — the rise in inflation readings that are still near 40-year highs on CPI.
USD/JPY
USD/JPY, on the other hand, continued its upward trend, aided by a number of factors:
- The US dollar rose to its highest level since March 2020 in anticipation that the Federal Reserve will tighten monetary policy more quickly to combat rising inflation.
- The markets expect the Federal Reserve of the United States to hike interest rates by 50 basis points this week and in June, July, and September. In contrast, the Bank of Japan offered to buy an unlimited quantity of Japanese government bonds to protect the 0.25% yield cap.
- Japanese Prime Minister Fumio Kishida urged the Bank of Japan (BoJ) to maintain its ultra-loose monetary policy, excluding the idea of raising interest rates as a way to prevent further declines in the Japanese yen.
As per the monthly chart, we see a rising trend for this pair as it is currently above its 50 and 100 SMAs at ¥130.64 and ¥129.40, respectively, which are acting as support levels.
Level up in your trading strategy with the latest market news and trade CFDs on your Deriv X Financial account.
Commodities
Gold
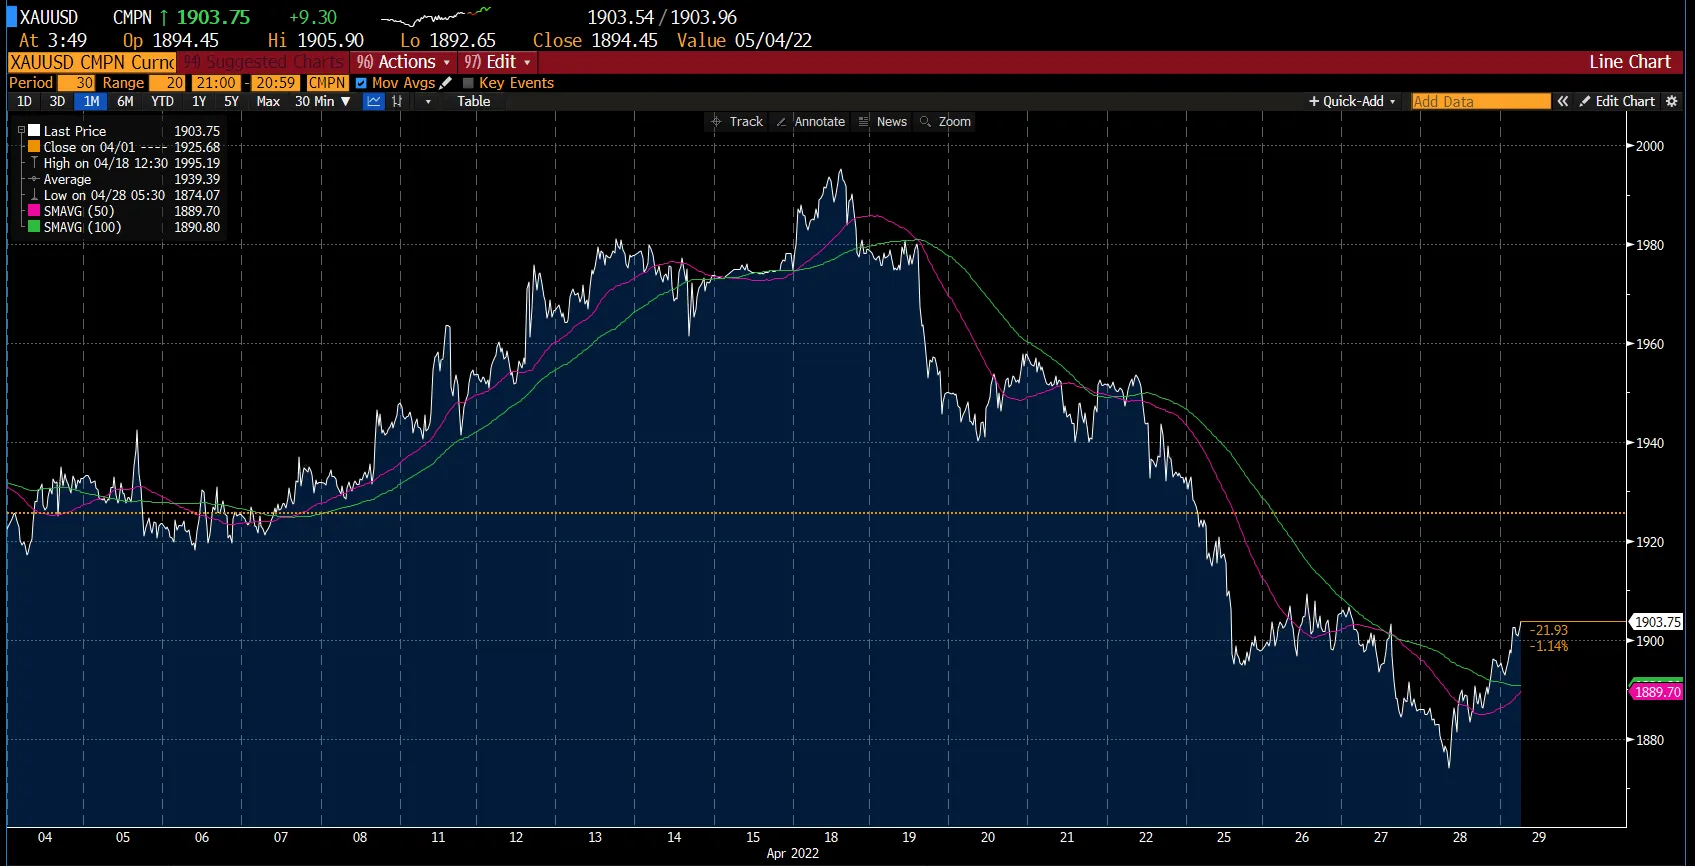
Gold prices had a continued downward trend during the week. It dropped from over $1,930 to under $1,900 at the start of the week, followed by a stabilising period where it bounced back and forth around the $1,900 mark.
Midweek, the SMA 50 acted as a support level for gold, preventing further downfall. However, the yellow metal soon slipped free of that grip and fell further to a two-month low of $1,872. Currently, it's trading marginally above the $1,900 mark, and the SMA 50 and SMA 100 are converging around the $1,890 level.
Oil
A strong decline at the onset of the week broke on oil as well. However, the asset quickly regained strength and climbed to the $102 mark, after the People's Bank of China (PBOC) declared that it will tighten its prudent monetary policy to support the economy. The oil prices continue to consolidate from the early-week lows around $95 and are now comfortably around the $105 mark.
The threat of a possible blockade of oil/gas trade between Russia and Europe remains intact. In addition, the covid lockdown in China continues to have an impact on prices as the demand for ‘liquid gold’ continues to fall.
Silver
Silver has recently experienced a significant decline due to its inverse relationship with the dollar. Geopolitical concerns emanating from Russia and the global central bankers' rush to normalise policy are also posing challenges to the metal.
Maximise market opportunities by sharpening your trading strategy and trading the financial markets with options and multipliers on DTrader.
Cryptocurrencies
Cryptocurrencies experienced a highly volatile week, with no specific trend during the course of the week and at the eye of the storm was Bitcoin.
Having traded sideways over the previous weekend, Bitcoin started the week showing signs of recovery and breached the $40,000 mark. However, the digital currency heavyweight plummeted by over $2,000 soon after, washing away all hopes of a recovery run. The correlation between Bitcoin price and Nasdaq has been striking this earning season.
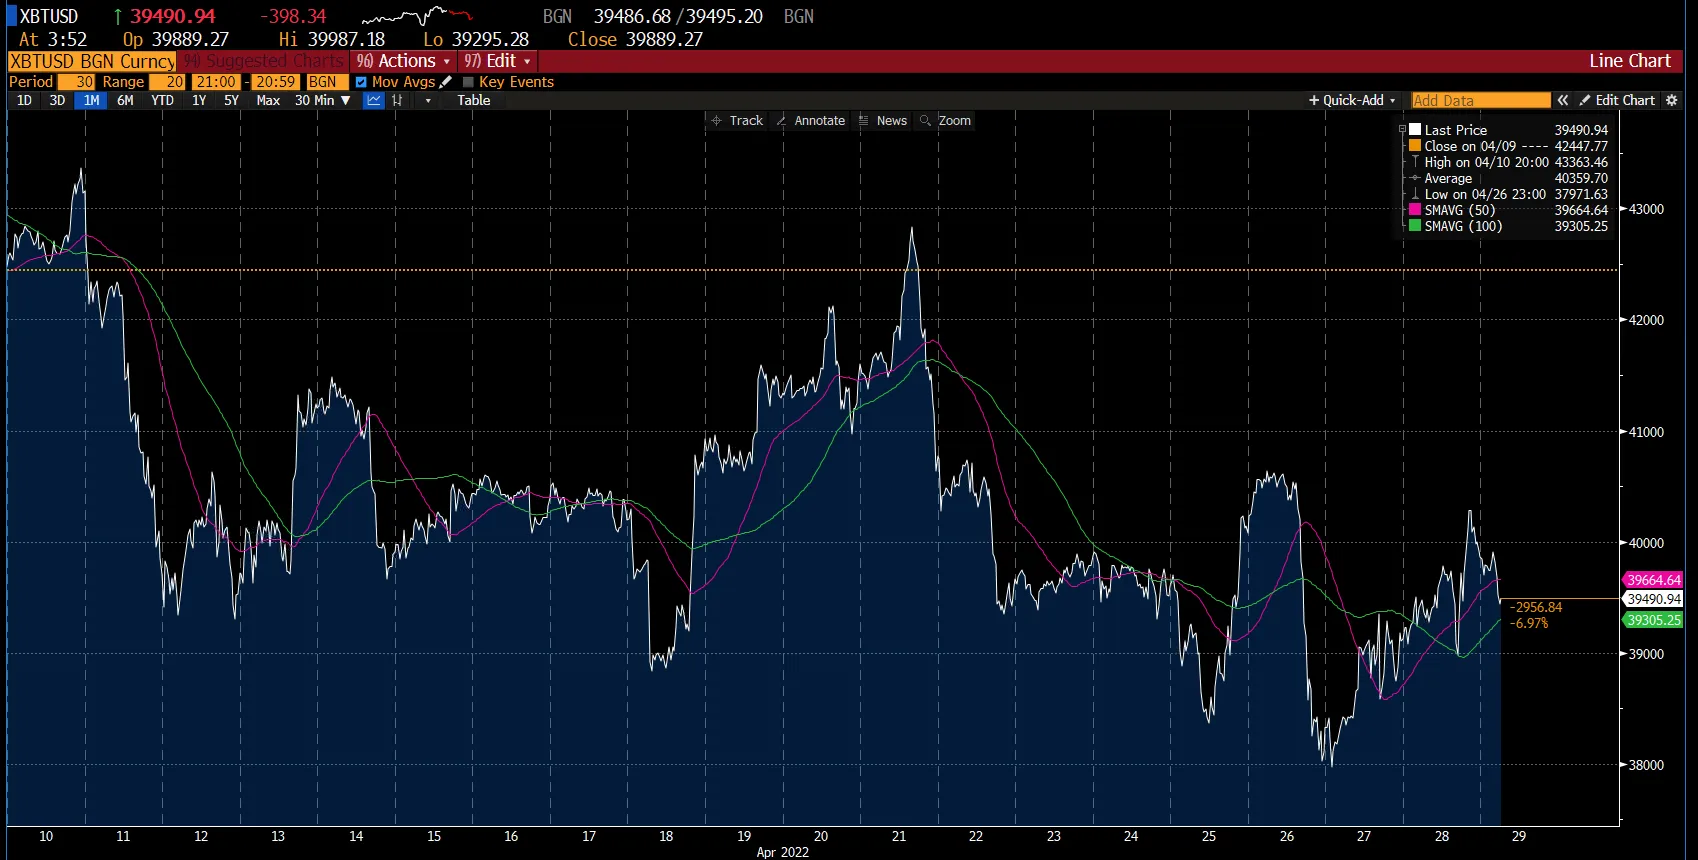
Ever since its massive drop during the start of the week, Bitcoin has been recuperating and slowly making its way back to the $40,000 mark, as seen in the chart above.
Towards the end of the week, it was trading at around the $39,500 mark, nearly bisecting its SMA 50 and SMA 100, which were at $39,664.64 and $39,305.25, respectively. The 2 moving averages have switched roles, playing support and resistance at different times during the week.
Major altcoins such as Ethereum, Dogecoin, and Litecoin dovetailed with the master cryptocurrency and showed near-identical patterns as well. Although slowly making their way back to their level at the start of the week, Dogecoin is the biggest laggard, having seen the least recovery since the slump.
As a result, the total cryptocurrency market capitalisation saw a massive decline when most major cryptocurrencies plunged, in the first half of the week.
Crypto news
The Bank of Canada is working on its own central bank digital currency. The bank chief has confirmed that the Canadian dollar will stay at the foundation of the country’s financial system. In other developments, more workers in the United States will be able to park their 401(k) retirement savings in Bitcoin.
In the Middle East, Dubai has been attracting major cryptocurrency firms, following the announcement of the first law governing digital currency in March. Additionally, the Central African Republic lawfully accepted Bitcoin as its legal tender.
Since the beginning of April, Bitcoin has not seen massive gains. However, the continued receptivity from world regulators is indicative of its long-term stronghold.
US Indices
In response to a string of bad trading days this week, traders have stepped up, pushing stocks higher ahead of earnings reports ending the week with split sentiments.
Strong earnings from tech companies like Facebook (Meta) boosted overall market sentiment as it went up by around 14% despite a revenue miss, a result of traders and analysts digesting the company's plans to cut spending. Moreover, Meta's Facebook app has gained users once again, with daily active users rising by 4% to 1.96 billion after losing 1 million users in the previous quarter.
Elon Musk's takeover of Twitter for $44 billion was another highlight of the week. Stock price rose by 5.9% to $51.79 with a reported $513.3 million increase in first-quarter net income, a remarkable jump from $68 million in the same period in 2021, just days after being sold.
The company reported a 16% increase in daily active users to 229 million. US users increased by 6.4% year on year to 39.6 million at the end of the first quarter, while international users increased by 18.1% to 189.4 million.
Indices market news
Treasury yields rose, with the 10-year yield rising to around 2.80%. The Q1 economic growth rate in the United States was -1.4%, lower than the consensus expectation of 1.1%. Despite this, several underlying trends continued to be strong.
Personal consumption increased by 2.7% for the quarter, indicating that the housing and business sectors of the US economy remained solid. Low net exports, a slower build-up of inventories, and less fiscal spending were the growth stumbling blocks.
The market mood is improving, but the macroeconomic backdrop remains tense, such as China’s lockdown due to a Coronavirus outbreak and the US central bank’s move to raise interest rates to fight rising inflation. Some tech stocks, which performed well during the expansionary monetary policy era caused by the pandemic, may still be vulnerable to rising interest rates.
Now that you’re up-to-date on how the financial markets performed last week, you can improve your strategy and trade CFDs on Deriv MT5 Financial and Financial STP accounts.

Weekly market report – 9 May 2022
The EUR/USD pair had a volatile week, ending at around $1.0547, not far from the year-to-date low of $1.0470. While the pair recovered some of its previous weekly losses, it remains bearish overall.
Forex

EUR/USD
The EUR/USD pair had a volatile week, ending at around $1.0547, not far from the year-to-date low of $1.0470. While the pair recovered some of its previous weekly losses, it remains bearish overall.
Last week, central banks took centre stage as overheating inflation continues to spiral out of control and monetary tightening becomes the new normal. On Wednesday, 4th May 2022, the Federal Reserve of the United States approved a half-point increase in interest rates (50 bps), which is twice as large as the quarter-point increase approved in March and the biggest hike since 2000. It was also announced that the bank will begin reducing its balance sheet on 1st June.
The announcement, which was broadly expected, triggered little reaction from financial markets. However, with Chair Jerome Powell's press conference, all hell broke loose as he dismissed potential 75-bps hikes. Investors applauded the "less aggressive" stance, but Wall Street rallied, dragging high-yielding currencies with it to the detriment of the US dollar. Following the announcement, the EUR/USD pair reached a weekly high of $1.0626 before falling to a weekly low of $1.0487 the next day.
Furthermore, market participants realised that while the Fed may not have been more aggressive than expected, it is the one imposing the most stringent measures. The European Central Bank has mentioned July as a possible date for a rate hike, but by then, the Fed would have likely pulled the trigger again by 50 basis points. In the long run, the imbalance between central banks may continue to favour the US dollar.
The crisis in Eastern Europe is another significant factor weighing on the common currency. Russian aggression against Ukraine continues unabated. Even after the sixth round of sanction announcements, the European Union still has not agreed on a full oil embargo, despite its ongoing struggle to replace Russian energy.
On the technical side, EUR/USD went up modestly by 0.42%. As per the week’s hourly chart, EUR/USD is currently near the 38.2% retracement level at around the $1.0540 mark, acting as the support level. If it breaches its support level, the next support level would be at the 23.6% retracement level at around the $1.0519 mark. On the flip side, the current resistance level is at the 50% retracement level at around $1.0556, followed by the next resistance level at the 61.8% retracement level at around $1.0573.
GBP/USD
For the GBP/USD pair, the Fed-BOE contrast remained in play as the UK's dire economic outlook widened the economic divergence alongside the monetary. GBP/USD remained relatively stable throughout the week before plunging to new 22-month lows below $1.23, dropping for the third week in a row.
The Bank of England (BoE) raised interest rates by 0.25% to 1% on Thursday, 5th May 2022 in line with market expectations, but warned that inflation could reach double digits in the third quarter and growth could fall into negative territory in 2023. This double whammy of bad news sent the already weak British pound tumbling lower, with any minor recoveries being sold off again.
This week’s focus would be on inflation, with the CPI report scheduled on 11th May 2022 and the UK’s GDP scheduled on 12th May 2022.
Level up your trading strategy with the latest market news and trade CFDs on your Deriv X Financial account.
Commodities

Gold
Dropping again for the third week in a row, gold reached around the $1,850 mark – its lowest price since February. Although the yellow metal managed to recover in the second half of the week, broad-based dollar strength prevented gold from breaking its three-week losing streak.
On Wednesday, 4th May 2022, after the Fed announced the increased policy rate by 50 basis points and dismissed the possibility of 75-bps rate hikes, gold started to rebound, climbing to a 5-day high at around the $1,900 mark. But it couldn’t maintain its momentum due to the stock market sell-off and the strengthening of the US dollar. Another reason gold was unable to gain traction last week was due to rising US yields.
As per the hourly chart for the week, gold ended its week at around the $1,883 mark between the 50% and 61.8% retracement levels at around $1,880 and $1,887, acting as the support and resistance levels respectively. If the support level is breached, its next support level would be at the 38.2% retracement level at around $1,874. If the resistance level is breached, the next resistance level would be at the 76.4% retracement level at around $1,894.
Gold may struggle to make a decisive move in either direction ahead of this week's key US inflation data. Investors will also be paying close attention to new developments concerning China's lockdowns and the Russia-Ukraine conflict.
Oil
Brent and WTI rose for the second week in a row, boosted by the EU's proposal to phase out Russian crude oil supplies in the next six months and the refined products by the end of 2022. It would also prohibit all shipping and insurance services for Russian oil transport.
If the EU successfully enacts this crude oil ban across its 27 member states, crude oil prices will likely remain high during the fall and winter months, when global crude oil demand typically declines.
Maximise market opportunities by sharpening your trading strategy and trading the financial markets with options and multipliers on Deriv Trader.
Cryptocurrencies

The cryptocurrency market saw a major decline during the course of last week, with Bitcoin spearheading the trend.
Bitcoin started the week trading sideways. On 4th May 2022, investors saw a glimmer of hope when Bitcoin almost grazed the $40,000 mark. However, this was short lived when the cryptocurrency plummeted to the $36,000 mark on 6th May 2022, as you can see from the chart. The short term moving averages SMA 5, SMA 10, and SMA 15 kept changing roles of key supports and resistances. The trio of moving averages converged and diverged repeatedly to end the week at $34,352, $34,432, and $34,510 respectively.
The world’s most popular cryptocurrency broke from its wave-like crest and trough pattern in the previous week and entered a nosedive, to slip for 4 consecutive days and end the week around the $34,000 mark. The digital currency is down 50% from its all-time high of nearly $68,000 in November 2021.
Barring stablecoins that are pegged to the US dollar, all major cryptocurrencies and altcoins followed the Bitcoin bandwagon into their lows. Ethereum dropped by 4%, Terra tumbled 6%, Avalanche plunged 5%, and Dogecoin traded 7.5% lower.
The downtrend experienced by the cryptocurrency market can be attributed to several reasons. The broad stock-sell in the US last week caused havoc in the cryptocurrency world, and major cryptocurrencies followed the downtrend of the equity markets. In addition, investors reacted to the increase in the interest rates by the Fed Reserve, its steepest increase in 2 decades in a battle against inflation.
The Russia-Ukraine war continues to impact investor sentiments, who are increasingly abandoning riskier assets and parking their funds in safe haven assets.
In other cryptocurrency related news, Portugal remains what people call the ‘crypto heaven’ as other European countries impose regulations and obligations on digital currencies.
Italian luxury fashion brand Gucci has announced that it will start accepting cryptocurrency payments in the US this month, as reported by Bloomberg. The fashion house will accept 10 cryptocurrencies including Bitcoin, Ethereum, and Dogecoin to start with.*
US Indices
.webp)
*Net change and net change % are based on the weekly closing price change from Monday to Friday.
The major US indices continued to lose their traction for the fifth week in a row after a sharp shift in sentiment sent stocks tumbling and the major indices ended the week with relatively modest weekly declines: -2.92% for the NASDAQ, -0.77% for the S&P 500, and -0.49% for the Dow.
Meanwhile, the economy faces headwinds from ongoing supply disruptions caused by China's lockdowns as well as rising consumer costs worsened by high oil prices. However, consumer employment conditions remain positive as it generated around 428,000 jobs in April 2022.
We also saw a surge in the 10-year Treasury Bond yield, which jumped from around 2.90% to around 3.10% at the end of the week.
Despite the heat of inflation, the latest trends indicate it has peaked and is headed towards a gradual decline. This can be seen by the Consumer Price Index report, due to be released on Wednesday, 11th May 2022, which will show whether the US economy experienced any relief from surging inflation in April. A month earlier, the government reported that inflation accelerated in March to an annual rate of 8.5%, the highest since 1981, surpassing the previous month's figure of 7.9%.
Now that you’re up-to-date on how the financial markets performed last week, you can improve your strategy and trade CFDs on Deriv MT5 Financial and Financial STP accounts.

Weekly market report – 16 May 2022
On Friday, 13 May 2022, the US dollar index fell for the first time in 7 trading days. A recovery in equity prices weakened the greenback, which had a negative effect across the board.
Forex

On Friday, 13 May 2022, the US dollar index fell for the first time in 7 trading days. A recovery in equity prices weakened the greenback, which had a negative effect across the board.
The EUR/USD fell to $1.035 (the weakest it's been in 5 years), on Thursday, 12 May 2022, amid worries of a recession and the interest rate differential between the monetary policies of the US Federal Reserve and the European Central Bank. The Euro came under severe pressure on Thursday, 12 May 2022, after several bearish geopolitical developments surrounding relations and trade with Russia regarding energy had taken place.
The chart above replicates this drop on Thursday, 12 May 2022. We can see the price fell below its support levels to act as the new resistance level. The pair picked up from the bounce but only saw a flat trend to end the week.
However, the EUR/USD pair rebounded from its lowest intraday level since 2017 and climbed back above $1.04 late on Friday, 13 May 2022. This bounce-back was due to an improvement in risk sentiment and a correction of the US dollar.
GBP/USD ended the week at approximately $1.2160, falling further by 0.3% on Friday, 13 May 2022, and taking its weekly losses to around 1.4%. In the past 4 weeks, the pair has seen losses totalling approximately 7.0%. In particular, the pound ended the day at its lowest since November 2020, when the UK was in a coronavirus lockdown.
GBP/USD was under heavy pressure last week caused by the strong safe-haven asset US dollar and because of a combination of bearish factors arising from the UK and Europe. Data showed that inflation has slowed, and underlying price pressures remain elevated, weighing on traders' sentiment.
The USD/JPY is gradually moving higher and is expected to reclaim the mark of ¥130.00 as traders brace themselves for a hawkish tone from Federal Reserve's chair Jerome Powell on the coming Tuesday, 17 May 2022. The speech from Fed Chair Powell will shed some light on the Fed's monetary policy stance in its June interest rate announcement.
Meanwhile, the Japanese Yen is facing pressure after the Bank of Japan's (BoJ) Governor, Harihuko Kuroda, promised a conservative monetary policy in the future. This statement was published on Friday, 13 May 2022, highlighting that the economy has not yet achieved its pre-pandemic growth levels, and inflation is still not at par with the targeted levels.
The economic calendar for next week is fairly light as US retail sales and EU inflation data are likely to steal the spotlight.
Level up your trading strategy with the latest market news and trade CFDs on your Deriv X Financial account.
Cryptocurrencies
Last week, the global market capitalisation of cryptocurrencies stumbled below $1.2 trillion, falling by about 65% from its peak of $3.2 trillion at the end of 2021. The global crypto market capitalisation saw a decline of nearly 27% in the market volume on Thursday alone.
The world's most popular cryptocurrency fell by more than 10% in a single day. On Thursday, 12 May 2022, the price of Bitcoin dropped to around $26,000, its lowest level since December 2020. It steadied at about $30,000 on Friday, 13 May 2022, but that was still less than half of Bitcoin's price last November – $69,000. However, the weekly net change in Bitcoin volatility was the highest in the two years.
The recent decline in stablecoins has made crypto markets vulnerable. As per a Bloomberg report, the wipeout of algorithmic stablecoin Terra/USD and its sister token Luna knocked more than $270 billion off the crypto sector's total trillion-dollar value.
Stablecoins have been viewed as a safe harbour among cryptocurrencies because the value of many stablecoins is pegged to a government-backed currency, such as the US dollar, or precious metals such as gold.
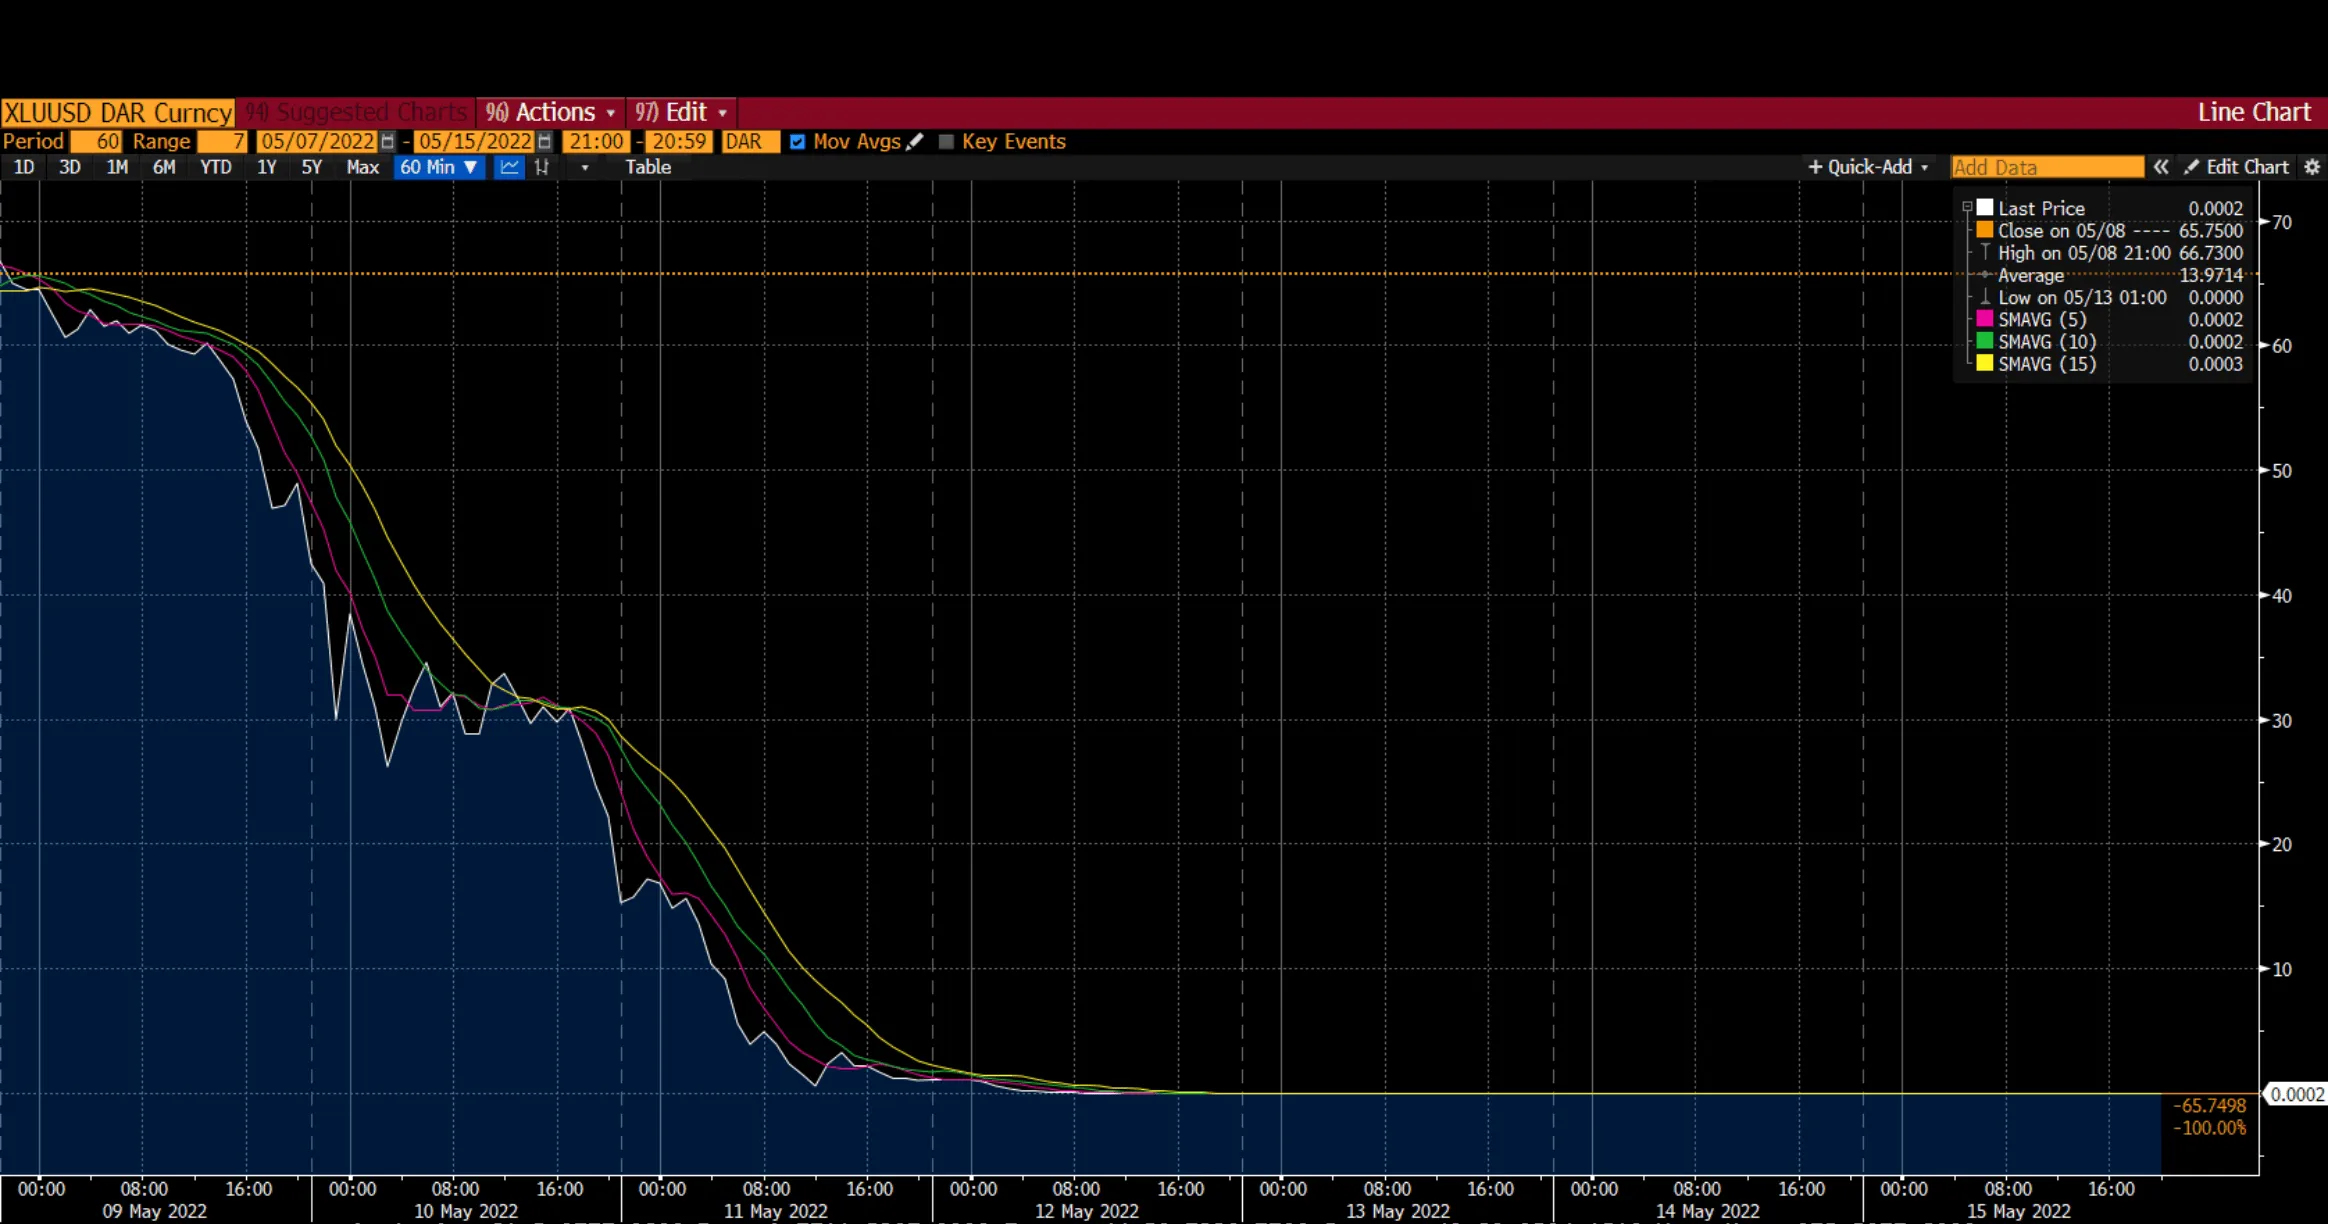
But this week, Terra experienced the unexpected. Terra's problems began with withdrawals from Anchor, a platform that supported this stablecoin. Since Friday, 13 May 2022, Anchor's total deposits have fallen from $14 billion to $2.2 billion. Along with concerns about cryptocurrencies as a whole, and the drop in Bitcoin's price, Terra started to lose its peg to the US dollar.
After beginning the week on Monday at $66, the coin Luna was trading at approximately $0.0002 on Friday, 13 May 2022.
Furthermore, Polkadot dipped by over 3% in market cap and over 26% in volumes. Solana dropped by over 2% in market cap and 25.5% in volumes, while Avalanche slipped by over 3% in market cap and fell by nearly 32% in volumes.
Maximise market opportunities by sharpening your trading strategy and trading the financial markets with options and multipliers on Deriv Trader.
Commodities
Despite recovering from Friday's fall below $1,800, gold lost more than 2% on a weekly basis as the Dollar Index extended its winning streak to 6 weeks when the Federal Reserve increased interest rate expectations. According to Jerome Powell, the FOMC is expecting 2 more 50 basis point rate hikes in June and July, which indicates they will do more if data "turns the wrong way." As a result, the US Dollar Index hit a nearly two-decade high of around $105.
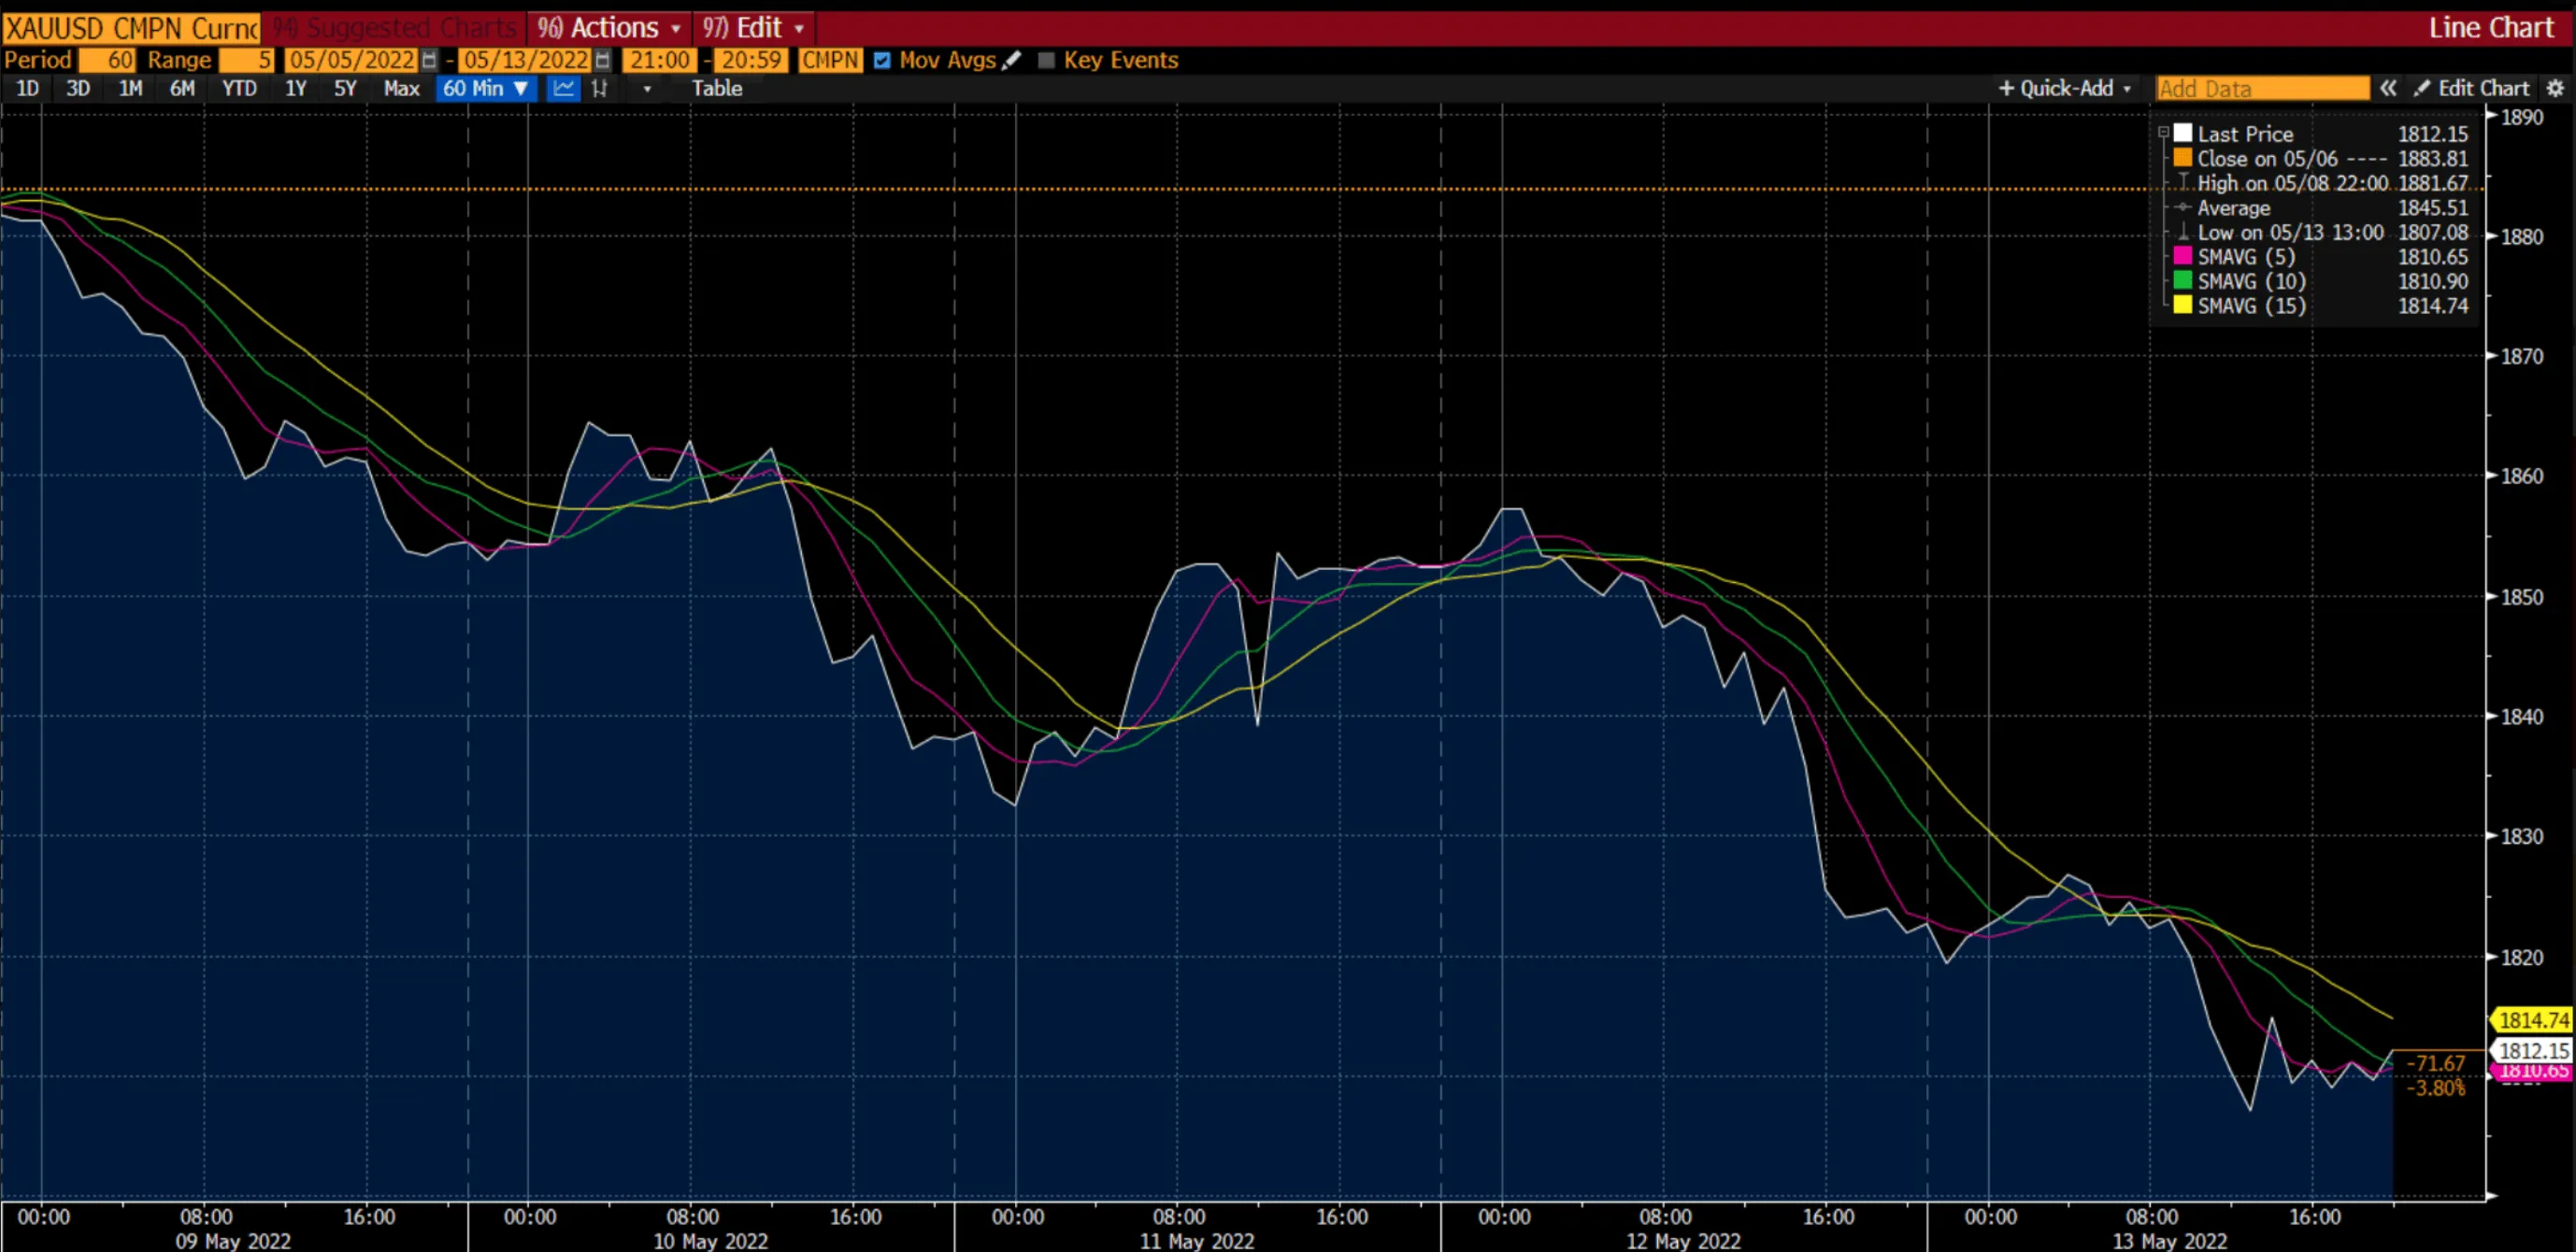
From a technical perspective, gold prices continued to decline and have attempted to go below the $1,800 mark, extending the bearish trend. On Friday, 13 May 2022, gold traded sideways near its two-month low of $1,810. Although gold briefly fell below $1,800 in the American session, it managed to recoup some of its daily losses and ended the week at around $1,812.15. This recovery came after the University of Michigan's monthly publication revealed that consumer confidence in the United States fell in early May.
Based on the hourly chart for the week, if gold continues to decline, its support level would be near $1,807.07. Additionally, due to the recoup, it managed to stay slightly above the SMA 5 and SMA 10 at $1,810.65 and $1,810.90, respectively.
Traders are also concerned that a more aggressive move by major central banks to contain inflation could harm global economic growth and precipitate a recession. Furthermore, shockingly poor Chinese macro data exacerbated the fears and, when combined with the resurgence of geopolitical tensions, weighed on risk sentiment, forcing traders to seek refuge in traditional safe-haven assets. This shift may provide some support for the safe-haven metal. Aside from that, the yellow metal's attractiveness as an inflation hedge may help limit further losses for the XAU/USD, at least for the time being.
On the other hand, the oil market has been volatile this week, falling below $100 amid concerns about the US and global economic slowdown, which could reduce demand for crude. However, oil seemed to have recovered most of those losses recently, as sharply falling US inventories of refined fuels combined with ongoing tensions between Russia and Ukraine shifts the market's focus back to the supply side.
This week, market participants will be looking for clues about the possibility of a 75-bps rate hike from remarks by several FOMC officials, including Fed Chair Jerome Powell. This economic event, in turn, will have a significant impact on the near-term USD price dynamics and provide a new directional boost to gold.
In addition to this, Foreign ministers from the EU will meet in Brussels to discuss the next round of Russian sanctions, and diplomats have floated the idea of delaying a proposed ban on its oil imports in response to Hungary's objections. According to government officials, Germany intends to stop importing Russian crude by the end of the year if the EU fails to agree on coordinated action.
US Indices
.webp)
*Net change and net change % are based on the weekly closing price change from Monday to Friday.
US Indices had a mixed week as traders grew increasingly doubtful that the Federal Reserve could prevent a recession by raising interest rates enough.
With the Fed's policy change, the consumer price index (CPI) was expected to show a slowing in inflation, giving traders relief. CPI rose by 8.3% in April compared to 8.5% in March, while core prices (excluding food and energy) rose by 6.2% versus 6.5%. The 0.6% monthly gain in the core index was of particular interest, with it being the largest gain in 3 months. Moreover, rates for rentals and airline fares rose by 0.6% and 18.6%, respectively, as travel demand rebounded strongly.
Also, the US government bond prices recovered modestly on Friday, 13 May 2022, with the 10-year US Treasury bond yield falling to around 2.93%. The 10-year yield had risen to 3.13% in the previous week after breaking through the 3% barrier for the first time since November 2018. It may be that the inverse correlation between stocks and treasuries is returning as stocks fell significantly this week, explaining the fall in yields as a whole and the increase in the Treasury prices.
Currently, the main drivers of the market are the Fed's accelerated pace of monetary tightening, persistently high inflation data, concerns about slowing growth, and disruptions caused by China's strict COVID-19 lockdowns.
Now that you’re up-to-date on how the financial markets performed last week, you can improve your strategy and trade CFDs on Deriv MT5 Financial and Financial STP accounts.

Why do you need to get in on the cryptocurrency action?
Most people are familiar with cryptocurrencies to some extent today. It’s hard to miss the headlines about it, whether you already own crypto or have never considered having it.
Most people are familiar with cryptocurrencies to some extent today. It’s hard to miss the headlines about it, whether you already own crypto or have never considered having it.
However, many people still prefer using good old fiat currency — paper money issued by a government. Are you missing out on something important if you don’t have crypto?
While fiat currency is not going anywhere anytime soon, cryptocurrency can be a good investment in the future. Let’s explore why.
Benefits of using crypto
The biggest advantage of the cryptocurrency world is its decentralisation. It means that virtual money is not issued and not controlled by any government, which makes digital coins completely independent. Cryptocurrencies are immune to inflation, bank failures and monetary policies of the governments. Aside from this, there are a number of other advantages of using these decentralised currencies:
- Value
Due to inflation, fiat currencies lose their value and buying power over time. The global yearly inflation rate can be anywhere from 1% to 10% and higher, depending on the economic situation. So, 100 USD deposited into your fiat account will have a lower value a year later.
On the other hand, cryptocurrency is a highly volatile market with big price fluctuations. It means if you invest the same 100 USD in it, its value can either increase or decrease over time. However, the value of the majority of digital coins has increased significantly over time.
For example, people who bought one Bitcoin in 2011 with 1 USD and kept it until today have thousands of dollars in value for the same digital coin at the moment of writing. Although it experienced a few upward and downward price swings, it has never dropped back to 1 USD, multiplying the value of the initial investment thousands of times.
- Security
Although the cryptocurrency world has witnessed some hacking attacks, they were targeting crypto wallets, while the virtual currencies and technology behind them are still highly secure and cannot be hacked. There is no way to make a fake cryptocurrency or steal your identity to use the digital coins you own. Nobody can show up at the bank with a weapon and demand giving them all the crypto it has.
Cryptocurrency transactions are also irreversible, which adds an extra level of security. Unlike regular debit and credit card transactions, which face fraud activities frequently nowadays, cryptocurrency is not exposed to this risk. Once a transaction is completed and digital coins are transferred to a new account, they cannot be recalled unless the recipient decides to transfer them back.
- Convenience
Fiat currencies are limited to the borders of the countries using them. For example, the USD is accepted worldwide, but in many countries, you still need to change it to a local currency to be able to use your money. Cryptocurrencies have similar prices everywhere, regardless of the country and continent.
Moreover, cryptocurrency transactions are very fast, and the majority of them are still considered inexpensive. You don’t have to wait 3-4 business days and pay a high fee to receive the transferred amount like you normally do with regular bank transfers. You can also transfer a tiny fraction of cryptocurrency, up to the 100th million part of it, unlike fiat transfers that require a minimum amount.
Now that you know why crypto is such a hot topic and why you need to get in on the crypto action, head on to the Trading with crypto: Top 3 myths blog. We’ll explain why more and more traders are trading using crypto instead of fiat and how you can get more crypto without buying it!

An introduction to Deriv Trader the trading platform
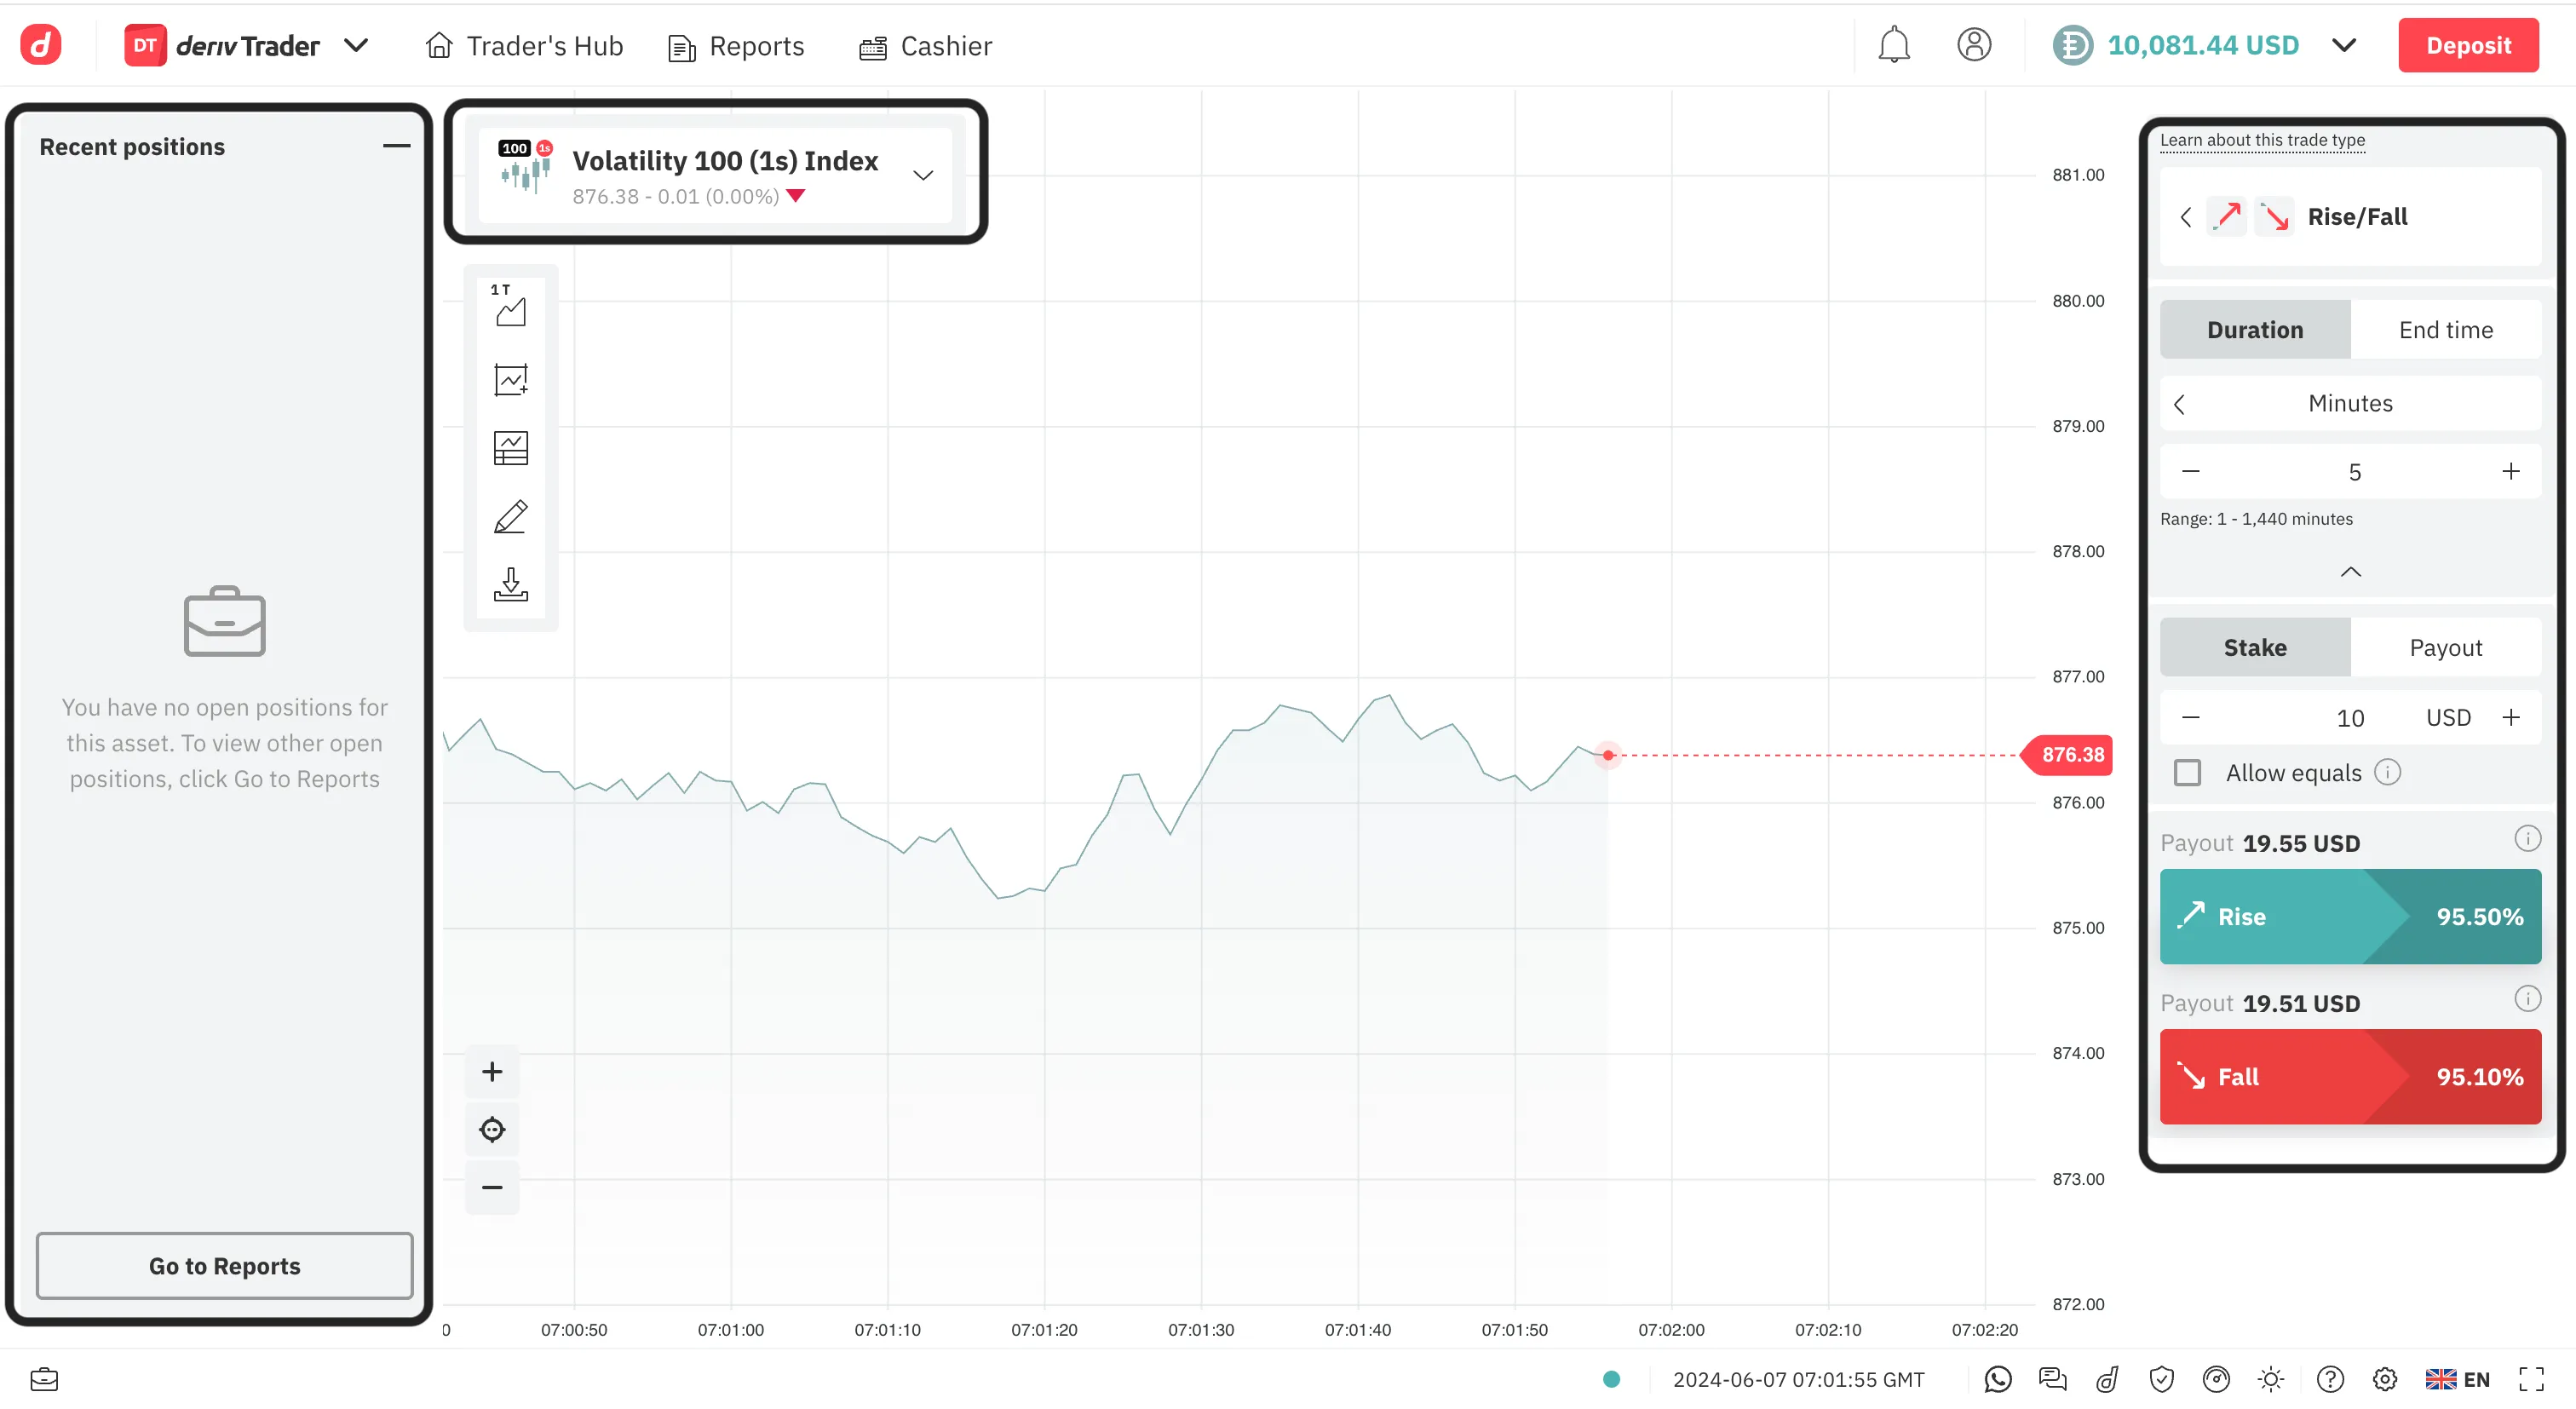
Deriv Trader is a powerful and easy-to-use trading platform. Get to know its features, trade types, markets and more.
This article was originally published on 5th May 2022 and updated on 7th June 2024.
To enhance your experience, we’ve added a video along with the article.
If a trading platform is simple and easy to use, does that mean it can only carry out basic functions? There are exceptions like Deriv Trader – an excellent example of simplicity combined with functionality.
As a beginner, you can take advantage of Deriv Trader’s user-friendly interface that encourages you to explore and enhance your trading skills. Alternatively, if you are an experienced trader, the platform’s various tools and features will help you refine your trading strategy.
Markets to trade
You can trade over 50 assets across forex, stock indices, and commodities within regular market hours. Additionally, you have access to the cryptocurrency market and Deriv’s synthetic indices trading around the clock.
Trade types available on Deriv Trader
Depending on the market and asset you choose, there are two trade types available on Deriv Trader — options and multipliers. Once you select an asset, you can check the trade types available for it.
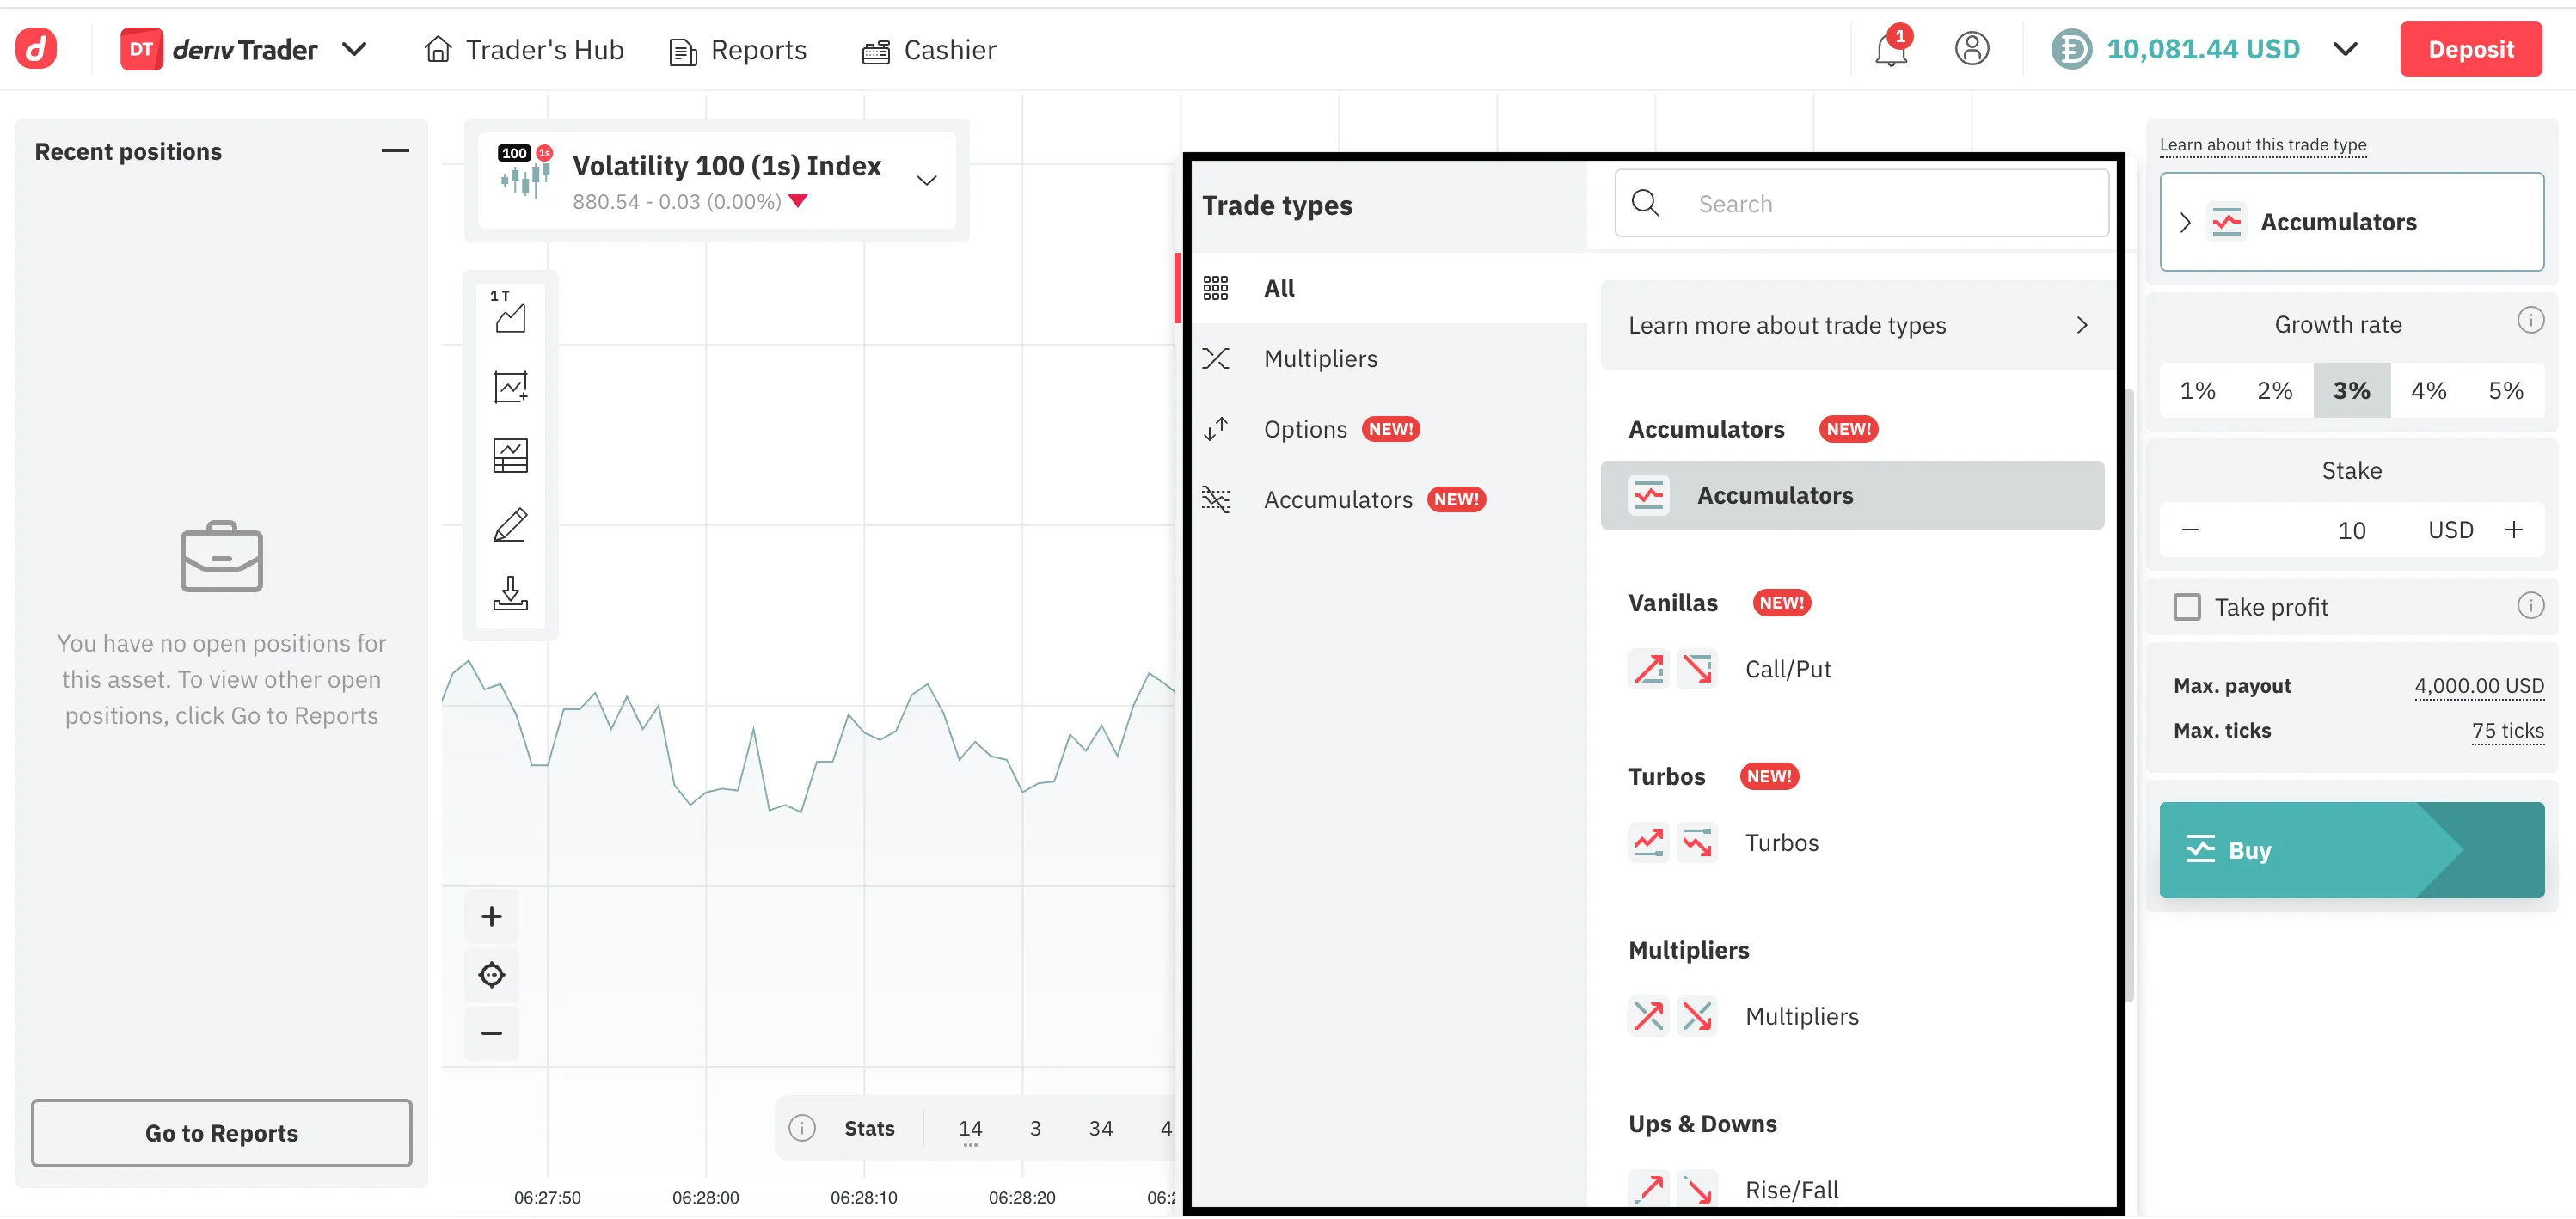
Options trading doesn’t require buying the underlying asset – you can earn payouts by correctly predicting the asset’s price movements. Deriv Trader has various trade types — Ups & Downs, Highs & Lows, and Digits, Vanillas and Turbos giving you the freedom to select your strategy.
With multipliers trading you also don’t need to buy the underlying asset. Using multipliers is similar to trading with leverage, where you can multiply your potential profits. But unlike leveraged trading, where potential losses are also amplified, trading with multipliers limits your potential losses to your stake. Additionally, multipliers offer risk management features to help you trade responsibly.
We have recently introduced a new type of trade known as accumulator options. This trade type allows you to capitalise on sideways movements within a predefined range, offering a unique way to engage with the markets. These ranges are determined based on a growth rate that you choose, with rates up to 5% per tick. Your potential payout will compound incrementally based on this rate, as long as the price stays within the specified range from the previous spot price.
How to use Deriv Trader
To get started, your first step is creating a Deriv account.

You’ll see the Deriv Trader dashboard right after logging in to your account. On the dashboard you can open a trade with your preferred asset, set your trade parameters, and modify or close your trade.
The platform also includes technical analysis tools to help you analyse the market price movements before you place your trade.

On the platform’s menu bar you can find the following tabs:
– Reports – displays your open positions, profit table, and account statement.
– Cashier – offers multiple options to deposit, withdraw, and transfer funds into your account.
– Account settings – provides access to your profile, password, security status, and more.
– Account info – displays all real and demo accounts you have created along with their balance.
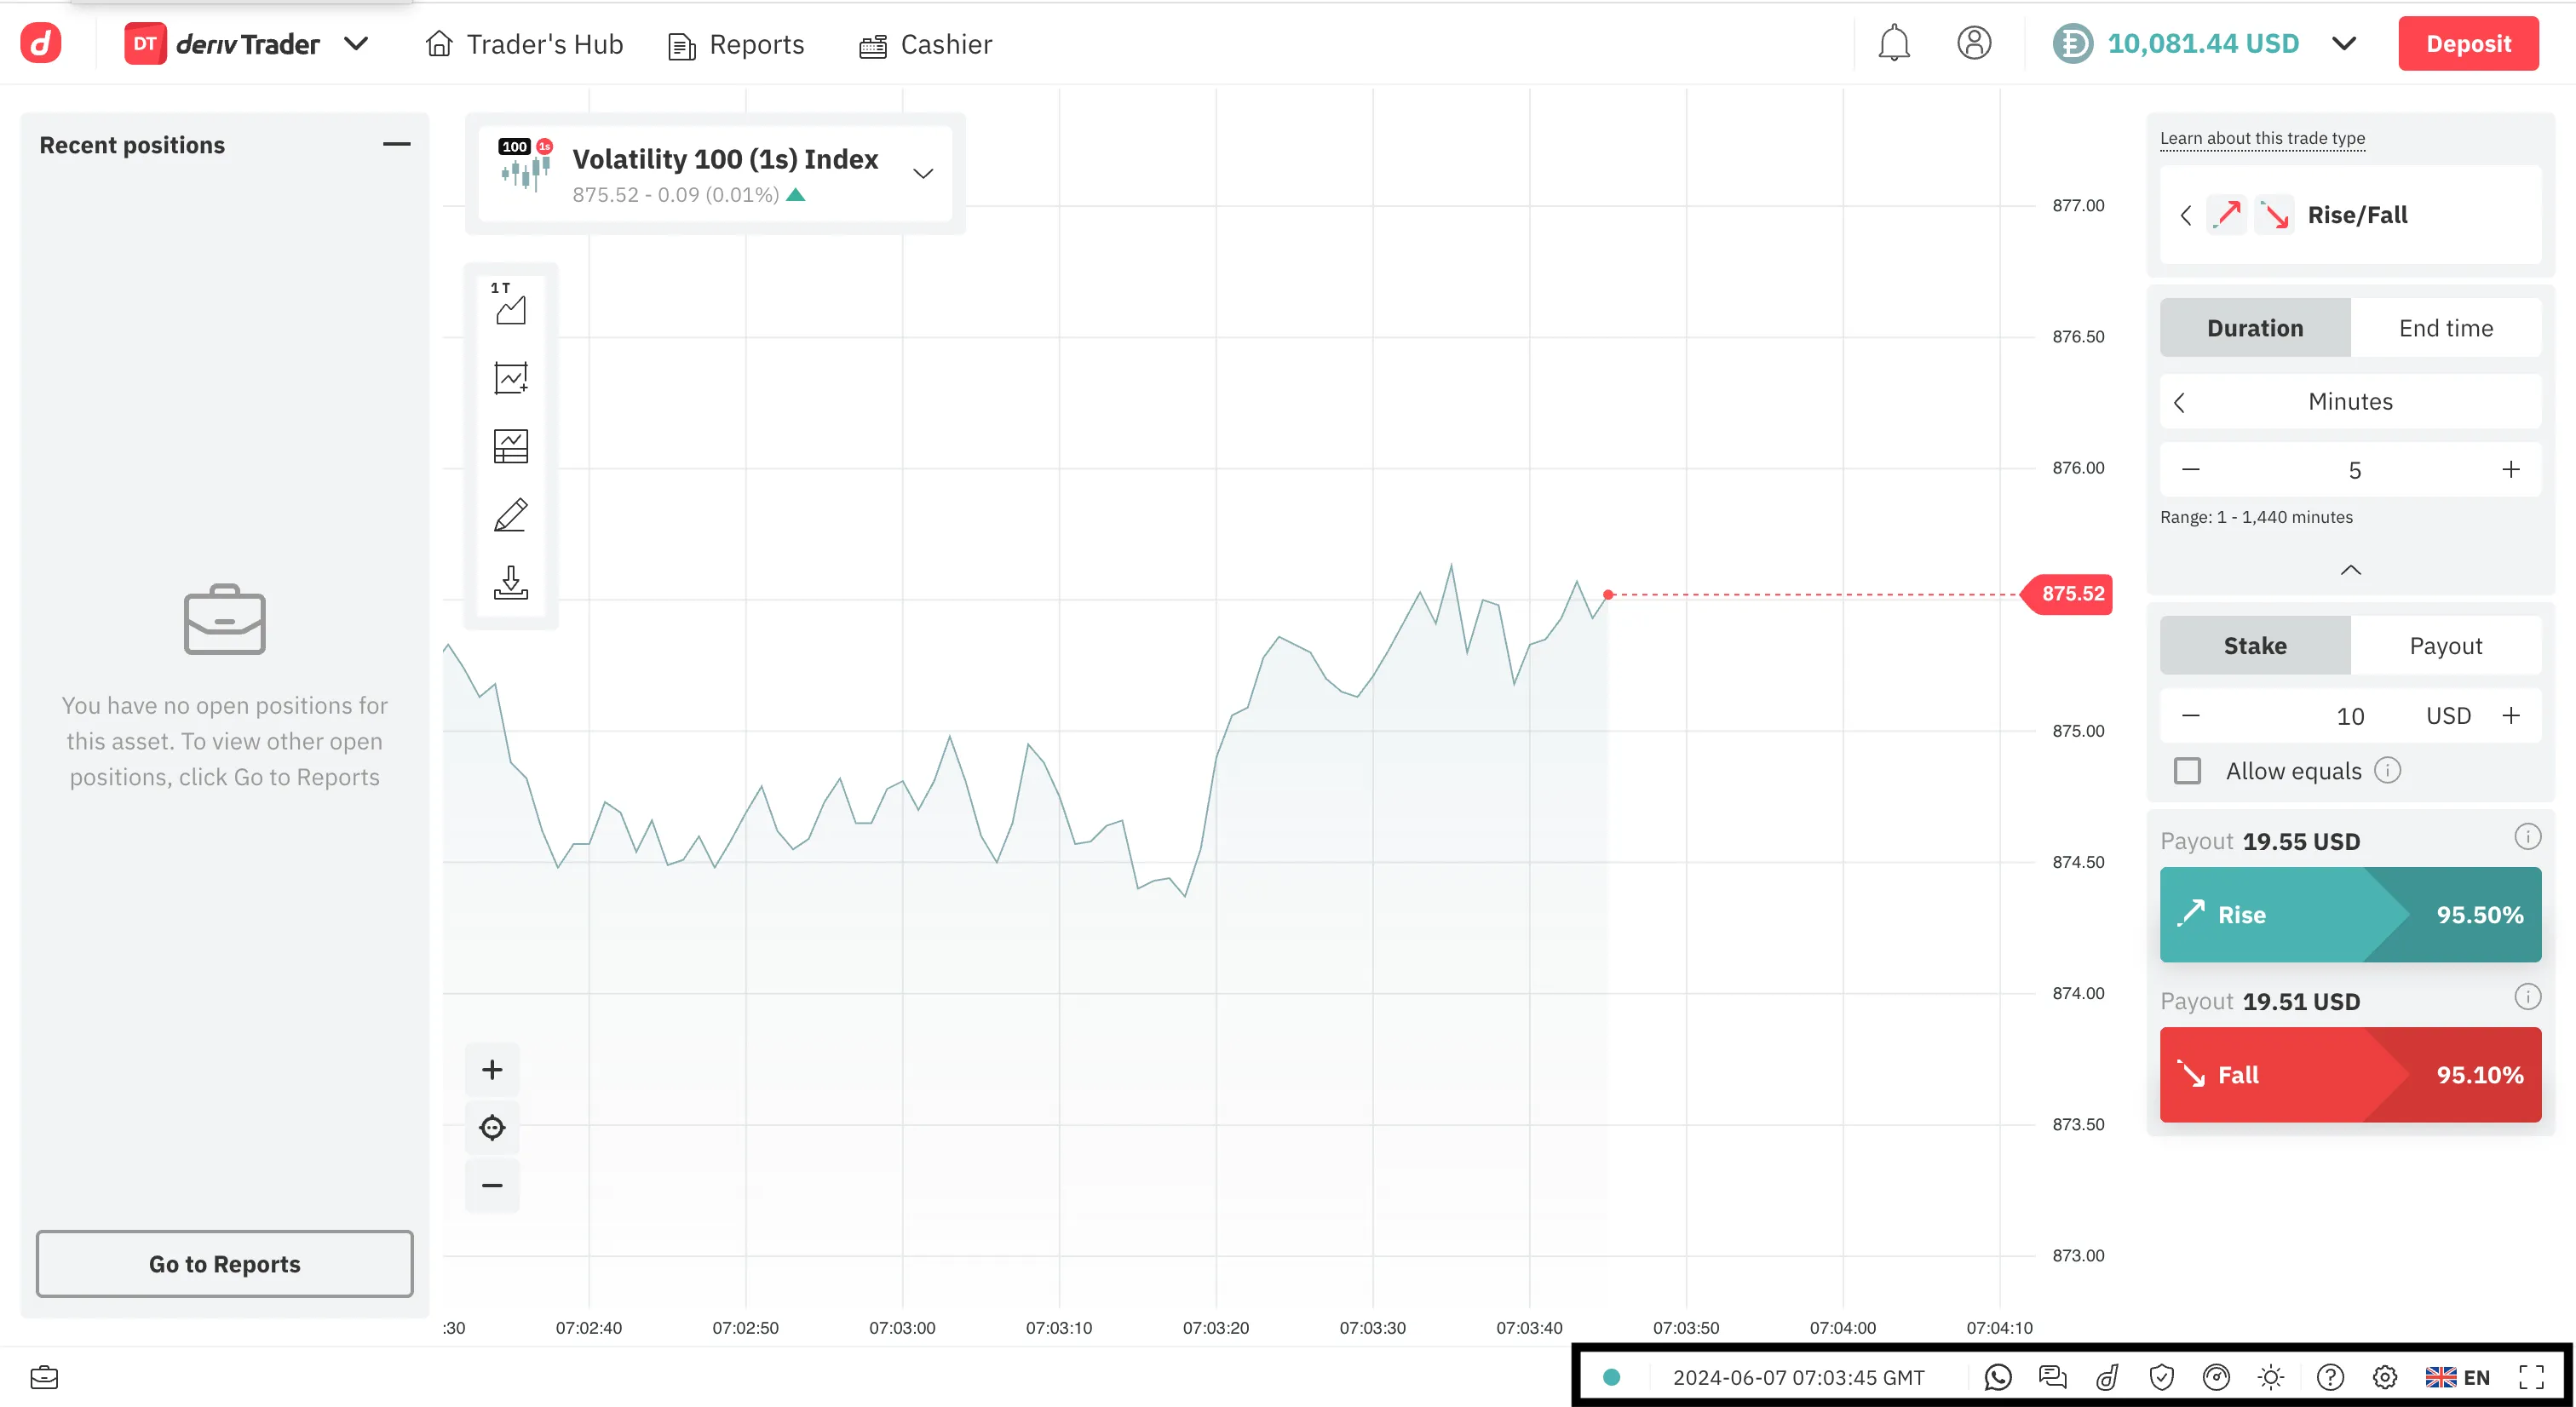
Moving on, the footer has a few buttons that you may need while using Deriv Trader:
– Date and Greenwich Mean Time – helps you keep track of the opening and closing time of the markets. Bringing your cursor over this tool will show your local time.
– Live chat – gives you instant access to our customer support representatives.
– Go to deriv.com – takes you to our website.
– Responsible trading – provides tips for safe and responsible trading.
– Account limits – displays trading and withdrawal limits of your account.
– Help centre – features answers to commonly asked questions.
– Platform settings – gives you an option to change the visual and language settings of the platform.
How Deriv Trader enhances your trading experience
1. Minimum stake as low as 0.35 USD
The minimum stake varies depending on the market and asset and ranges from 0.35 USD to 1 USD. This gives beginners an opportunity to start trading and learn concepts in a practical and cost-effective way. Even if you start with low capital, you can still explore different trade types, markets, and strategies.
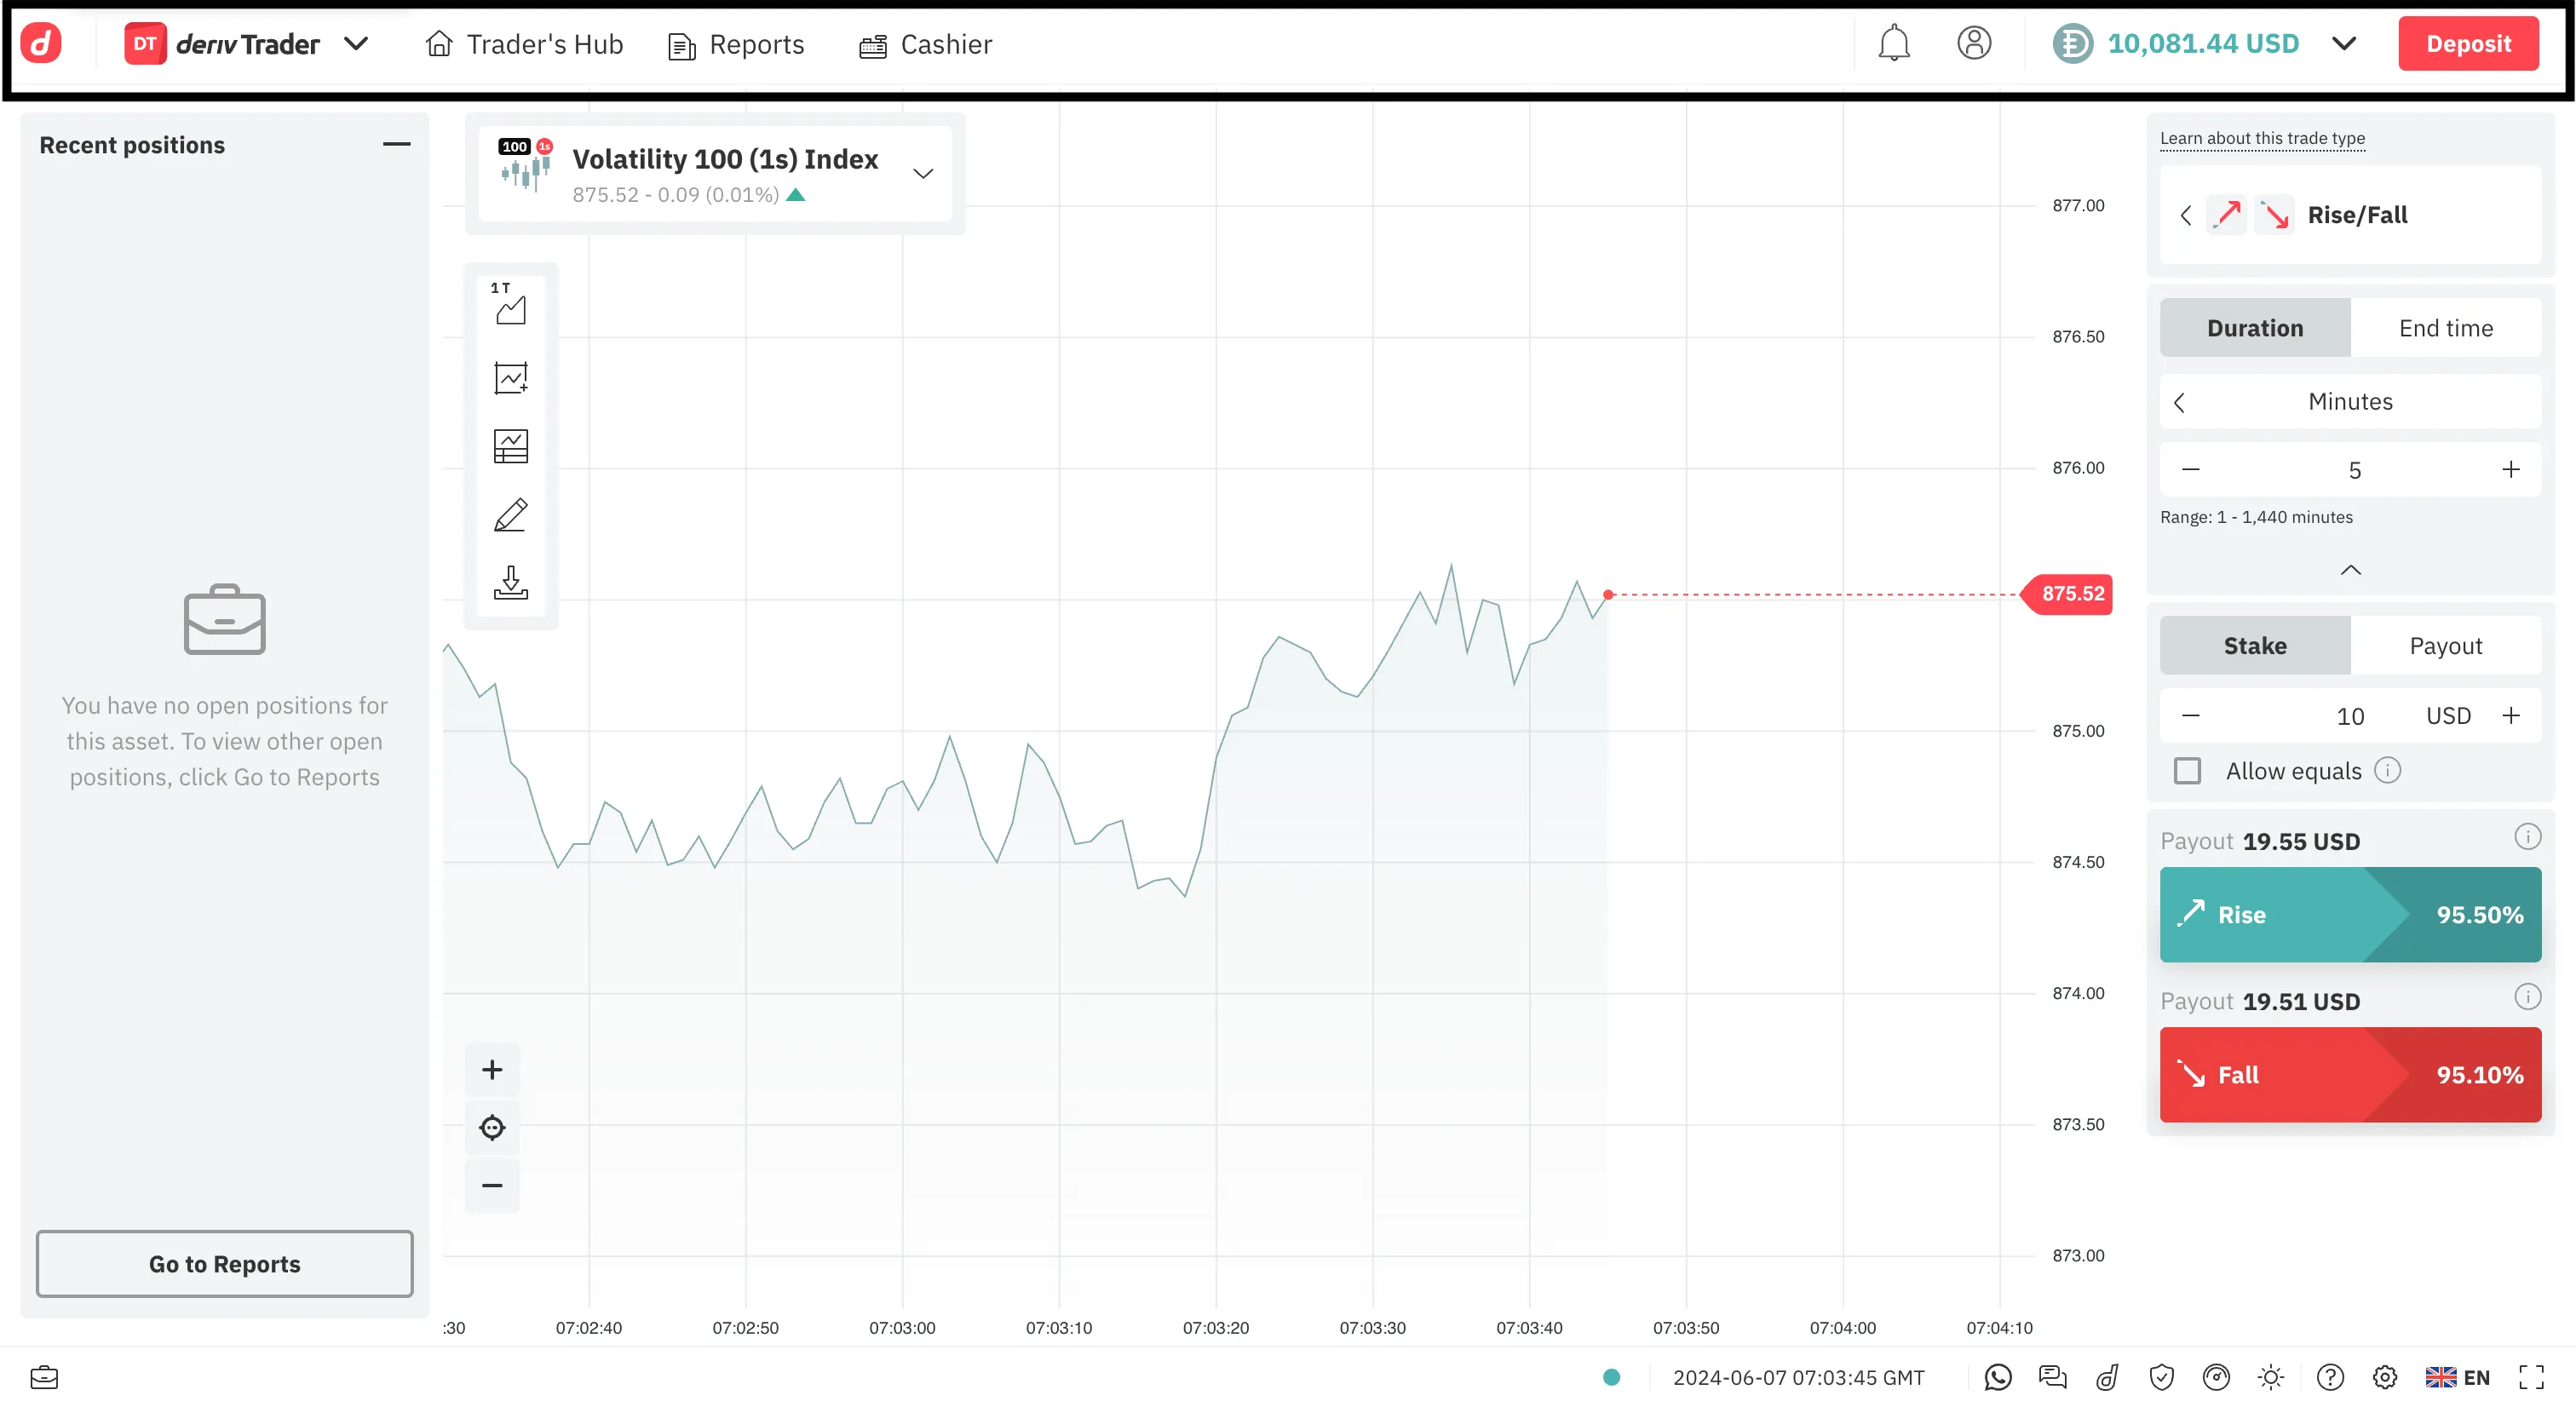
2. Contract duration as short as 1 second
Deriv Trader is one of the very few platforms that allows you to place trades for durations as short as 1 second. In other words, if you are confident about how the market will move in just a few seconds, Deriv Trader allows you to make a quick entry and exit. Besides that, Deriv Trader offers you an opportunity to place multiple trades on different markets, and with different trade types simultaneously to potentially profit from small price fluctuations.
3. Risk management features
Risk management is an essential part of trading, and that applies even when you are trading without purchasing the asset. On Deriv Trader, you can view your stake and payout correlation before placing the trade. This feature gives you a clear idea of how much you’ll earn if your prediction turns out to be correct, or how much you have to pay for a certain level of profit. Plus, multipliers include risk management features such as take profit, stop loss, and deal cancellation, allowing you to manage risks even more effectively.
At a glance, the Deriv Trader platform has a well-spaced layout with a designated spot for every tool, allowing easy navigation. Plus, once you start using it, you’ll discover that it combines the simplicity beginner traders crave with the advanced options experienced traders prefer.
Test all the features on Deriv Trader with a demo account loaded with 10,000 USD virtual money that you can use to trade instead of using your own funds.

Weekly market report – 30 May 2022
Last week, markets bounced back after several weeks of decline. As we learned, a few key variables like inflation and the US dollar influenced this outcome.
Last week, markets bounced back after several weeks of decline. As we learned, a few key variables like inflation and the US dollar influenced this outcome.
Forex
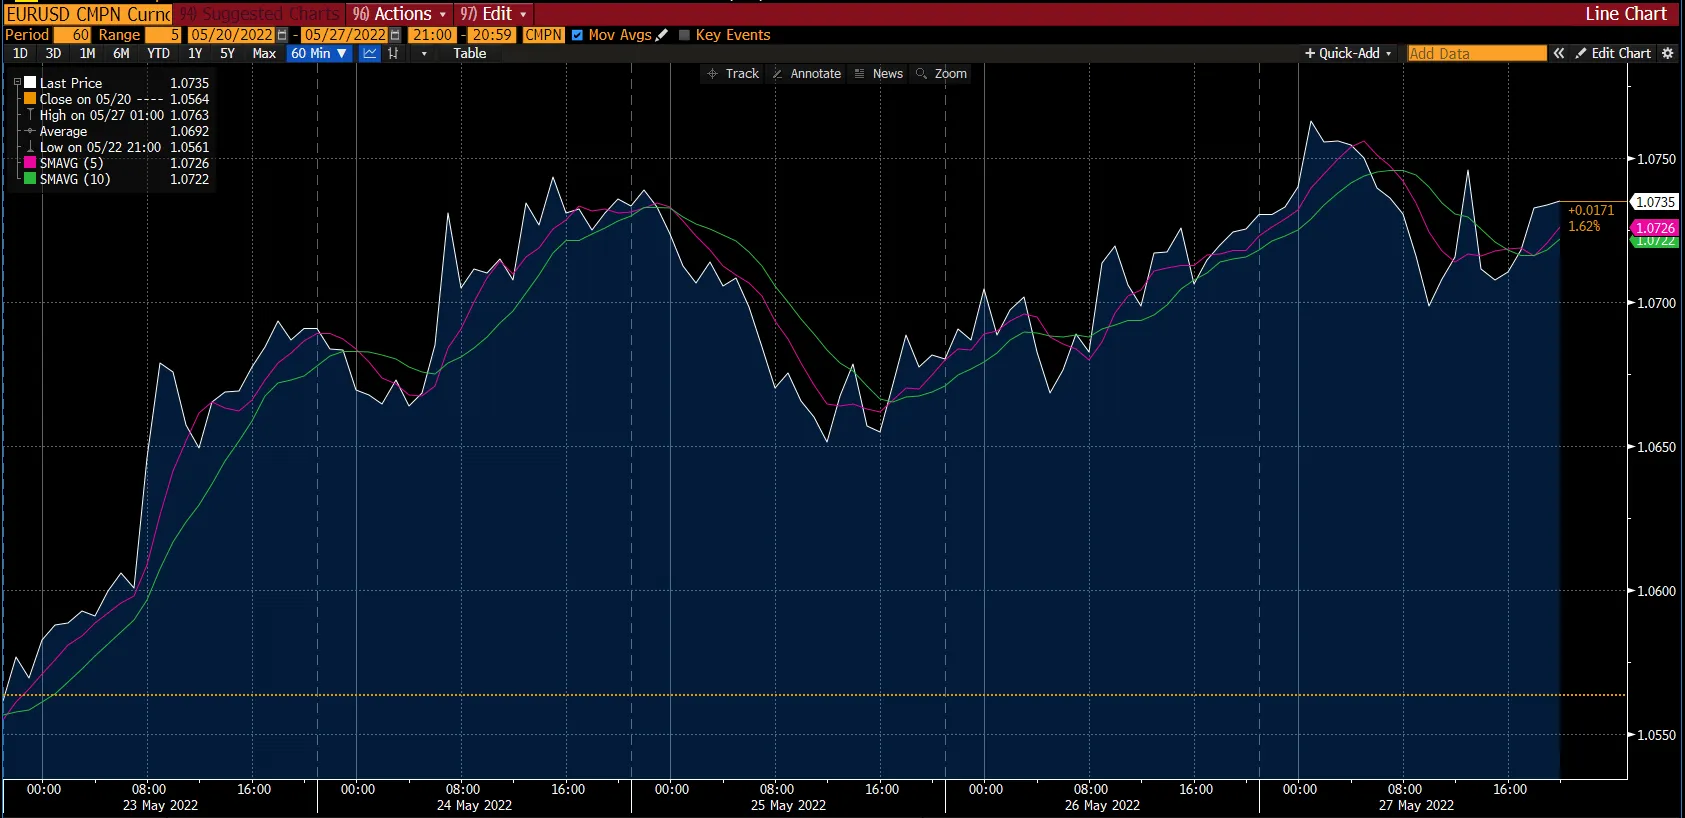
For the second week in a row, EUR/USD closed above $1.07 in a rally fueled by the broad US dollar's weakness. As seen in the chart above, the price stayed above the 5 and 10 SMA's (now acting as the support levels) towards the end of the week, maintaining an upward momentum.
The Euro recently benefited from rising European Central Bank (ECB) interest rate expectations. Markets are now anticipating a tightening of over 100bps through the end of the year, starting with the first hike in July.
Meanwhile, GBP/USD extended its recovery from two-year lows of $1.2155 in the preceding week, finishing the week at around $1.2631. The widespread US dollar selling pressure fueled the rise in GBP/USD in the second half of the week. This factor led to the currency pair reaching its highest level in a month, at around $1.27.
Currently, it is far too early to forecast if the US dollar will remain weak for much longer. However, persistent inflation is keeping the Federal Reserve (Fed) on track, allowing them to re-evaluate the effectiveness of its current policy on inflation.
This week the focus will be on inflation, with the EU publishing its preliminary estimates of the May Consumer Price Index. To add to that, the US will release the May non-farm payrolls (NFP) report.
Level up your trading strategy with the latest market news and trade CFDs on your Deriv X Financial account.
Commodities

Last week, gold juggled between gains and losses before completing the week with a solid comeback. On the road to recovery, gold is aiming to retest its two-week highs while the US dollar struggles to gain ground as market sentiment remains mixed and Treasury yields remain low.
Moreover, the dismal US GDP and the Pending Home Sales report also contributed to the slowing down of the US economy, making traders reposition themselves ahead of the minutes of the May Fed meeting. Therefore, last week's rally in global stocks also weighed down on the US dollar's safe-haven appeal, benefiting gold.
As per the chart for the week, gold is around the 38.2% retracement level at around $1,853. If gold continues to go down, its next support level would be at the 23.6% retracement level near $1,850. However, on the upside, its next resistance level would be at the 50% retracement level at around $1,856.
On the other hand, oil prices increased by 3% on Thursday, May 26 2022 – the most in 2 weeks. This increase is due to a long bet on surging gasoline consumption ahead of the Memorial Day holiday, which marks the start of America's peak driving season on Monday (May 30 2022). The price also increased due to the European government considering whether or not to ban Russian crude oil completely.
Cryptocurrencies
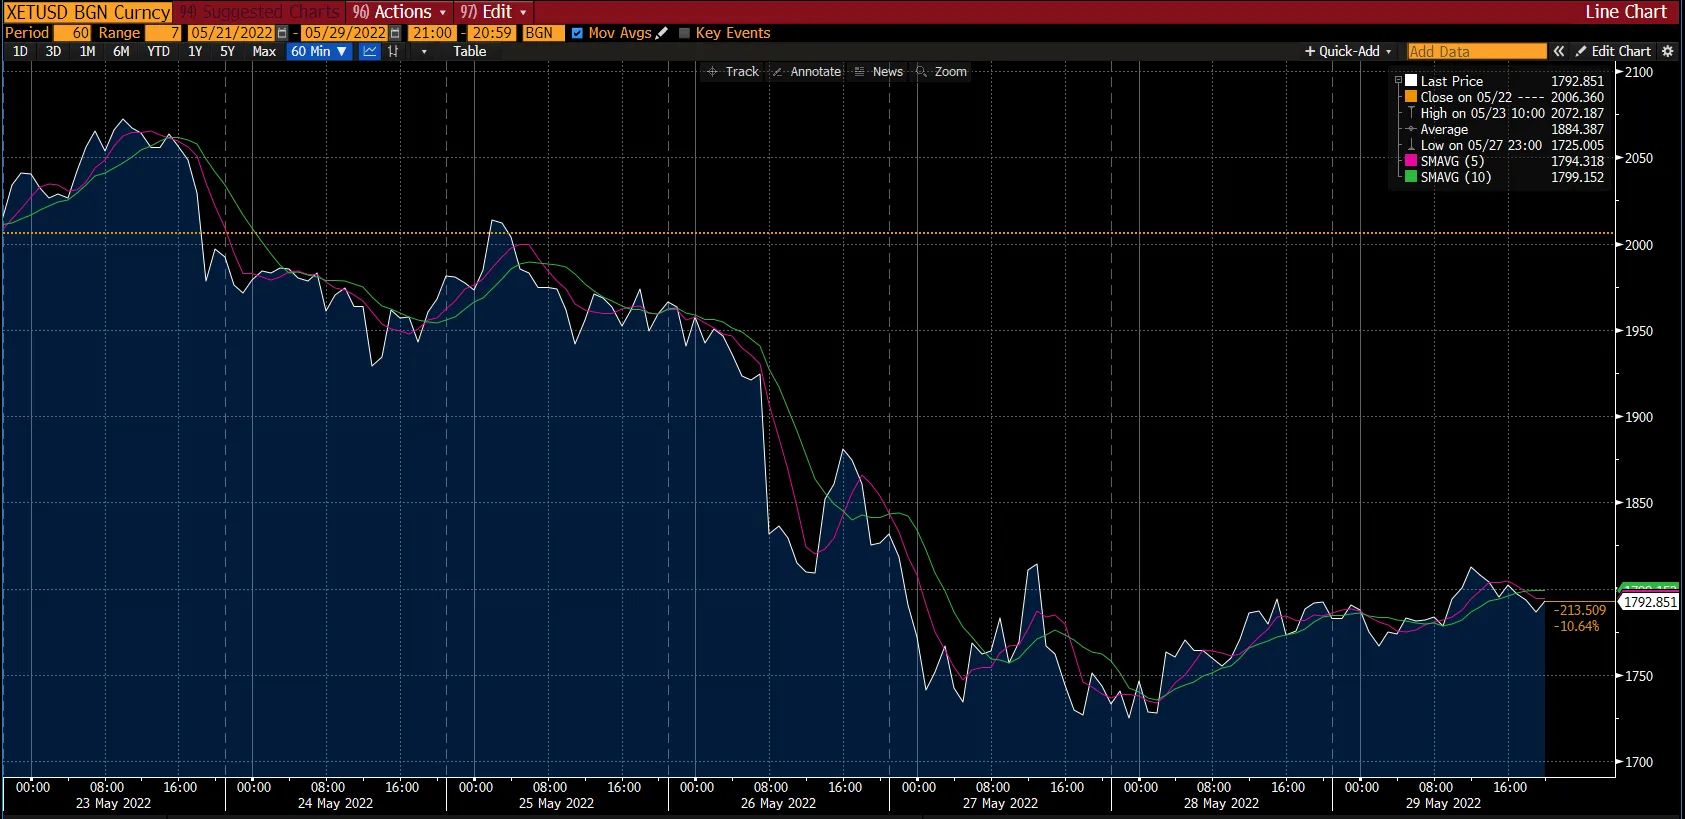
The global crypto market cap has recovered after yet another round of crashes in recent days. Bitcoin currently holds 45.25% of the crypto asset market and has seen an overall price increase of 0.04% in the last seven days.
During this period, ETH's price dropped by around 10%. This dip is visible in the chart above, along with a sharp drop on Thursday, 26 May 2022, and then it continued to trade sideways for the rest of the week.
Furthermore, Altcoins too underperformed over the weekend. Last week, the price of SOL (Solana) dropped by 10.54%, while the price of ADA (Cardano) dropped by 4.78%.
However, Terra's new blockchain was launched over the weekend. With this new development, the old token would become Luna Classic (LUNC), while the new token would be Luna 2.0 (LUNA). The elaborate proposal involved airdropping new tokens to LUNA and UST tokens holders before the crash. Unfortunately, in the wake of the UST de-pegging debacle, traders appear sceptical about LUNA Classic and LUNA 2.0.
Maximise market opportunities by sharpening your trading strategy and trading the financial markets with options and multipliers on Deriv Trader.
US Indices

*Net change and net change % are based on the weekly closing price change from Monday to Friday.
Wall Street saw its first positive week in nearly 2 months. All 3 major US indexes were in the green as they ended a losing streak that some feared was a prelude to a recession. The Dow climbed by 4.18%, the S&P 500 gained 4.64%, and the Nasdaq gained 5.38%.
US markets have mostly had a lousy year as soaring inflation, rising interest rates, the war in Ukraine and the coronavirus pandemic rattled traders and weighed on corporate profits. Until Friday's close, the Dow had fallen for eight consecutive weeks, while the broader S&P 500 index and Nasdaq had declined for seven straight weeks.
This jump occurred because the yield on benchmark US Treasuries fell after data showed that US consumer spending rose in April and the uptick in inflation slowed. Both factors are signs that the world's largest economy could be on track to grow this quarter.
In the coming week, key updates in the labour market are expected, with the release of Jobs Openings and Labor Turnover Survey (JOLTS) openings, hires, and separations, ADP private payrolls, and the official May non-farm payrolls report. It will be a shorter trading week as markets are closed for the Memorial Day holiday in the US on Monday, 30 May 2022.
Now that you’re up-to-date on how the financial markets performed last week, you can improve your strategy and trade CFDs on Deriv MT5 Financial and Financial STP accounts.
Sorry, we couldn’t find any results matching .
Search tips:
- Check your spelling and try again
- Try another keyword