Results for

Weekly market report – 21 Feb 2022
The US dollar index edged higher against a basket of major currencies on Friday, 18 February 2022, reversing previous losses. However, it was still down for the week as a series of developments in the Ukraine-Russia situation jittered traders.
Forex
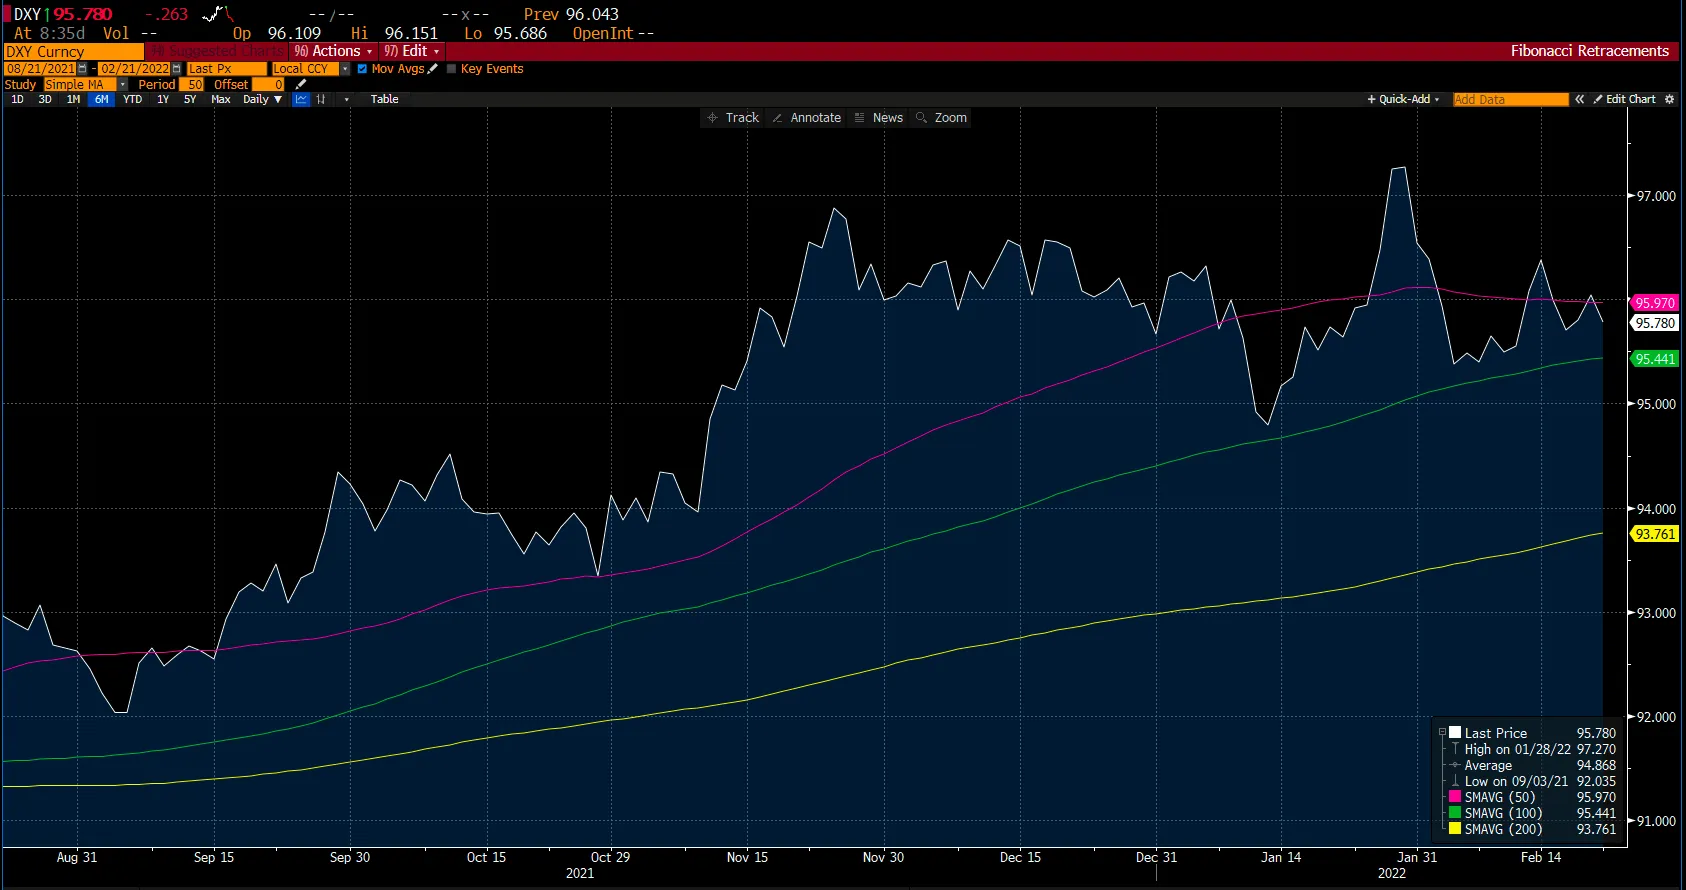
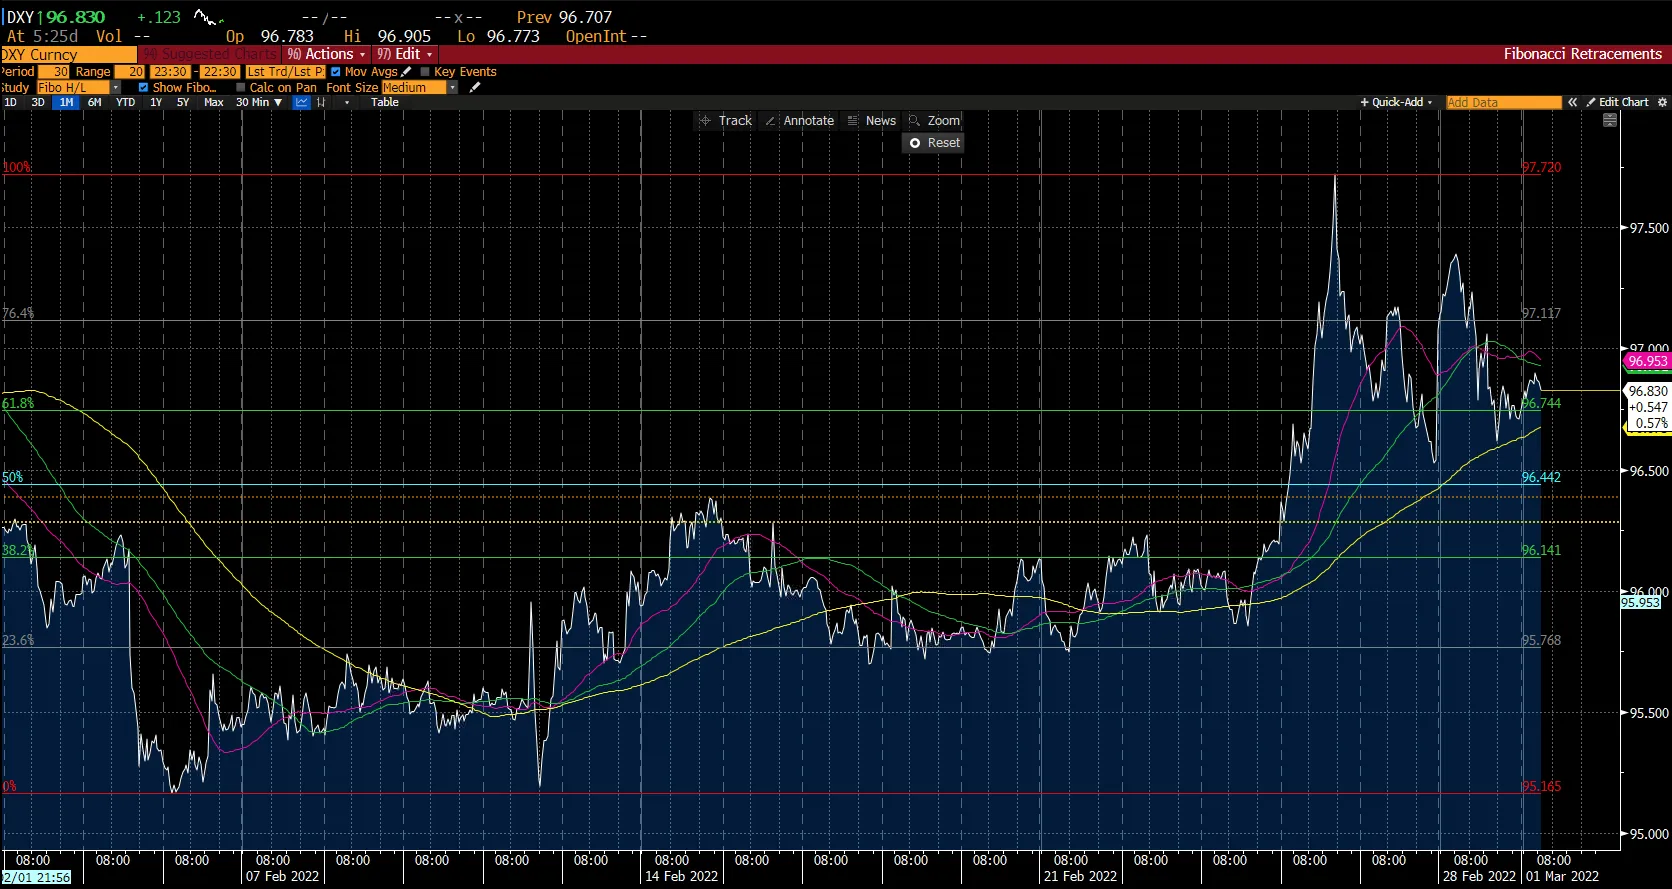
The US dollar index edged higher against a basket of major currencies on Friday, 18 February 2022, reversing previous losses. However, it was still down for the week as a series of developments in the Ukraine-Russia situation jittered traders. The US dollar index was down by around -0.34% for the week. Currently, the US dollar index is trading at approximately $95.78. The monthly chart above shows multiple support levels at the 100 SMA and 200 SMA at $95.44 and $93.76, respectively. On the other hand, the US dollar index is trading just below the resistance level of 50 SMA at around $95.97.
How did the other pairs react?
- The EUR/USD pair ended the week with little movement, trading in the $1.1350 - $1.1360 price range. The sentiment about geopolitical tensions between Russia and Ukraine dominated financial activity. Additionally, the US Federal Reserve meeting minutes failed to provide new hints on monetary policy.
- GBP/USD, up for the third week in a row, remained resilient to the Russia-Ukraine crisis despite UK inflation rising and raising expectations of increased rate hikes by the Bank of England (BOE). On the other hand, the January Fed minutes disappointed hawks and triggered a new wave of US dollar selling.
- USD/JPY's movement was primarily driven by Russia's intentions in Ukraine and the news surrounding the military and diplomatic situation. On Thursday, 17 February 2022, USD/JPY closed at ¥114.91, its lowest level in 2 weeks, after unverified artillery exchange reports triggered safe-haven flows to the yen. The USD/JPY rose above ¥115.00 following an agreement for US Secretary of State Anthony Blinken to meet with Russian Foreign Minister Sergey Lavrov in Moscow next week. However, the standoff continues to have market ramifications.
This week's focus would be on CPI data (January) for the Eurozone, the Consumer Confidence Index and Fed Monetary Policy Report for the US and the inflation report hearings in the UK by the Bank of England. Despite a relatively light data week, the central underlying theme will be geopolitical developments involving Russia and Ukraine.
Commodities

There is a growing concern that key commodities manufactured and exported by Russian companies may be affected by tensions between Russia and Western nations over Ukraine and possible sanctions against Russia.
Last week gold reached $1,900 per ounce for the first time since 2021 only to retreat in response to the US-Russian diplomacy talks on 18 February 2022. However, this pullback could be short-lived, as "lingering and still unresolved tensions will continue to support bullion", says RJO Futures senior market analyst Bob Haberkorn. Regardless of the slump, the gold price rose by 1.9% maintaining its uptrend for the third consecutive week.
As seen in the monthly chart above, gold is currently trading at around $1,896.76, marginally close to its 50-day and 100-day moving averages at $1,895.18 and $1,893.84, respectively, and well above its 200-day moving average at $1,877.25.
Oil prices took a hit following reports that a nuclear agreement with Iran was "closer than ever." If a deal is reached, Iran could return about 1.3 million barrels per day (BPD) to the market following the lifting of US sanctions. This prospect pushed oil prices to their first weekly decline in 9 weeks on Friday, 18 February 2022. Although escalating tensions over the Ukraine-Russia crisis did not offer significant support, the uncertainty could potentially push prices higher.
On Friday, 18 February 2022, the benchmark WTI Crude was trading around $91.07 a barrel, closing 4.6% lower on the week.
Since the oil markets are currently unpredictable, there is a high probability that OPEC+ will stick to the production hike strategy of 400,000 BPD by April 2022 to maintain some normality and stable long-term conditions.
Cryptocurrencies
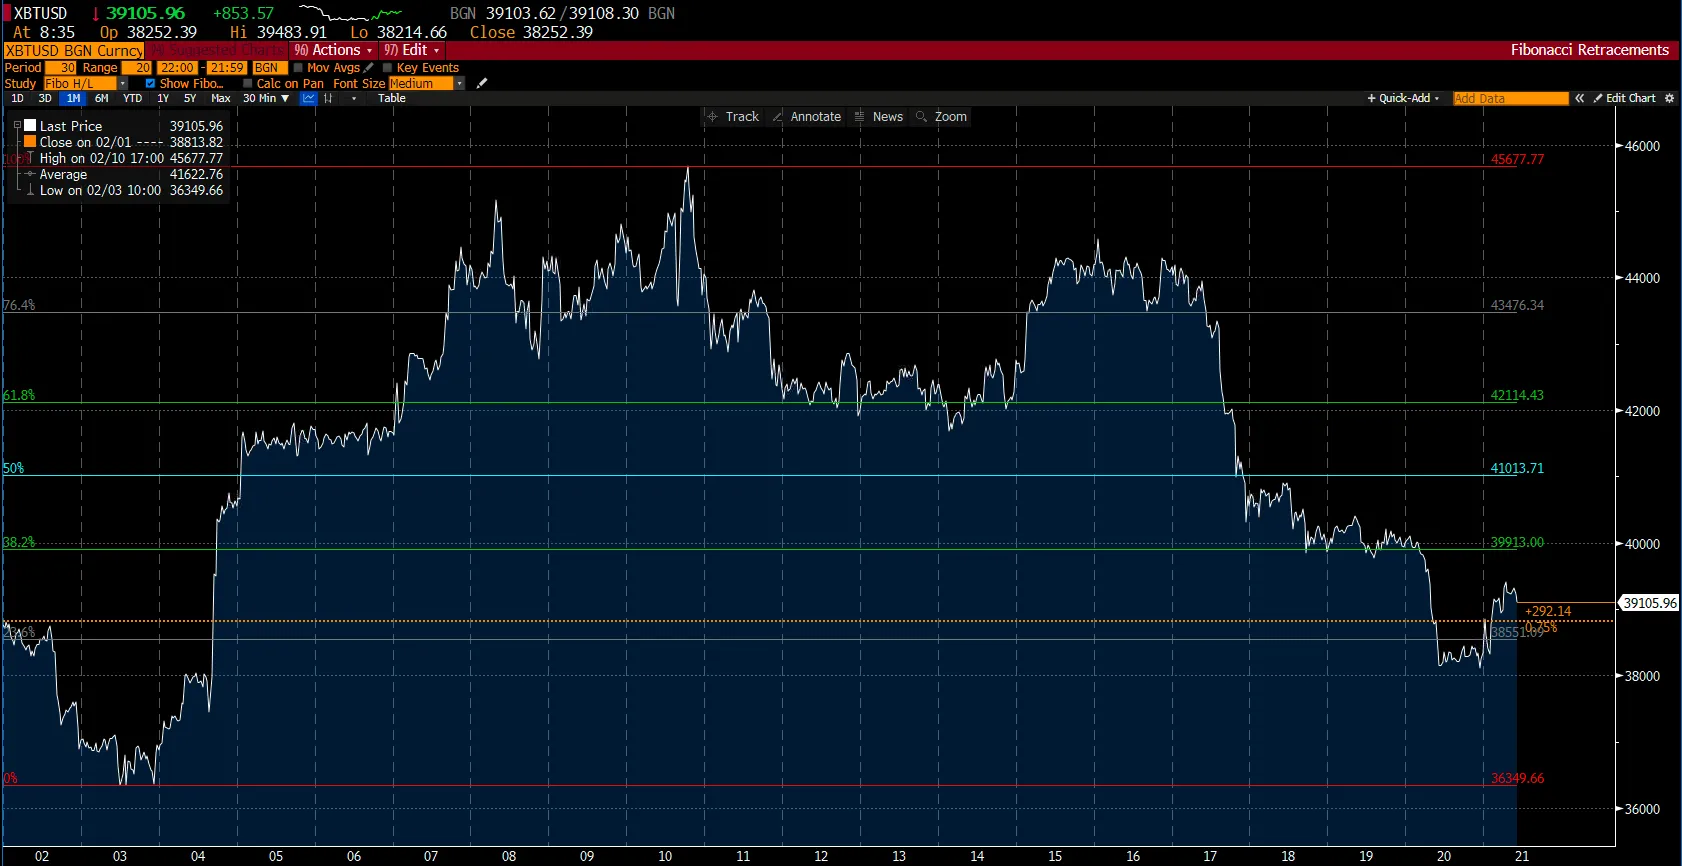
Last week, Bitcoin slipped below its key psychological level of $40,000, which moved it further into bearish territory. The world's largest cryptocurrency shed around 6% last week, trading lows of about $39,858 as the standoff between Russia and Ukraine continued to spook traders.
Technically speaking, the chart above shows Bitcoin's current primary support at $36,450, whilst any upside potential would see its primary resistance level of $39,913 at 38.2% retracement come into action. A breach of this level would introduce $41,013 as its new primary resistance level.
The number two cryptocurrency, Ether, continued to mirror Bitcoin's price movements with a weekly loss of almost 7%. During Friday's morning session, Ethereum failed to uphold its major support level at $2,900 and was further hit with a wave of selling that dropped Ether to an intraday low of around $2,750.
Whilst last week's sell-off placed most of the top 20 cryptocurrencies in the red, only Avalanche (AVAX) ended the week positively, posting an interesting 3%.
"Wall Street has gone into full de-risking mode, and Bitcoin is paying the price", OANDA senior market analyst Edward Moya commented. "Fears over geopolitical concerns and potentially aggressive central bank tightening has cryptos across the board in free fall."
Moreover, the rise of government scrutiny on the US cryptocurrency market poses an additional threat to long-term price movements. In a recent development, the United States FBI launched the Virtual Asset Exploitation Unit to focus on cryptocurrency-related crimes. Similarly, the Department of Justice named the first director for its recently-established National Cryptocurrency Enforcement Team.
US Indices
.webp)
*Net change and net change % are based on the weekly closing price change from Monday to Friday.
The major US stock indices appeared to be on the verge of an overall gain at midweek, only to end up negative after declining on Thursday and Friday. Indices fell by nearly 2%, with military tensions on the Russia-Ukraine border being the driving force. These geopolitical tensions added to the market's already high inflation and rising rate-hike expectations by the Fed. In addition, the 10-year US Treasury yield climbed as high as 2.06% on Wednesday, 16 February 2022, the highest since July 2019, before falling back to around 1.93% on Friday, 18 February 2022. The factors contributing to this momentum were Russia's and the Fed's ambiguous signals, as well as economic reports.
According to the January economic reports, US retail sales increased from a December decline thanks to a surge in online sales and higher furniture sales, contributing to better than expected growth. Furthermore, high inflation also aided the latest monthly retail sales total, which was up by 3.8% compared to a 2.5% decline in December. On the other hand, the latest weekly total of new jobless claims surged to 248,000, the highest level in 4 weeks.
On the bright side, the Fed released minutes from the January FOMC meeting, which provided some comfort to markets since there were no major surprises or overly hawkish remarks. While the Fed was generally ready to raise rates in March, the minutes indicated that it did not favour a 0.50% rate hike or other aggressive moves. However, the committee did acknowledge that a significant reduction in the Fed's balance sheet looked prudent. Just 2 weeks ago, the market expectations for a 0.50% rate hike at the March meeting dropped from over 90% to around 33%.
This week, the key events to focus on would be on the Consumer Confidence Index and the Fed Monetary Policy Report (which is tentative).
Trade the financial markets with options and multipliers on Deriv Trader or CFDs on Deriv X Financial account and Deriv MT5 Financial and Financial STP accounts.

Why the trading world loves the MT5 platform
MetaTrader 5, also known as MT5, is one of the most versatile trading platforms on the market, equipped with various features to improve your trading experience.
MetaTrader 5, also known as MT5, is one of the most versatile trading platforms on the market, equipped with various features to improve your trading experience. Here are the top features you need to know.Launched in 2010, MT5 has been specifically designed with the retail trader and the smaller institutional traders in mind. It gained huge traction in the market very quickly, primarily due to its true multi-asset capabilities. It allows traders to trade derivative instruments (including CFDs) on forex, stocks and stock indices, cryptocurrencies, and exchange-traded commodities.Its multi-device operability, user-friendly interface, and robust tools for fundamental and technical analysis have also significantly contributed to its popularity.In fact, the key features of MT5 are what set it apart from other platforms and take the trading experience to the next level. Here's what the platform has to offer.
Algorithmic trading and backtesting capabilities
MT5 is built on MQL5, a high performance and object-oriented programming language. With this, traders get improved backtesting capabilities, including multiple pair backtesting. The language can also be used for developing trading robots and algorithms.Algorithmic trading on the MT5 platform has freed up traders' time and energy for more important activities, such as monitoring the markets and identifying opportunities. Now, all they need to do is set up the parameters for entering and exiting trades, and the platform takes care of the rest. Traders get notifications when positions are opened and closed so that they can stay in touch with their trading, even on the go.This versatile programming language also lets traders create technical indicators with special characteristics. Access to a wide range of free indicators is provided by the MQL5 codebase, while the Marketplace allows traders to shop for their preferred indicators and Expert Advisors (EAs). So, traders don’t need to be programming experts to capitalise on these functionalities.
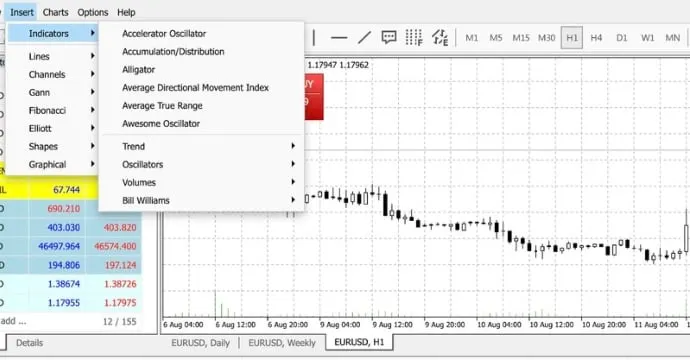
Wide range of technical indicators
With the MT5 platform, traders can access 44 analytical objects, 38 technical indicators, and numerous charts in 21 timeframes. These tools can be customised according to the trading strategy in terms of settings and analytical parameters. There is also the option of adding indicators to the chart itself or a separate sub-window. Plus, traders can choose to add one indicator over another.There are also choices for variations in timeframes, allowing traders to study market volume and price momentum from different angles. Traders also have access to both tick volume data, and real volume traded data.
One-click trading
Traders have a highly flexible trading experience on the MT5 platform with the help of market orders, 6 different types of pending order, and also stop-loss and take-profit orders.In addition, it offers the “one-click trading” option, which reduces trade execution time. With this feature, traders can complete many different operations, including modifying orders, entering positions, and setting stop loss levels with just a single click. The feature can be used across all execution modes.
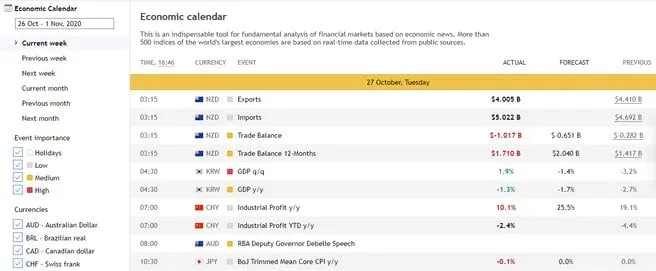
Economic calendar
The MT5 platform allows traders to gain real-time insights into financial developments posted by reputed international news agencies. Traders can access multiple newsletters about global events and analysts' predictions daily. Additionally, the platform has a built-in economic calendar, which offers the time, date, description, and degree of importance of macroeconomic data releases. These help traders evaluate underlying market trends and predict the price movements of assets.
Comprehensive security
Robust security measures are vital for any trading platform, and MT5's security features are among the best available.
- The data exchanged between the server and the trading platform is compressed and encrypted using a 128-bit system.
- The platform has an extended authentication mode as well. It can be enabled on the server and provides added protection against unauthorised access.
- In the authentication process, the identity of clients is not the only thing that is verified. The trade server also has to undergo authentication. This ensures that the server is the one it is claiming to be.
- All configuration files with server configuration accounts and settings are encrypted. This ensures that it is almost impossible to connect to a trade server with configuration files copied from the /config folder of a different platform.
MT5 is a truly versatile platform suitable for both new and more experienced traders. Create a free Deriv MT5 demo account and try it for yourself. It is loaded with 10,000 USD of virtual money that lets you test out the platform risk free, for as long as you want.

Weekly market report – 28 Feb 2022
The US dollar index (DXY) began last week by capitalising on safe-haven flows amid rising geopolitical tensions. Among the pairs that reacted to this, the EUR/USD hit a fresh 2022 low of $1.11118 just as markets opened.
Forex
The US dollar index (DXY) began last week by capitalising on safe-haven flows amid rising geopolitical tensions. Among the pairs that reacted to this, the EUR/USD hit a fresh 2022 low of $1.11118 just as markets opened. Furthermore, the USD/JPY pair opened at ¥115.14 and hit a high of ¥115.78 shortly after the announcement that Ukraine and Russia would hold their first diplomatic talks since the Kremlin invasion.
On Monday, 21 February 2022, the Russian rouble was reported to have lost more than 40% against the US dollar on the interbank market. In response, the central bank of Russia raised its benchmark interest rate to 20%. The central bank said that the rate hike is intended to offset depreciation risks and inflation risks associated with the rouble.
For the first time, the European Union (EU) decided to provide weapons aid to a nation at war. According to Reuters, the EU will send 450 million euros worth of weaponry to its eastern neighbour. In addition to that, over the weekend, the US and the EU and other Western nations decided to exclude some Russian financial institutions from the global payment system, SWIFT.
Commodities

Gold could not build on its previous week's gains because of the improved market mood at the start of last week. This sentiment was fuelled by renewed hopes of a diplomatic solution to the Russia-Ukraine crisis. As gold was the most vulnerable asset to a shift in risk perception, its price fluctuated wildly throughout the week.
After a rally to its highest level since September 2020 at $1,974, gold fell below $1,900 early in the American session on Friday, 25 February 2022, ending a three-week winning streak. The chart above shows that gold is currently trading at $1,900.84. Gold's RSI indicator sits at 46.3 and is just above the 50 SMA at $1,900.64 and below the 100 SMA and 200 SMA levels at $1,912.97 and $1,909.28.
In the oil markets, WTI Crude oil hit $100 per barrel for the first time since 2014, as global geopolitical concerns turned into a visible threat with Russian President Vladimir Putin announcing a military operation in Ukraine. However, it could not sustain this high for long and retreated, but did not drop below $90 per barrel.
Additionally, the US Energy Information Administration (EIA) reported a second consecutive increase in domestic crude oil inventories for the week ending on Thursday, 24 February 2022. According to EIA data, US commercial crude stockpiles increased by 4.5 million barrels last week totalling to 416 million barrels, putting them at about 9% below the five-year average.
This week's economic calendar will include several high-level data releases, but traders are likely to remain focused on geopolitical headlines. Last week's market action demonstrated that gold is the preferred safe-haven asset, but it is also the first to be sold when sentiment improves. If Russia reaffirms its intention to seek a diplomatic solution and refrains from advancing its troops early this week, gold may face additional selling pressure. On the other hand, a protracted military conflict with Russia's intent to take over Kyiv and additional sanctions from the West could support the precious metal.
US Indices
.webp)
*Net change and net change % are based on the weekly closing price change from Monday to Friday.
Global stock markets were highly volatile last week as traders reacted to Russia's invasion of Ukraine. Following a midweek sell-off in equities, markets swiftly recovered during the week's late trading sessions.
On Tuesday, 22 February 2022, risk assets fell as traders assessed the financial market's reaction to escalating military tensions and increased sanctions against Russia.
The US indices extended losses on Wednesday, 23 February 2022, pushing the Dow Jones and S&P 500 to their lowest levels in 2022. Despite steep declines the previous day, all three indices climbed on Friday, 25 February 2022. Based on Bloomberg data, the Dow Jones Industrial Average closed 1.38% higher at around $33,502. The S&P 500 and the Nasdaq 100 also ended in the green, closing higher at 1.86% and 2.30%, respectively.
As the US released its initial set of sanctions against Russian financial institutions and sovereign debt, hopes of a diplomatic resolution between Russia and Ukraine appeared to dim. However, on Friday, 25 February 2022, market sentiment boosted after the Kremlin reportedly announced that Vladimir Putin was ready to send a delegation for negotiations with Ukraine.
For US traders, geopolitical tensions will further complicate the Federal Reserve's next economic policy move, which has thus far prioritised reducing inflationary pressures via hawkish monetary policy changes. Increasing prices from the escalating conflict would complicate Fed policy, causing the Fed to have to decide whether to increase rates in the midst of an energy-stressed, slowing economy.
Trade the financial markets with options and multipliers on Deriv Trader or CFDs on Deriv X Financial account and Deriv MT5 Financial and Financial STP accounts.

Weekly market report – 07 Mar 2022
As the Ukraine-Russia conflict intensifies, the US Dollar Index (DXY) surges to $99.10, the highest level since May 2020. The quote restarted its trading this week with an upside gap, rising 0.63% intraday which resulted in new highs for the week.
Forex
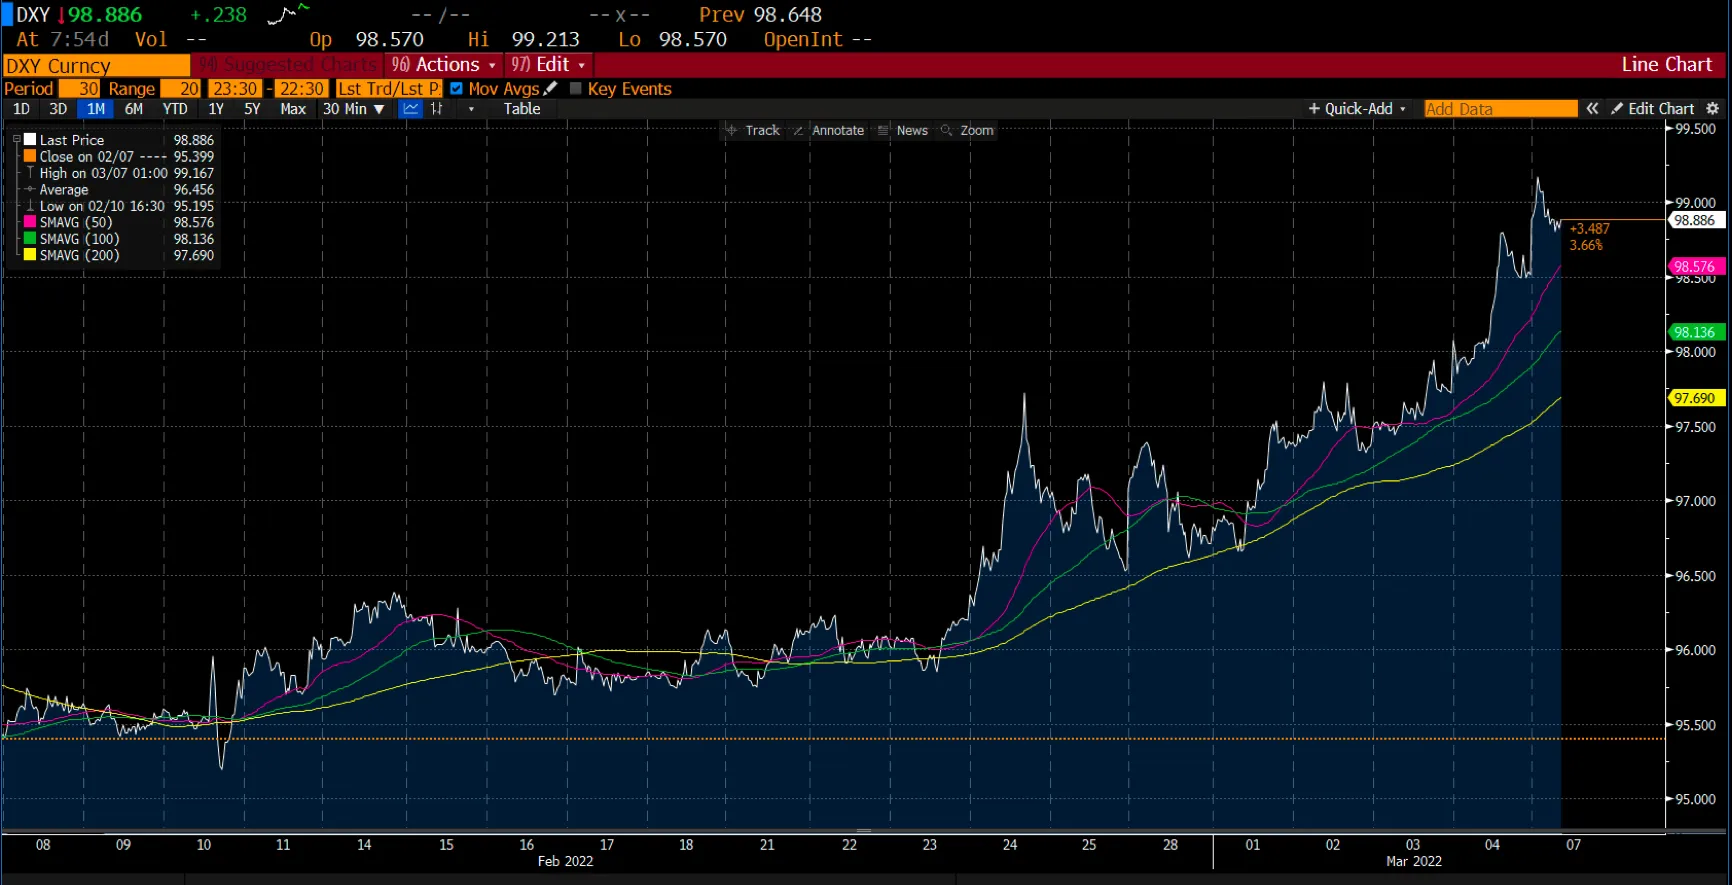
As the Ukraine-Russia conflict intensifies, the US Dollar Index (DXY) surges to $99.10, the highest level since May 2020. The quote restarted its trading this week with an upside gap, rising 0.63% intraday which resulted in new highs for the week.
Economic data from the US came in above expectations but it made no difference on market sentiment. There was a 678K increase in payroll in February, more than the expected 407K — making it the best month since July 2021. The unemployment rate dropped from 4% to 3.8% (even as the labour participation rate rose), and average hourly earnings stagnated in February against expectations of a 0.5% increase.
EUR/USD continues its four-week downtrend, hitting a fresh multi-day low as the trading week ended. Last week, this major currency pair dropped to its lowest levels since May 2020. In addition to the risk-off mood, the Fed is facing escalating pressure to lift its benchmark rates at a faster pace as inflation increases.
USD/JPY broke to the downside falling to ¥114.90, its lowest level since Wednesday’s Asian session. And GBP/USD is battling $1.3200 after hitting fresh 2022 lows at $1.3185, amid the Ukraine crisis-led risk-aversion and a firmer US dollar.
AUD/USD rallied for the third day in a row, closing the week in green. The pair faced strong resistance near $0.7369 even after the US Department of Labor reported that the US economy added more jobs than expected.
We await the US Consumer Price Index (CPI) for February this week as well as the decision of the European Central Bank on its monetary policy meeting for fresh stimulus. Close attention will also be paid to Russia-Ukraine headlines.
Commodities
Oil prices soared last week to decade-level highs as geopolitical troubles in Ukraine and looming US sanctions pushed the energy markets higher.
The global benchmark, US West Texas Intermediate (WTI) rose $19.96, or 20.85%, to settle at $115 — its highest close since 2014. And Brent Crude gained 15.9%, closing Friday’s session above $118 a barrel.
Prices were pushed higher from the news that the United States and its allies were engaged in a “very active discussion” on a potential embargo of Russian oil and natural gas imports, according to US Secretary of State, Antony Blinken.
Russian-supplied oil to the US last year accounted for only 3% of total crude shipments that arrived to the US, making a short-term trade ban highly plausible. However, Europe is far more dependent with an estimated 30% of its oil supplies coming from Russia, so it may not follow suit.
Brent Crude could end the year at $185 if Russia’s energy supplies continue to be disrupted, according to JPMorgan Chase. They predict that without any Russian barrels, oil prices could go as high as $150 within the next three months.
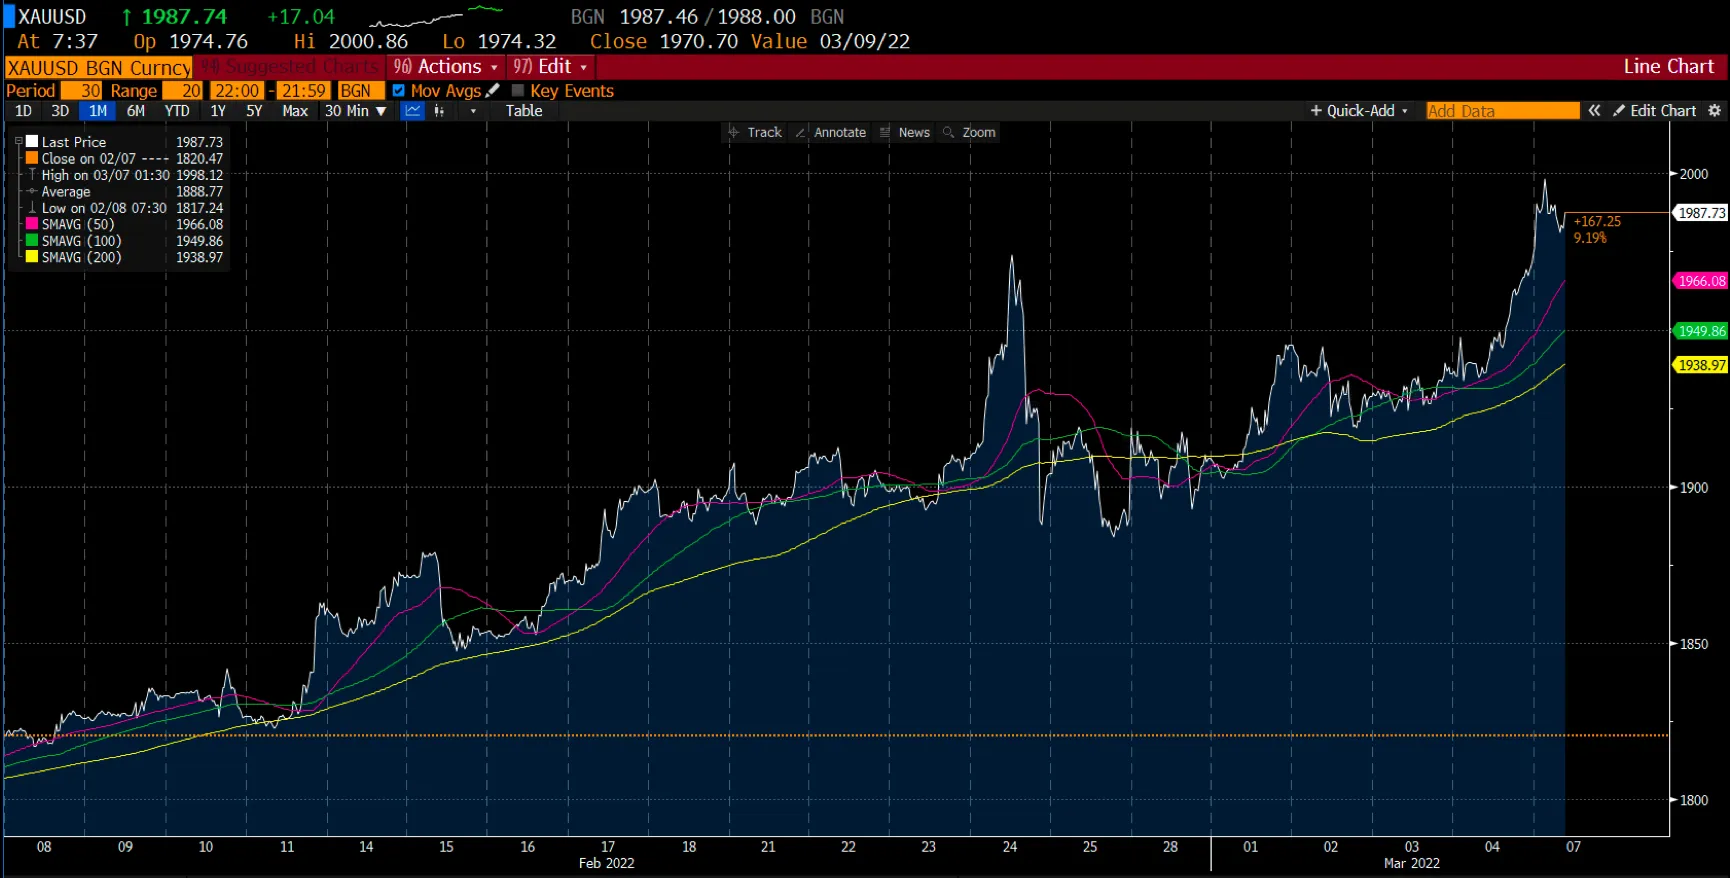
Meanwhile in the metal markets, gold rose sharply amidst panic in the equity markets. The yellow metal hit $2,000 last week, its highest level since mid-2020. Last week’s rally took gold’s price back above its 50-,100-, and 200-day simple moving average, trading around $1,990 mark at the time of writing.
Cryptocurrencies
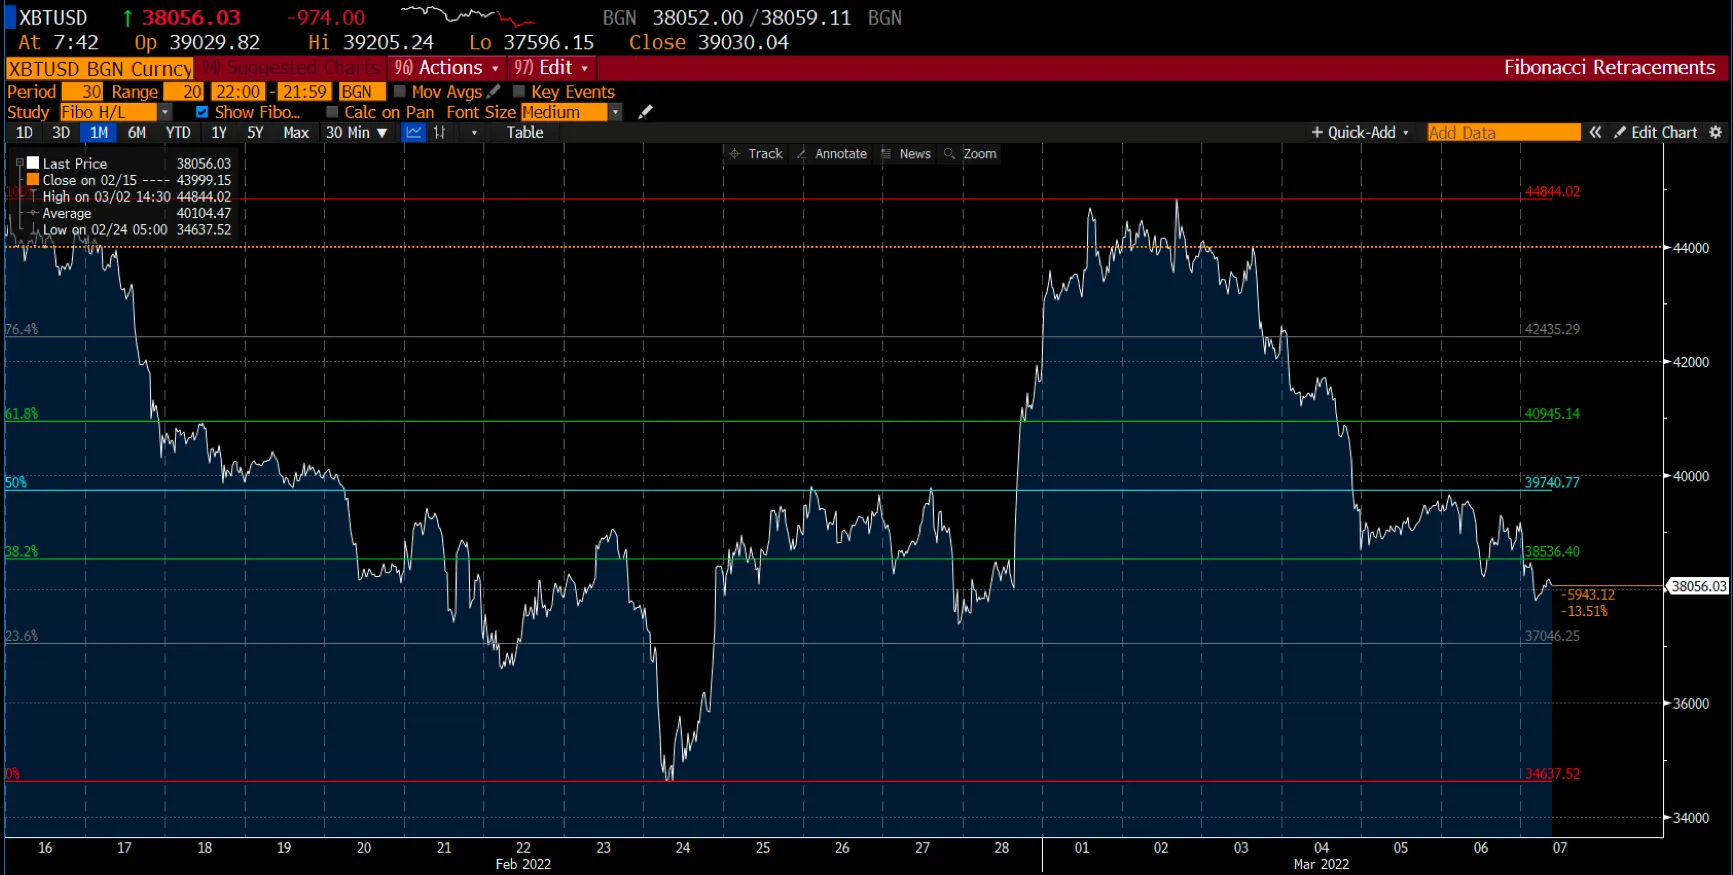
Bitcoin traded below some critical support zones last week after a late sell-off cost the cryptocurrency its key $40,000 level. After its latest run above $44,000 earlier in the week, Bitcoin failed to preserve this trend, pushing back to its average range for 2022 at around the $39,000 mark.
Bitcoin may be tested at its primary support level at around $37,050 levels at the 26.6% retracement level. Any upwards momentum would bring Bitcoin’s initial resistance level into play at around $38,540. Above this lies Bitcoin’s secondary level of resistance at $39,470, at 50% retracement.
Due to the short-term flight to safety taking over market sentiment, gold and the US dollar have profited at the expense of Bitcoin. Market commentators have ascribed the downturn of the crypto markets simply to short-term panic.
Proponents of Bitcoin are known to have called the asset “digital gold” — the idea that Bitcoin is a safe haven and store of value in times of market turmoil. This argument resurfaced as Bitcoin reached $44,000 as the war in Ukraine intensified.
But prominent market commentators have disagreed with this notion. “Crypto has aggressively sold off since it was clear the Fed were going to hike rates faster than anticipated which in turn saw stocks sell off. This is not the definition of a safe haven,” remarked Lux Thiagarajah, BCB Group’s head of trading.
What’s clear is that cryptocurrencies in general continue to be a key talking point during Russia’s invasion of Ukraine for its potential ability to evade economic sanctions. With major financial institutions being placed on a US sanctions list that prohibits business and the movement of money, this has led to a debate about whether cryptocurrencies like Bitcoin, which are decentralised in nature, could be a financial loophole that evades such restrictions.
US Indices
.webp)
*Net change and net change % are based on the weekly closing price change from Monday to Friday.
Last week, markets were volatile but showed resilience as solid economic data helped alleviate some of the rising geopolitical concerns. However, the conflict in Ukraine is having a more significant impact on several aspects, most notably commodity prices, inflation, and interest rates.
Economic events appeared to play a secondary role in shaping sentiment, despite traders paying close attention to Federal Reserve Chair Jerome Powell's Congressional testimony on Wednesday and Thursday. Powell stated that it was "too early to say" whether Russia's invasion would affect the Fed's policy in the medium term but that policymakers would "move cautiously". Powell also stated that he was inclined to keep the federal funds rate at a quarter-point increase in March, putting to rest fears of a 50-basis-point (0.50%) increase.
Additionally, the price of US government bonds increased, causing yields to fall dramatically. The 10-year US Treasury bond yield began the week at 1.92%, dipped to as low as 1.68% on Tuesday (3 March 2022), then stabilised at 1.73% on Friday, indicating an increase in volatility.
Trade the financial markets with options and multipliers on Deriv Trader or CFDs on Deriv X Financial account and Deriv MT5 Financial and Financial STP accounts.

Automated trading: What you need to know
There are many moving parts in online trading. First, you need to learn how to trade. Second, you'll need a trading strategy. Third, you’ll need to test out that strategy.
There are many moving parts in online trading. First, you need to learn how to trade. Second, you'll need a trading strategy. Third, you’ll need to test out that strategy. Finally, you must keep track of your trades so you can maximise your profits when you win or limit your losses when your predictions go against you.This process may appear easy, but if you have been trading for some time, you’d know that it involves a lot of repetitive tasks and there’s actually a lot of technical and fundamental analysis to do.
The good news is, with automated trading, you can automate your trades so that you won’t have to stare at your screen all day. Thanks to modern technology, auto trading bots are easy to create and only require minimal effort to deploy. Plus, you don’t have to worry about hiring a programmer to build a trading robot for you, and there's no need to learn how to code.In this blog, we’ll walk you through what automated trading is, how trading robots work, and why you should use one for trading.
What is automated trading?
Automated trading is a financial trading method where you set and execute your trading decisions with the help of a trading robot. The automated trading system (ATS) is a subset of algorithmic trading. It uses a computer program to generate trade orders and automatically executes them. The trade orders are dependent on your technical analysis and the parameters you've set.
How do trading robots work?

In automated trading, a trading robot interacts with the online trading platform via an application program interface (API). This API acts as the middleman which takes your requests, tells the trading robot what you want it to do, and delivers back the responses to you. Once you enable your trading robot, it will automatically enter, monitor, and exit trades based on the rules you have set. The good thing about some trading robots is that you don’t need to learn how to code. One great example is Deriv Bot.
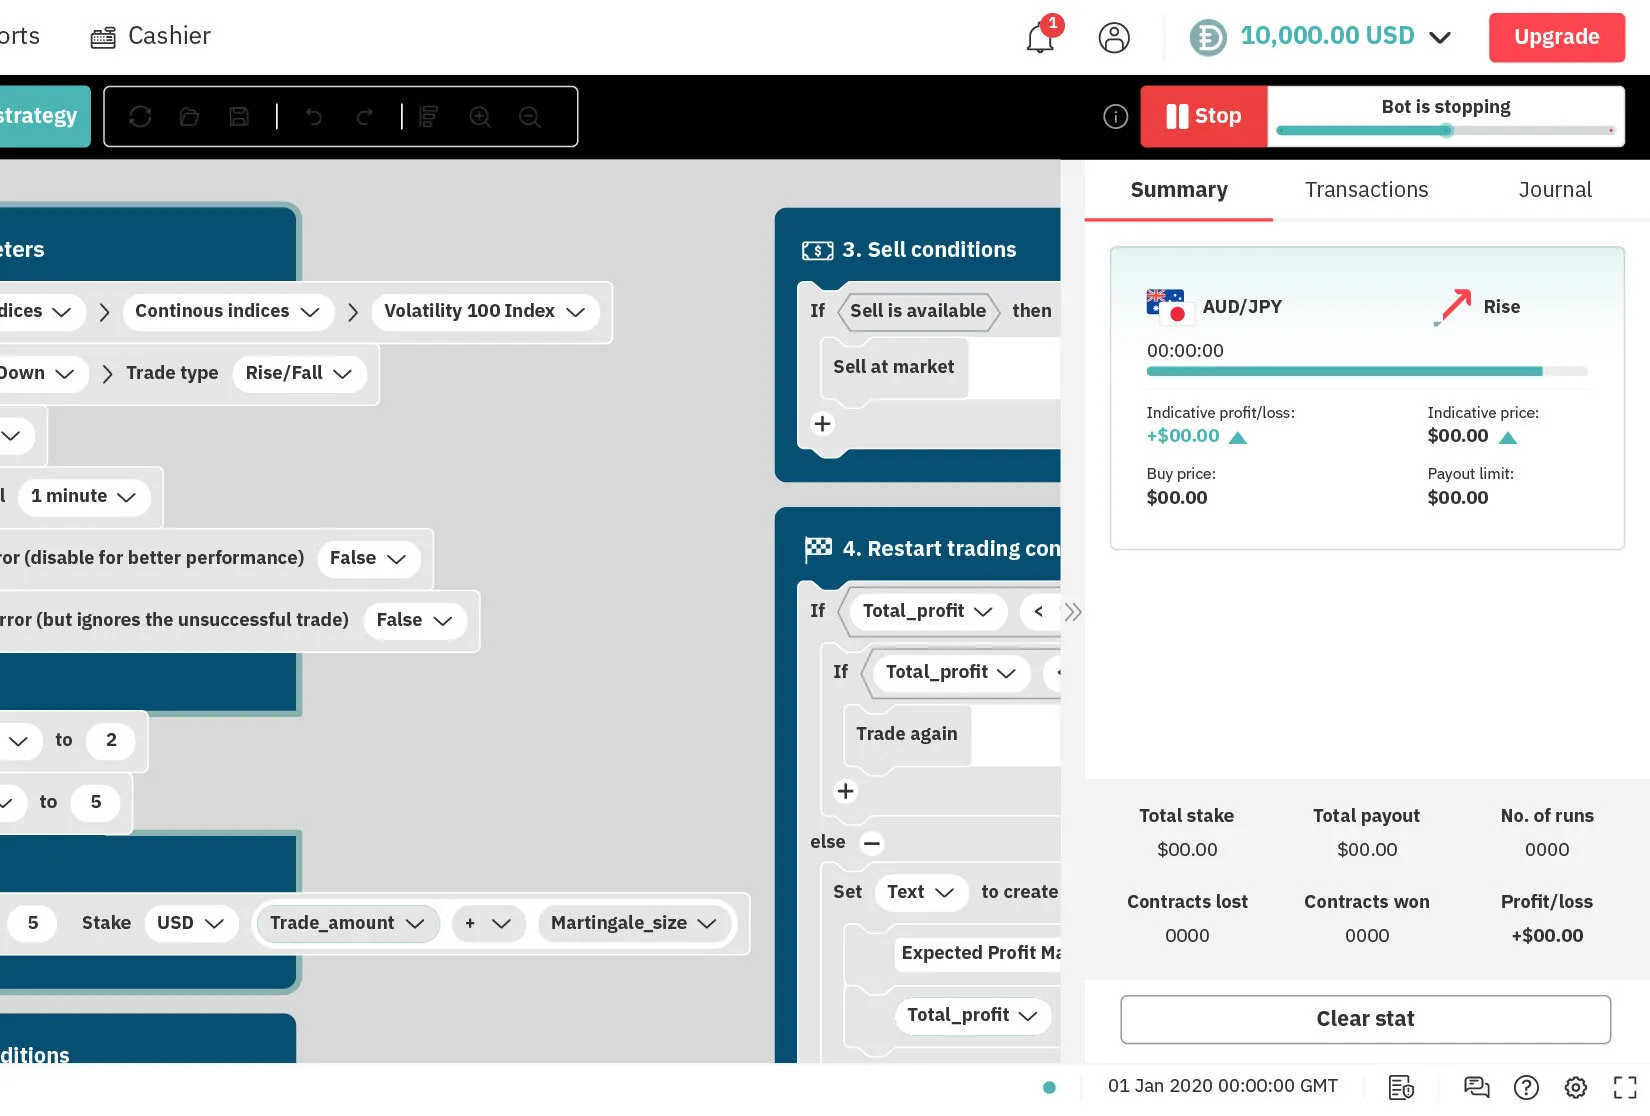
The Deriv Bot trading platform has a drag-and-drop robot builder that is customisable. All you need to do is select the blocks and indicators to match your trading strategy. You can use simple formulas to get yourself started, but you can also create sophisticated algorithms. The trading robot you build then does all the trading for you, so you do not have to stay glued to your computer all the time.
Why use trading robots
Your bot, your rules
Trading bots eliminate the need for constant market monitoring. It will keep track of the markets on your behalf all day long, so you can take advantage of every trading opportunity. This means that you won't have to be tethered physically to your trade terminal. With a trading robot, you just have to set the rules, and it executes them, enabling you to manage your trades more efficiently.
Emotionless trading
Trading involves money, and emotions come along with it. A lot of traders are influenced by fear and greed when making trading decisions. Fear of loss can make traders hesitate before taking a trading position, leading to lost opportunities.
Likewise, too much greed for greater profits may force a trader to hold on to a position for too long or make reckless decisions, which may also cause financial losses.A trading robot enables trading without emotions. It will not think twice about making decisions since it works based on your preset commands.
Round-the-clock trading
Trading robots don't sleep, which means you can trade at any time and from anywhere. It does not require constant monitoring, so you can catch market movements even while you're away. It's just a matter of setting your desired specifications and letting the trading robot do the work.
Disciplined trading
Discipline and patience are two essential attributes that distinguish great traders from the rest. They are constantly refining their strategies and making decisions based on the data they collect.With a trading robot, you can examine your trade history and apply what you've learned to future trades. Most trading robots like Deriv Bot let you practise in a trial environment to learn the ropes and develop a trading strategy that suits you. The more you practise, the more discipline you are likely to develop in your trading. Want to try trading with a trading robot? Sign up for a free Deriv demo account to practise with Deriv Bot.

Weekly market report – 21 Mar 2022
The US Dollar Index (DXY) managed to regain some buying interest and moved beyond the $98.00 hurdle at the end of the week. After a four-day losing streak, it began to attract some bids around $97.73. But renewed fears of an escalation in geopolitical tensions between Russia and Ukraine brought a minor pause in the demand for risk-perceived assets, eventually resulting in a minor pullback for the DXY.
Forex

The US Dollar Index (DXY) managed to regain some buying interest and moved beyond the $98.00 hurdle at the end of the week. After a four-day losing streak, it began to attract some bids around $97.73. But renewed fears of an escalation in geopolitical tensions between Russia and Ukraine brought a minor pause in the demand for risk-perceived assets, eventually resulting in a minor pullback for the DXY. Despite that, the Greenback remains around 1.5% higher for March. On the technical side, it is currently at around $98.79, well-settled above the moving average based on the six-month chart. Even though there is a bit of a fluctuation in the spikes due to the mentioned reasons above, it maintains its uptrend for now.
How did other pairs react?
After a strong week, the Euro suffered from some profit-taking, causing EUR/USD to fall back to the mid - $1.10s. Due to speculation of the start of the European Central Bank’s hiking cycle by the end of the year, the European currency faced some selling bias at the end of the week and faded from its recent uptick in the $1.1140 region.
GBP/USD erased some of its earlier weekly losses after the Bank of England (BoE’s) increased borrowing costs. It is worth noting that this was the third time the BoE consecutively raised their benchmark rates by a quarter to the percent.
The USD/JPY pair extended its steady intraday climb to a fresh multi-year peak – around ¥119.10 – ¥119.20, gaining ground on the last day of the week. The Bank of Japan stuck to its dovish stance and left its policy-setting unchanged at the end of the March meeting. This, in turn, weighed on the Japanese yen and pushed the pair higher amid a pickup in the US dollar demand.
Commodities
At the beginning of last week, hopes for a diplomatic solution to the Russia-Ukraine conflict allowed risk flows to dominate financial markets, making it difficult for gold to find demand. Furthermore, on Wednesday, 16 March 2022, the US Federal Reserve announced that it would raise the policy rate by 25 basis points (bps). According to the revised Summary of Projections, policymakers expect 6 more rate hikes by the end of the year. The market's initial reaction to the Fed's hawkish rate outlook forced gold to go below the $1,900 mark.
However, there was a negative shift in risk sentiment in the second half of the week. This change aided gold's recovery as both Russia and Ukraine officials denied reports that they were getting closer to a peace agreement.
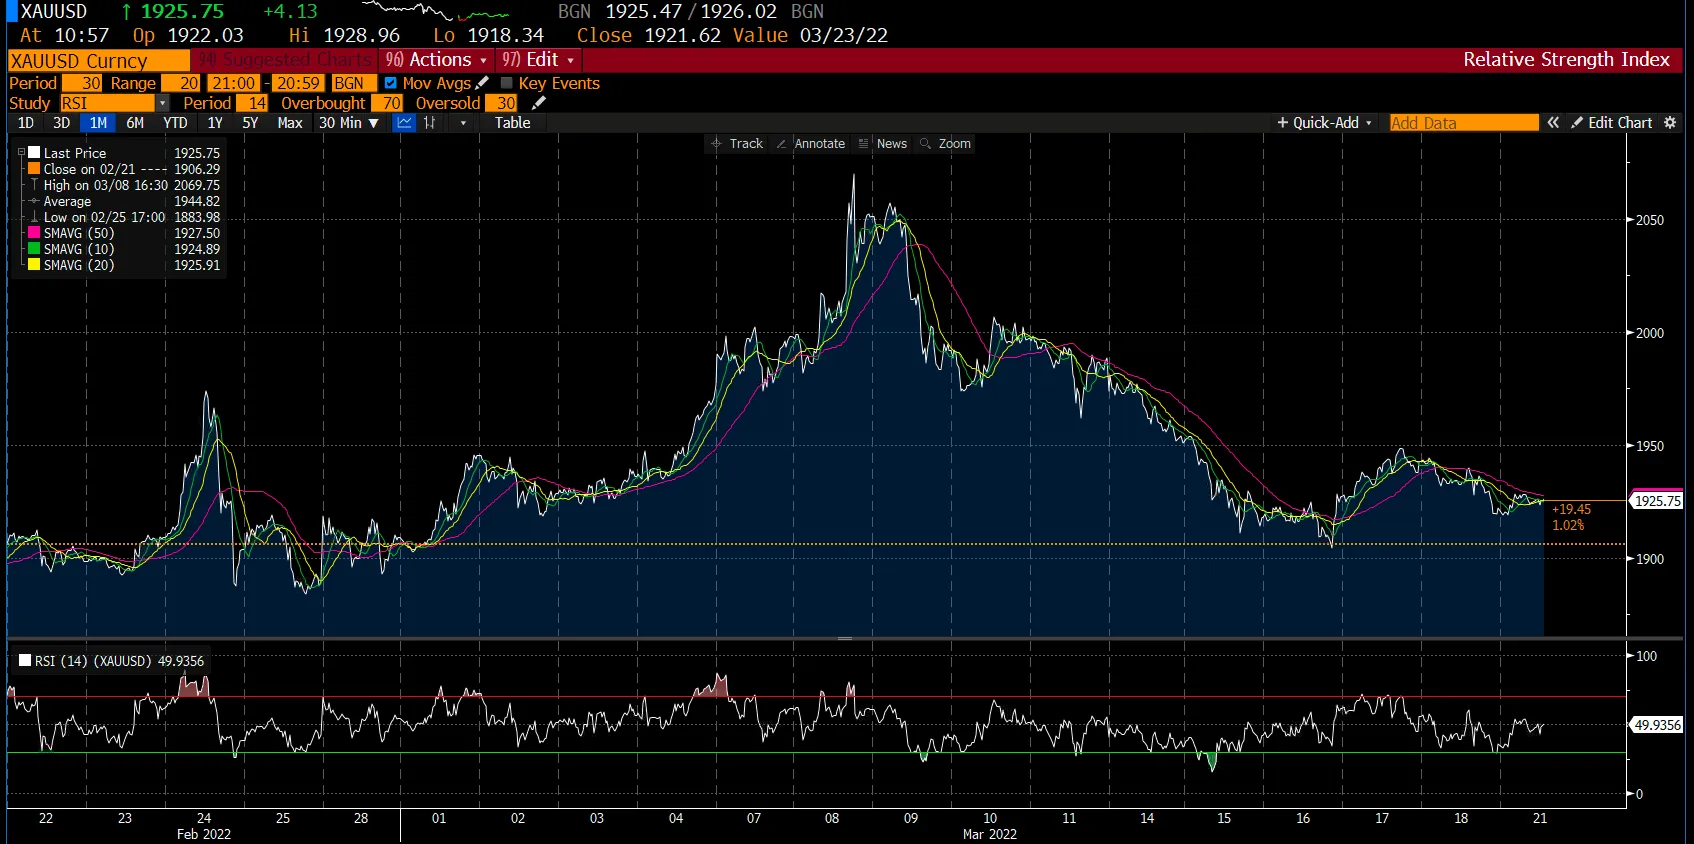
As seen in the monthly chart above, gold is currently trading at around $1,925.75, close to its moving average. The 14-day RSI is just below the 50 level mark at about 49.93, suggesting further selling may be likely. If this momentum persists, it may have an expected bearish market trend.
Since late February, gold's reaction to changes in risk sentiment has been fairly straightforward. If this week's developments indicate a further conflict escalation, gold should rally and begin regaining last week's losses. On the other hand, if markets remain optimistic about a cease-fire, the precious metal may face renewed selling pressure.
On the other hand, Oil prices found a floor above $100 per barrel on Friday, 18 March 2022, following a week of volatile trading. Since there's no easy replacement for Russian barrels in sight, the market is already characterised by tight supply.
The rise in oil prices and other commodities exported by Russia has also fueled inflation fears as governments seek to stimulate growth in the aftermath of the pandemic. The Federal Reserve raised interest rates last week and signalled further increases to match the pace of the rise in prices.
However, the recent surge in COVID-19 cases and the fact that closures in China are in place now may threaten the oil demand. Lastly, with nuclear proliferation talks making little progress, the possibility of Iran supplying additional barrels has also contributed to the volatility in the oil prices.
Cryptocurrencies
The US Federal Reserve's long-awaited announcement of interest rate hikes kept Bitcoin's price above $40,000. For the first time in 3 years, Fed Chair Jerome Powell announced plans to raise interest rates by 25 basis points. After weeks of low volatility, Bitcoin's price experienced a surge, skyrocketing by $3,000 in one day.
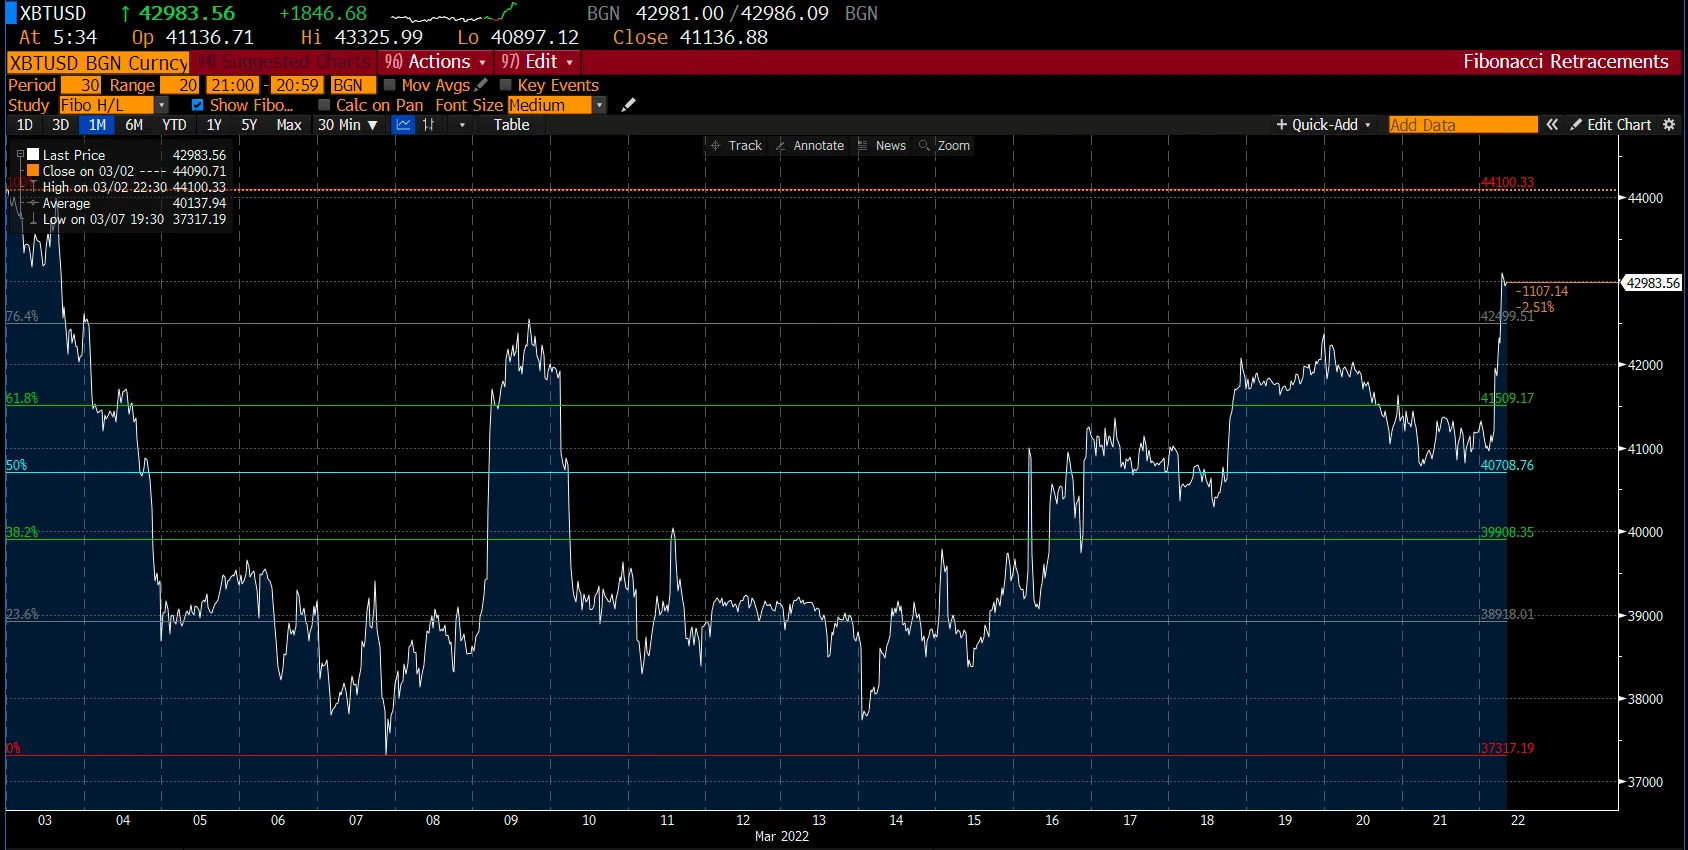
Technically, at the start of the week, Bitcoin was trading close to the 23.6% retracement level at around $38,900, followed by an uptrend and then range-bound between 50% and 61.8% retracement levels. As per the monthly chart above, it went above the 61.8% retracement level for a brief time. However, it reverted to range-bound until it breached the major resistance level at 61.8% around the $41,500 mark and hit the next resistance level at 76.4% around the $42,500 mark. At the time of writing, Bitcoin is trading around the $42,983.56 mark.
Despite a soaring US dollar, declining Bitcoin mining, and falling NFT interest, Bitcoin is still impressively hovering around $40,000.
Several leading cryptocurrencies rallied more than 10% in the last week, with Ethereum, Solana, Cardano, and Avalanche posting some of the highest gains.
By market capitalisation, Avalanche had the most significant growth last week among the top 20 cryptocurrencies. Avalanche shot up by almost 30% to hit the $90 mark. While it's 37.5% off its former all-time high of $146.22, set 4 months ago, this is by far the biggest rise for a leading cryptocurrency in the last 7 days.
Both Solana and Cardano, 2 other smart contract giants, rose by more than 11% and 12%, respectively.
US Indices
.webp)
*Net change and net change % are based on the weekly closing price change from Monday to Friday.
The major US market indices gained by around 5.50% to 10.50% last week, regaining all ground lost in the previous two weeks. Multiple factors supported the market, including falling oil prices, news that Russia avoided defaulting on its sovereign debt and the outcome of the Federal Reserve's monetary policy meeting. While tensions in Ukraine continued, market sentiment was sustained this week by ongoing talks to end the conflict. Gains were widespread across the major indices, with the Nasdaq 100 leading the way.
On the other hand, the government bond prices fell in a rising-rate environment with high inflation, sending sharply higher yields for the second week in a row. The 10-year US Treasury bond yield rose to around 2.15% on Friday, 18 March 2022, the highest level in nearly 3 years.
The Federal Reserve of the United States raised interest rates for the first time since 2018, following market expectations to raise its benchmark lending rate by a quarter percentage point to a range of 0.25% to 0.50%. Policymakers have indicated that they intend to raise interest rates at each of their 6 remaining policy meetings through the end of 2022.
Trade the financial markets with options and multipliers on Deriv Trader or CFDs on Deriv X Financial account and Deriv MT5 Financial and Financial STP accounts.

Weekly market report – 14 Mar 2022
Throughout the week, the EUR/USD traded on sentiment, finishing near $1.09. While the mood was gloomy for most of the week it improved on Friday, 11 March 2022, after Russian President Vladimir Putin stated that "certain positive shifts" had occurred in negotiations with Ukraine.
Forex
Throughout the week, the EUR/USD traded on sentiment, finishing near $1.09. While the mood was gloomy for most of the week it improved on Friday, 11 March 2022, after Russian President Vladimir Putin stated that "certain positive shifts" had occurred in negotiations with Ukraine. President Volodymyr Zelenskyy, on the other hand, stated that victory would require time and patience.
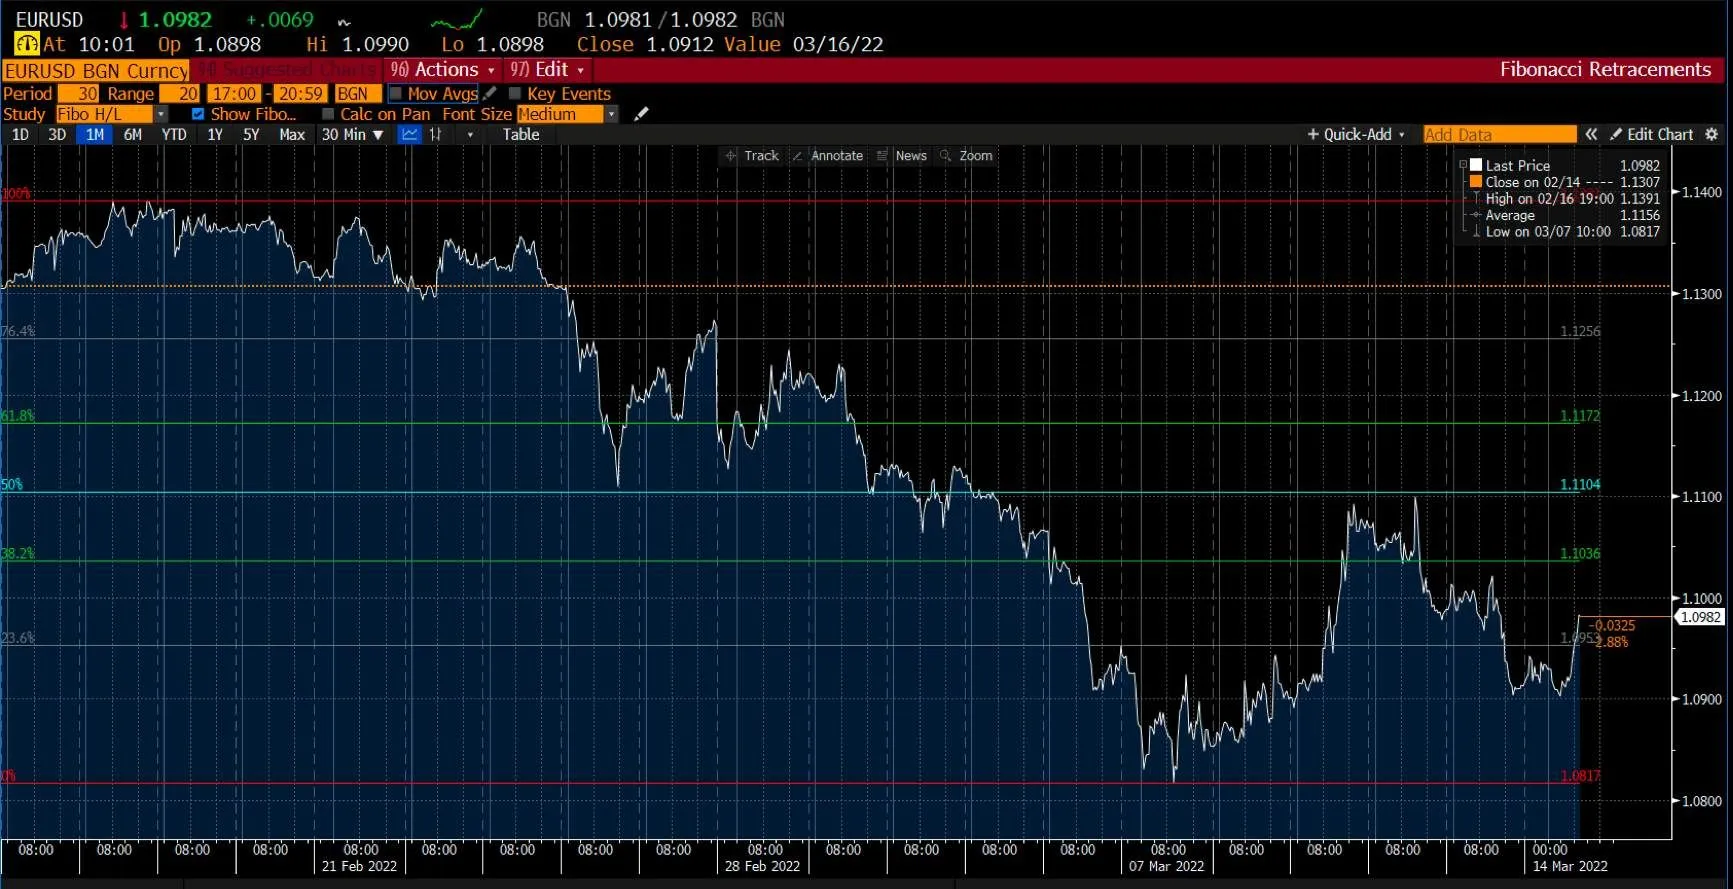
On Thursday, 10 March 2022, the US released its February Consumer Price Index, which rose by 7.9% YoY, as expected, but remained at a multi-decade high. The headline figure was released one week before the US Federal Reserve's monetary policy meeting. It is important to note, the central bank is expected to raise interest rates for the first time since 2018, and policymakers are expected to hint at a faster pace of increases in 2022. According to the monthly data, an immediate support level is around $1.0953, where the pair intersects the 23.6% retracement of the aforementioned slump. The next possible bearish target below the latter is $1.0817. Bulls may gain confidence if the pair surpasses $1.1036 at the 38.2% retracement level, followed by $1.1104 at the 50% retracement level.
Aside from the Eastern European crisis, the European Central Bank announced its monetary policy this week. As expected, the ECB kept its rates unchanged but announced that the Asset Purchase Program (APP) would be phased out earlier than expected, in the third quarter of this year. The APP will be worth 40 billion euros in April, 30 billion in May, and 20 billion in June. President Christine Lagarde stated that inflation is likely to stabilise with the central bank's target to bring it down to 2% in the medium term and that Moscow's invasion of Ukraine is a watershed moment for Europe, with a material impact on economic activity and inflation. As a result, the central bank revised its growth forecast downward and predicted rising inflationary pressures.
The US dollar, on the other hand, resumed gains against the British Pound. Last week, the GBP/USD set a new 2022 low, closing at the lowest level since November 2020. The war between Russia and Ukraine has weighed heavily on the pound, pushing the GBP/USD to $1.30.
USD/JPY raced past its 2022 high of ¥116.35 touching a four-year high on Friday, 11 March 2022. This momentum was caused due to a confluence of factors. Normally, during times of geopolitical uncertainty, the Japanese Yen appreciates due to its 'safe-haven' appeal. However, since the invasion of Ukraine, the Japanese Yen has been a rather frustrating pair to watch due to its tendency to trade sideways.
With Japan importing roughly 80% of its oil consumption, rising oil prices will increase import costs, putting downward pressure on the Yen. In contrast, the US dollar is receiving a safe-haven bid and has remained elevated since the FOMC began talking up the likelihood of a March 2022 rate hike in response to multi-decade inflation.
Commodities
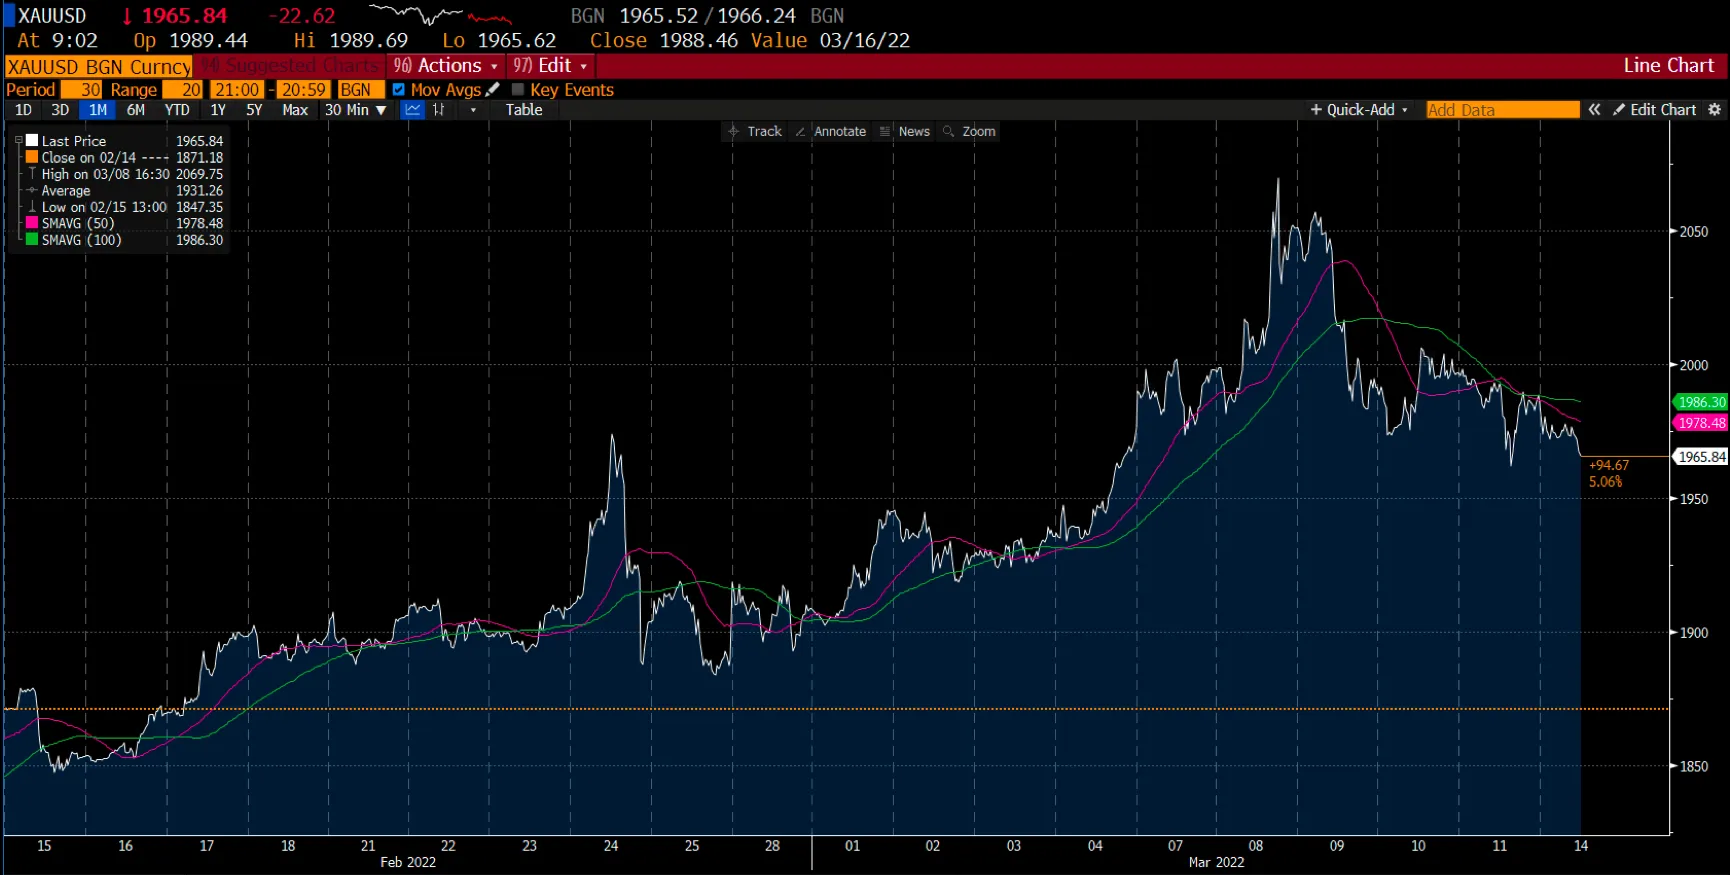
Gold is trading around the $1,975 level, ahead of Sunday's trading session. There is a possibility that the yellow metal's initial decline was due to developments in the Ukraine-Russia peace talks. However, weekend comments from Moscow and Kyiv suggest that the policymakers are far from ready to step back. A firmer US Treasury yield, as well as pessimism surrounding China's Coronavirus situation, may also weigh on market sentiment, as well as gold prices.
Even though talks surround a halt in the production of gold, India's ramping gold demand, as well as inflation fears, keep the yellow metal on the bull's radar.
Gold prices remained over 4% higher on the month. The yellow metal is also benefiting from higher volatility across equity markets, driving its appeal as a haven asset. While traders will closely watch the Fed's rate decisions, the ongoing and rapidly changing situation in Ukraine could overshadow the FOMC meeting. A large part of that results from the economic uncertainty that has affected the global economy.
The chart above shows that gold is currently trading below the 50 SMA and 100 SMA at $1,978.48 and $1,986.30, respectively. The recent decline could be a technical correction in response to the sharp uptrend that began early in February.
Oil prices fell on the morning of Sunday, 13 March 2022, extending last week's decline, as a US official said Russia might be willing to engage in substantive talks over Ukraine.
As of the last session on Sunday, 13 March 2022, WTI crude oil prices remain pressured at around $105.00 following a recent 14-year high. The black gold reacted to the market's increased optimism over Russia-Ukraine’s peace talks and hoped that the US and China may resolve their differences.
Cryptocurrencies
Last week, cryptocurrency markets couldn't sustain gains as concerns over global inflation and the Russia-Ukraine geopolitical crisis-affected sentiment. Barring Avalanche, nearly all the leading altcoins were trading lower on Friday, 11 March 2022. Bitcoin and BNB each fell by 6%, whilst Ether, the number two cryptocurrency, fell by 5%.
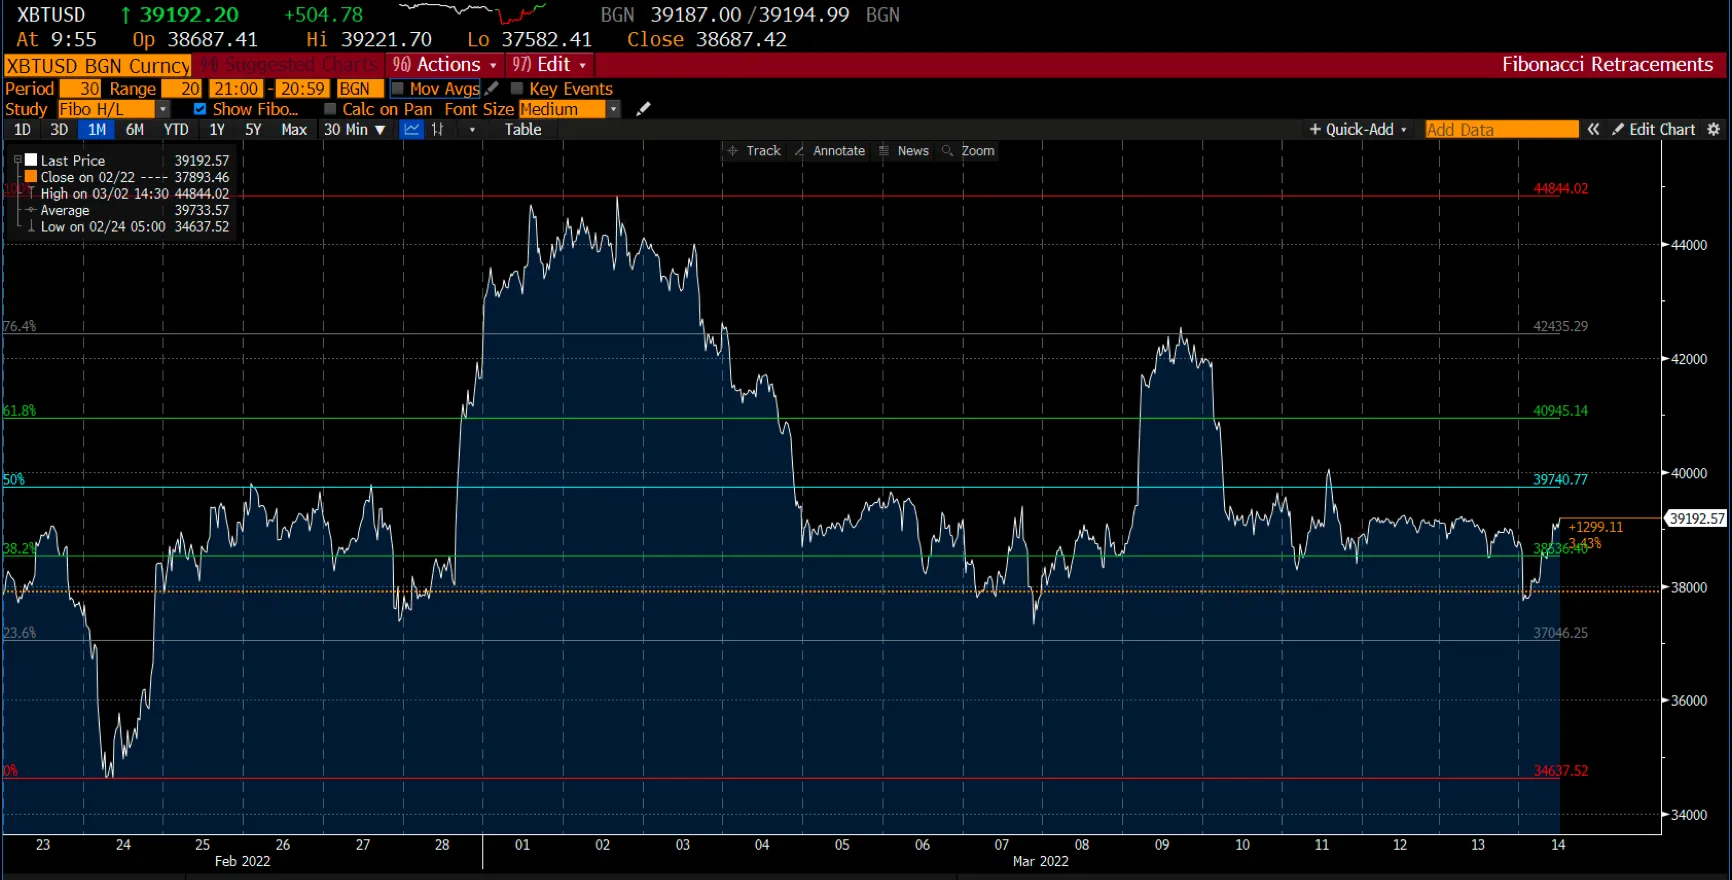
Bitcoin has traded sideways for over a month without any major breakout. It has increasingly tested the strong demand zones of $34,200 – $34,400 and the important supply zones of $45,500 – $45,800. Based on the listed support and resistance levels, traders should watch for major breakouts.
The world's largest cryptocurrency is currently trading at around $39,190. On the technical chart above, Bitcoin finds its primary support level at about $38,536 at the 38.2% retracement level. Below this, the secondary support for Bitcoin is $37,050, at 23.6% retracement. On the upside, the first resistance level is located at around 39,740 at 50% retracement, followed by $40,945 at 61.8% retracement.
On a weekly timeframe, Bitcoin's performance represented a 7.8% decline. Yet another late selloff unfolded as traders chose to secure their positions early, considering the risk of heightened tensions and additional weekend volatility for the crypto markets.
The global cryptocurrency market capitalisation dipped to $1.72 trillion on Friday, 11 March 2022, representing a loss of nearly 5% within 24 hours. Meanwhile, the total cryptocurrency trading volumes dropped as much as 9% to around $88.9 billion.
US Indices
.webp)
*Net change and net change % are based on the weekly closing price change from Monday to Friday.
Stocks ended a volatile week mixed after late gains turned into losses on Friday, 11 March 2022, following diplomatic progress between Russia and Ukraine.
The Dow Jones Industrial Average gained 126.8 points last week, seeing a 0.39% increase. Meanwhile, the S&P 500 Index traded flat at around 4,204 whilst the Nasdaq Composite tumbled to -17.55%. All three major indices led the week with gains but ended with a sell-off.
Global markets continued to struggle with the economic and financial implications of the Russia-Ukraine conflict. However, market sentiment does appear to have shifted from extreme fear to something resembling concern.
The US 10-year Treasury prices fell on Friday, 11 March 2022, pushing the yield above 2% from its March low of 1.73%. As traders moved into bonds during Russia's invasion and out again after headlines began to ease, the rise in yields was a blow to tech stocks and the Nasdaq Composite.
The benchmark US Treasury yield is close to its pandemic-era high, and any break above this level could signal a sustainable path higher. Moreover, this would serve as a hit for the high-growth tech companies, as higher long-dated bond yields eat into the value of future profits.
This week's focus will also shift back to the Federal Reserve, which is widely expected to raise its benchmark overnight interest rate by a quarter of a percentage point following its two-day policy meeting on Wednesday, 16 March 2022. More importantly, the markets will closely watch policymakers' projections of how far rates may rise this year and across 2023 and 2024 to tame inflationary pressures.
Trade the financial markets with options and multipliers on Deriv Trader or CFDs on Deriv X Financial account and Deriv MT5 Financial and Financial STP accounts.

From zero to entry: Your first steps into crypto trading
A quick guide on cryptocurrency trading for beginners. Find out what crypto pairs, trade types, and platforms are available for crypto trading on Deriv.
Starting your journey in cryptocurrency trading can seem intimidating, but it doesn’t have to be. On Deriv, cryptocurrency trading is designed to be accessible and supported by platform features that help you understand the process. You don’t need to own any digital coins or set up a crypto wallet. Instead, you can trade on price movements through flexible tools that suit beginners.
This guide walks you through the basics of how crypto trading works, what makes it different, and how you can take your first steps confidently using Deriv’s beginner-friendly platforms.
Quick summary
- You can trade cryptocurrencies on Deriv using CFDs or multipliers without owning any coins.
- Deriv offers user-friendly platforms for every experience level, from beginners to advanced traders.
- Risk management tools, such as take-profit and stop-loss, can support more structured trade management.
- Everything you need to get started is available in one place. No crypto wallet required.
What makes cryptocurrency trading accessible for new traders?
Cryptocurrency might sound complex, but at its core, it’s just digital money built on blockchain technology: a secure and transparent system that records transactions. Coins like Bitcoin (BTC) and Ethereum (ETH) are traded globally, with prices fluctuating constantly in response to changes in supply, demand, and market sentiment.
On Deriv, you don’t have to buy or store these coins yourself. Instead, you can trade them through Contracts for Difference (CFDs), which let you speculate on price changes without owning the asset. If the market moves in the direction you anticipated, the trade may result in a profit. The same applies if you correctly predict a price drop.
This beginner-friendly approach removes the need for crypto wallets, private keys, and complicated exchange processes.
How do cryptocurrency CFDs work on Deriv MT5?
Think of a CFD as a mirror of the market. When you trade crypto CFDs on Deriv MT5, you’re trading on the difference between the price when you open and close your position, not the asset itself.
For example, if you believe Bitcoin will rise against the US dollar (BTC/USD), you can open a buy position. If the price moves in your favour, you earn based on that movement. Similarly, you can open a sell position if you expect the price to drop.
Because CFDs allow trading in both directions, you can benefit from opportunities in rising and falling markets. You can also start with smaller position sizes, which many new traders use as a way to become familiar with how CFDs react to market movements.
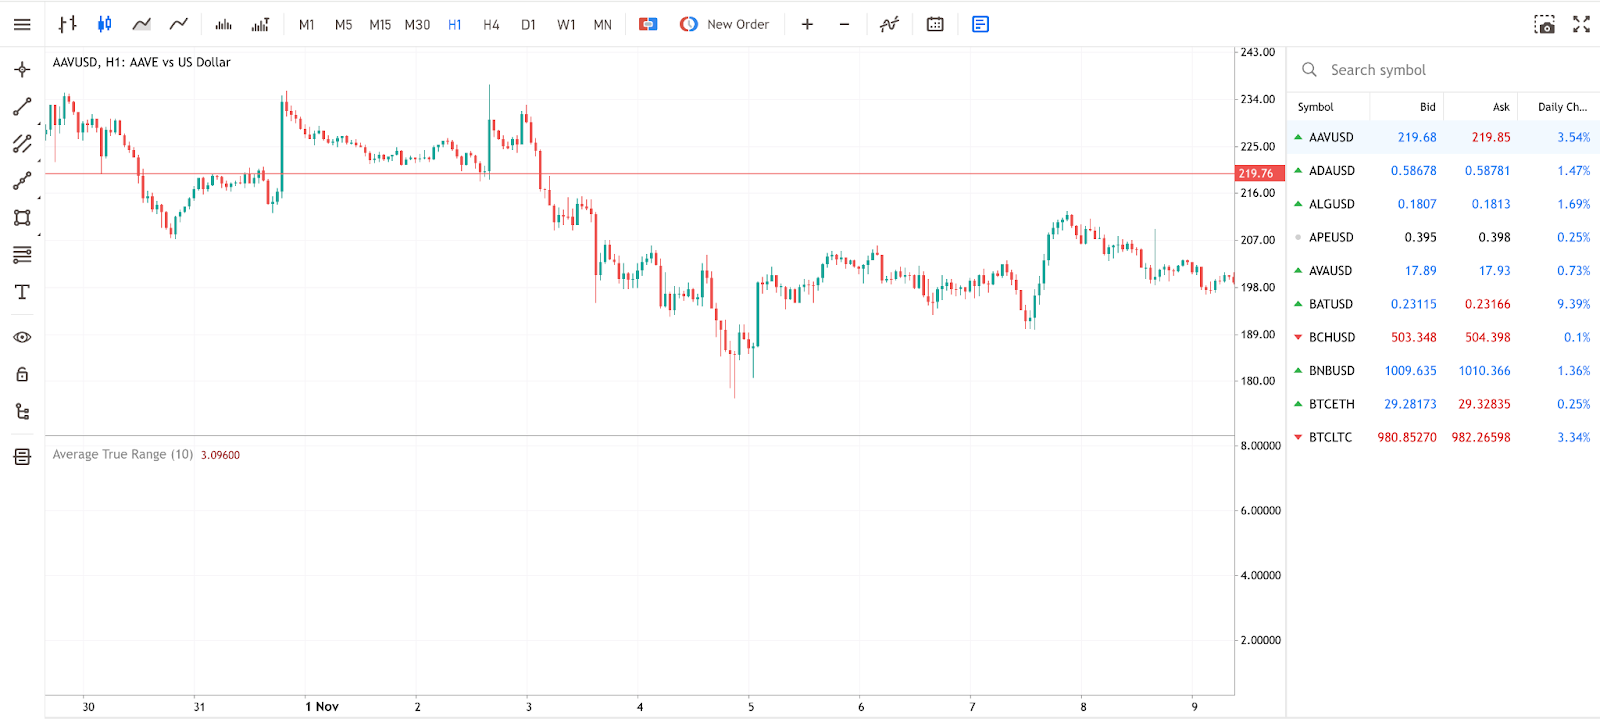
Deriv’s MT5 platform offers a familiar interface, analytical charts, and various cryptocurrency pairs, including Bitcoin, Ethereum, Litecoin, Ripple, and Bitcoin Cash.
Max Matthew Camilleri, Senior Analytics & Automation Specialist at Deriv, mentions:
“Focus on learning how CFDs behave with smaller stakes before scaling up.”
How can you start trading cryptocurrency CFDs on Deriv?
Getting started with crypto trading is straightforward on Deriv. You can begin in just a few steps:
- Create a Deriv account and open a Deriv MT5 Financial account.
- Select your preferred cryptocurrency pair, such as BTC/USD or ETH/USD.
- Set your trading parameters, including your stake, take-profit level, and stop-loss level. You can learn more about these tools in the stop loss and take profit explained guide.
- Place your first trade and track it through the platform.
For beginners, starting with a demo account is the best way to learn. It gives you access to real-time prices and trading tools using virtual funds, so you can practise without risk. Once you feel confident, you can switch to a real account whenever you’re ready.
What should traders understand about crypto multipliers?
Another way to gain exposure to cryptocurrency price movements is through multipliers trading. Multipliers allow you to amplify potential returns from small price changes, which enables traders to gain exposure to market movements without committing large initial capital amounts, while still carrying significant trading risks.
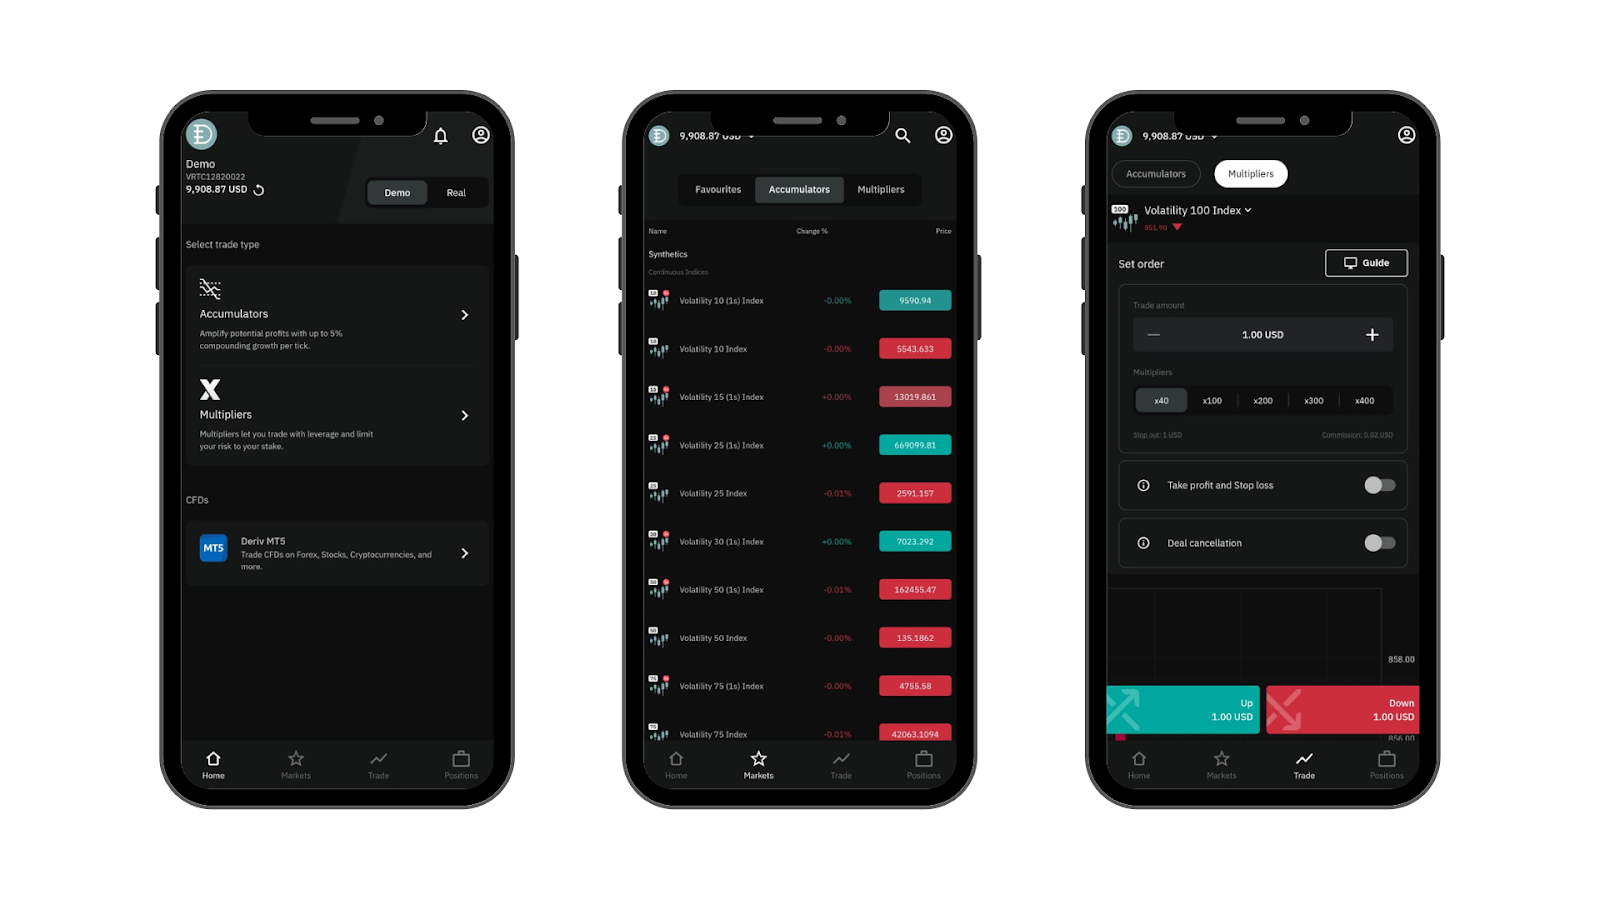
You can trade cryptocurrency with multipliers using:
- Deriv Trader: a web-based, intuitive platform.
- Deriv Bot: automate your strategy with a trading robot.
- Deriv GO app: a mobile app for trading anywhere, anytime.
Here’s how it works: you set your multiplier (for example, 5x), and if the market moves in your favour by 1%, your return becomes 5%. Your maximum potential loss is limited to your stake amount, which means your exposure is predefined. However, trading outcomes can still vary based on market conditions.
To manage your risk, you can use tools like take profit and stop loss, which automatically close trades at your chosen levels. These are particularly useful when you’re still learning how markets move.
Ashkan Nemati, Vice President of Trading Applications at Deriv, elaborates:
“Multipliers are excellent for short-term exposure with predefined risk.”
Why is Deriv a great place to start crypto trading?
Deriv is built with beginners in mind. Whether you’re exploring CFDs or multipliers, you’ll find everything you need in one place:
- Simple setup: Open an account in minutes. No wallets or exchanges required.
- Practise with virtual funds: A demo account allows you to experience market conditions without risking real money.
- Smart risk tools: Features like stop-loss and take-profit help protect your capital. Learn more about how multipliers work on Deriv.
- Regulated environment: Deriv operates under multiple licences, providing a transparent and security-focused platform experience.
- Flexible platforms: Choose between web, mobile, and automated trading, whatever fits your style.
With over 25 years of experience in online trading, Deriv offers a reliable path for newcomers to enter the crypto market with confidence.
How do CFDs and multipliers compare for beginners?
Both options provide different ways to access cryptocurrency markets. CFDs offer flexibility and detailed control, while multipliers provide a faster pace of trading and increased exposure, which can amplify both potential gains and losses.
Paveetra Bhadrika, Deriv Trading Specialist, confirms:
“Beginners can experiment with both CFDs and multipliers to discover which approach aligns with their goals.”
How can beginners manage risk in crypto trading?
Before trading with real funds, it’s essential to understand risk management: the foundation of every successful trading strategy. Managing risk means knowing how much you can afford to lose and how to control losses before they happen.
Deriv’s take profit and stop loss tools are your first line of defence. A take-profit order closes a trade automatically once the market reaches your chosen level. Meanwhile, a stop-loss limits losses if the market moves against you. These features help prevent emotional decisions and keep your trades disciplined.
Another helpful principle is the 1% rule: risk no more than 1% of your total balance on a single trade. This approach ensures you can stay active in the market even during losing streaks, giving you more opportunities to learn.
Kai Zhe, Senior Analytics & Automation Specialist at Deriv, adds:
“Consistency matters more than quick wins. A trader who manages losses wisely will still be trading when others have stopped."
Take advantage of Deriv’s demo account to practise setting different stop-loss and take-profit levels. Experimenting in a risk-free environment lets you see how these features work in real-time, preparing you for more confident decision-making later on.
What are the next steps for new crypto traders?
One of the most important things for beginners to learn is that cryptocurrency prices can change rapidly. These movements are driven by global events, regulations, and overall market sentiment. Unlike traditional markets, crypto never sleeps, meaning market movements can occur at any time.
Before placing a trade, it is helpful to review the technical analysis tools available on Deriv MT5. Charts, indicators, and historical data can help you understand patterns and trends. Even simple indicators, such as moving averages or Relative Strength Index (RSI), give valuable insights into when a market might rise or pull back.
At the same time, fundamental factors such as new blockchain projects, government policy updates, or major coin listings can also influence prices. Many traders combine both technical and fundamental analysis to make informed decisions.
If you’re new, practise analysing price charts in your demo account before using real funds. Over time, you’ll develop a sense of how crypto markets move and how to manage trades confidently.
Ready to start your crypto journey?
Taking your first steps into cryptocurrency trading begins with understanding how the market works and how different tools function. With Deriv, you can learn at your own pace, practise using virtual funds, and explore the platform features before considering live trading.
Start with a free Deriv demo account that comes with 10,000 USD in virtual funds, explore the platforms, and understand how price movements work. As you gain experience, you can move to live trading when you feel comfortable.

Factors affecting forex rates
As the biggest and one of the most accessible financial markets to trade in, the forex market holds plenty of trading opportunities for traders all over the world. Forex trading is essentially the exchange of one currency for another, and the value of both currencies are measured against each other. This is called an exchange rate.
As the biggest and one of the most accessible financial markets to trade in, the forex market holds plenty of trading opportunities for traders all over the world. Forex trading is essentially the exchange of one currency for another, and the value of both currencies are measured against each other. This is called an exchange rate.
There are typically two types of exchange rates — fixed rates and floating rates. If a currency has a fixed rate, its value is pegged to the value of another currency and maintained until the local government adjusts the official exchange rate.
However, if a currency has a floating rate, its value is determined by forces in the forex market through supply and demand.
But what are these forces that affect floating exchange rates? And what factors should a trader consider when predicting how a currency value will move?
In this blog post, we go through important factors that affect the mid- and long-term trends of foreign exchange rates and the value of currencies.
Interest rates
A high interest rate leads to higher currency values, as it will attract foreign investment and increase the demand for the local currency.
The interest rate is an amount that is charged to a borrower as a cost for using the capital or asset that they borrow, and is a percentage of the total amount borrowed. This represents the rate of return for the investor, which is the gains or losses of the investment.
When interest rates offered by a country are high, foreign investors will be more willing to invest in the country as they will receive a higher rate of return — or higher gains — from their investment over time. When foreign capital is poured into the local country as investment, the foreign currency has to be converted into the local currency. This pushes up the demand for local currency and raises its value.
Interest rates are determined by central banks, so it’s good to keep an eye on important announcements made by them.
Inflation
Inflation occurs when rising costs of goods and services lead to the decline of a currency’s purchasing power. The measurement of a currency’s purchasing power is a strong indicator of its value, and can be observed through a country’s level of inflation.
Inflation occurs when goods and services become more expensive. This can happen either because of rising production costs thanks to more expensive raw materials or services, or because of an increased demand. This in turn pushes up the prices of goods and services as either they become more expensive to produce or production fails to meet increasing demand.
If inflation is high, it would cost a consumer more money to buy the goods and services compared to previously, meaning the currency has less purchasing power. The measurement of a currency’s purchasing power is a strong indicator of its value.
If inflation is low, a currency is strengthened because its purchasing power is high — one unit of the currency is able to buy more. This leads to an increase in demand for that currency, which in turn raises its value.
International trade
A currency’s value can also be affected by the balance of trade between countries — the balance of trade refers to the difference between a country’s imports and exports. Countries with higher exports will usually experience an increase in their currency’s value.
Let’s say demand for UK products increases. Countries that want to import UK products will need to convert their currency to British pound sterling to buy UK products. This will then increase the demand for pound sterling as countries are buying more products with the currency, which will then boost its value.
International trade is also affected by a country’s inflation rate.
For example, if the US has a high inflation rate, buying US-made products and services becomes more expensive as the US dollar's purchasing power has decreased. There will be less demand for the US dollar, thus leading to a decreasing value and exchange rate.
Economic and political stability
International trade is closely related to a country’s economic health. Economic health can be measured by a number of factors, including GDP, inflation, as well as a country’s current account and balance of payments — the difference between how much a country spends and how much it earns.
If a country spends more to import foreign trade compared to what it earns, their balance is in deficit. They would need more foreign capital to buy foreign products, resulting in a lower demand for local currency and a decrease in the local currency’s value.
A currency’s exchange rate and perceived value are also strongly affected by a country’s political stability. Solid financial and economic policies determined by a stable government will greatly contribute to confidence in a currency and the economy as a whole.
When people are confident and optimistic about an economy’s future expansion and growth, they will be more willing to invest in the local currency. This will increase demand for the currency, and thus strengthen its value.
Speculation
The forex market and currency exchange rates can also react to speculations. For example, if speculators anticipate a rise in currency value in response to political events or global news, investors will buy more of it in the hopes of making a profit by selling it when prices rise. This leads to an increase in demand, resulting in an increase in the currency’s value.
It is important to note that there are many factors that contribute to currency exchange rates and price movements, leading to potentially significant volatility in the forex market.
So in addition to considering the factors mentioned above in a fundamental analysis, make use of technical analysis to support your strategy and trading style when you trade forex. You can practise trading risk-free with a demo account that’s pre-loaded with virtual currency, which allows you to refine your strategy before trading with real money.
Sorry, we couldn’t find any results matching .
Search tips:
- Check your spelling and try again
- Try another keyword