Results for

Weekly market report – 18 Oct 2021
There has been a sideways trend in gold for more than four weeks – every time it attempted to move up, it was not sustaining its bullish momentum.
XAU/USD — Gold
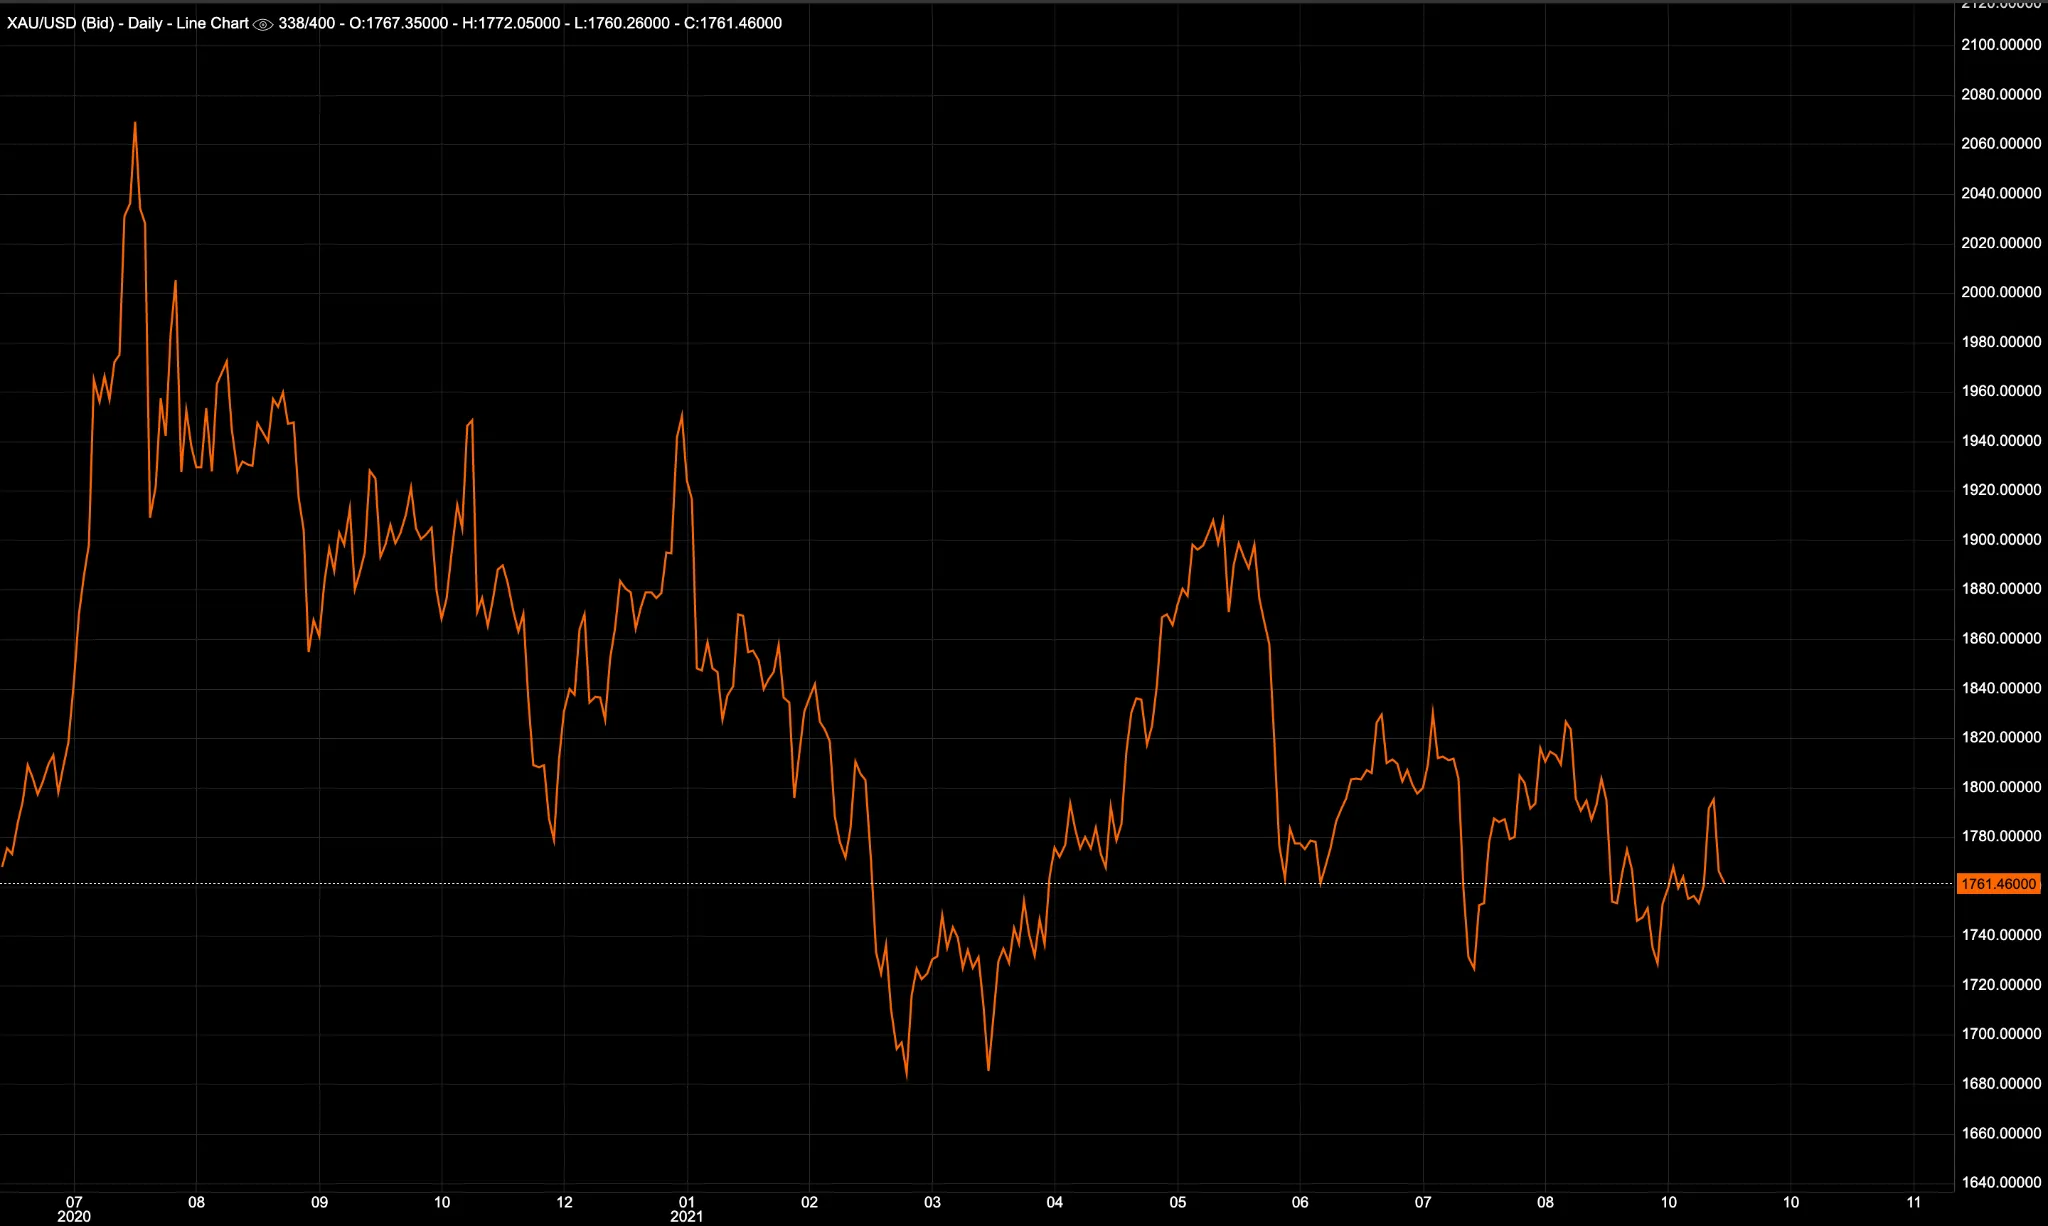
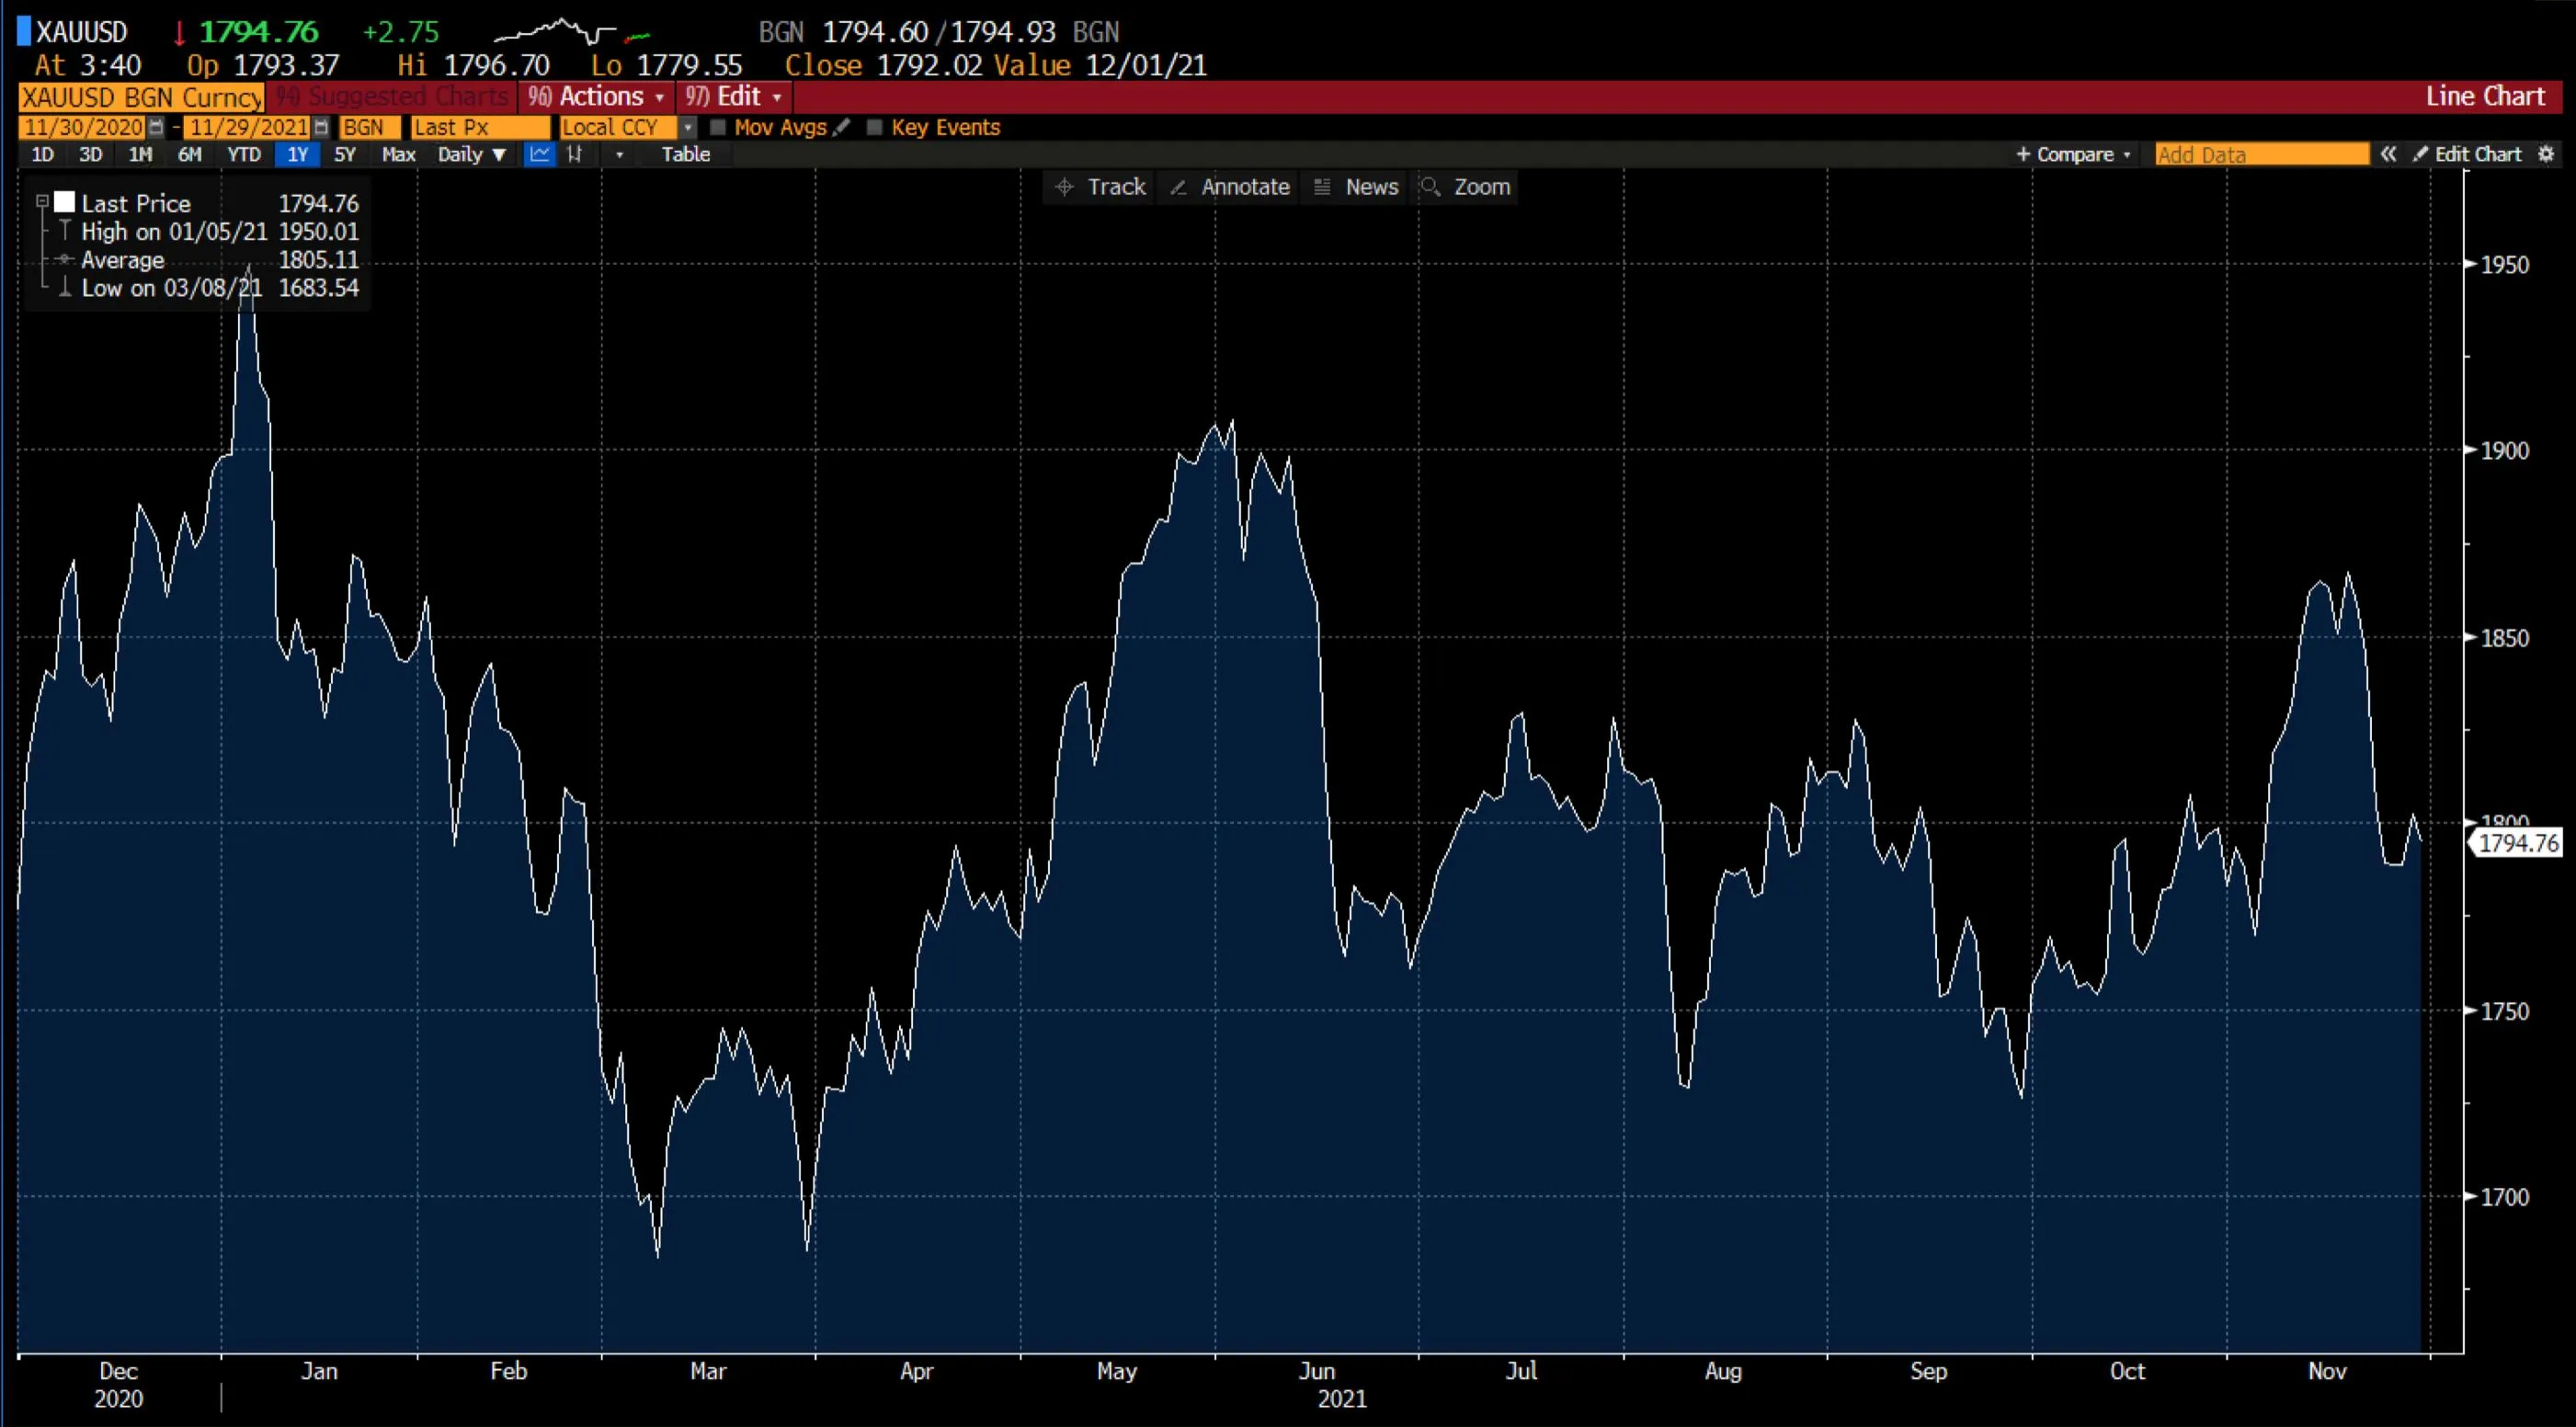
There has been a sideways trend in gold for more than four weeks – every time it attempted to move up, it was not sustaining its bullish momentum. Last week, gold hit the $1,800 mark and dropped back to $1,764. In the absence of major fundamental data, gold prices might be confined to the same range. It might also focus on the development of the US treasury yield and the US dollar index. The first resistance levels appear to be $1,780 - $1,786 followed by 50% retracement levels near $1,800, while $1,750 – the previous week's low – might provide some support, followed by the major downside channel support near $1,720.
Trade Gold options on DTrader and CFDs on Deriv MT5 Financial account.
EUR/USD

The EUR/USD pair has been moving sideways, too, for the past week. It has been hovering around its 52-week low for more than three weeks but it failed to break out on either side. Support levels near 1.1525 are proving to be key, as the pair has taken support at this level multiple times and bounced back. On a daily basis, the RSI is showing a divergence, which indicates a bullish trend in the short-to-medium term. Technically speaking, 1.15 could provide major support, while on the higher side, once EUR/USD sustains above 1.1620, it might attempt to reach the 1.17 levels.
Trade EUR/USD options on DTraderand CFDs on Deriv MT5 Financial and Financial STP accounts.
NASDAQ — Tech 100
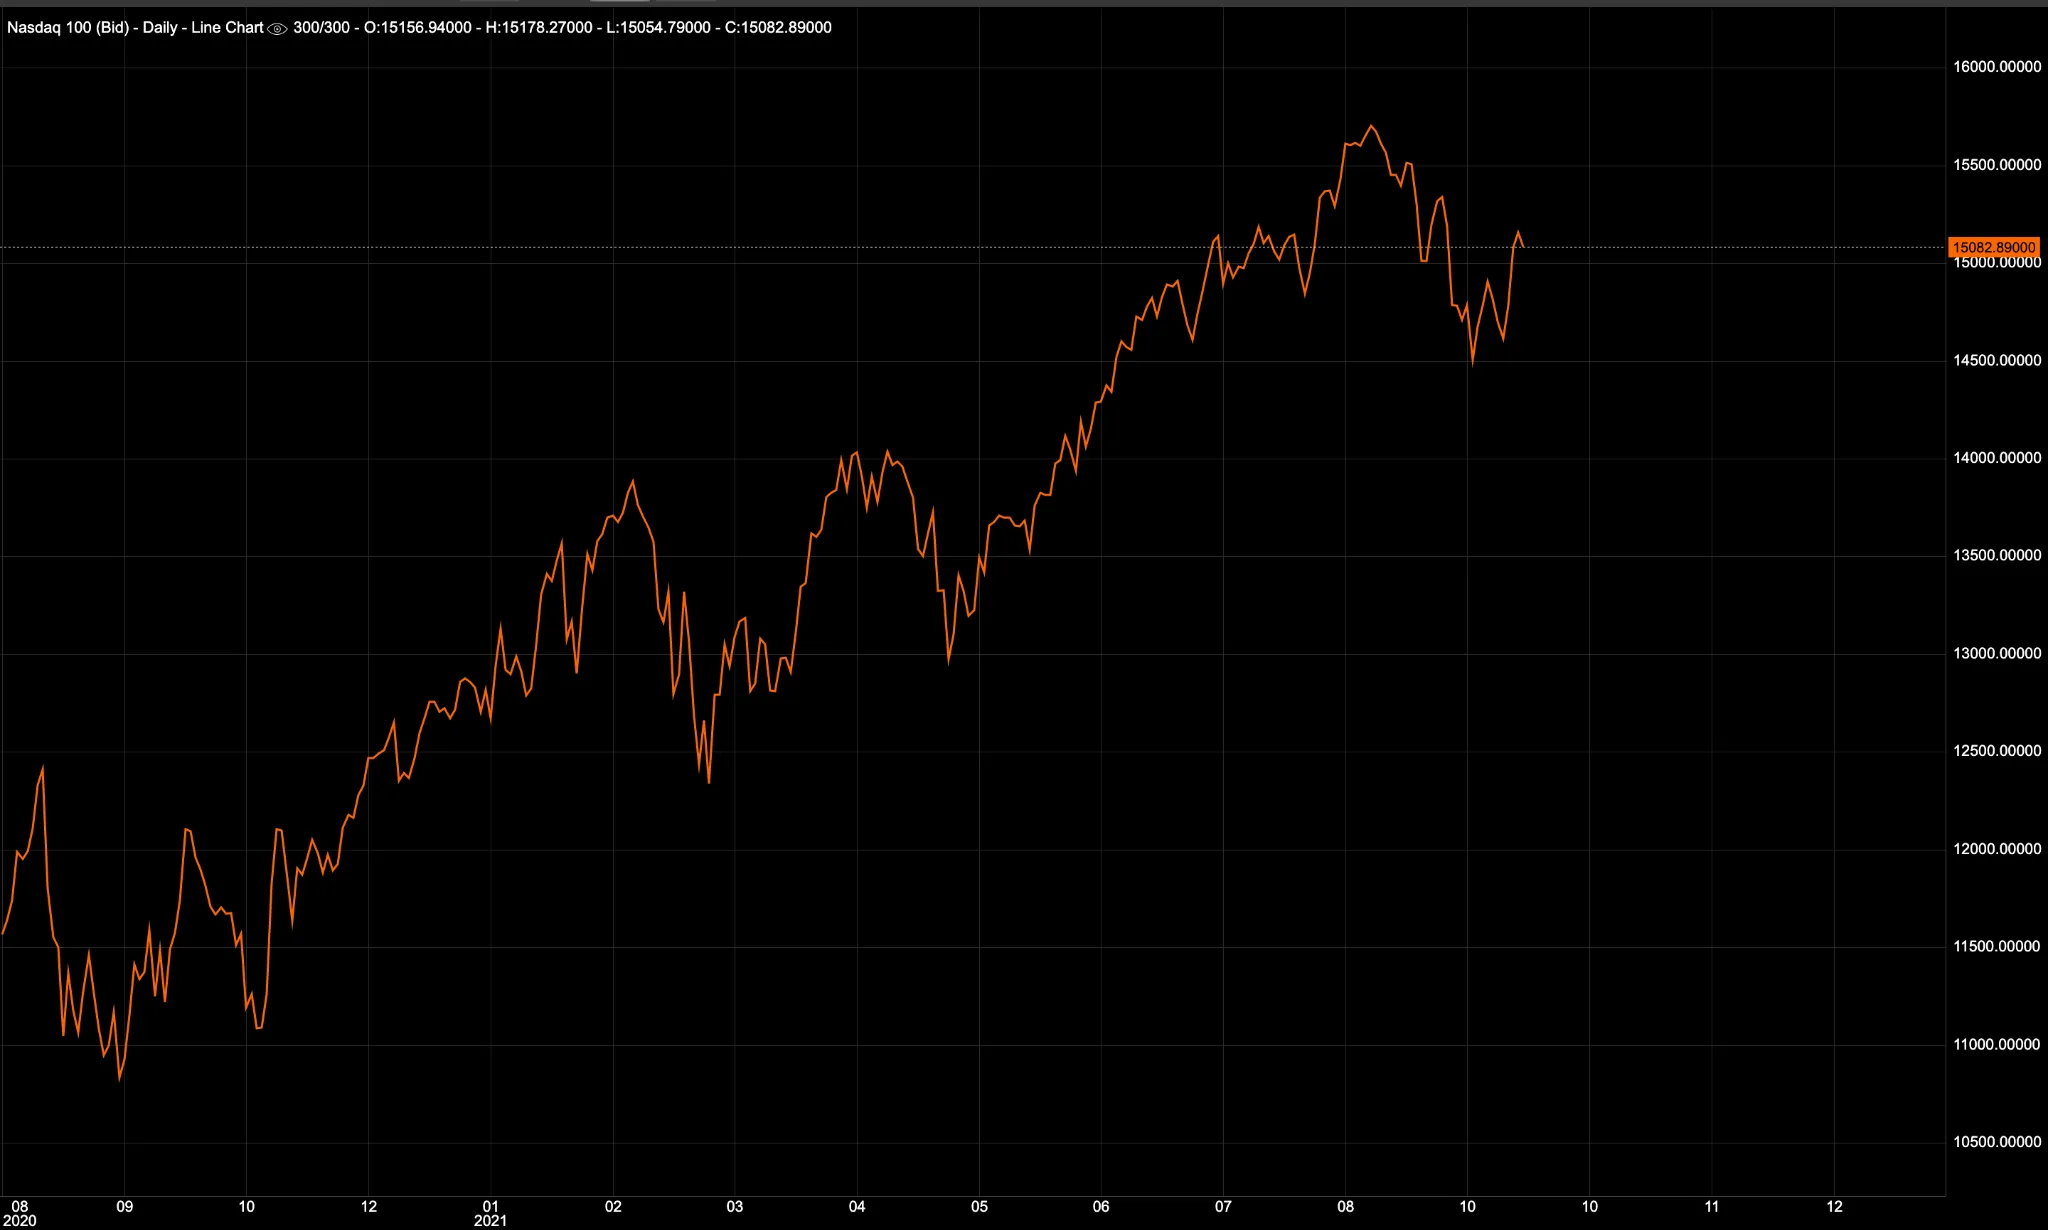
The US Tech Index, Nasdaq managed to pull back in the last week and closed above its resistance level of $15,000. It was the first major bullish week since the past month. The index is likely to depend on the upcoming quarterly results from some tech giant companies like Netflix and others over the next couple of weeks. In the coming week, $14,800 will provide support. However, on the upside, if it crosses the 61.8% retracement level of $15,192, it might reach the 78.6% retracement level of $15,400.
Trade US Tech Index options on DTrader and CFDs on Deriv MT5 Financial accounts.

Weekly market report – 01 Nov 2021
Last week, gold maintained its momentum on the bullish side due to the fall in treasury yields. Although yields continued to fall for the next two days, the yield curve started to flatten, with the 2-year yield rising above 0.52%, strengthening the US dollar and limiting the upside potential for gold.
XAU/USD — Gold

What happened last week?
Last week, gold maintained its momentum on the bullish side due to the fall in treasury yields. Although yields continued to fall for the next two days, the yield curve started to flatten, with the 2-year yield rising above 0.52%, strengthening the US dollar and limiting the upside potential for gold.
In addition to this, on Thursday, 28 October 2021, the GDP was announced by the BEA and was not up to par with the forecast (2.0% vs 2.7%), leading to a fall in the US dollar. However, this was not for long as the economic data on initial jobless claims was favourable (281K vs 290K), retreating gold at around $1,800.17 high.
On 29 October 2021, gold slipped by around -$18.70 at $1,783.02 due to the rise in the US yields.
What’s next?
The ISM manufacturing PMI is scheduled for next week, followed by the FOMC meeting later in the week. If the policymakers adopt a hawkish approach, the US dollar will outperform, and gold could turn bearish in the near term. On the other hand, if the policymakers adopt a dovish approach, downplaying the inflation concerns and focusing on the fall in GDP (Q3) would create selling pressure on the dollar and allow gold to go up.
Initial jobless claims and Non-farm Payrolls are also scheduled for the week wherein a strong figure could support the US dollar and vice versa.
Trade Gold options on DTrader and CFDs on Deriv MT5 Financial account.
EUR/USD

What happened last week?
Last week, the European Central Bank (ECB) kept its monetary policy unchanged. Despite inflationary concerns, the President of the ECB, Christine Lagarde, insisted that inflation is transitory and shall decrease next year. The GDP announcement (2.0% actual vs 2.7% forecast) cooled down the expectations for aggressive tapering in the US. The reason for the downfall was mainly attributed to slow consumer spending and supply chain concerns.
What’s next?
The US will be publishing the ISM manufacturing PMI on Monday, 1 November, 2021, with the forecast at 60.4 (the previous at 61.1). On Wednesday, 3 November, 2021, the country will publish the ADP Non-farm employment change, with the forecast being at 400k (the previous being at 568K), followed by the monetary policy decision undertaken by the US Federal Reserve. Also, the country will publish the Non-farm Payroll report with the forecast of around 397k new jobs (the previous being 194k).
On the other side, the EU calendar would focus on Retail sales (for September) and ECB’s President Lagarde speech.
Trade EUR/USD options on DTrader and CFDs on Deriv MT5 Financial and Financial STP accounts.
GBP/USD
What happened last week?
In the last week, the dollar struggled due to the GDP data (2.0% actual vs 2.7% forecast), and the yield curve that continued to fall started to flatten by the end of the week, allowing GBP/USD to improve despite the current Brexit issues.
What’s next?
The ISM Purchasing Manager Index is scheduled this week for the USD (60.4 Forecast vs 61.1 Previous). As the forecast is well above 60, it could reflect strong economic growth, the Non-farm Payroll report with the forecast of around 397k new jobs (previous being 194k). As mentioned earlier, a monetary policy decision will be undertaken by the Federal Reserve this week.
For GBP, the calendar would be focusing more on the upcoming inflation report and the interest rate decision by the Bank of England. However, the question is, will the Bank of England increase the rates?
Trade GBP/USD options on DTrader and CFDs on Deriv MT5 Financial and Financial STP accounts.

Weekly market report – 22 Nov 2021
On Friday, 19 Nov 2021, stocks ended the week mixed as COVID-19 cases surged across Europe, and investors weighed its impact on the global economy.
Stock Indices
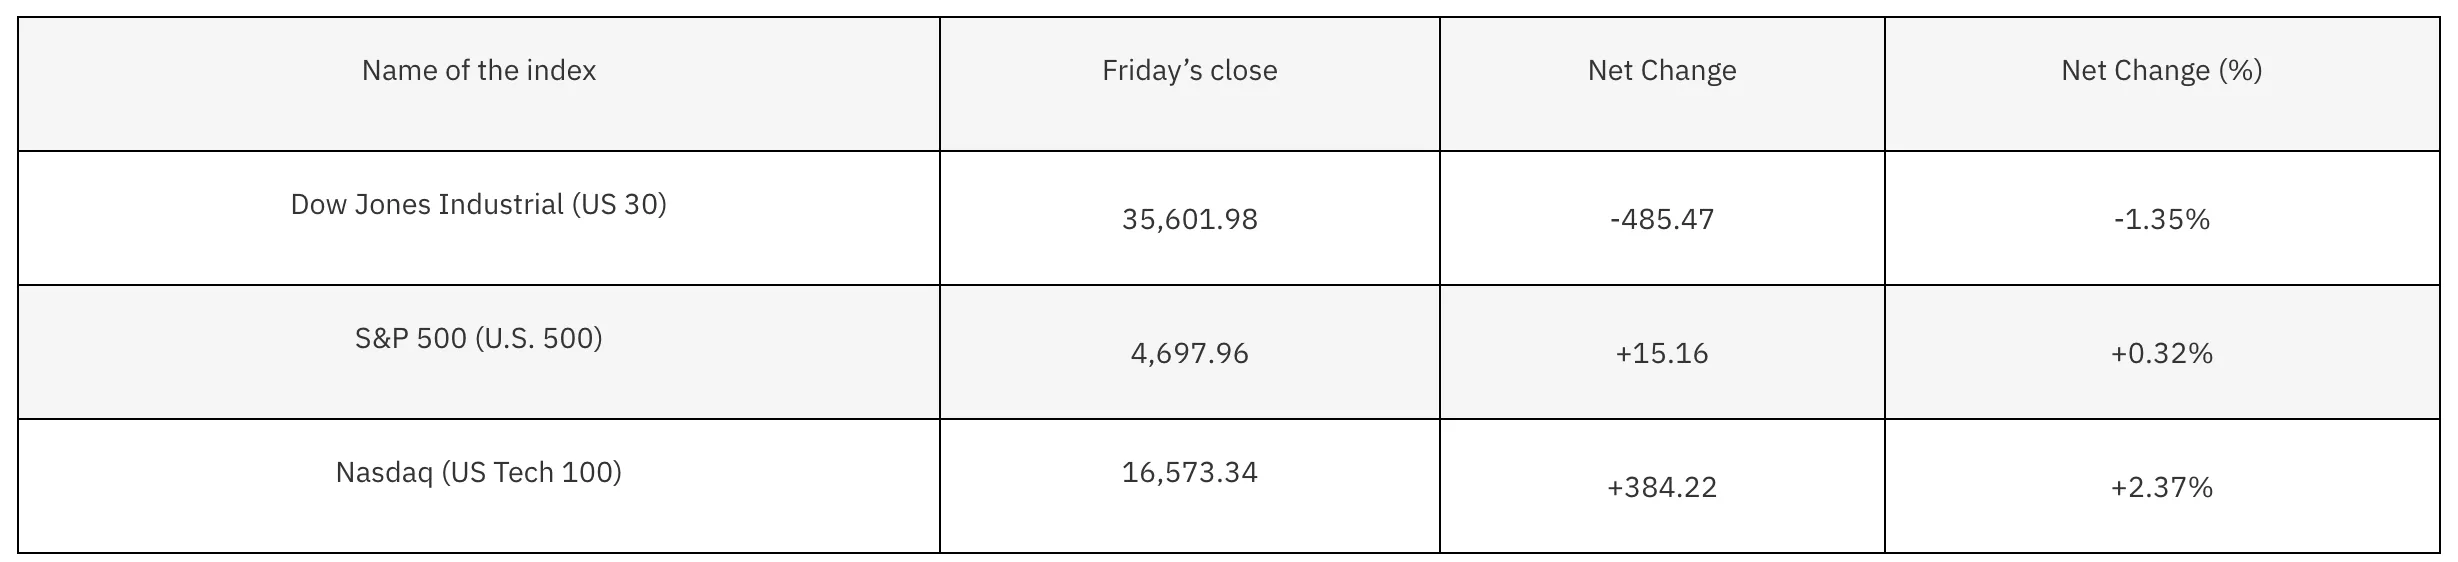
On Friday, 19 Nov 2021, stocks ended the week mixed as COVID-19 cases surged across Europe, and investors weighed its impact on the global economy. During the week, the S&P posted a gain of 0.32%, while the Dow took a dive, translating to a 1.35% drop. Meanwhile, the tech-heavy Nasdaq posted some impressive gains, rising 2.37% for the week — a historic close for the Index. Nasdaq-100 surged higher as tech stocks appeared to be the popular choice amongst investors. Strong earning results from Nasdaq-listed Nvidia, the world's largest producer of computer chips, enticed investors to purchase other chipmakers.
Additional tech moves saw Apple rise 7.51% on the week after reporting that it would refocus its electric vehicle efforts towards self-driving capabilities. Lower bond yields also contributed to the rise in stocks. The 10-year Treasury fell to 1.545% on Friday, 19 Nov 2021, down from 1.586% on Thursday. This caused stocks to become more attractive to investors because bond prices move inversely with bond yields. Corporate earnings continued to surpass Wall Street's expectations despite inflationary pressures and ongoing supply-chain disruptions.
Companies like Nvidia (NVDA) and The Home Depot, Inc. (HD) had the largest gains in corporate earnings for the week, adding 7.91% and 9.16%, respectively. However, not all corporate postings translated into green readings across the board. Cisco Systems Inc (CSCO) closed the week in the red after reporting disappointing revenue, along with forecasts that missed investors' estimates. Following a similar suit, Visa (V), a major Dow Jones component, fell by nearly 5% after Amazon said it would stop accepting payments made with Visa credit cards in the UK.
Trade US indices options on Deriv Trader and CFDs on Deriv MT5 Financial and Financial STP accounts.
Forex
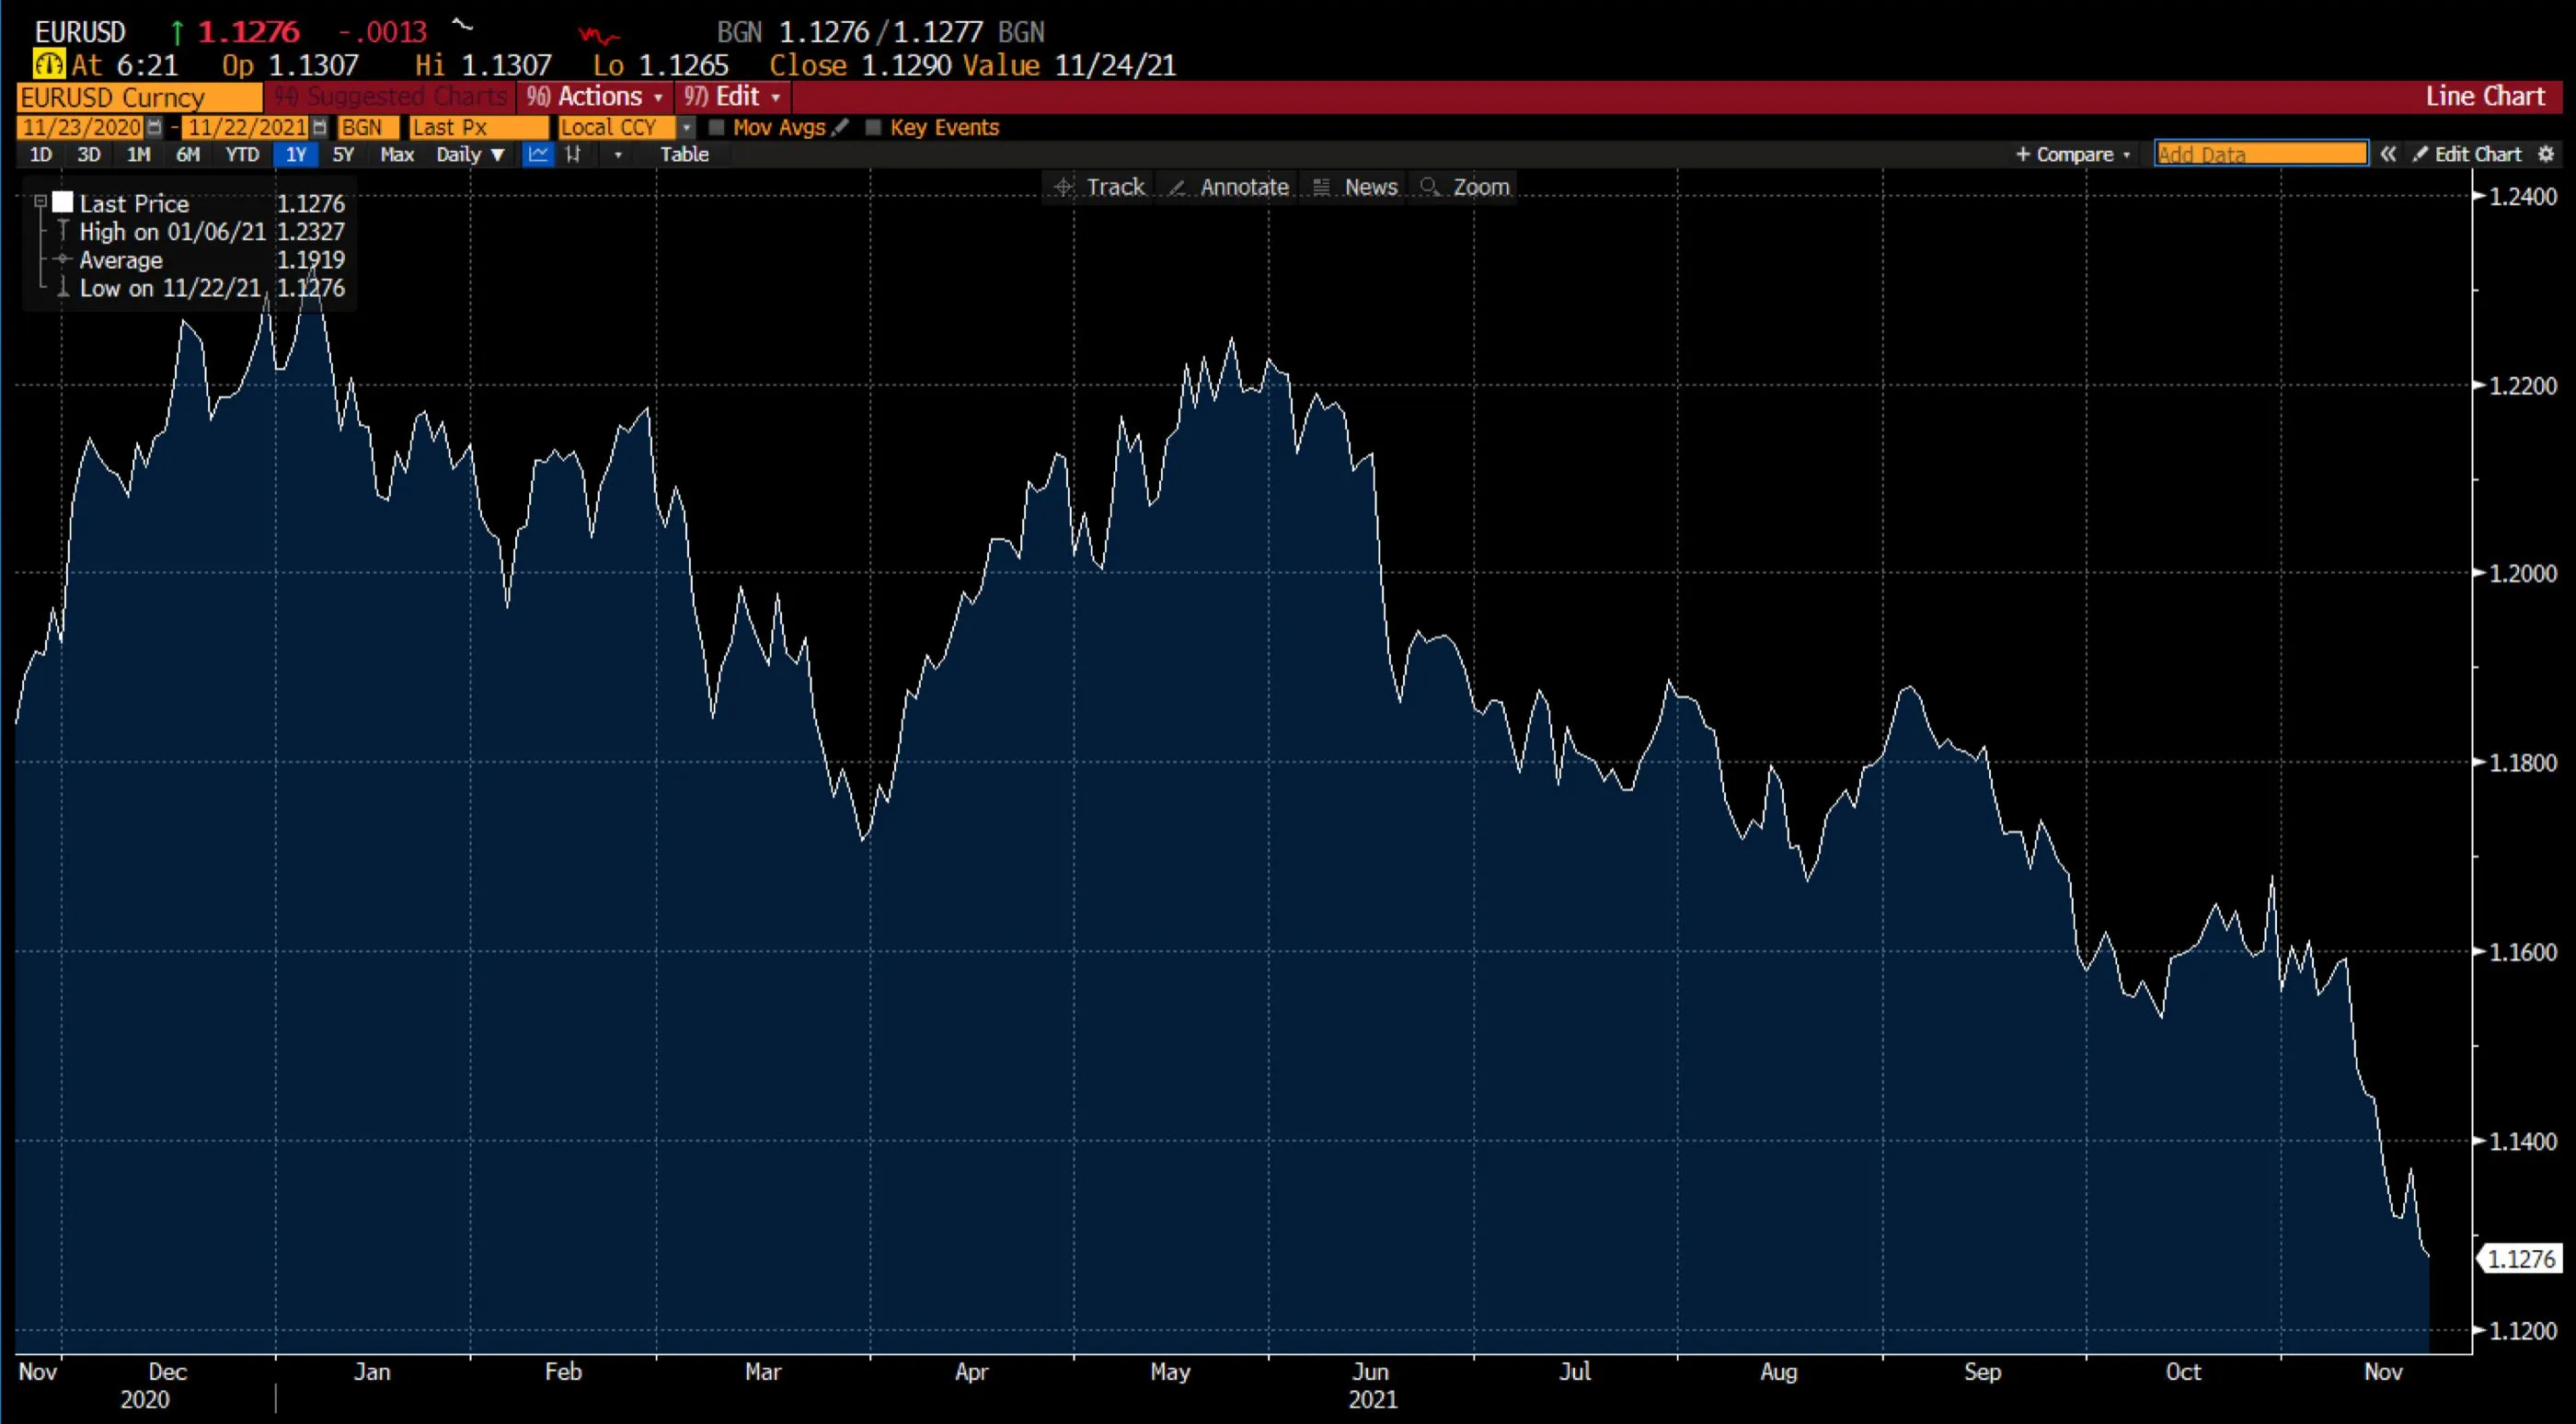
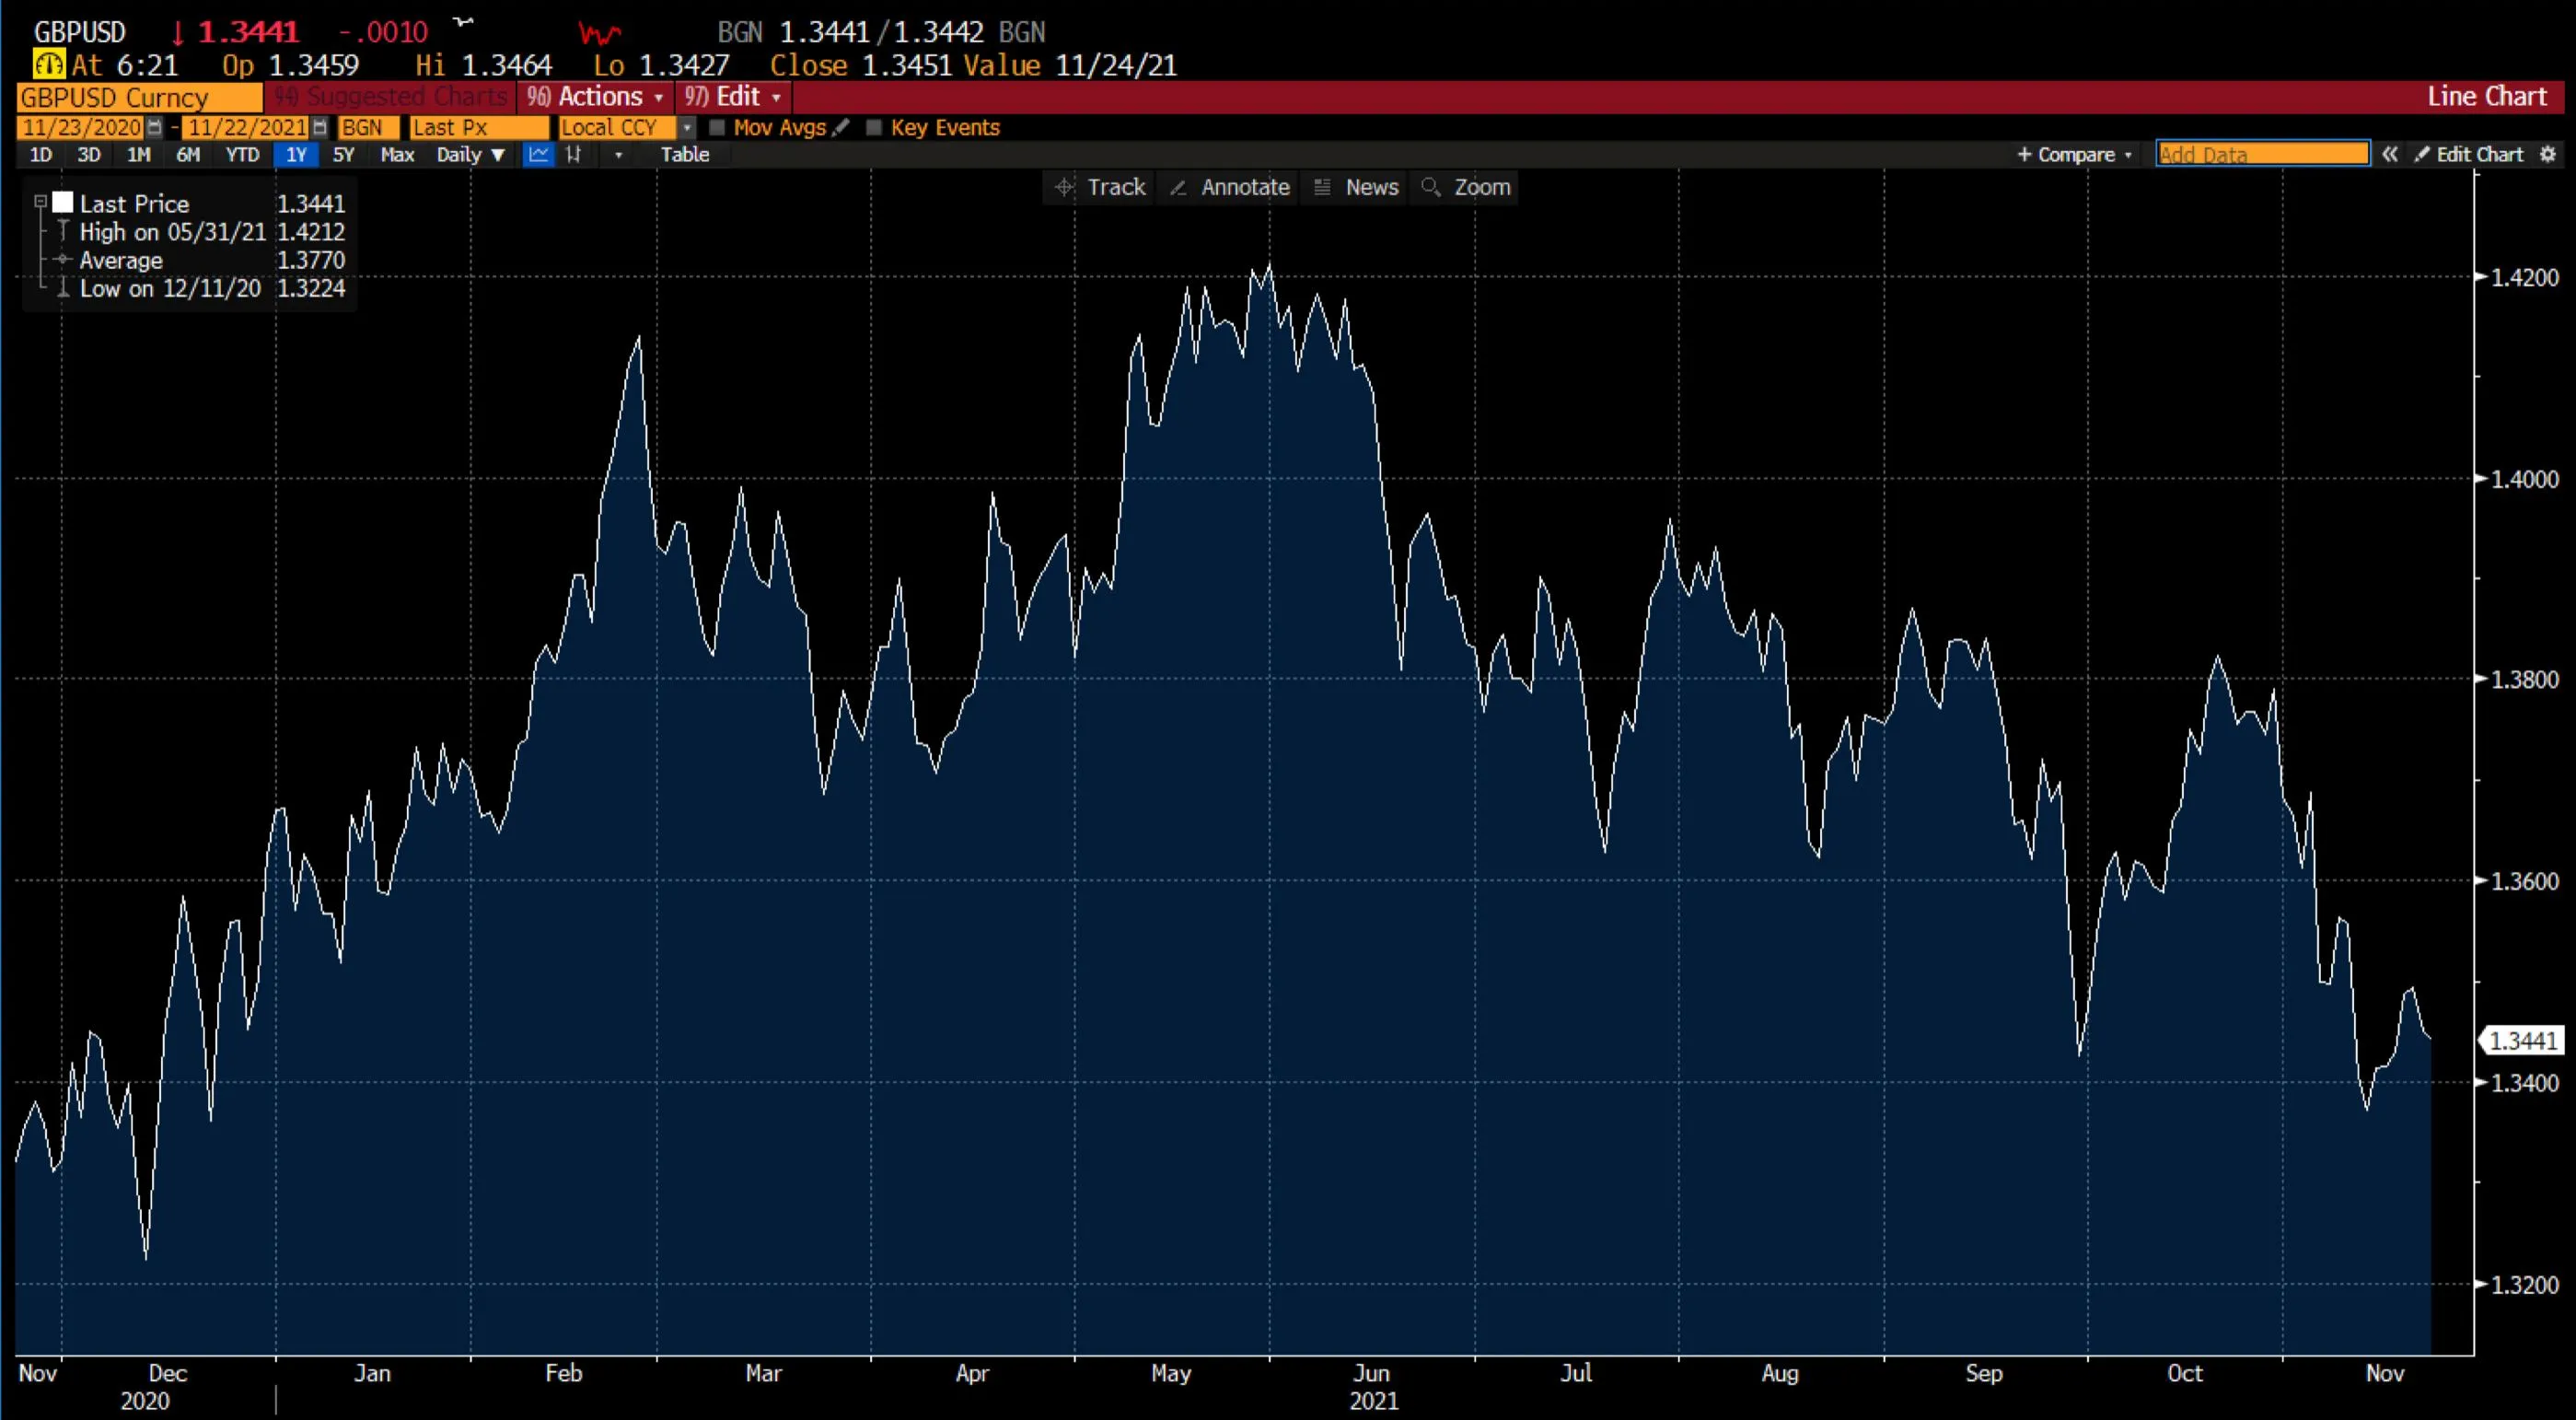
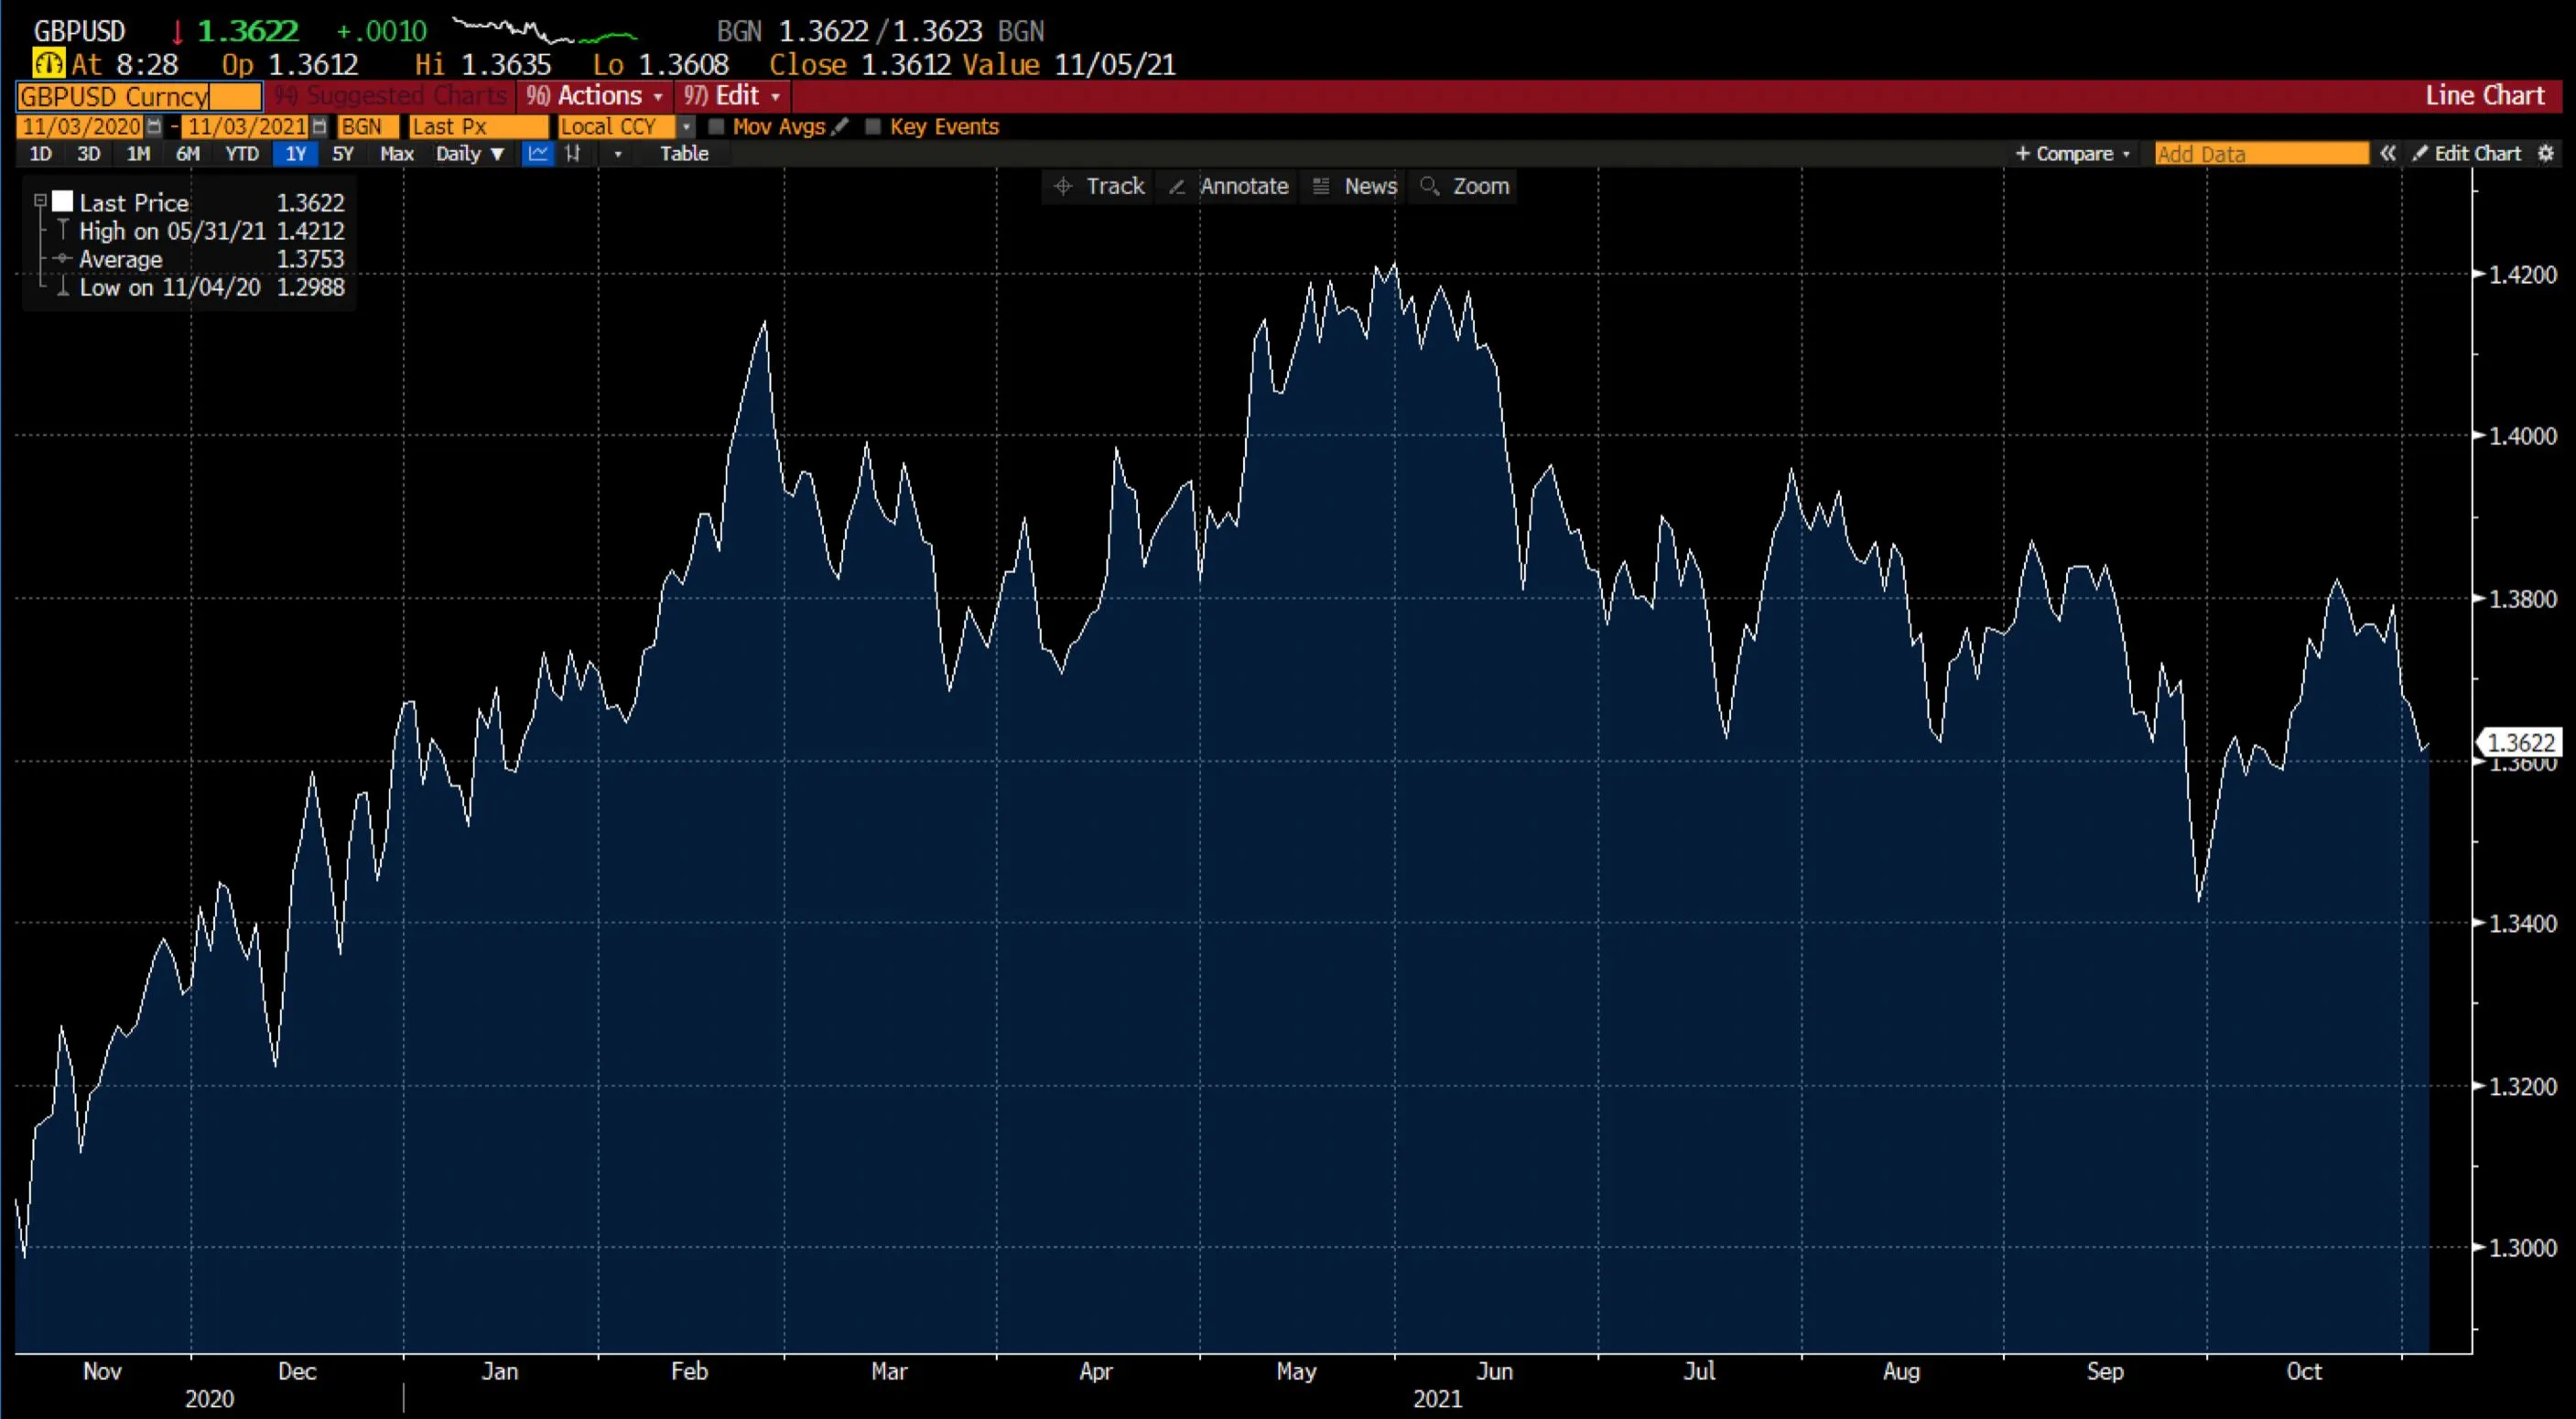
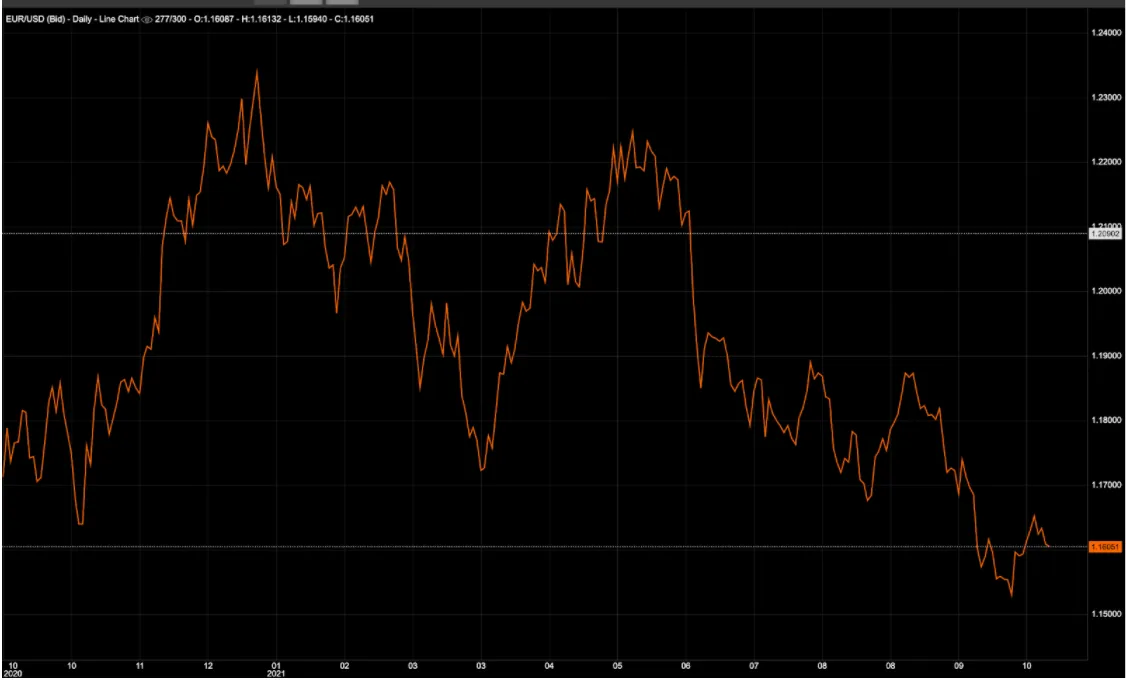
EUR/USD has been trading at low levels for the past 2 weeks due to comments made by the ECB President, stressing that rate hikes are unlikely in the near term. At the same time, U.S. Retail Sales increased by 1.7% (forecast at 1.0%). Moreover, concerns regarding COVID-19 have also led to nationwide lockdowns, further hindering the Euro. In a downtrend, EUR/USD is currently just below the 38.2% retracement level at $1.127, followed by the 23.6% retracement level at $1.10. GBP/USD gained a bit of momentum this week as CPI (YoY) data came in at 4.2% vs 3.9% expected.
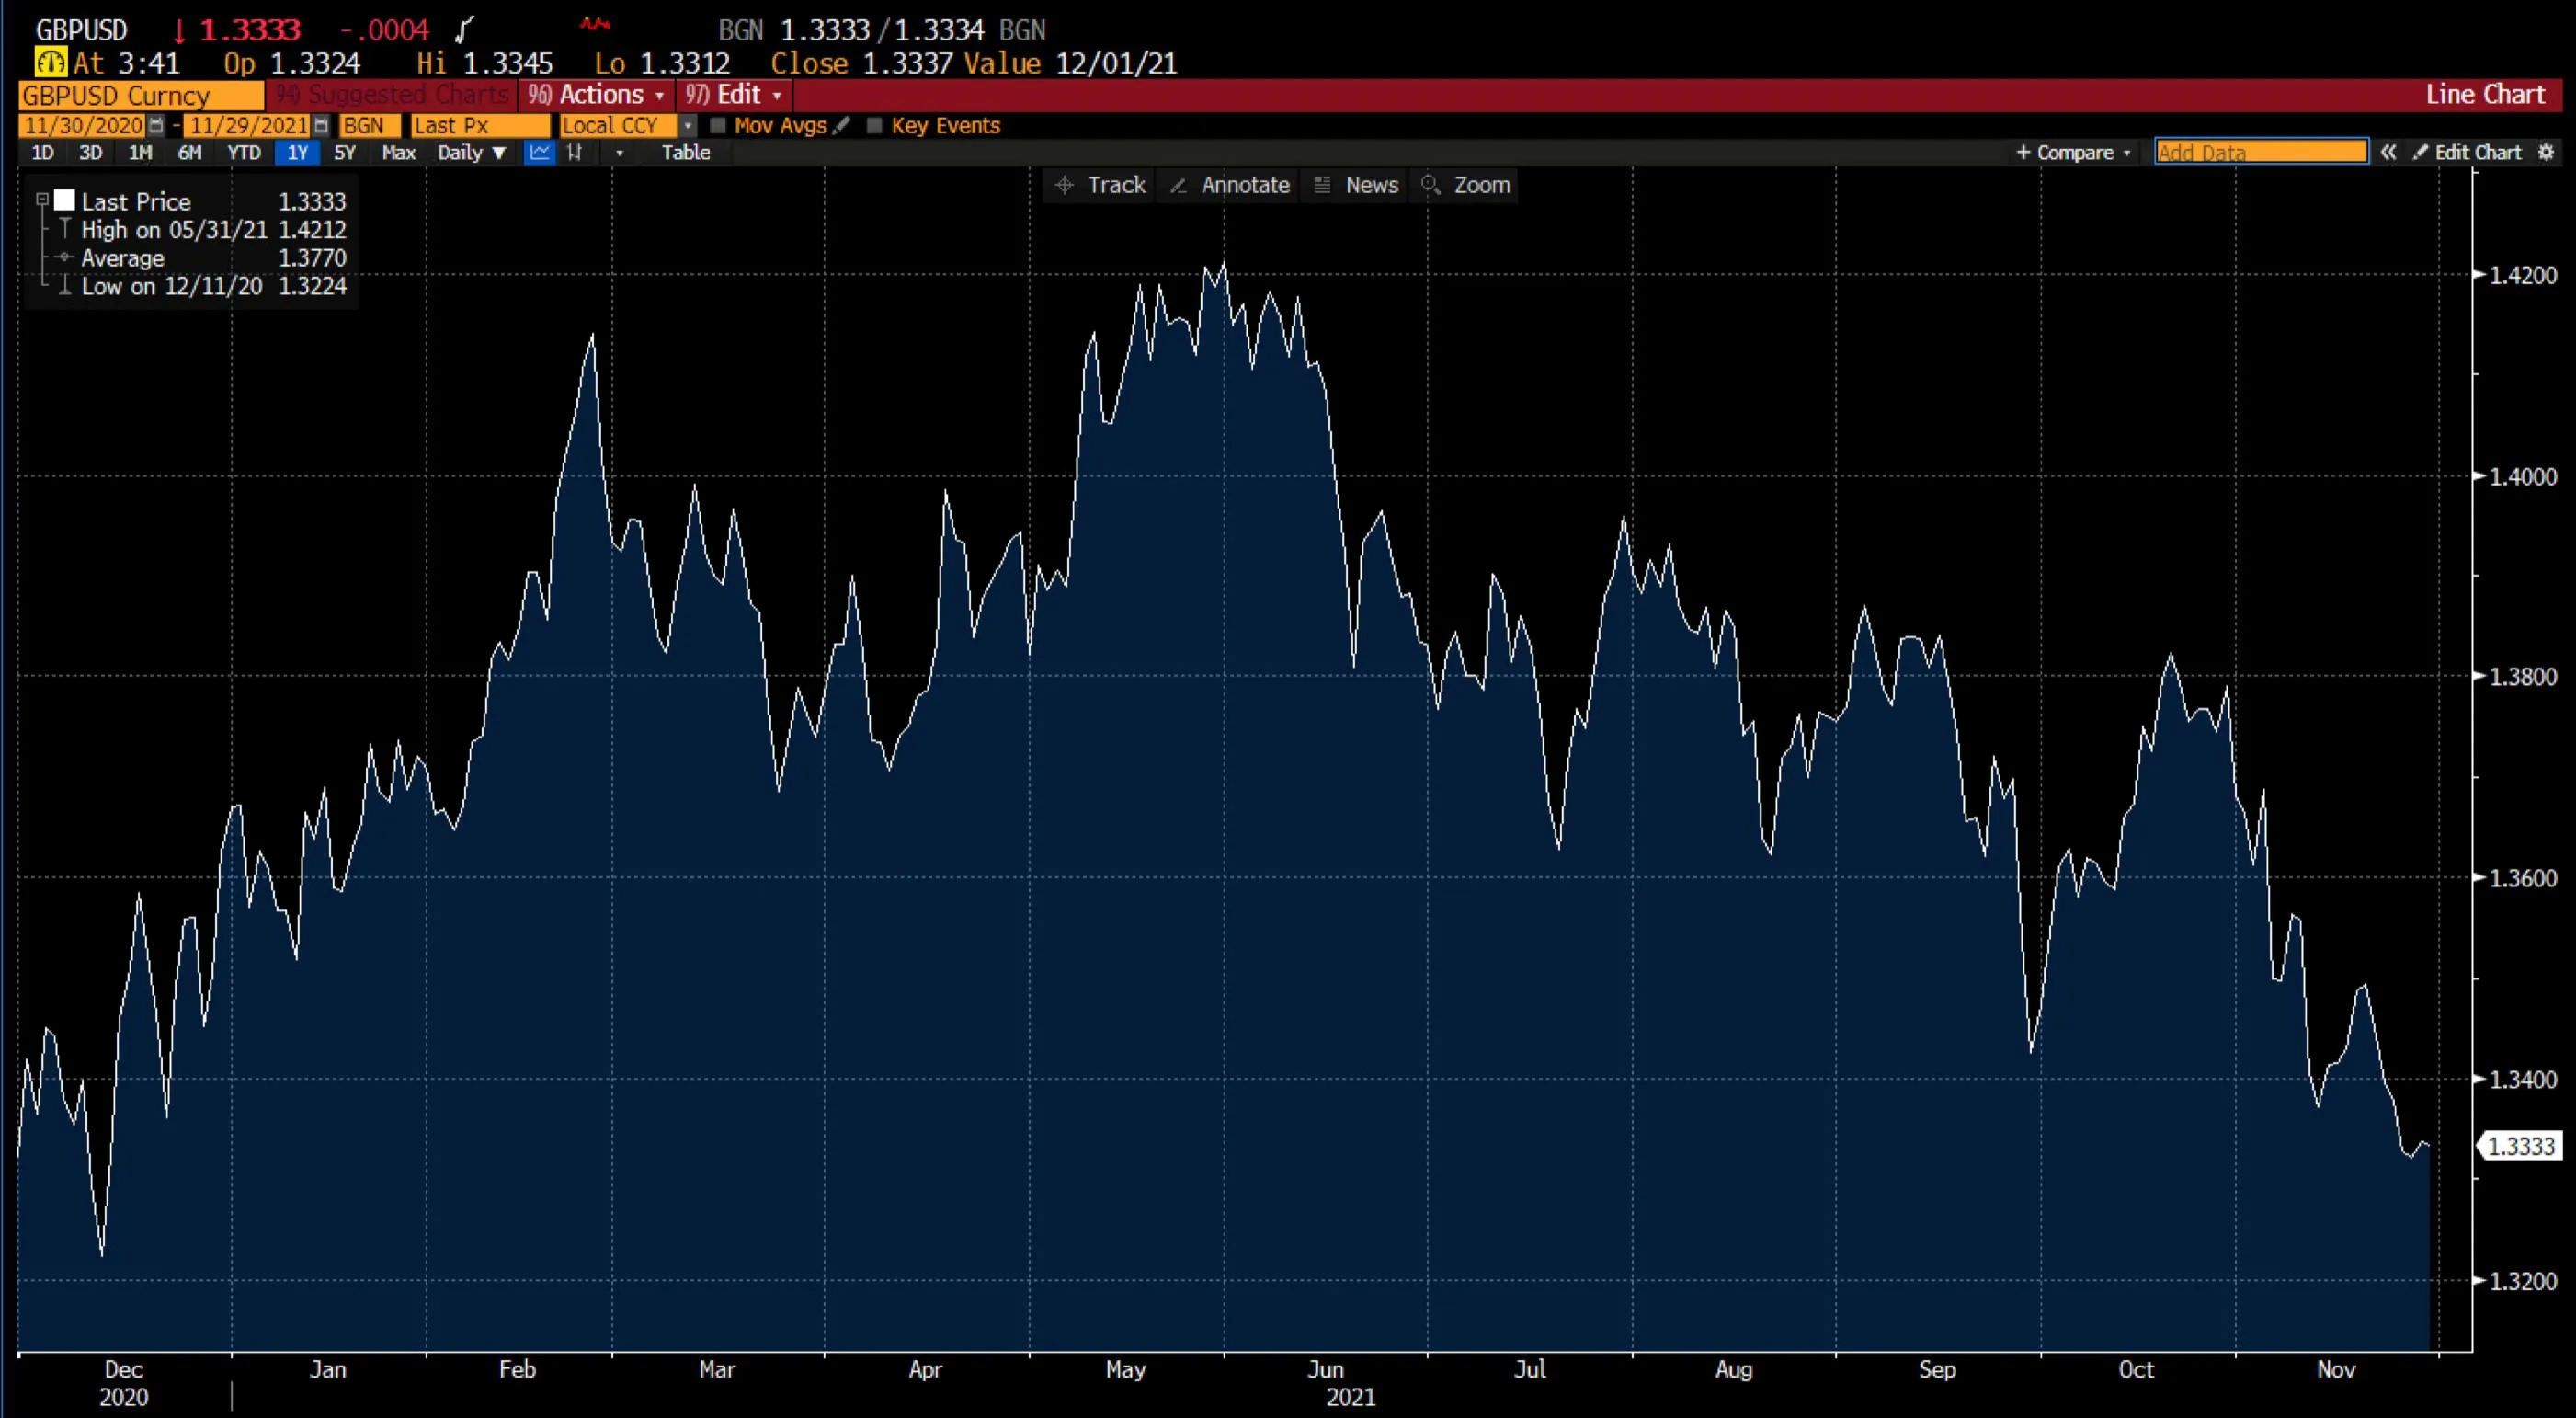
Retail Sales for the month were up 0.8% vs 0.5% forecast, whereas, for the US dollar, Retail Sales were up 1.7% vs 1.0% forecast. The GBP/USD pair ended the week near $1.34, and its next support level is the 61.8% retracement level near $1.31, followed by a 50% retracement level near $1.28. Resistance is seen at 78.6% retracement levels near $1.37.
Trade forex options on Deriv Trader and CFDs on Deriv MT5 Financial and Financial STP accounts.
Commodities
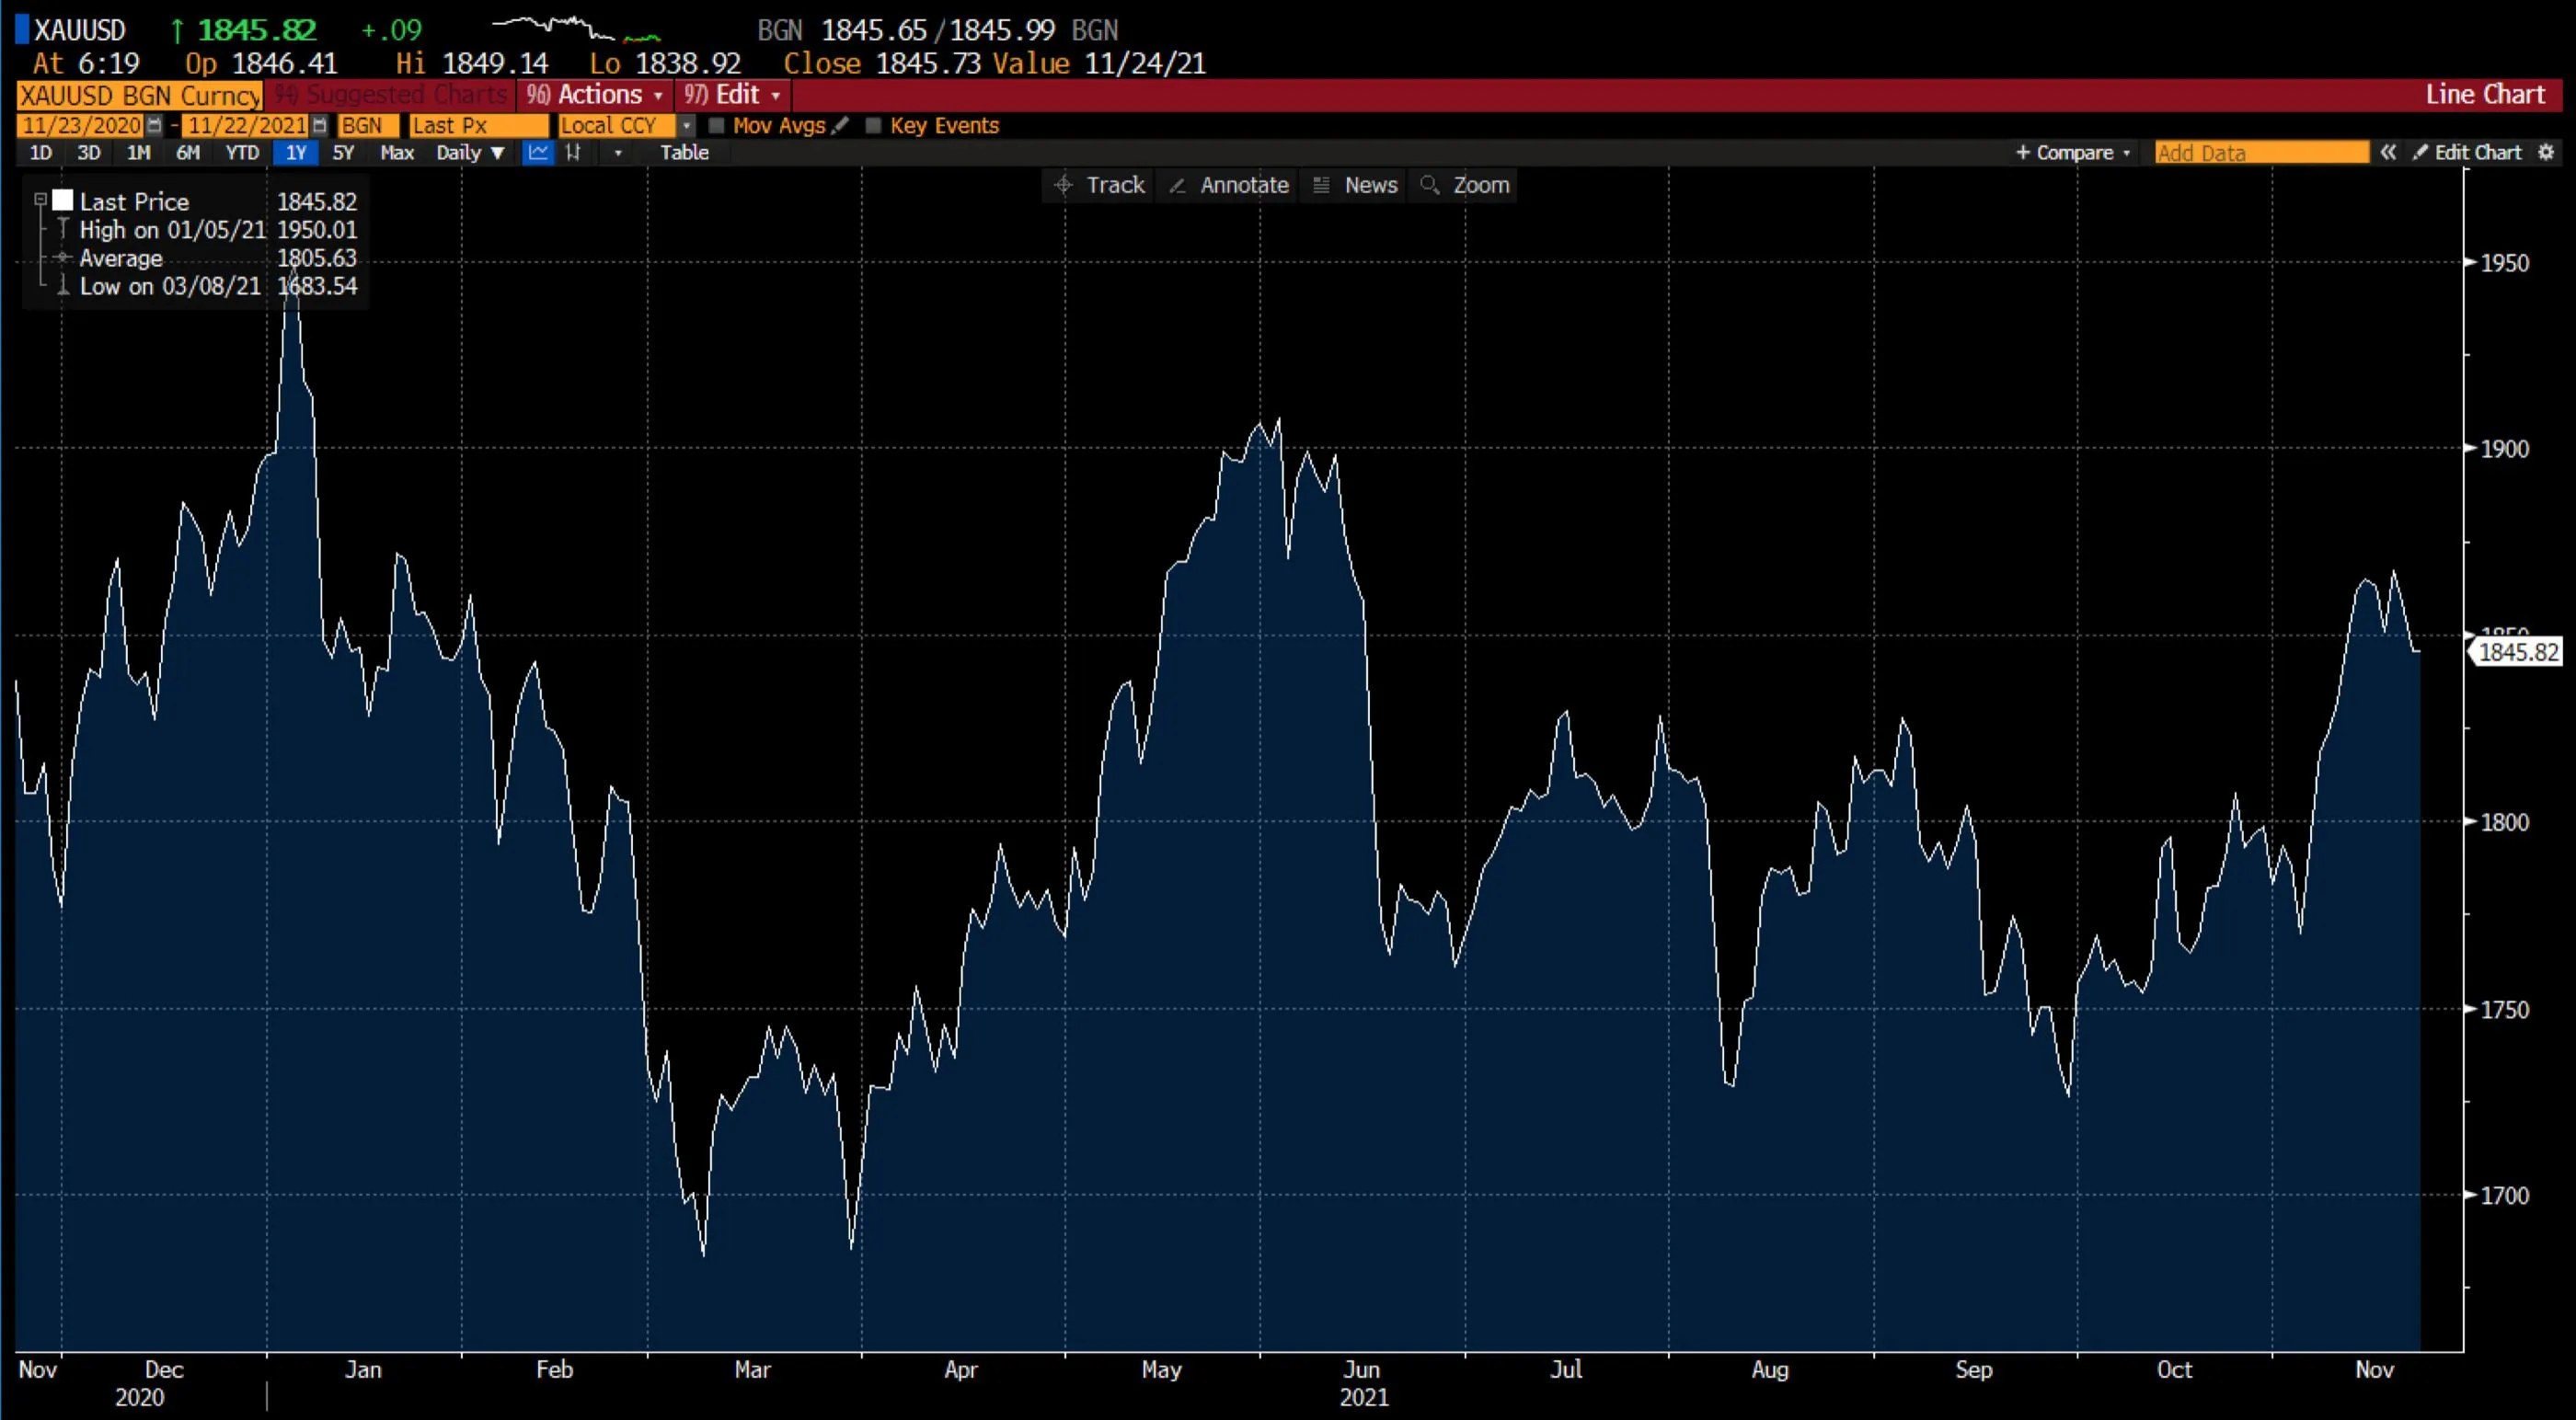
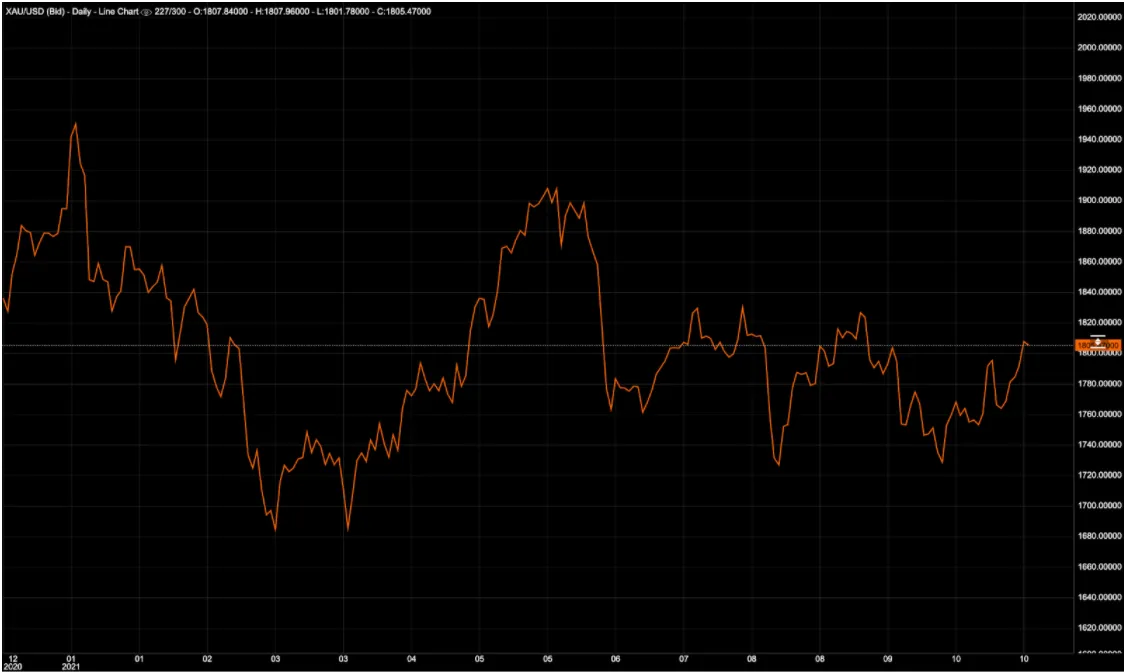
At the start of the week, gold struggled to maintain its momentum against the dollar due to an increase in Treasury Yields. Retail sales were higher than predicted, fueling strong inflation. However, gold managed to go up briefly on Wednesday, 17 Nov 2021, by 0.86% amidst a 4 basis point drop in the 10-year US Treasury Yield. Gold then slipped due to the market rallying on Thursday, 18 Nov 2021, with Large Cap Tech outperforming. XAU/USD finished the week near $1,845.00, and its next support level is the 38.2% retracement level near $1,830.00, followed by a 23.6% retracement level near $1,770.00. On the upside, resistance for XAU/USD is near $1,875.00 at 50% retracement levels, followed by $1,920.00 at 61.8% retracement levels. On Friday, 19 Nov 2021, gold against euro closed at €1,634.91, maintaining its upward trend from the previous 4 weeks.
This movement was primarily due to the ECB keeping interest rates below zero and pushing back the possibility of a rate hike in the near term. If the ECU decides to hike rates, the situation could potentially weaken gold's value with inflationary pressures rising across Europe. The technical analysis indicates that XAU/EUR is facing resistance near the 78.6% retracement level of around €1,670.00. On the downside, the pair faces resistance at its 61.8% retracement level around €1,605.00, and €1,560.00 at its 50% retracement level. Oil ended at $76.10 and has been declining for the past 4 weeks.
This decline can mainly be attributed to the increasing Covid-19 cases in the Eurozone and the possibility of the US and China releasing crude oil reserves to lower the price. As per the chart, it is currently above the 78.6% retracement level, near $66.00. On the upside, if things change, at the 127.2% retracement level, it may climb up to $105.00.
Trade commodities options on Deriv Trader and CFDs on Deriv MT5 Financial account.
Cryptocurrency

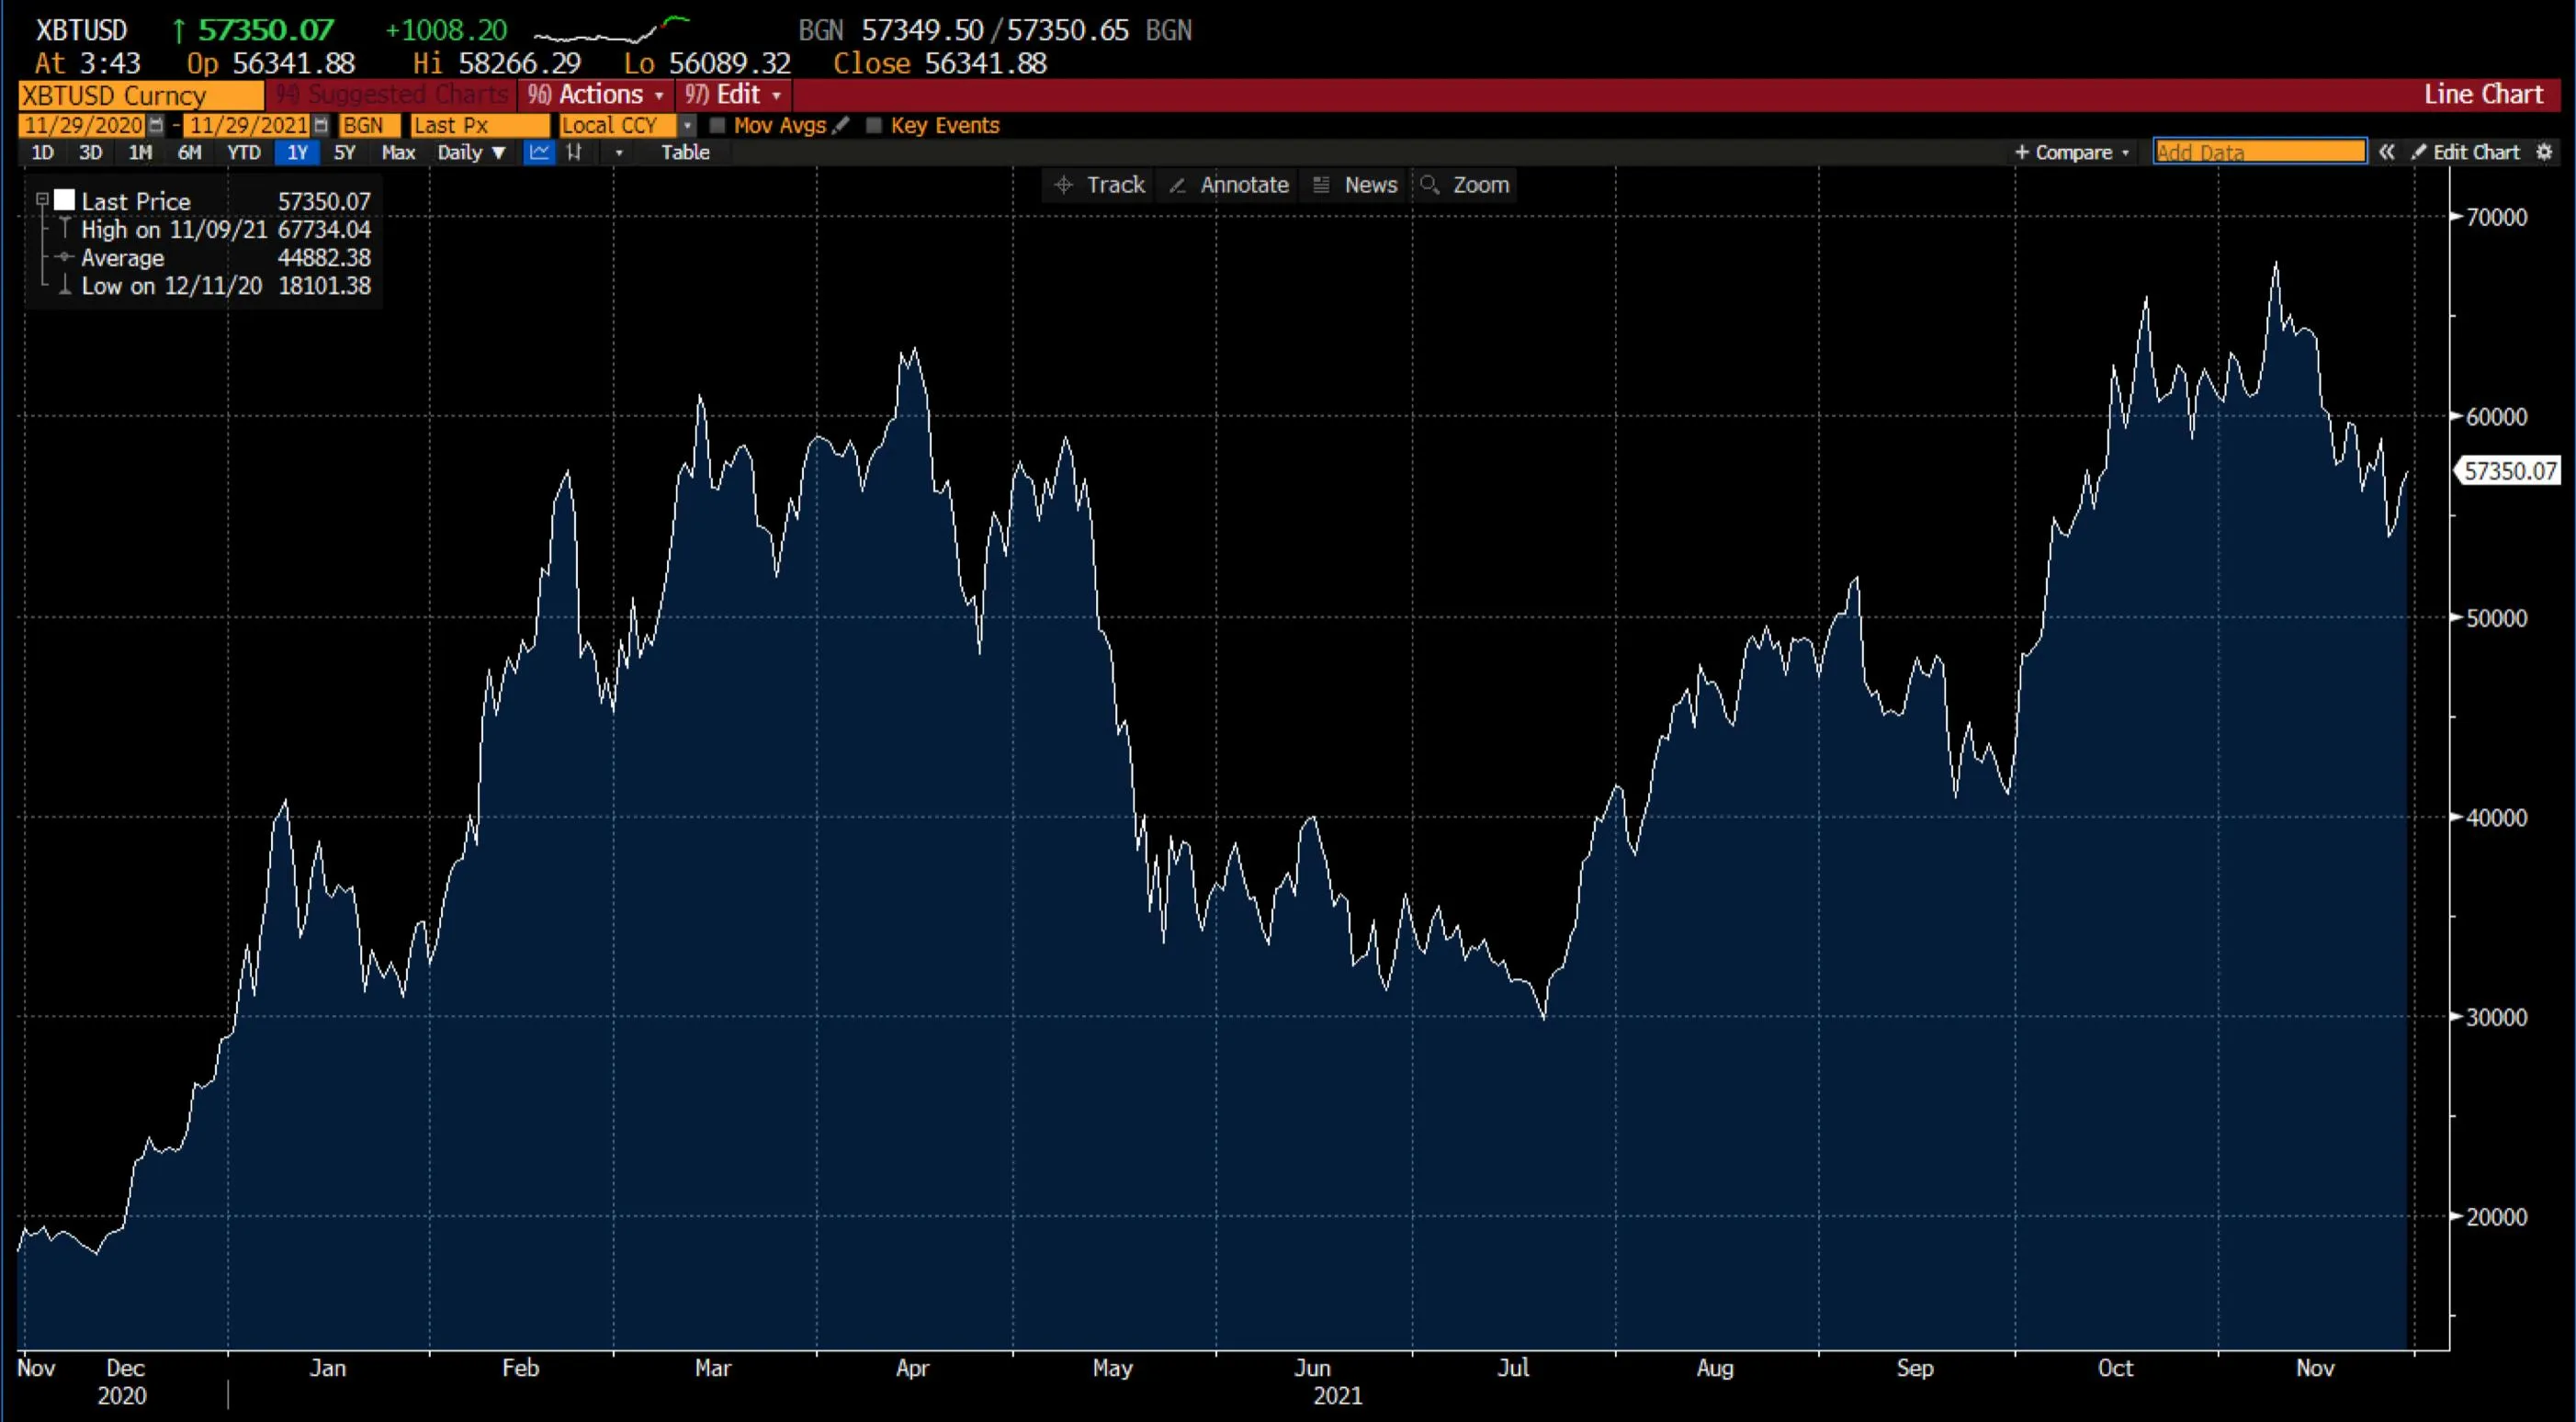
China’s renewed pressure on crypto, the new U.S. tax-reporting provisions, and India’s idea of possibly allowing trading only on pre-approved virtual currencies contributed to Bitcoin falling below the $56,000 mark on Friday, 19 Nov 2021. However, since then, the global cryptocurrency capitalization surged marginally by 0.55% to $2.63 trillion. Bitcoin and Ethereum showed small signs of green, while Solana, Polkadot and Dogecoin fell slightly.
As per market reports, Bitcoin lost almost 20% in less than 15 days. On 21 Nov 2021, President Nayib Bukele of El Salvador announced plans of issuing a $1 billion U.S. “bitcoin bond,” a tokenized financial instrument developed by Blockstream, on the Liquid Network. El Salvador intends to issue the world’s first sovereign Bitcoin bonds and build Bitcoin City, which will supposedly be free of income, property and capital gains taxes.
Ethereum’s network continues to suffer from congestion despite a drop in Ethereum transaction fees. MATIC Network is addressing congestion by offering its new scaling solution, Miden. Following the activity on the Polygon network, it has hit a high. In the past week, it generated $6,10,000 in revenue, with transactions on MATIC exceeding those on ETH by over four times. As per the charts, BTC/USD is currently near the $58,000 mark. The next support level is at 61.2% retracement, near $53,500, followed by 50% retracement at $49,000. On the upside, BTC/USD resistance is near $60,000 at 78.6% retracement levels.
Trade cryptocurrency options on Deriv Trader and CFDs on Deriv MT5 Financial and Financial STP accounts.

Weekly market report – 25 Oct 2021
It was another bullish week for gold. Since the US Dollar Index recovered more than 2% over the past two weeks, gold has risen above the $1,800 level.
XAU/USD — Gold
It was another bullish week for gold. Since the US Dollar Index recovered more than 2% over the past two weeks, gold has risen above the $1,800 level. The price of gold is currently trading just above its weekly 50 EMA level of $1,802. Any sustained move above the same could trigger it to move towards its previous resistance zone between $1,830 - $1,833. On the downside, $1,780 will be the first support, followed by $1,760 as major support.
Trade Gold options on Deriv Trader and CFDs on Deriv MT5 Financial account.
EUR/USD
The EUR/USD pair started the week with a bullish move but failed to maintain its momentum by the week's end. Even the weak US dollar index was not enough to drive EUR/USD higher. The European Central Bank policy announcements on Thursday, 28 October 2021, might shed some light on the EUR/USD trend. Technically, it has support close to 1.1580, followed by major support close to 1.1530, while an uptrend above the previous weeks' high of 1.1670 could push the price to 1.18 levels.
Trade EUR/USD options on Deriv Trader and CFDs on Deriv MT5 Financial and Financial STP accounts.
US Tech — Nasdaq
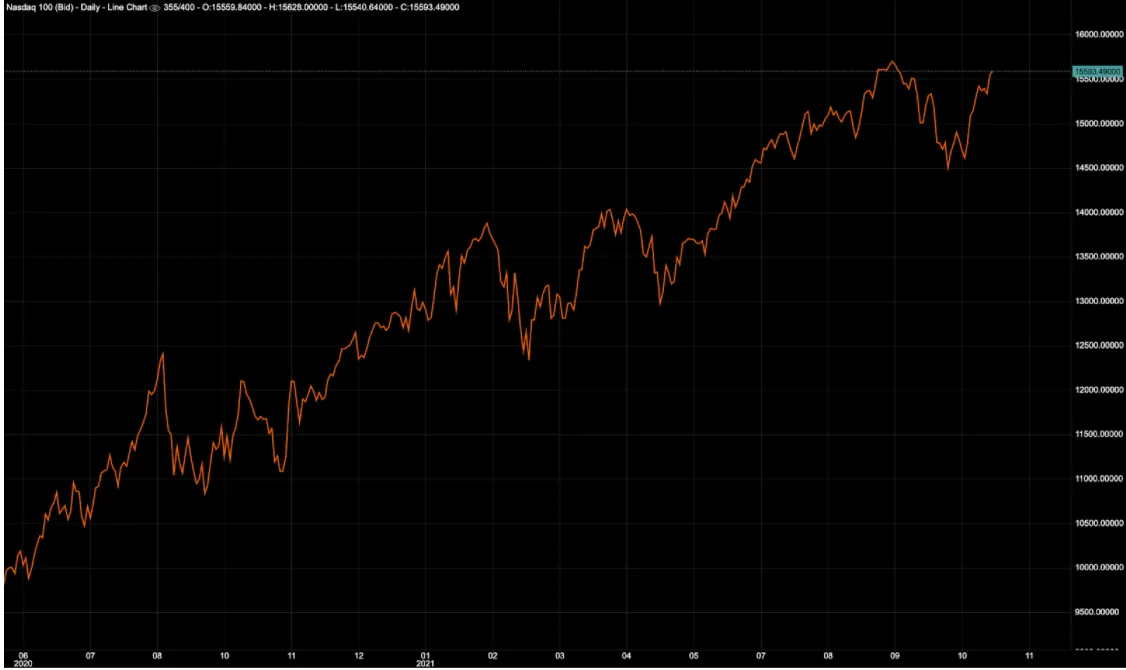
The US Tech Index recovered nearly all of last month's losses, and it appears as any pullback will be short-lived. The price is just beneath its September month high, which was around $15,700. It will open the next extended uptrend if it maintains its move above its previous month's high. The next major level to watch will be $16,000, while the previous swing low $14,386 will be a key support level.
Trade US Tech Index options on Deriv Trader and CFDs on Deriv MT5 Financial accounts.

Weekend trading on Deriv
There’s a common misconception that you cannot trade over the weekend because most financial markets are closed. The truth is, there are still markets that you can trade on Saturdays and Sundays.
There’s a common misconception that you cannot trade over the weekend because most financial markets are closed. The truth is, there are still markets that you can trade on Saturdays and Sundays.
With the interest in trading growing exponentially by the minute due to easier access to financial markets, more traders are looking for ways to continue trading every day, even on weekends. To meet this demand, more brokers now offer weekend trading.
Why trade on the weekend
For seasoned traders, trading on the weekend provides more time to refine their trading strategies, allowing them to take advantage of more market movements. If you’re a beginner and want to find out if it’s right for you, here are the 3 reasons to consider.
1. More time to trade
Weekends give you more trading time and more opportunities to take advantage of price movements. In contrast to weekdays, you have fewer distractions, allowing you to think through your trades and limit the risk of making hasty decisions just because you want to seize trading opportunities.
2. More flexibility to trade at your convenience
For some, trading on weekdays is nearly impossible. With busy schedules and commitments throughout the week, the weekend is the best option as it offers flexibility — you enjoy the freedom to choose the hours that best fit your schedule.
3. Keep your trades open
Trades you make during the week will still be able to run through the weekend even if the market is closed. Your trading conditions, such as stop loss and take profit, will remain in place but will not be triggered for the markets that are closed. If you need to close a trade manually, you can do so whenever you want. But, if you’re confident about your trades, maintaining your position over the weekend can provide you with additional potential gains.
How the weekend can help you improve your trading
The weekends offer the perfect time to go over how your trades performed. You have the leeway to review your trading journal, evaluate market conditions with more focus, and examine the changes you need to implement in your strategies if they are not working in your favour.
Financial markets behave differently throughout the week, so if you'd like to perform an in-depth technical or fundamental analysis for your trades, the weekend provides you the leniency to do so.
It's also a good time to evaluate whether you've let your emotions influence your trading decisions. Have you held on to your trades too long? Did you overestimate your trading ability? If so, the weekends give you the chance to contemplate how you've been trading and make necessary adjustments.
Markets to trade during the weekend
There are two markets that never sleep which you can trade on Deriv — synthetic indices and cryptocurrencies.
Synthetic indices
Synthetic indices are unique indices that mimic real-world markets but are not affected by global events or market and liquidity risks. They are backed by a cryptographically secure random number generator and offer different levels of volatility depending on the trading conditions you prefer. You can choose from Volatility indices, Crash/Boom, Jump indices, Step indices, to Range break indices.
You can trade synthetic indices on Deriv MT5 and Deriv X (with CFDs), Deriv Trader (with options and multipliers for as low as 0.35 USD), Deriv Bot (with options) and Deriv GO (with multipliers).
Cryptocurrencies
Cryptocurrencies are digital currencies that are decentralised, meaning they are neither issued nor backed by an authority such as a central bank or government. Due to the high volatility of cryptocurrency markets, they are favoured by traders who like more risk in their trades.
On Deriv, you can trade the world's most popular cryptocurrencies, with over 17 crypto pairs available. You can trade them on Deriv MT5 and Deriv X (with CFDs), Deriv GO (with multipliers), and DTrader (with multipliers).
If you are not familiar with these markets, you can practice your trading skills first. Start with a free demo account, which comes pre-loaded with 10,000 USD of virtual money that you can use and top up when it runs out. Once you feel comfortable with your trading, you can easily switch to a real account.
Find out more about how synthetic indices and cryptocurrencies work with our “An introduction to synthetic indices trading” and “What is cryptocurrency?” blogs.

What is leverage in online trading
Leverage is one of the many terms you’ll hear floating around in the online trading world. However, not everyone understands what it means. So in this blog, we'll talk about what leverage is, how it works, and what markets you can trade with it.
Leverage is one of the many terms you’ll hear floating around in the online trading world. However, not everyone understands what it means. So in this blog, we'll talk about what leverage is, how it works, and what markets you can trade with it.
What is leverage
Leverage is a crucial aspect of CFD trading. It refers to using borrowed funds to increase your trading position beyond what your cash balance allows.
Many traders take advantage of leverage to improve their strategies and maximise their potential gains. But, there's a catch to leverage: it can also result in larger losses than expected if it's not used strategically. That's why before applying it to your trades, make sure you've carefully analysed the markets and are sufficiently confident it will benefit you.
How it works
Essentially, leverage lets you open larger positions for a fraction of the trade’s value. For example, if you want to open a CFD of asset X that costs 1,000 USD, even if you only have 10 USD, you can do so with leverage of 1:100.
The higher the leverage, the lower the capital you need to open a trade. This in turn boosts the purchasing power of your capital, allowing you to take advantage of small price changes and to expand your market exposure.
Margin refers to the deposit required to open a leveraged position, taking into account spreads, leveraging, and currency conversions. You use a margin calculator to determine how much margin you need to increase the market value of your position.
For example, if asset X has a price of 100 USD and the leverage is 1:100, then the required margin to open 1 CFD of X will only be 1 USD.
Let’s say you’d like to open a position of 100 CFDs (or 100 lots) of X with a buy order (you expect that the prices of asset X will increase), here are the possible outcomes of the trade opened with leverage:
- If the price of X increases to 105 USD, you make a profit of 5 USD per CFD.Since you bought 100 CFDs, this gives you a total profit of 500 USD (100 CFDs ✕ 5 USD = 500 USD).
- If the price of X decreases to 95 USD, your total loss is 500 USD.
Based on these outcomes, leverage can increase profits, but it can also increase losses.
How to manage risk in leveraged trading
Leveraged trading involves high risks, so it’s smart to use standard risk management features on trading platforms such as stop loss and take profit. Stop loss and take profit orders will help limit the potential loss you may incur or secure the profit you make.
When you place a stop loss order, you specify the exact price at which your position will automatically close at a loss. It lets you specify how much you want to risk, allowing you to limit your losses before they grow larger than expected.
Whereas when you place a take profit order, you specify the exact price at which your position will automatically close. This allows you to secure your target profit before the market moves against your favour.
Markets to trade with leverage on Deriv
The markets you can trade with leverage on Deriv are forex, stocks and stock indices, cryptocurrency, commodities, and derived indices. Each of these markets operates differently so it’s important to be careful when trading them with leverage. You can trade them on Deriv MT5 and Deriv X.
Forex
Get access to over 50 popular currency pairs and trade with leverage of up to 1:1000 (max 1:30 for EU/AU) to maximise your market exposure.
Stocks and indices
Take advantage of competitively priced equities and asset baskets — from your favourite household brands to international indices — available to trade with leverage of up to 1:50 on stocks and up to 1:100 on indices (max 1:5 on stocks and 1:20 on indices for EU/AU) outside regular stock market trading hours.
Derived indices
Derived indices consist of synthetics, basket indices, and derived FX. Trade synthetics round the clock with leverage of up to 1:1000 (max 1:30 for EU). These indices simulate real-world market movements, offer constant volatility, and are free of liquidity risks.
Commodities
Predict the price movements of commodities such as silver, gold, and oil and benefit from leverage of up to 1:500 (max 1:20 for EU/AU) to boost your potential gains.
Cryptocurrency
Trade the world's most popular cryptocurrencies with over 17 crypto pairs to choose from. Benefit from this highly liquid market with leverage of up to 1:100 (max 1:2 for EU/AU).
In summary
Many see leverage as a double-edged sword but once you learn how to manage it, there's no need to fear it. If you’re a beginner, a smart way to work your way around it is by starting small no matter how tempting the leverage ratio is. It's never a good idea to head straight for large amounts, as doing so may completely impact your trades.
Want to practice trading with leverage? Sign up for a free demo account that’s pre-loaded with 10,000 USD virtual money.

Why trade gold
Curious about gold trading? Discover what influences its value and more in our blog. Get the inside scoop with Deriv.
Gold has been used as a form of payment since early civilisations, making it one of the oldest currencies in the world. It has been recognised for centuries as a store of value, meaning it can hold its worth over a long period of time and doesn’t depreciate. It’s one of the reasons why many regard it as a sign of wealth.
Trading in gold is the buying and selling of gold in the form of physical gold or gold derivatives. This metal is highly malleable and doesn't degrade, which is why it's considered precious, making it one of the most widely traded raw materials globally today. Due to its popularity and high value, the price of gold in commodity markets fluctuates more than others. Many online traders see these price movements as great trading opportunities to acquire more potential gains.
In this blog, we’ll go over what gold trading is, what influences its price, and how to trade it online alongside other assets.
What is gold trading?
Gold trading refers to speculating on gold's price to make a potential profit, and there are several ways you can do this online. On Deriv, gold traders use CFDs and options.
Gold CFDs and options allow you to predict the metal’s price movements without owning or buying it. These trade types give you more flexibility since you don't have to adhere to the typical buy low, sell high approach, letting you potentially profit from rising and falling markets. Regardless of your position, your goal is to predict the market's future direction correctly.
With CFDs, you can go long or short and keep your trade open as long as you want if you have sufficient capital to maintain it. The more the market moves in your favour throughout your trade, the greater your potential gains. However, the more it moves against you, the more losses you'll incur.
Whereas with options, you predict price movements within a set timeframe. Plus, you know beforehand how much your potential payout is and your loss is limited to your stake.
Factors affecting gold prices
As with any other asset, gold's price is influenced by both supply and demand.If there is too much supply in the market and not enough demand, gold prices decline. However, gold prices rise if the demand is strong and the supply is low.
A number of factors influence gold's supply and demand, resulting in significant price fluctuations. Here are 3 of them.
Value of the US dollar
Gold is a dollar-denominated metal, meaning its price is pegged to the value of the US dollar, often referenced as XAUUSD in trading. XAUUSD is a trading symbol used in financial markets to represent the exchange rate between gold (XAU) and the United States Dollar (USD). It essentially indicates how many US dollars are needed to purchase one ounce of gold. Traders and investors use this symbol to speculate on the price movements of gold in relation to the US dollar.
This influence dramatically impacts gold's price. Whenever the value of the dollar drops, people turn to other investments to preserve their wealth, and gold is seen as the best option due to its intrinsic value. Additionally, a declining dollar increases the purchasing power of other currencies, potentially boosting demand for gold and causing its price to rise.
Rising inflation
Inflation occurs when a particular currency's purchasing power weakens. As a result, people seek safe-haven assets. A safe-haven asset is an investment expected to retain or increase in value during market volatility.
Gold is generally considered a safe-haven asset. Although it's more volatile than other assets in the commodity market, its volatility is still very low compared to other markets. That's why many use it to hedge against inflation to reduce their exposure to losses.
Scarcity in production
Mining and recycling are the two significant sources of gold production. However, it's expected to deplete over time due to the finite nature of gold and the fact that most of the world's gold reserves have already been mined.
To meet the demand, what's currently on the market is being recycled, and more companies are exploring advanced mining technologies to locate gold deposits. However, any new discovery will spike gold's price in the short term since everyone wants to get their hands on it. Following the law of supply and demand, if the supply cannot keep up with the demand, its price will continue to rise.
Platforms to trade gold on Deriv
Trading gold is available on a number of platforms on Deriv.
You can trade gold with CFDs on Deriv MT5 and Deriv X. Deriv MT5 is Deriv's version of the popular CFD trading platform that is equipped with trading tools and plugins, including analytical objects, technical indicators, and more. Since Deriv X is a customisable trading platform that allows you to personalise your workspace, it is packed with advanced features and designed to fit your trading style.
When it comes to trading gold with options, you can choose Deriv Trader and Deriv Bot. Deriv Trader offers flexible trade durations, and you can open positions with stakes as low as 0.50 USD. Now, if it’s automated trading you prefer, Deriv Bot is the trading platform to use, as it allows you to build your trading bot in 5 steps without any coding skills needed.
Practice trading gold risk-free! Sign up for a free demo account that’s preloaded with 10,000 USD virtual money and available for any of the platforms mentioned above. As soon as you feel confident about your trades, you can switch to a real account right away.

Weekly market report – 29 Nov 2021
Stocks ended the week on Friday, 26 Nov 2021, facing its worst day of the year. All 3 major indices dropped sharply in the half-day session as a new Covid variant, recently named Omicron, was discovered in South Africa triggered a global shift away from risk assets.
US Indices
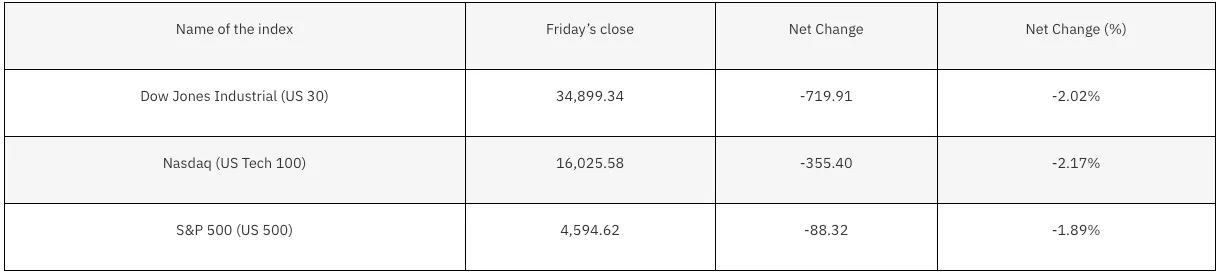
Stocks ended the week on Friday, 26 Nov 2021, facing its worst day of the year. All 3 major indices dropped sharply in the half-day session as a new Covid variant, recently named Omicron, was discovered in South Africa triggered a global shift away from risk assets.
The World Health Organisation officials announced that further investigations of the new strain are needed. But fears of it showing resistance to current vaccines sent shock waves through the financial markets.
Concurrent market highs at the start of November seem far-off following Friday's market shift. Bond prices lifted as yields tumbled amidst a flight to safety. The benchmark U.S. Treasury note lost 15 basis points to close at 1.48%. This marked a sharp reversal from the 1.68% level that was hit earlier in the week.
Travel stocks were hit the hardest. Delta Air lines and American Airlines were down 7.08% and 7.12%, respectively, and Boeing Co took a nose-dive to end the week 11.45% lower. Bank shares also pulled back, along with industrials linked to the global economy.
This week's winners were those whom investors huddled into during the sell-off, namely vaccine makers. Pfizer was up 4.29%, whilst Moderna shares skyrocketed above 20%. Corporations that support stay-at-home workers also benefited, with Zoom and Netflix each gaining more than 5%.
In the coming weeks, all eyes will be on the new vaccine developments. Investors are banking on a quick containment of the new strain for global markets to calm. Jerome Powell, newly re-elected Chair of the Federal Reserve, is also expected to make a statement on future monetary policies this week. As inflationary pressures remain a threat, market watchers will be watching for any reactive changes in monetary policy.
Trade US indices options on Deriv Trader and CFDs on Deriv MT5 Financial and Financial STP accounts.
Forex

The data for EUR/USD has been relatively mixed. The Manufacturing Purchasing Managers Index (PMI) in the EU for November was better than expected, signalling an increase in inflation during the month. In the US, the Core Personal Consumption Expenditure (PCE) Price Index was also better than expected on a yearly basis. The minutes from the FOMC meeting show that the Fed members are concerned about the rise in inflation and are willing to tighten the policy sooner if needed, whereas the ECB is in no rush to change its monetary policy as of now.
In addition, the new COVID-19 variant caused a downturn in market sentiments and reignited the COVID-19 fear. This week the EU will bring in updates on the Consumer Price Index, whereas in the US, the main updates would be on the Central Banks Consumer Confidence, Non-Farm Payroll, and ADP Non-Farm Employment Change. EUR/USD ended at the $1.13 mark, and its next support level at the 38.2% retracement level is near $1.123. The resistance for EUR/USD at the 50% retracement level is near $1.14.
GBP/USD stayed on the lower end last week despite better than forecasted Purchasing Managers Index readings. The Bank of England previously decided to hike the interest rates in December by 15 basis points but this decision may be scaled back after the new coronavirus variant was detected.
The US dollar, on the other hand, was boosted based on the hawkish Fed comments and the renomination of Jerome Powell as the Fed Chairman. This week will feature the Purchasing Managers Index readings for the GBP, ADP Non-Farm Employment Change and Non-Farm Payroll for the USD. The pair ended at $1.33, and its next support level is the 61.8% retracement level near $1.31, followed by a 50% retracement level near $1.28. Resistance is seen at 78.6% retracement levels near $1.37.
The Japanese yen jumped against major currency pairs on Friday, 26 Nov 2021, as investors sought out safe-haven assets after getting spooked by news of a new COVID-19 variant detected that may be able to evade immune responses and counter vaccine effects.
Trade forex options on Deriv Trader and CFDs on Deriv MT5 Financial and Financial STP accounts.
Commodities
Gold continued to struggle against the U.S. dollar last week. The reason behind the downfall was mainly due to the surge in the Treasury yields. The renomination of Jerome Powell as the Fed chair was also a factor, strengthening the view that the interest rates are going to hike up by June 2022.
The recently detected COVID variant led global equities to suffer heavy losses, and the 10-year Treasury yield to fall below 1.50% at the end of the week leading to XAU/USD finishing near $1,788.85. The support level at the 23.6% retracement level is near $1,772.55. The resistance for XAU/USD at the 38.2% retracement level is near $1,829.00 followed by a 50% retracement level near $1,875.50.
Oil fell by around 13.50% last week due to the fear of coronavirus and its possible effect on the demand for fuel and travel outcomes. China, India, Japan, South Korea, the U.K. and the U.S. are agreeing to release barrels of crude oil to help cool down the price. OPEC is set to meet this week, and these demand concerns could cause them to delay or halt their planned increase in the supply of oil. Oil is currently trading at the $68 mark, just above its support level at the 78.6% retracement level near $66. The next support level at the 61.8% retracement level is near $52, whereas the resistance level at the 127.2% retracement level is near $107.
Trade commodities options on Deriv Trader and CFDs on Deriv MT5 Financial account.
Cryptocurrency
The new variant of coronavirus is roiling global markets, with its impact not sparing cryptocurrencies. Bitcoin wasn’t exempt from the carnage despite being seen by crypto enthusiasts as a hedge against market turmoil.
The world’s largest cryptocurrency was down more than 20% from an all-time high of nearly $69,000, which hit earlier this month. Ether, the second-largest crypto, fell more than 10%, while XRP slumped by 9.9%.
On the technical side, Bitcoin remains above its major first support level of $53,500 at the 61.8% retracement level. The second support level sits at the $48,700 level at 50% retracement. On the upwards side, resistance is found at $60,300 for a medium-long term outlook.
Market watchers remain divided on whether Bitcoin has lost its steam off the back of recent record highs in early November. Believers in cryptocurrency, however, are not phased by Bitcoin’s bearish momentum. Optimistic Bitcoin bulls claim the dip to be a temporary shock that serves as the perfect opportunity to buy.
Trade cryptocurrency options on Deriv Trader and CFDs on Deriv MT5 Financial and Financial STP accounts.

What is technical analysis in trading?
The key factor that determines a trader's success is their ability to predict the price movement of an asset correctly. However, it's not about guessing – you can analyse the market and make informed decisions in trading, which ultimately increases your chances of potential profit.
The key factor that determines a trader's success is their ability to predict the price movement of an asset correctly. However, it's not about guessing – you can analyse the market and make informed decisions in trading, which ultimately increases your chances of potential profit.
There are 2 types of market analysis that you can apply to any financial market: technical and fundamental. Experienced traders usually combine both types of analysis and use a combination of various instruments to increase their chances of a correct prediction. In this blog post, we'll focus on technical analysis, and in the Fundamental analysis for beginners blog, we'll cover how fundamental analysis works.
What is technical analysis?
Technical analysis is purely based on analysing the past price movements. It is not affected by political and economic events in any way. Its ultimate goal is to identify patterns, predict future market behaviour, and determine the right time to buy (or sell) an asset.
Technical analysis can be performed in 2 ways: by identifying chart patterns or using technical indicators, both of which we'll go through in this blog post.
In both cases, you'd need to understand how to read a price chart, so let's go through that first.
What are the price charts in technical analysis?
A price chart is a graphical representation of a price movement of an asset over a selected period of time.
Every chart has a horizontal axis that represents time and a vertical one that represents the price. This screenshot, for example, shows the price fluctuations of the Volatility 10 index from August to November 2021.
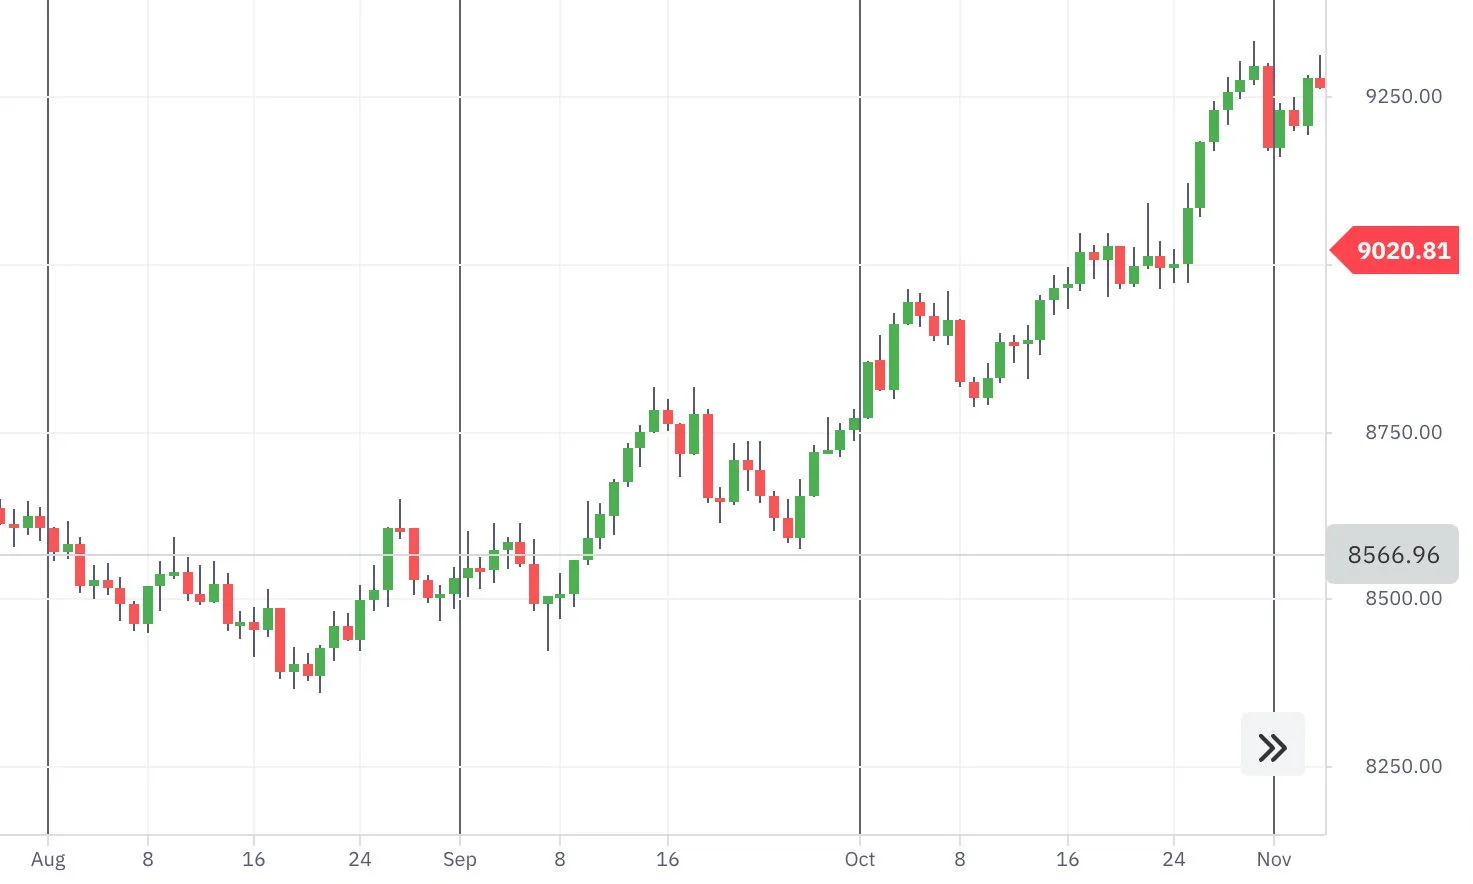
The price chart is essentially price movements in little units of time intervals. The time intervals can be set individually and typically depend on personal preference. Some traders prefer more detailed charts and set 1-tick or 5-minute intervals, while others prefer having a bigger picture and use hourly, daily or even weekly charts.
A tick chart, where 1 tick reflects 1 unit of price change, provides traders with the most detailed data, as it displays the price change every 1-2 seconds. This type of chart is mostly used in options trading and is available on DTrader and DBot.
Chart types
The 3 most commonly used chart types are:
- Candlestick chart
- Bar chart
- Line chart
Candlestick chart
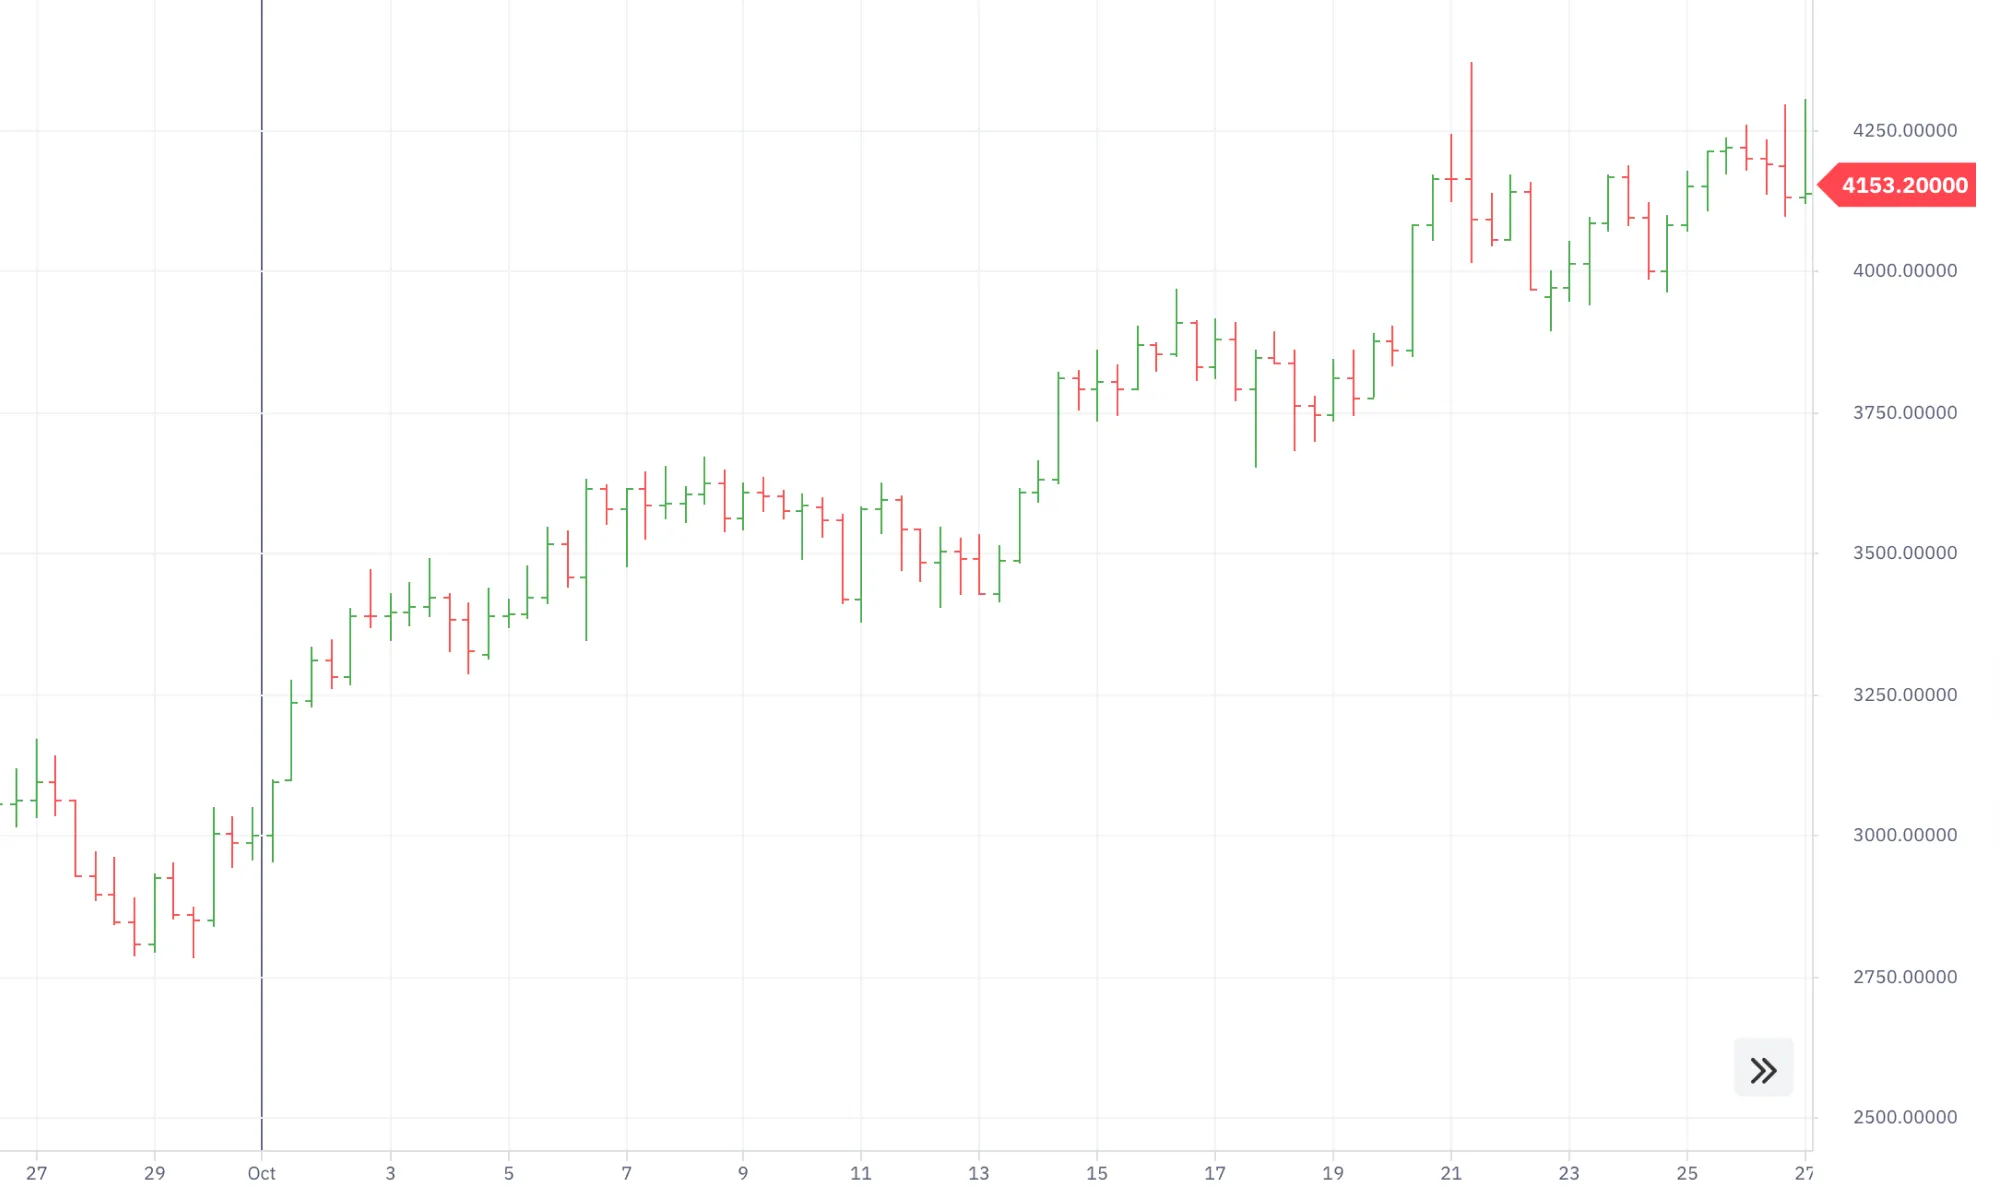
One of the most popular charts among traders is a candlestick chart. Below is a screenshot showing how it looks.
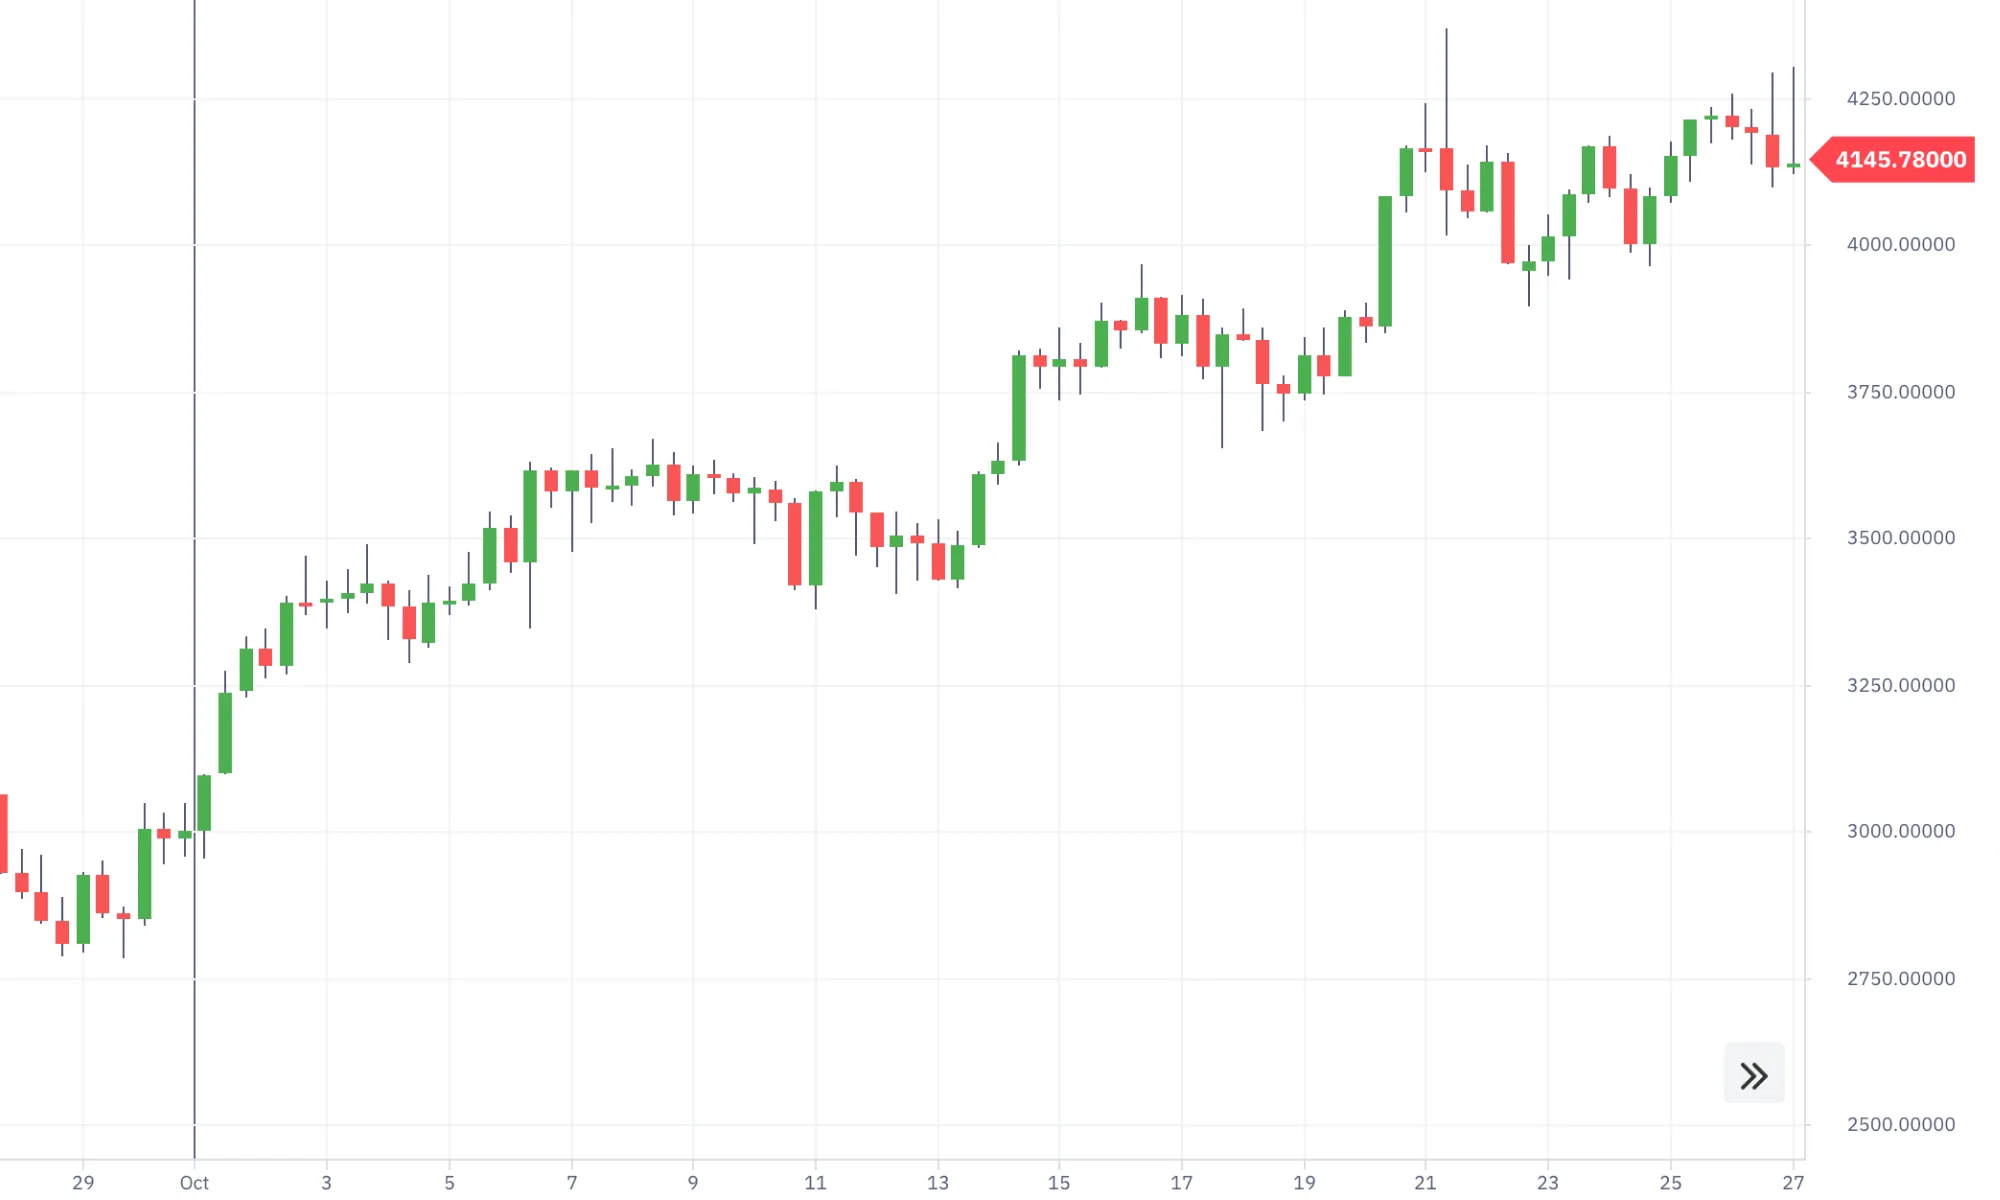
Each candlestick consists of a body and a wick that display the opening and closing prices of your selected time interval, as well as the highest and lowest prices reached within that time.
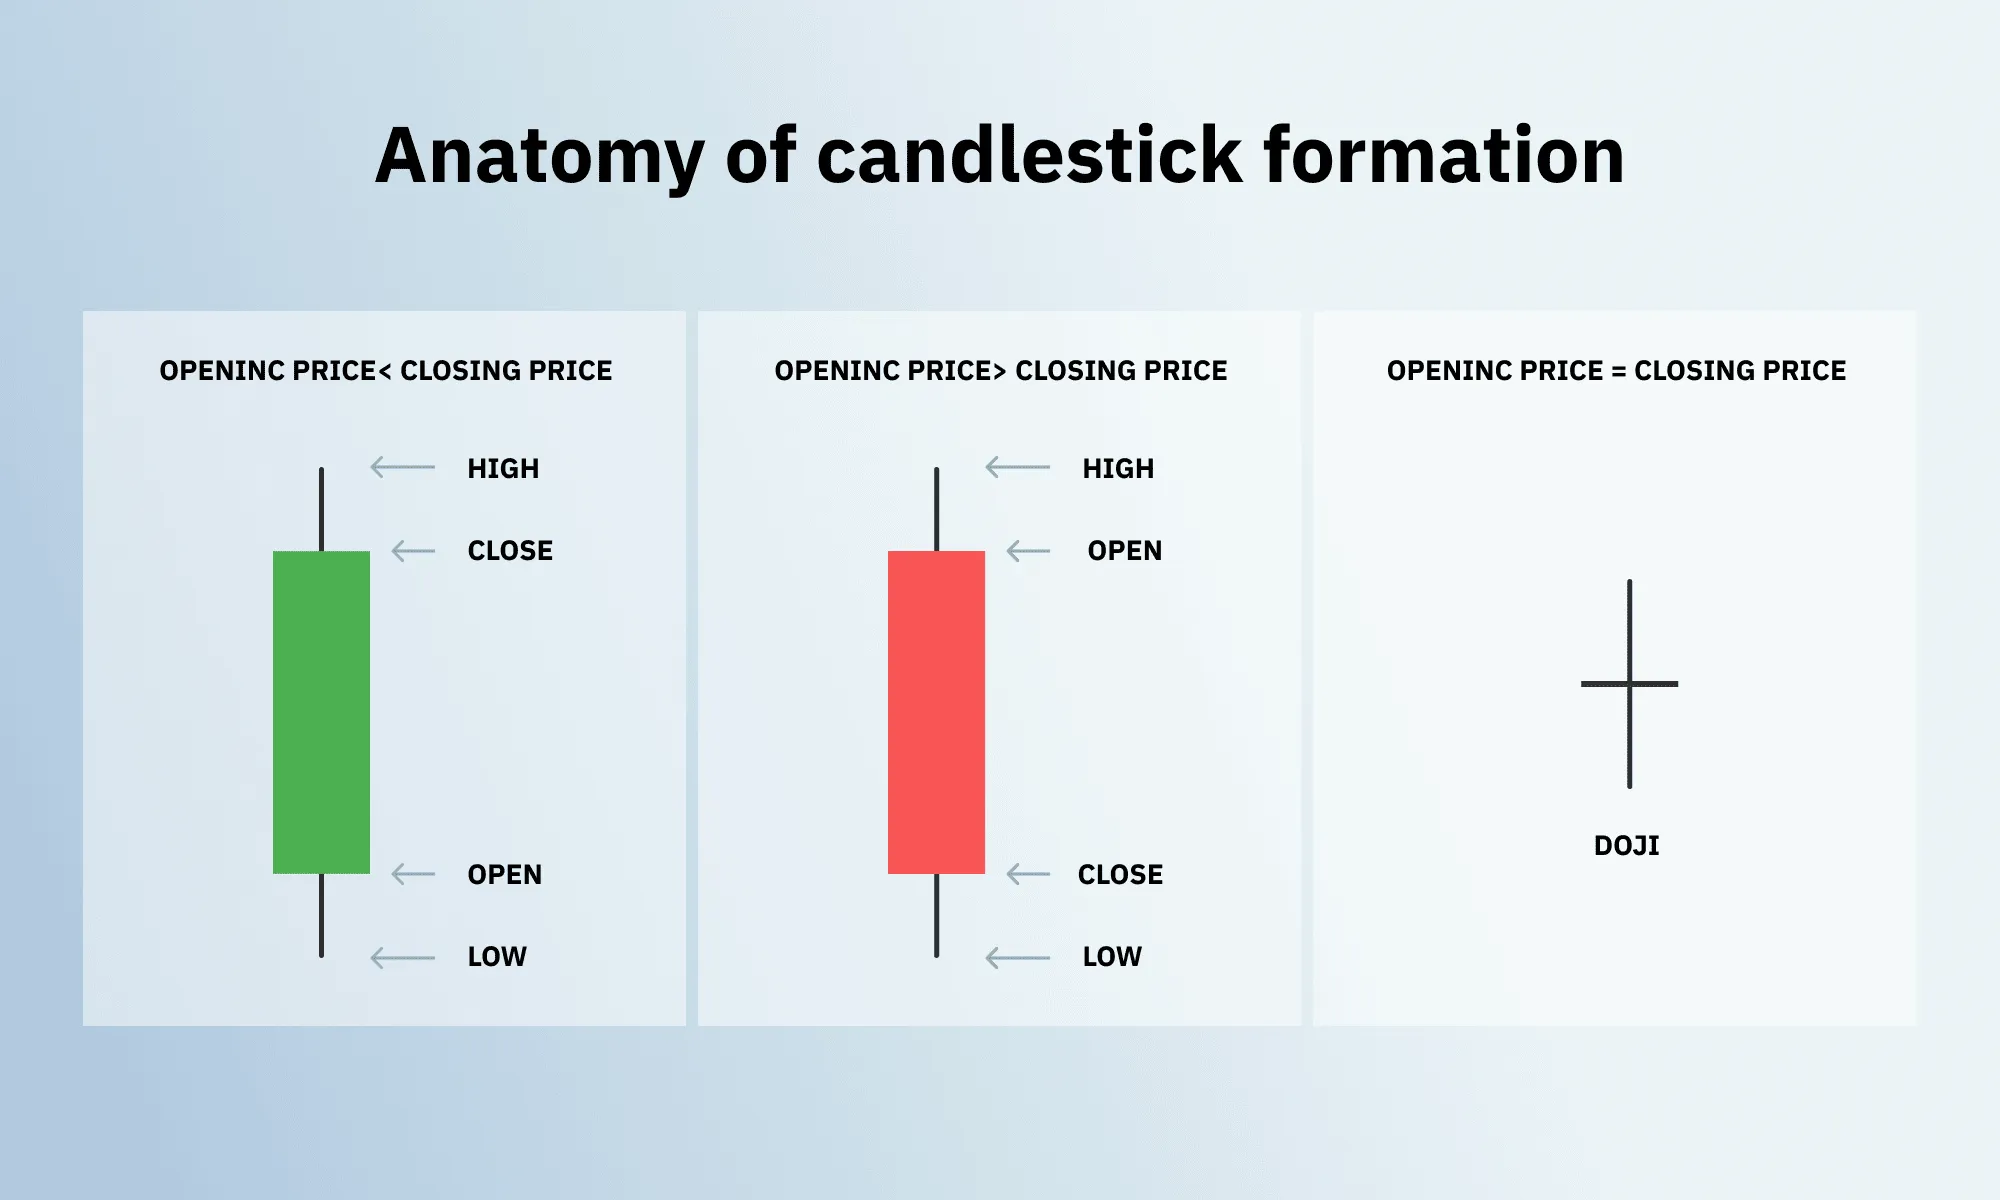
The body of the candlestick (the main square part) shows the opening and closing prices. If the body is red (black on some other platforms), it means that the closing price is lower than the opening price, with the opening price at the top of it. And if the body is green, the closing price is higher than the opening, with the opening price at the bottom.
The candlestick's wick (the lines at the top and/or bottom of the body) reflects the highest trading price reached within the set time interval at the top and the lowest at the bottom.
Let's say you choose to view your chart with 1-minute candlesticks. Each candlestick will reflect the asset's opening and closing prices (the body) of each minute, with the highest and lowest prices reached within the minute (the wick).
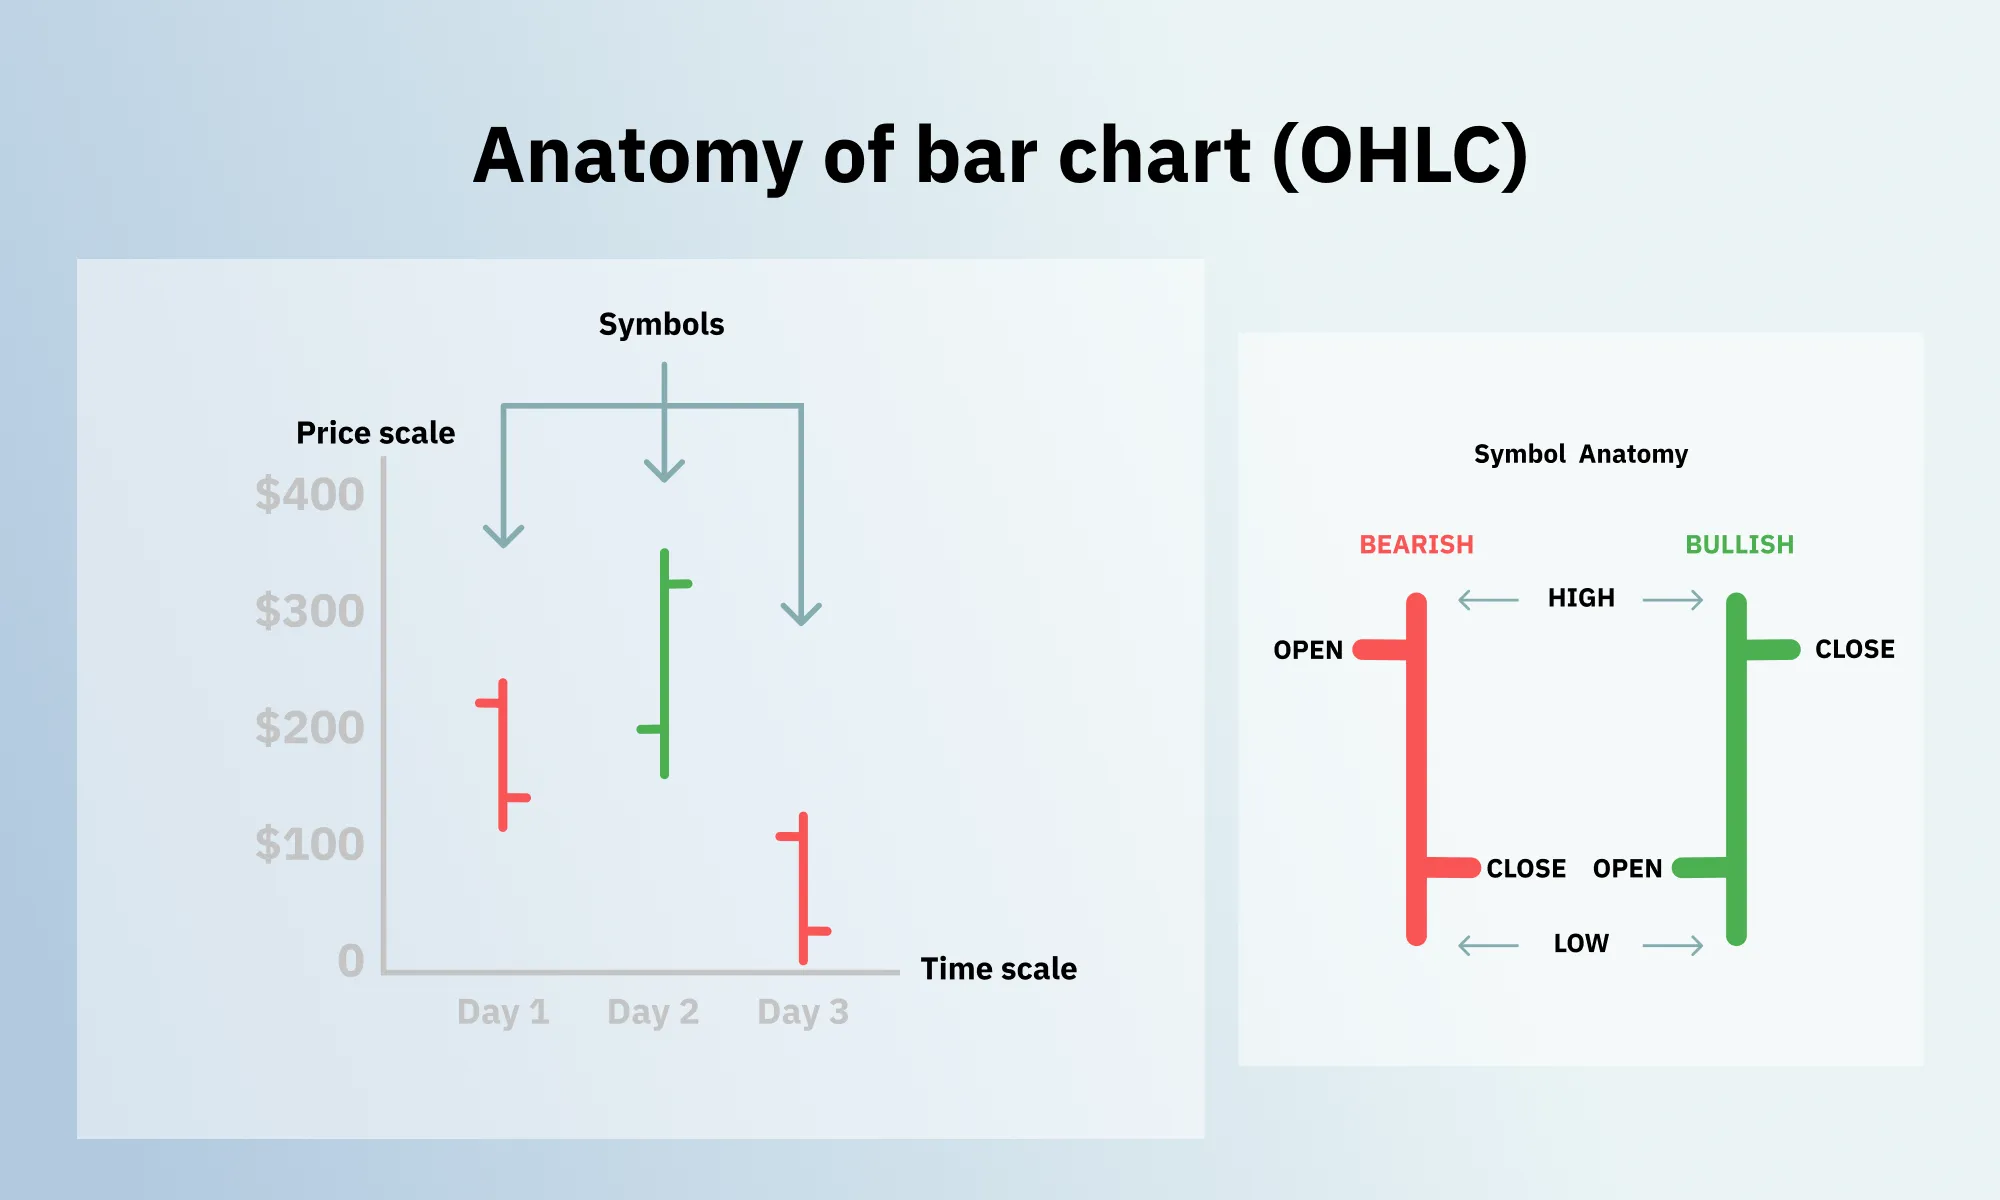
Bar chart
A bar chart, also referred to as OHLC chart, follows the same logic as a candlestick chart, but using bars instead of candlesticks. OHLC stands for the opening, the highest, the lowest, and the closing prices. Similar to candlesticks, the bars can be coloured (e.g. on DTrader) or just black (e.g. on Deriv MT5).
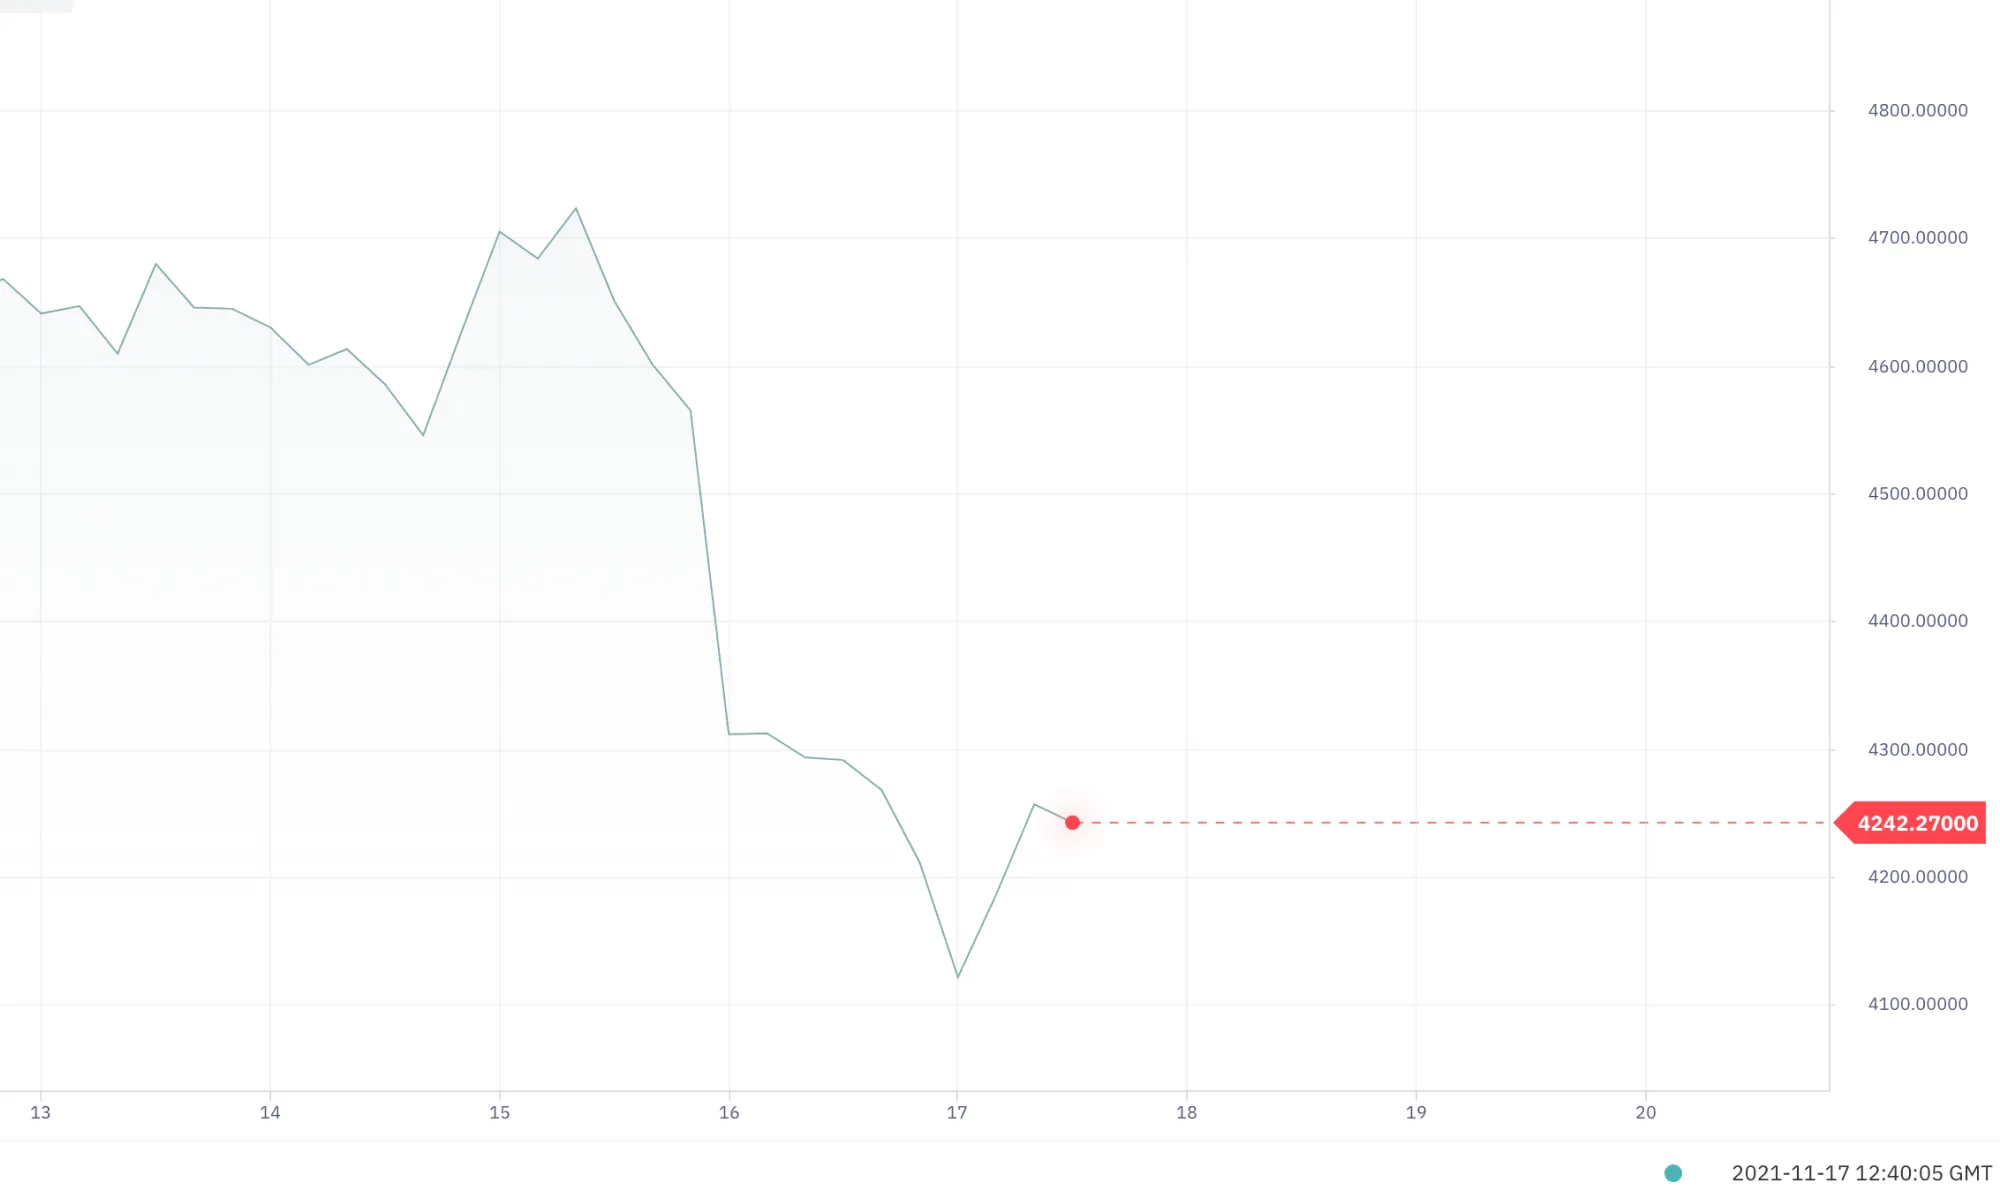
Line chart
A line chart displays only the closing price of an asset. While it provides less information, it also reduces the noise on the screen – which is great if you prefer your charts to look uncluttered. The line of the chart connects the closing prices of your selected time intervals (e.g. of every minute) which helps you clearly see movement trends. This type of chart is available on Deriv MT5.
A line chart can also be displayed as an area chart. In this case, the space between the horizontal axis and the line is filled with colour. This type of chart is available on DTrader.
Some time intervals, like ticks, are too short to provide enough data to form a candle or a bar; hence, they can only be displayed with the line chart.
Chart patterns and technical indicators
Chart patterns and technical indicators are the 2 different ways of evaluating the price charts and market behaviour.
A chart pattern is a shape (e.g. a triangle) that you can draw over your price chart with the help of various drawing tools, just like you would draw a line, connecting the dots on a piece of paper. Identifying these shapes in a chart helps to suggest where the price is going to move next.
A technical indicator is a tool that helps suggest future price movements with the help of complex mathematical calculations. These indicators are also placed over your charts, and they calculate the potential price movements automatically, using historical data.
When doing technical analysis, you don’t have to choose one way over the other. In fact, you can use both chart patterns and technical indicators simultaneously to have more data to analyse. Let’s head to the ‘Support and resistance in chart patterns’ blog to find out how it works.
Sorry, we couldn’t find any results matching .
Search tips:
- Check your spelling and try again
- Try another keyword