Results for

Weekly market report – 27 Sep 2021
Major currency pair EUR/USD ended the past week in negative territory for the third time in a row. Read more about the resistance zones and support areas in our market analysis report.
EUR/USD
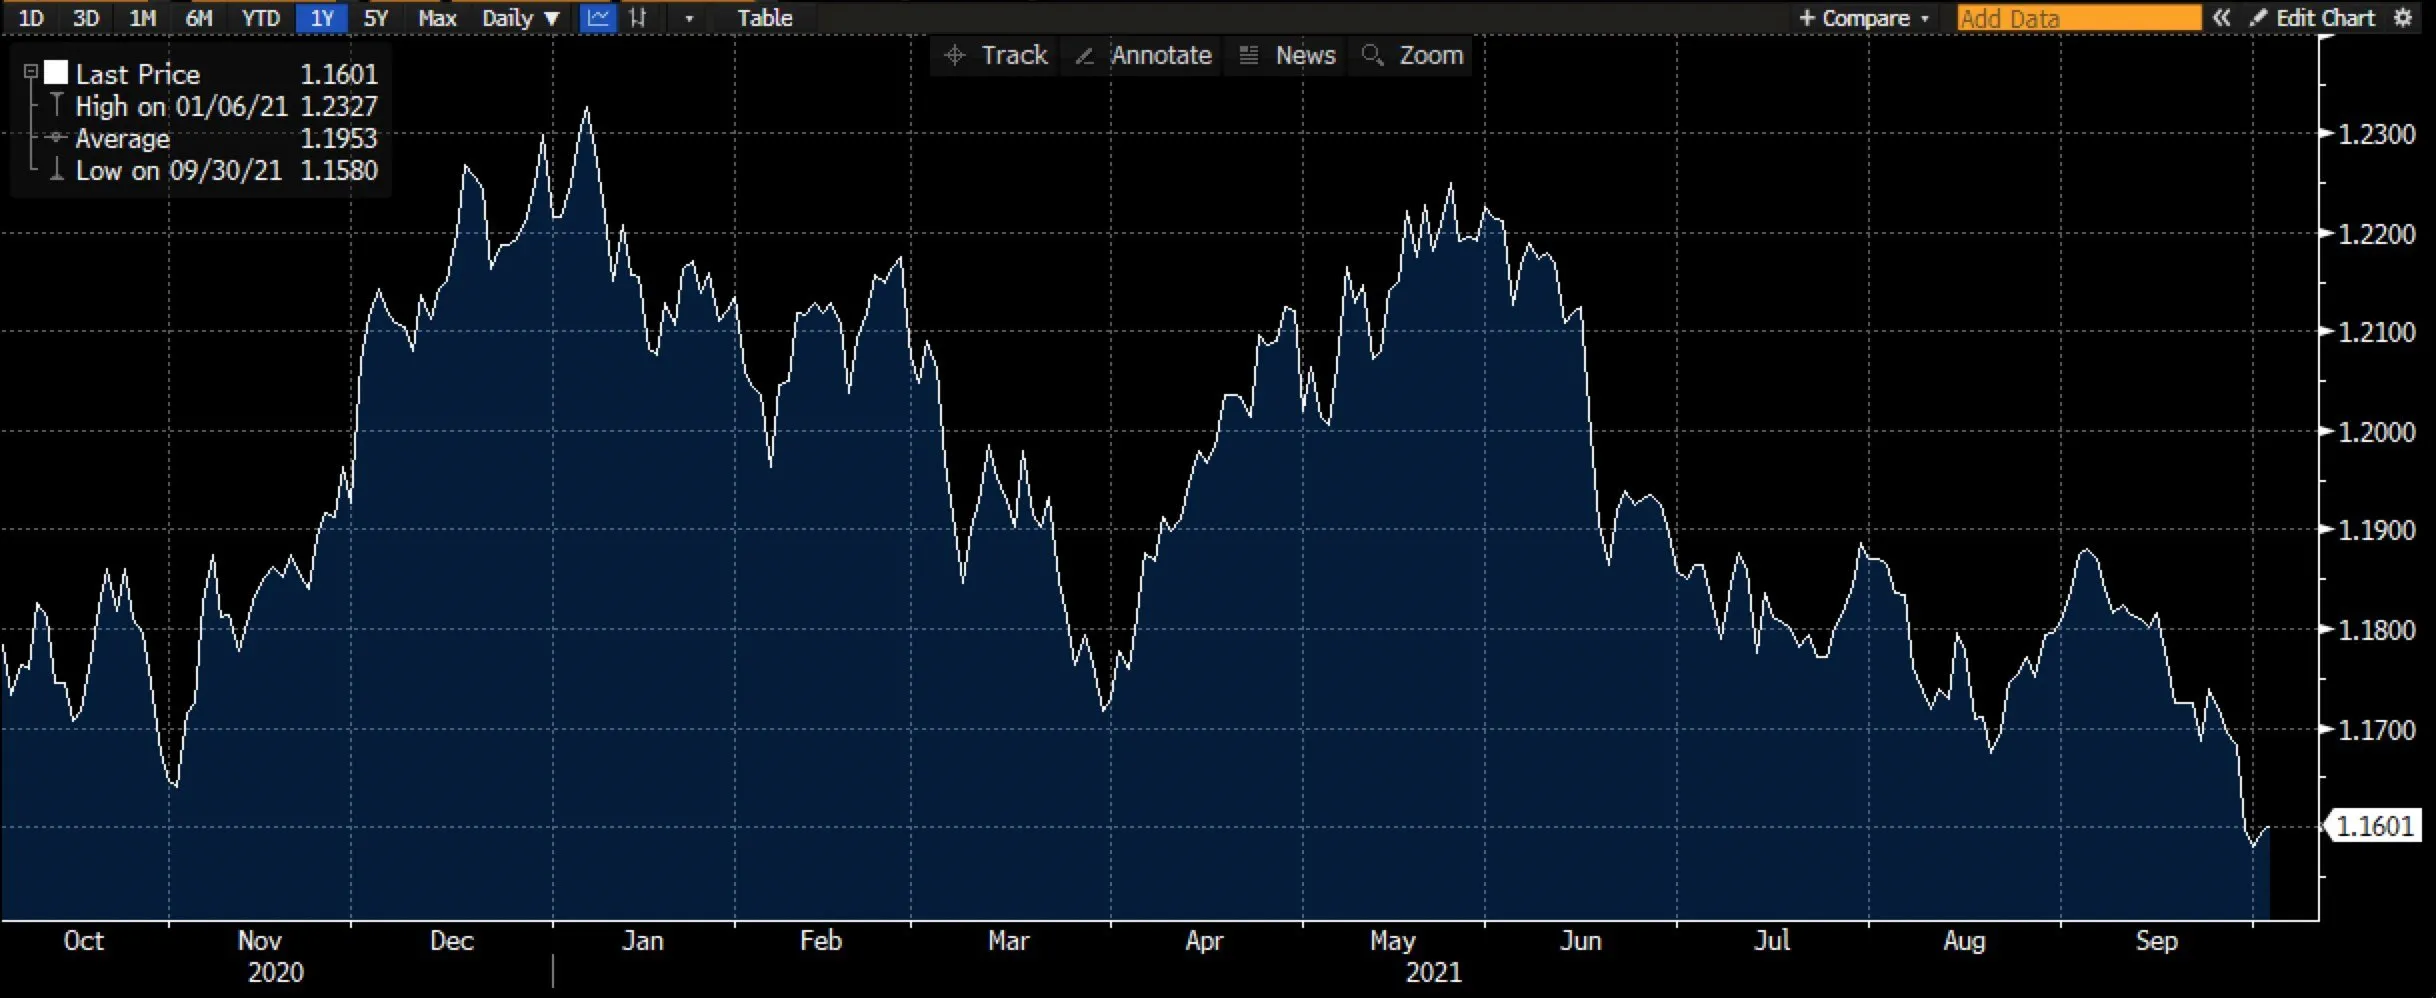
Major currency pair EUR/USD ended the past week in negative territory for the third time in a row. Weak German PMI data and hawkish Fed comments have put pressure on euro prices. On top of that, the market also reacted to the news of a Chinese property developer's potential downfall, which could disrupt the global market. EUR/USD is trading just near its yearly low of 1.1663. Based on this week's RSI, the index is trading at 42, indicating an upward trend, while the momentum indicator is trading below 0, indicating oversold conditions. For the coming week, Germany's election results may influence the market, and technically, EUR/USD may find support near 1.1590 if it breaks the yearly low of 1.1663. In the event of any change in momentum, it may find resistance near 1.18, with 1.1860 being the next level to watch.
Trade EUR/USD options on DTrader and CFDs on Deriv MT5 Financial and Financial STP accounts.
GBP/USD
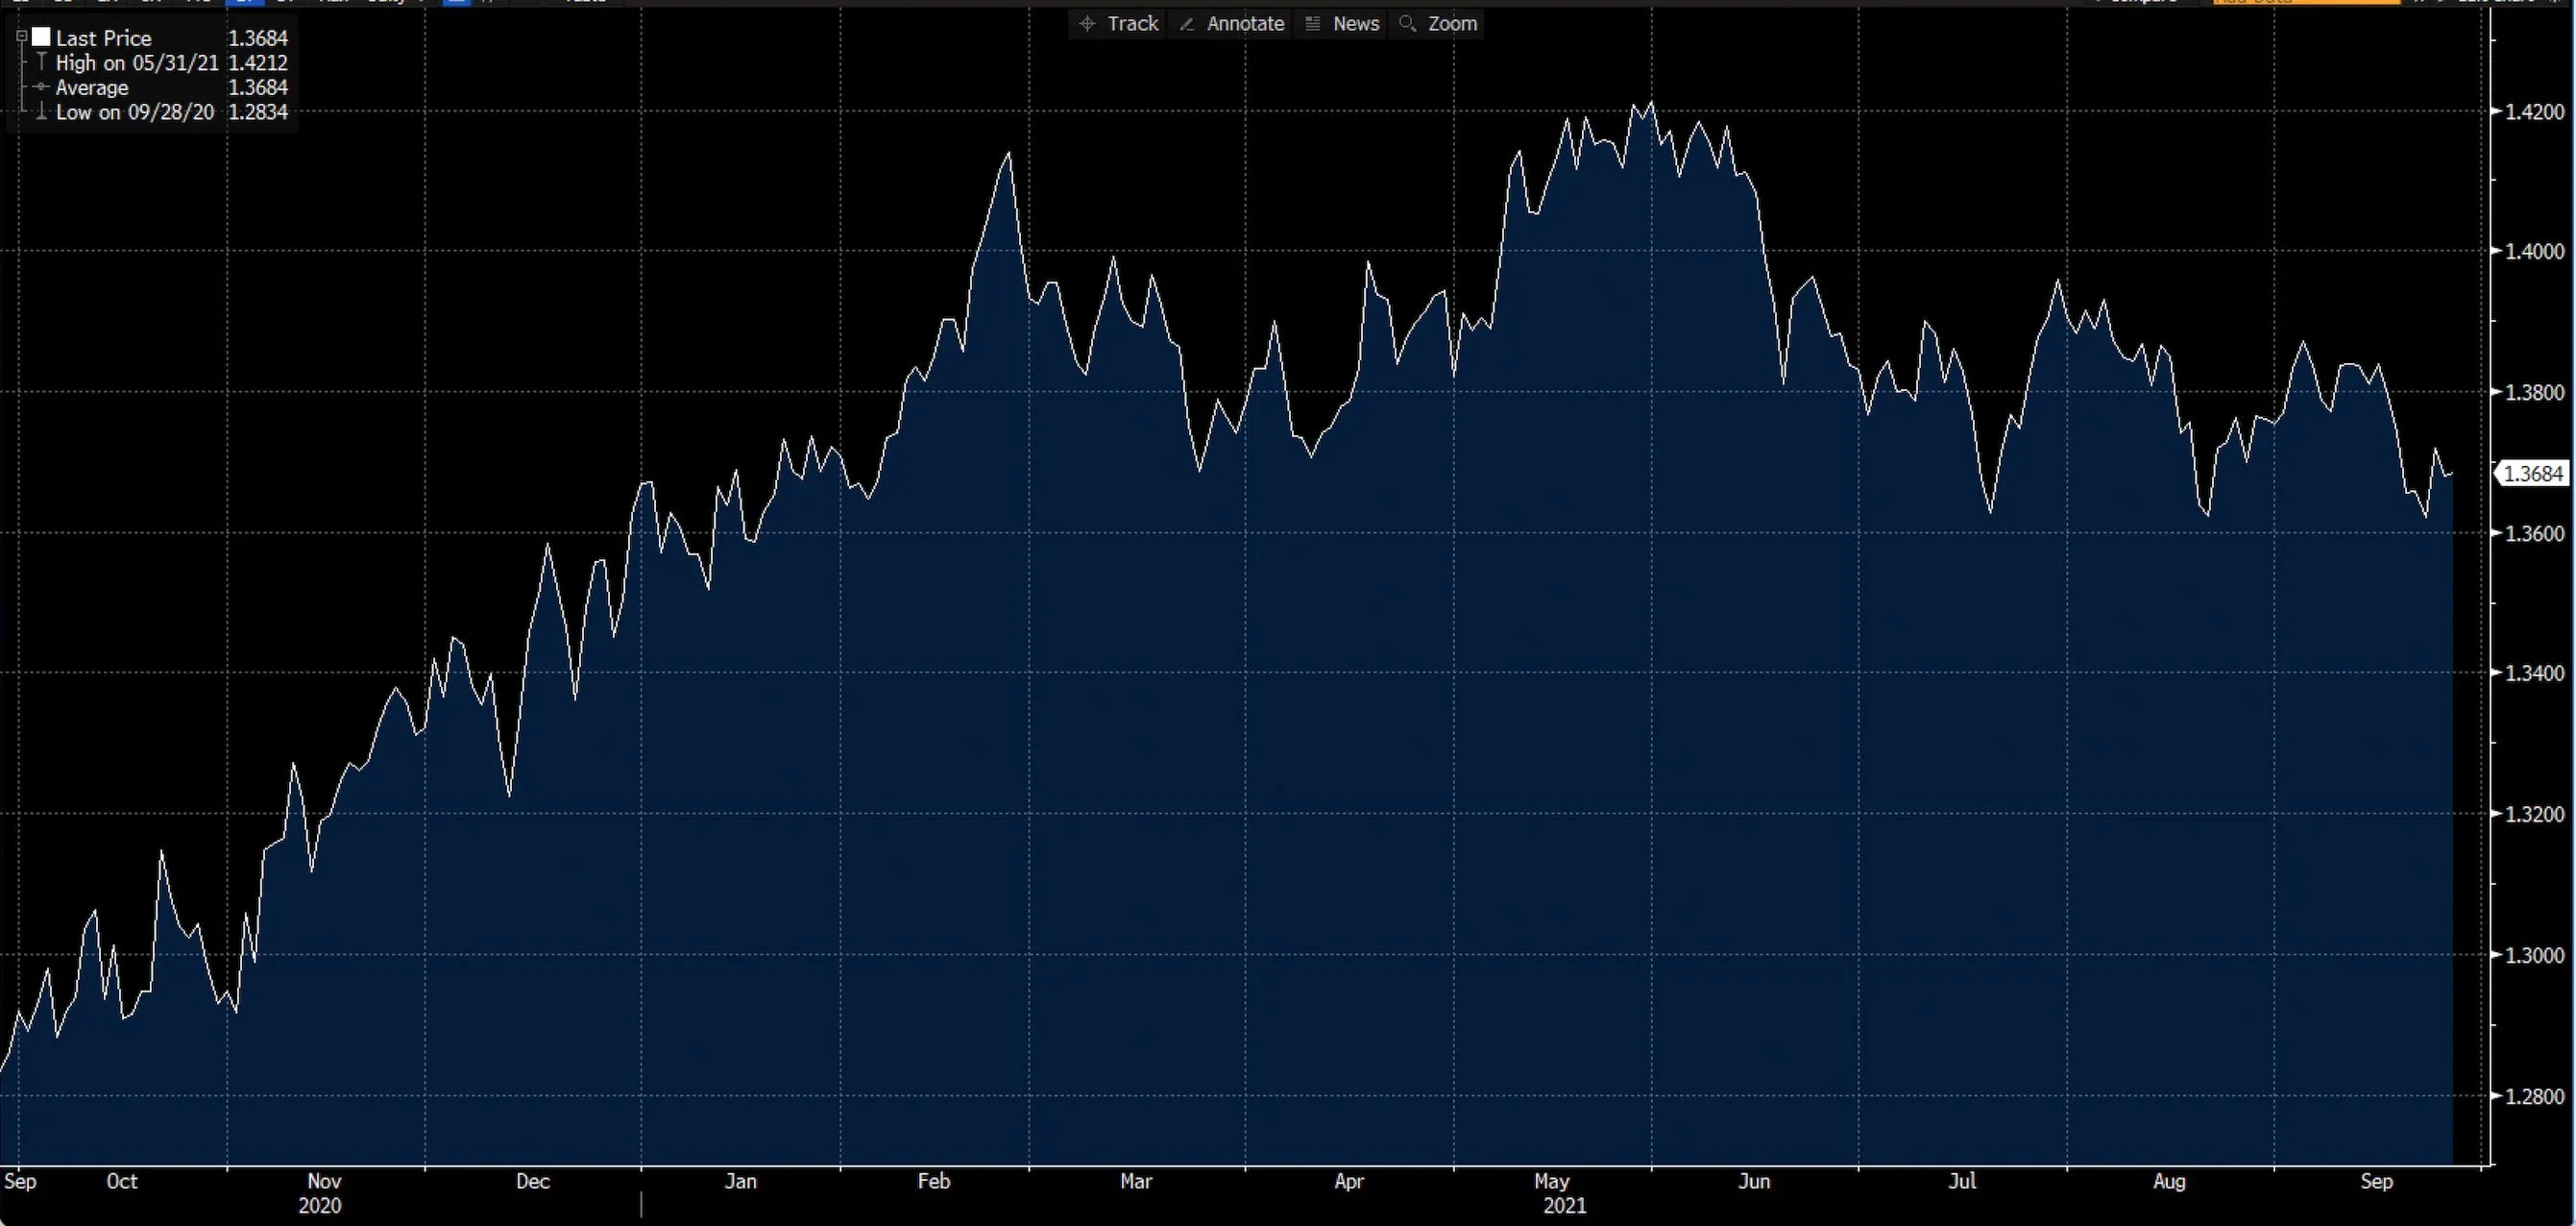
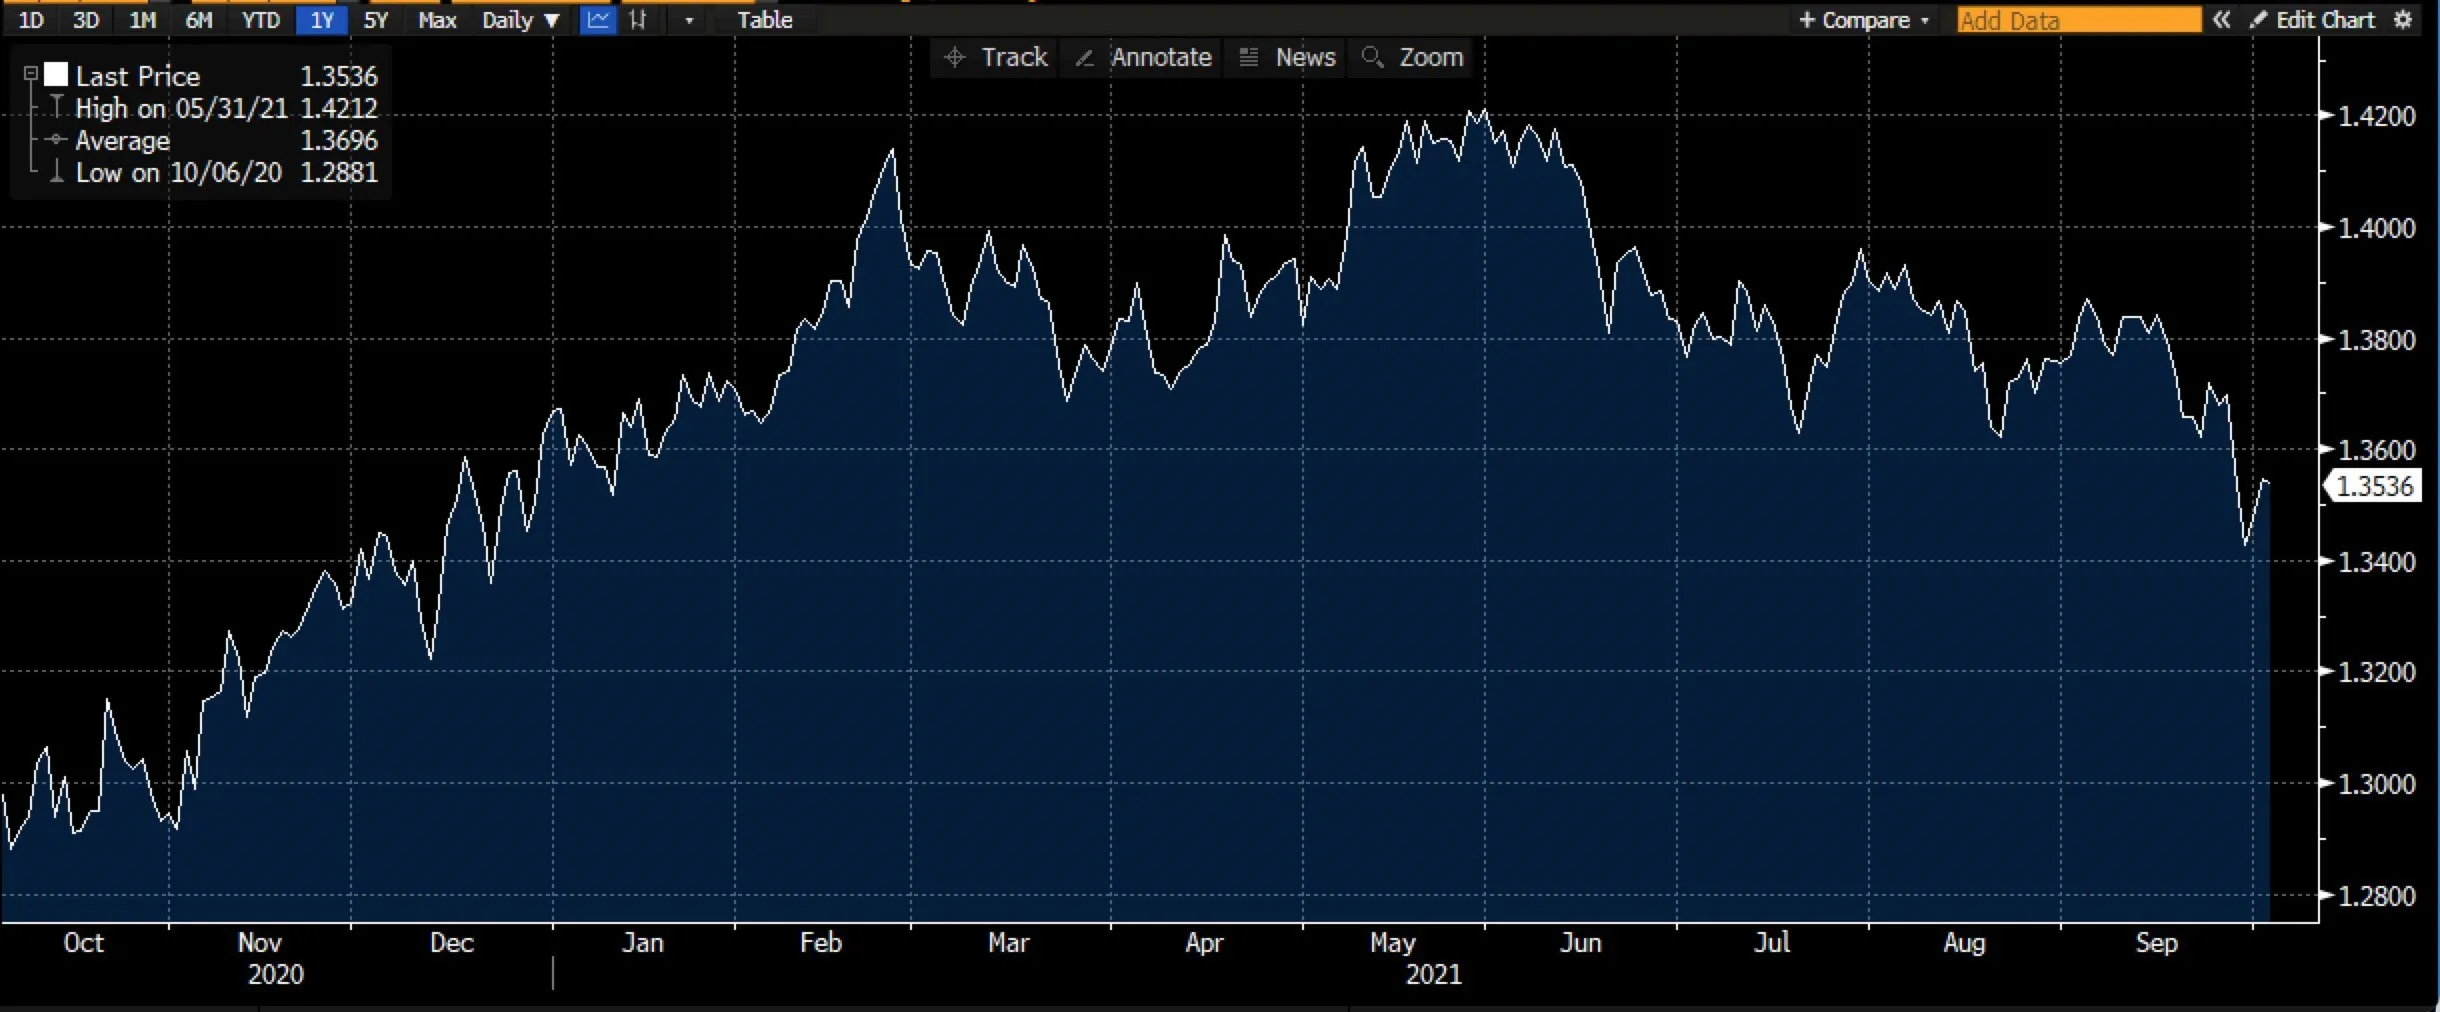
Last Friday, cable broke the 1.36 level, and it was the third consecutive weekly loss for the British pound. Technically, the pair is just trading above its yearly low of 1.3570, and any confirmed break below that level might indicate further bearish movement. On the higher side,1.3750-1.38 will be the key resistance zone for the pair, while 1.35 might provide some support before the major support of 1.3420.
Trade GBP/USD options on DTrader and CFDs on Deriv MT5 Financial and Financial STP accounts.
XAU/USD — Gold
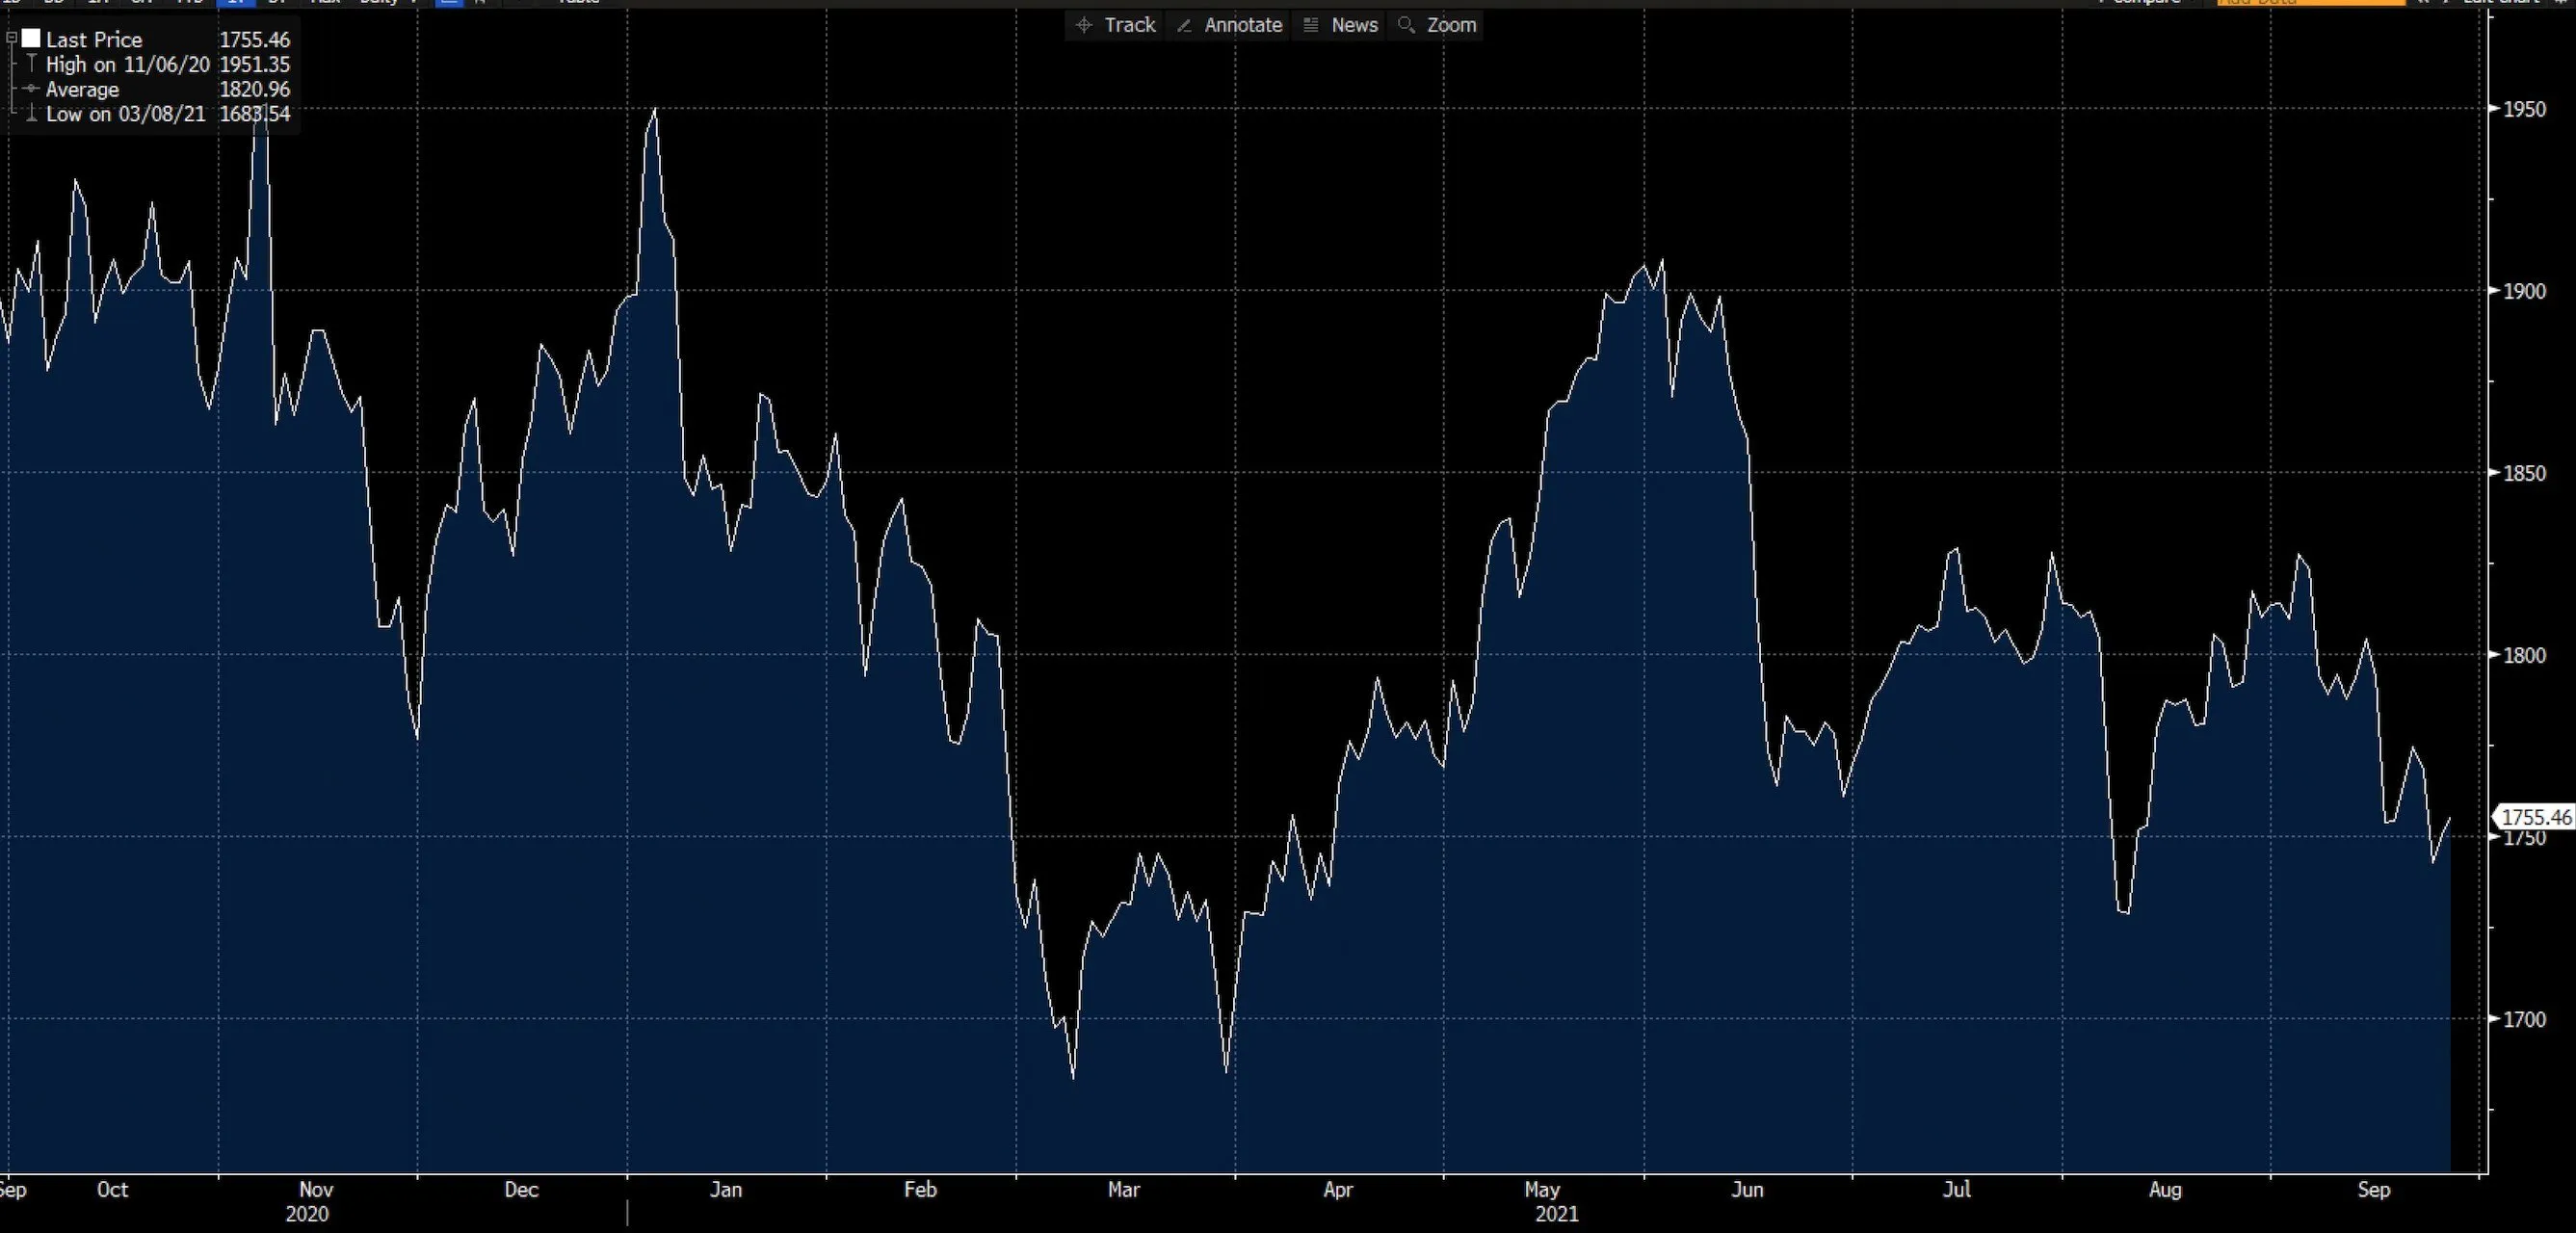
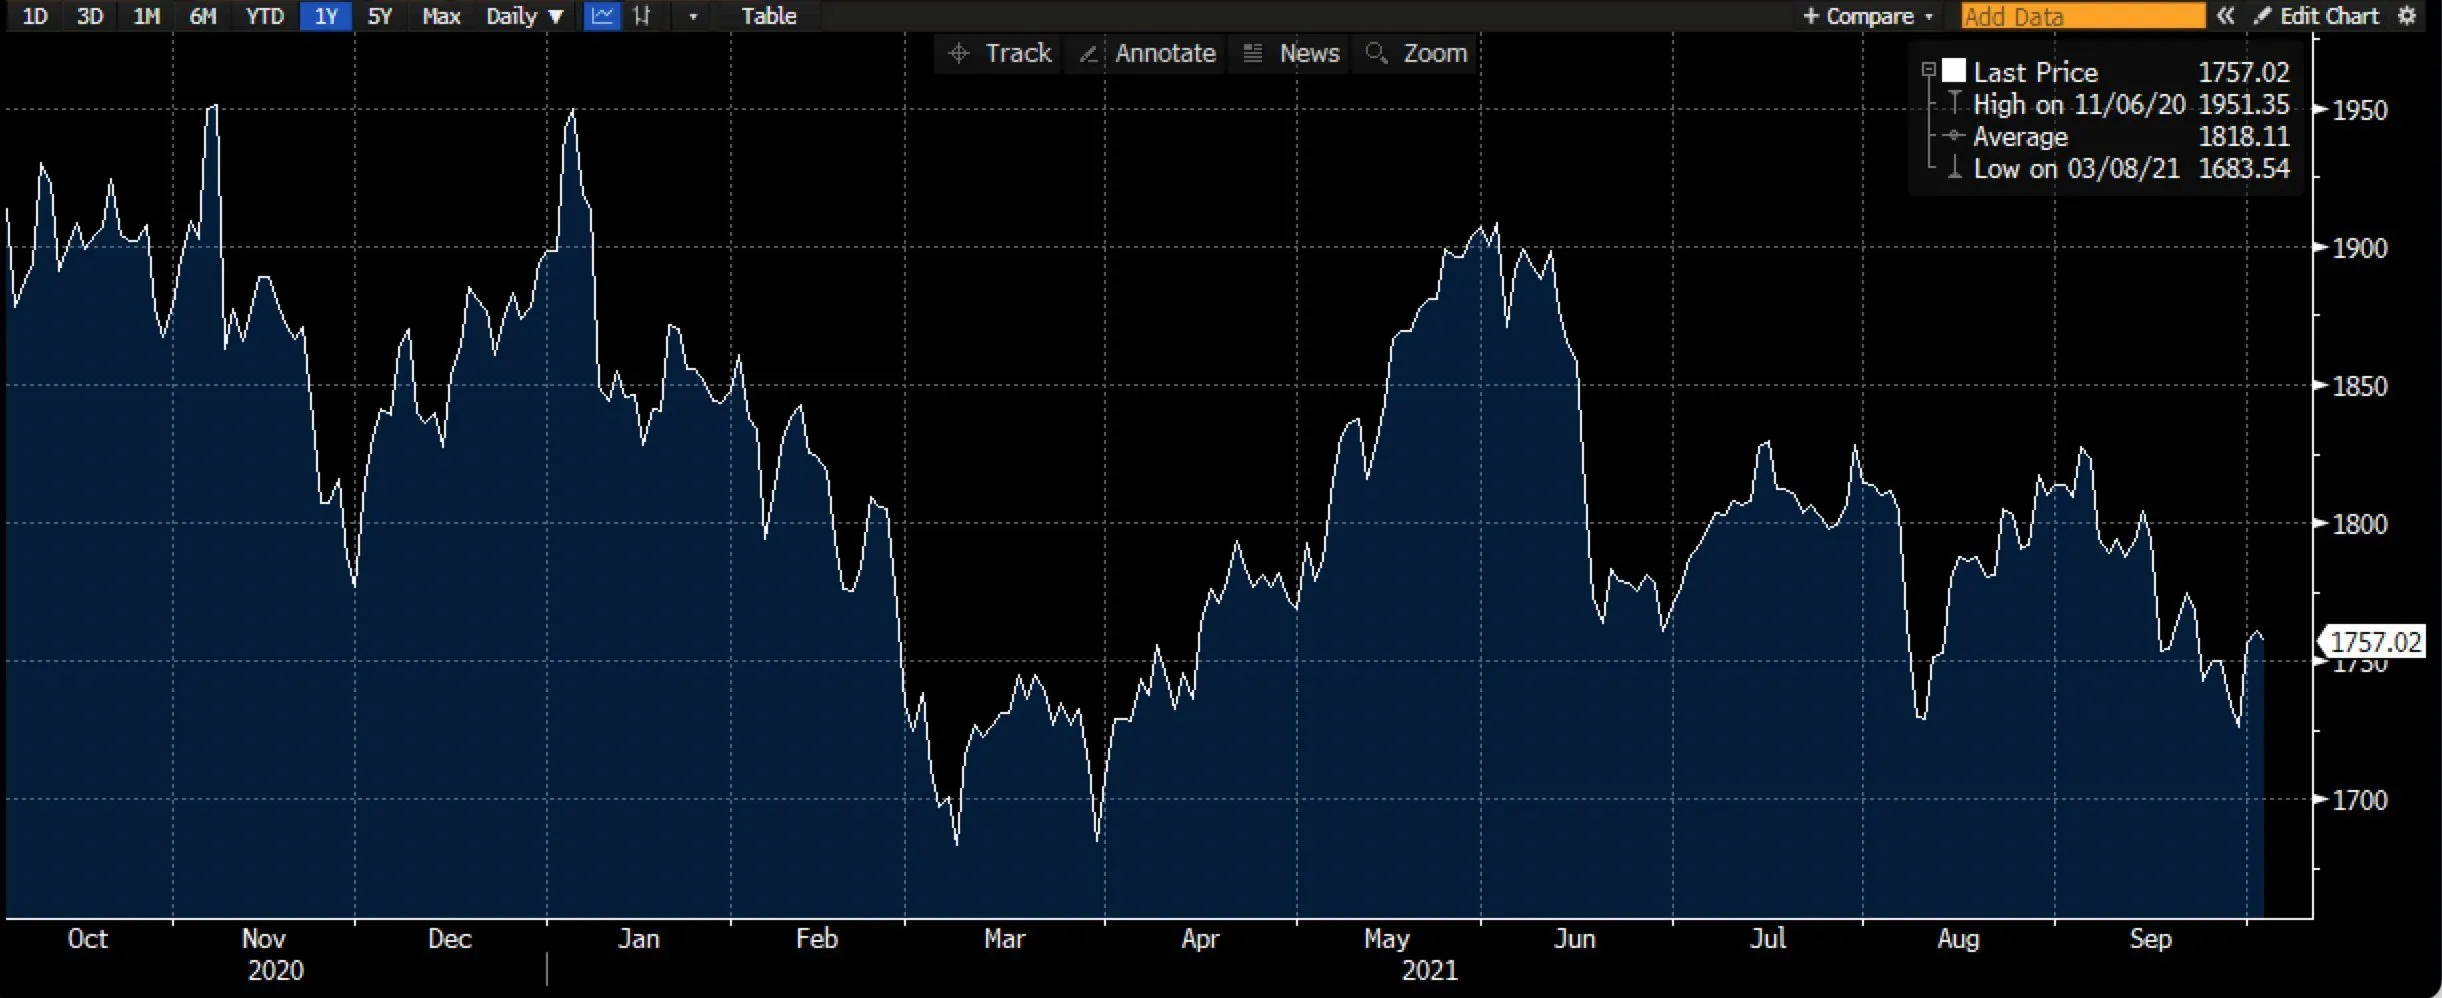
A strong US Dollar Index and hawkish Fed’s commentary dragged the prices of gold down last week. In fact, it was the lowest weekly close in the last six months. During the week, it went further down, and closed below its major support of 50% retracement levels of $1,755. RSI is making a lower low on a weekly basis, suggesting a short-term bearish outlook for gold. In addition to the trend reversal level previously, gold has major support near the 61.8% retracement level near $1,680. On the upside, it might try to recover up to the $1,780-$1,790 zone. Fundamentally, the market will wait for Fed chairman Powell’s speech on Wednesday, followed by major US manufacturing PMI data on Friday.
Trade Gold options on DTrader and CFDs on Deriv MT5 Financial account.

Weekly market report – 20 Sep 2021
Last week, gold suffered its second straight weekly loss, the lowest weekly close in the last six months. Lower than expected US CPI data helped last week's gold prices to trade higher than $1,800.
XAU/USD — Gold
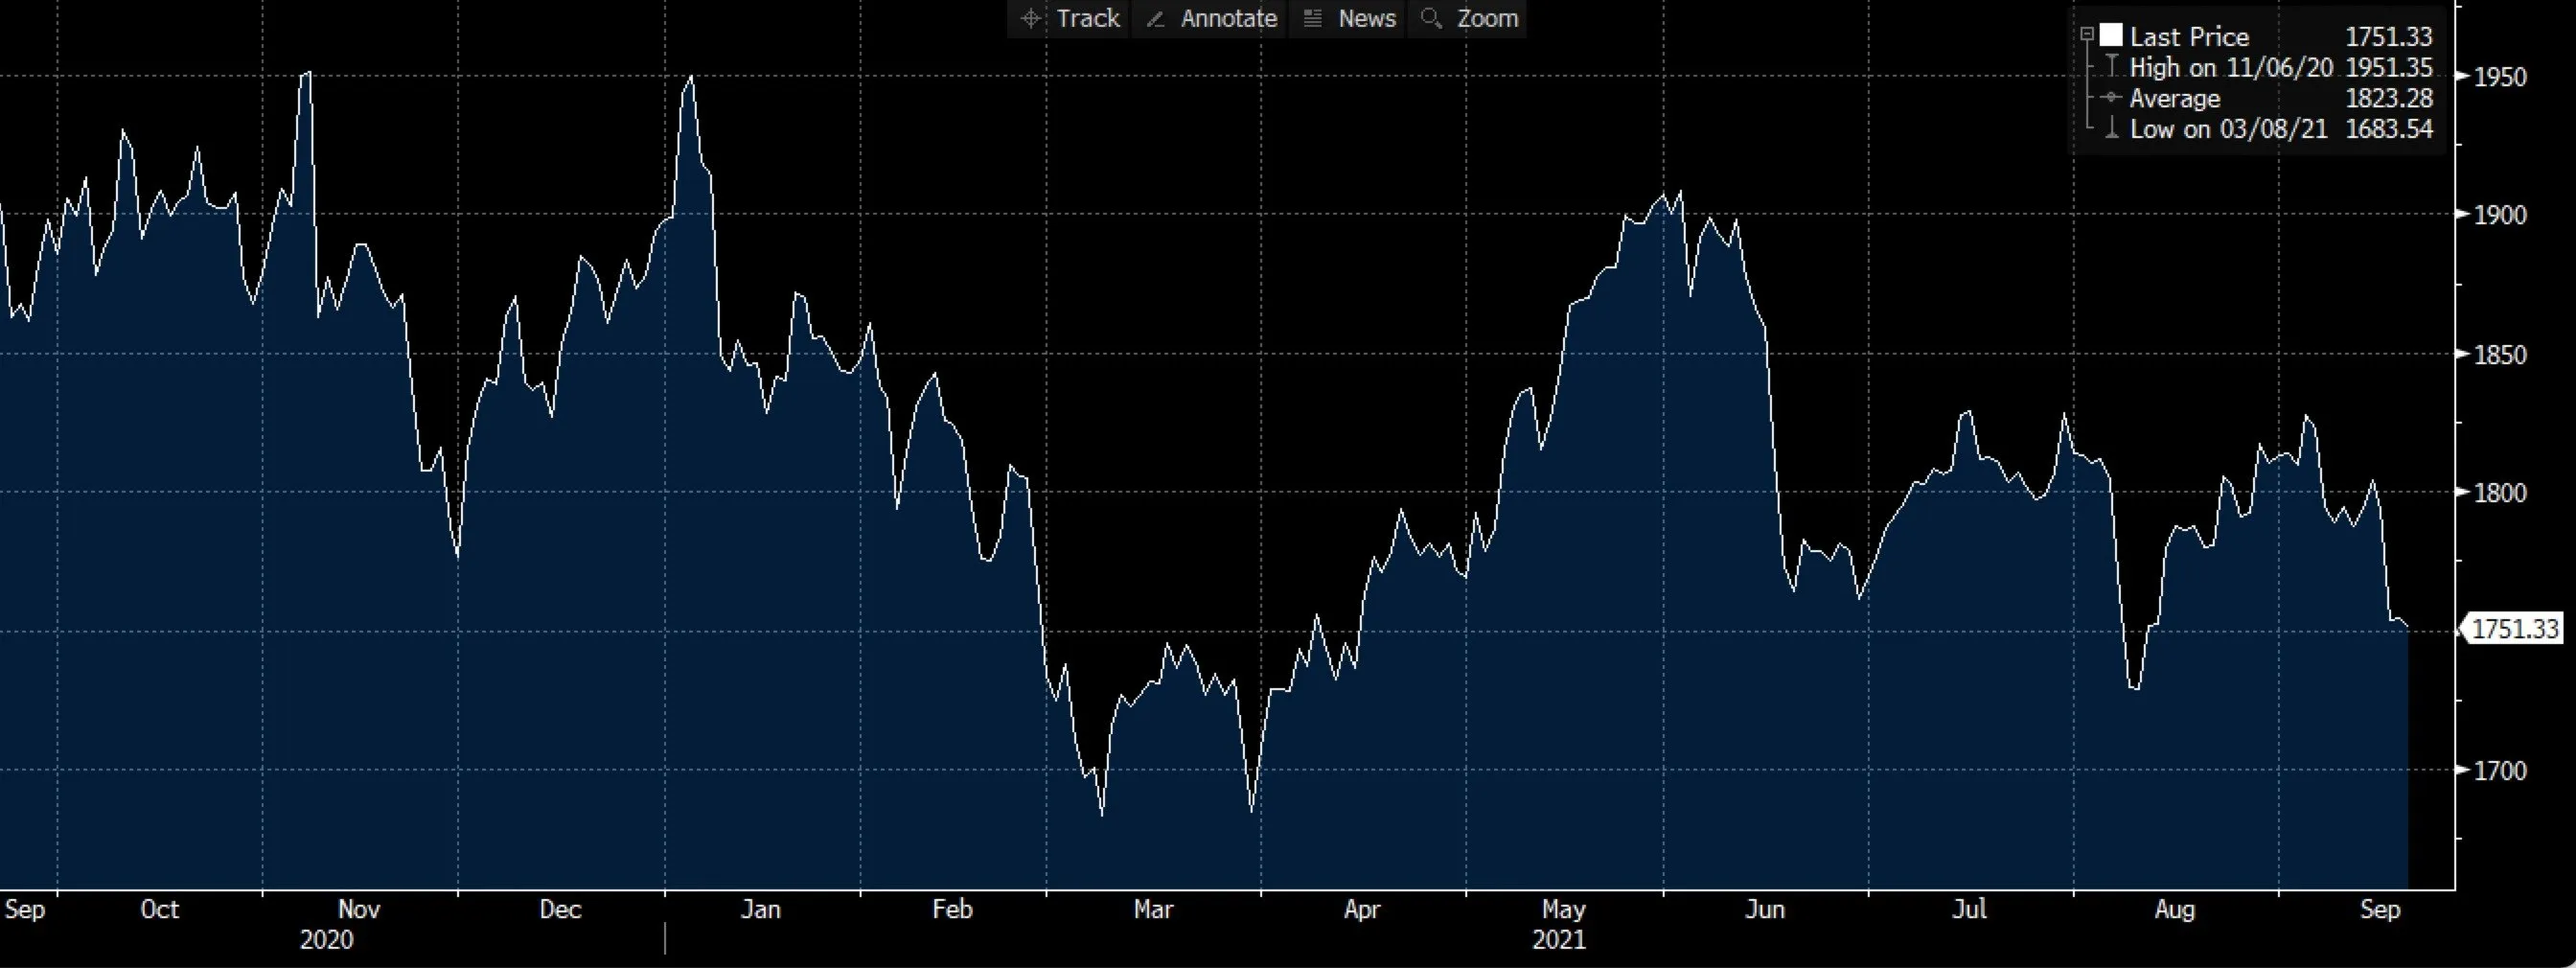
Last week, gold suffered its second straight weekly loss, the lowest weekly close in the last six months. Lower than expected US CPI data helped last week's gold prices to trade higher than $1,800. However, US dollar strength later in the week caused gold to fall below $1,750. It closed a little above the 100 weekly SMA level of $1,751. Wednesday's FOMC policy announcement will be closely followed by the market this week. Gold is trading at a crucial level, and its movement will determine the next trend. The next support is the Fibonacci retracement of 61.8% at $1,720, and below that, it has major support at the 78.6% retracement level of $1,578. While on the higher side $1,814-1,820 will be the key level for the momentum to continue upwards.
Trade Gold options on DTrader and CFDs on Deriv MT5 Financial account.
EUR/USD
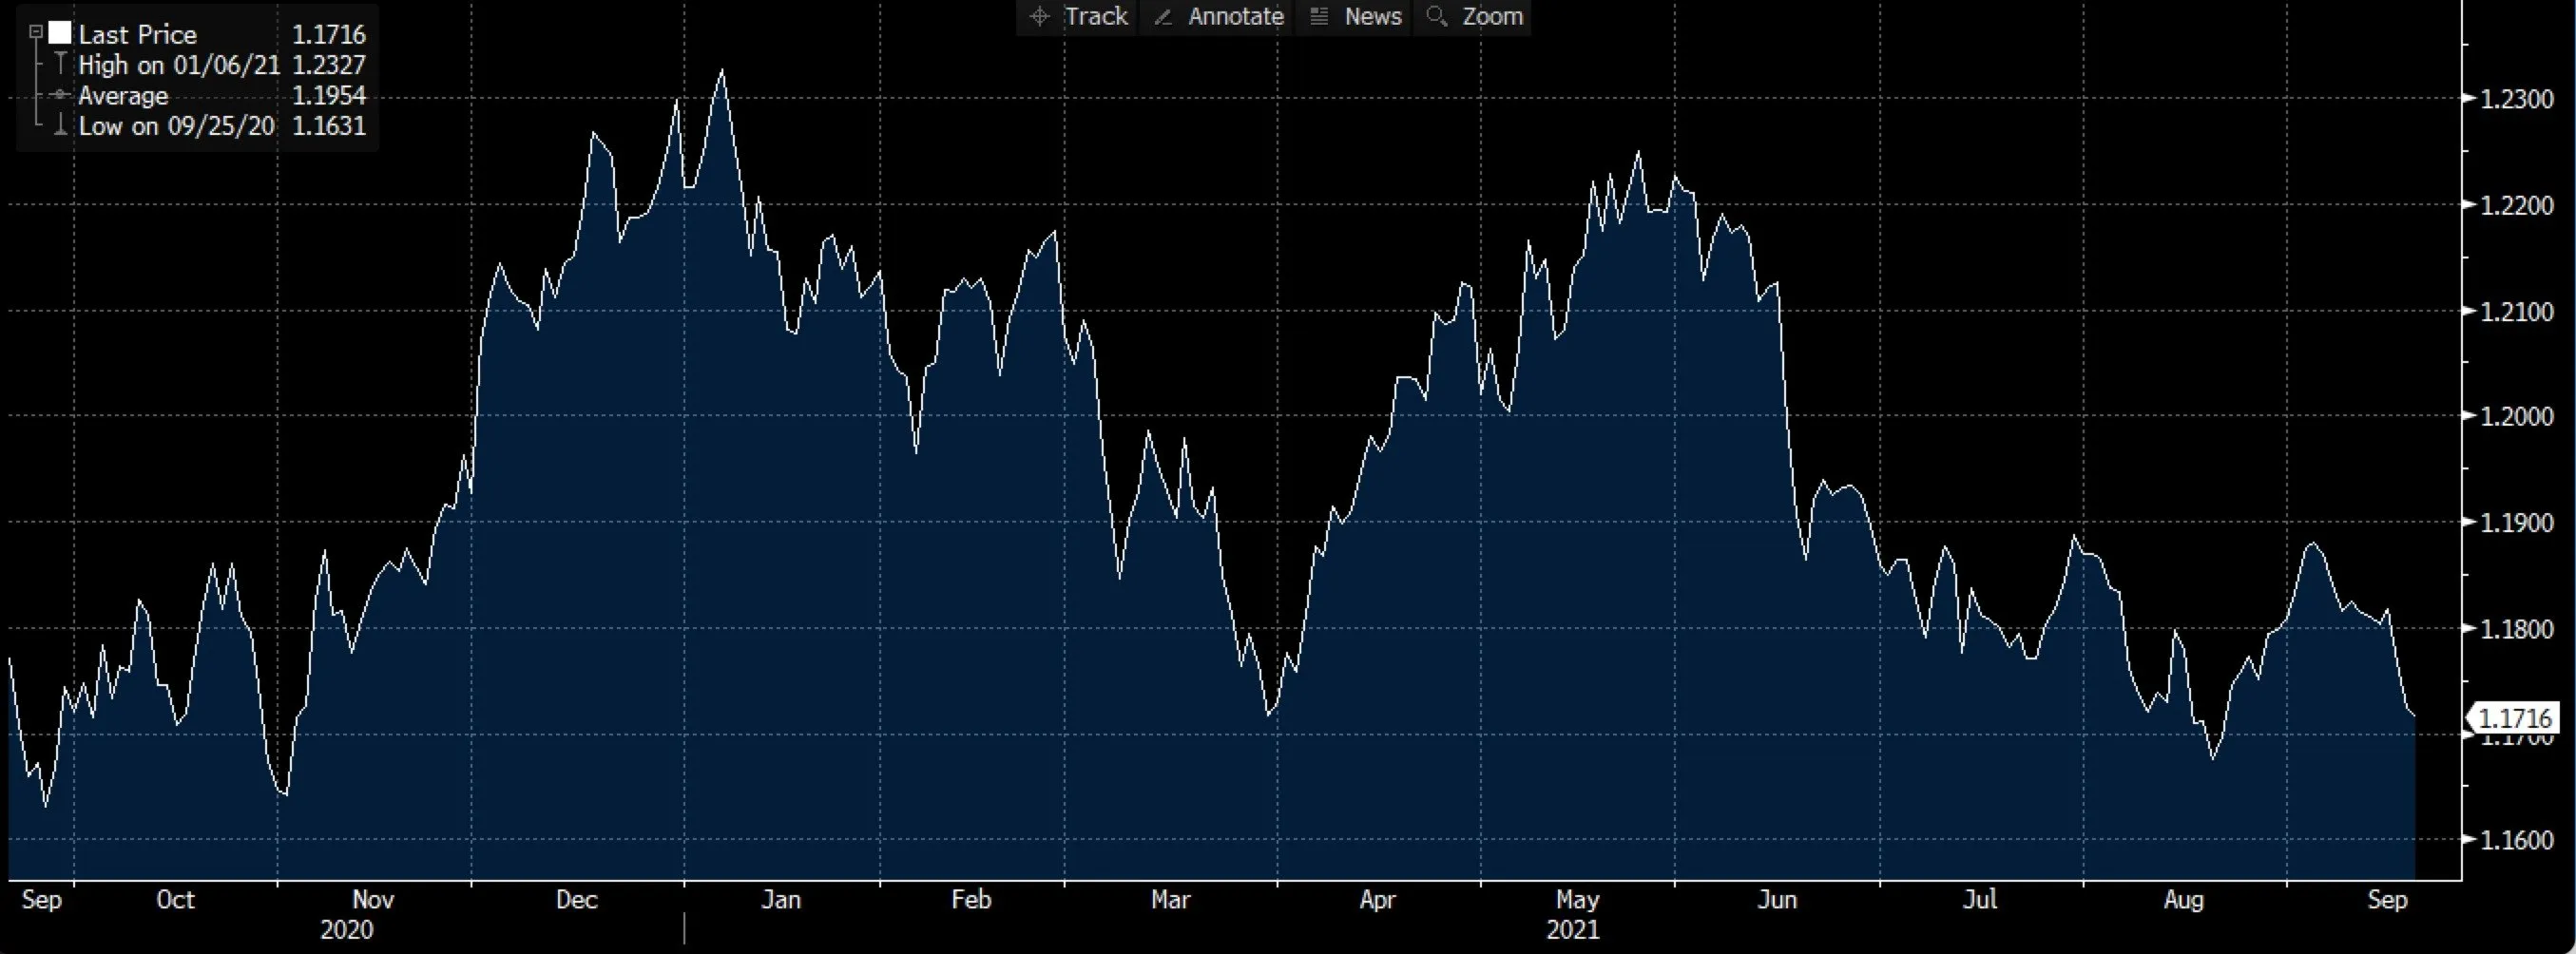
It was a bearish second week for the EUR/USD last week. Higher prices of the US dollar Index are putting pressure on the prices of major currencies. Technically, it has major support at the 1.15890 levels, which is a weekly 200 SMA. While on the higher side, it might rebound to up to 1.1840 levels, and 1.19 will be the level for the trend reversal. The EUR/USD pair might show higher volatility due to the upcoming FOMC minutes and German election on Sunday.
Trade EUR/USD options on DTrader and CFDs on Deriv MT5 Financial and Financial STP accounts.
BTC/USD
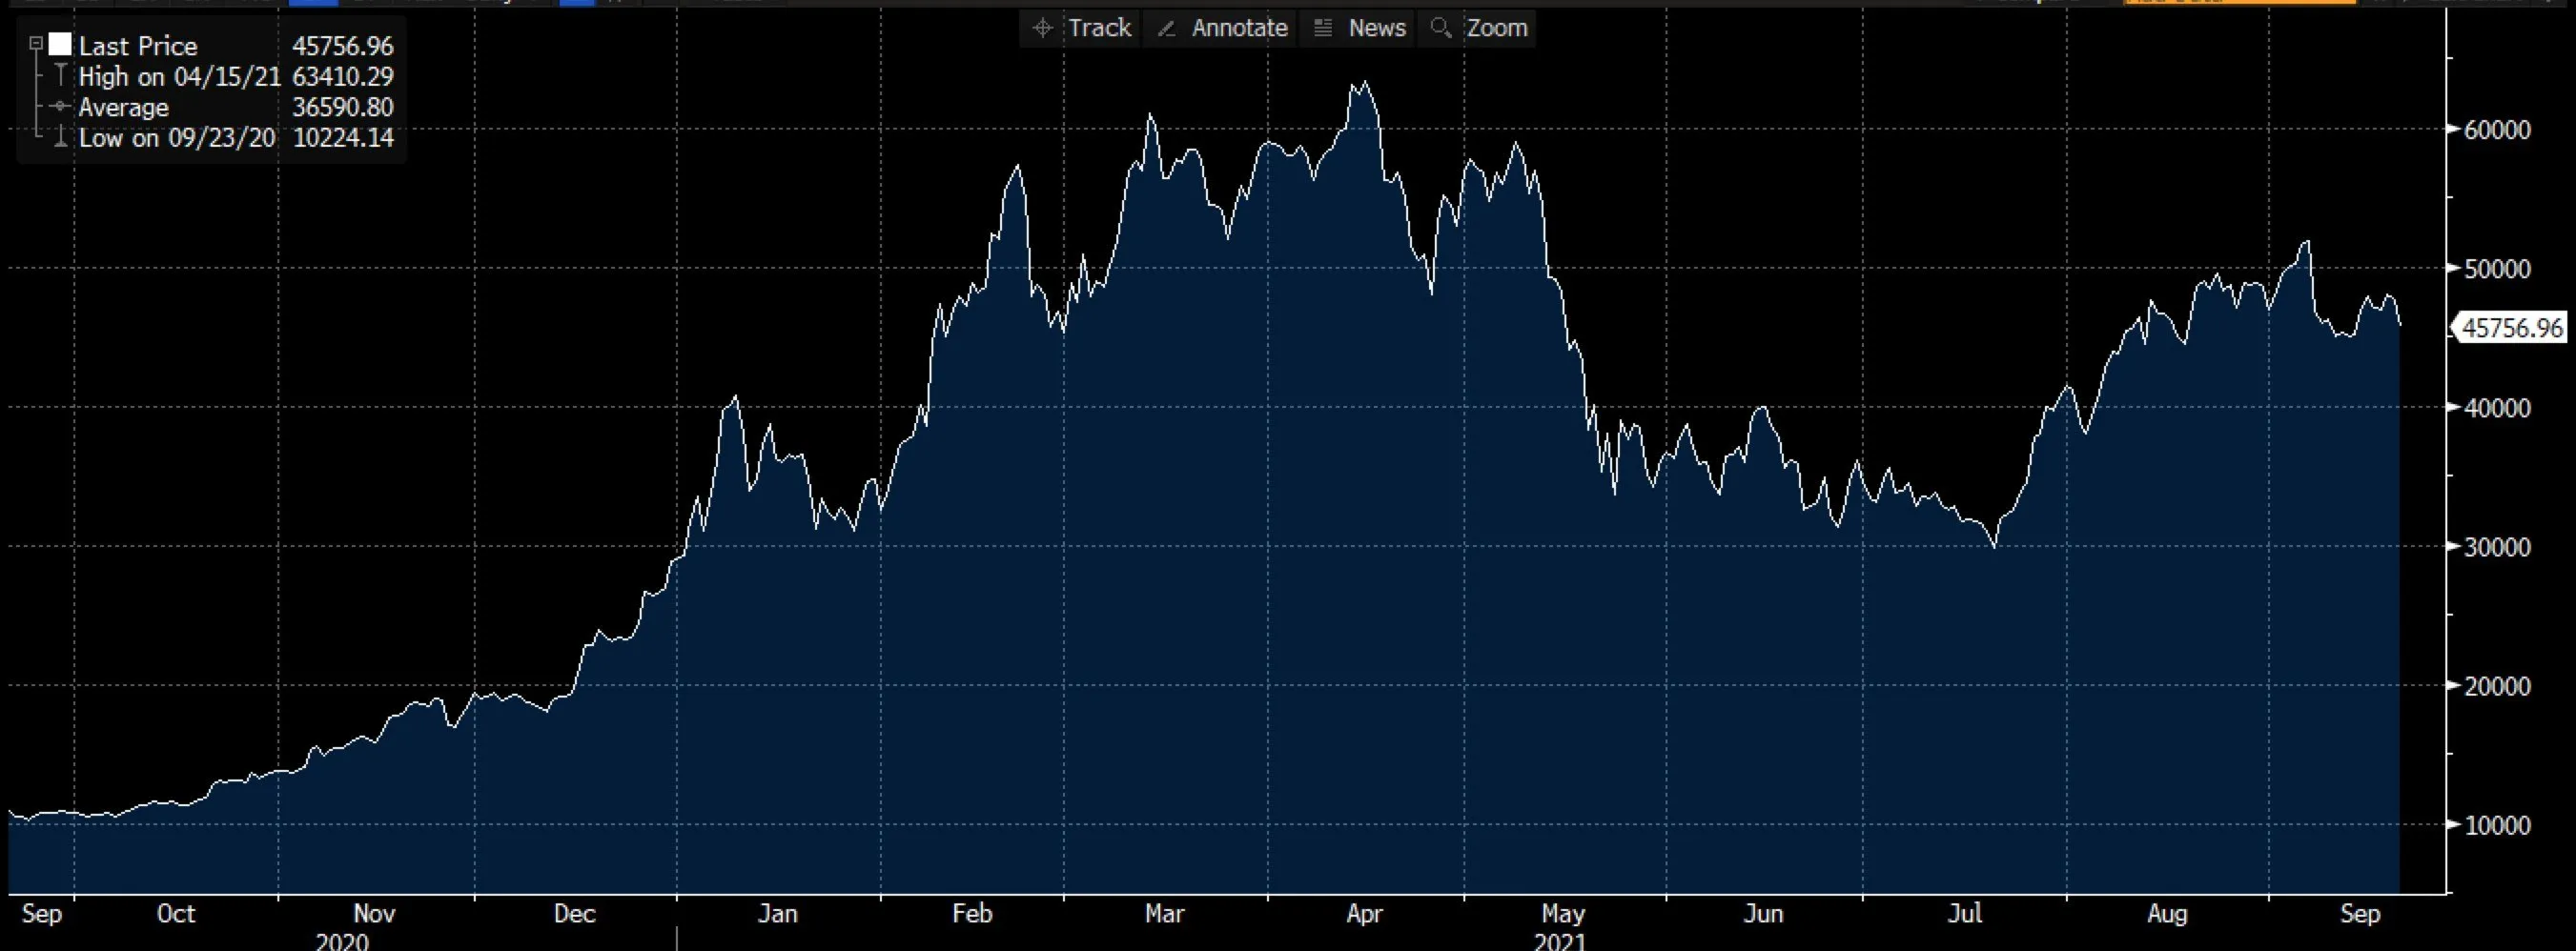
Bitcoin continues to move range-bound for the second week. Its daily time frame shows it has multiple support near $42,780, which is a 38.2% retracement level. The next major weekly support will be near $40,625. A 61.8% retracement level of $51,200 will be the key resistance zone for further upside momentum.
Trade BTC/USD multipliers on DTrader and CFDs on Deriv MT5 Financial and Financial STP accounts.
NASDAQ — US Tech 100
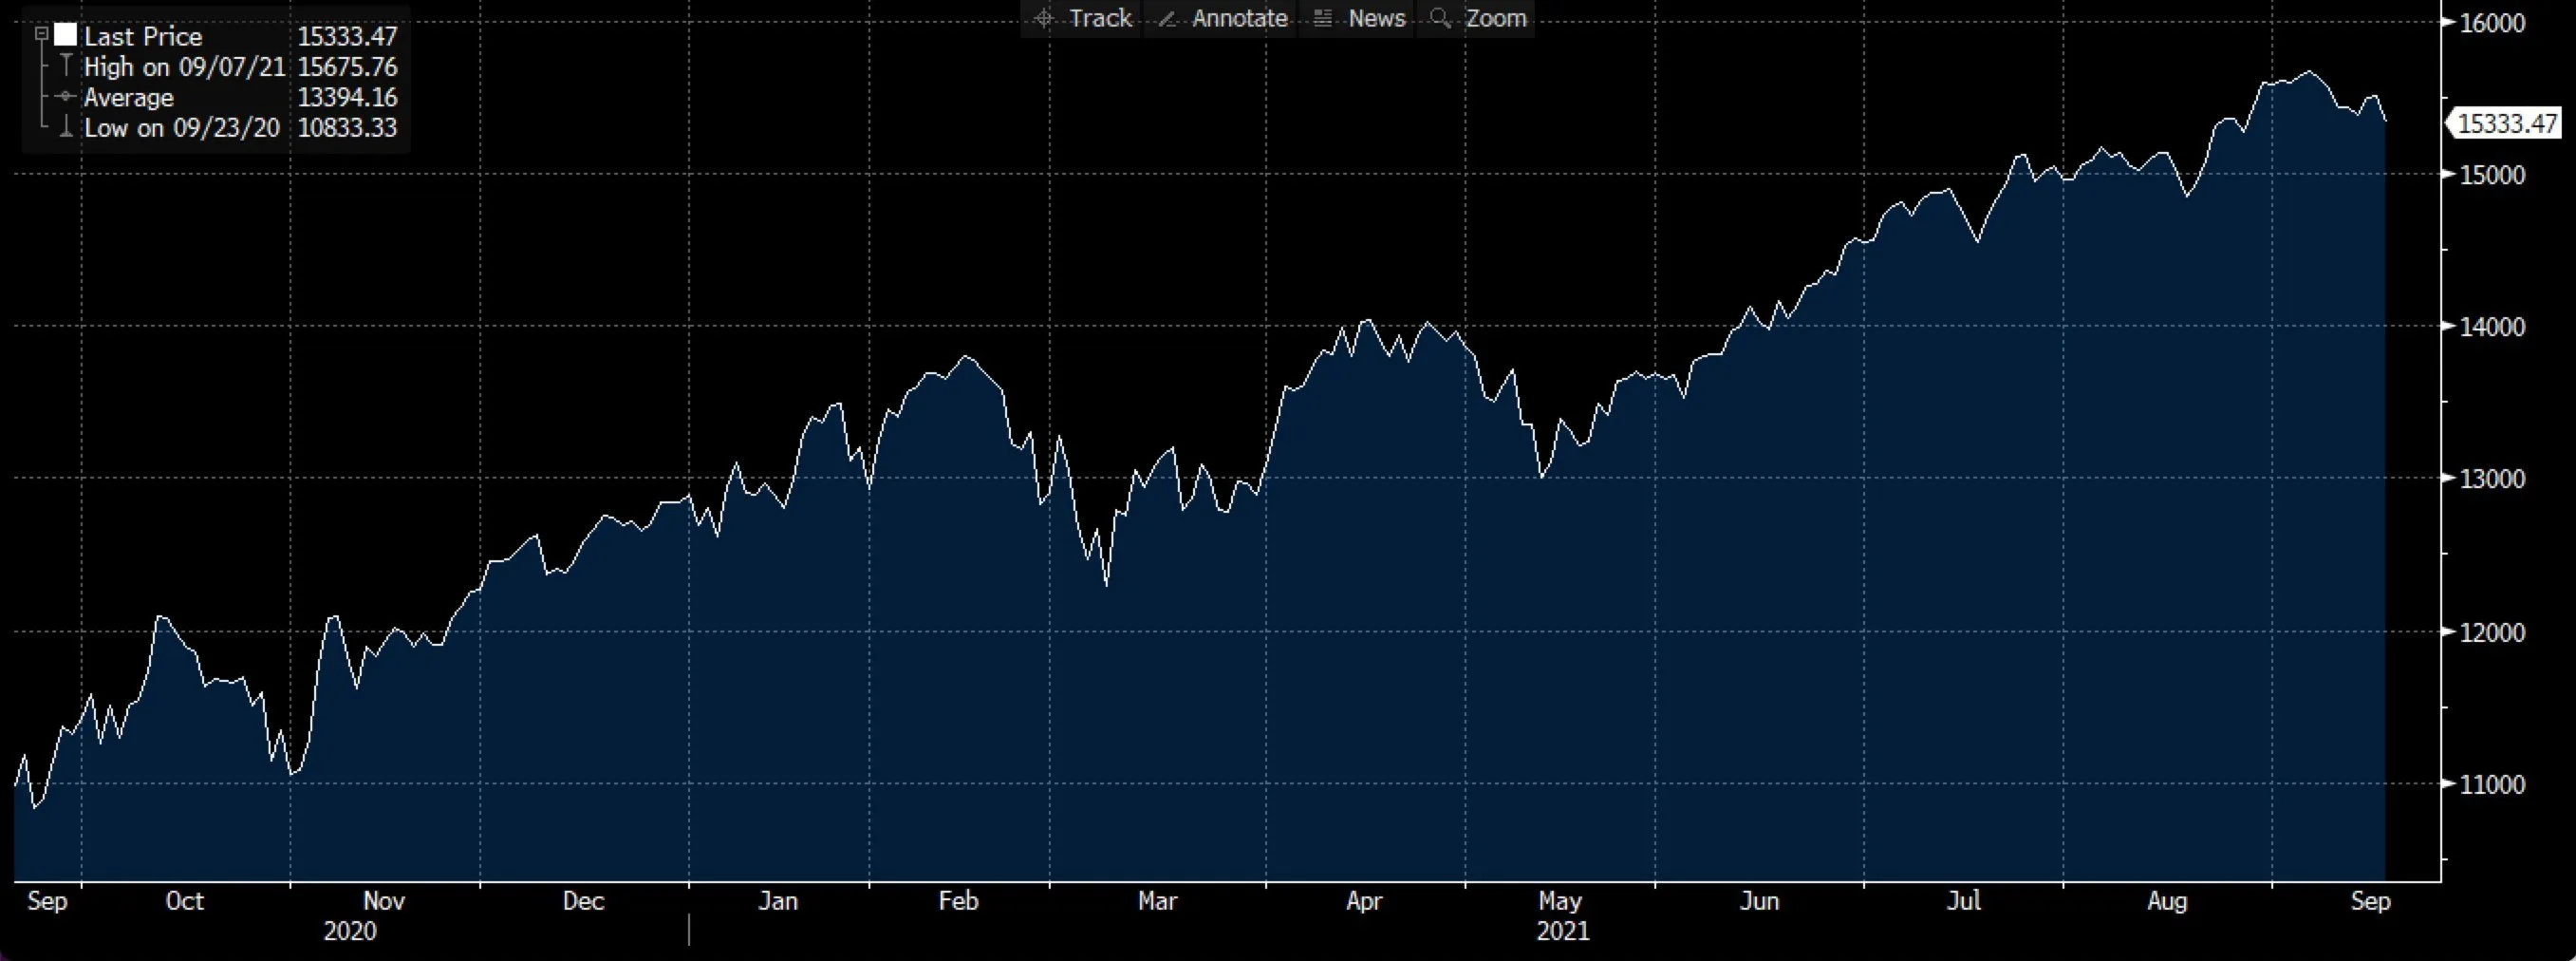
Last week, US Tech Index Nasdaq registered a second weekly loss. It started moving down exactly from its 161.8% weekly retracement level of around $15,712. An FOMC statement upcoming this week and an upward trend in the US dollar could result in a period of high volatility in the coming weeks. Technically, $15,157 may act as the first support level followed by major support near the $14,800 level. While on the higher side, $15,500 will act as the first resistance level followed by a trend reversal level of $15,712.
Trade US Tech Index options on DTrader and CFDs on Deriv MT5 Financial accounts.
.webp)
Deriv multipliers: How they work
Find out what multipliers are, how you can amplify potential profits, and how trading with Deriv multipliers is different from leveraged trading.
This article was updated on 22 January 2024
Trading with leverage allows you to take a larger position in the market with a small amount of capital. However, leveraged trading also comes with the possibility of large losses.
Not on Deriv multipliers.
Multipliers allow you to amplify your potential profits in a similar way as leveraged trading. You simply apply a multiplier to your trades to potentially multiply your profit. But unlike leveraged trading, you won’t be increasing your potential losses at the same time.
How multipliers work
Here’s an example. Let’s say you trade with a stake of 100 USD and predict the market will go up. The market then goes up by 2%.

On the other hand, your losses are limited to your stake when trading multipliers on Deriv. For example:

*multiplier values and leverage differ per country you’re trading in
Benefits of trading with multipliers
Ramp up your trades
Add a multiplier to your trades — the higher the multiplier, the higher your potential profits. (If you reside in the EU or UK, your multiplier values are pre-determined based on the asset you’re trading.)
Limit your risk
Risk losing no more than your initial stake with the automatic stop-out function — on every single trade.
Manage the possibilities
Secure your profit automatically, protect your stake, and feel free to change your mind with risk-management features like take profit, stop loss, and deal cancellation.
Trade anytime, anywhere
Trade multipliers on forex, cryptocurrencies, and Deriv’s synthetic indices on both desktop and on Deriv’s mobile app, Deriv GO. With crypto and synthetic indices available to trade 24/7, even on weekends, you can trade multipliers anytime, anywhere you want.
Find out how to get started trading multipliers on Deriv’s DTrader trading platform in this step-by-step guide.

Weekly market report – 04 Oct 2021
The EUR/USD pair continues to fall in a bearish channel. Any pullback for the pair is short-lived and followed by a strong bearish candle. Find out in this week's market report.
EUR/USD
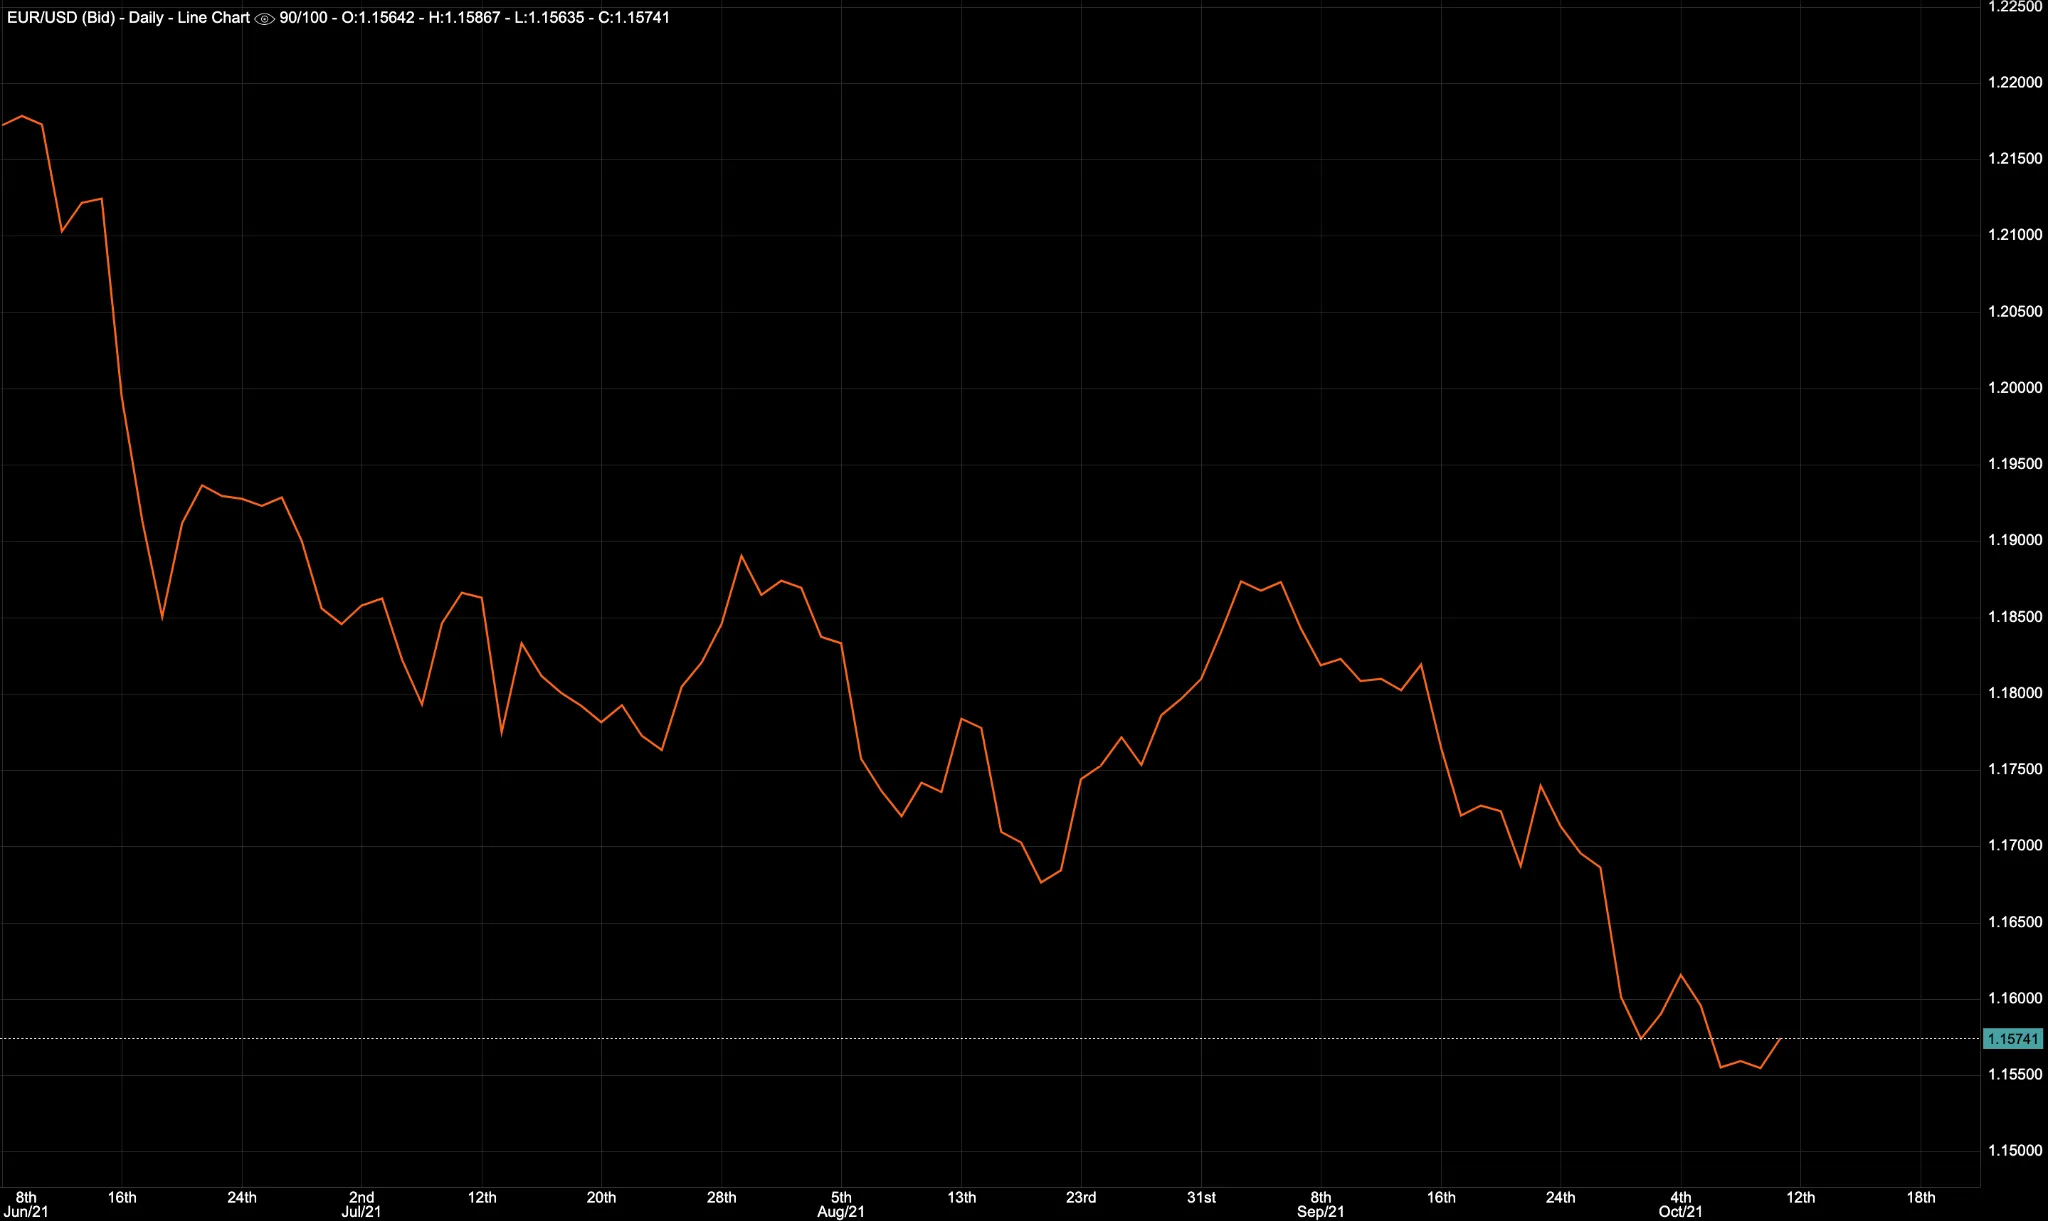
The EUR/USD pair continues to fall in a bearish channel. Any pullback for the pair is short-lived and followed by a strong bearish candle. Moreover, a negative outlook is also implied, as the pair broke through the 1.16 level for the first time in a year. Since it has fallen from a 1.19 to a 1.16 level without any major pullback, it might retrace higher before it resumes further decline. As far as price is concerned, on the higher side, 1.1680-1.17 will act as a strong resistance zone, while on the downside, 1.15 is a major support zone, followed by 1.1290. On a weekly basis, RSI is trading at 38, indicating the possibility of further downward movement. As a whole, the market will react to the US Nonfarm employment data, which will be released on Friday, 08 October 2021.
Trade EUR/USD options on DTrader and CFDs on Deriv MT5 Financial and Financial STP accounts.
GBP/USD
By breaking the 1.35 level, the GBP/USD pair made a new yearly low. A strong US dollar and rising concerns of Brexit continue to put pressure on the prices of GBP/USD. According to RSI, the index is trading at 42 and is continuing to decline. Last week, it breached and closed below the 78.6% retracement level, 1.3650. A major support level is situated close to the 61.8% retracement level, which is around 1.3170, while 1.3650 will decide the future trend for the GBP/USD pair.
Trade GBP/USD options on DTrader and CFDs on Deriv MT5 Financial and Financial STP accounts.
XAU/USD — Gold
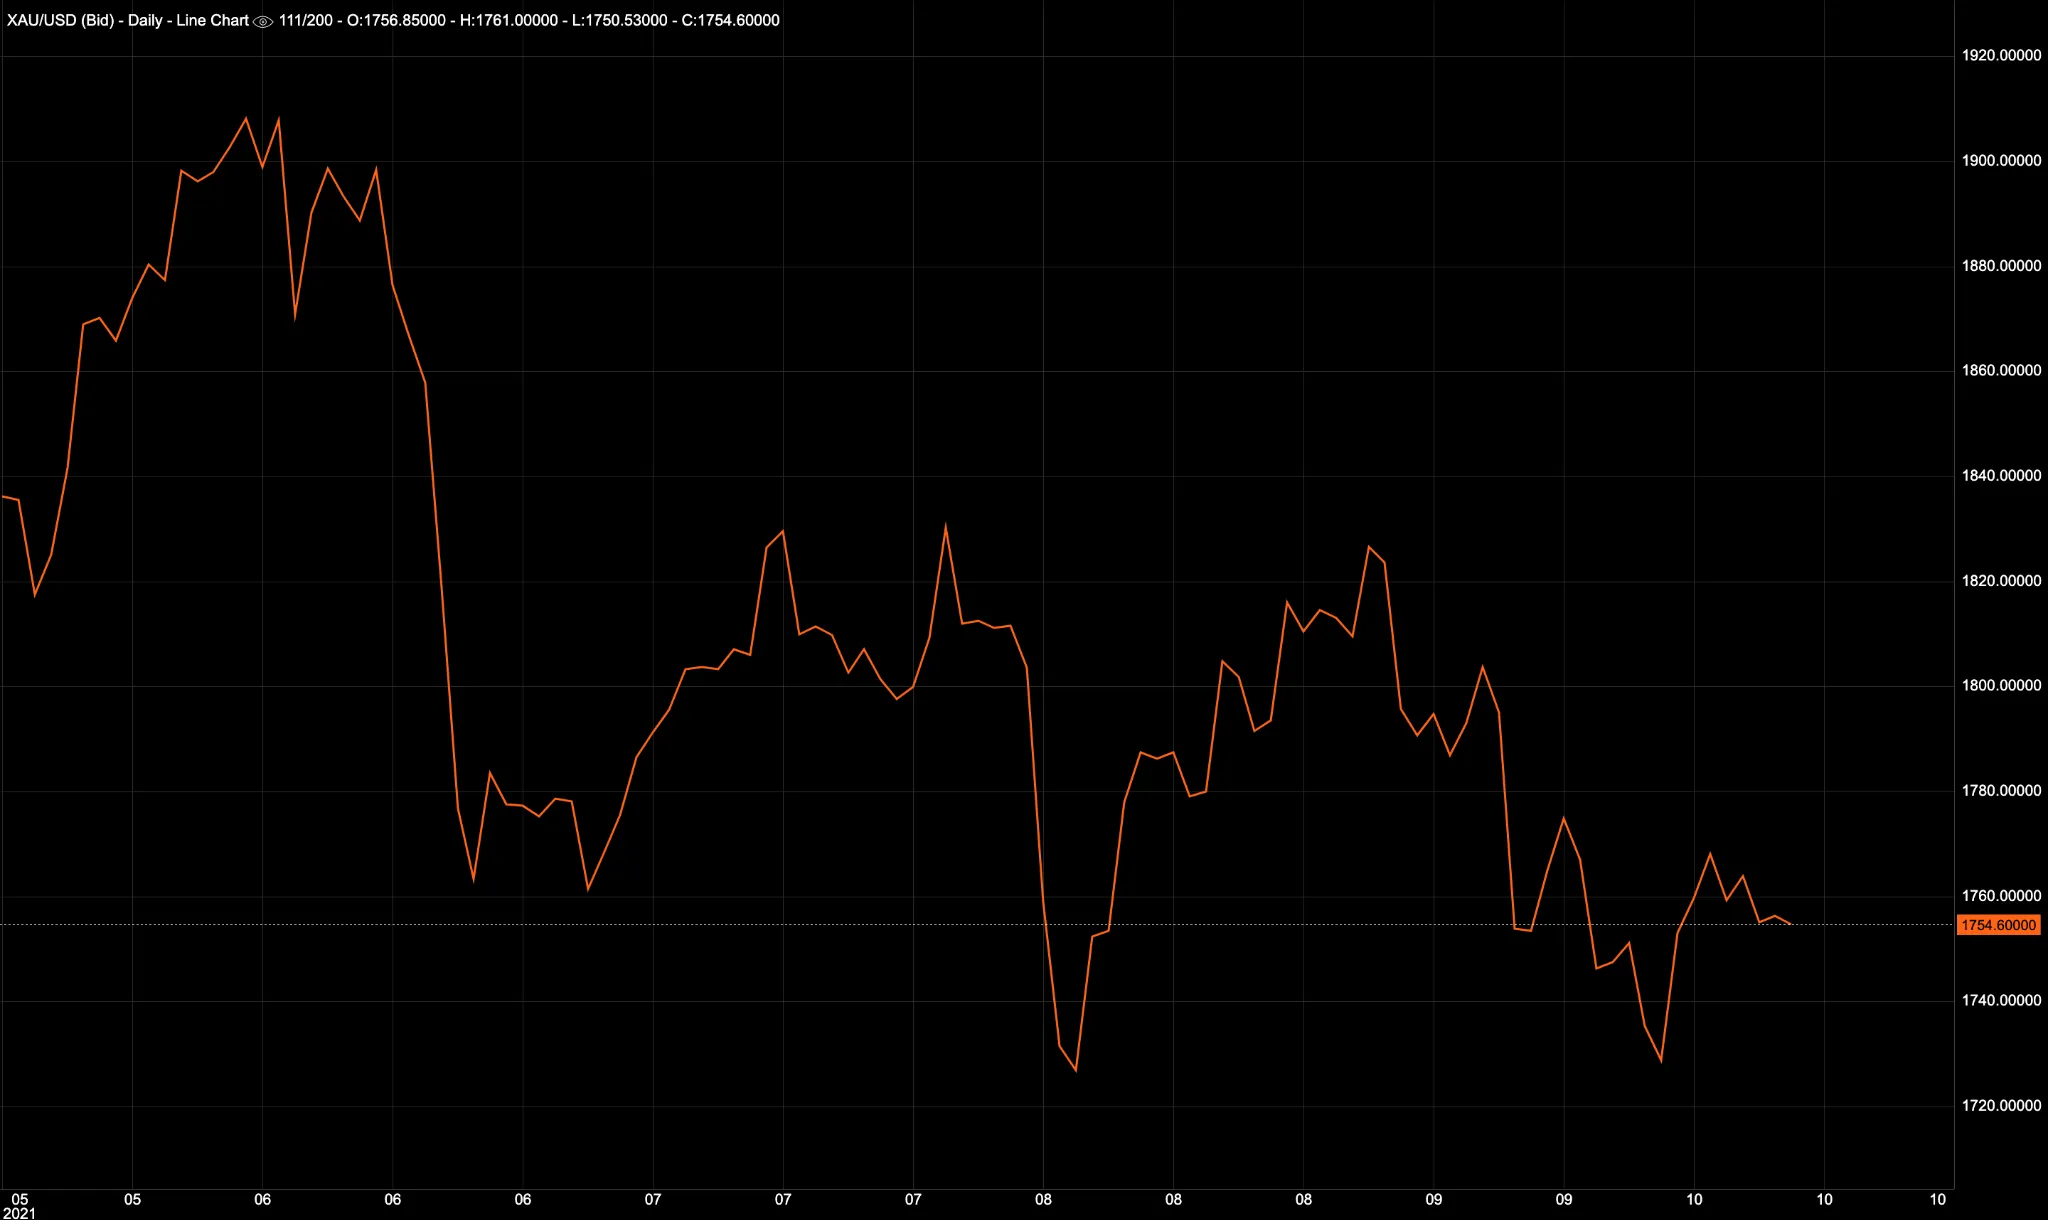
The prices of gold closed below their 50% retracement level of $1,764 for the third week in a row. Gold prices are falling due to higher Treasury yields and a strong US dollar. However, on a weekly basis, gold managed to close slightly positive near $1,759 after reaching a low near $1,721. There is a possibility of gold prices bouncing back for a short period due to the lack of an established trend. If it crosses next to the watch, it will be around $1,798 as it has a resistance zone at $1,764-1,770. On the downside, the next major support level is near the 38.2% retracement level of around $1,689. The US employment data scheduled to release on Friday, 08 October 2021, may shed some light on how gold prices will trend in the future.
Trade Gold options on DTrader and CFDs on Deriv MT5 Financial account.

Weekly market report – 11 Oct 2021
Last week, lower than expected employment data helped the gold prices rise to a level it hadn’t crossed in two weeks – $1,781. However, it failed to maintain momentum and fell back to $1,756.
XAU/USD — Gold
Last week, lower than expected employment data helped the gold prices rise to a level it hadn’t crossed in two weeks – $1,781. However, it failed to maintain momentum and fell back to $1,756. Prices of gold are taking a hit due to concerns of the US rate tapering and higher treasury yields. In the coming week, the market might react to the FOMC minutes and CPI data, releasing on Wednesday, 13 October 2021. This will be followed by m/m retail sales data on Friday, 15 October 2021. From a technical standpoint, gold’s resistance will be located between $1,764 – $1780 for the upcoming week. While on the downside, a 38.2% retracement level of $1,690 will act as the key support area, followed by a 23.6% retracement level of $1,600. According to the weekly and daily RSI, the index is currently trading at 43 and 45, respectively, implying further downside if the RSI breaks key support levels.
Trade Gold options on DTrader and CFDs on Deriv MT5 Financial account.
EUR/USD
Earlier this week, EUR/USD broke through the key support area of 1.16 to make a new yearly low. Across Europe, economic data came in weaker than expected, affecting the EUR/USD pair. According to weekly charts, the pair is weak; however, on a daily chart, the RSI suggests a short-term retracement before the pair continues to decline. In terms of support, the prices could retrace to their previous 1.16 level, followed by a weekly 61.8% retracement level of 1.17. Below that, a 50% retracement level of 1.15 could provide some support.
Trade EUR/USD options on DTrader and CFDs on Deriv MT5 Financial and Financial STP accounts.
NASDAQ — 100
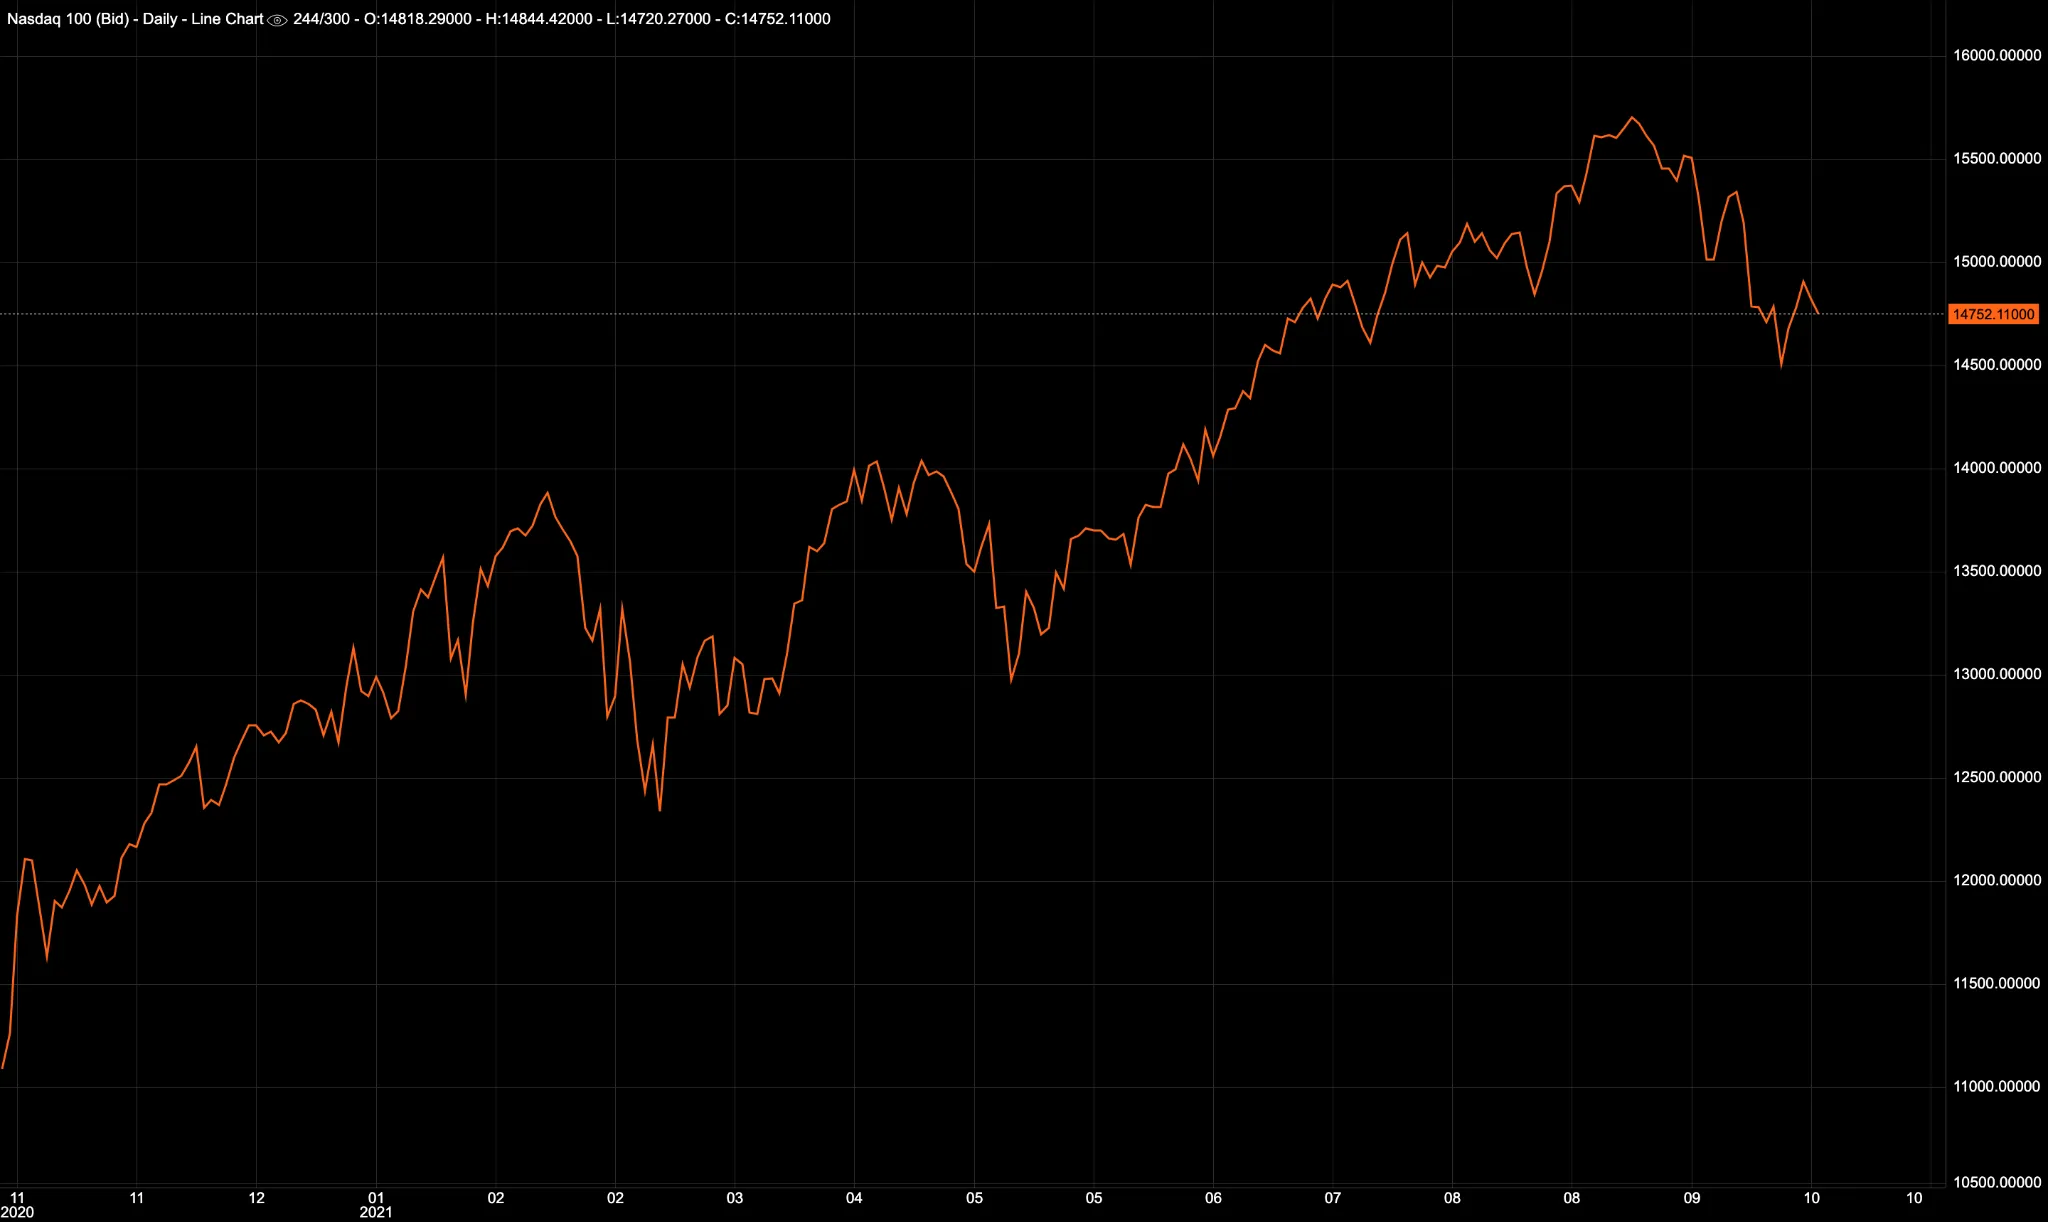
After a correction of almost 6% in the month of September, the US Tech Index is moving range bound. A rising US $ Index and the treasury yield is putting pressure on the equities. The upcoming FOMC minutes may help the Index determine its next move. In the short term, it has support near $14,400; any break below that might open the door for further declines to levels as low as $14,000. On the other hand, any sustained move above $15,000 could attract further bullish momentum.
Trade US Tech Index options on DTrader and trade CFDs on Deriv MT5 Financial accounts.

Weekly market report – 08 Nov 2021
Gold fluctuated while the British pound had a rough week. Get the details in our weekly market report
XAU/USD — Gold
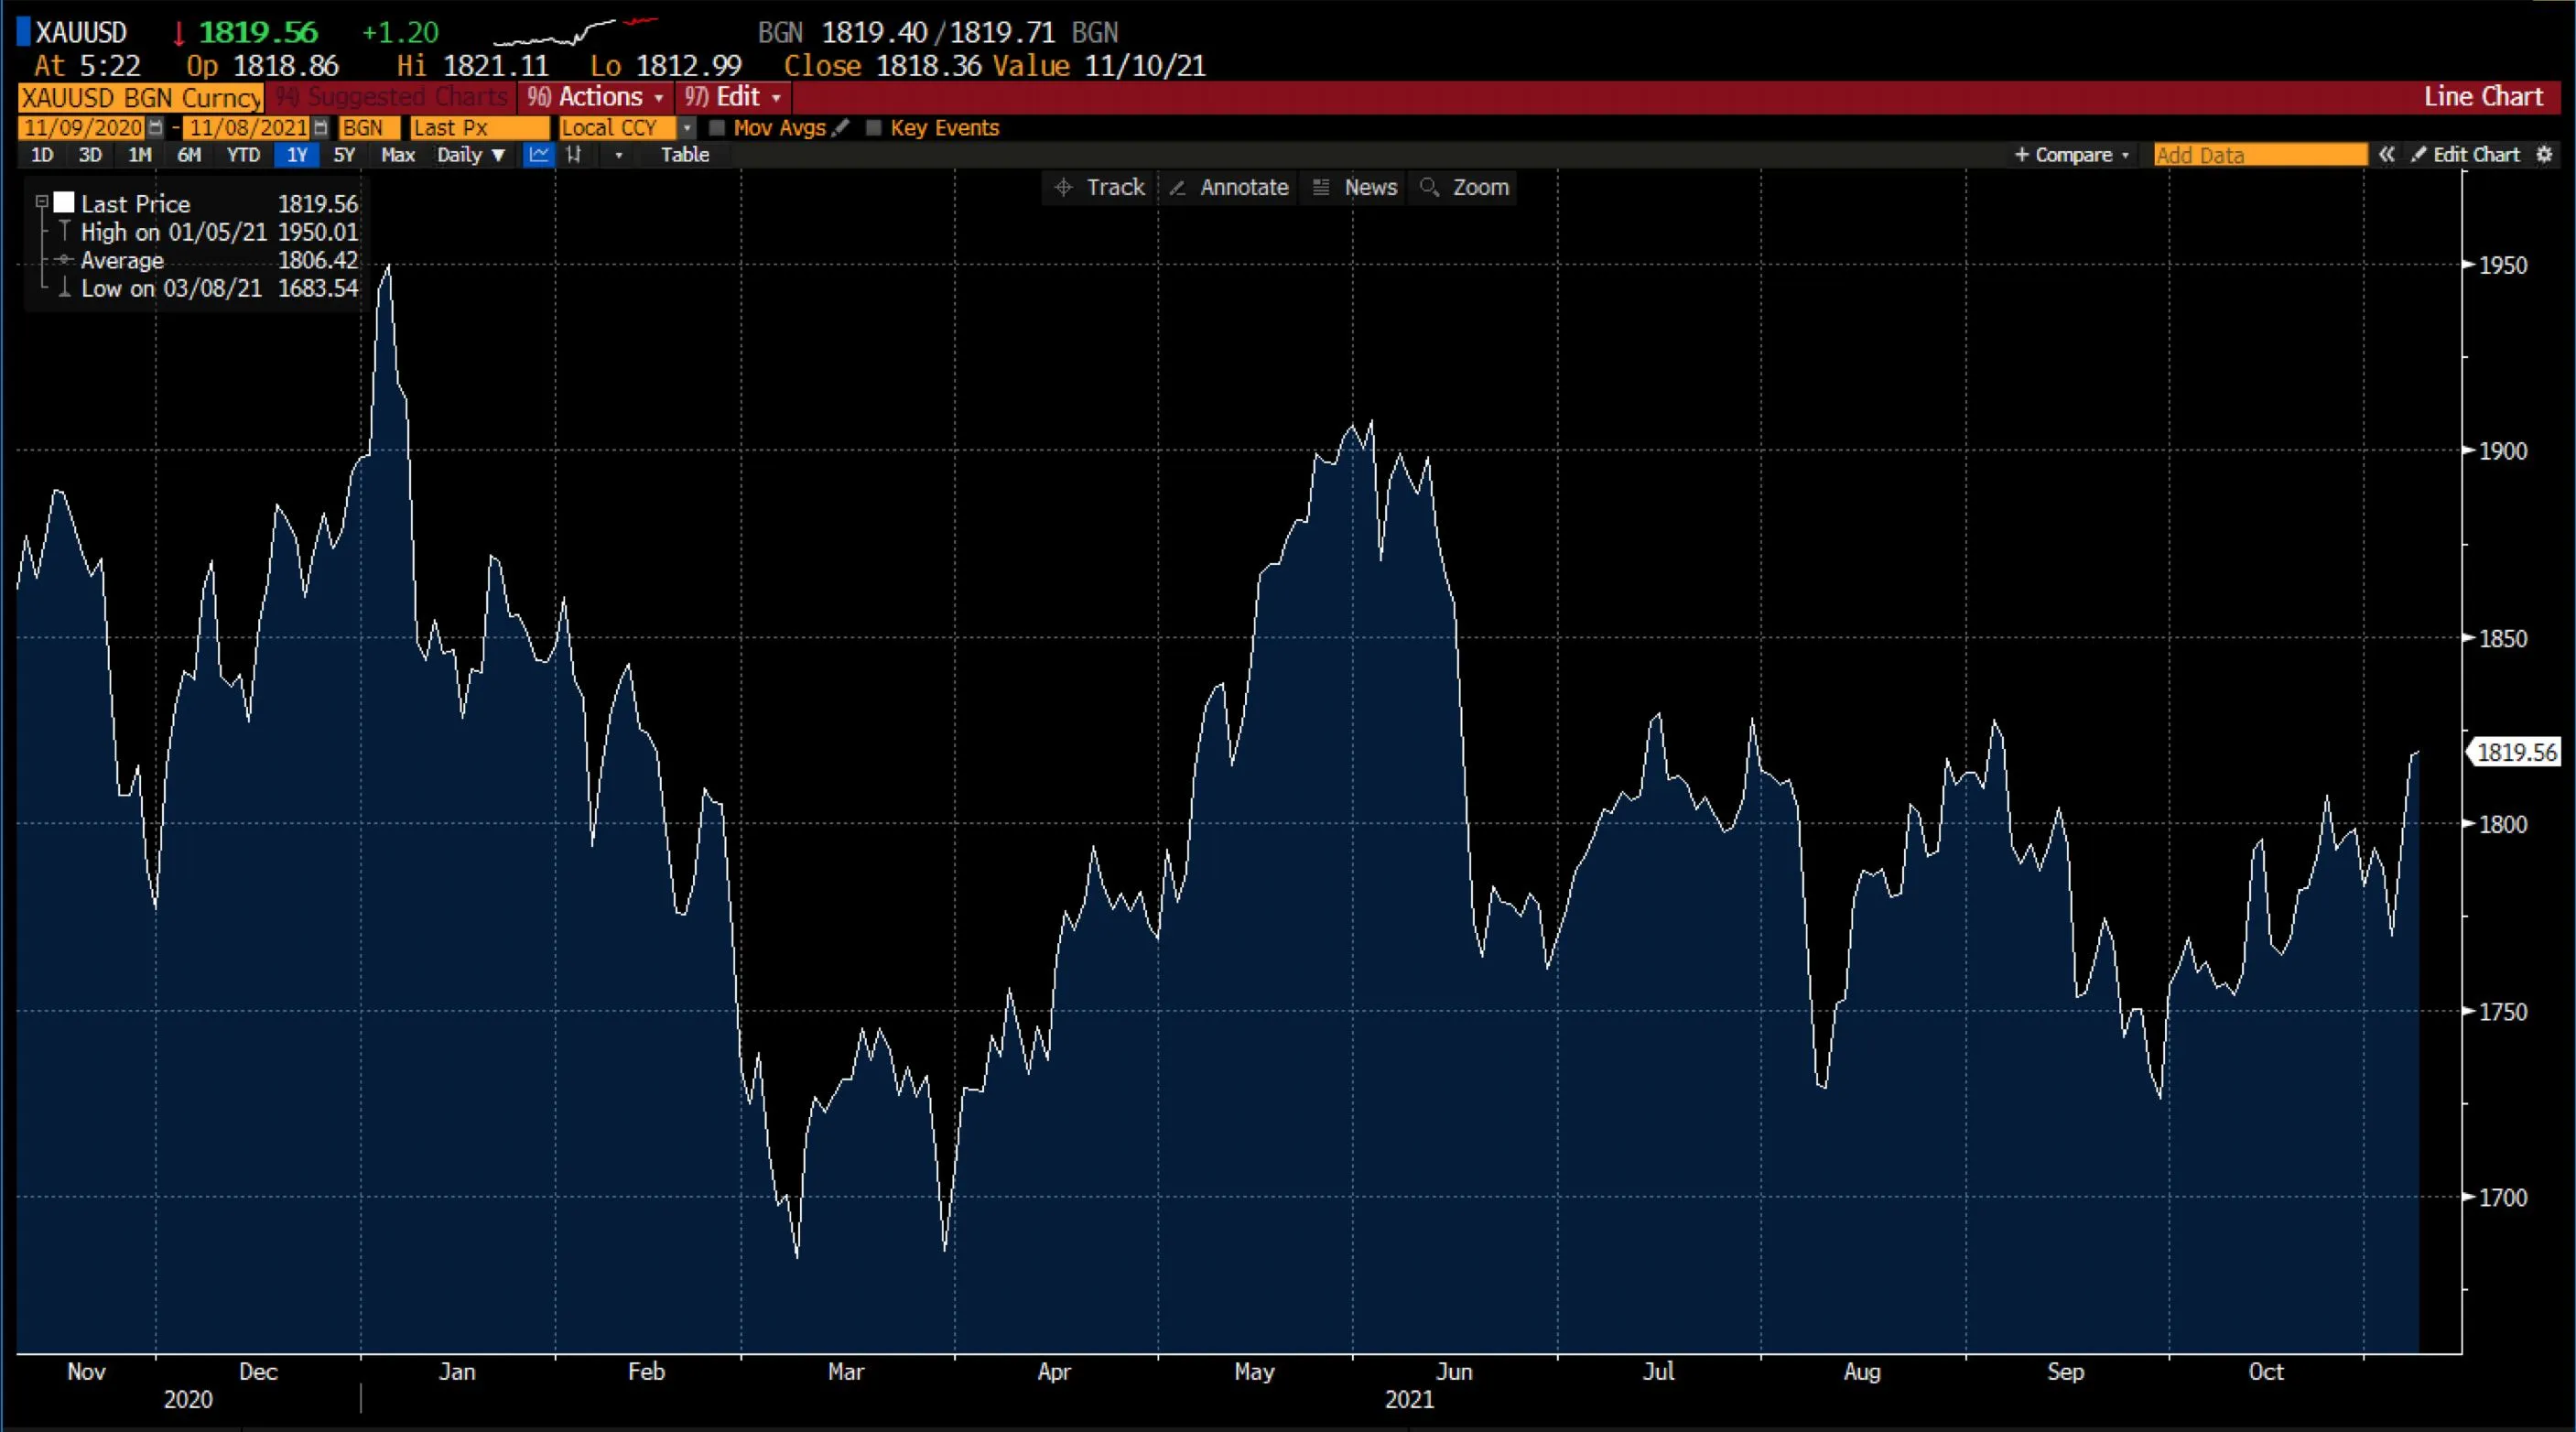
Gold fluctuated throughout last week but closed on the higher side at the end of it. The ISM Manufacturing data released on Monday, 1 Nov 2021, was revealed at 60.8 (vs forecast of 60.5), compared to 61.1 in September. However, gold ended up on the positive side ahead of the FOMC meeting as no interest rate hike was expected.
The federal funds remained unchanged at 0%-25% and, in a unanimous decision, the federal reserve decided to taper asset purchases by around $15 billion a month. Following this announcement, the 10-year Treasury yield soared up, leading to a fall in gold, settling at around $1,763.90. On Thursday, 4 Nov 2021, gold managed to pull back amidst the fall in Treasury yields. The 2-year yield dropped by 6 points to 0.48%, and the 10-year yield dropped by 8 points to 1.52%. On Friday, 5 Nov 2021, the Non-farm Payrolls report was way above the forecast (531k actual vs 450k forecast), the 10-year yield went below 1.5%, with gold having an upward momentum at the end of the day ($1,818.36). Investors will keep an eye on the Treasury yields, and if it stays the same or goes down even further, gold would continue its upward momentum until and unless the yields rebound. In terms of economic events, the Consumer Price Index data is scheduled for the week (0.5% forecast vs 0.4% previous), along with the Producer Price Index (0.6% forecast vs 0.5% previous) and Initial Jobless claims (266k forecast vs 269k previous).
Trade Gold options on DTrader and CFDs on Deriv MT5 Financial account.
GBP/USD
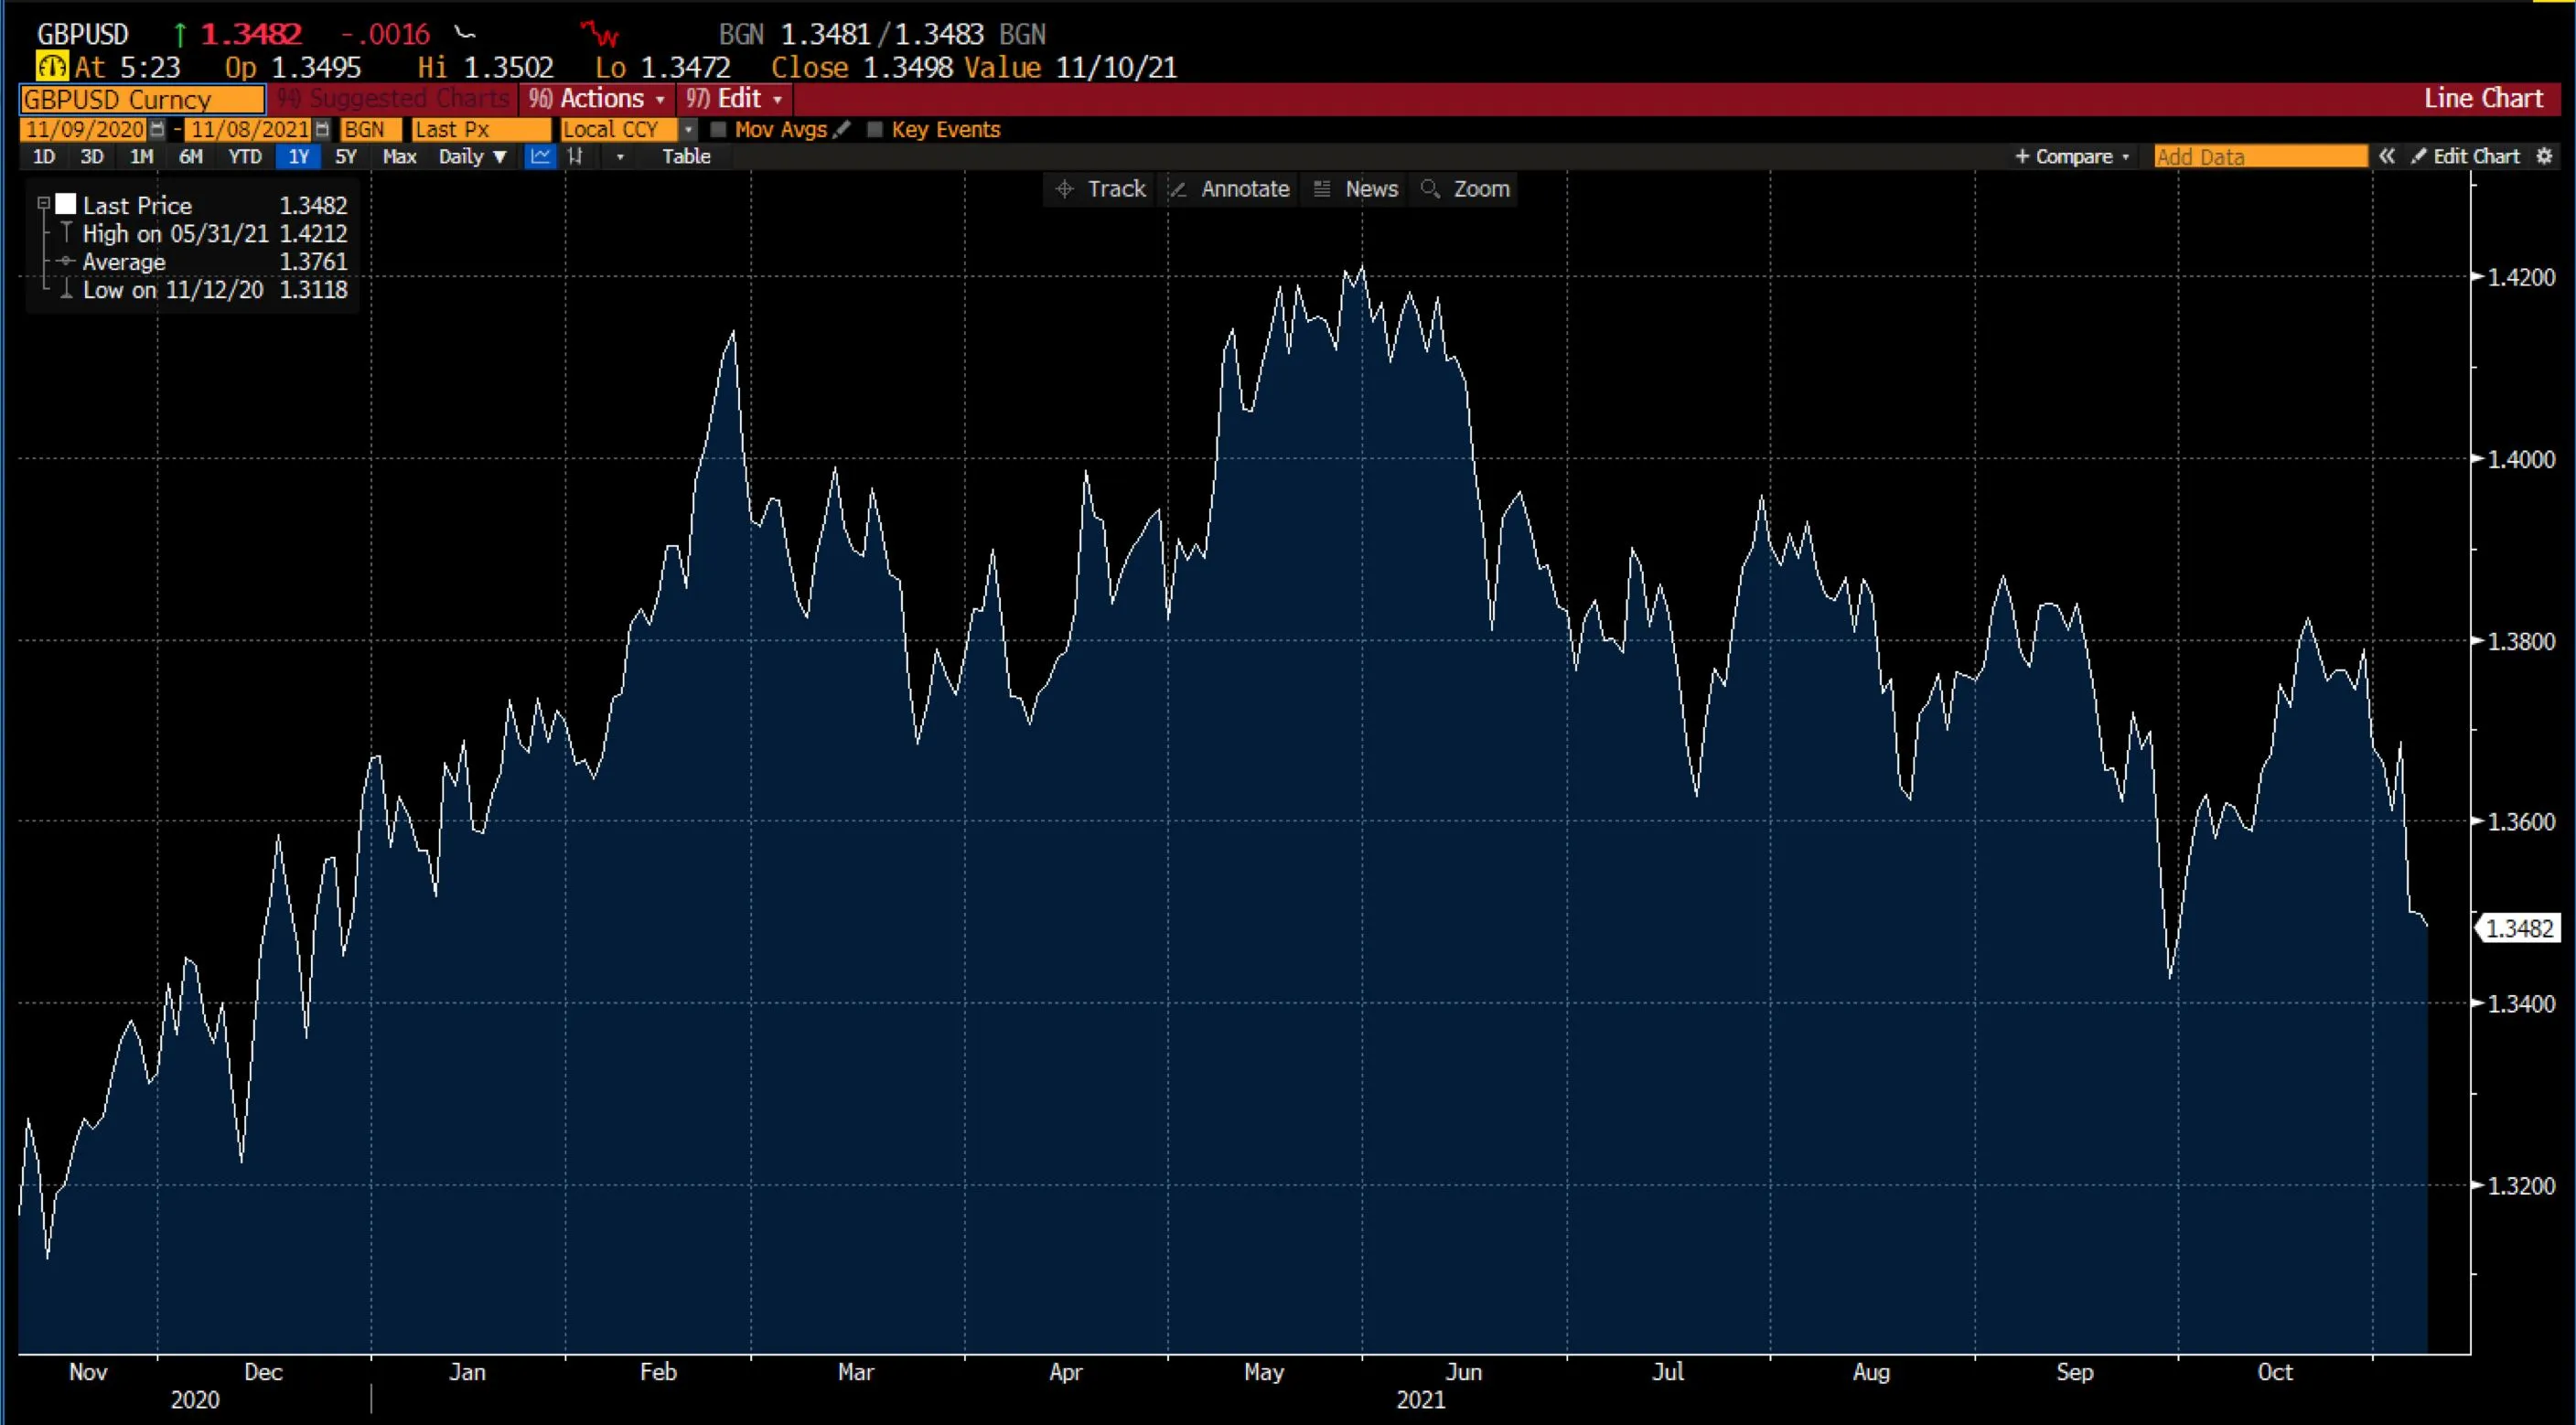
It was a rough week for the British Pound. The market reacted negatively to the Bank of England's decision to keep the interest rate unchanged. On the other hand, the Federal Reserve decided to taper asset purchases by around $15 billion a month. However, FOMC Chairman Jerome Powell emphasized that the rates would not be hiked immediately once the tapering is concluded. In addition to the above, the economic indicators for the US were mostly positive – ISM Manufacturing Data 60.8 actual vs 60.5 forecast, Non-farm Payroll 531k actual vs 450k forecast. This week's main economic events for USD are the Producer Price Index (0.6% forecast vs 0.5% previous), Consumer Price Index (0.5% forecast vs 0.4% previous), and Initial Job Claims (266k forecast vs 269k previous). For GBP, the main focus would be the GDP figures on Thursday, 11 Nov 2021, and whether these figures justify the reason behind the unchanged interest rates by the Bank of England.
Trade GBP/USD options on DTrader and CFDs on Deriv MT5 Financial and Financial STP accounts.
BTC/USD

Bitcoin has been moving range-bound ever since it made a lifetime high near the $66,980 level 3 weeks ago. Last week, it managed to close just above $62,000. While the momentum is bullish, bulls are unable to cross the lifetime high. Technically, it has support near the 78.6% retracement level, which is approximately $57,200, followed by a 61.8% retracement level of roughly $51,000. At the same time, on the higher side, if the prices manage to cross the lifetime high, the next target would be the 127.2% retracement level of around $75,000.
Trade BTC/USD options on DTrader and CFDs on Deriv MT5 Financial and Financial STP accounts.
US indices

The Dow Jones Industrial Average, the S&P 500 Index, and the Nasdaq Composite all reached record highs as stocks posted impressive weekly gains. The Federal Reserve policy meeting, favourable October job reports, and strong earnings contributed majorly towards the rise in equities. The US economy created 531k jobs in October, which beat the expected mark of 450k. The actual jobs created have been beating estimates for the last 3 months, with the unemployment rate at another low of 4.6%. Investors' sentiments are heading in a positive direction for equities, and economic recovery as the wave of the delta variant has eased with Pfizer releasing a study of its COVID-19 antiviral drug, and suggesting it is successful in combating the illness. This week's focus is more on the inflation data (Producer Price Index (0.6% forecast vs 0.5% previous), Consumer Price Index (0.5% forecast vs 0.4% previous)). Strong economic data will continue the upward trend for this week.
Trade US indices on DTrader and CFDs on Deriv MT5 Financial and Financial STP accounts.

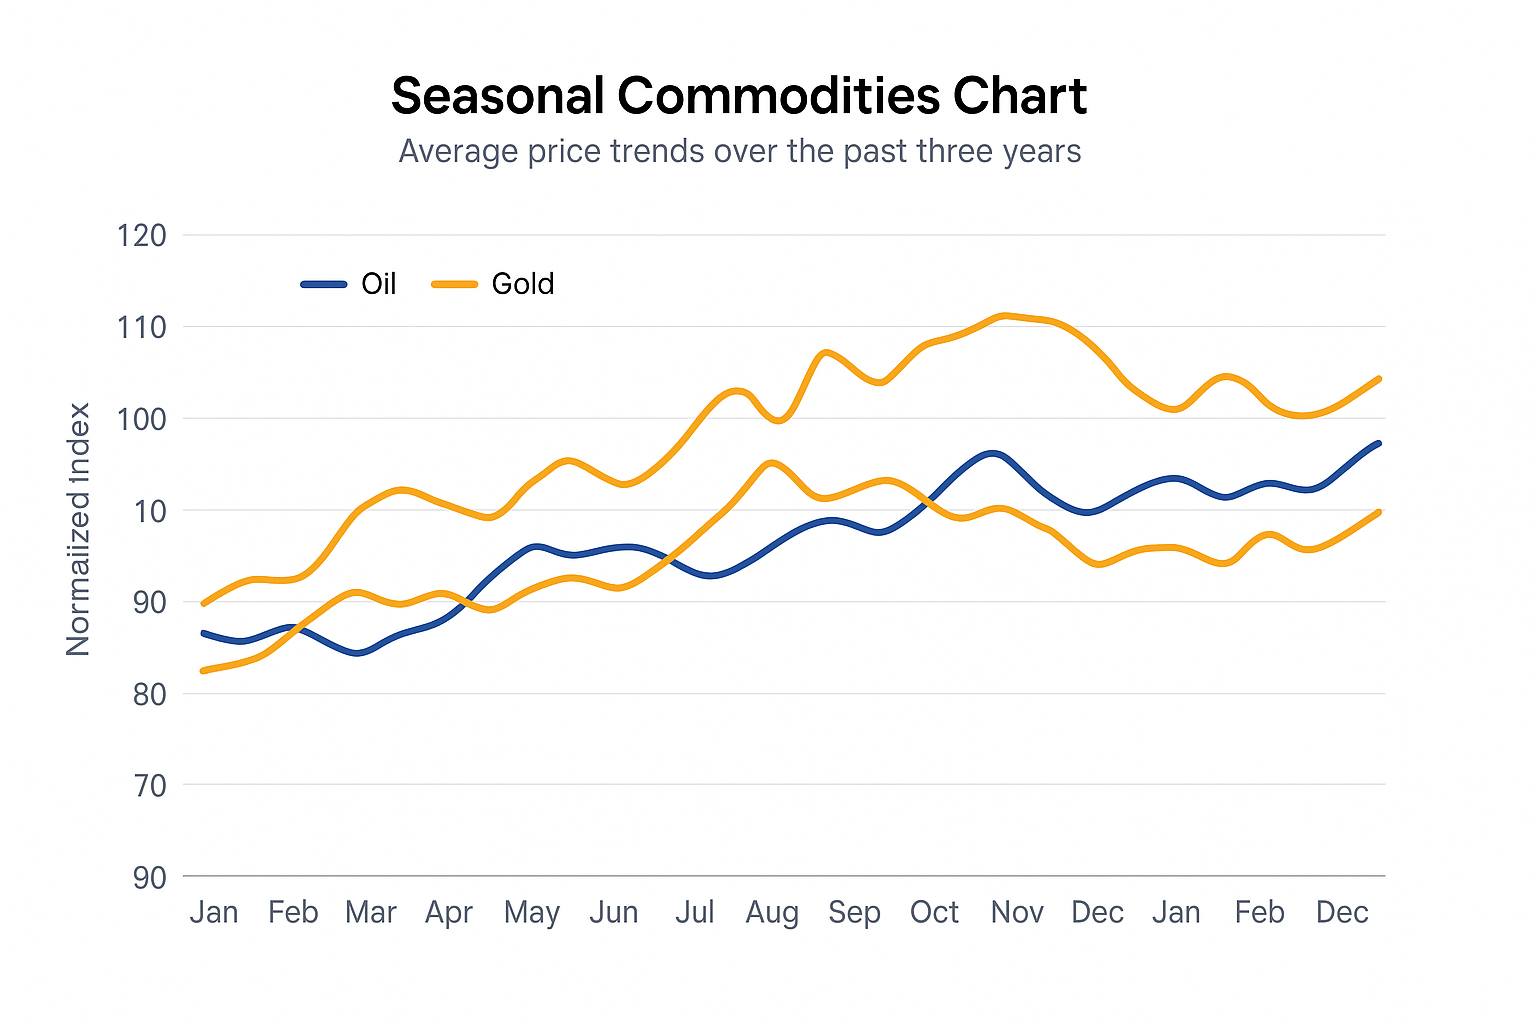
How to trade commodities on Deriv
Find out what commodities are, the different types in the market, and the most popular ones to trade online.
Commodities trading on Deriv offers traders exposure to price movements in energy, metals, and selected soft commodities through two main instruments: contracts for difference (CFDs) and digital options. In 2026 and beyond, Deriv provides a suite of platforms—Deriv MT5, Deriv cTrader, Deriv Trader, SmartTrader, Deriv Bot, and Deriv GO—to support various trading styles. CFDs allow flexible position management with stops, partials, and trailing, while options offer fixed-risk contracts based on price direction or level outcomes.
Quick summary
- Commodities like oil and gold react to supply, demand, and macroeconomic factors.
- CFDs suit traders who manage positions over hours or days.
- Digital options are often used by traders to express short-term or level-based ideas, with predefined risk per contract.
- Consistent position sizing and awareness of event risk support responsible trading.
How to trade commodities on Deriv
CFDs (Deriv MT5, Deriv cTrader)
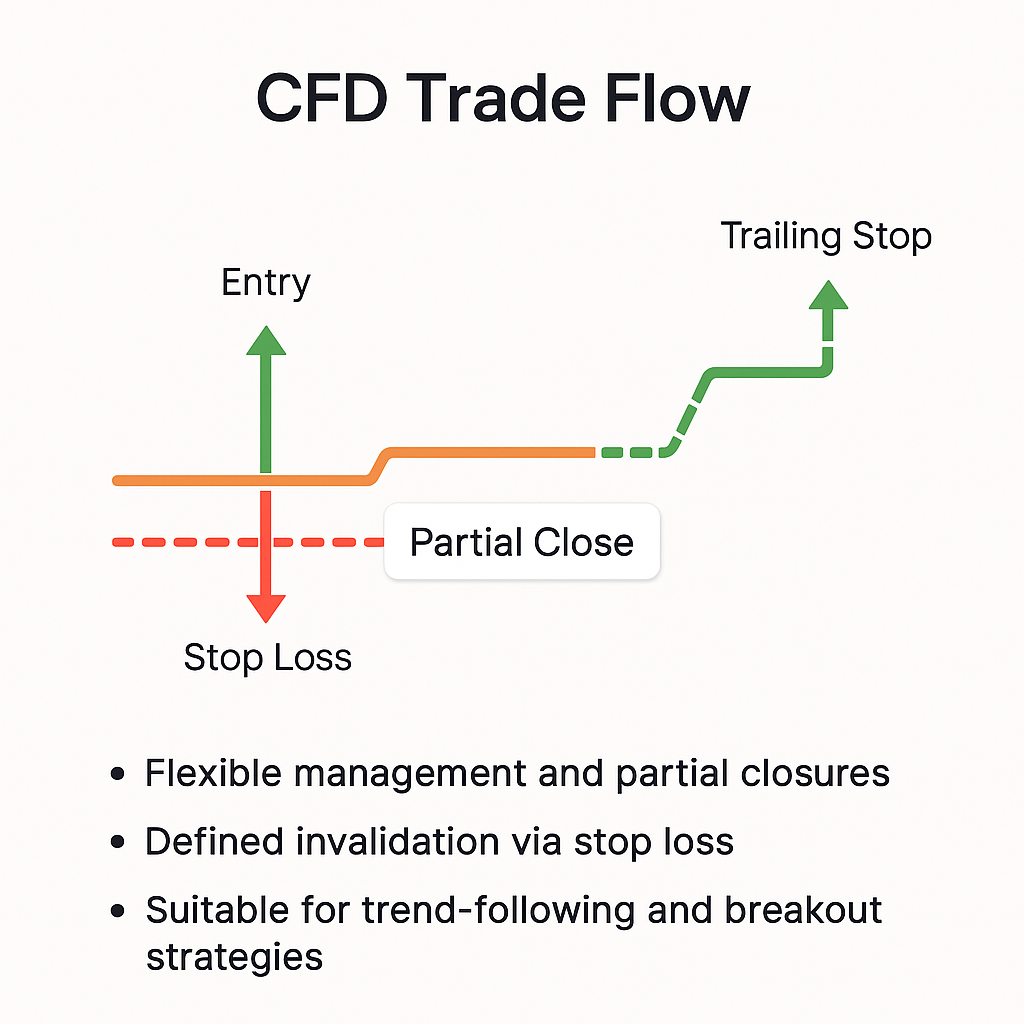
You trade price exposure, not physical goods. CFDs let you open-endedly manage trades: define risk with stop losses, scale in gradually, take partial profits, and trail winners.
Benefits:
- Flexible management and partial closures.
- Defined invalidation via stop loss.
- Suitable for trend-following and breakout strategies.
A practical example: A trader analysing US Oil (WTI crude) identifies a breakout above resistance. On Deriv MT5, they place a buy stop order slightly above that level, set a defined stop below the previous swing, and use Deriv GO alerts to manage a trailing stop while monitoring risk. This structured method supports consistency across sessions, though outcomes remain dependent on market conditions.
Risk vs reward setup checklist:
- Identify a clear technical trigger (trend or level).
- Calculate position size based on stop distance.
- Predefine partial profit zones.
- Trail stops as structure evolves.
According to a Deriv analyst, in 2026, the flexibility of CFDs gives traders the ability to adapt to intraday volatility while maintaining structured risk control.
“It’s not about predicting every move. It’s about defining risk boundaries.”
Digital options (Deriv Trader, SmartTrader, Deriv Bot)
You select directional or level-based contracts with predefined duration and stake. Rise/Fall captures short-term direction; Higher/Lower and Touch/No Touch focus on level outcomes.
Benefits:
- Fixed maximum loss.
- Simple directional and level-based expressions.
- Useful for volatile or event-driven periods.
Additional guidance: Deriv’s digital options are ideal for structured learning. Beginners can start with Rise/Fall to understand directional behaviour, then progress to Higher/Lower for level-based forecasting. As they gain confidence, they can explore Touch/No Touch contracts to test precision in predicting volatility.
Which Deriv platform suits your trading style?
CFDs vs options: Which fits your strategy?
Oil (US Oil / UK Brent Oil)
- Options: Traders commonly use Rise/Fall for directional moves around events like OPEC+ headlines or inventory reports while Touch/No Touch for “tag or avoid” scenarios. Typical durations: 10–30 minutes intraday, up to 2 hours for session outcomes.
- CFDs: Typical strategies are breakouts or pullbacks. Both allow placing stops beyond true invalidation; take partial profits at 1R, and trail the remainder. Pros mainly trade them during London–New York overlap for stronger liquidity.
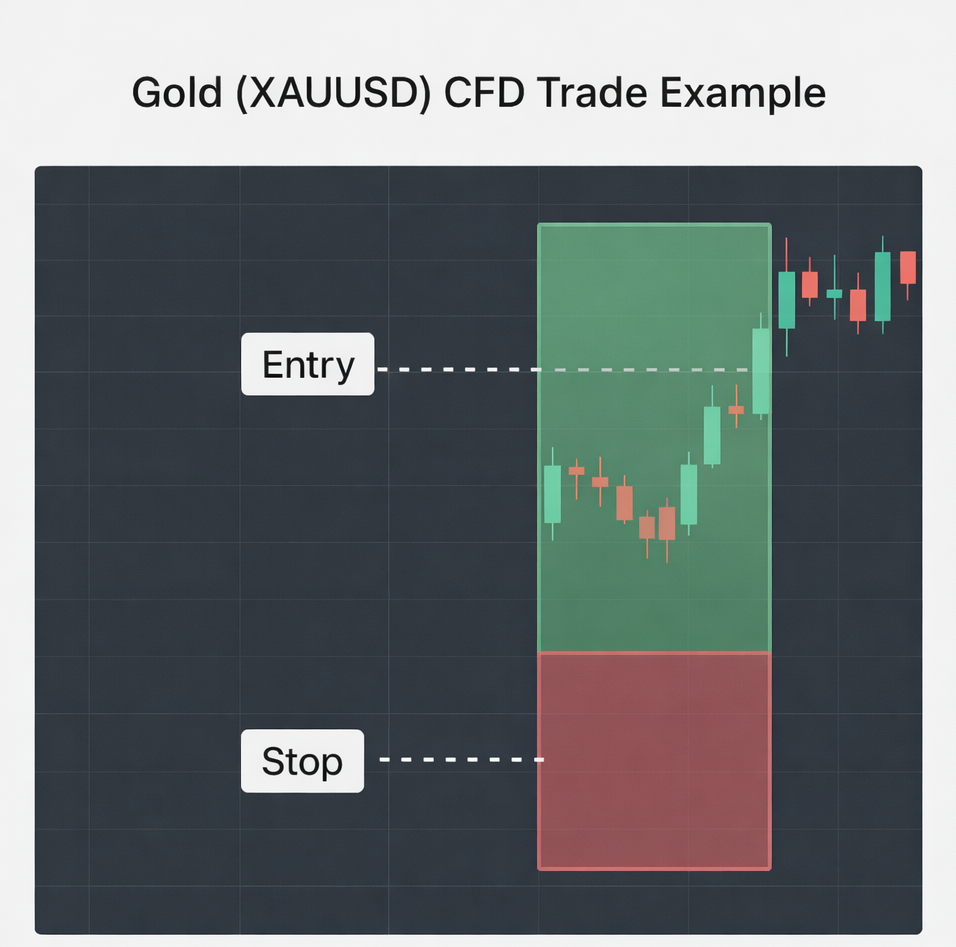
Gold (XAUUSD)
- Options: Most traders use Rise/Fall in short momentum bursts or Higher/Lower for session-end level tests. Often preferred during event weeks (e.g., central bank announcements), where defining maximum risk is a priority.
- CFDs: Pros trade structured pullbacks in uptrends or range edges with micro size. Take partials, trail winners, and use alerts on Deriv GO for discipline.
A useful framework: CFDs suit traders who want active control and incremental exits, while options suit those who prefer defined risk and time-boxed outcomes. During trending phases, CFDs provide flexibility; in event-driven markets, options limit exposure.
An IMF market report mentions:
“Gold remains sensitive to rate expectations and currency trends. The ability to define risk through options trading allows individual traders to participate in macro themes without leverage-induced exposure.”
Natural gas
- Options: Traders commonly use Touch/No Touch during range-bound conditions or short-lived momentum phases, particularly when volatility is elevated. Stakes are typically kept small due to the asset’s sharp and unpredictable price movements.
- CFDs: CFDs are usually traded only when market structure is clear and volatility stabilises. Traders often use wider stops relative to the prevailing range and reduce position size to account for abrupt price swings.
Soft commodities (e.g., cocoa)
- Options: Most traders use small-stake Rise/Fall contracts around clearly defined levels during periods of supply-driven volatility, such as weather disruptions or production news.
- CFDs: CFDs are generally used during quieter market conditions, where price action remains range-bound. Traders often apply mean-reversion approaches, manage positions intraday, and avoid holding exposure overnight due to swap costs and headline risk.
Comparing CFDs vs options in different markets
Adding further depth, experienced traders often combine both instruments. For example, a trader might open a CFD position for a longer trend while simultaneously using a No Touch option as insurance during volatile events. This hybrid approach keeps exposure balanced while maintaining participation in the broader market move.
Why are Deriv platforms important for commodities markets in the future?
Deriv’s ecosystem is built for adaptability. Traders can analyse markets on Deriv MT5, automate a portion of their strategy on Deriv Bot, and monitor progress using Deriv GO. This connected structure ensures traders remain in control, regardless of market conditions or device access.
What influences commodities markets in the future?
Supply and demand: The U.S. Energy Information Administration (EIA) reports often trigger oil volatility. Large draws have historically lifted prices; builds have pressured them.
Weather & geopolitics: OPEC+ policies, wars, and transport disruptions affect both energy and agricultural markets. During such events, market conditions often become more volatile, leading many traders to reassess exposure and favour instruments with predefined risk characteristics.
Macro & currency: Gold responds to interest rate shifts and the U.S. dollar. As global rate cycles evolve, traders opt for options remain useful for defined risk exposure during uncertain macro periods.
Emerging trends: Renewable energy developments and industrial demand from Asia are shaping commodity prices, especially metals. Traders on Deriv can use CFDs to capture these longer-term shifts or options to isolate event risk.
A Deriv risk strategist explains:
“Diversification between CFDs and options offers a balanced way to navigate volatility. In uncertain macro conditions, traders can stay active without taking on excessive directional risk.”
Seasonality: Gas demand peaks in winter; agricultural prices respond to crop cycles. Professional traders treat seasonality as context, not a signal.
Future outlook: As data analytics and AI trading tools become more integrated, Deriv aims to enhance pattern recognition and sentiment tracking within its platforms, giving traders clearer macro insight and precision in execution.
What trading risks and strategies should you know?
- Volatility spikes and gaps: During major events, options are commonly discussed for their defined risk, while CFDs are often associated with trend-driven market conditions once structure becomes clearer.
- Leverage risk on CFDs: CFD outcomes are closely tied to position size relative to stop distance, which is why leverage is often discussed alongside sizing discipline and clearly defined invalidation levels.
- Holding costs: CFD positions held beyond rollover can involve swap charges, so holding time and contract specifications are commonly reviewed when traders evaluate longer-duration exposure.
- Slippage: In fast markets, execution can differ from intended levels, which is why pending orders and smaller sizes are frequently discussed; with options, the contract cost is known upfront, although outcomes still depend on market movement.
- Correlation risk: Commodity markets can move together under shared catalysts, so correlated exposures (e.g., US Oil and UK Brent Oil) are often discussed as a portfolio-level concentration risk.
- Model risk: Automated approaches can degrade when market regimes change, which is why simpler rule sets with fewer filters and clearer constraints are commonly viewed as easier to monitor and maintain.
- Psychological risk: Behavioural errors such as overtrading or loss-chasing are widely discussed; consistent stake sizing for options and pre-planned management rules for CFDs are often used to reduce decision pressure.
- Operational errors: Outcomes can be affected by contract selection choices (e.g., duration, barrier placement, or order type), so matching the contract parameters to the underlying idea is commonly emphasised in execution planning.
Before placing a trade checklist:
- Confirm news and event calendar.
- Verify position size vs. account equity.
- Set stop-loss and target before execution.
- Limit correlated exposure across assets.
- Review emotional state and avoid impulse trades.
Expanding risk management beyond single trades, traders often look at account-wide exposure and how correlations between instruments can influence overall drawdowns. Margin usage and daily loss limits are commonly reviewed as part of broader risk oversight. Consistent review of margin usage and daily loss thresholds forms the backbone of professional risk discipline.
How can beginners approach commodities trading responsibly?
- Beginners can start by practising with one metal (gold) and one energy (oil) only.
- CFD risk per trade: 1–2% of equity; option stakes 0.5–1%.
- Avoid stacking correlated exposures.
- Conduct weekly 30-minute reviews.
What’s next for commodities trading on Deriv?
Deriv continues to refine its trading technology, introducing more automation tools, predictive insights, and improved mobile performance. As global markets evolve, traders can expect seamless integration between risk control tools, AI-backed analytics, and platform upgrades supporting faster execution and contextual alerts.
In addition, Deriv plans to expand educational support, offering interactive learning modules and case-based lessons through the Deriv Academy. These resources aim to help traders understand macroeconomic drivers, risk mechanics, and practical trade structuring across multiple commodities.
Key takeaways
Commodities let traders express views on global supply, demand, and macro shifts. On Deriv, CFDs provide flexible management, while digital options define risk precisely. Start with a demo, keep stakes small, and refine one consistent approach at a time.

How to trade multipliers on Deriv Trader
Multipliers offer traders the upside of increased market exposure with a smaller capital. But on Deriv, it also offers the advantage of limiting your losses to your stake amount with its automatic stop-out function.
This article was updated on 22 January 2024
Here’s a proposition for traders cautious about leveraged trading and its accompanying risks of increased losses — trade with Deriv multipliers and get all the same benefits but without risking more than your stake (initial trade amount).
Multipliers offer traders the upside of increased market exposure with a smaller capital. But on Deriv, it also offers the advantage of limiting your losses to your stake amount with its automatic stop-out function.
In our previous blog posts, we talked about what multipliers are and the various risk-management features that you can take advantage of when trading them. Here, we’ll go through how to trade multipliers and use its risk management features on Deriv Trader.
How to start trading multipliers on Deriv Trader
Check out this video on how to place your first multipliers trade on Deriv, or go through our step-by-step guide with screenshots below.
Step 1: Log in to Deriv
Log in to your Deriv account.
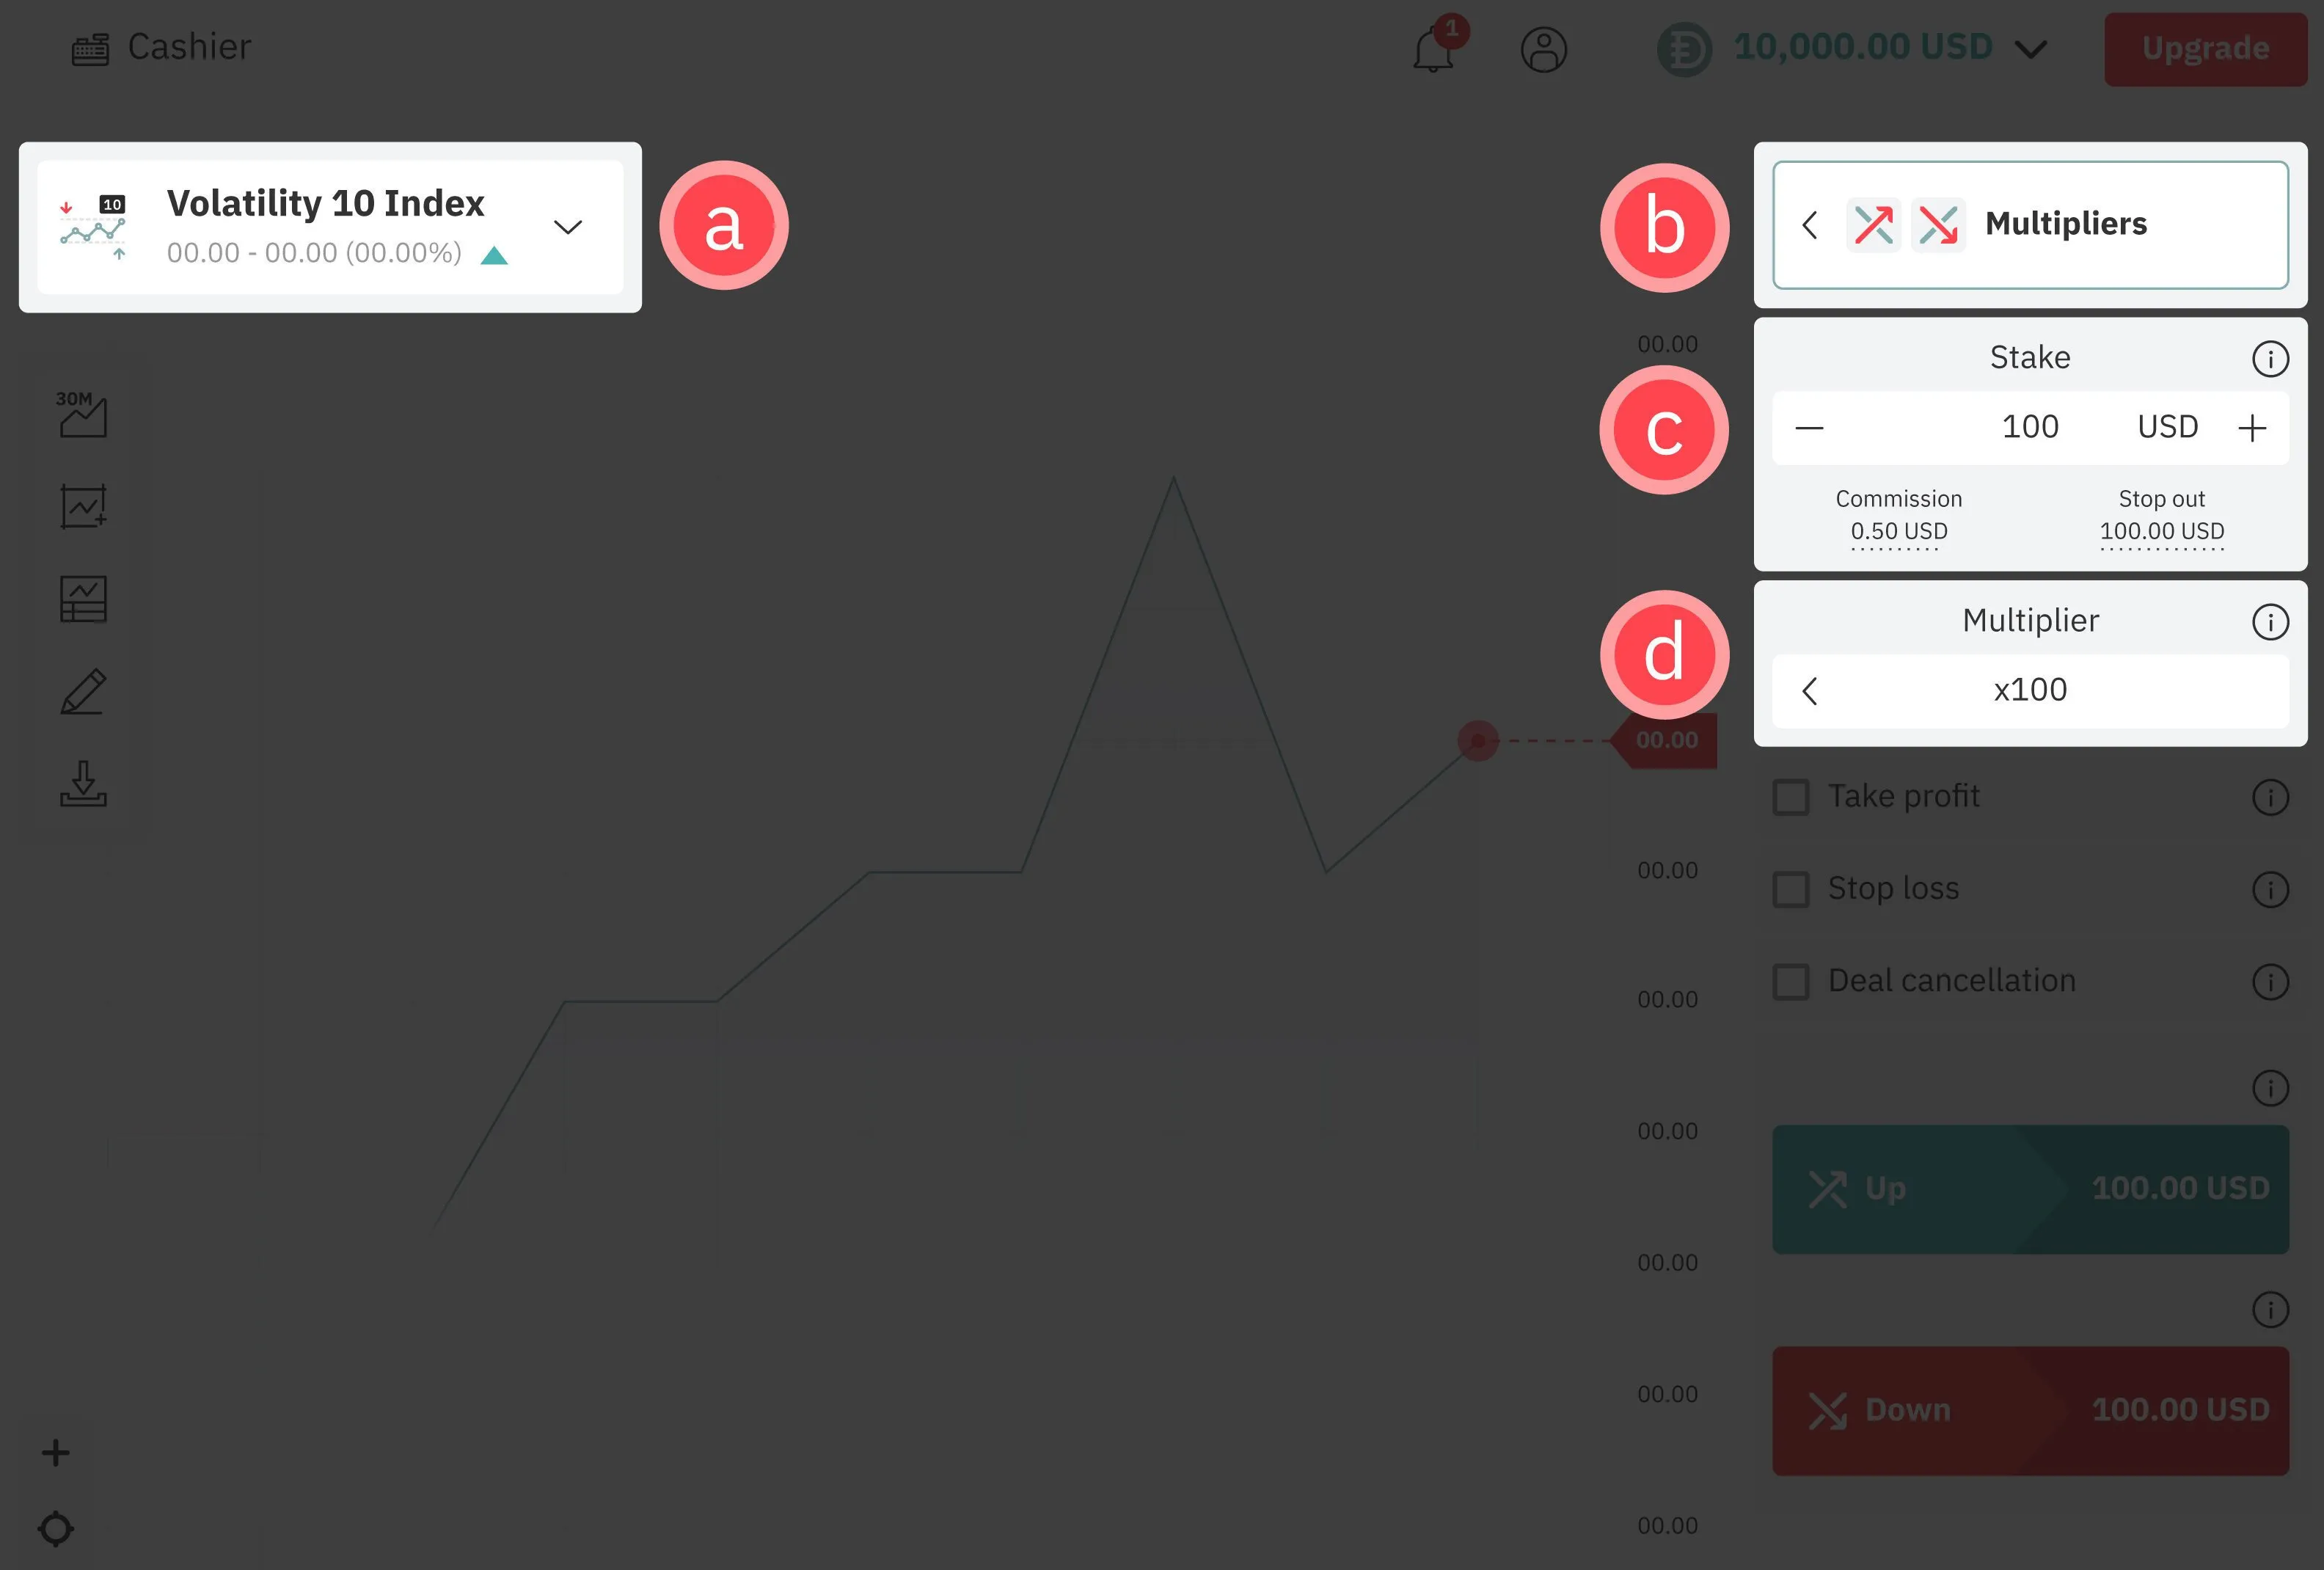
Step 2: Define your trade
On the Deriv Trader trading platform, set up your trade by:
a) Choosing your preferred asset to trade
b) Selecting Multipliers from the trade menu
c) Entering your stake amount
d) Choosing the multiplier value you want to trade with. Your potential profit will be multiplied by this value.*
*If you reside in the EU, your multiplier values are pre-determined based on the asset you are trading.
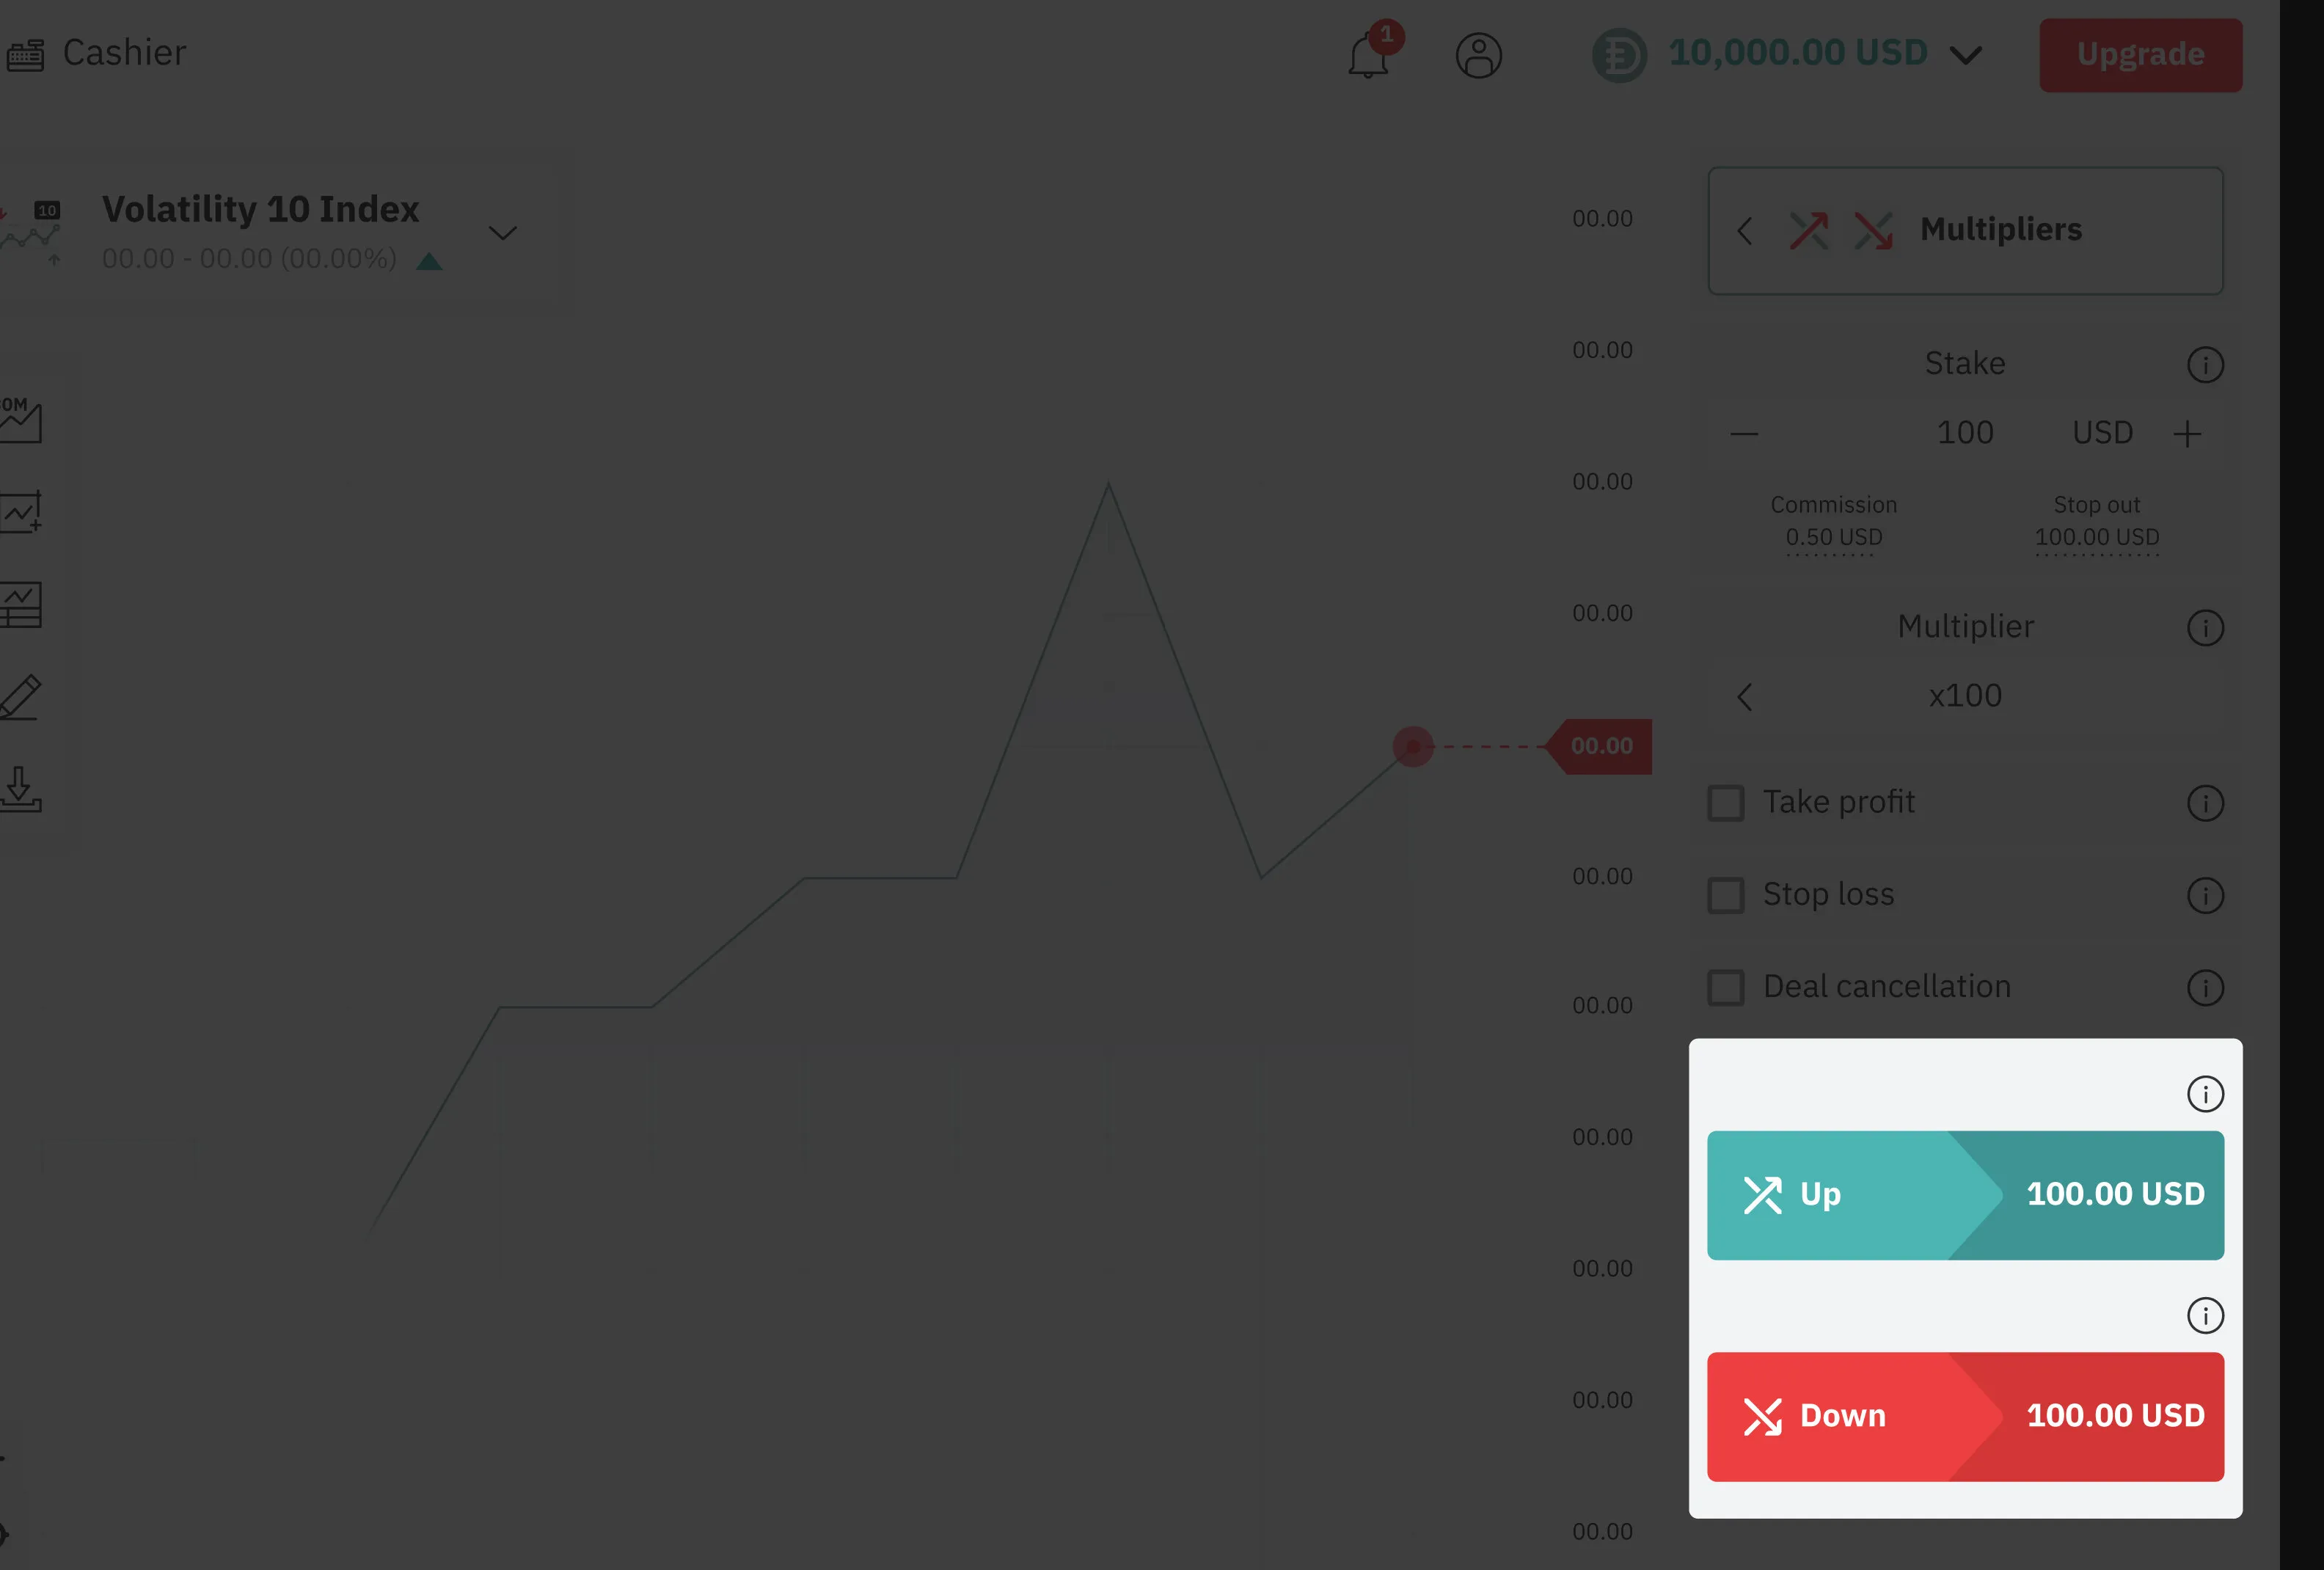
Step 3: Set optional parameters
Manage your risk by setting the take profit, stop loss, and deal cancellation parameters. These features will protect your trades by automatically closing them when your preferred limits are reached.
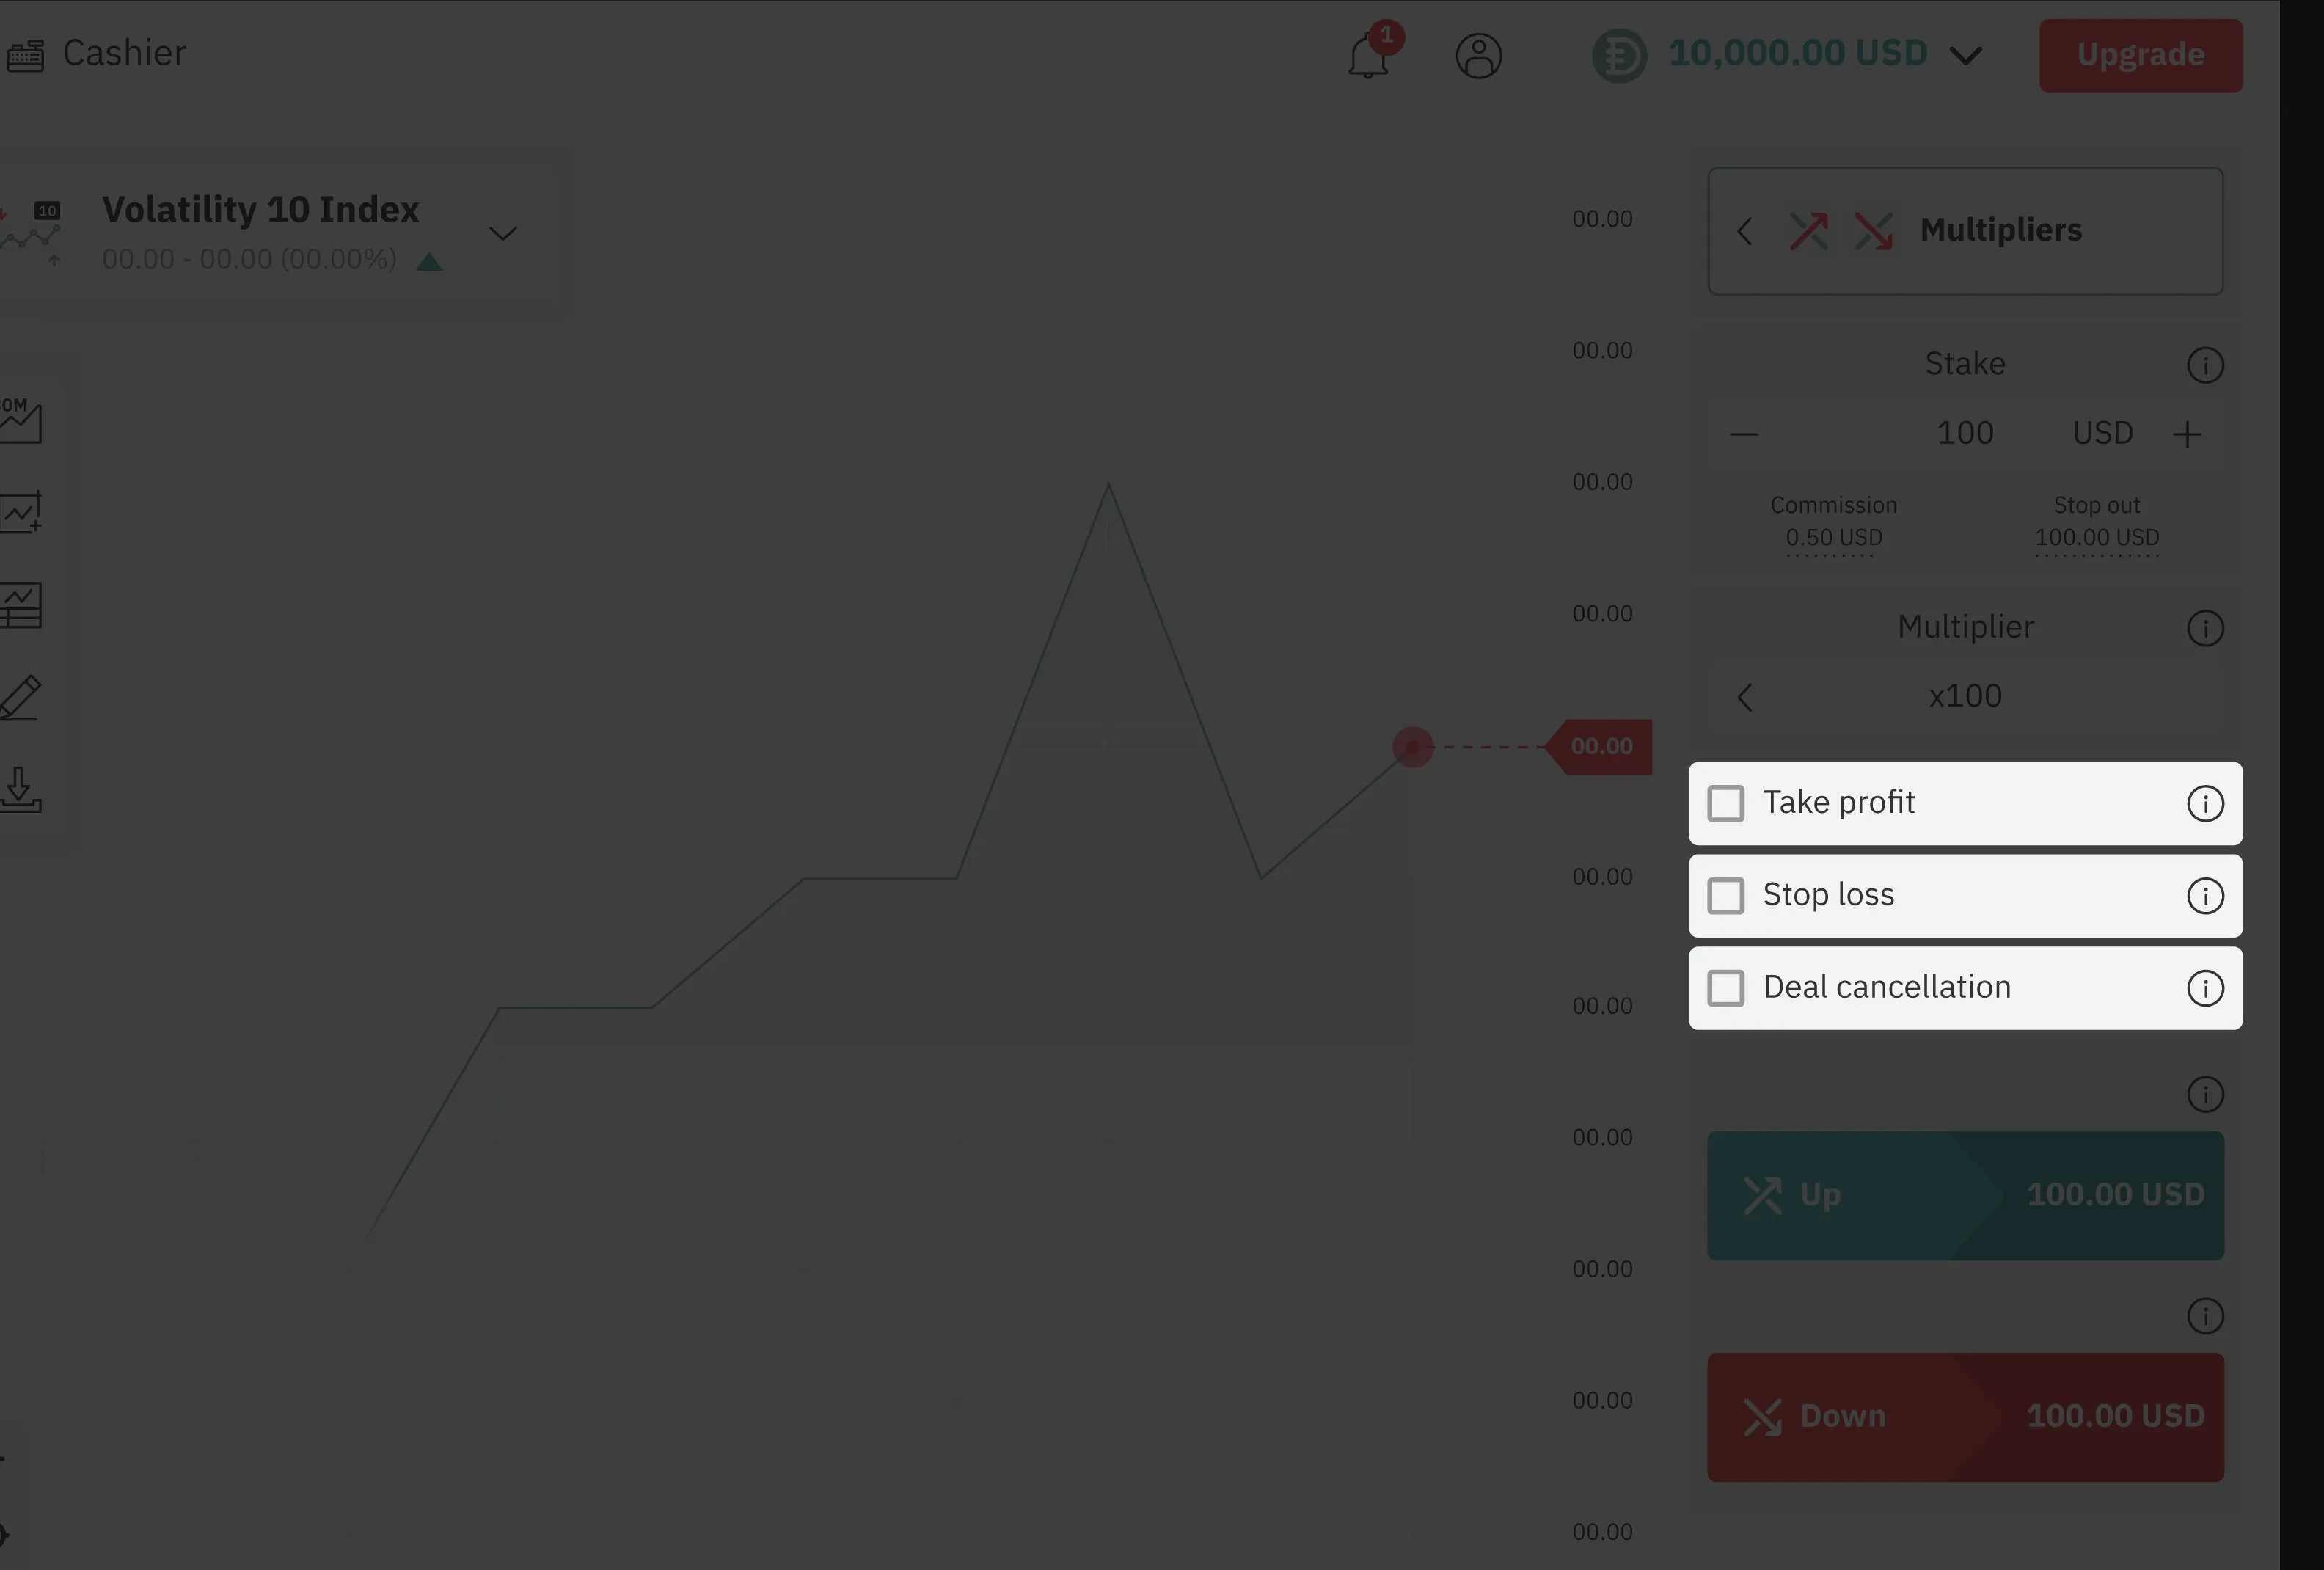
Step 4: Open your trade
To open your trade, choose Up if you think the market will rise, or Down if you think the market will fall. Your trade will stay open until you close it, or if it hits the risk-management parameters you may have set in the previous step.
That’s it! You’re now ready to start trading multipliers with Deriv. Practise trading multipliers risk-free on forex, cryptocurrency, and synthetic indices using a free demo account.

Cryptocurrencies you can buy and trade with on Deriv
In our ‘Trading with crypto: Top 3 myths’ blog post, we discussed how to buy crypto on Deriv and how to start trading with it.
In our ‘Trading with crypto: Top 3 myths’ blog post, we discussed how to buy crypto on Deriv and how to start trading with it. However, which cryptocurrency should you choose? There are thousands of digital coins on the market, and each one has its own features.
At Deriv, we've narrowed down the list of cryptocurrencies available to fund your cryptocurrency account to five major and popular cryptocurrencies. Let's take a closer look at their unique characteristics.
1. Bitcoin (BTC)
Bitcoin is the most well-known and accepted cryptocurrency in the world. The unique features of this digital coin have turned it from being just another coin to exchange into a store of value with high purchasing power — an equivalent of gold in the crypto world.
Just like the famous precious metal, Bitcoin has a limited supply (21 million coins only), and it is also decentralised. The limited supply provides protection from inflation, while the decentralisation protects from the control and influence of governments.
The BTC transaction specifications are:
- Transaction processing time: approximately 30 minutes
- Amount of confirmations: 3 (3x10 minutes each = about 30 minutes)
- Transaction fees: high
2. Ethereum (ETH)
Ethereum was created as an open-source blockchain platform to create, release, and monetise apps, where Ether token served as a payment method. Due to its popularity, it eventually became accepted as a payment currency by merchants and service providers outside the platform.
Today, Ethereum is the second-largest cryptocurrency by market capitalisation. However, experts believe that the value of this digital coin is still underestimated and should be much higher.
The specifications for Ethereum transactions are as follows:
- Transaction processing time: from 1 to 15 minutes
- Amount of confirmations: 6 (6x10 seconds = 1 minute)
- Transaction fees: vary – from very low to very high, depending on network congestion
3. Litecoin (LTC)
Litecoin is widely considered to be the silver to Bitcoin’s gold. It was indeed created to complement Bitcoin as a more accessible and more affordable cryptocurrency. As a result, Litecoin has quickly become a new medium of exchange — used for payments, while Bitcoin transformed into a store of value — an asset that will have purchasing power in the future.
Litecoin has a much larger but still limited supply of 84 million coins and significantly lower transaction fees, which made it the most inexpensive option for cryptocurrency transfers.
The specifications of LTC transactions are:
- Transaction processing time: approximately 30 minutes
- Amount of confirmations: 12 (12x2.5 min each = about 30 minutes)
- Transaction fees: very low
Stablecoins: USDT (OMNI & ERC-20) and USDC
A stablecoin is a type of cryptocurrency that is tied to an asset like USD or gold to stabilise its price. Generally speaking, stablecoin is a digital representation of fiat money.
4. Tether (USDT) OMNI
Tether is by far the largest stablecoin by market cap. Each unit of Tether is backed by the USD with a 1:1 equivalent. However, unlike other cryptocurrencies, Tether is issued and regulated by Tether Limited, which makes it a fully centralised cryptocurrency.
The ‘omni’ part of this digital coin means that Deriv accepts USDT transactions that are proceeded via omnilayer – a software built on top of Bitcoin’s blockchain.
While the ‘erc-20’ part means that the USDT transactions are also processed via the new transport layer based on the Ethereum blockchain.
It gives Tether the security of Bitcoin or Ethereum while letting it operate as an independent cryptocurrency.
The USDT OMNI transaction specifications are:
- Transaction processing time: from 1 to 15 minutes
- Amount of confirmations: 6 (6x10 seconds = 1 minute)
- Transaction fees: vary – from very low to very high (depending on network congestion)
The specifications for ERC-20 (eUSDT) transactions are as follows:
- Transaction processing time: from 1 to 15 minutes
- Amount of confirmations: 6 (6x10 seconds = 1 minute)
- Transaction fees: vary – from very low to very high, depending on network congestion
5. USD Coin (USDC)
The USD Coin is the second-largest stablecoin that is also tied to the USD with a 1:1 ratio but is powered by Ethereum’s blockchain. This coin is also centralised and held by a group of three companies that maintain full reserves of the equivalent fiat currency. USDC is currently the most transparent stablecoin in the crypto world, and it is accepted by hundreds of companies worldwide.
The USDC transaction specifications are:
- Transaction processing time: approximately 30 minutes
- Amount of confirmations: 3 (3x10 min each = about 30 minutes)
- Transaction fees: vary – from very low to very high, depending on network congestion
Now that you know the main differences between these cryptocurrencies, all you have to do is choose your preferred one to fund your Deriv crypto account. Ready to make your choice? Create your cryptocurrency account, buy crypto, and start trading!
Sorry, we couldn’t find any results matching .
Search tips:
- Check your spelling and try again
- Try another keyword