نتائج لـ

EUR/USD outlook: The dollar’s rate-cut reckoning
What began as a quiet Thanksgiving week has turned into the dollar’s steepest weekly decline in four months.
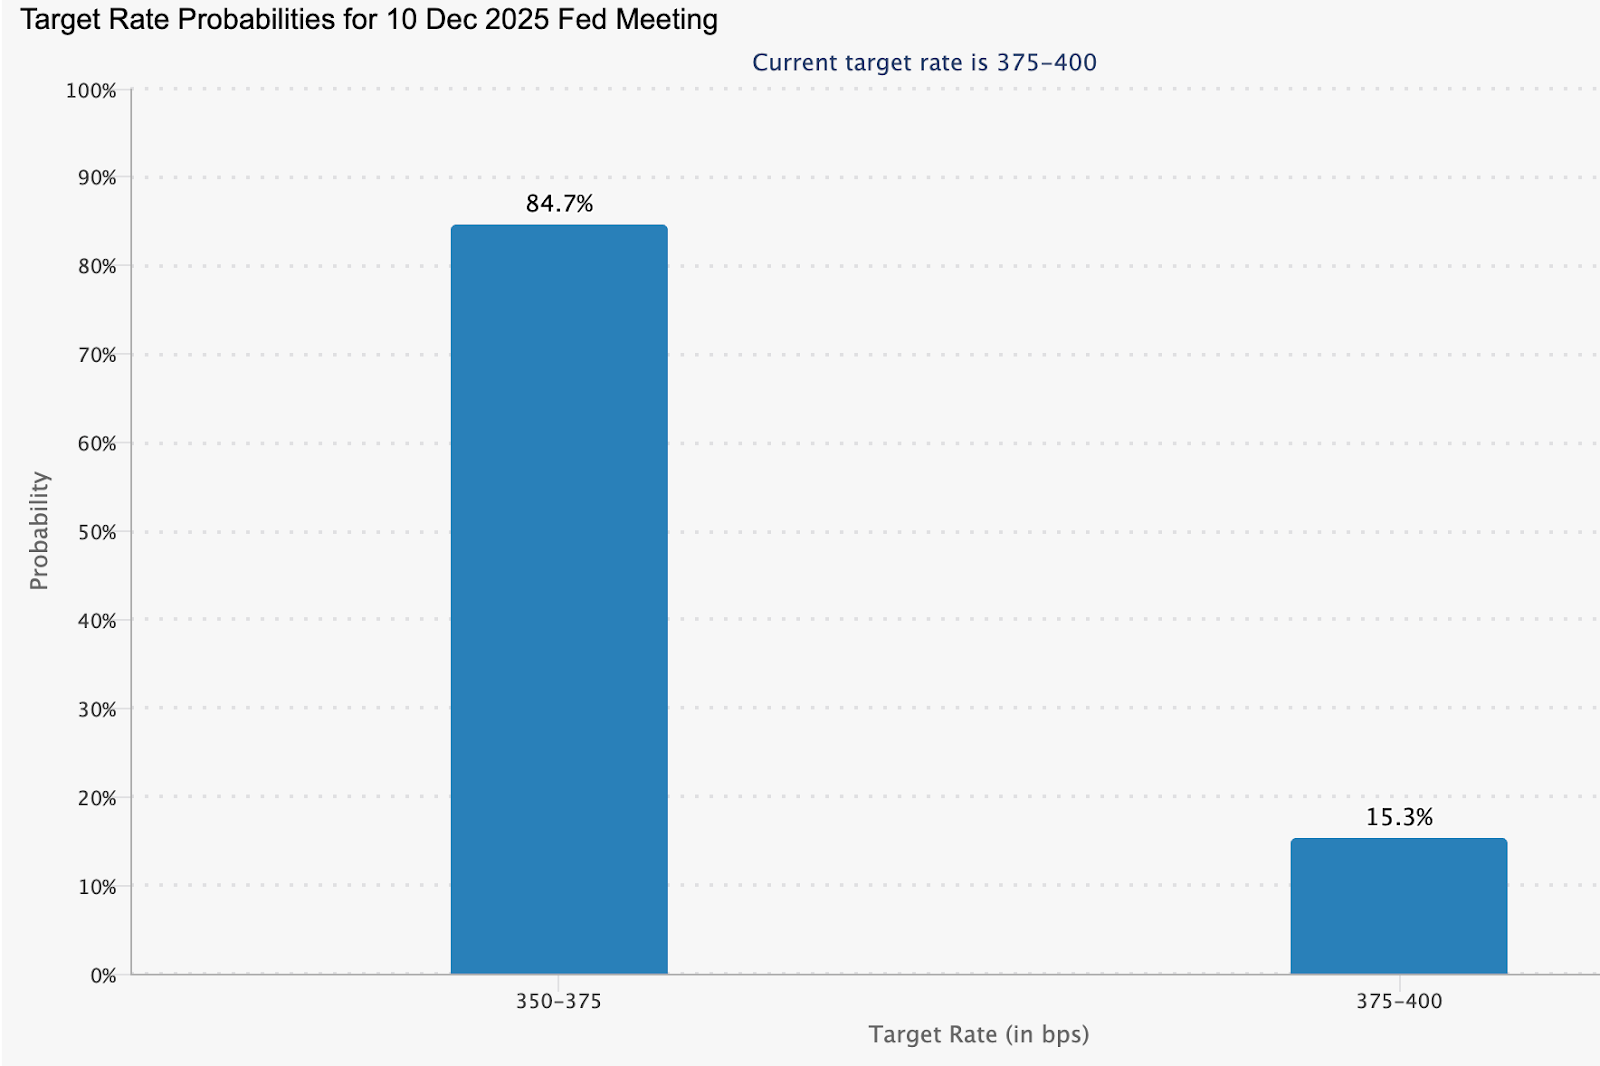
According to reports, the dollar’s rate-cut reckoning is now the defining force in EUR/USD, with traders pushing expectations for a December Federal Reserve cut to more than 85%, up sharply from 39% just a week earlier. What began as a quiet Thanksgiving week has turned into the dollar’s steepest weekly decline in four months, reshaping the balance of power across major currency pairs.
EUR/USD is rising not because the euro has rediscovered its strength, but because the dollar is losing the policy advantage it has enjoyed for most of the year. As markets confront the prospect of a softer Fed and political pressure on the institution intensifies, the pair is becoming a barometer for how much credibility the central bank is willing to risk in the months ahead.
What’s driving EUR/USD right now?
The Fed sits squarely at the centre of the story. Rate expectations have shifted at a pace not seen since early summer, with futures markets now assuming a December cut as the most likely outcome. Reuters reported a series of softer labour market indicators, dovish public remarks from key policymakers, and increased speculation around Kevin Hassett’s potential nomination as the next Fed Chair have accelerated the move. Thin U.S. liquidity over the Thanksgiving holiday added fuel, allowing even modest data points to push the dollar lower.
This recalibration has allowed EUR/USD to climb despite Europe’s mixed economic backdrop. The dollar index, still hovering near 99.72, is heading for its worst weekly performance since late July.

The euro briefly touched a 1½-week high of $1.1613 before easing, supported more by dollar fatigue than by renewed optimism in the eurozone. Even so, the narrowing of U.S.–European rate differentials has created space for euro bulls to test higher levels, something that looked unlikely just two weeks ago.
Why the dollar is facing its own reckoning
Political pressure is becoming an increasingly prominent part of the narrative. President Donald Trump has renewed calls for deeper rate cuts, arguing that the Fed must “move quickly” to support economic momentum.
The possibility that Kevin Hassett - a prominent advocate of looser policy - could become the next Fed Chair has forced traders to reassess the institution’s independence and long-term trajectory. Markets are now questioning whether December’s cut is simply another precaution or the start of a strategically driven easing cycle.
At the macro level, the dollar’s credibility premium is also being tested. Barclays’ global head of FX strategy, Themos Fiotakis, argued that Europe had benefited in recent months from supportive rate differentials and improving sentiment, but warned that these assumptions are now under reassessment. The euro’s valuation remains high by several metrics, while the U.S. economy continues to show pockets of resilience, particularly in services. The dollar’s decline, therefore, reflects less a loss of faith and more a repricing of what the next policymaking regime might look like.
What this means for EUR/USD traders
Positioning in EUR/USD has turned decisively constructive, according to analysts. With holiday-thinned liquidity amplifying moves, traders have been quick to unwind long-USD positions accumulated during the autumn rally. The shift has also been visible in cross-asset markets: U.S. 10-year Treasury yields briefly dipped below 4% before rebounding, while German bunds held steady, creating a more supportive environment for the euro.

For corporates, the recalibration matters. European exporters face a marginally stronger currency, which could tighten their margins if the trend persists, while importers benefit from reduced dollar-denominated costs. For investors, the EUR/USD is becoming a call on relative credibility: whether the Fed’s pivot is justified by economic factors or shaped by politics - and whether the European Central Bank can maintain stability as global conditions change.
The geopolitical backdrop adds another layer, analysts added. Markets are tracking every incremental update on Ukraine peace negotiations, with Vladimir Putin signalling that draft proposals could form the basis of future talks. While analysts caution against expecting a rapid “peace premium”, even the possibility of de-escalation has helped cap dollar demand against the euro.
Expert outlook
In the near term, market watchers stated the EUR/USD will remain closely tied to U.S. policy signals. A confirmed December rate cut, reinforced by dovish messaging, could send the pair back toward 1.17. But any upside surprise in U.S. labour or inflation data would temper enthusiasm and reintroduce volatility, particularly for leveraged positions - something traders often evaluate beforehand using the Deriv trading calculator to manage risk.
Medium-term dynamics remain more uncertain. The eurozone continues to wrestle with uneven growth and limited fiscal momentum, which could limit the sustainability of any rally built solely on dollar weakness. At the same time, bond markets remain a crucial indicator: if the U.S. 10-year yield breaks back above 4.1%, the dollar could regain some cyclically driven strength, according to experts.
The next trigger may come from a combination of Fed rhetoric, incoming U.S. data, and developments in Eastern Europe, all of which have the potential to redirect EUR/USD in the weeks ahead.
EUR/USD technical insights
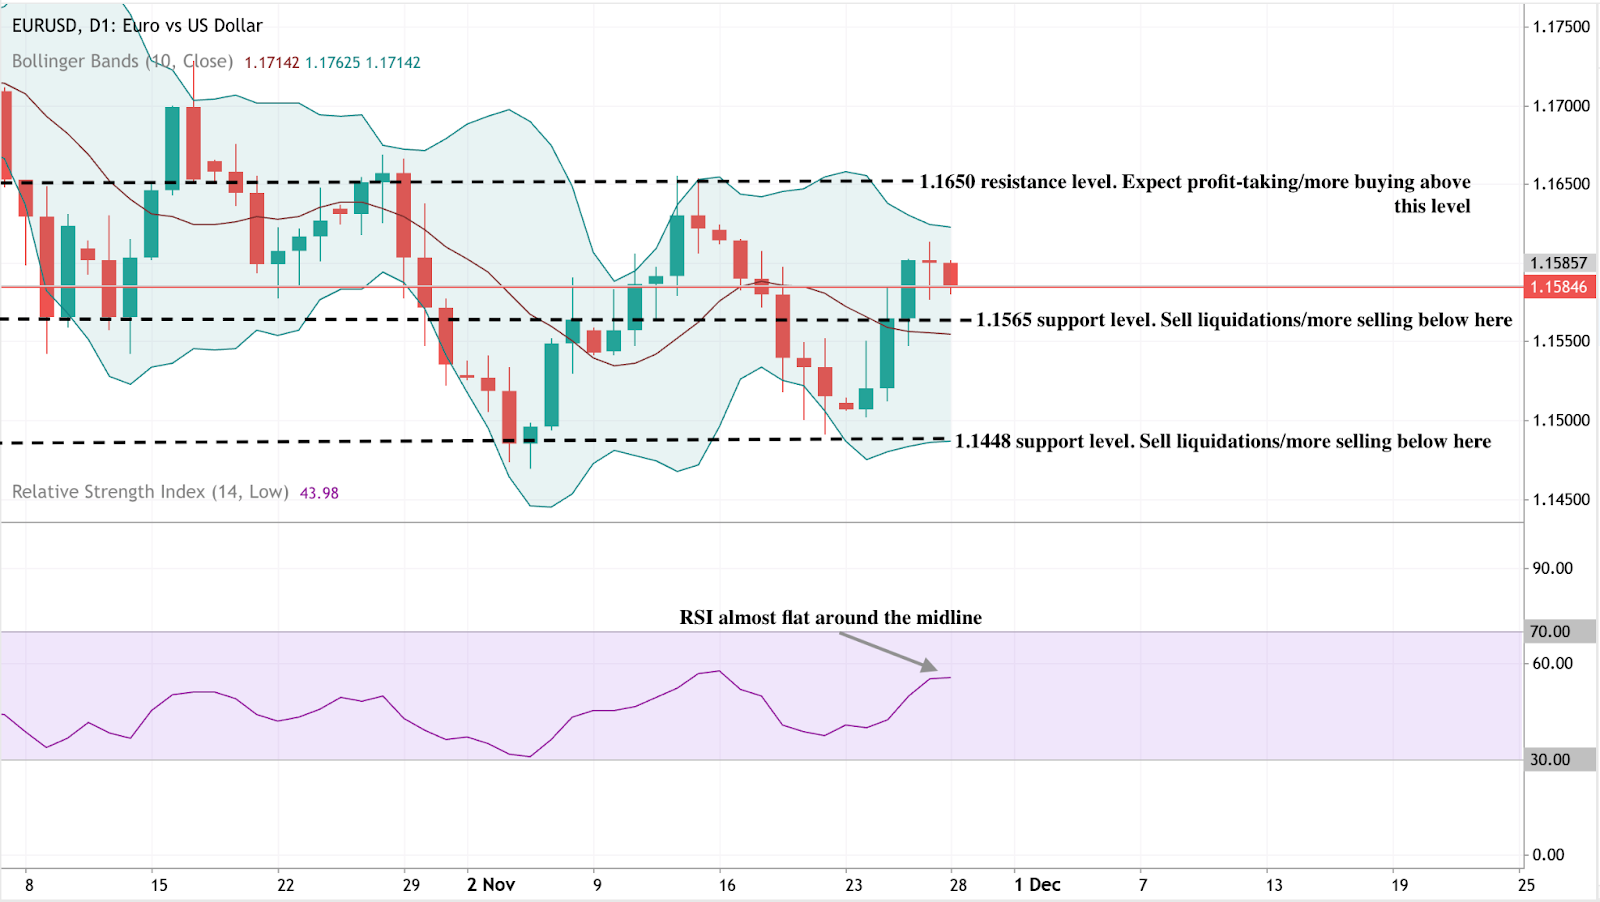
At the start of writing, EUR/USD is trading near 1.1585, moving sideways within a well-defined range. The pair continues to face overhead pressure from the 1.1650 resistance level, where traders may look for profit-taking or renewed buying if the price can break convincingly above it. On the downside, the first key support level sits at 1.1565, followed by a stronger base at 1.1448. A break below either level is likely to trigger sell liquidations and deeper downside momentum.
The price remains contained within the Bollinger Bands, indicating a market lacking strong directional conviction. This consolidative structure suggests EUR/USD may continue chopping within the range unless a macro catalyst - such as ECB or Fed commentary - forces a breakout.
The RSI is nearly flat, sitting around 44, close to the midline and signalling neutral momentum. Neither bulls nor bears currently dominate, reinforcing the idea that the pair is in a holding pattern while awaiting its next decisive move.
Key takeaway
EUR/USD is climbing because the dollar is undergoing a policy reckoning shaped by rapid shifts in rate expectations and rising political influence. The euro may not have a strong domestic story, but the repricing of U.S. monetary credibility has given it new momentum. The next leg depends on the Fed's decision in December, U.S. Treasury yields, and geopolitical developments. Traders on Deriv MT5 will closely watch those catalysts as they adjust their strategies.

الفضة تتفوق بهدوء على الذهب: هل يمكن أن يستمر الارتفاع؟
أظهرت البيانات الأخيرة أن الفضة ارتفعت بأكثر من 7% هذا الأسبوع، مما دفعها لتقترب بشدة من أعلى مستوى قياسي لها.
الفضة تتفوق بهدوء على الذهب - لكن هل يمكن أن يستمر هذا الارتفاع؟ أظهرت البيانات الأخيرة أن المعدن ارتفع بأكثر من 7% هذا الأسبوع، مما دفع XAG/USD ليقترب بشدة من أعلى مستوى قياسي له مع تضخيم سيولة عيد الشكر الضعيفة لكل حركة. الذهب، الذي عادة ما يكون النجم الرئيسي، شهد تراجعًا في تقلباته، ومع ذلك تسرق الفضة الأضواء بارتفاع يبدو بعيدًا عن الطابع الموسمي.
أعرب مراقبو السوق عن أن القوى وراء هذا الاختراق حقيقية: ضعف مبيعات التجزئة الأمريكية، انهيار توقعات المستهلكين، واحتمالية ضمنية في السوق بنسبة 84% لخفض الفائدة في ديسمبر، مما عزز الطلب على الأصول الملاذ الآمن. يزن المتداولون الآن ما إذا كان هذا الارتفاع يعكس اضطرابًا مؤقتًا بسبب العطلات أو المراحل الأولى لإعادة تقييم هيكلية. هذا السؤال - هل يمكن أن يستمر تفوق الفضة - يحدد نغمة بقية تحليل السوق.
ما الذي يدفع ارتفاع الفضة؟
يرتكز الارتفاع الأخير للفضة عند تقاطع التوترات الاقتصادية الكلية وتناقص السيولة. ارتفعت مبيعات التجزئة الأمريكية اسميًا منذ 2021، مما يشير إلى توقف محرك المستهلك الذي يترك مجالًا ضئيلاً للنمو. انخفض مؤشر توقعات مجلس المؤتمر إلى 63.2، وهو مستوى سبق أن سبّق الركودات تاريخيًا، مما يعزز الاندفاع نحو الأصول الدفاعية.

مع إعادة المستثمرين تقييم مسار الطلب الأمريكي، كانت المعادن الحساسة للتغيرات الاقتصادية هي الأسرع استجابة - والفضة في مقدمتها.
سرّع تحول الاحتياطي الفيدرالي هذا التغير. أعادت الأسواق بسرعة تسعير احتمالات خفض الفائدة، قفزت من 50% إلى 84% في غضون أيام قليلة.
أشارت تعليقات رئيس بنك الاحتياطي الفيدرالي في نيويورك جون ويليامز ومسؤولين آخرين إلى الاستعداد للتيسير إذا استمر ضعف الزخم. مع تراجع عوائد سندات الخزانة نحو أدنى مستوياتها خلال شهر وتراجع الدولار، تستفيد الأصول غير ذات العائد من ميزة كبيرة. تساعد علاقة الفضة بهذه الظروف في تفسير سبب تحركها السريع - والدراماتيكي.
لماذا هذا مهم
وفقًا للمحللين، فإن ارتفاع الفضة مهم ليس فقط بسبب سرعة الارتفاع ولكن لما يعكسه. على الرغم من سمعة الذهب كملاذ أخير، فقد تفوقت الفضة عليه بفارق كبير، حيث ارتفعت بنسبة 163% منذ أكتوبر 2023 وبلغت أعلى مستوى قياسي عند 54.38 دولارًا في وقت سابق من هذا الشهر. أصبح من الصعب على المؤسسات تجاهل هذا التفوق لأن الفضة تقع عند تقاطع التحوط النقدي والاستخدام الصناعي.
كما يحذرون من أن حركة السعر تكشف عن مخاوف أعمق. يشير تيم ووترر، كبير محللي السوق في KCM Trade، إلى أن السوق يتفاعل مع "جوقة من التصريحات المتساهلة" مع تراكم مؤشرات الاقتصاد الكلي الضعيفة. يشير تقييمه إلى مشكلة أوسع: الفضة ترتفع ليس لأن النمو قوي، بل لأن الثقة في مسار الاقتصاد الأمريكي تتلاشى. المعادن تمتص هذا عدم اليقين في الوقت الحقيقي.
التأثير على الأسواق والصناعة
بالنسبة للمتداولين، يعقد ارتفاع الفضة من وضع المراكز مع تراجع الأسواق خلال فترة العطلات. يؤدي انخفاض المشاركة إلى تضخيم التحركات اليومية، مما يصعب تحوط المخاطر الاتجاهية. على منصات مثل Deriv MT5، حيث سرعة التنفيذ وحجم التداول الدقيقان ضروريان خلال ظروف التقلب، يتطلب هذا الوضع من المتداولين البقاء يقظين. يعتمد الكثيرون بشكل متزايد على أدوات مثل حاسبة التداول من Deriv لقياس الأرباح المحتملة، ورسوم المبادلة، والتعرض قبل التعامل مع تقلبات الفضة الحادة خلال اليوم.
لكن القصة الأعمق تكمن في القطاع الصناعي. قفز الطلب على الفضة من تصنيع الألواح الشمسية إلى 243.7 مليون أونصة في 2024، ارتفاعًا من 191.8 مليون في 2023 وأكثر من ضعف المستوى المسجل في 2020.
مع توقع وصول القدرة الشمسية العالمية إلى ما يقرب من 1000 جيجاوات سنويًا بحلول 2030، من المتوقع أن يرتفع الطلب بمقدار 150 مليون أونصة أخرى سنويًا. ومع ذلك، يبقى العرض محدودًا: معظم إنتاج الفضة العالمي هو منتج ثانوي من إنتاج النحاس والزنك والرصاص أو الذهب، مما يجعله بطيئًا في التكيف مع إشارات الأسعار. تقدر Mining Technology أن الإنتاج العالمي قد ينخفض إلى 901 مليون أونصة بحلول 2030 - وهو عجز هيكلي يعزز الحجة طويلة الأجل لارتفاع الأسعار.
توقعات الخبراء
أعرب المتداولون المحترفون عن أن استدامة ارتفاع الفضة تعتمد على ثلاثة عوامل رئيسية: الخطوة التالية للاحتياطي الفيدرالي، مسار الاستهلاك الأمريكي، وسرعة التوسع الصناعي. إذا أكد صناع السياسات التحول في ديسمبر، فقد يوفر الجمع بين انخفاض العوائد وضعف الدولار الحافز اللازم لدفع الأسعار إلى مستويات قياسية جديدة. ومع تزايد إشارات الركود، من غير المرجح أن يتلاشى الطلب على الأصول الملاذ بسرعة.
ومع ذلك، لا شيء مؤكد. قد يؤدي انتعاش مفاجئ في نشاط المستهلك أو مفاجأة تضخمية إلى إبطاء توقعات التيسير. قد يدفع المستخدمون الصناعيون في النهاية ضد ارتفاع الأسعار، رغم أن الطلب على الطاقة الشمسية يبدو قويًا بما يكفي لامتصاص التقلبات قصيرة الأجل. في الوقت الحالي، يراقب المتداولون عن كثب البيانات الاقتصادية الكلية الواردة واتصالات الاحتياطي الفيدرالي. قد يشير اختراق حاسم فوق القمة السابقة إلى أن السوق يرى نظام تسعير جديدًا جوهريًا للفضة.
النقطة الأساسية
يرتكز ارتفاع الفضة على إشارات اقتصادية حقيقية، من ضعف البيانات الأمريكية إلى ارتفاع توقعات خفض الفائدة على المدى القريب. تفوقت الفضة على الذهب وهي الآن تقترب من مستويات قياسية مدعومة بتدفقات الملاذ وقصة صناعية قوية. يعتمد استمرار الارتفاع على رسائل الاحتياطي الفيدرالي ومرونة الأسر الأمريكية، لكن الاتجاه الأوسع يشير إلى تضييق العرض واستمرار الطلب. ستكشف الأسابيع القادمة ما إذا كانت الفضة ترتفع فقط - أم تعيد تسعير دورة جديدة تمامًا.
رؤى فنية عن الفضة
في بداية الكتابة، يتداول الفضة (XAG/USD) حول 53.79 دولارًا، مرتفعًا بقوة مع اقترابه من مستوى المقاومة الرئيسي عند 54.22 دولارًا. من المرجح أن تجذب هذه المنطقة جني الأرباح، رغم أن اختراقًا نظيفًا قد يثير شراء زخم جديد نظرًا لقوة الارتفاع الحالي.
على الجانب السفلي، تقع مستويات الدعم الرئيسية عند 50.00 و47.00 دولارًا. يشير التحرك أدنى أي منهما إلى تراجع الضغط الصعودي وقد يؤدي إلى تصفية مبيعات أو تراجع أعمق، خاصة إذا انخفض السعر عبر منتصف قناة Bollinger Band.
لا يزال الزخم قويًا، مع ارتفاع RSI sharply إلى حوالي 80، وهو في منطقة تشبع الشراء. يشير هذا إلى سيطرة المشترين لكنه يحذر أيضًا من احتمال الإرهاق قصير الأجل. بينما يبقى الاتجاه الصعودي ساريًا، قد تكون الفضة عرضة لتراجعات أو تماسك جانبي إذا استمرت ظروف التشبع الشرائي.


قوس استرداد البيتكوين: هل يمكن لاختراق 90,000 دولار أن يصمد حقًا؟
وصل قوس استرداد البيتكوين إلى الواجهة بالكامل مع عودته فوق 90,000 دولار، مما يثير التساؤل عما إذا كان هذا الاختراق يمكن أن يصمد حقًا.
وصل قوس استرداد البيتكوين إلى الواجهة بالكامل مع عودة أكبر عملة مشفرة في العالم فوق 90,000 دولار، مما يثير التساؤل عما إذا كان هذا الاختراق يمكن أن يصمد حقًا. جاء هذا التحرك بعد ارتداد حاد من القاع عند حوالي 80,400 دولار الذي شوهد قبل أيام قليلة فقط، مدفوعًا إلى حد كبير بتوقعات متزايدة بأن الفيدرالي قد يخفض الفائدة في ديسمبر وتحول أوسع نحو الأصول ذات المخاطر، وفقًا للتقارير.
ومع ذلك، فإن انتعاش البيتكوين قائم على أرض هشة، حيث لا تزال صناديق الاستثمار المتداولة الفورية تشهد تدفقات ضعيفة، ويظهر الأداء الشهري انخفاضًا في BTC بنحو 19%، مما يبرز الأساس غير المتكافئ وراء الارتداد.
أعرب المحللون عن أن هذا التوتر بين التفاؤل المتجدد وتدهور السيولة يحدد الآن مزاج السوق. إذا كان على البيتكوين تحويل هذا التعافي إلى شيء دائم، فيجب عليه تجاوز مقاومة قوية في نطاق 92,000–95,000 دولار وجذب عودة حاسمة لحجم التداول من التجزئة ومشاركة صناديق الاستثمار المتداولة. سواء ظهرت هذه الشروط - أو ما إذا كان الاختراق سيتلاشى إلى هبوط تصحيحي آخر - سيحدد الفصل التالي في ما يسمى بقوس استرداد البيتكوين.
ما الذي يدفع تحرك البيتكوين الأخير
تم دعم صعود البيتكوين الأخير جزئيًا بتغير التوقعات الكلية. يخصص المتداولون الآن احتمالات أعلى لخفض الفائدة من الفيدرالي في ديسمبر، مما يساعد على تعزيز شهية المخاطرة عبر أسواق الأسهم والعملات المشفرة.
ساعد هذا التغير في المزاج BTC على استعادة مستوى 90,000 دولار بعد أن انخفض إلى منطقة 80,000 دولار الأسبوع الماضي. ومع ذلك، فإن الخلفية أكثر تعقيدًا: لا يزال التضخم مرتفعًا، مما دفع محللي QCP Capital إلى التحذير من أن "العرض من المرجح أن يحد من BTC في منتصف التسعينات"، مما يشير إلى أن الارتفاع قد يقترب من النفاد.
تضيف بيئة صناديق الاستثمار المتداولة طبقة أخرى. بعد أسابيع من التدفقات الخارجة القياسية، كافحت صناديق البيتكوين الأمريكية لجذب تدفقات ثابتة. يشير المحللون إلى أن السيولة لا تزال ضعيفة، وأن طلب المستثمرين لا يزال مترددًا.
تقترب MicroStrategy - واحدة من أكبر حاملي البيتكوين من الشركات - فقط من مستويات التعادل وهي الآن على قائمة المراقبة للإزالة من MSCI، مما يزيد من عدم اليقين بشأن التعرض المؤسسي. تظل هذه الضغوط تحت السطح، حتى مع تعافي الأسعار، مما يكشف عن انتعاش مبني أكثر على التموضع الكلي من تدفقات رأس المال القوية.
لماذا هذا مهم
أصبح التباين بين حركة السعر والمؤشرات الهيكلية نقطة محورية للمستثمرين. يشير تورستن سلوق، كبير الاقتصاديين في Apollo، إلى أن الارتباط النموذجي للبيتكوين مع ناسداك قد ضعُف في الأسابيع الأخيرة، حيث انخفض BTC بشكل أسرع من المؤشرات التقنية الكبرى.

يثير هذا الانفصال تساؤلات حول مشكلات السيولة الخاصة بالعملات المشفرة في وقت تستقر فيه الأسهم. في الوقت نفسه، يحذر محللو 10X Research من أن السوق قد يضع ثقة مفرطة في خفض الفائدة في ديسمبر. تشير أبحاثهم إلى أن البيتكوين يتفاعل أكثر مع تواصل الفيدرالي ونبرته أكثر من تحركات السياسة الفعلية.
إذا أشار باول إلى الحذر أو قلل من وتيرة التيسير المستقبلي، فقد تنعكس الأسواق بسرعة. كما تتحدى الشركة الافتراضات حول إنفاق حساب الخزانة العامة (TGA) كمحفز لسيولة العملات المشفرة، مشيرة إلى أن الإصدارات السابقة من TGA استغرقت ما يصل إلى شهرين لتنعكس على سعر البيتكوين - إن حدث ذلك أصلاً.
التأثير على الصناعة والأسواق والمستهلكين
كشفت البيانات الأخيرة أن عودة البيتكوين فوق 90,000 دولار قد أعادت بعض الثقة النفسية، لكن الصورة الهيكلية لا تزال غير متكافئة. لا يزال الأصل منخفضًا بنسبة 5% منذ بداية العام، واستقرت منتجات صناديق الاستثمار المتداولة مؤخرًا فقط بعد تدفقات خارجة كبيرة ساهمت في هبوط BTC إلى حوالي 80 ألف دولار. قدم الارتداد بعض الراحة، لكن السوق بعيد عن الإشارة إلى اتجاه صعودي واضح.
تقدم التدفقات المؤسسية لمحات عن تحول. قال فارزام إحساني، الرئيس التنفيذي لشركة VALR، إن صناديق الاستثمار المتداولة الفورية شهدت تدفقات يوم الثلاثاء لأول مرة منذ أسابيع - "علامة مبكرة على عودة السيولة المؤسسية." لاحظ المتداولون الذين يراقبون سلوك السعر عبر Deriv MT5 أهمية مستوى 90,000 دولار كنقطة محورية هيكلية، مع إظهار الأطر الزمنية الأقصر تقلبات بين محاولات صعودية وموجات جني أرباح. في الوقت نفسه، أصبح حاسبة التداول من Deriv أكثر فائدة للمتداولين الذين يسعون لتقدير تكاليف المراكز والمخاطر مع اقتراب BTC من مقاومة رئيسية.
وفقًا لمراقبي السوق، لا يزال أداء البيتكوين يؤثر على مجمل سوق الأصول الرقمية. قد يعزز الثبات الحاسم فوق 90,000 دولار السيولة عبر أسواق العملات البديلة والعملات المستقرة. قد يؤدي انهيار المخاطر إلى إعادة إشعال البيع القسري وتآكل الثقة في القطاع.
توقعات الخبراء
ترى QCP Capital وجود نطاق مقاومة واضح بين 92,000 و95,000 دولار، محذرة من أن تقلص السيولة قد يحد من أي محاولة للارتفاع. تحدد الشركة نطاق 80,000 – 82,000 دولار كمنطقة دعم حاسمة دافع عنها المشترون خلال البيع الأخير. يضيف محللو 10X Research أنه إذا استمرت تأخيرات سيولة TGA التاريخية، فقد يتماسك البيتكوين حتى أواخر يناير 2026، مما يقلل من احتمالات اختراق سريع.
لا يعتقد جميع الاستراتيجيين أن القاع قد تم الوصول إليه. يجادل إيد إنجل، محلل Compass Point، بأن الأسواق الهابطة غالبًا ما تتميز بـ "انتعاشات سريعة تليها مبيعات عدوانية عند القوة." ويريد رؤية تراكم صافي من حاملي المدى الطويل ومراكز بيع أكثر حزمًا في أسواق العقود الآجلة قبل أن يصبح متفائلًا. بدون هذه الإشارات، يرى إنجل خطر مواجهة BTC مقاومة شديدة إذا اقترب من 92,000-95,000 دولار، مما قد يؤدي إلى هبوط متجدد.
النقطة الرئيسية
يشير المحللون إلى أن صعود البيتكوين فوق 90,000 دولار يمثل نقطة تحول رمزية في قوس استرداده المستمر، لكن أسس هذا الارتفاع لا تزال هشة. المقاومة قرب 92,000 – 95,000 دولار، وضعف تدفقات صناديق الاستثمار المتداولة، وخلفية سيولة نهاية العام الهشة تاريخيًا كلها تشكل تحديات لاستدامة الاختراق.
ستعتمد المرحلة التالية على كيفية استيعاب الأسواق لرسائل الفيدرالي في ديسمبر، وما إذا كان المتداولون الأفراد سيعودون، وما إذا كانت التدفقات المؤسسية ستقوى. ستحدد هذه القوى ما إذا كان انتعاش البيتكوين سيستمر - أو يتوقف عند مقاومة مألوفة.
رؤى فنية عن البيتكوين
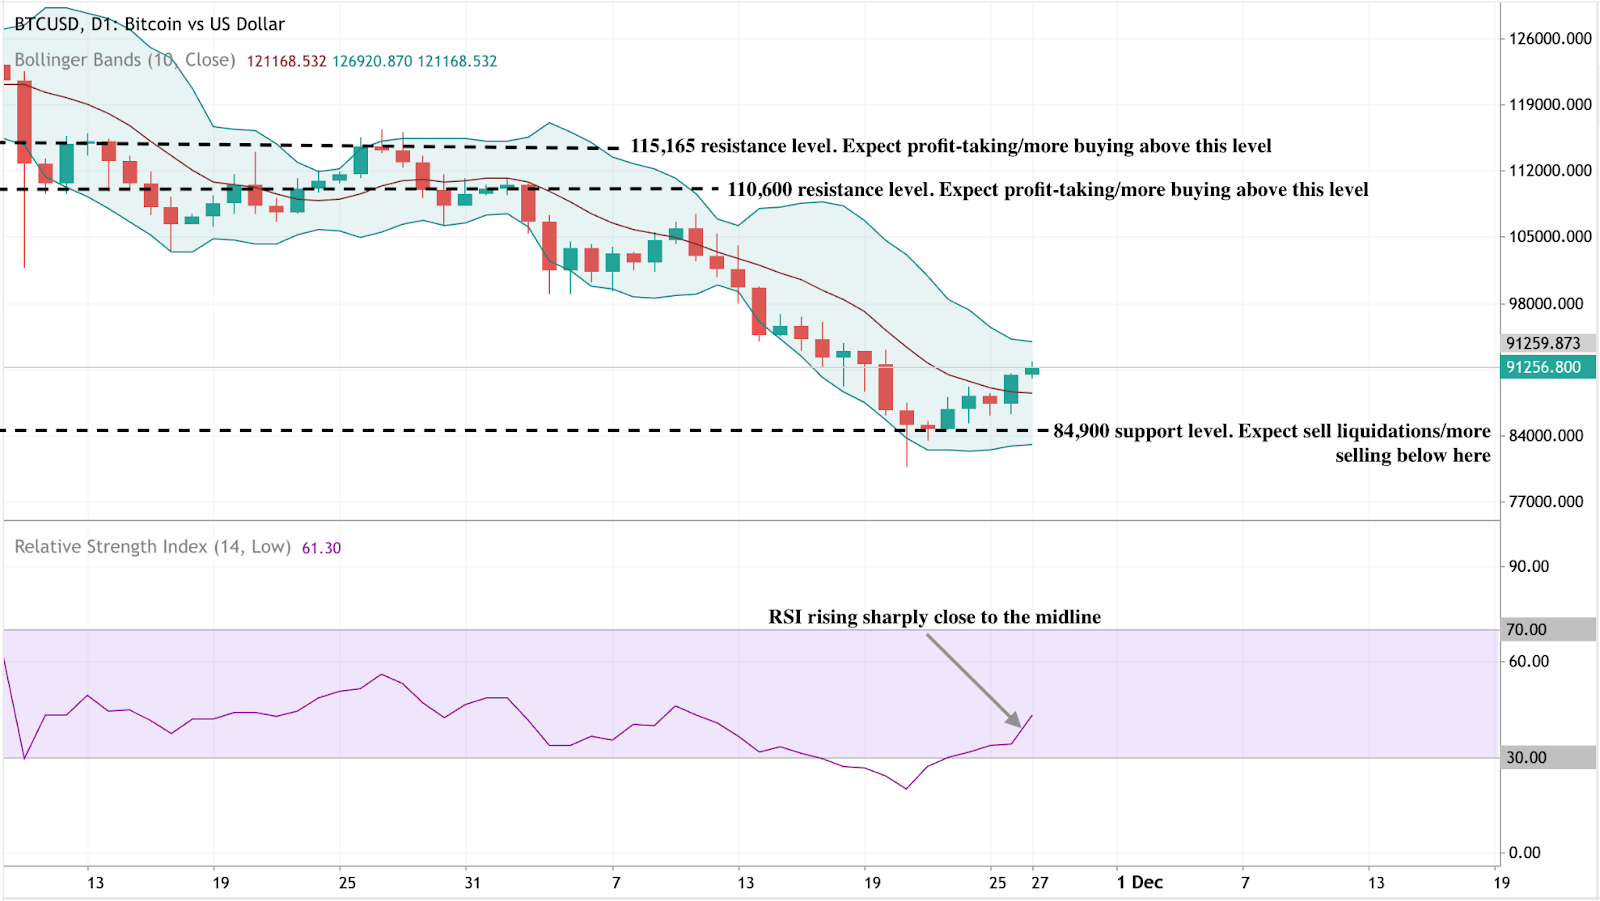
في بداية الكتابة، يحاول البيتكوين (BTC/USD) التعافي من أدنى مستوياته الأخيرة، متداولًا فوق 91,200 دولار بقليل بعد الارتداد من منطقة الدعم الرئيسية عند 84,900 دولار. الحفاظ على هذا المستوى أمر حاسم - قد يؤدي كسره إلى تفعيل تصفيات بيع وإعادة فتح الاتجاه الهبوطي. على الجانب الصعودي، يواجه BTC الآن مستويين مهمين من المقاومة: 110,600 و115,165 دولار، حيث قد يبحث المتداولون عن جني أرباح أو اهتمام شراء متجدد إذا تمكن السعر من بناء زخم كافٍ لإعادة اختبارهما.
تظل حركة السعر محصورة ضمن أشرطة بولينجر، مع بدء BTC في الدفع نحو الشريط الأوسط بعد فترة طويلة من الضعف. يشير هذا إلى علامات مبكرة على الاستقرار، رغم أن الاتجاه الأوسع لا يزال يميل إلى الحذر حتى حدوث اختراق واضح فوق مناطق المقاومة.
ارتفع مؤشر القوة النسبية (RSI) بشكل حاد إلى حوالي 61، متسلقًا نحو الخط الأوسط بعد قضاء وقت في مناطق التشبع البيعي. يبرز هذا التغير تحسن الزخم الصعودي، لكن مع وجود مساحة كبيرة قبل الوصول إلى مستويات التشبع الشرائي، مما يشير إلى أن التعافي قد يمتلك مزيدًا من المجال للاستمرار إذا استمر المشترون في التدخل.

BoJ vs Fed: How December decisions could shatter the yen’s fragile range
A potential BoJ rate hike clashing against near-certain Fed easing could finally tip the scales
December 2025 is poised to deliver a high-stakes policy showdown between the Bank of Japan (BoJ) and the US Federal Reserve, with USD/JPY hovering in a precarious 154–158 band, suggesting intervention is likely.
As of 27 November 2025, the pair trades around 155.91, down slightly from recent highs near 157.89 but still vulnerable to a break in either direction. A potential BoJ rate hike clashing against near-certain Fed easing could finally tip the scales - yen bulls are banking on a downside rupture, while bears eye a dollar rebound if either central bank disappoints.
The yen’s tightrope: USD/JPY’s November range
USD/JPY has been confined between the 154.00 support price and 158.00 danger zone price through much of November, a tug-of-war between persistent US yield strength propping up the dollar and mounting speculation on policy divergence.
The upper end-157-158-marks familiar "intervention territory," where Tokyo has deployed verbal and actual yen support in past episodes of rapid depreciation. This range persists amid a backdrop of weak yen-fueled inflation risks in Japan and cooling US data, which is tilting toward Fed cuts.
BoJ: A December hike edges into focus
BoJ rhetoric has sharpened on yen weakness as an inflation accelerant, with import costs now a key concern. A Reuters poll from 11-18 November revealed a slim majority - 53% (43 of 81 economists) - anticipating a 25 basis point hike to 0.75% at the 18-19 December meeting, up from prior surveys. All polled forecasters see at least that level by March 2026.
Easing political friction has helped: Prime Minister Sanae Takaichi’s recent nod to gradual normalisation, following talks with Governor Kazuo Ueda, has reduced near-term hurdles. Ex-BoJ insiders echo this, citing current levels as a catalyst for action sooner than later.
Fed: Overwhelming odds on a December cut
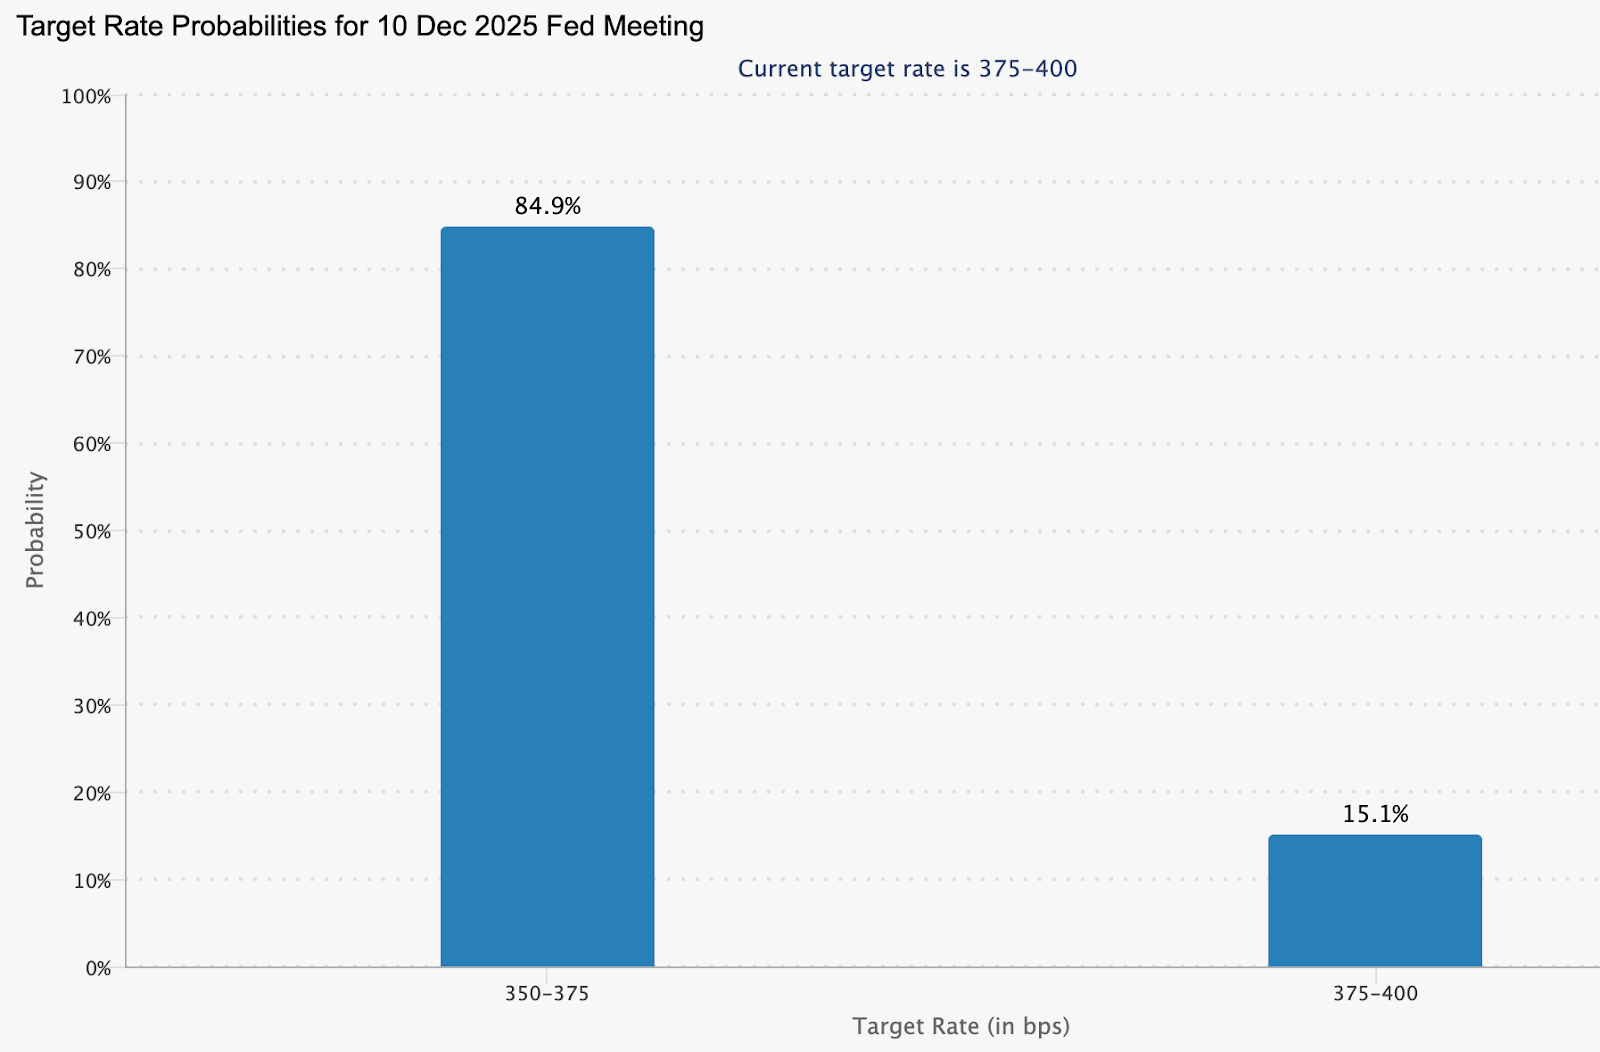
Market pricing leans heavily toward Fed easing, with the CME FedWatch Tool data as of 26 November showing an 84.9% probability of a 25-basis-point reduction at the 10 December FOMC meeting.
This reflects softer US indicators, including recent jobs data that hasn't derailed cut expectations despite some internal Fed debate. Such a move would trim the US–Japan yield gap modestly, offering tailwinds to the yen independent of BoJ moves.
Why it matters
The December decisions will determine whether the yen’s months-long stasis finally resolves into a trend - a critical shift for traders, Japanese policymakers, and multinational firms managing currency exposure. A break from the 154–158 range would influence capital flows, hedging strategies, and carry-trade dynamics at a time when global FX volatility is already rising.
For Japan, the stakes are especially high. A stronger yen would ease imported inflation and energy-cost pressures, while a renewed slide would intensify political scrutiny and prompt the Ministry of Finance to consider direct intervention. For the US, the Fed’s decision will signal how confidently it believes inflation is returning to its target, shaping global risk appetite as the year-end approaches.
Breakout scenarios: Two paths for USD/JPY
These outcomes hinge on post-meeting commentary - hawkish BoJ signals or dovish Fed dots could exaggerate moves.
What to monitor closely
- Event timeline: Fed decision on 10 December; BoJ on 18–19 December.
- Volatility gauges: One- and two-week option-implied vol expected to spike, signaling hedge flows.
- The intervention threshold of 157–160 remains a political flashpoint for Ministry of Finance action.
USDJPY technical insights
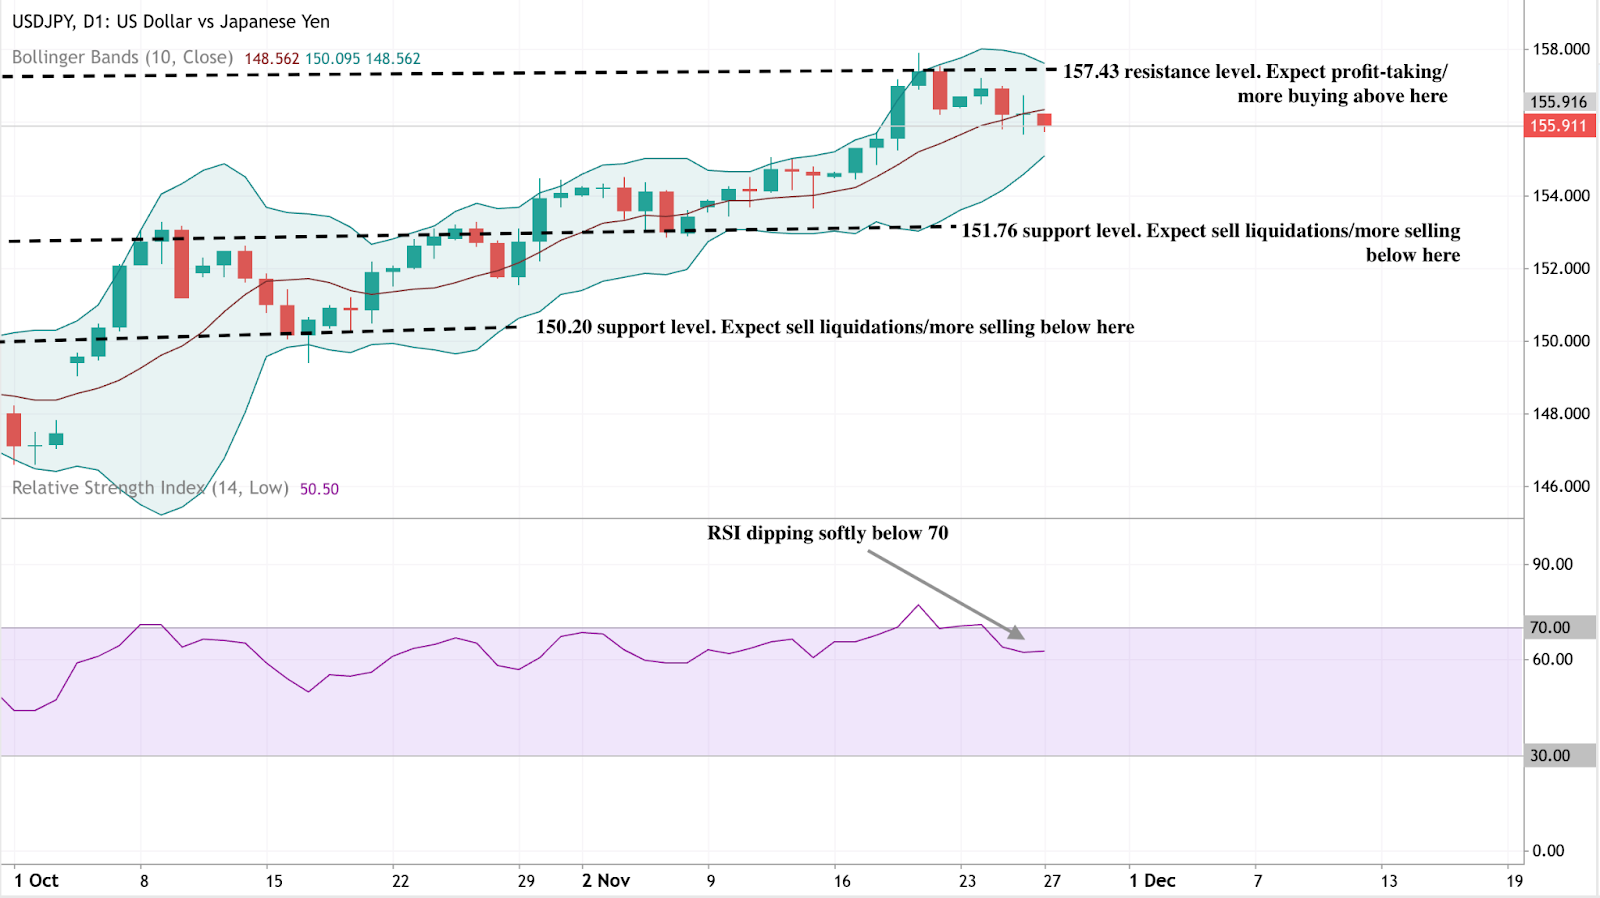
At the start of writing, USD/JPY is trading just below 156, easing slightly after failing to hold levels near the 157.43 resistance zone - an area where traders typically look for profit-taking or fresh upside breakouts. The pair now sits above two key supports at 151.76 and 150.20; slipping below either level could trigger sell liquidations and a deeper corrective move toward the lower Bollinger Band.
Despite the recent pullback, price action remains broadly constructive, with the pair still riding the middle Band and holding below the short-term moving averages.
The RSI, meanwhile, has dipped gently below 70, signalling that bullish momentum is cooling after a stretch of overbought readings. This soft decline hints at consolidation rather than a full reversal, suggesting the pair may trade sideways while the market waits for new catalysts, such as U.S. data or Bank of Japan commentary, to determine its next leg.

سباق الإنفاق الرأسمالي للذكاء الاصطناعي في شركات التكنولوجيا الكبرى لعام 2025: أمازون تتصدر بقيمة إنفاق تتجاوز 125 مليار دولار
الأرقام مذهلة. في عام 2025، تتوقع شركات Amazon وMicrosoft وAlphabet وMeta مجتمعة إنفاقاً رأسمالياً يتراوح بين 360 و400 مليار دولار.
الأرقام مذهلة. في عام 2025، تتوقع شركات Amazon وMicrosoft وAlphabet وMeta مجتمعة إنفاقاً رأسمالياً يتراوح بين 360 و400 مليار دولار – أي زيادة سنوية تقارب 60%، مع توجيه الغالبية العظمى من هذا الإنفاق نحو البنية التحتية المتعلقة بالذكاء الاصطناعي (مراكز البيانات، الرقائق المخصصة، مجموعات GPU/Trainium).
في 24 نوفمبر 2025، بدأت BNP Paribas Exane تغطيتها لسهم Amazon بتصنيف أداء متفوق وسعر مستهدف قدره 320 دولاراً - وهو الأعلى حالياً بين كبار الوسطاء ويعني ارتفاعاً بنحو 39% عن إغلاق 26 نوفمبر البالغ حوالي 230 دولاراً.
توجيهات الإنفاق الرأسمالي لعام 2025 - الأربعة الكبار
| الشركة | توجيهات الإنفاق الرأسمالي لعام 2025 | المجالات الرئيسية لتركيز الذكاء الاصطناعي |
|---|---|---|
| Amazon | >125 مليار دولار (تم رفعها عدة مرات في 2025) | مجموعات AWS الضخمة، رقائق Trainium/Inferentia، السُحب السيادية والحكومية |
| Microsoft | 80–121 مليار دولار (السنة المالية المنتهية في يونيو 2026) | توسعة Azure، بنية OpenAI التحتية، الذكاء الاصطناعي التوليدي للمؤسسات |
| Alphabet | حوالي 91 مليار دولار (تم رفعها من 85 مليار دولار) | وحدات Google Cloud TPU، معالجة النقص التاريخي في السعة |
| Meta | 70–72 مليار دولار | نماذج Llama، الإعلانات المدفوعة بالذكاء الاصطناعي، مراكز بيانات ضخمة في موقع واحد |
المصادر: إفصاحات الشركات، مكالمات الأرباح، BNP Paribas Exane، BBC، Bloomberg، Reuters
لماذا ترى BNP Paribas Exane أمازون بشكل مختلف
يجادل محللو BNP Paribas Exane بأن المخاوف بشأن تقليل Amazon للاستثمار أو تأخرها في مجال الذكاء الاصطناعي "مضخمة" في ضوء الإنفاق المعلن وخط الإنتاج لدى الشركة. ناقش فريق الشؤون المالية في Amazon توقعات إنفاق رأسمالي لعام 2025 بنحو 125 مليار دولار، مع توقعات بارتفاع الرقم في 2026، وأشار إلى أن الغالبية العظمى من هذا الإنفاق تتركز على البنية التحتية للذكاء الاصطناعي مثل مراكز البيانات، والشبكات، والمعجلات الداخلية لـ AWS.
تسلط المذكرة الضوء على عدة نقاط تميز Amazon في دورة الإنفاق الرأسمالي هذه:
- التكامل الرأسي: من خلال تصميم رقائق الذكاء الاصطناعي الخاصة بها مثل Trainium وInferentia، أشارت الإدارة إلى إمكانية تحقيق فوائد في التكلفة والكفاءة مقارنة بالاعتماد فقط على وحدات GPU من أطراف ثالثة، ما قد يساعد في مرونة التسعير والسعة مع مرور الوقت.
- قنوات تحقيق الدخل المتعددة: تم تصميم بنية الذكاء الاصطناعي التحتية لدعم ليس فقط أعباء عمل المؤسسات والحكومات على AWS، بل أيضاً تحسينات في ملاءمة الإعلانات، وتحسين الخدمات اللوجستية، والخدمات الموجهة للمستهلكين، ما يمنح Amazon عدة طرق لتحويل البنية التحتية إلى إيرادات.
- رواية الهامش طويل الأجل: تشير فرضية الشركة إلى سيناريوهات يتسارع فيها نمو AWS ليصل إلى منتصف العشرينات بالمئة، وتنمو الإعلانات بمعدل 20–25% سنوياً أو أكثر، ما يساهم في توسيع هامش التشغيل على مستوى المجموعة على مدى عدة سنوات، رغم أن النتائج الفعلية ستعتمد على التنفيذ والطلب.
أهم النقاشات والمخاطر للمستثمرين
| النقاش / الخطر | وجهة نظر "متفائلة" ممثلة | وجهة نظر "متشائمة" ممثلة |
|---|---|---|
| حجم الإنفاق الرأسمالي | يُنظر إلى الإنفاق الرأسمالي واسع النطاق في الذكاء الاصطناعي على أنه ضروري لتأمين الطلب طويل الأجل في الحوسبة السحابية وخدمات الذكاء الاصطناعي والإعلانات، مع الاعتقاد بأن الإنفاق الحالي يعكس نمواً هيكلياً في أعباء العمل. | بعض المستثمرين قلقون من سيناريو الإفراط في البناء حيث تتم إضافة السعة أسرع من الطلب، ما يقلل من عوائد رأس المال المستثمر ويترك الأصول غير مستغلة. |
| توقيت العوائد | يتوقع المعلقون الداعمون أن يرتفع الاستخدام وتحقيق الدخل خلال 2026–2027 مع انتقال مشاريع الذكاء الاصطناعي التوليدي من التجارب إلى النشر الكامل، خاصة في الحوسبة السحابية وبرمجيات المؤسسات. | تبرز الآراء المتشككة ضغوط التدفق النقدي الحر على المدى القريب وعدم اليقين بشأن سرعة تحول التجارب إلى إنفاق متكرر كبير على الذكاء الاصطناعي. |
| الموقع التنافسي | يرى المؤيدون أن استراتيجية Amazon الشاملة (من الرقائق إلى السحابة إلى تطبيقات المستهلك) تمثل ميزة مستدامة مقارنة بالمنافسين الذين يركزون على طبقات فردية من السلسلة. | يشير النقاد إلى الزخم القوي لدى Microsoft Azure وAlphabet/Google Cloud ويتساءلون عما إذا كان بإمكان أي شركة واحدة الحفاظ على الصدارة الواضحة. |
| الحساسية للظروف الاقتصادية الكلية | يجادل البعض بأن الإنفاق على الحوسبة السحابية والذكاء الاصطناعي أصبح أشبه بالبنية التحتية، ويظل صامداً حتى في حال تباطؤ إنفاق المستهلكين، خاصة بالنسبة لأعباء العمل الحيوية. | بينما يخشى آخرون أن يؤدي تباطؤ اقتصادي أوسع إلى الضغط على ميزانيات الإعلانات الرقمية وأحجام التجارة الإلكترونية—وهي محركات إيرادات رئيسية لـ Amazon وMeta. |
المحفزات/البيانات القادمة
- AWS re:Invent - أوائل ديسمبر 2025
من المرجح أن يراقب المشاركون في السوق الإعلانات حول خدمات الذكاء الاصطناعي الجديدة، وعروض النماذج، وتوسعات السعة، بالإضافة إلى دراسات حالة العملاء التي توضح أعباء العمل على نطاق الإنتاج.
- نتائج Amazon للربع الرابع 2025 - متوقعة أواخر يناير / أوائل فبراير 2026
تشمل المؤشرات الرئيسية التي يجب مراقبتها معدلات نمو إيرادات AWS، ودخل التشغيل القطاعي، وتعليقات الإدارة حول الطلب المدفوع بالذكاء الاصطناعي وخطط الإنفاق الرأسمالي لعام 2026.
- أرباح المنافسين والتوجيهات المحدثة - أوائل 2026
من المتوقع أن توفر أرباح Microsoft وAlphabet وMeta في أوائل 2026 تفاصيل جديدة حول مسارات الإنفاق الرأسمالي، واعتماد منتجات الذكاء الاصطناعي، وكيفية موازنة كل شركة بين الاستثمار والتدفق النقدي الحر.
قد توفر هذه الأحداث مزيداً من الوضوح حول مدى سرعة تحول استثمارات الذكاء الاصطناعي إلى إيرادات، وما إذا كانت مستويات الإنفاق الرأسمالي ستظل مرتفعة أو تتراجع أو ترتفع أكثر في 2026.
رؤى فنية حول Amazon
في بداية كتابة هذا التقرير، يتم تداول سهم Amazon (AMZN) بالقرب من 229 دولاراً، مع تعافٍ طفيف من أدنى مستوياته الأخيرة مع بقائه فوق مستويات الدعم الرئيسية عند 218.45 و213 دولاراً. قد يؤدي الهبوط دون هذه المناطق إلى تفعيل عمليات بيع، بينما يدفع الارتفاع نحو مستوى المقاومة 250.15 دولاراً - وهي منطقة قد يقوم فيها المتداولون بجني الأرباح أو البحث عن فرص شراء جديدة.
يبقى مؤشر القوة النسبية (RSI) مستقراً حول 50، ما يشير إلى زخم محايد ويعكس أن السوق لا يزال يبحث عن اتجاه بعد التراجع الأخير.


توقعات سعر XRP: ما التالي مع تصادم زخم صناديق ETF مع موجات البيع؟
أصبحت توقعات سعر XRP متوترة بشكل غير معتاد مع تصاعد زخم صناديق ETF الذي يصطدم الآن بموجة من عمليات البيع المكثفة.
أصبحت توقعات سعر XRP متوترة بشكل غير معتاد مع تصاعد زخم صناديق ETF الذي يصطدم الآن بموجة من عمليات البيع المكثفة. كان من المفترض أن يرتفع الرمز استنادًا إلى الموافقات المتعددة لصناديق ETF الأمريكية في 21 نوفمبر - حيث سجل بعضها أكثر من 50 مليون دولار في حجم التداول في اليوم الأول، وفقًا لمحلل السوق Eric Balchunas - ومع ذلك انخفض XRP إلى 2.18 بعد أن كان عند أعلى مستوياته 2.29، وسط عمليات بيع أوسع في سوق العملات الرقمية. هذا التناقض بين التقدم الهيكلي وضغط السوق هو ما يحدد المشهد الحالي.
يثير هذا التصادم سؤالاً حادًا للمستثمرين: هل تمثل تدفقات صناديق ETF المنظمة أساسًا لإعادة تقييم طويلة الأجل، أم أن عمليات البيع المستمرة ستطغى على المعنويات وتدفع السوق نحو تصحيح أعمق؟ يقف XRP الآن عند نقطة تحول فنية ونفسية، وسيحدد حل هذا التوتر حركته الرئيسية التالية.
ما الذي يدفع التحول الأخير في XRP؟
وفقًا للتقارير، تتشكل ديناميكيات سعر XRP الأخيرة من خلال روايتين متنافستين. من جهة، يواصل المحللون الذين طالما دافعوا عن أهداف طموحة - مثل 24HrsCrypto ومؤسس Black Swan Capitalist فيرسان الجراح - التأكيد على أن قيمة XRP مرتبطة في النهاية بالطلب العالمي على التسوية وليس بضجة التجزئة.
يرون أن بيتكوين ترتفع بناءً على المضاربة، بينما يعتمد صعود XRP على المدى الطويل على "الاستخدام، وطلب التسوية، واحتياجات السيولة العالمية". ويؤكد هؤلاء المحللون أن التراكم الصبور والتبني المؤسسي يظلان محور خلق القيمة لـ XRP.
وقد تصادم هذا التوجه مع تطور تنظيمي كبير: الموافقة الرسمية على عدة صناديق ETF أمريكية لـ XRP. فقد أدى اعتماد NYSE لصندوق Franklin Templeton وإطلاق منتجات من Bitwise و21Shares وآخرين إلى خلق بوابة نظيفة ومتوافقة للمستثمرين التقليديين.
تعكس التدفقات المبكرة اهتمامًا حقيقيًا - حيث سجلت Bitwise حجم تداول بقيمة 22 مليون دولار في اليوم الأول، بينما سجل منتج XRPC من Canary Capital مبلغ 58 مليون دولار، وهو من أقوى البدايات لهذا العام. توسع هذه المنتجات قاعدة الطلب المحتملة على XRP رغم أن السوق الفوري لا يزال متقلبًا.
لماذا الأمر مهم
ذكر محللو السوق أن الموافقات على صناديق ETF تمثل دفعة هيكلية لمصداقية XRP على المدى الطويل. وصفت Bitwise إطلاق صندوقها بأنه "لحظة تاريخية"، مشيرة إلى أن المنتجات المنظمة لها وزن لدى المستشارين الماليين ومديري صناديق التقاعد الذين لا يزالون حذرين من الأصول الرقمية. غالبًا ما يتخذ هؤلاء المستثمرون قراراتهم بعد أشهر من الموافقة التنظيمية، مما يشير إلى أن التدفقات الكبيرة قد تظهر في عام 2026 مع تعديل أطر المحافظ الاستثمارية.
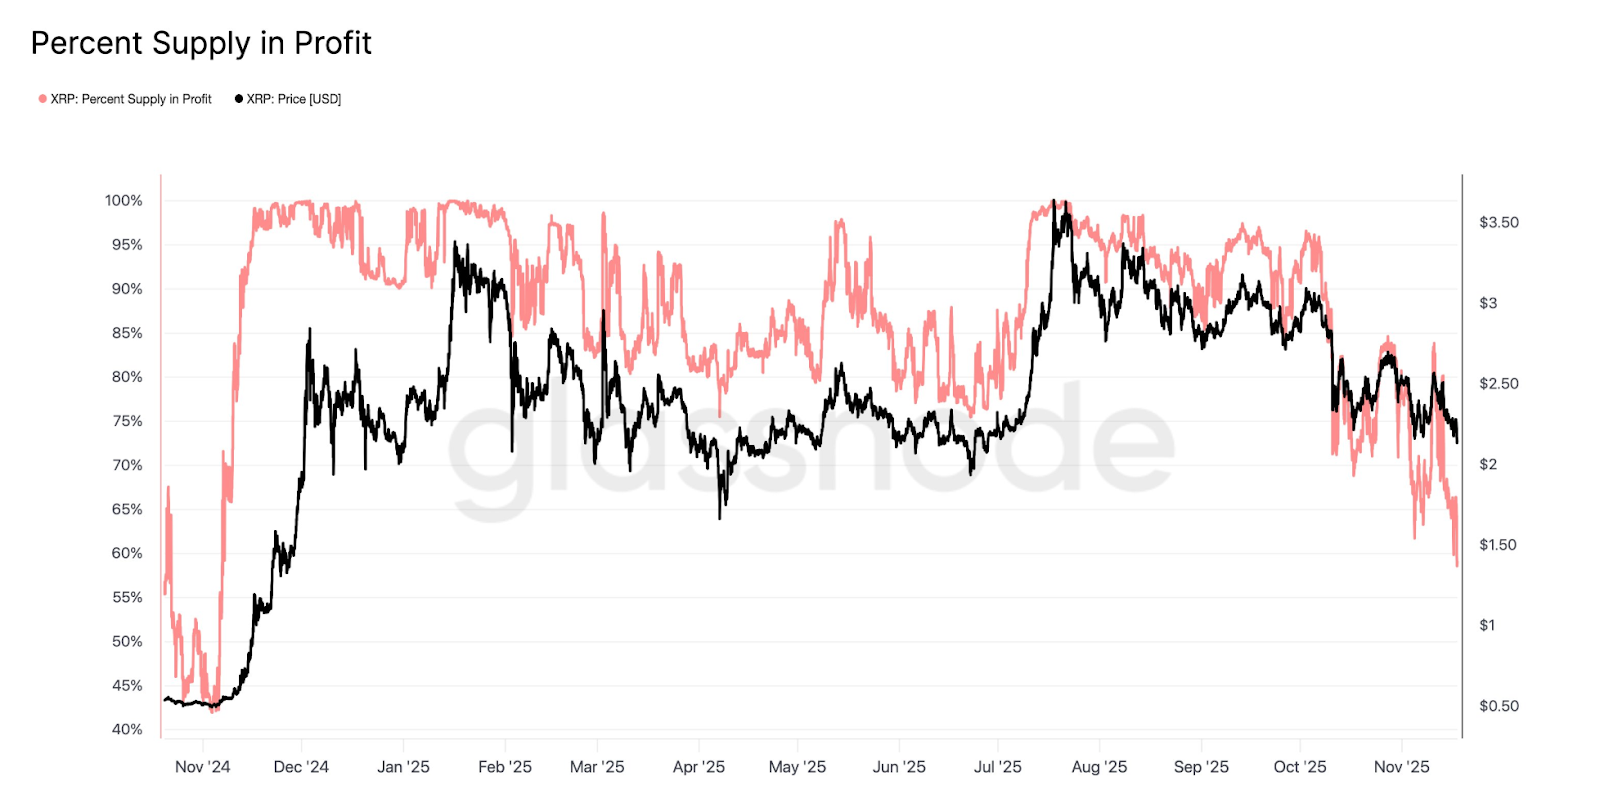
لكن المعنويات على المدى القريب تروي قصة مختلفة. يُظهر هبوط XRP دون 2 دولار رغم إنجاز صناديق ETF مدى هشاشة البيئة السوقية الحالية. وتشير بيانات Glassnode إلى أن 41.5% من المعروض المتداول حاليًا في حالة خسارة، مما يخلق ضغطًا مع استسلام المتداولين.
وقد كثفت تحركات الحيتان من التراجع، حيث تم بيع أكثر من 200 مليون XRP خلال يومين من أخبار صناديق ETF. هذا التباين بين المكاسب الهيكلية والضعف قصير الأجل أصبح الآن محور توقعات XRP.
تأثير ذلك على الأسواق والمستثمرين
من خلال التقارير الأخيرة، تضيف استراتيجية Ripple المؤسسية بعدًا آخر لمسار XRP. فاستحواذ الشركة على Hidden Road بقيمة 1.25 مليار دولار، والتي أعيدت تسميتها إلى Ripple Prime، يمثل المرة الأولى التي تمتلك فيها شركة أصلها من العملات الرقمية وسيطًا رئيسيًا عالميًا متعدد الأصول.
تقوم المنصة بتسوية 3 تريليونات دولار سنويًا، ويشير مسؤولو Ripple إلى نمو كبير منذ الاستحواذ. من المقرر استخدام XRP وRLUSD كضمان للعملاء المؤسسيين، في إشارة إلى دفع لربط الرمز بالبنية التحتية للتداول والتسوية الاحترافية.
يعتبر المراقبون هذا التحول حاسمًا لأن الوساطة الرئيسية تمثل مركز تدفق رأس المال المؤسسي. إن دمج XRP في قنوات الضمان والتسوية يعزز مسارات السيولة التي لا تعتمد على حماس التجزئة. ويشير التوسع السريع لـ Hidden Road إلى أن الطلب على أدوات الأصول الرقمية المتوافقة لا يزال في ازدياد. بالنسبة للمستثمرين، يخلق هذا سيناريو غير معتاد حيث تتحسن البنية التحتية الأساسية حتى مع ضعف الرسم البياني قصير الأجل، وهو نمط شائع في مراحل التحول السوقي.
توقعات الخبراء
يصف المحللون الفنيون XRP بأنه يقترب من عتبة محورية. استعادة مستوى 2.195 دولار ستشير إلى الاستقرار وقد تفتح الطريق نحو 2.6 دولار، بينما فقدان مستوى 2 دولار ينذر بهبوط نحو 1.5 دولار، حيث قد يحاول المستثمرون على المدى الطويل إعادة التراكم. ويبدو أن الهدف الشائع سابقًا عند 3.6 دولار أصبح بعيد المنال ما لم تنعكس معنويات سوق العملات الرقمية بشكل عام.
لا يزال الجدل طويل الأمد منقسمًا. يؤكد مؤيدو فرضية 100 دولار أن مستقبل XRP يعتمد على مسارات السيولة والتسوية المؤسسية وليس على دورات المضاربة. بينما يرى المنتقدون أن التدفقات الحقيقية قد لا تظهر حتى يخصص المستشارون والصناديق المنظمة استثماراتهم بجدية - على الأرجح في عام 2026. وتبقى الرياح المعاكسة الكلية واتجاه بيتكوين عوامل حاسمة: فقد يؤدي انتعاش السوق على نطاق واسع إلى تعزيز الطلب على صناديق ETF، بينما قد يبقي الضعف المستمر XRP قريبًا من مستويات الدعم.
الخلاصة الرئيسية
يقول الكثيرون إن توقعات XRP تتشكل من خلال صراع بين التفاؤل المدفوع بصناديق ETF وضغط عمليات البيع المكثفة. وقد عبر المحللون عن أن النظام البيئي الأساسي يزداد قوة من خلال التكامل المؤسسي؛ ومع ذلك، لا يزال السعر عرضة للانخفاض مع توزيع الحيتان وتأثير الظروف الاقتصادية الكلية على الأصول عالية المخاطر. تعتمد الحركة الرئيسية التالية على ما إذا كان XRP سيتمكن من استعادة منطقة 2 دولار، وجذب تدفقات صناديق ETF المستمرة، والاستفادة من أي انتعاش أوسع في سوق العملات الرقمية. سيحدد توازن هذه القوى المسار حتى عام 2026.
رؤى فنية حول XRP
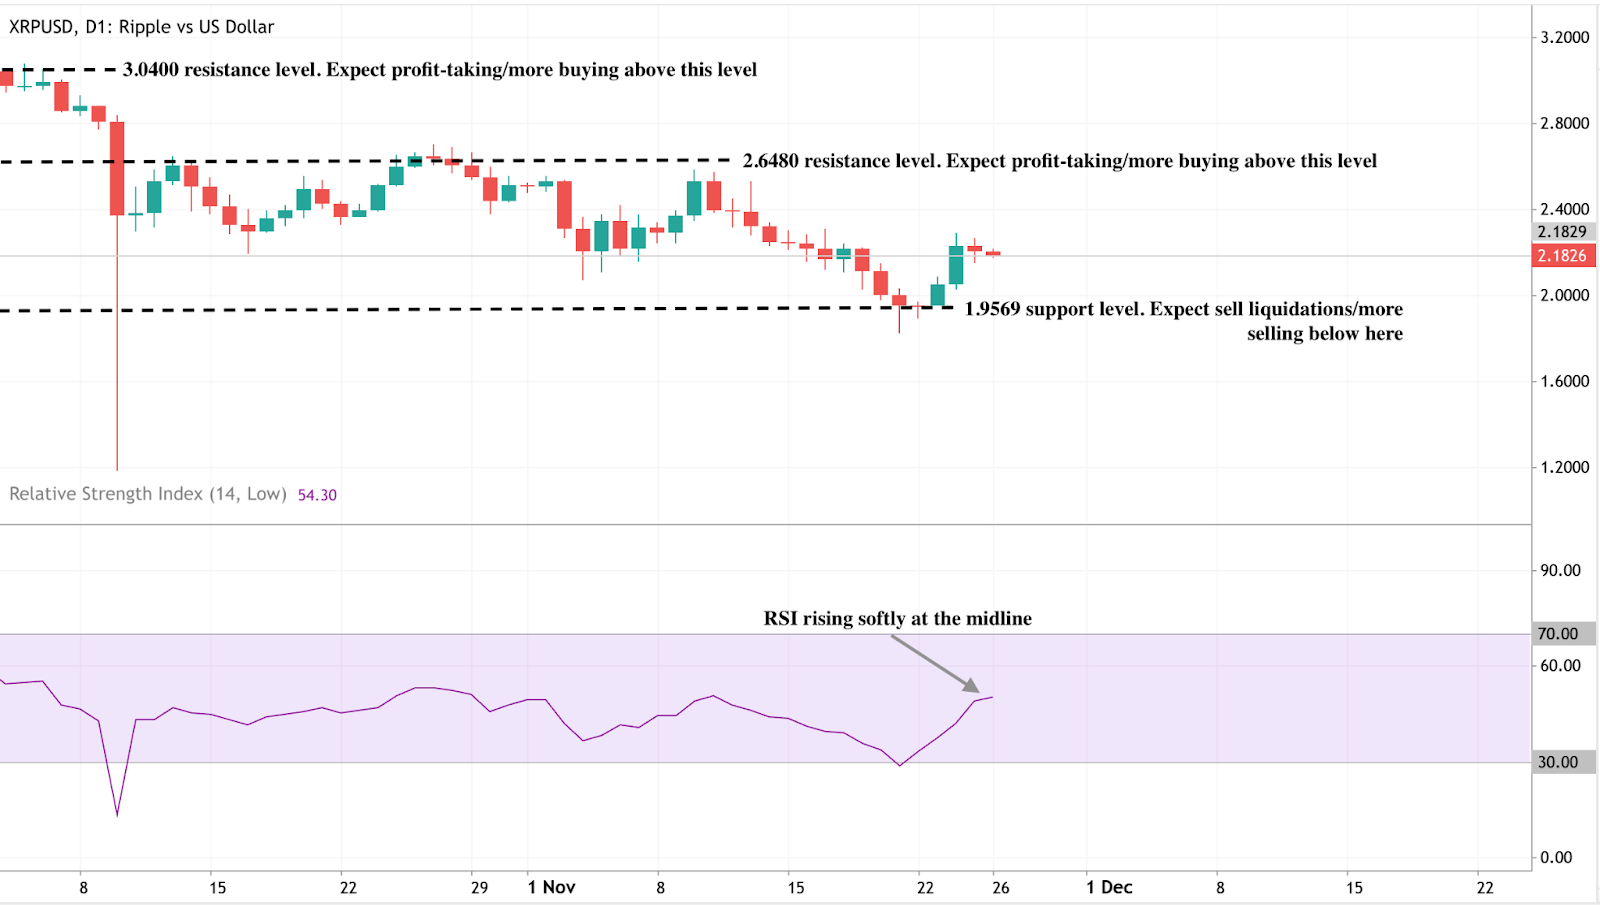
في وقت كتابة هذا التقرير، يتداول XRP/USD حول 2.1800 دولار، بين مقاومة رئيسية عند 2.6480 دولار ودعم قوي عند 1.9569 دولار. قد يؤدي كسر الدعم إلى تصفية مراكز البيع، بينما قد تجذب التحركات فوق 2.6480 أو 3.0400 دولار عمليات جني أرباح أو اهتمامًا جديدًا بالشراء.
يرتفع مؤشر القوة النسبية (RSI) تدريجيًا من خط المنتصف عند حوالي 54، مشيرًا إلى تعافٍ طفيف في الزخم دون الإشارة بعد إلى ظروف تشبع الشراء.
.png)
Google’s AI comeback: Has the sleeping giant finally awoken?
Google has been criticised for years for lagging behind OpenAI, especially after ChatGPT exploded in late 2022 and reshaped the AI landscape.
Google has been criticised for years for lagging behind OpenAI, especially after ChatGPT exploded in late 2022 and reshaped the AI landscape. Yet the company’s recent streak of breakthroughs has triggered a dramatic reappraisal.
At the centre of this shift is Gemini 3, Google’s newest flagship AI model, which has impressed analysts with its performance in reasoning, coding and specialised tasks that traditionally stump chatbots. As demand grows for both cloud compute and Google’s custom AI chips, investors are beginning to question whether Google’s comeback is already underway - and whether the AI race is entering a new phase.
What’s driving Google’s resurgence
Alphabet has gained substantially since mid-October, sending shares to $323.64 and bringing it within reach of the $4 trillion club.
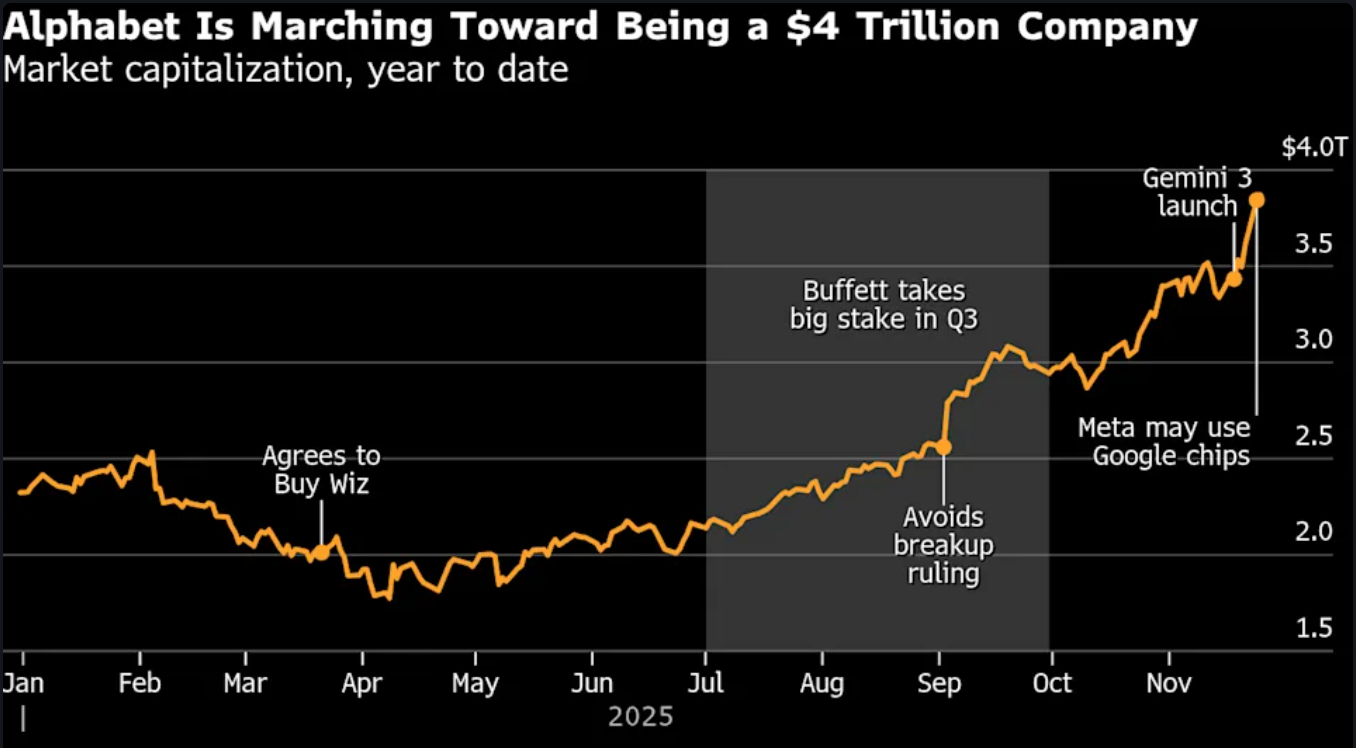
Google’s return to form is rooted in a combination of technical breakthroughs and strategic repositioning. The launch of Gemini 3 captured global attention after the model surged to the top of AI leaderboards such as LMArena and Humanity’s Last Exam, winning praise from analysts and technologists for its reasoning ability and performance on complex science tasks
Its improved reliability in generating images with accurate embedded text - a challenge that has plagued many chatbots - signals a maturity necessary for enterprise adoption. At the same time, Google has refreshed its AI product suite, including updates to its viral Nano Banana generator, which reinforces momentum across both consumer and developer segments.
The second force propelling Google forward is its deep investment in infrastructure. Once criticised for falling behind Microsoft, OpenAI and Nvidia, the company now benefits from rising demand for Google’s Tensor Processing Units (TPUs) - a specialised chip architecture Google has refined for over a decade.
Reports that Meta is in talks to deploy Google’s chips in its data centres by 2027 triggered a rally in Alphabet stock, demonstrating that Google’s hardware ecosystem may finally offer a meaningful alternative to Nvidia’s dominant GPUs. Partnerships with Anthropic - potentially involving up to 1 million TPUs - further signal a structural shift in AI compute preferences.
Why it matters
Google’s resurgence has implications far beyond its own balance sheet. As Neil Shah of Counterpoint Research put it, “Google has arguably always been the dark horse in this AI race — a sleeping giant now fully awake.” . If Gemini 3 continues to outperform expectations, it may reshape competitive dynamics between the three pillars of modern AI: OpenAI for model innovation, Nvidia for hardware, and Microsoft for cloud and enterprise distribution. A strengthened Google challenges this equilibrium, creating new strategic options for companies seeking alternatives to Nvidia’s high-cost GPUs or Microsoft’s deep integrations with OpenAI.
The return of competitive balance is also important for consumers and regulators. Google escaped the most severe outcome in a US antitrust case partly because AI competition has intensified. If Google proves it can innovate at scale, it may relieve pressure on regulators while accelerating the adoption of AI products beyond search advertising.
Units like Waymo, which is expanding into multiple cities and now supports highway driving, illustrate how Alphabet’s deep research pipeline fuels progress beyond software. The question is whether Google can convert technical superiority into commercial leadership - something it has historically struggled with outside advertising.
Impact on industry, markets and consumers
Google’s ascent poses both opportunity and disruption across the tech landscape. Nvidia, which lost $150 billion in market value on the day Meta’s chip discussions were reported, now contends with the prospect of a viable alternative for certain AI workloads. While Nvidia insists its GPUs remain the industry’s Swiss Army knife - flexible, widely supported, and essential for model training - TPUs give Google a niche advantage. As ASIC-based designs gain traction, analysts expect custom silicon to grow faster than the GPU market over the next several years.
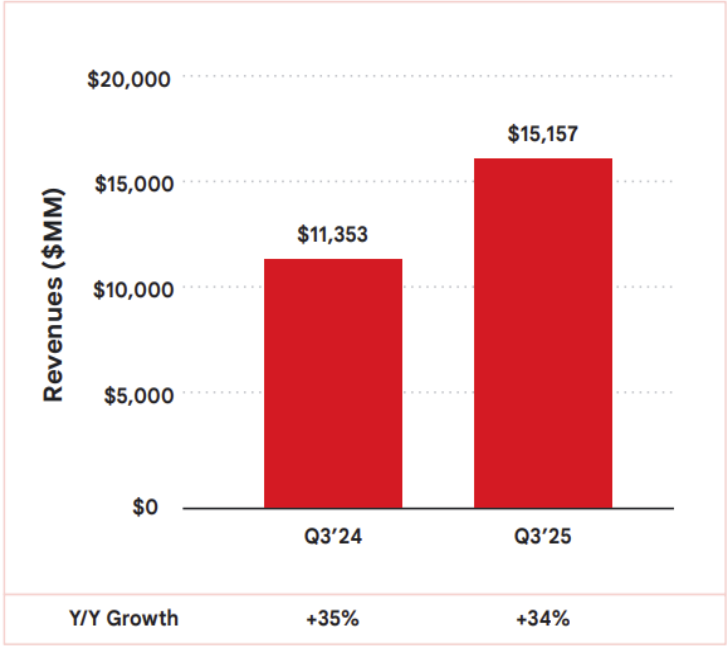
This shift has a significant impact on the broader cloud industry. Google Cloud, which generated $15.2 billion in third-quarter revenue - up 34% year-on-year - remains behind AWS and Microsoft Azure, but the demand for generative-AI compute is narrowing the gap.
Companies attracted by TPUs' cost efficiency may choose Google Cloud for specialised workloads, while still relying on Nvidia GPUs for general tasks. For consumers, the competition translates into better AI experiences: models with stronger reasoning, fewer errors, and safer behaviour.
Across financial markets, Alphabet’s rally affects index weightings and rotation patterns. As traders reassess Google’s valuation, volatility in Nvidia, AMD, Microsoft and Meta increases - creating opportunities for directional and event-driven strategies on platforms like Deriv MT5, where both tech stocks and index CFDs see heightened activity during AI-driven shifts. Tools such as the Deriv Trading Calculator help quantify margin impact and manage exposure as market reactions intensify.
Expert outlook
Forecasts for Google’s next phase remain divided. Some analysts argue that Google’s resurgence marks a long-awaited payoff from its “full-stack” strategy - controlling data, models, chips, cloud and applications. CEO Sundar Pichai emphasised during the last earnings call that this unified approach “really plays out” when scaling frontier models that integrate reasoning, multimodal capabilities and advanced coding. If Google continues to refine its ecosystem, it could rival or surpass OpenAI in enterprise adoption while weakening Nvidia’s dominance in hardware.
Yet uncertainties persist. Data revealed consumer adoption of Gemini still lags behind that of ChatGPT, with 650 million users compared to ChatGPT's 800 million weekly users, and monthly downloads of 73 million, which trail ChatGPT’s 93 million. Google Cloud, although accelerating, is still half the size of AWS and Azure.
It was noted that if Google cannot convert its technological strength into sustained commercial traction, the gap could widen again. Much will depend on whether Meta and other AI-intensive companies formalise their TPU commitments and whether Gemini 3 continues outperforming rivals in real-world deployments. The next six to nine months will be decisive, according to analysts.
Key takeaway
For market watchers, Google’s rapid AI resurgence suggests the company has moved far beyond its defensive posture of recent years. Gemini 3’s strong performance, rising TPU adoption and fresh cloud momentum have revived Alphabet’s standing in the global AI race. Yet the outcome is far from settled.
The next phase hinges on whether Google can scale its breakthroughs commercially while sustaining hardware and model performance. Traders and analysts await confirmation from enterprise adoption, chip-supply agreements and quarterly cloud-revenue growth - the indicators that will decide whether this comeback becomes a lasting transformation.
Alphabet technical insights
At the start of writing, Alphabet (GOOG) has broken into a price discovery zone above $323, signalling strong bullish momentum after an extended run along the upper Bollinger Band. Key supports sit at $268.75 and $240, where a drop below either level could trigger sell liquidations or deeper pullbacks.
The RSI, now around 74, is approaching overbought territory, highlighting stretched conditions that may lead to short-term cooling or consolidation, even as the broader trend remains firmly upward.


Gold’s November surge: From $4,000 barrier to all-time highs. What’s really happening?
Imagine waking up to headlines screaming 'Gold Smashes Past $4,300,' and no, it’s not a dream; it has been the reality of October 2025.
Imagine waking up to headlines screaming 'Gold Smashes Past $4,300,' and no, it’s not a dream; it has been the reality of October 2025. Now, November’s keeping the momentum alive with prices hovering near $4,132 as of 25 November 2025. If you’re wondering whether this shiny metal remains a smart addition to your financial mix, stick around. We’re breaking down the fresh data, historical peaks, and practical takeaways without the hype.
Why is gold climbing so sharply in late 2025?
The gold spot price breached $4,100 per ounce on November 24, a 1.65% increase from the prior day, driven by investor bets on U.S. Federal Reserve rate cuts amid cooling inflation signals. This isn't random volatility; it's a response to broader economic jitters. Geopolitical tensions, like ongoing Russia-Ukraine talks, add a layer of safe-haven demand, pushing prices up even as crude oil dips on "peace" rumours.
Breaking it down: Central banks worldwide are projected to acquire over 900 tons of gold in 2025, according to reports, surpassing demand for jewellery and technology. This institutional buying creates a floor under prices - think of it as a global vote of confidence in gold as a hedge against currency wobbles.
For everyday folks, it means reviewing your asset allocation might reveal whether gold’s 58% year-to-date gain (from -$2,600 in January) aligns better with your risk tolerance now than it did during last year’s flatline.
How close is gold to its historic peaks, and what do the charts say?
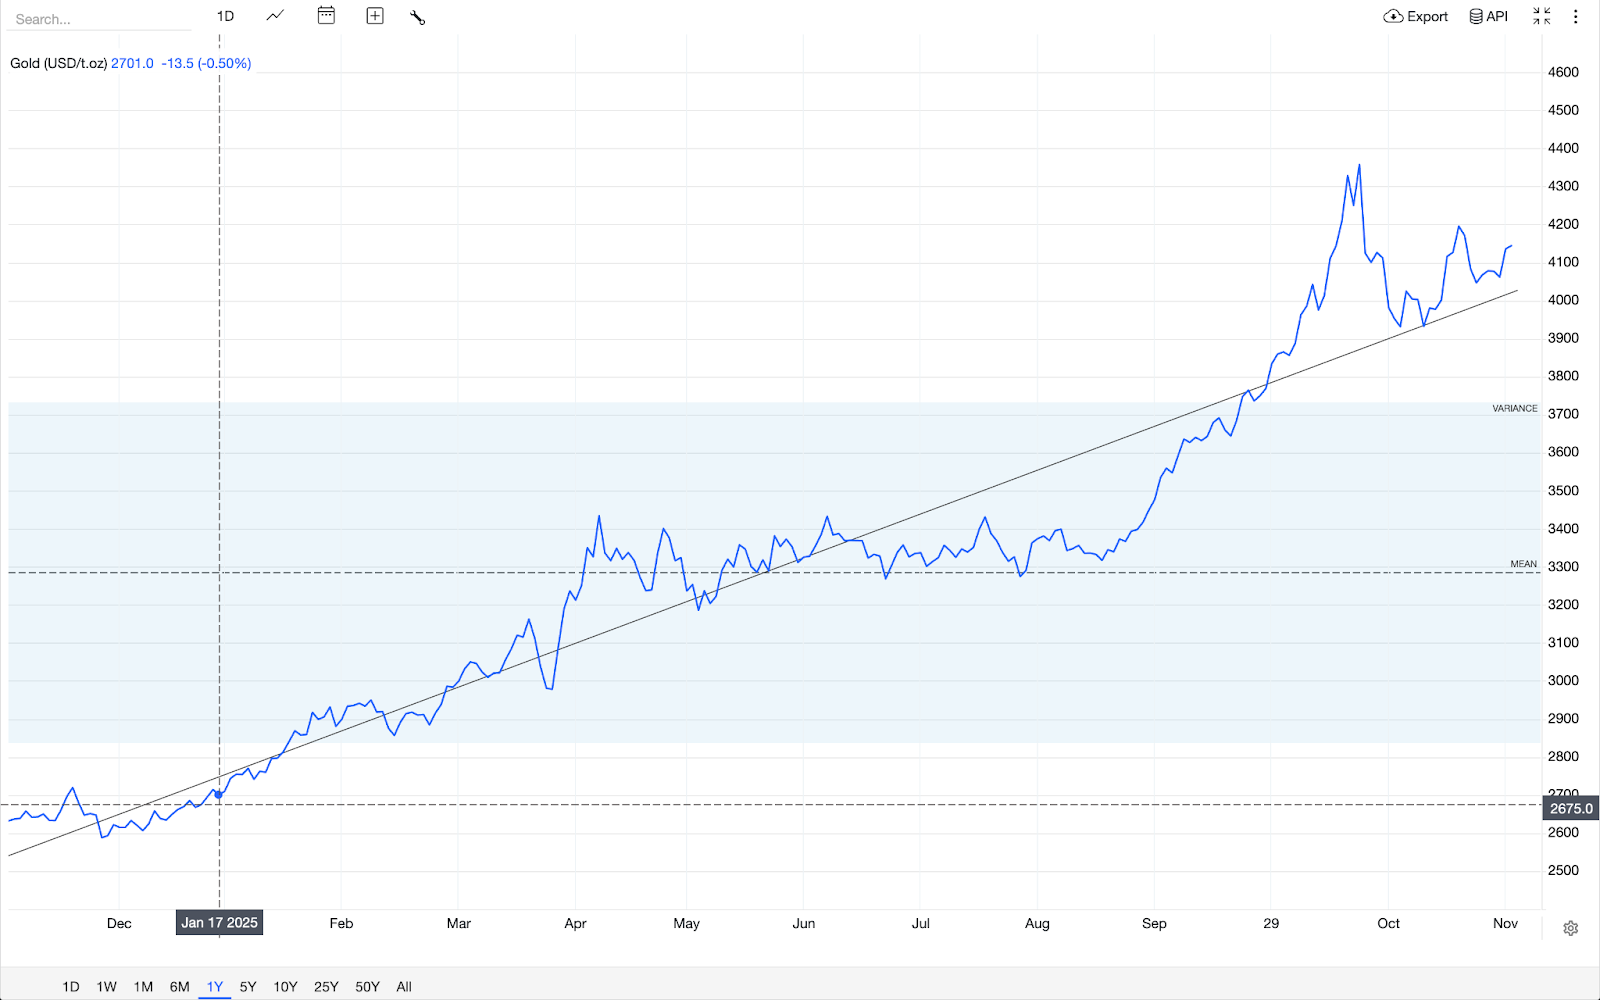
Gold’s all-time high? $4,379.13 on October 17, 2025, eclipsing the inflation-adjusted 1980 record of about $3,400 (when an ounce topped $850 nominally). Fast-forward to November: Spot prices traded between $4,046 and $4,145 on 24 November, coiling in a bull pennant pattern on daily charts - a setup that hints at continuation if it breaks upward, based on Kitco’s intra-day analysis.
Visualise this: On a 5-minute Comex futures chart, gold is hugging the 50-period moving average as support around $4,010, with resistance at $4,108. Zoom out to weekly: It’s testing the upper Bollinger Band after a 3.7% monthly rise.

Historically, such consolidations after highs (like the post-2020s $2,070 peak) often precede 10-15% corrections or fresh legs up - a reminder to track these levels when assessing gold’s role in long-term savings, such as in a retirement portfolio.
Expert take: "Gold’s resilience stems from its inverse correlation to real yields,” notes FX Empire analyst Yoav Niv, who points to the metal’s consolidation amid delayed U.S. data releases. Actionable angle? If inflation reports this week nudge yields lower, gold could revisit its October high - use that as a cue to compare gold’s performance against your bond or cash holdings.
Gold’s role in everyday portfolios
Hypothetically, let’s consider a mid-40s couple in Chicago, facing 7% inflation that ate into their savings in 2024. So, they shifted 5% of their nest egg to a gold ETF in early 2025; by November, that slice would have grown 58%, offsetting spikes in grocery and housing costs. Nothing magical here, but gold acting as a diversifier when stocks wobble.
Or take an example of a small business like a jeweller who rode out November’s uptick by locking in supplier rates at $4,000, buffering against dollar strength that hammered imports. The insight? Gold isn’t just for vaults; it’s a tool for smoothing cash flow volatility.
Scan your expenses - if currency fluctuations hit suppliers or travel, a modest gold exposure (via accessible ETFs) could stabilise planning without overcomplicating things.
November’s gold action underscores its enduring appeal: a buffer against the unpredictable. Whether eyeing historic charts or current consolidations, the key is integration - weave it into your financial story thoughtfully.
Gold technical insights
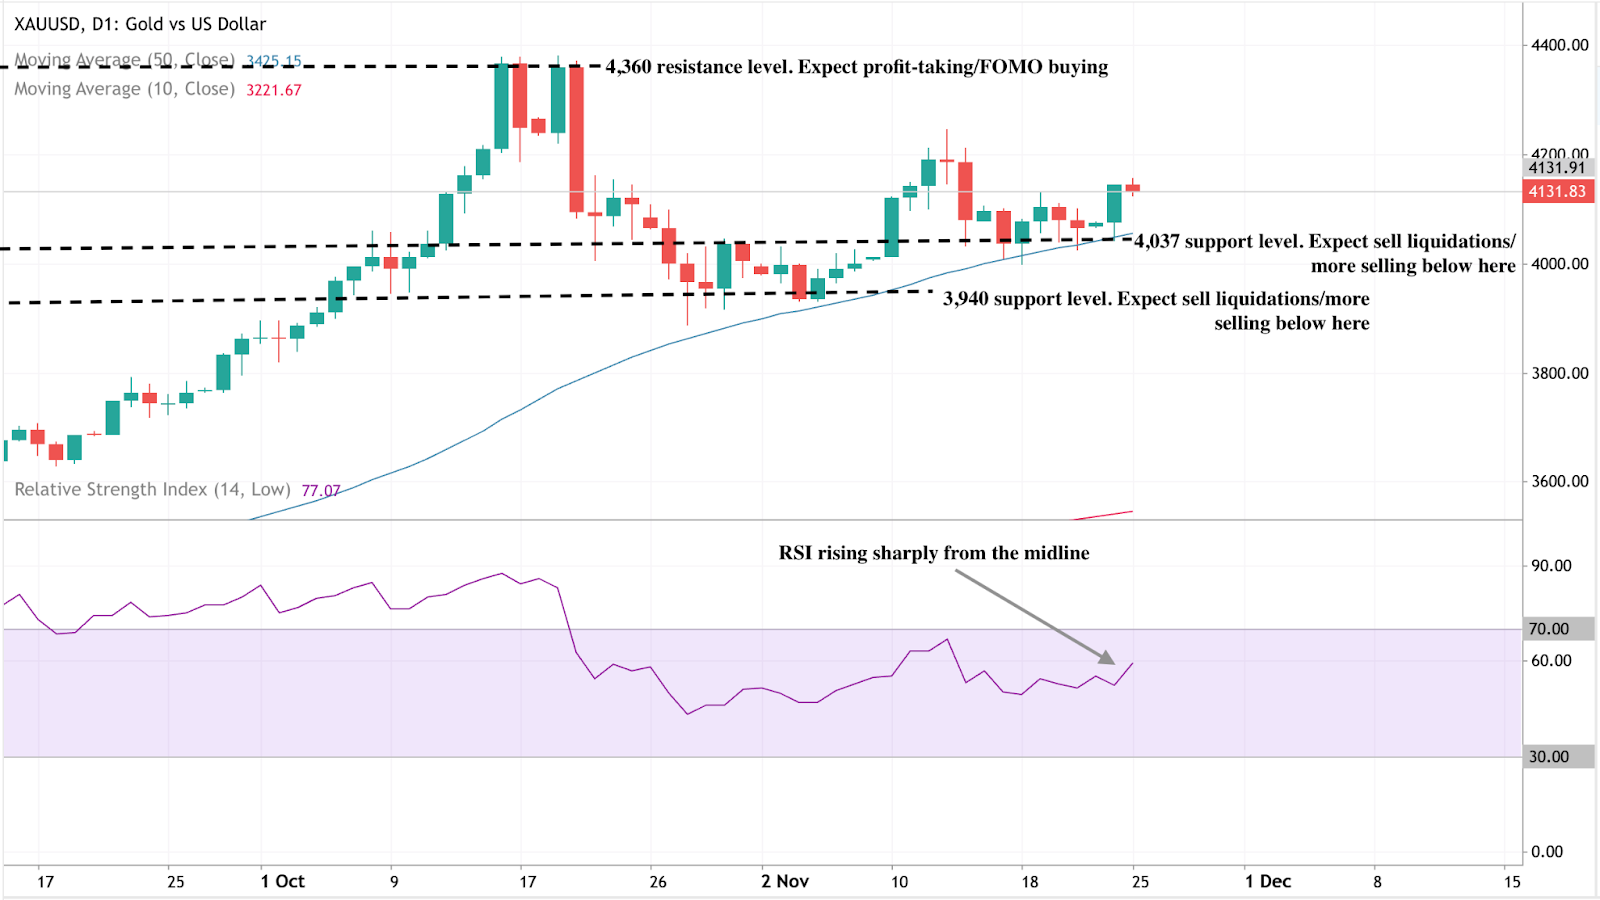
At the start of writing, Gold (XAU/USD) is trading near $4,132, maintaining bullish momentum above key supports at $4,037 and $3,940. A sustained move above these levels suggests buyers remain in control, though a drop below either could trigger sell liquidations.
The $4,360 level stands out as a major resistance, where traders may take profits or new buyers could enter on FOMO sentiment. Meanwhile, the RSI has surged to around 77, rising sharply from the midline - a signal of strengthening momentum but also a potential sign of overbought conditions that could invite short-term pullbacks.

The tech stock rally: Is this the start of a new cycle?
This week’s sharp rebound in tech stocks poses a compelling question: Is this more than just a bounce?
This week’s sharp rebound in tech stocks poses a compelling question: Is this more than just a bounce? With the Nasdaq Composite jumping 2.7% and the S&P 500 up roughly 1.5% as investors embraced both AI momentum and hopes for a December rate cut, the tone has shifted, according to reports.
The deeper issue, however, is whether this marks the beginning of a new tech cycle, underpinned by accelerating AI deployment and cheaper capital, or simply a rally within an existing one. The following insights examine what drives the move, its significance, its impact on markets, and what comes next.
What’s driving the tech stock rally
Market watchers say that at the heart of the current advance lie two forces: renewed confidence in AI-led innovation and fresh traction in monetary policy expectations. On the policy side, signals from the Federal Reserve, including Governor Christopher Waller and President John Williams of the New York Fed, have bolstered expectations for a December rate cut, helping to lift growth-stock valuations.
The reduction in discount rates on long-term earnings tends to favour tech firms, which rely on high forward-rate growth. Parallel to that, the AI story remains central. Firms such as Alphabet Inc. surged after enthusiasm for its Gemini model, while the “Magnificent Seven” pulled the broader tech cohort higher.
The market appears to be reconciling the earlier pullback (driven by bubble fears) and repositioning into stocks that benefit from the AI infrastructure build-out, including chips, cloud, and software. The question now is whether this is the launch of a new growth wave or simply the next leg of the existing one.
Why it matters
If tech is entering a new cycle, the implications extend far beyond a handful of large-cap stocks. These companies increasingly lag behind not only in market weight but also in shaping index trajectory, sector rotation, and investor psychology. As one analyst observed: “Scepticism around AI cap-ex might be a contrarian positive” for the trade in the long term.
For institutional and retail investors alike, the timing could matter: a true cycle shift may favour growth and innovation over value, alter asset-allocation flows, and provide a greater runway for risk assets. Conversely, if this is not a new cycle, then mispricing valuations could lead to sharp reversals. For corporates - from chip fabricators to SaaS startups - the cost of capital, demand for AI services, and global semiconductor supply chains all hinge on how the cycle evolves.
Impact on the market and industry
A credible new tech cycle would signal substantial real-world change: surging investment in data-centres, exponential scaling of AI models, and ecosystem shifts toward cloud-native, AI-first companies. We’re seeing some of that. Analysts estimate that AI could add $5-19 trillion in incremental revenue to US companies, although many warn that much of this may already be priced in.
In market terms, a cycle change could reinvigorate under-weight tech portfolios, trigger rotation out of value/cyclicals and reshape the “growth vs. value” trade. For the industry, this means that winners will likely emerge among firms that scale AI profitably, while laggards will face margin pressure, heavier capital expenditure burdens, and competitive erosion. The stakes are high: the surge could be transformative - but the infrastructure and competitive demands are intense.
For the market, that means volatility is likely to stay elevated. Traders balancing positions on platforms like Deriv MT5 can use advanced order types, leverage settings and stop-loss controls to navigate sharp swings. Understanding margin impact and exposure - via the Deriv Trading Calculator - is increasingly essential as the cycle matures.
Expert outlook
Looking ahead, professional traders note that key signals to monitor include inflation trajectories, clarity on Fed policy, earnings from major tech companies, and progress on supply-chain goals in the AI build-out. Markets currently price in a high probability of a December rate cut, but if inflation proves persistent or earnings disappoint, momentum could stall.
Some strategists caution that we may simply be in yet another leg of the initial tech-cycle rather than in the dawn of a fresh era. For instance, Goldman Sachs analysts suggest much of the potential upside from AI is already embedded in current valuations.
This means that while the upside exists, the risk-reward becomes less attractive. The best scenario: a renewed tech cycle with broad-based participation. The risk: concentrated gains, fading momentum and underlying disillusionment. Either way, the next few months will be critical.
Key takeaway
The surge in tech stocks carries more than a feel-good bounce - it could mark the opening stages of a new cycle where AI deployment and supportive policy drive sustained growth. However, the caveats remain substantial: valuations are stretched, execution risk is real, and macroeconomic headwinds loom. Investors should watch upcoming inflation data, Fed commentary and earnings from tech heavyweights as signals to validate the shift. The moment is promising, but not yet definitive.
Alphabet technical insights
At the start of writing, Alphabet’s stock (GOOG) has entered a price discovery zone above $318, signalling strong bullish momentum. The $280 and $238 levels act as key supports - a break below these zones could trigger sell liquidations or deeper corrections.
Meanwhile, the RSI has climbed to around 74.5, pushing into overbought territory, suggesting that the stock may face short-term profit-taking or consolidation before attempting further upside.

عذرًا، لم نتمكن من العثور على أي نتائج مطابقة لـ .
إرشادات البحث:
- تحقق من التهجئة وحاول مرة أخرى
- جرّب كلمة مفتاحية أخرى