结果

白银悄然超越黄金:涨势能否持续?
最新数据显示,白银本周上涨超过7%,逼近历史高点。
白银悄然超越黄金——但涨势能否持续?最新数据显示,本周白银上涨超过7%,推动XAG/USD逼近历史高点,感恩节期间流动性稀薄放大了每一次波动。通常作为焦点的黄金波动性减弱,而白银却凭借一波看似非季节性的飙升抢尽风头。
市场观察人士表示,这次突破背后的力量是真实存在的:美国零售销售疲软、消费者预期崩溃,以及市场隐含的12月美联储降息概率高达84%,这些因素共同加速了避险资产的需求。交易员们正在权衡这波涨势是节日临时错位的反映,还是结构性重新定价的早期阶段。这个问题——白银的超额表现能否持续——为后续市场分析定下基调。
是什么推动了白银的飙升?
白银最新的涨势处于宏观压力与流动性减少的交汇点。自2021年以来,美国零售销售名义上有所增长,显示消费者动力停滞,增长空间有限。会议委员会的预期指数已跌至63.2,这一水平历来预示经济衰退,强化了对防御性资产的抢购。

随着投资者重新评估美国需求路径,对经济敏感的金属反应最快——白银尤为明显。
美联储的转向加速了这一变化。市场迅速重新定价降息概率,几天内从50%跃升至84%。
纽约联储主席约翰·威廉姆斯及其他官员的言论表明,如果经济势头继续减弱,准备放松政策。随着国债收益率回落至一个月低点附近,美元走软,无收益资产获得了超额优势。白银对这些条件的敏感性解释了其涨势为何如此迅速且剧烈。
为何重要
分析师指出,白银的上涨不仅因涨势迅速,更因其所反映的意义。尽管黄金被誉为终极避险资产,白银自2023年10月以来已上涨163%,本月早些时候创下54.38美元的历史新高,远远超越黄金。这种超额表现令机构难以忽视,因为白银处于货币对冲与工业用途的交汇点。
他们还警告称,价格走势暴露了更深层的焦虑。KCM Trade首席市场分析师Tim Waterer指出,市场正对“鸽派言论合唱”作出反应,宏观指标疲软不断累积。他的评估指向一个更广泛的问题:白银上涨并非因经济增长强劲,而是因对美国经济前景的信心减弱。金属市场正实时吸收这种不确定性。
对市场和产业的影响
对白银交易者而言,涨势使假期期间市场定位更为复杂。参与度降低放大了日内波动,增加了对冲方向性风险的难度。在如Deriv MT5等执行速度和精准交易规模至关重要的平台上,这种环境要求交易者保持警惕。许多人越来越依赖Deriv交易计算器等工具,在承担白银剧烈日内波动前,测算潜在利润、掉期费用和仓位风险。
但更深层的故事在于工业领域。2024年,太阳能电池板制造对白银的需求跃升至2.437亿盎司,高于2023年的1.918亿盎司,且是2020年水平的两倍多。
随着全球太阳能装机容量预计到2030年将达到近1000吉瓦,需求预计每年再增长1.5亿盎司。然而供应依然受限:全球大部分白银产量是铜、锌、铅或黄金生产的副产品,价格信号难以迅速调节产量。Mining Technology估计,到2030年全球产量可能降至9.01亿盎司——这一结构性缺口强化了长期价格上涨的逻辑。
专家展望
专业交易员表示,白银涨势的可持续性取决于三个核心因素:美联储的下一步动作、美国消费走势以及工业扩张速度。如果政策制定者确认12月转向,较低的收益率和走软的美元可能成为推动价格创新高的催化剂。随着衰退信号愈发明显,避险资产需求不太可能迅速消退。
但一切尚未确定。消费者活动突然反弹或通胀意外可能减缓对政策宽松的预期。工业用户最终可能对高价产生抵触,尽管太阳能需求似乎足够强劲以吸收短期波动。目前,交易员正密切关注即将发布的宏观经济数据和Federal Reserve 沟通。若价格果断突破前高,可能表明市场已预期白银进入一个全新的定价周期。
关键结论
白银的飙升根植于真实的经济信号,从美国数据走弱到对近期降息预期上升。该金属已超越黄金,现正逼近历史高点,既受避险资金推动,也有强劲的工业需求支撑。涨势能否持续取决于美联储的表态和美国家庭的韧性,但更广泛的趋势指向供应收紧和需求持久。未来几周将揭示白银是仅仅一波反弹,还是全新周期的重新定价。
白银技术洞察
撰写时,白银(XAG/USD)交易于约53.79美元,随着接近关键的54.22美元阻力位,价格强势上扬。该区域可能吸引获利了结,但若能干净突破,鉴于当前涨势强劲,可能引发新一轮买盘。
下方关键支撑位于50.00美元和47.00美元。若价格回落至任一支撑以下,表明多头动力减弱,可能触发卖盘清算或更深回调,尤其是价格跌破Bollinger Band通道中轨时。
动能依然强劲,RSI急剧攀升至约80,处于明显超买区。这表明买方占优,但也警示短期可能出现疲软。尽管上升趋势保持完整,若超买状态持续,白银可能面临回调或横盘整理风险。


比特币的救赎之路:9万美元突破能否真正站稳?
随着比特币重新攀升至9万美元以上,其救赎之路已全面显现,引发了这一突破是否能真正站稳的疑问。
随着全球最大加密货币比特币重新攀升至9万美元以上,其救赎之路已全面显现,引发了这一突破是否能真正站稳的疑问。此举紧随几天前约8.04万美元低点的急剧反弹,主要受联邦储备可能在12月降息的预期上升以及市场整体回归风险资产的推动,据报道。
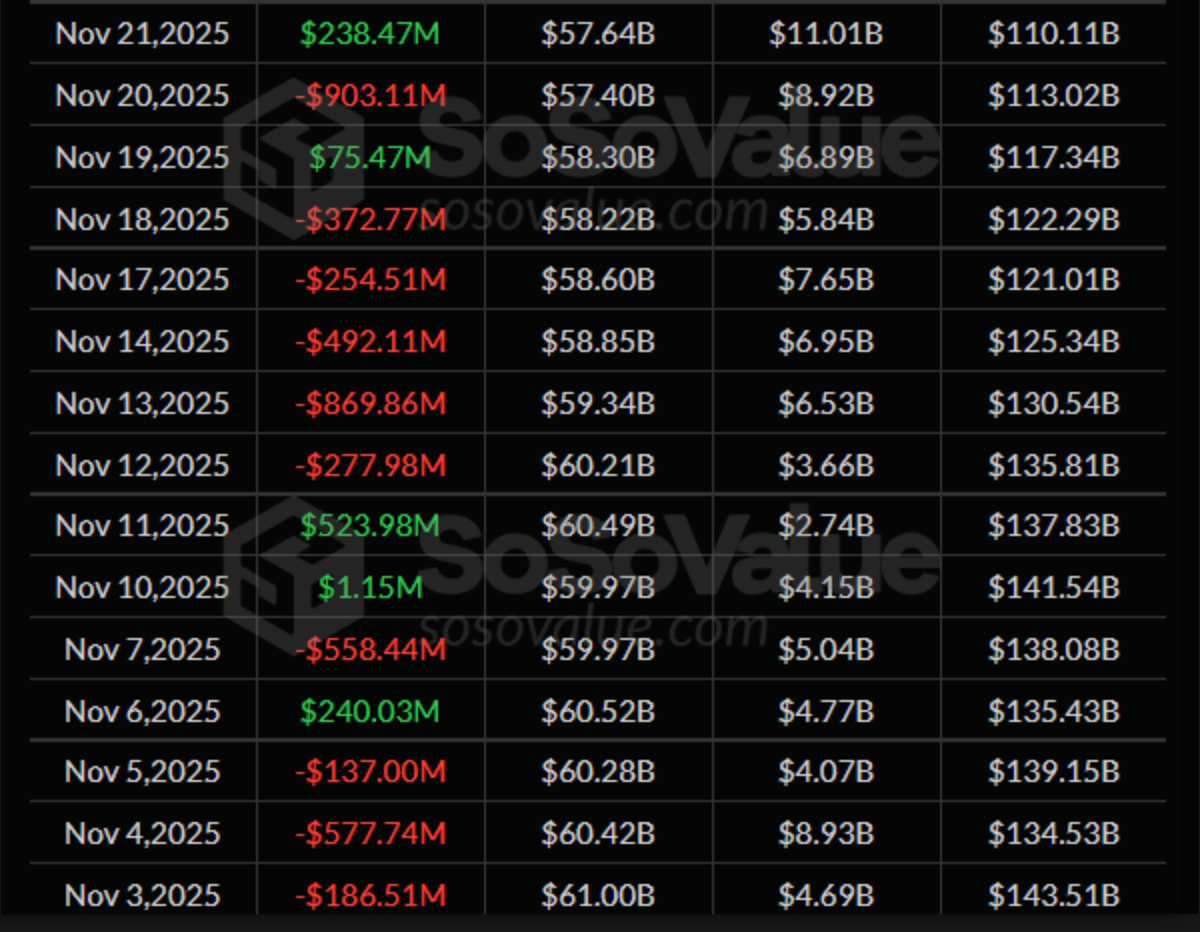
然而,比特币的反弹基础依然脆弱,现货ETF仍然流入疲软,月度表现显示BTC下跌近19%,凸显了反弹背后的不稳定基础。
分析师表示,这种新一轮乐观情绪与流动性恶化之间的紧张关系,现已成为市场情绪的主导。如果比特币要将此次复苏转化为持久动力,必须突破9.2万至9.5万美元区间的强大阻力,并吸引零售交易量和ETF参与的决定性回归。是否能出现这些条件,或突破是否会演变为另一轮调整性下跌,将决定比特币所谓救赎之路的下一章节。
推动比特币最新走势的因素
比特币最新的上涨部分得益于宏观预期的转变。交易者现在赋予12月联邦储备降息的可能性更高,这助推了股票和加密货币市场的风险偏好回升。
这种情绪转变帮助BTC在上周跌至8万美元区域后重新夺回9万美元关口。然而,背景更为复杂:通胀依然高企,QCP Capital的分析师警告称“供应可能会将BTC限制在9.5万美元中段”,暗示反弹可能接近尾声。
ETF市场情况则增添了另一层复杂性。经历数周创纪录的资金流出后,美国比特币ETF难以吸引持续的资金流入。分析师指出流动性依然稀薄,投资者需求仍显犹豫。
MicroStrategy——比特币最大的企业持有者之一——刚刚接近盈亏平衡点,且现已被列入MSCI退市观察名单,增加了机构持仓的不确定性。即使价格回升,这些压力依然潜藏,显示此次反弹更多依赖宏观头寸而非强劲的资金流入。
为何这很重要
价格走势与结构性指标之间的背离已成为投资者关注的焦点。Apollo首席经济学家Torsten Slok指出,比特币与纳斯达克的典型相关性在最近几周减弱,BTC的跌幅超过主要科技股基准。

这种脱钩引发了关于加密货币特有流动性问题的疑问,尤其是在股票市场趋于稳定之时。与此同时,10X Research的分析师警告市场可能过于信赖12月降息。他们的研究表明,比特币对Fed的沟通和语气反应更为敏感,而非实际政策动作。
如果鲍威尔发出谨慎信号或淡化未来宽松步伐,市场可能迅速逆转。该机构还质疑将财政部普通账户(TGA)支出视为加密流动性催化剂的假设,指出此前的TGA释放资金可能需要长达两个月时间才能反映在比特币价格上——如果能反映的话。
对行业、市场和消费者的影响
最新数据显示,比特币重新站上9万美元可能恢复了一定的心理信心,但结构性状况依然不均衡。该资产今年迄今仍下跌5%,ETF产品在经历大量资金流出后才刚刚稳定,这些流出助推了BTC跌至约8万美元。反弹带来缓解,但市场远未发出明确的上升趋势信号。
机构资金流动显示出转变的曙光。VALR首席执行官Farzam Ehsani表示,现货ETF周二迎来数周以来首次资金流入——“机构流动性回归的早期信号”。通过Deriv MT5监测价格行为的交易员注意到,9万美元作为结构性枢纽的重要性,短期内显示出多头尝试与获利回吐波动交替出现。同时,Deriv交易计算器对试图估算仓位成本和风险的交易员来说日益有用,因为BTC正试探重要阻力位。
市场观察人士称,比特币的表现继续影响更广泛的数字资产生态。若能果断守住9万美元以上,可能提振山寨币和稳定币市场的流动性。风险若被突破,可能引发强制抛售并削弱整个行业信心。
专家展望
QCP Capital认为,9.2万至9.5万美元区间形成明显阻力带,警告流动性收缩可能限制进一步上涨尝试。他们将8万至8.2万美元区间视为关键支撑区,买家在最近的抛售中予以守护。10X Research的分析师补充称,如果历史上的TGA流动性滞后持续,比特币可能会盘整至2026年1月底,降低快速突破的可能性。
并非所有策略师都认为底部已现。Compass Point分析师Ed Engel认为熊市常见“快速反弹后随即出现的强烈抛售”。他希望看到长期持有者的净积累以及期货市场更积极的空头头寸,才会转为看多。缺乏这些信号,Engel认为BTC在接近9.2万至9.5万美元时可能遭遇沉重阻力,或触发新一轮下跌。
关键要点
分析师指出,比特币重新站上9万美元标志着其持续救赎之路的象征性转折点,但此次反弹的基础依然薄弱。9.2万至9.5万美元附近的阻力、疲软的ETF资金流入以及历来脆弱的年末流动性环境,都对突破的可持续性构成挑战。
下一阶段将取决于市场如何消化联邦储备12月的政策信息,零售交易者是否回归,以及机构资金流入是否增强。这些力量将决定比特币的复苏是继续推进,还是在熟悉的阻力位止步。
比特币技术洞察
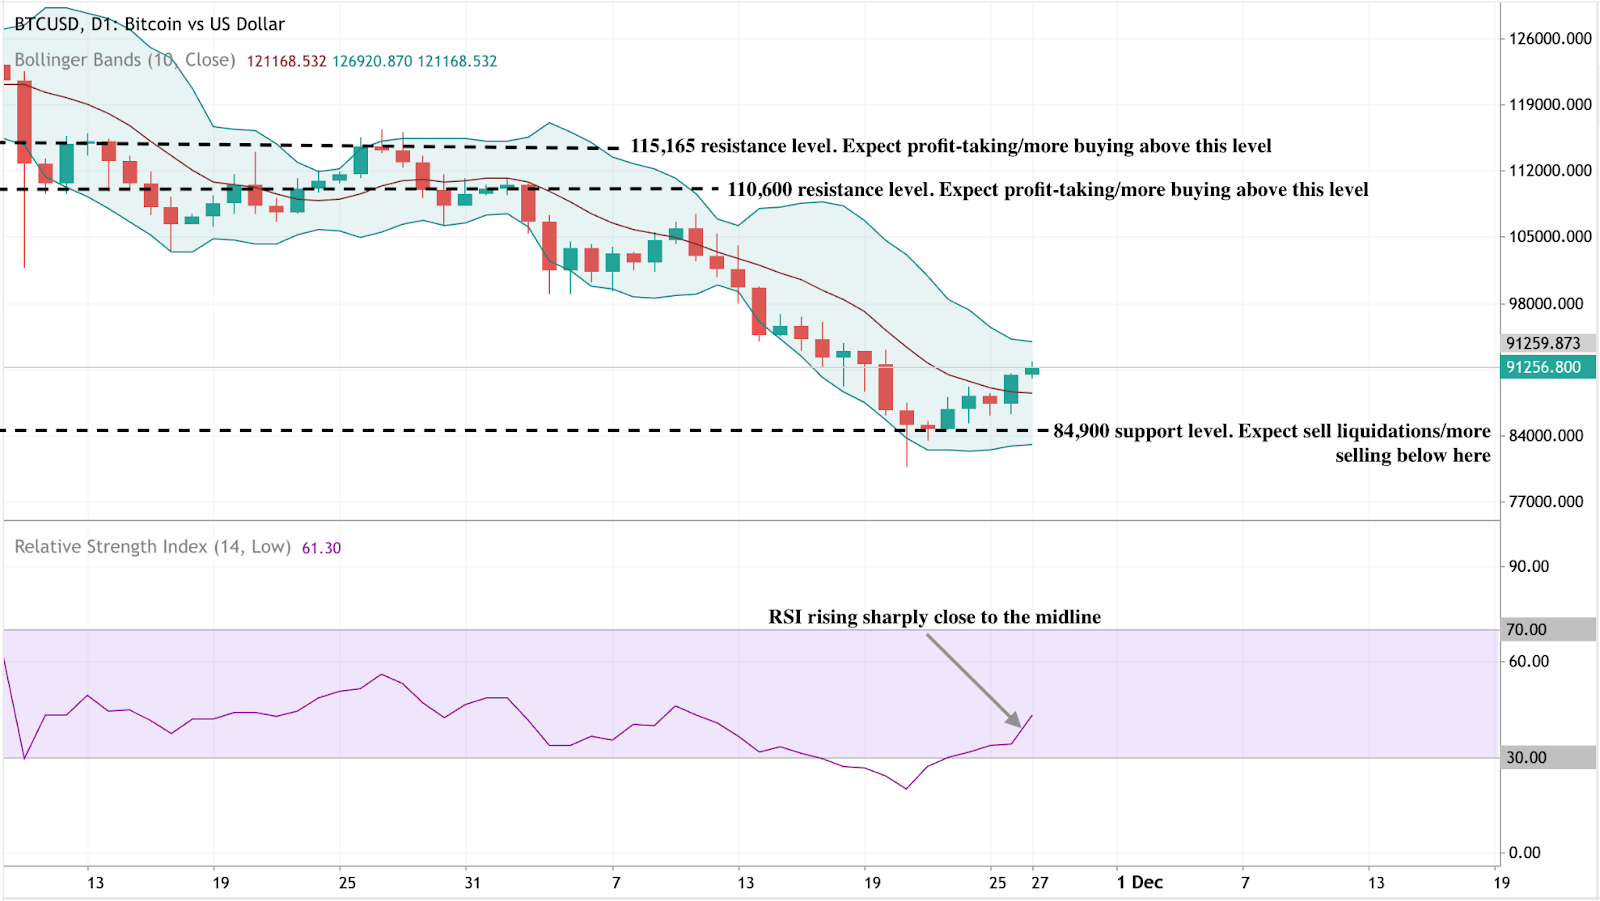
撰写时,比特币(BTC/USD)正试图从近期低点反弹,价格在关键的8.49万美元支撑区反弹后,交易于9.12万美元以上。守住该水平至关重要——若跌破,可能触发卖盘清算并重新开启下行趋势。上方,BTC面临两个重要阻力位:11.06万美元和11.5165万美元,交易者可能在此寻求获利了结或若价格积聚足够动能则重新买入。
价格走势仍受布林带限制,BTC在经历一段时间疲软后开始向中轨推进。这表明早期稳定迹象,尽管整体趋势仍偏谨慎,直到价格能干净利落地突破阻力区。
相对强弱指数(RSI)急剧上升至约61,经历超卖区后回升至中线附近。这一变化凸显看涨动能改善,但距离超买水平仍有较大空间,表明若买盘持续介入,反弹仍有上升空间。

BoJ vs Fed: How December decisions could shatter the yen’s fragile range
A potential BoJ rate hike clashing against near-certain Fed easing could finally tip the scales
December 2025 is poised to deliver a high-stakes policy showdown between the Bank of Japan (BoJ) and the US Federal Reserve, with USD/JPY hovering in a precarious 154–158 band, suggesting intervention is likely.
As of 27 November 2025, the pair trades around 155.91, down slightly from recent highs near 157.89 but still vulnerable to a break in either direction. A potential BoJ rate hike clashing against near-certain Fed easing could finally tip the scales - yen bulls are banking on a downside rupture, while bears eye a dollar rebound if either central bank disappoints.
The yen’s tightrope: USD/JPY’s November range
USD/JPY has been confined between the 154.00 support price and 158.00 danger zone price through much of November, a tug-of-war between persistent US yield strength propping up the dollar and mounting speculation on policy divergence.
The upper end-157-158-marks familiar "intervention territory," where Tokyo has deployed verbal and actual yen support in past episodes of rapid depreciation. This range persists amid a backdrop of weak yen-fueled inflation risks in Japan and cooling US data, which is tilting toward Fed cuts.
BoJ: A December hike edges into focus
BoJ rhetoric has sharpened on yen weakness as an inflation accelerant, with import costs now a key concern. A Reuters poll from 11-18 November revealed a slim majority - 53% (43 of 81 economists) - anticipating a 25 basis point hike to 0.75% at the 18-19 December meeting, up from prior surveys. All polled forecasters see at least that level by March 2026.
Easing political friction has helped: Prime Minister Sanae Takaichi’s recent nod to gradual normalisation, following talks with Governor Kazuo Ueda, has reduced near-term hurdles. Ex-BoJ insiders echo this, citing current levels as a catalyst for action sooner than later.
Fed: Overwhelming odds on a December cut
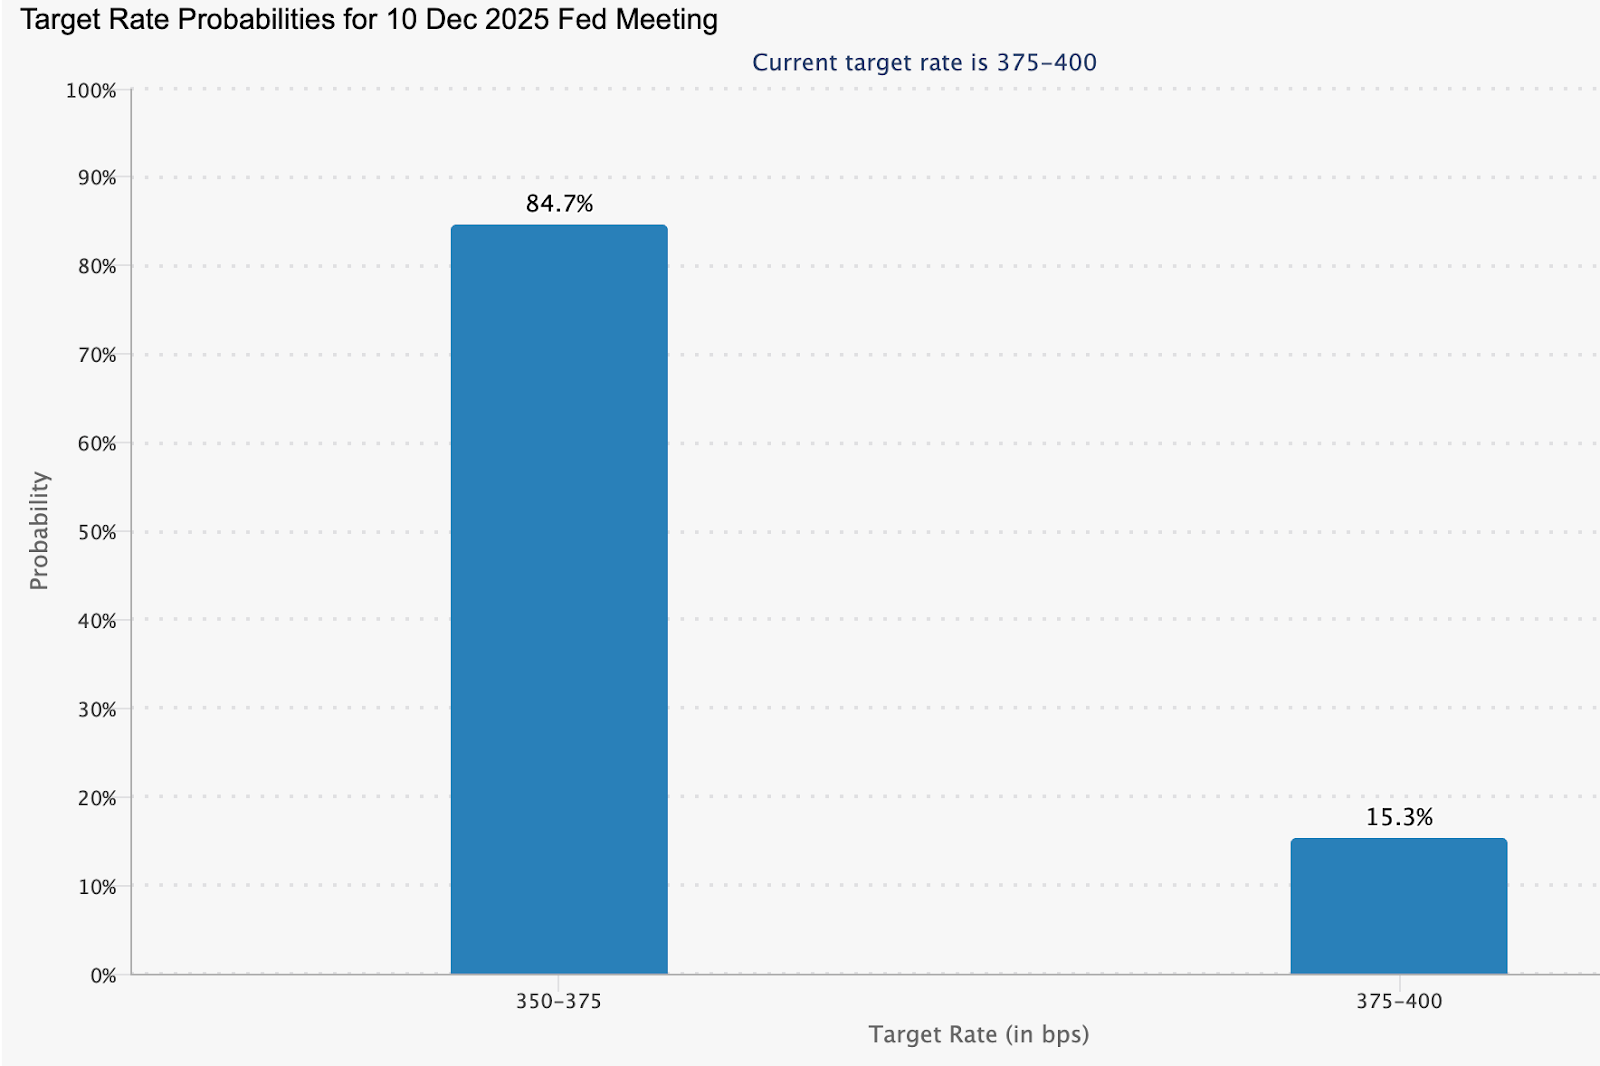
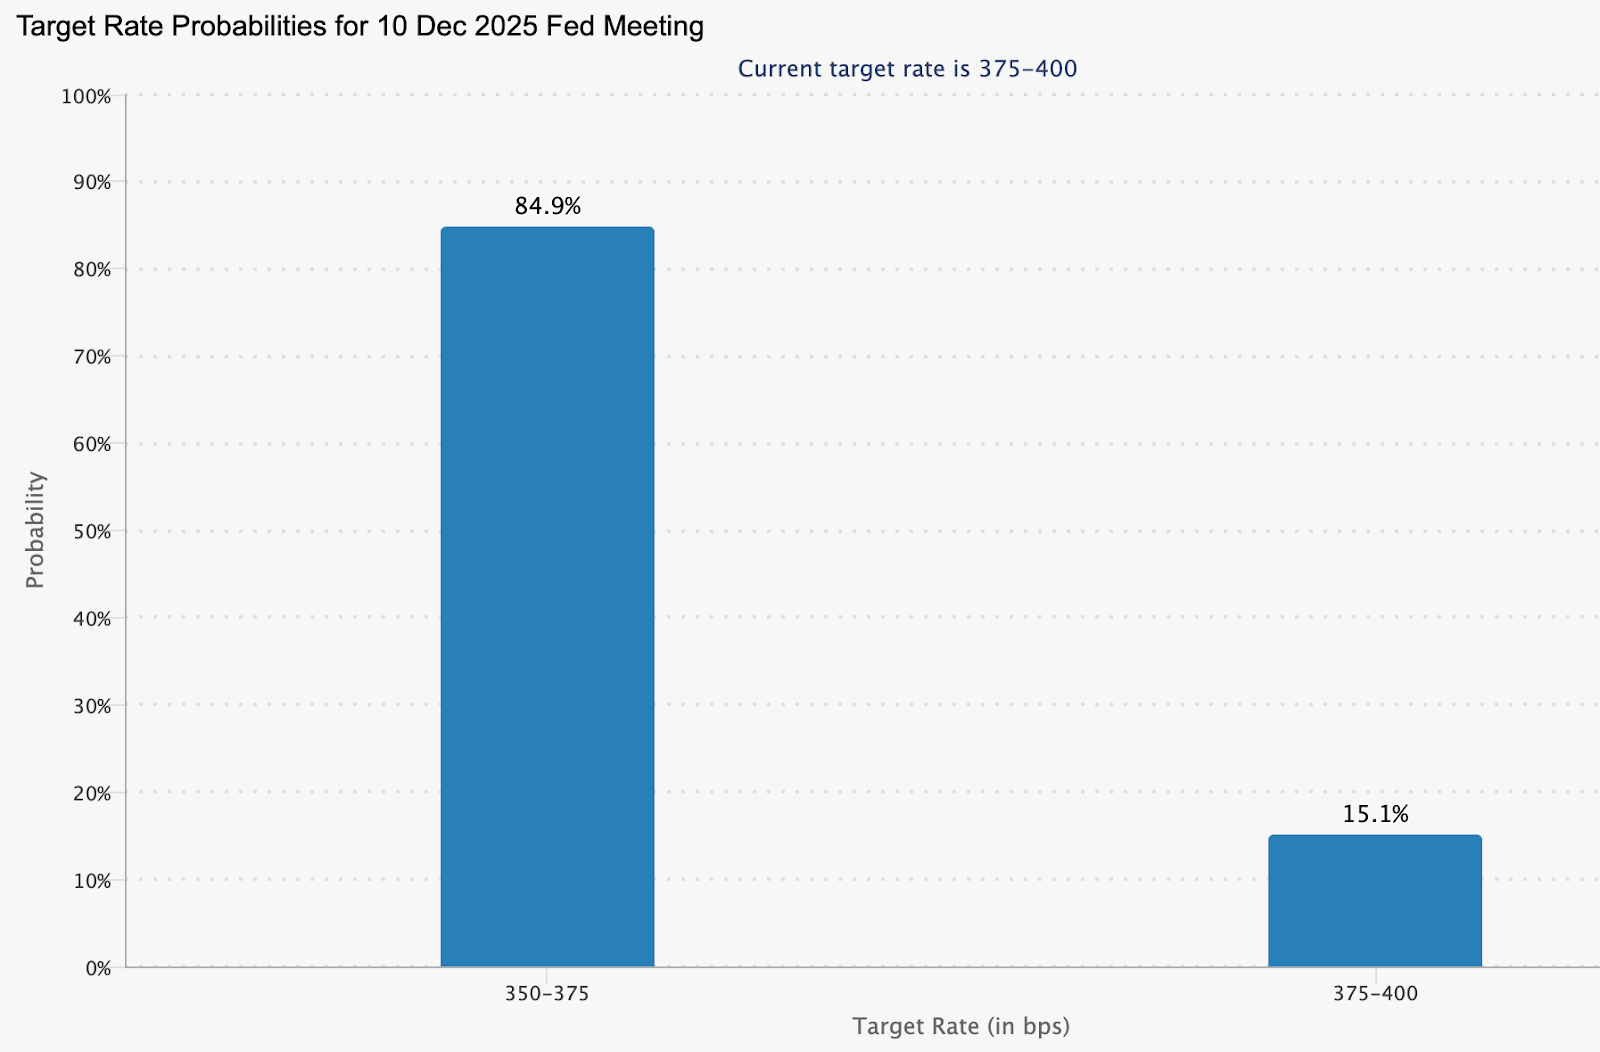
Market pricing leans heavily toward Fed easing, with the CME FedWatch Tool data as of 26 November showing an 84.9% probability of a 25-basis-point reduction at the 10 December FOMC meeting.
This reflects softer US indicators, including recent jobs data that hasn't derailed cut expectations despite some internal Fed debate. Such a move would trim the US–Japan yield gap modestly, offering tailwinds to the yen independent of BoJ moves.
Why it matters
The December decisions will determine whether the yen’s months-long stasis finally resolves into a trend - a critical shift for traders, Japanese policymakers, and multinational firms managing currency exposure. A break from the 154–158 range would influence capital flows, hedging strategies, and carry-trade dynamics at a time when global FX volatility is already rising.
For Japan, the stakes are especially high. A stronger yen would ease imported inflation and energy-cost pressures, while a renewed slide would intensify political scrutiny and prompt the Ministry of Finance to consider direct intervention. For the US, the Fed’s decision will signal how confidently it believes inflation is returning to its target, shaping global risk appetite as the year-end approaches.
Breakout scenarios: Two paths for USD/JPY
These outcomes hinge on post-meeting commentary - hawkish BoJ signals or dovish Fed dots could exaggerate moves.
What to monitor closely
- Event timeline: Fed decision on 10 December; BoJ on 18–19 December.
- Volatility gauges: One- and two-week option-implied vol expected to spike, signaling hedge flows.
- The intervention threshold of 157–160 remains a political flashpoint for Ministry of Finance action.
USDJPY technical insights
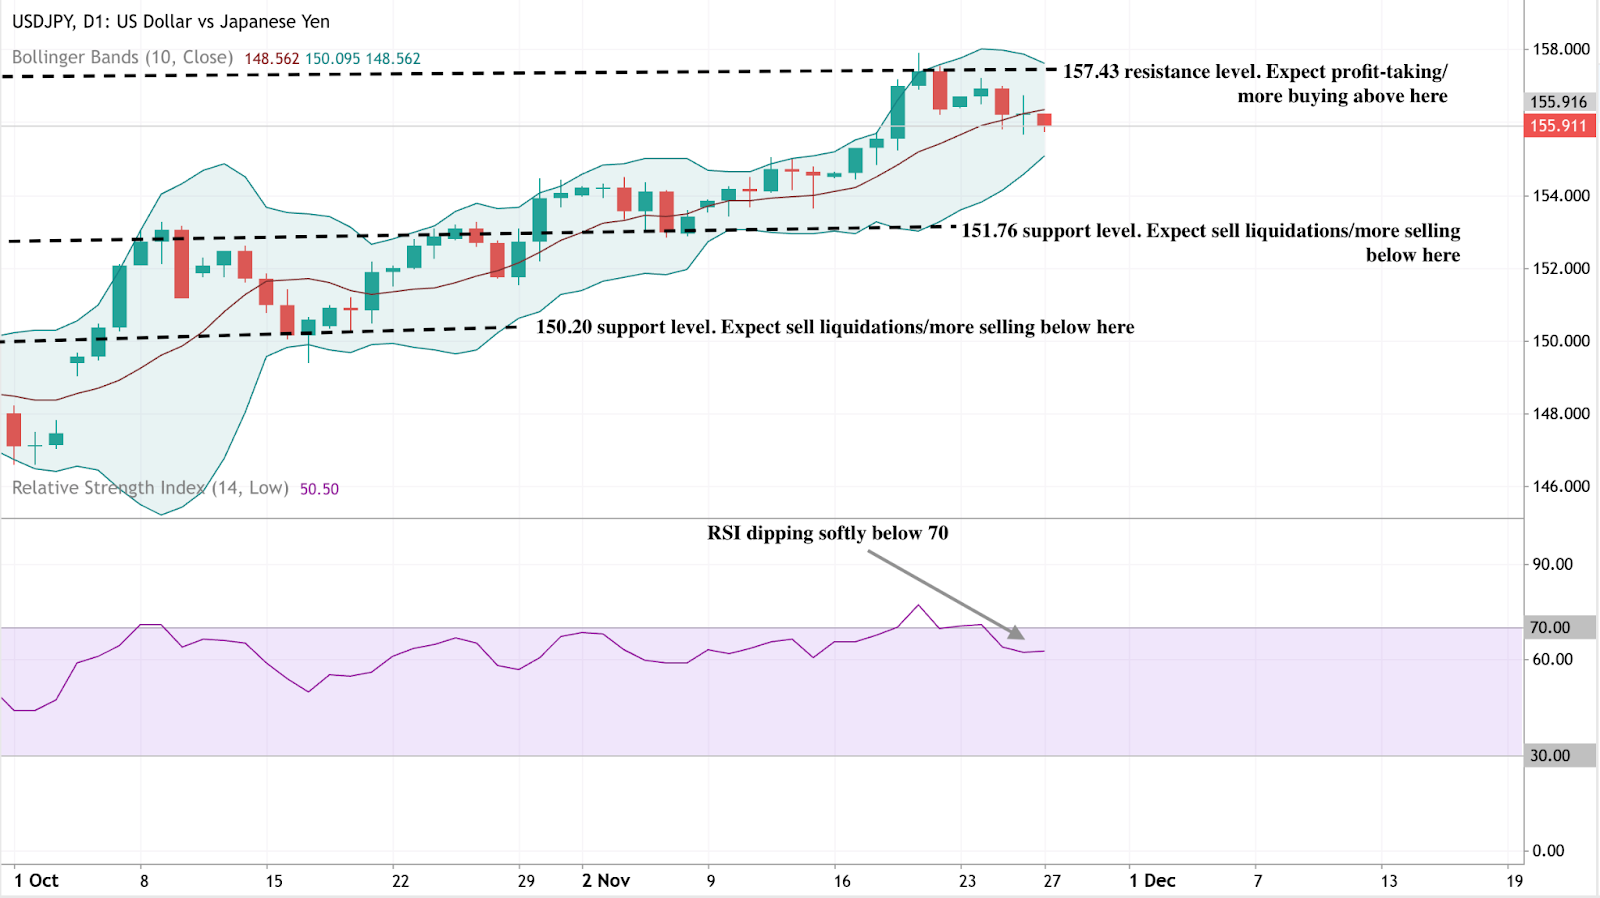
At the start of writing, USD/JPY is trading just below 156, easing slightly after failing to hold levels near the 157.43 resistance zone - an area where traders typically look for profit-taking or fresh upside breakouts. The pair now sits above two key supports at 151.76 and 150.20; slipping below either level could trigger sell liquidations and a deeper corrective move toward the lower Bollinger Band.
Despite the recent pullback, price action remains broadly constructive, with the pair still riding the middle Band and holding below the short-term moving averages.
The RSI, meanwhile, has dipped gently below 70, signalling that bullish momentum is cooling after a stretch of overbought readings. This soft decline hints at consolidation rather than a full reversal, suggesting the pair may trade sideways while the market waits for new catalysts, such as U.S. data or Bank of Japan commentary, to determine its next leg.

科技巨头2025年AI资本开支竞赛:Amazon以超1,250亿美元领跑
数据令人震惊。2025年,Amazon、Microsoft、Alphabet和Meta预计合计资本开支将达到3,600亿至4,000亿美元。
数据令人震惊。2025年,Amazon、Microsoft、Alphabet和Meta预计合计资本开支将达到3,600亿至4,000亿美元,同比增长约60%,其中绝大部分将用于AI相关基础设施(数据中心、定制芯片、GPU/Trainium集群)。
2025年11月24日,法国巴黎银行Exane首次覆盖Amazon,给予“跑赢大盘”评级,并设定320美元目标价——目前为主流券商中最高,较2025年11月26日约230美元的收盘价有约39%的上涨空间。
2025年资本开支指引——四大科技巨头
| 公司 | 2025年资本开支指引 | AI主要投入领域 |
|---|---|---|
| Amazon | 超过1,250亿美元(2025年多次上调) | AWS超大规模集群、Trainium/Inferentia芯片、主权及政府云 |
| Microsoft | 800亿–1,210亿美元(2026财年结束) | Azure扩展、OpenAI基础设施、企业级生成式AI |
| Alphabet | 约910亿美元(由850亿美元上调) | Google Cloud TPU、弥补历史产能短缺 |
| Meta | 700亿–720亿美元 | Llama模型、AI驱动广告、大型单体数据中心 |
来源:公司公告、财报电话会、法国巴黎银行Exane、BBC、彭博、路透
法国巴黎银行Exane为何对Amazon有不同看法
法国巴黎银行Exane的分析师认为,市场对Amazon在AI领域投资不足或落后的担忧被“夸大”了。根据公司披露的支出和项目储备,Amazon财务团队讨论了2025年约1,250亿美元的资本开支展望,预计2026年还会更高,并指出绝大部分资金将用于AI基础设施,如数据中心、网络和AWS自研加速器。
该报告强调了Amazon在本轮资本开支周期中的几大差异化优势:
- 垂直整合: 通过自研AI芯片(如Trainium和Inferentia),管理层认为相较完全依赖第三方GPU,能带来成本和效率优势,有助于未来价格和产能的灵活调整。
- 多元变现渠道: AI基础设施不仅支持AWS企业和政府工作负载,还能提升广告相关性、优化物流和改善面向消费者的服务,为Amazon带来多元化的收入转化路径。
- 长期利润率预期: 该机构认为,AWS有望重回20%中段的增长区间,广告业务年增速可达20–25%以上,推动集团层面经营利润率在多年内持续提升,尽管实际结果仍取决于执行和市场需求。
主要投资者争议与风险
| 争议 / 风险 | 代表性“多头”观点 | 代表性“空头”观点 |
|---|---|---|
| 资本开支规模 | 大规模AI资本开支被认为是保障云计算、AI服务和广告长期需求的必要条件,当前支出反映了工作负载的结构性增长。 | 部分投资者担心产能扩张快于需求,导致资本回报率下降,资产利用率不足。 |
| 回报时点 | 支持者预计,随着生成式AI项目从试点转向全面部署,2026–2027年利用率和变现能力将提升,尤其是在云和企业软件领域。 | 持怀疑态度者关注短期自由现金流压力,以及试验阶段转化为大规模AI持续支出的速度存在不确定性。 |
| 竞争格局 | 支持者认为,Amazon的全栈战略(从芯片到云再到消费应用)相较于只专注于某一层的同行具有持久优势。 | 批评者指出,Microsoft Azure和Alphabet/Google Cloud势头强劲,质疑是否有单一公司能持续保持领先。 |
| 宏观敏感性 | 有观点认为,云和AI支出正变得“类基础设施”,即使消费支出放缓,关键任务型工作负载依然具有韧性。 | 也有人担心,宏观经济放缓会影响数字广告预算和电商交易量——这对Amazon和Meta来说是关键收入来源。 |
即将到来的催化剂/数据点
- AWS re:Invent——2025年12月初
市场参与者将关注新AI服务、模型产品、产能扩展的发布,以及展示生产级工作负载的客户案例。
- Amazon 2025年第四季度业绩——预计2026年1月底/2月初公布
关注的核心指标包括AWS收入增长率、分部经营利润,以及管理层对AI驱动需求和2026年资本开支计划的评论。
- 同行财报及最新指引——2026年初
Microsoft、Alphabet和Meta将在2026年初发布财报,预计将披露资本开支趋势、AI产品采纳情况,以及各公司如何在投资与自由现金流之间取得平衡。
这些事件有望进一步揭示AI投资转化为收入的速度,以及资本开支水平在2026年是否会维持高位、趋于温和或进一步提升。
Amazon技术面分析
撰稿时,Amazon(AMZN)股价接近229美元,较近期低点有所回升,并稳守218.45美元和213美元关键支撑位。若跌破这些区间,可能引发抛售清算;若上行,则250.15美元阻力位将重新成为关注焦点——该区域或为部分交易者获利了结或寻求新买入机会。
RSI指标维持在50附近,显示动能中性,表明市场在近期回调后仍在寻找方向。


XRP价格展望:ETF势头与抛售潮碰撞后,下一步会如何?
随着ETF势头的激增正面遭遇大规模抛售,XRP的价格前景变得异常紧张。
随着ETF势头的激增正面遭遇大规模抛售,XRP的价格前景变得异常紧张。按理说,受11月21日多只美国ETF获批的推动——据市场分析师Eric Balchunas称,其中部分ETF首日交易量就超过5000万美元——XRP本应上涨,然而在更广泛的加密货币抛售潮中,XRP却从高点2.29下跌至2.18。这种结构性进展与市场压力之间的矛盾,正定义着当前的市场格局。
这一冲突为投资者带来了尖锐的问题:受监管的ETF资金流入,究竟是长期重估的基础,还是持续的抛售会压倒市场情绪,将市场拖向更深的调整?XRP目前正处于技术和心理的转折点,这种紧张局势的化解将决定其下一步的重大走势。
是什么推动了XRP的最新变化?
据报道,XRP近期的价格动态正受到两种相互竞争的叙事影响。一方面,长期看好XRP的分析师——如24HrsCrypto和Black Swan Capitalist创始人Versan Aljarrah——依然认为,XRP的价值最终取决于全球结算需求,而非散户炒作。
他们的观点是,比特币依靠投机上涨,而XRP的长期上行则依赖于“实用性、结算需求和全球流动性需求”。这些分析师坚持认为,耐心的积累和机构采纳仍是XRP价值创造的核心。
这一主题与重大的监管进展发生了碰撞:多只美国XRP ETF正式获批。Franklin Templeton的ETF获得NYSE认证,Bitwise、21Shares等公司也推出了相关产品,为传统投资者创造了一个合规、透明的投资通道。
早期资金流入反映出真实的兴趣——Bitwise首日成交额达2200万美元,而Canary Capital的XRPC产品则录得5800万美元,成为今年最强劲的开局之一。尽管现货市场依然波动,这些产品拓宽了XRP的潜在需求基础。
为何重要
市场分析师表示,ETF获批为XRP的长期信誉带来了结构性提升。Bitwise将其ETF首秀称为“历史性时刻”,强调受监管产品对仍对数字资产持谨慎态度的理财顾问和养老金管理者具有重要意义。这些投资者通常会在监管批准数月后才做出决定,这意味着随着投资组合结构的调整,2026年可能会出现实质性资金流入。
但短期情绪却讲述了不同的故事。尽管有ETF里程碑,XRP跌破2美元,显示出当前市场环境的脆弱。Glassnode数据显示,目前流通供应量中有41.5%处于亏损状态,随着交易者止损,压力加大。

巨鲸的活跃加剧了下跌,ETF消息发布后两天内就有超过2亿枚XRP被抛售。结构性利好与短期疲软之间的分歧,如今成为XRP前景的核心。
对市场和投资者的影响
据最新报道,Ripple的机构战略为XRP的走势增添了新维度。公司以12.5亿美元收购Hidden Road,并将其更名为Ripple Prime,这标志着加密原生公司首次拥有全球多资产主经纪商。
该平台年清算额达3万亿美元,Ripple高管表示自收购以来增长显著。XRP和RLUSD将作为机构客户的抵押品投入使用,显示出将该代币嵌入专业交易和结算基础设施的意图。
观察人士认为这一转变至关重要,因为主经纪业务是机构资金流动的中枢。将XRP嵌入抵押和结算渠道,强化了不依赖散户热情的流动性路径。Hidden Road的快速扩张表明对合规数字资产工具的需求持续上升。对投资者而言,这造成了一个特殊局面:基础设施不断完善,而短期K线却走弱,这在市场过渡期很常见。
专家展望
技术分析师认为XRP正接近关键门槛。若能重回2.195美元,将释放企稳信号,并有望打开通往2.6美元的空间;而若失守2美元,则可能跌向1.5美元,届时长期投资者或将尝试重新建仓。曾经热门的3.6美元目标,如今看来遥不可及,除非整体加密市场情绪逆转。
长期争论依然分化。支持100美元论点的人认为,XRP的未来取决于流动性通道和机构结算,而非投机周期。批评者则认为,真正的资金流入要等到理财顾问和受监管基金真正配置,可能要到2026年。宏观逆风和比特币的走势依然关键:若市场整体反弹,ETF需求或被放大;若持续疲软,XRP可能继续徘徊在支撑位附近。
核心观点
许多人认为,XRP的前景正由ETF驱动的乐观情绪与大规模抛售压力的碰撞所塑造。分析师表示,随着机构整合,底层生态正在加强;但由于巨鲸分散筹码及宏观经济环境对风险资产的影响,价格依然脆弱。下一步的关键在于XRP能否重回2美元区间,吸引持续的ETF资金流入,并搭上更广泛的加密反弹。这些力量的平衡将决定2026年前的走势。
XRP技术面洞察
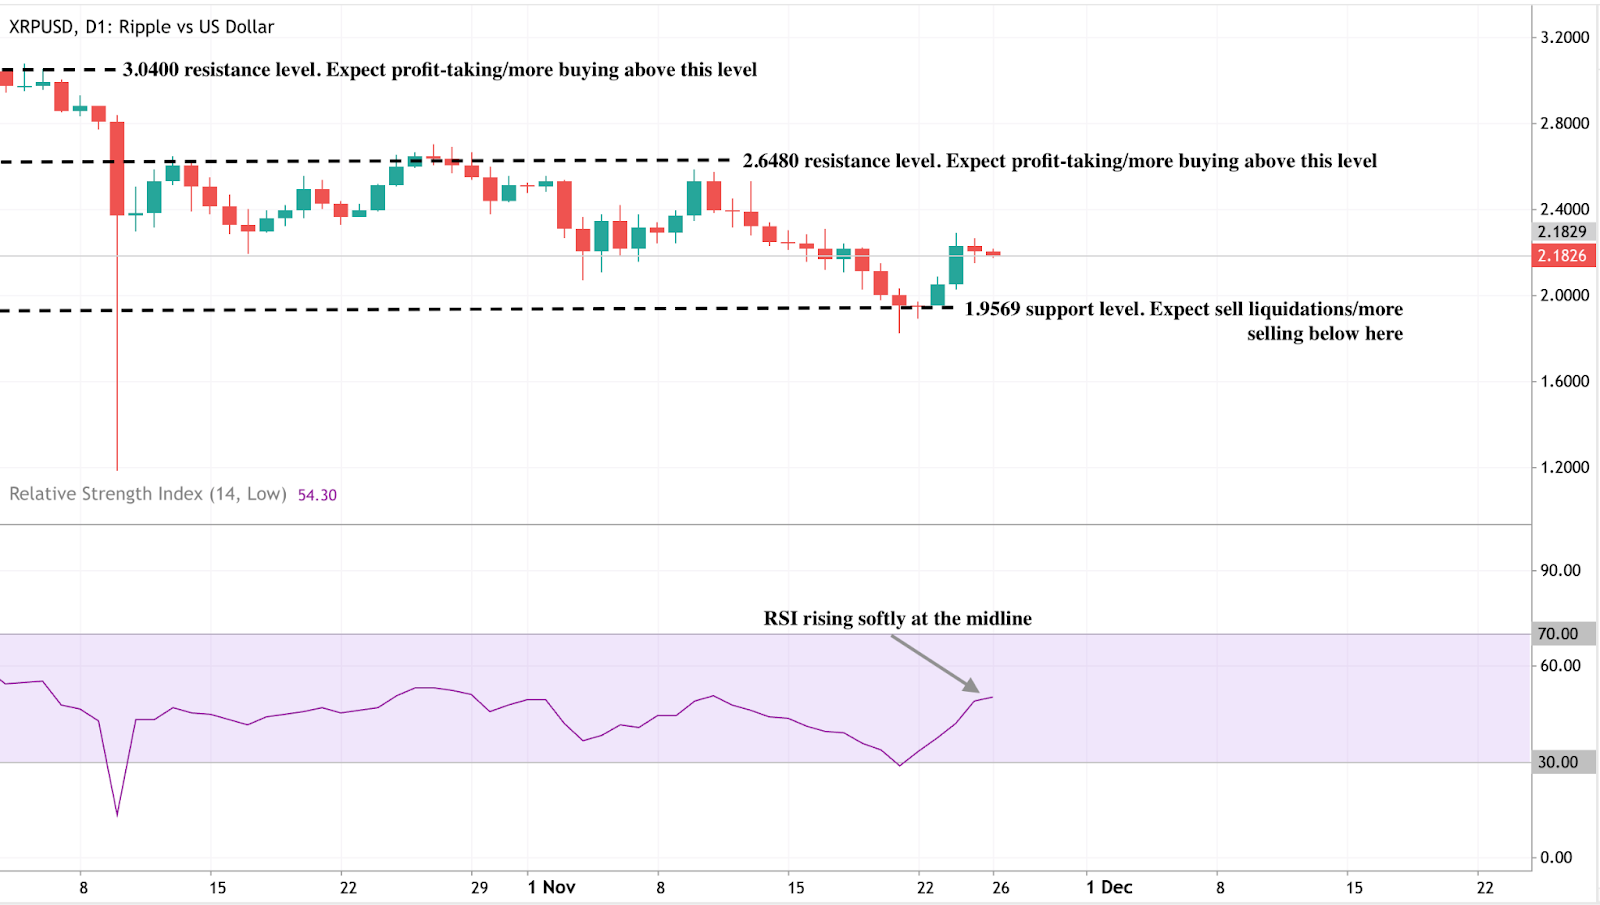
撰写时,XRP/USD徘徊在2.1800美元附近,交易区间在2.6480美元关键阻力位与1.9569美元强支撑位之间。若跌破支撑,可能引发抛售清算;而突破2.6480美元或3.0400美元,则可能吸引获利了结或新的买盘兴趣。
RSI指标正从中线54附近温和上升,显示动能略有恢复,但尚未进入超买区间。
.png)
Google’s AI comeback: Has the sleeping giant finally awoken?
Google has been criticised for years for lagging behind OpenAI, especially after ChatGPT exploded in late 2022 and reshaped the AI landscape.
Google has been criticised for years for lagging behind OpenAI, especially after ChatGPT exploded in late 2022 and reshaped the AI landscape. Yet the company’s recent streak of breakthroughs has triggered a dramatic reappraisal.
At the centre of this shift is Gemini 3, Google’s newest flagship AI model, which has impressed analysts with its performance in reasoning, coding and specialised tasks that traditionally stump chatbots. As demand grows for both cloud compute and Google’s custom AI chips, investors are beginning to question whether Google’s comeback is already underway - and whether the AI race is entering a new phase.
What’s driving Google’s resurgence
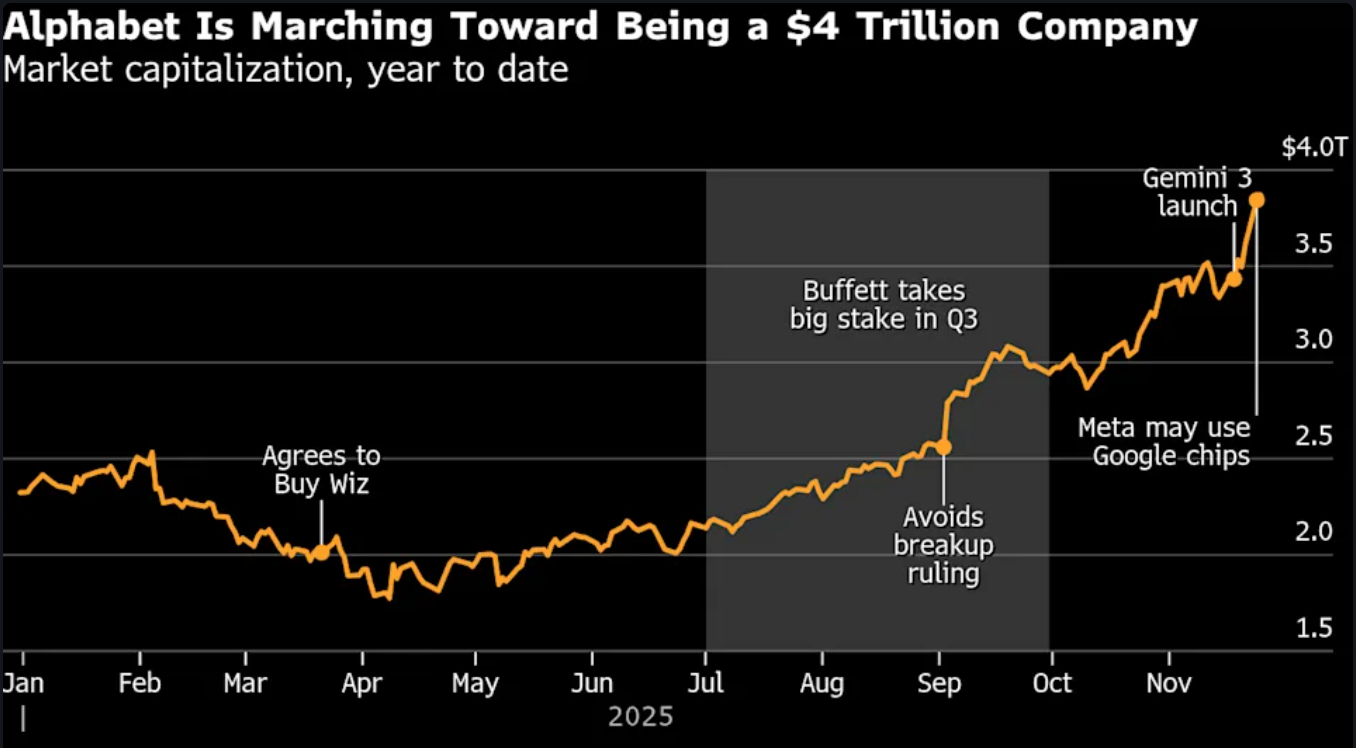
Alphabet has gained substantially since mid-October, sending shares to $323.64 and bringing it within reach of the $4 trillion club.
Google’s return to form is rooted in a combination of technical breakthroughs and strategic repositioning. The launch of Gemini 3 captured global attention after the model surged to the top of AI leaderboards such as LMArena and Humanity’s Last Exam, winning praise from analysts and technologists for its reasoning ability and performance on complex science tasks
Its improved reliability in generating images with accurate embedded text - a challenge that has plagued many chatbots - signals a maturity necessary for enterprise adoption. At the same time, Google has refreshed its AI product suite, including updates to its viral Nano Banana generator, which reinforces momentum across both consumer and developer segments.
The second force propelling Google forward is its deep investment in infrastructure. Once criticised for falling behind Microsoft, OpenAI and Nvidia, the company now benefits from rising demand for Google’s Tensor Processing Units (TPUs) - a specialised chip architecture Google has refined for over a decade.
Reports that Meta is in talks to deploy Google’s chips in its data centres by 2027 triggered a rally in Alphabet stock, demonstrating that Google’s hardware ecosystem may finally offer a meaningful alternative to Nvidia’s dominant GPUs. Partnerships with Anthropic - potentially involving up to 1 million TPUs - further signal a structural shift in AI compute preferences.
Why it matters
Google’s resurgence has implications far beyond its own balance sheet. As Neil Shah of Counterpoint Research put it, “Google has arguably always been the dark horse in this AI race — a sleeping giant now fully awake.” . If Gemini 3 continues to outperform expectations, it may reshape competitive dynamics between the three pillars of modern AI: OpenAI for model innovation, Nvidia for hardware, and Microsoft for cloud and enterprise distribution. A strengthened Google challenges this equilibrium, creating new strategic options for companies seeking alternatives to Nvidia’s high-cost GPUs or Microsoft’s deep integrations with OpenAI.
The return of competitive balance is also important for consumers and regulators. Google escaped the most severe outcome in a US antitrust case partly because AI competition has intensified. If Google proves it can innovate at scale, it may relieve pressure on regulators while accelerating the adoption of AI products beyond search advertising.
Units like Waymo, which is expanding into multiple cities and now supports highway driving, illustrate how Alphabet’s deep research pipeline fuels progress beyond software. The question is whether Google can convert technical superiority into commercial leadership - something it has historically struggled with outside advertising.
Impact on industry, markets and consumers
Google’s ascent poses both opportunity and disruption across the tech landscape. Nvidia, which lost $150 billion in market value on the day Meta’s chip discussions were reported, now contends with the prospect of a viable alternative for certain AI workloads. While Nvidia insists its GPUs remain the industry’s Swiss Army knife - flexible, widely supported, and essential for model training - TPUs give Google a niche advantage. As ASIC-based designs gain traction, analysts expect custom silicon to grow faster than the GPU market over the next several years.
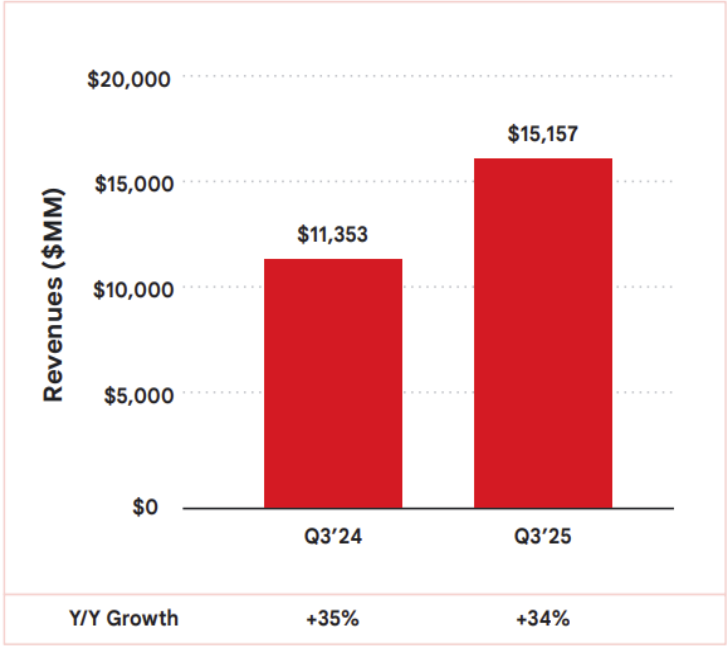
This shift has a significant impact on the broader cloud industry. Google Cloud, which generated $15.2 billion in third-quarter revenue - up 34% year-on-year - remains behind AWS and Microsoft Azure, but the demand for generative-AI compute is narrowing the gap.
Companies attracted by TPUs' cost efficiency may choose Google Cloud for specialised workloads, while still relying on Nvidia GPUs for general tasks. For consumers, the competition translates into better AI experiences: models with stronger reasoning, fewer errors, and safer behaviour.
Across financial markets, Alphabet’s rally affects index weightings and rotation patterns. As traders reassess Google’s valuation, volatility in Nvidia, AMD, Microsoft and Meta increases - creating opportunities for directional and event-driven strategies on platforms like Deriv MT5, where both tech stocks and index CFDs see heightened activity during AI-driven shifts. Tools such as the Deriv Trading Calculator help quantify margin impact and manage exposure as market reactions intensify.
Expert outlook
Forecasts for Google’s next phase remain divided. Some analysts argue that Google’s resurgence marks a long-awaited payoff from its “full-stack” strategy - controlling data, models, chips, cloud and applications. CEO Sundar Pichai emphasised during the last earnings call that this unified approach “really plays out” when scaling frontier models that integrate reasoning, multimodal capabilities and advanced coding. If Google continues to refine its ecosystem, it could rival or surpass OpenAI in enterprise adoption while weakening Nvidia’s dominance in hardware.
Yet uncertainties persist. Data revealed consumer adoption of Gemini still lags behind that of ChatGPT, with 650 million users compared to ChatGPT's 800 million weekly users, and monthly downloads of 73 million, which trail ChatGPT’s 93 million. Google Cloud, although accelerating, is still half the size of AWS and Azure.
It was noted that if Google cannot convert its technological strength into sustained commercial traction, the gap could widen again. Much will depend on whether Meta and other AI-intensive companies formalise their TPU commitments and whether Gemini 3 continues outperforming rivals in real-world deployments. The next six to nine months will be decisive, according to analysts.
Key takeaway
For market watchers, Google’s rapid AI resurgence suggests the company has moved far beyond its defensive posture of recent years. Gemini 3’s strong performance, rising TPU adoption and fresh cloud momentum have revived Alphabet’s standing in the global AI race. Yet the outcome is far from settled.
The next phase hinges on whether Google can scale its breakthroughs commercially while sustaining hardware and model performance. Traders and analysts await confirmation from enterprise adoption, chip-supply agreements and quarterly cloud-revenue growth - the indicators that will decide whether this comeback becomes a lasting transformation.
Alphabet technical insights
At the start of writing, Alphabet (GOOG) has broken into a price discovery zone above $323, signalling strong bullish momentum after an extended run along the upper Bollinger Band. Key supports sit at $268.75 and $240, where a drop below either level could trigger sell liquidations or deeper pullbacks.
The RSI, now around 74, is approaching overbought territory, highlighting stretched conditions that may lead to short-term cooling or consolidation, even as the broader trend remains firmly upward.


Gold’s November surge: From $4,000 barrier to all-time highs. What’s really happening?
Imagine waking up to headlines screaming 'Gold Smashes Past $4,300,' and no, it’s not a dream; it has been the reality of October 2025.
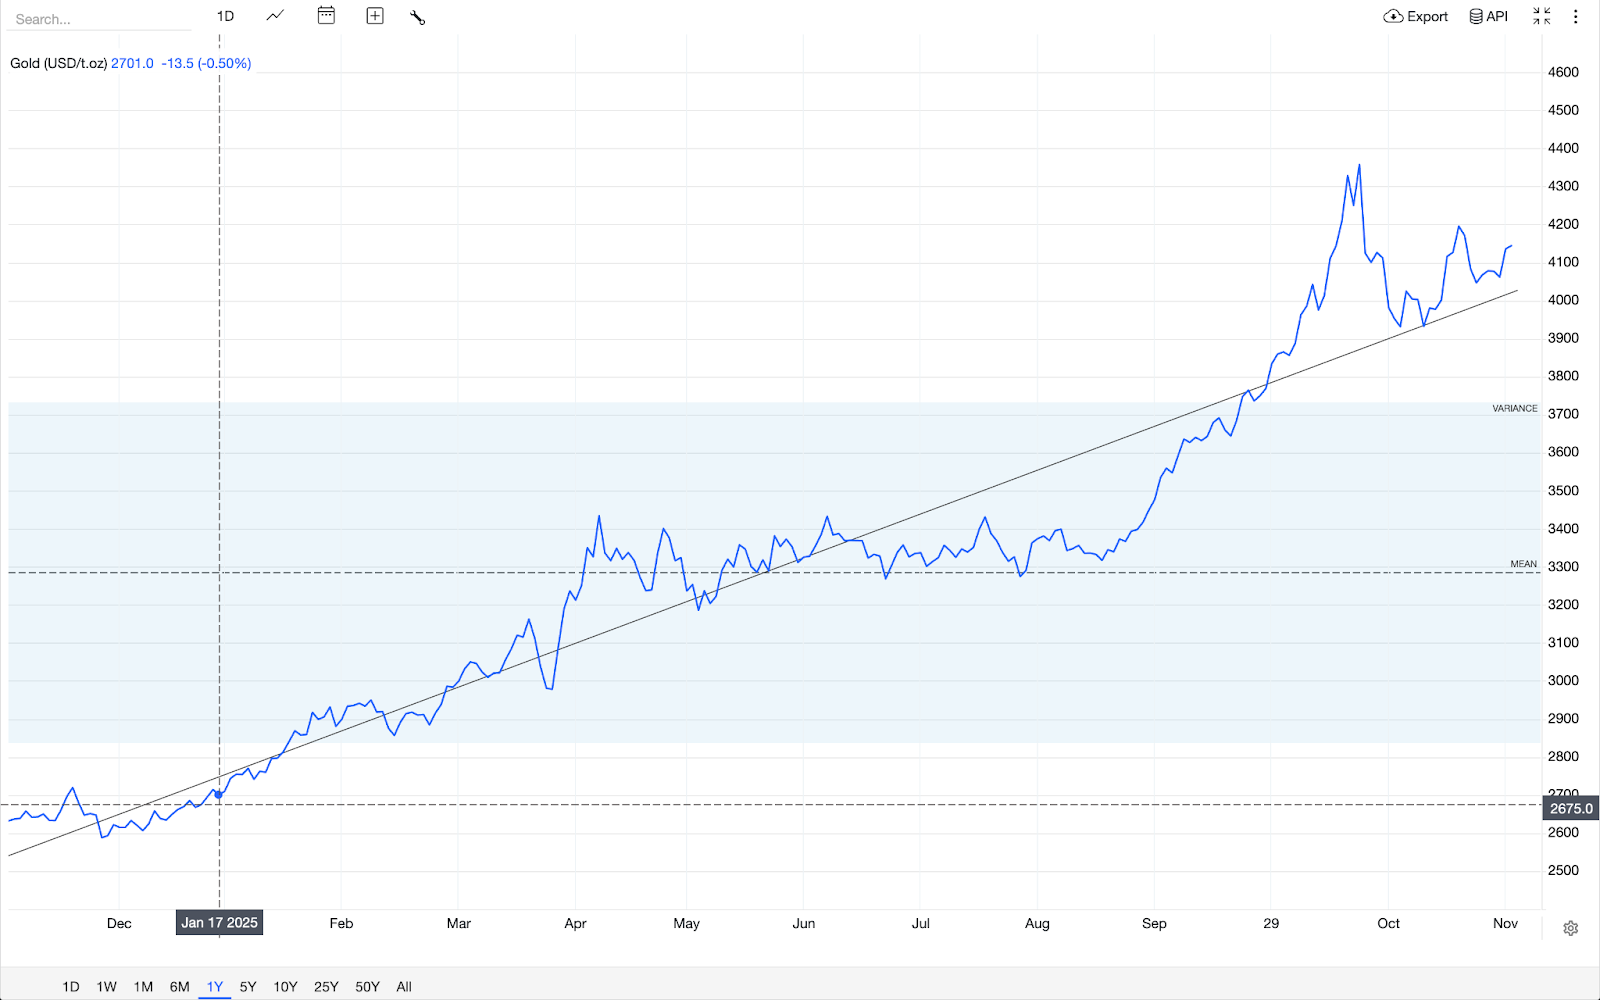
Imagine waking up to headlines screaming 'Gold Smashes Past $4,300,' and no, it’s not a dream; it has been the reality of October 2025. Now, November’s keeping the momentum alive with prices hovering near $4,132 as of 25 November 2025. If you’re wondering whether this shiny metal remains a smart addition to your financial mix, stick around. We’re breaking down the fresh data, historical peaks, and practical takeaways without the hype.
Why is gold climbing so sharply in late 2025?
The gold spot price breached $4,100 per ounce on November 24, a 1.65% increase from the prior day, driven by investor bets on U.S. Federal Reserve rate cuts amid cooling inflation signals. This isn't random volatility; it's a response to broader economic jitters. Geopolitical tensions, like ongoing Russia-Ukraine talks, add a layer of safe-haven demand, pushing prices up even as crude oil dips on "peace" rumours.
Breaking it down: Central banks worldwide are projected to acquire over 900 tons of gold in 2025, according to reports, surpassing demand for jewellery and technology. This institutional buying creates a floor under prices - think of it as a global vote of confidence in gold as a hedge against currency wobbles.
For everyday folks, it means reviewing your asset allocation might reveal whether gold’s 58% year-to-date gain (from -$2,600 in January) aligns better with your risk tolerance now than it did during last year’s flatline.
How close is gold to its historic peaks, and what do the charts say?
Gold’s all-time high? $4,379.13 on October 17, 2025, eclipsing the inflation-adjusted 1980 record of about $3,400 (when an ounce topped $850 nominally). Fast-forward to November: Spot prices traded between $4,046 and $4,145 on 24 November, coiling in a bull pennant pattern on daily charts - a setup that hints at continuation if it breaks upward, based on Kitco’s intra-day analysis.
Visualise this: On a 5-minute Comex futures chart, gold is hugging the 50-period moving average as support around $4,010, with resistance at $4,108. Zoom out to weekly: It’s testing the upper Bollinger Band after a 3.7% monthly rise.

Historically, such consolidations after highs (like the post-2020s $2,070 peak) often precede 10-15% corrections or fresh legs up - a reminder to track these levels when assessing gold’s role in long-term savings, such as in a retirement portfolio.
Expert take: "Gold’s resilience stems from its inverse correlation to real yields,” notes FX Empire analyst Yoav Niv, who points to the metal’s consolidation amid delayed U.S. data releases. Actionable angle? If inflation reports this week nudge yields lower, gold could revisit its October high - use that as a cue to compare gold’s performance against your bond or cash holdings.
Gold’s role in everyday portfolios
Hypothetically, let’s consider a mid-40s couple in Chicago, facing 7% inflation that ate into their savings in 2024. So, they shifted 5% of their nest egg to a gold ETF in early 2025; by November, that slice would have grown 58%, offsetting spikes in grocery and housing costs. Nothing magical here, but gold acting as a diversifier when stocks wobble.
Or take an example of a small business like a jeweller who rode out November’s uptick by locking in supplier rates at $4,000, buffering against dollar strength that hammered imports. The insight? Gold isn’t just for vaults; it’s a tool for smoothing cash flow volatility.
Scan your expenses - if currency fluctuations hit suppliers or travel, a modest gold exposure (via accessible ETFs) could stabilise planning without overcomplicating things.
November’s gold action underscores its enduring appeal: a buffer against the unpredictable. Whether eyeing historic charts or current consolidations, the key is integration - weave it into your financial story thoughtfully.
Gold technical insights
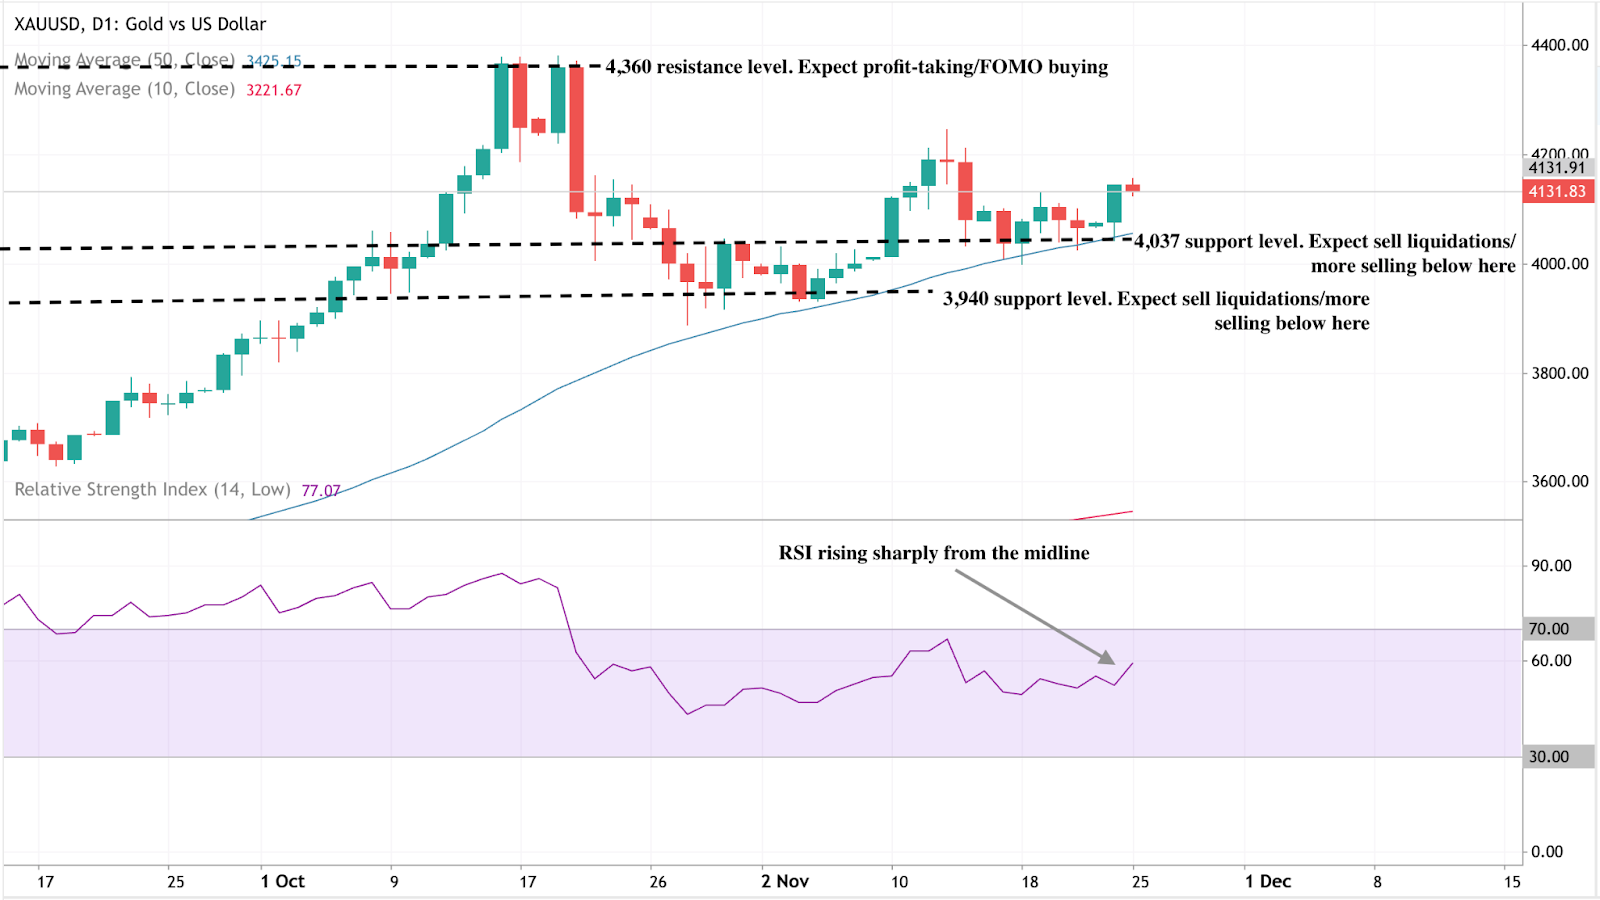
At the start of writing, Gold (XAU/USD) is trading near $4,132, maintaining bullish momentum above key supports at $4,037 and $3,940. A sustained move above these levels suggests buyers remain in control, though a drop below either could trigger sell liquidations.
The $4,360 level stands out as a major resistance, where traders may take profits or new buyers could enter on FOMO sentiment. Meanwhile, the RSI has surged to around 77, rising sharply from the midline - a signal of strengthening momentum but also a potential sign of overbought conditions that could invite short-term pullbacks.

The tech stock rally: Is this the start of a new cycle?
This week’s sharp rebound in tech stocks poses a compelling question: Is this more than just a bounce?
This week’s sharp rebound in tech stocks poses a compelling question: Is this more than just a bounce? With the Nasdaq Composite jumping 2.7% and the S&P 500 up roughly 1.5% as investors embraced both AI momentum and hopes for a December rate cut, the tone has shifted, according to reports.
The deeper issue, however, is whether this marks the beginning of a new tech cycle, underpinned by accelerating AI deployment and cheaper capital, or simply a rally within an existing one. The following insights examine what drives the move, its significance, its impact on markets, and what comes next.
What’s driving the tech stock rally
Market watchers say that at the heart of the current advance lie two forces: renewed confidence in AI-led innovation and fresh traction in monetary policy expectations. On the policy side, signals from the Federal Reserve, including Governor Christopher Waller and President John Williams of the New York Fed, have bolstered expectations for a December rate cut, helping to lift growth-stock valuations.
The reduction in discount rates on long-term earnings tends to favour tech firms, which rely on high forward-rate growth. Parallel to that, the AI story remains central. Firms such as Alphabet Inc. surged after enthusiasm for its Gemini model, while the “Magnificent Seven” pulled the broader tech cohort higher.
The market appears to be reconciling the earlier pullback (driven by bubble fears) and repositioning into stocks that benefit from the AI infrastructure build-out, including chips, cloud, and software. The question now is whether this is the launch of a new growth wave or simply the next leg of the existing one.
Why it matters
If tech is entering a new cycle, the implications extend far beyond a handful of large-cap stocks. These companies increasingly lag behind not only in market weight but also in shaping index trajectory, sector rotation, and investor psychology. As one analyst observed: “Scepticism around AI cap-ex might be a contrarian positive” for the trade in the long term.
For institutional and retail investors alike, the timing could matter: a true cycle shift may favour growth and innovation over value, alter asset-allocation flows, and provide a greater runway for risk assets. Conversely, if this is not a new cycle, then mispricing valuations could lead to sharp reversals. For corporates - from chip fabricators to SaaS startups - the cost of capital, demand for AI services, and global semiconductor supply chains all hinge on how the cycle evolves.
Impact on the market and industry
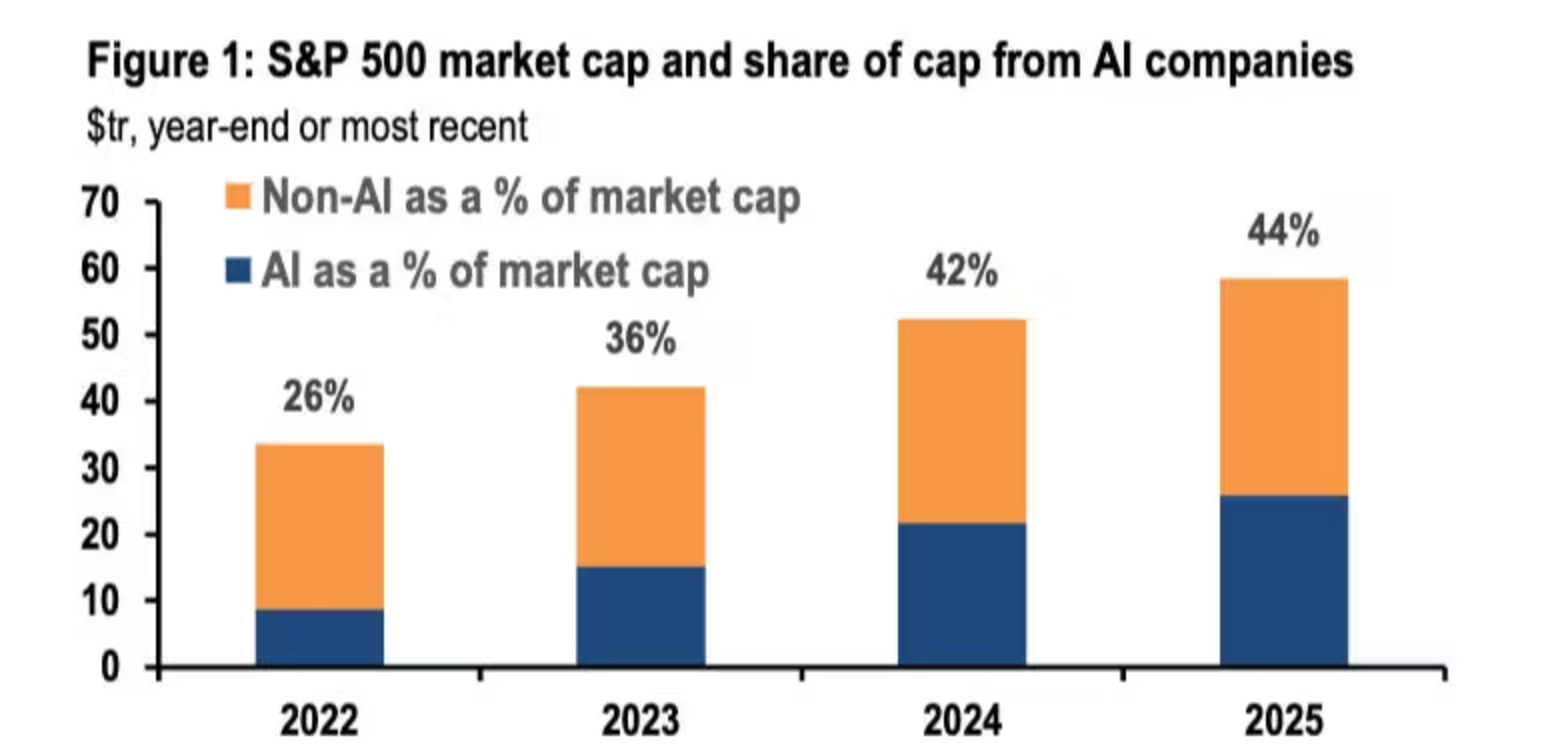
A credible new tech cycle would signal substantial real-world change: surging investment in data-centres, exponential scaling of AI models, and ecosystem shifts toward cloud-native, AI-first companies. We’re seeing some of that. Analysts estimate that AI could add $5-19 trillion in incremental revenue to US companies, although many warn that much of this may already be priced in.
In market terms, a cycle change could reinvigorate under-weight tech portfolios, trigger rotation out of value/cyclicals and reshape the “growth vs. value” trade. For the industry, this means that winners will likely emerge among firms that scale AI profitably, while laggards will face margin pressure, heavier capital expenditure burdens, and competitive erosion. The stakes are high: the surge could be transformative - but the infrastructure and competitive demands are intense.
For the market, that means volatility is likely to stay elevated. Traders balancing positions on platforms like Deriv MT5 can use advanced order types, leverage settings and stop-loss controls to navigate sharp swings. Understanding margin impact and exposure - via the Deriv Trading Calculator - is increasingly essential as the cycle matures.
Expert outlook
Looking ahead, professional traders note that key signals to monitor include inflation trajectories, clarity on Fed policy, earnings from major tech companies, and progress on supply-chain goals in the AI build-out. Markets currently price in a high probability of a December rate cut, but if inflation proves persistent or earnings disappoint, momentum could stall.
Some strategists caution that we may simply be in yet another leg of the initial tech-cycle rather than in the dawn of a fresh era. For instance, Goldman Sachs analysts suggest much of the potential upside from AI is already embedded in current valuations.
This means that while the upside exists, the risk-reward becomes less attractive. The best scenario: a renewed tech cycle with broad-based participation. The risk: concentrated gains, fading momentum and underlying disillusionment. Either way, the next few months will be critical.
Key takeaway
The surge in tech stocks carries more than a feel-good bounce - it could mark the opening stages of a new cycle where AI deployment and supportive policy drive sustained growth. However, the caveats remain substantial: valuations are stretched, execution risk is real, and macroeconomic headwinds loom. Investors should watch upcoming inflation data, Fed commentary and earnings from tech heavyweights as signals to validate the shift. The moment is promising, but not yet definitive.
Alphabet technical insights
At the start of writing, Alphabet’s stock (GOOG) has entered a price discovery zone above $318, signalling strong bullish momentum. The $280 and $238 levels act as key supports - a break below these zones could trigger sell liquidations or deeper corrections.
Meanwhile, the RSI has climbed to around 74.5, pushing into overbought territory, suggesting that the stock may face short-term profit-taking or consolidation before attempting further upside.


美元/日元徘徊在危险区域:日本能否停止攀升至160?
美元/日元徘徊在交易者现在所谓的 “危险区域” ——此前迫使日本伸出援手的155—160区间。
美元/日元徘徊在交易者现在所谓的 “危险区域” ——此前迫使日本伸出援手的155—160区间。分析师称,该货币对正在测试水平,如果突破该水平,可能会迫使东京再次进行干预以捍卫日元。对于市场而言,这不仅仅是一个心理门槛;这是历史划定的界限。每一次接近160的举动都会让人回想起过去的干预措施和猜测,即日本在介入之前会让其货币贬值多远。
报告称,紧张局势的核心是日本的财政扩张与其谨慎的货币立场之间的分歧越来越大。在美国维持高利率的同时,首相高市早苗的21.3万亿日元(合112亿英镑)刺激计划推动了收益率的上升并进一步削弱了日元。
现在的问题是,日本能否——或将——及时采取行动,在美元/日元突破160并考验东京在全球舞台上的决心之前阻止其上涨。
是什么在推动美元/日元?
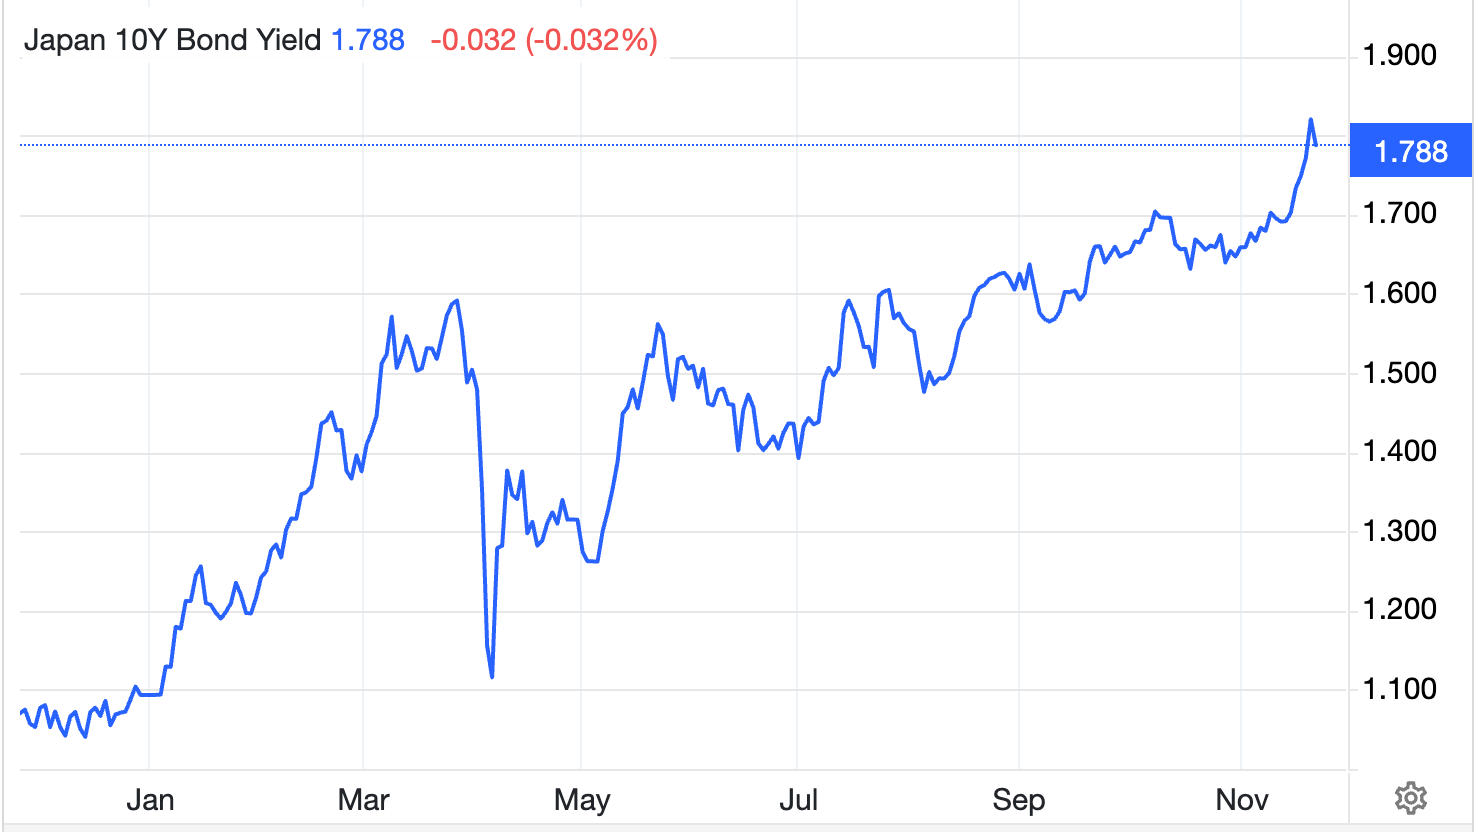
日元最近的下跌源于日本与美国的政策差距扩大。高市的刺激措施是自疫情以来最大的一次刺激措施,包括能源救济、税收减免和现金救济方面的支出。它旨在缓解生活成本压力,但投资者认为这是通货膨胀和财政鲁莽的。彭博社报道说,由于债务担忧加深和对长期财政纪律的信心减弱,日本国债(JGB)收益率已飙升至2008年以来的最高水平
日本央行的谨慎立场只会加剧压力。州长上田和夫继续认为,即使通货膨胀率仍高于2%的目标,但在任何重大政策转变之前,工资增长都必须稳定。

相比之下,美联储一直将美国利率保持在较高水平,并且仍然不愿迅速降息。这种收益率差异使持有美元的回报更大,使资本流出日元,使美元/日元保持在多年高位附近。
它为何重要
市场观察家说,日元的疲软是双向的。货币疲软有利于丰田和索尼等出口商,他们的海外收入转化为更高的利润。然而,对于进口商和家庭来说,痛苦是立竿见影的。日本严重依赖进口燃料和食品,这意味着美元/日元每上涨都会使日常生活更加昂贵。布鲁金斯学会的罗宾·布鲁克斯警告说:“按实际有效价值计算,日本的日元几乎和土耳其里拉一样疲软,” 他将政府的财政立场描述为 “否认债务”。
在日本境外,日元是衡量风险情绪的全球晴雨表。当美元大幅贬值时,它表明人们对美元的信心增强,并会鼓励以日元资助的套利交易策略。但是,如果东京干预,这也增加了突然逆转的风险。市场仍然回想起年中时期,据报道,在美元/日元短暂突破160美元之后,日本花费了超过600亿美元捍卫其货币。这一遗产使这个乐队内部的一举一动都像倒计时。
对市场和战略的影响
在债券市场,投资者要求更高的收益率以抵消财政风险,将十年期日本国债利率推高至1%以上,将40年期国债收益率推高至3.6%以上。上涨反映了人们的担忧,即在高市的促增长议程下,日本的债务——已经是其经济规模的两倍多——将进一步膨胀。
财政部长片山小树已经警告说,政府 “将对无序举动采取行动”,交易员现在将这句话解释为隐蔽的干预威胁。
对于股票投资者来说,日元疲软带来了短期提振。在出口密集型股票和海外盈利意外收入的支持下,日经225指数已攀升至数十年来的最高水平。
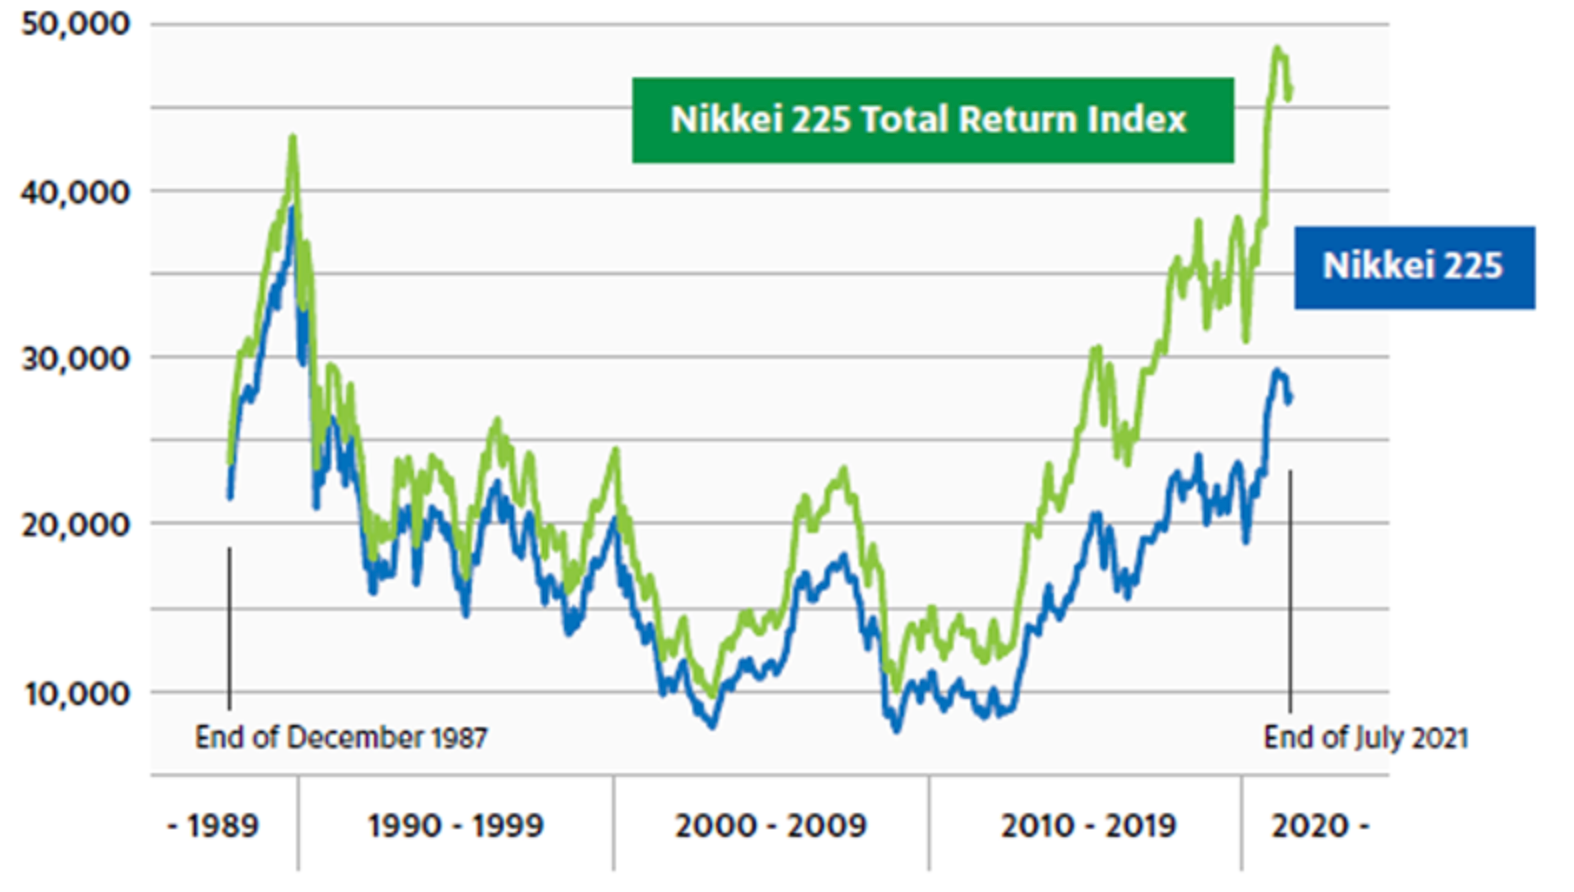
然而,这是有代价的:消费者信心下降,通货膨胀预期在上升。在全球范围内,日元的疲软推动了风险偏好——股市甚至加密货币的燃料——但如果东京或日本央行突然改变立场,市场容易受到大幅回调的影响。
对于零售交易者来说,这种波动性同样带来了机会和风险。由于关键水平附近的高波动性,严格的头寸规模和保证金跟踪变得必不可少——像 派生计算器 可以帮助交易者在进入市场之前估算点值、合约规模和潜在利润或亏损。
专家展望
美元/日元的预测取决于时机。如果日本央行像极少数经济学家预期的那样在12月将利率提高至0.75%,则日元可能会缓解性反弹至150。
但是,如果央行推迟,并且美国数据保持稳定,交易者可能会继续测试该区间的上限。惠灵顿阿尔图斯的詹姆斯·索恩说:“高市早苗的安倍经济学式刺激措施将扩大全球流动性并增强美元——King Dollar还活得很好。”
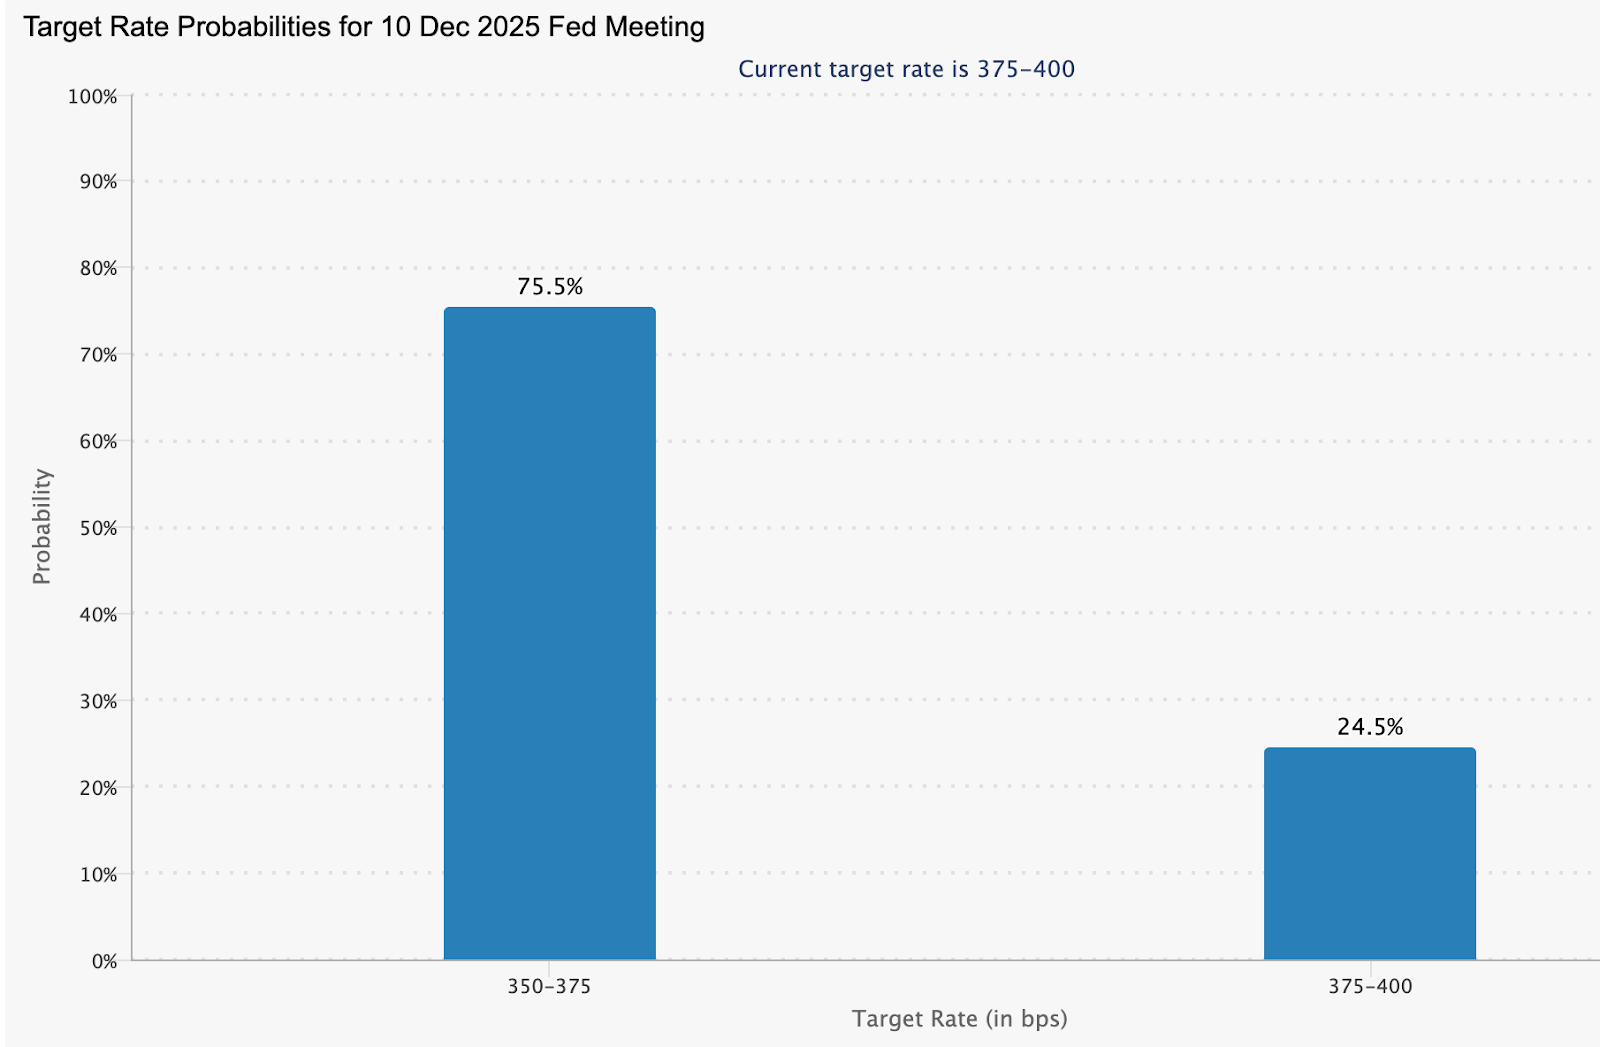
这在很大程度上取决于美联储是否在日本央行之前做出调整。期货市场目前认为美国在12月降息的可能性为75.5%。
分析师还补充说,鸽派 美联储 可能会缩小收益率差距并引发日元买盘。但否则,日本的货币仍受政策惯性和全球情绪的制约。美元/日元保持在160附近的时间越长,东京需要证明其仍然受到市场尊重的压力就越大。
美元/日元技术见解
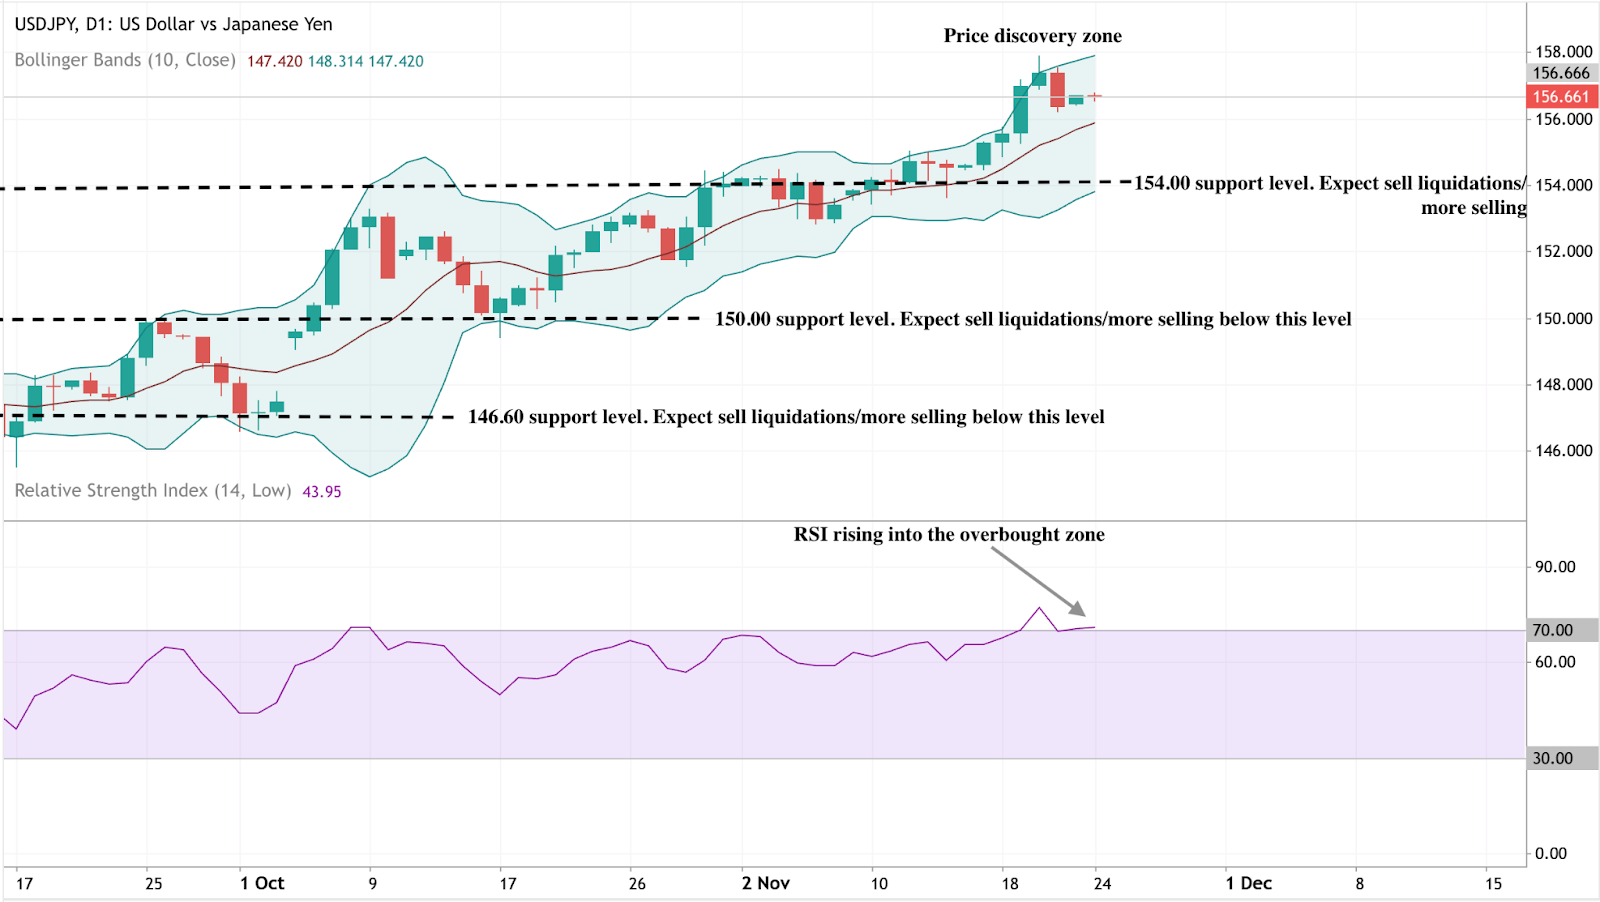
在撰写本文时,美元/日元的交易价格接近156.66,在延期后在价格发现区内盘整 看涨 跑。布林带(10,收盘价)正在扩大,由于价格走势仍接近上限,波动性加剧和持续偏见——这表明看涨势头强劲,但也增加了短期疲惫的风险。
关键支撑区域位于154.00、150.00和146.60,跌破这些区域可能会触发卖出清算和更深的修正。从好的方面来看,价格在156.00上方出现的阻力有限,这意味着除非波动率飙升,否则下一次回调可能会吸引逢低买家。
这个 RSI (14)正在攀升至超买区域,这表明看涨势头可能已接近顶峰。如果RSI维持在70以上,则势头可能会延续走高;但是,任何跌破该水平的逆转都可能表明未来将出现获利回吐或早期抛售压力。
要点外卖
分析师认为,美元/日元重返155-160走廊不仅仅是图表模式;这是对日本政策组合的全民公决。没有相应的货币调整的财政扩张使日元变得脆弱,投资者也持怀疑态度。干预措施可能会短暂稳定市场,但只有果断的紧缩或财政紧缩才能恢复信心。在此之前,该货币对一直处于危险区域——这里的一举一动不仅考验着东京的容忍度,还考验着全世界对日本控制本国货币能力的信心。
抱歉,我们找不到任何匹配 的结果。
搜索提示:
- 检查拚写并重试
- 尝试其他关键字