结果

Nvidia创纪录的季度业绩遭遇市场冷遇
尽管Nvidia业绩飙升,并将下季度指引上调至约650亿美元,市场反应却异常平淡。
当Nvidia Corporation公布第三季度营收为570亿美元——同比增长62%——看起来又一次在AI硬件竞赛中取得了完美胜利。然而,尽管业绩大涨并将下季度指引上调至约650亿美元,市场的反应却异常克制。
在一场泄露的全员会议中,首席执行官黄仁勋坦言:“市场并不买账。”这种业绩与市场热情之间的脱节,揭示了高涨的预期和AI狂热如何抬高了即便是最佳表现者的门槛。
推动Nvidia创纪录季度的动力
Nvidia业绩的命脉依然是数据中心需求——AI基础设施的支柱。仅该板块就创造了约510亿美元的营收,同比增长66%,环比增长25%。

Blackwell平台等旗舰产品持续主导企业订单,而最新指引显示下季度有望再创纪录——营收650亿美元,同比增长65%。Nvidia不仅在增长,更是在为整个行业的资本支出周期定下节奏。
地缘政治和结构性力量进一步放大了这种增长。随着云计算、机器人和自动化系统在全球范围内扩张,Nvidia的硬件处于创新的核心——也是供应的瓶颈。但成功也带来脆弱:当完美成为常态时,哪怕最小的波动都显得举足轻重。“当你让市场习惯于期待完美时,”一位分析师打趣道,“即使很优秀也不够好。”
为何重要
Nvidia目前约占S&P 500总权重的7.31%,成为AI情绪最具影响力的风向标。如此体量的股票在创纪录季度后横盘,意味着投资者质疑的不是数据,而是故事本身。
FinancialContent称其为“AI及更广泛市场的考验时刻”。如果Nvidia的卓越已无法激发热情,其它科技公司也将感受到寒意。
黄仁勋自己也直言不讳:业绩差就被指责戳破泡沫,业绩好又被说助长泡沫。这种认知陷阱凸显了AI交易进入新阶段——只有超越卓越的结果才能撬动市场。这也反映出一种微妙转变:从炒作与承诺转向纪律与兑现。
对科技与AI生态系统的影响
Nvidia的财报最初带动了整个科技板块上涨,AMD、Broadcom和存储供应商也受益于乐观情绪。但随着交易日推进,这些涨幅逐渐回吐——证明市场热情已变得脆弱。
分析师认为,如果如此强劲的业绩已无法引发上涨,说明AI基础设施的增长很大程度上已被计入股价。投资者现在可能更青睐运营效率而非单纯扩张。这是自然演变:当增长成熟,估值纪律接管主导权。
对于硬件采购方和企业用户而言,这种演变可能意味着供应条件略有改善,但价格趋于紧张。Nvidia的挑战将是在扩大产能的同时保持利润率——从愿景式增长转向工业级精细化运营。
专家展望
市场观察人士认为,未来有两条路。如果Nvidia继续执行——扩展新产品线、扩大制造能力、应对出口风险——它可以保持领先并延续增长。公司依然拥有少数对手能企及的技术护城河。
另一种情形则是估值重置:如果投资者开始质疑硬件增长能否持续跑赢成本通胀和竞争,Nvidia可能面临增长平台期。正如Bernstein一位分析师所说:“至少从财报来看,我不知道还能要求什么。”
对于交易者来说,值得关注的信号包括业绩指引趋势、订单积压更新(尤其是中国市场),以及Rubin和Blackwell芯片的推出进度。市值在数周内波动五千亿美元,足见市场情绪之敏感。
Nvidia技术面分析
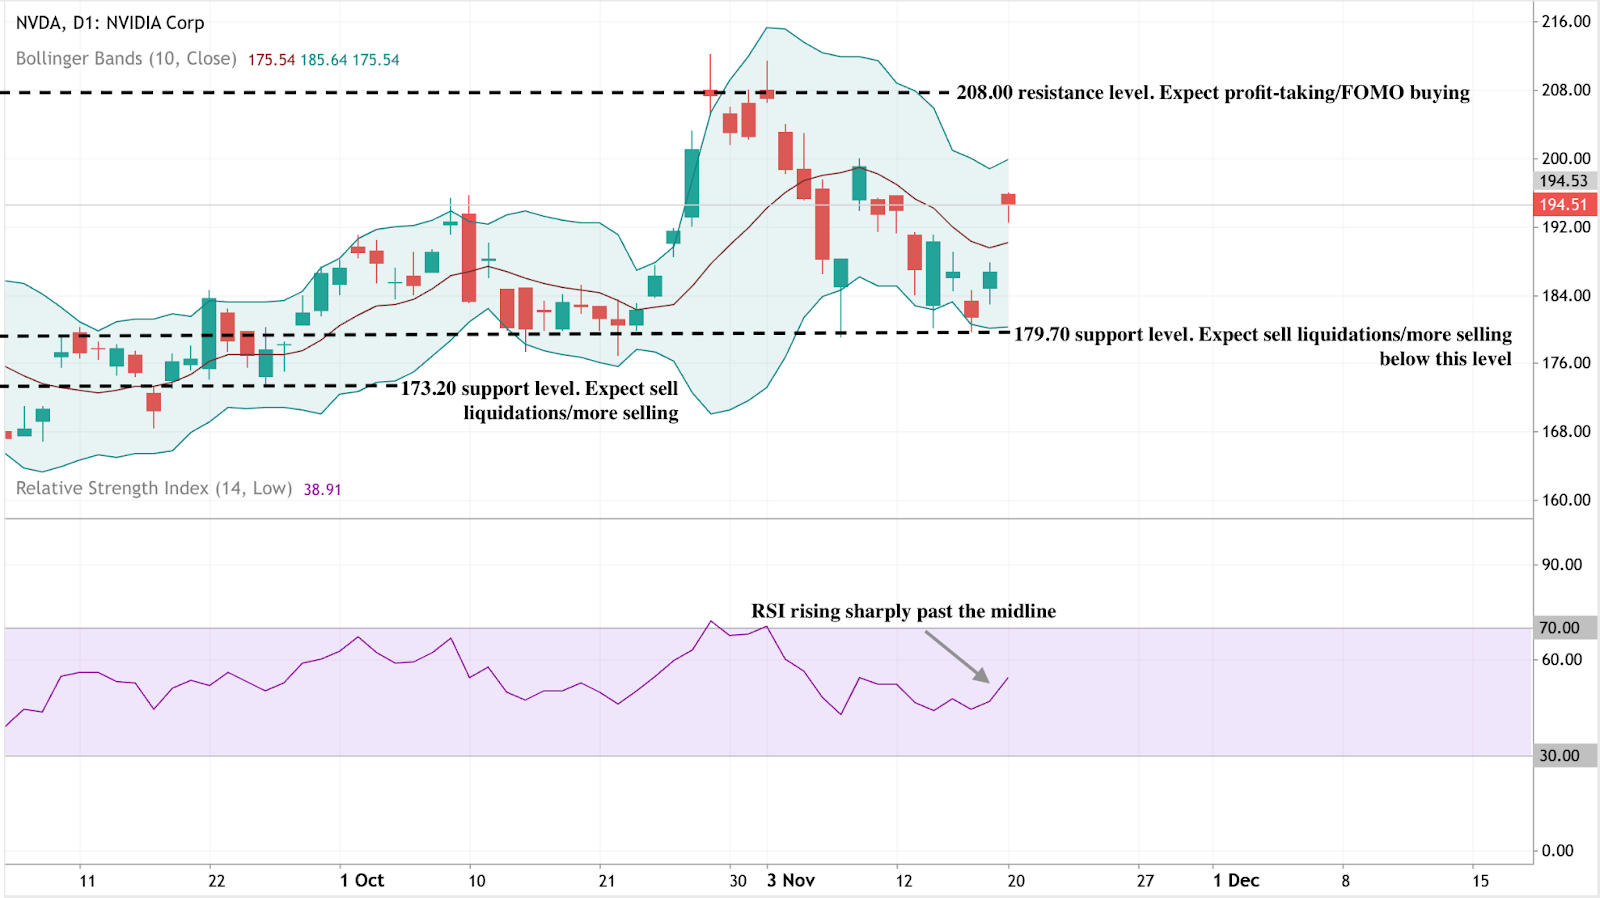
截至发稿,Nvidia(NVDA)股价接近194.50美元,在测试179.70美元支撑位后自下轨Bollinger Band反弹。Bollinger Bands(10,收盘价)正适度扩张——表明波动性上升——价格走势趋向中轨,短期内有望继续向上轨靠拢。
173.20美元为下一个关键支撑位;若跌破,可能引发抛售并加剧下行动能。相反,208.00美元构成强阻力区,若涨势延续,可能出现获利了结和末端FOMO买盘。
动量指标进一步强化多头观点。RSI(14)大幅上扬,突破50中线——这是买盘压力回升的技术信号。若能持续站稳该水平,并保持在179.70美元上方,将巩固短期上升趋势,吸引关注动量交易的投资者。
对于制定交易情景的投资者,Deriv calculator 可用于在不同波动性设定下模拟盈亏——在Deriv MT5上规划NVDA交易时,是图表分析的重要补充。
核心观点
投资者认为Nvidia仍是AI基础设施浪潮的核心——财务无可匹敌,技术上占据主导。然而,市场的冷淡反应标志着一个转折点:投资者不再为承诺买单,只看重兑现。在AI交易的新阶段,执行力、利润韧性和创新节奏将决定领导地位。对交易者而言,Nvidia的技术图形或许暗示短期上行,但更大的故事是预期的转变——完美已成为新常态,而非惊喜。

黄金价格展望:各国央行筑起支撑底线
在利率降息预期减弱和美元走强的喧嚣背后,隐藏着更深层的结构性力量:全球各国央行对黄金的持续买入。
据报道,黄金在每盎司约4,050美元附近的显著稳定并非偶然。在利率降息预期减弱和美元走强的喧嚣背后,隐藏着更深层的结构性力量:全球各国央行的持续买入。从北京到安卡拉,政策制定者正在悄然改写货币安全的规则,利用黄金作为对冲政治风险、货币不稳定以及对美国金融秩序信任减弱的工具。
分析师指出,这种需求已成为支撑黄金的无形之手。即使投机交易者撤退,ETF资金流趋于平缓,主权买家仍在帮助稳固市场。
随着中国人民银行延续其连续12个月的黄金购买纪录,其他央行也纷纷效仿,黄金的下行风险如今更像是暂停而非崩溃——这是由国家而非基金加固的底线。
当前推动黄金的因素是什么?
最新的美国就业数据重置了全球市场的预期。9月份非农就业报告显示新增11.9万个职位,超过经济学家预期的两倍多,而失业率微升至4.4%。

表面上看,数据表现参差——招聘强劲但势头放缓——但足以促使投资者减少对美联储12月降息的预期。
这一调整推高了美元和美国国债收益率,通常这对黄金是不利的组合。但黄金几乎未受影响。原因在于央行需求改变了黄金对政策周期的敏感度。
根据世界黄金协会的数据,官方部门的购买量现占年度需求的近四分之一——这是与十年前的结构性转变。当美联储犹豫时,央行却不犹豫。
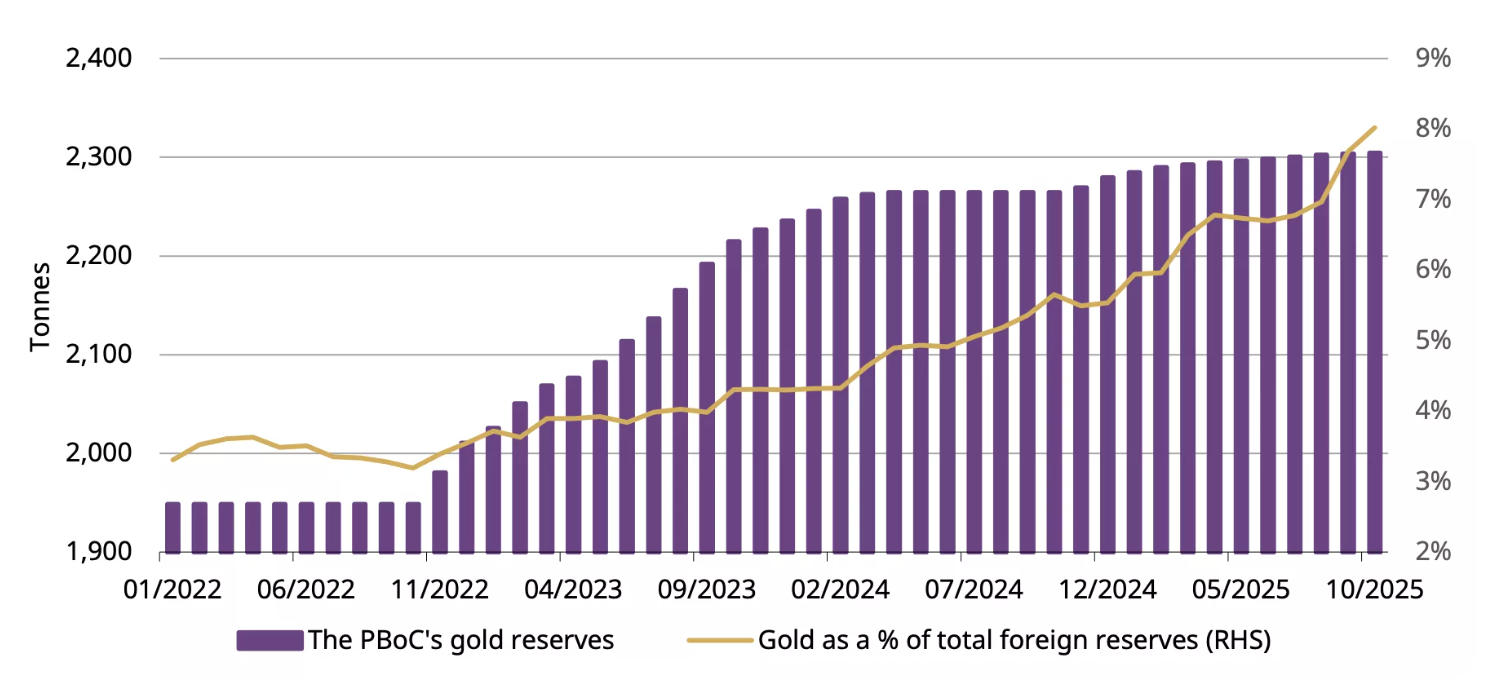
中国人民银行(PBoC)已连续12个月报告黄金购买,10月增持0.9吨,使总量达到2,304吨,占中国外汇储备的8%,标志着连续一整年的买入。土耳其、波兰和印度也加入了这一积累趋势。
为何这很重要
市场观察人士表示,这种低调的主权积累正在重塑黄金在全球金融体系中的角色。过去被视为“避险”交易的黄金,如今已成为国家储备战略的一部分。2022年俄罗斯外汇资产被冻结,促使各国政府重新评估其对美元主导体系的敞口,黄金因此成为一种中立的替代选择。
正如Zaner Metals策略师Peter Grant所言,最新的美国就业数据“确认了市场放缓但稳定——但这并未减少对安全资产的需求。”
对新兴市场的政策制定者而言,黄金提供了纸质资产无法比拟的优势:免受制裁、通胀和货币政治的影响。对投资者来说,这意味着黄金价格不再仅仅取决于利率或风险偏好,而是成为一个地缘政治指标——反映当前货币秩序中剩余信任的镜子。
对市场和投资者的影响
本周期最显著的变化是,尽管美元指数(DXY)处于数月来的强势水平,黄金仍维持在接近历史高点的位置。传统的反向关系已减弱。分析师指出,两种资产的购买原因相同:安全。这一动态挑战了黄金仅在利率下降时上涨的观点。
对交易者而言,这使短期仓位调整更为复杂。黄金目前约比10月创纪录的4,380美元低7%,动能有所降温,但结构性需求依然存在。尽管近期ETF资金流略为负面,但未见恐慌迹象。
散户投资者减少了持仓,但官方部门已取代他们成为边际买家。对长期投资者而言,这一转变表明回调可能是机会而非警告,尤其是在宏观经济不确定性延续至2026年时。
专家展望
分析师对央行买盘能将黄金推高至何种程度仍存在分歧。高盛仍将近期疲软视为“短暂波动,而非反转”,并认为主权和私人投资需求将支撑价格至2026年。瑞银预计,假设持续从美元储备多元化,未来两年内黄金可能攀升至每盎司4,900美元。
该展望的主要风险在于货币政策的自满。如果美国数据保持强劲,美联储重申“更高更久”的立场,投机兴趣可能进一步减弱。但目前,黄金的韧性已说明一切。市场正在适应新现实——由央行而非交易者主导基调。
黄金技术分析
撰写本文时,黄金(XAU/USD)交易于约4,030美元区域,徘徊在4,020美元支撑位附近。RSI指标平稳且接近中线,显示缺乏强劲动能——市场犹豫不决的信号。
与此同时,布林带开始收窄,反映近期波动性降低。价格在中轨附近震荡,暗示可能进入盘整阶段,等待下一次突破。
上方关键阻力位为4,200美元和4,365美元,若看涨情绪回归,交易者可能在此获利了结或重新买入。相反,若跌破4,020美元,可能打开通往3,940美元支撑位的大门,届时卖压或清算压力可能加大。

主要结论
2025年末黄金的韧性并非谜团——这是分析师们传达的信息。曾经信赖美国国债的机构如今购买黄金以对冲政策、政治和不确定性风险。交易者或许会淡化这波涨势,但央行毫不动摇。随着Fed在分歧的政策前景中航行,全球储备持续向东方转移,黄金的支撑底线看起来和持有它的手一样坚实。
.png)
比特币的严峻重置:资金流动、恐惧与两条关键线
这全球最大的加密货币自十月高点以来已蒸发近三分之一的价值,随着逆风影响显现,价格正滑向关键技术水平。
比特币的严峻重置已经到来。自十月高点以来,这全球最大的加密货币已蒸发近三分之一的价值,随着交易所交易基金(ETF)资金流出和宏观经济逆风的影响,价格正滑向关键技术水平。
最新数据显示,仅本月,比特币ETF资金流出近30亿美元,曾经推动涨势的机构资金流如今转变为赎回和撤退的反馈循环。
这波抛售背后,是美联储降息预期减弱、流动性收紧以及市场被“极度恐惧”所瘫痪的混合因素。随着价格徘徊在85,600美元附近,一年低点74,000美元逼近,问题简单而紧迫:这次调整是昙花一现,还是比特币新ETF时代更深层次转变的开始?
推动比特币调整的因素
分析师指出,比特币30%的下跌并非由丑闻或突发事件引发,而是结构性力量最终逆转的结果。经过两年的持续资金流入,现货比特币ETF现正经历资金流出。曾被誉为加密稳定器的机构投资者,正展示出市场动荡时情绪转变的速度。
根据Farside数据,本月除四天外,ETF均出现赎回,净流出近30亿美元。
部分撤退源于宏观环境的变化。联邦储备系统对降息的犹豫加强了美元,吸引流动性远离投机资产。
过往走势显示,美元走强通常对比特币构成压力,且通胀数据依然顽固,交易者正在重新评估12月“宽松货币”回归的预期。结果是市场中,反弹往往伴随抛售而非热情——这与几周前推动比特币冲高至126,000美元的狂热形成鲜明对比。
为何这很重要
比特币的抛售揭示了传统市场与数字市场如今的紧密联系。ETF为机构敞开了大门,但也将比特币与更广泛的风险趋势挂钩。当投资者从ETF产品撤资时,影响会在流动性池和市场情绪中产生连锁反应。
正如Luxor的Matt Williams所解释,“跌至86,000美元主要受宏观因素驱动——利率预期、通胀——以及大户在突破关键技术支撑后减少敞口。”
对交易者而言,这是一个心理转折点。曾在2017年感恩节期间涌入交易所的散户群体——当时比特币首次突破10,000美元——如今大多保持沉默。
Santiment的社交数据表明,市场情绪在预测跌破70,000美元和对反弹至130,000美元的狂热乐观之间均分。这种分裂反映的是犹豫而非信心。在此阶段,恐惧而非基本面主导市场基调。

对市场和投资者的影响
这波抛售已波及加密领域之外。比特币与纳斯达克100等股指的相关性一度超过0.8,意味着科技股和数字资产的波动现由相同的宏观因素驱动。当利率乐观情绪消退,两个市场均受影响。这一联系挑战了比特币作为货币风险对冲工具的长期主张。
ETF资金流出是另一压力点。随着基金赎回,流动性提供者被迫平仓期货和现货头寸,进一步加剧波动性。
本周跌至14点的Crypto Fear & Greed Index——为2月以来最低——凸显情绪恶化之迅速。BTC Markets的Rachael Lucas等分析师警告,动量、资金流和成交量趋势“均反映出情绪急剧恶化”,由宏观收紧和风险规避驱动。

在背后,流动性提供者正苦苦挣扎。Fundstrat的Tom Lee将加密市场做市商比作数字流动性的“中央银行”——而目前,这些银行正面临枯竭。
继十月200亿美元的清算潮后,做市商的资产规模缩小,限制了其吸收订单流的能力。这提醒我们,加密市场的基础设施虽更复杂,但依然脆弱。
专家展望
分析师在谨慎与好奇之间摇摆。Coin Bureau的Nic Puckrin将当前形势形容为“牛熊拉锯战”,宏观经济悲观情绪被科技板块的韧性所抵消。
Nvidia的盈利超预期短暂提振了风险偏好,但比特币未能跟进,表明交易者仍在减仓而非加仓。Puckrin将下一阻力位定在107,500美元,若反弹获得动力则可能触及。
Bitwise的Andre Dragosch认为此次调整与以往牛市中期回调相似,指出此次下跌的深度和持续时间“与以往牛市中的阶段性回调一致”。他的基本预期仍是周期将延续至2026年,受全球货币逐步宽松推动。
不过,目前短期风险仍偏向下行,85,600美元和74,000美元是两大关键观察点。守住这两线,比特币或将筑底;一旦失守,下一轮抛售可能迅速展开。
更大格局:比特币会引发金融危机吗?
尽管市场恐慌,比特币相较于真实金融体系仍相对较小。整个加密市场规模约为3至4万亿美元,比特币约占一半。相比之下,全球金融资产超过400万亿美元。过去的崩盘事件,如2022年的FTX和2021年的Terra,虽在加密行业内引发混乱,但几乎未波及全球市场。
话虽如此,每个周期都使加密更接近传统金融。ETF、企业持仓及以美国国债支持的稳定币已形成实际联系。严重的比特币崩盘可能引发ETF赎回,损害持有BTC公司的资产负债表,并迫使稳定币清算其国债资产。虽然这些情况今天不会引发2008年式的危机,但随着重叠加深,“加密崩盘”与“金融传染”之间的界限正日益模糊。
比特币技术洞察
撰写本文时,比特币(BTC/USD)在经历一段持续下跌后,交易价格约为84,200美元。相对强弱指数(RSI)急剧跌入超卖区,显示出强烈的看跌动能,并暗示若买盘介入,短期内可能出现技术性反弹。
“死亡交叉”——即50日均线跌破200日均线——强化了看跌偏见,暗示近期仍有进一步下行压力。
关键阻力位分别为106,260美元、115,200美元和123,950美元,交易者若见反弹,可能在这些位置获利了结或重新买入。若未能收复这些区域,比特币可能持续承压,市场情绪在持续抛售中保持脆弱。
关键要点
比特币的下跌并非偶然——它是对其新现实的压力测试。ETF时代使这加密货币与全球金融体系联系更紧密,利弊共存。流动性曾是顺风,如今却成为双刃剑。恐惧主导市场,但深度调整是比特币的基因之一。
如果那两条线——85,600美元和74,000美元——能坚守,许多人认为这次重置可能只是下一波机构需求前的又一次清洗阶段。若失守,这场严峻重置可能演变成更深层次的调整。

Nvidia earnings reality check: Is the AI boom back on track?
Nvidia’s latest earnings didn’t inflate another round of hype; they restored confidence that artificial intelligence is entering its scale phase.
Yes - the AI boom is back on track, according to analysts, just in a different gear. Nvidia’s latest earnings didn’t inflate another round of hype; they restored confidence that artificial intelligence is entering its scale phase, not its speculative one.
Nvidia investors are bracing for a $300 billion surge in market value after the chipmaker reported its first sales acceleration in seven quarters, signalling that AI demand isn’t fading - it’s normalising into a sustainable growth cycle.
For months, markets were haunted by talk of “peak AI.” However, Nvidia’s results - record data centre revenue, renewed partnerships, and a 5% share spike in after-hours trading - show the story isn’t one of collapse, but calibration. This isn’t a bubble bursting; it’s the industry learning how to breathe again.
What’s driving Nvidia’s momentum
At the core of Nvidia’s dominance in artificial intelligence architecture is its data centre segment, which surpassed $50 billion this quarter, a milestone reached earlier than analysts expected.
This reflects an industrial-scale buildout, not a speculative frenzy. The surge in demand from AI workloads has transformed GPUs from niche products into the backbone of modern computing, powering everything from ChatGPT to enterprise cloud systems.
CEO Jensen Huang captured it best: “We’re in every cloud.” That ubiquity underpins Nvidia’s stability. Its chips are not optional - they’re essential infrastructure. With Blackwell GPUs offering up to 40 times faster inference speeds than the previous generation, the company isn’t chasing hype; it’s engineering the next leap in computational efficiency.
Why it matters
Nvidia’s report acts as a barometer for the AI economy. The stock’s post-earnings rally wasn’t just about profits; it was about validation. The market had priced in fear after days of tech sell-offs, but Nvidia’s blowout numbers reintroduced realism.
Analysts like Julian Emanuel of Evercore ISI summed up the pre-earnings tension: “The angst around ‘peak AI’ has been palpable.” Those fears evaporated when Nvidia showed that demand isn’t flattening - it’s broadening.
The company’s performance has become closely tied to the trajectory of U.S. equities. With AI now a structural growth driver, Nvidia’s consistency reassures investors that this is an economic revolution in progress, not a fleeting mania. Its $5 trillion valuation last month wasn’t an aberration; it was a preview of scale yet to come.
Impact on global markets
The aftershocks were immediate. Tech indices that had stumbled under the weight of “AI fatigue” rebounded as Nvidia reignited investor faith. Asian markets opened higher, and S&P futures turned positive, driven by renewed conviction that the AI trade still has legs. Even after a period of correction - Meta down 19%, Oracle off 20% - Nvidia’s performance reaffirmed that the long-term AI thesis remains intact.
Beyond markets, Nvidia’s results signal a new capital cycle. Its multibillion-dollar partnerships with Microsoft, OpenAI, and Anthropic aren’t one-off investments; they’re structural commitments to an AI-driven infrastructure era. Every dollar of GPU spending feeds into an ecosystem that’s building capacity for the next generation of models, data centres, and intelligent services.
Expert outlook
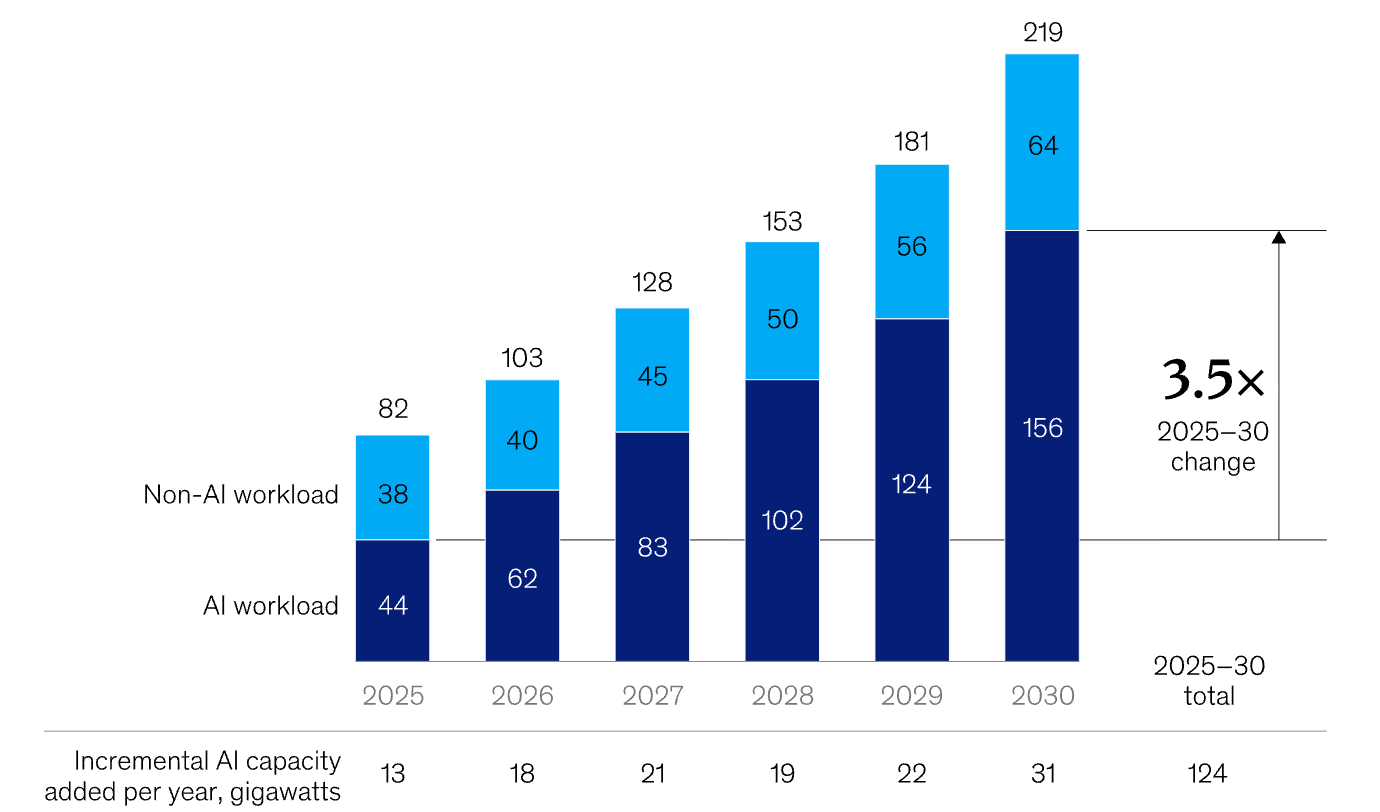
Forecasts are being rewritten. McKinsey estimates $7 trillion in AI infrastructure spending by 2030, with $5.2 trillion going toward data centres. According to McKinsey, we will also see significant incremental AI capacity added every year through to 2030.
Nvidia’s share of that pie could exceed 50%, given its current dominance and design lead. Some analysts even project a $20 trillion market capitalisation by 2030 if the company maintains its pace of innovation.
Still, this is not a frictionless ascent. Export restrictions to China and the rise of custom silicon from rivals like AMD and Google pose challenges. Yet Nvidia’s edge isn’t just its hardware - it’s the CUDA software ecosystem, which locks developers and enterprises into its platform. As long as AI workloads require versatility and performance across models and frameworks, Nvidia’s moat will hold.
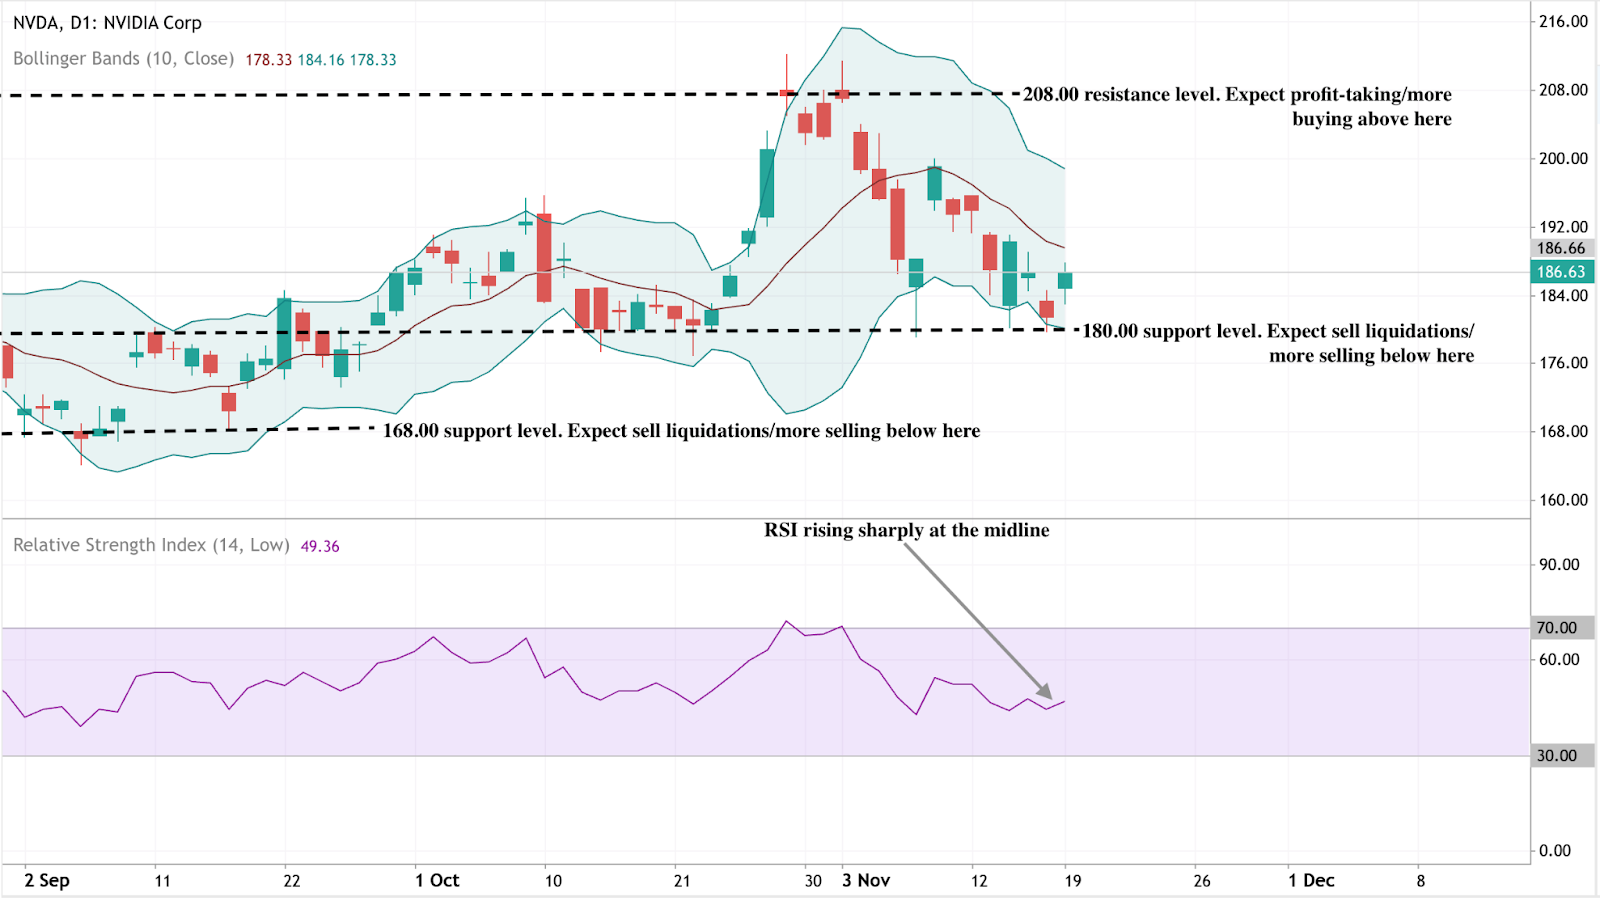
Nvidia technical analysis
At the time of writing, Nvidia’s stock (NVDA) is hovering around $186, showing early signs of recovery after a short-term pullback. The RSI is rising sharply from the midline near 50, indicating that bullish momentum may be building as buying pressure intensifies.
Meanwhile, the Bollinger Bands are starting to narrow slightly, signalling a potential volatility squeeze that could precede a directional breakout. The price is currently positioned around the middle band, indicating a balance between buying and selling forces.
On the downside, support levels lie at $180 and $168. A drop below $180 may trigger further selling or stop-loss liquidations, while a break under $168 could confirm a deeper correction. On the upside, the key resistance sits at $208, where profit-taking and fresh buying activity are likely to intensify if the price breaks above it.
Key takeaway
Nvidia’s potential $300bn surge isn’t a sign of euphoria - it’s a reality check for those betting on an AI crash. The company’s results confirm that artificial intelligence has moved beyond the phase of promise into proof. As capital shifts from prototypes to platforms, the question isn’t whether AI will endure - it’s how fast it will reshape every market it touches. For now, Nvidia remains the pulse of that transformation.
For traders navigating that transformation, platforms like Deriv MT5 offer exposure to the tech rally’s next phase - while tools such as the Deriv trading calculator provide the precision to manage risk as the AI-driven market matures.

Sanctions vs supply glut: The battle defining Oil prices
Oil prices are caught in a tug-of-war that defines the entire energy narrative right now - sanctions versus surplus.
Oil prices are caught in a tug-of-war that defines the entire energy narrative right now - sanctions versus surplus. As Washington’s latest restrictions on Russian oil giants, such as Rosneft and Lukoil, take effect, traders are wondering whether this will finally squeeze supply enough to lift prices or if swelling inventories and record U.S. output will keep them grounded.
WTI crude has hovered near $60 in recent sessions, reflecting that same indecision. Every headline about sanctions sparks a flicker of optimism; every inventory report snuffs it out. The outcome of this standoff - between geopolitics and fundamentals - will decide whether oil’s next move is a breakout or another false dawn.
What’s driving the rebound
According to analysts, the recent oil bounce is largely fuelled by heightened concern over Russia’s export flows. In a press release issued by the U.S. Department of the Treasury, the United States and allied countries have imposed sweeping sanctions targeting major Russian oil producers, including Rosneft and Lukoil, along with hundreds of vessels from the “shadow fleet”.
These measures are designed to choke off Russia’s oil revenues and, by extension, reduce its export volumes. The logic is simple: fewer barrels from Russia = tighter global supply = higher prices. But the counter-force is significant: global supply remains robust, and demand isn’t bouncing back as expected.
According to the International Energy Agency (IEA), non-OPEC+ production is forecast to grow by 1.7 million barrels per day (bpd) in 2025, while demand growth is projected at just 0.79 million bpd, signalling a structural surplus unless changes occur.
Meanwhile, data show that Russia’s output and export adapt-workarounds remain effective so far - Russian production rose by about 100,000 bpd even after sanctions. Thus, the rebound is caught between a genuine supply shock narrative and a stubborn demand/stock overhang, and whether prices break out depends on which side prevails.
Why it matters
For traders, producers and consumers, this dynamic is far from academic. A sustained rally driven by supply constraints would favour oil-heavy portfolios, refining margins, and exporting nations. Conversely, if oversupply persists and demand disappoints, even the sanction narrative won’t save prices. As one senior energy analyst noted: “The market doesn’t expect much lost supply until enforcement becomes indisputable.”
For Russia and its global buyers, the stakes are high. Russia’s oil and gas revenues plunged by 27% in October 2025 compared to the same month a year earlier, reflecting the pressure of sanctions even as volumes held up through workarounds.
At the same time, major oil importers such as India and China have been increasing their Russian cargoes in recent months before the November plunge, which has cast doubts about continued oil flows to those countries.
So, if importers continue to absorb discounted Russian barrels, global supply may remain ample even though the narrative suggests otherwise. On the consumer end, if oil prices are kept low due to oversupply, fuel costs remain manageable. If supply loss dominates, refined-product prices (diesel, gasoline) could rise, feeding inflation and impacting economic growth - a risk to be watched for in both developed and emerging markets.
Impact on the market
In practical terms, the battle lines are drawn according to analysts. On the supply-risk side, if sanctions bite and Russian exports drop materially, markets may tighten quickly, and oil prices could rally.
The risk premium is already reflected in crude spreads: the discount for Russian Urals crude versus global benchmarks jumped to around US$19 per barrel by early November, as buyers shunned Russian cargoes, according to a report by Meduza. That suggests the sanction effect may be starting to crack.
But on the flip side, tracking data suggest that Russian flows are still being rerouted, and global producers (especially shale, Brazil and the U.S.) are responding. With U.S. production at record levels and inventories increasing, the oversupply story remains viable, according to industry commentators. If demand remains weak - for instance, from China or the global industry - then any supply-shock rally may be short-lived, and prices could retreat.
Refining and trade flows are also adjusting. Dealers and refiners are now considering discounted Russian crude, longer shipping routes, and higher freight and insurance costs - all of which increase complexity but don’t necessarily immediately reduce volumes. Until actual barrel losses show up in export data, the market may remain in limbo, reluctant to commit to strong upward momentum.
Expert outlook
According to analysts, the most probable scenario is a market stuck in a range-bound trading pattern, punctuated by bursts of volatility. That is, oil may temporarily rally on rumours of sanctions or supply disruptions, but unless demand proves stronger and supply genuinely tightens, the move may lack legs. Reuters reported that the IEA continues to expect supply growth outpacing demand this year.
If enforcement of sanctions tightens - for example, if shadow-fleet tankers are blocked, insurance costs spike or major importers pull back from Russian oil - then we could see a meaningful rally.
On the demand front, counter-signals to watch include refining run-rates (which remain under pressure), travel and mobility trends, and China’s petro-chemical demand. Until one of these breaks clearly favourably, the oversupply story will likely keep a lid on prices.
In short, the supply risk is real, but it hasn’t yet overridden the oversupply/weak-demand backdrop. Until that happens, the rally remains tentative.
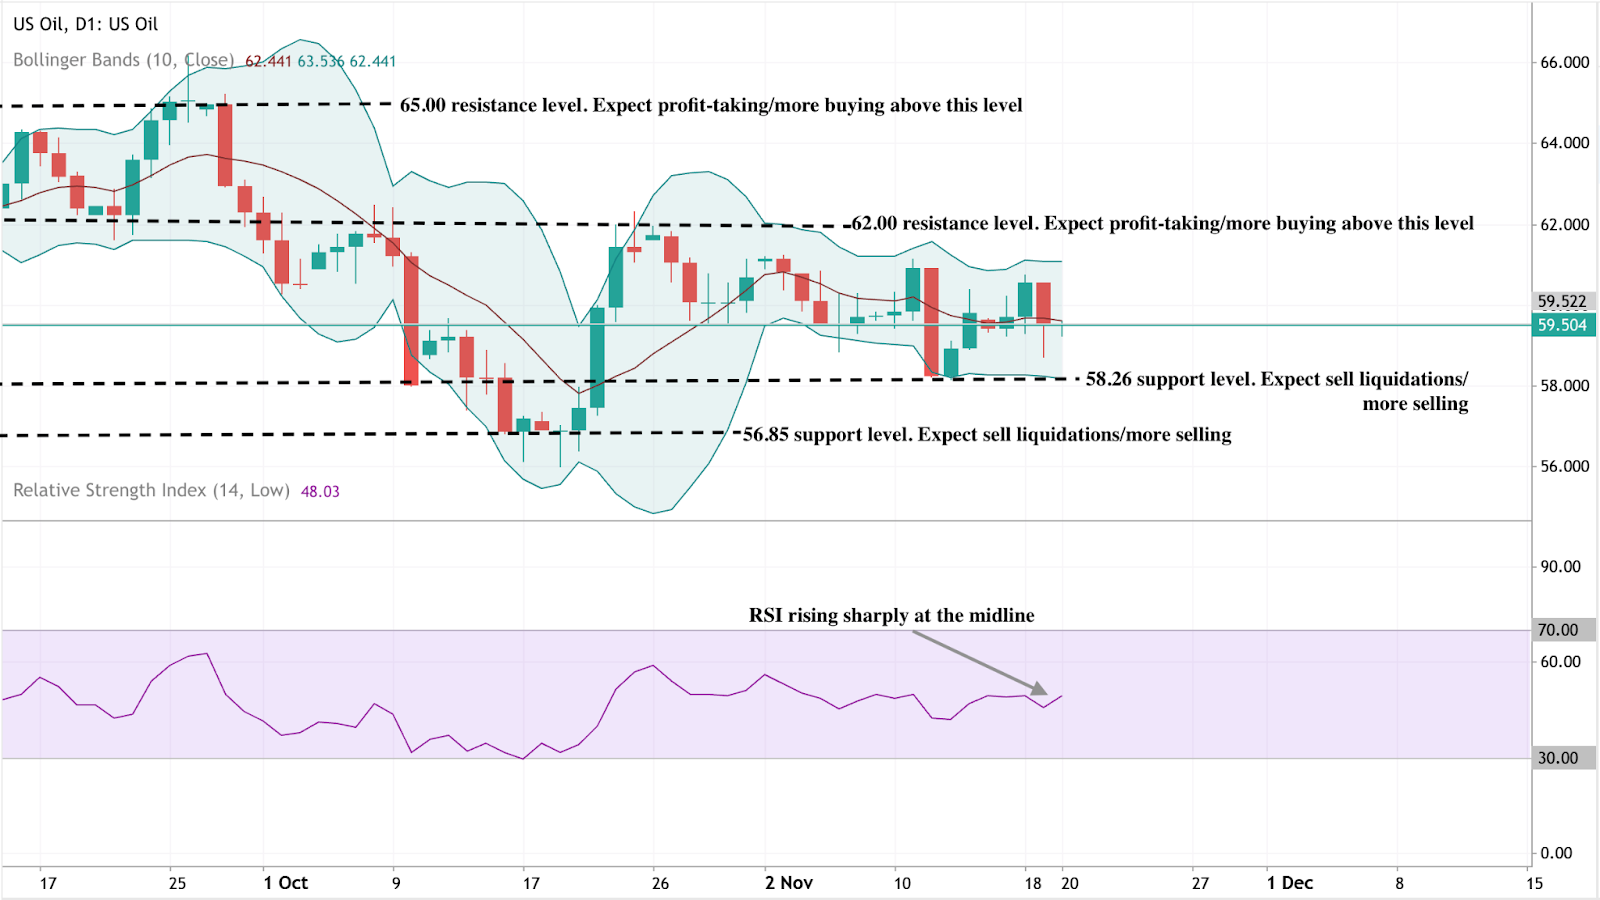
Oil technical insights
At the time of writing, US Oil is trading around $59.50, consolidating within a narrow range as momentum starts to stabilise. The RSI is climbing sharply from the midline near 50, hinting at strengthening bullish momentum and suggesting that buyers may be regaining short-term control.
The Bollinger Bands (10, close) are relatively tight, signalling reduced volatility and the potential for a breakout. Price action remains centred around the middle band, showing indecision but with a slight upward bias as buyers attempt to push above the mid-range.
Key support levels are found at $58.26 and $56.85, where a break lower could trigger further selling pressure or stop-loss liquidations. On the upside, resistance sits at $62.00 and $65.00 - levels where profit-taking and stronger buying activity could emerge if the market breaks higher.
Key takeaway
The oil market is at a crossroads where the sanction-driven supply-risk narrative clashes with the solid structural reality of oversupply and weak demand. While the latest Russian sanctions have sharpened the risk premium, global production and inventories remain elevated and demand remains fragile.
Unless export losses are real and demand picks up, the oversupply story will likely keep oil prices pinned. The next key signals to monitor: export data from Russia, inventory changes globally and demand indicators from Asia and the U.S. Stay alert - this is a high-stakes battle that could tip either way.
For traders navigating the oil market, Deriv MT5 offers exposure to both WTI and Brent. Meanwhile, tools such as the Deriv trading calculator provide the precision needed to manage risk as the AI-driven market matures.

USD/JPY outlook: Can the Yen hold its ground amid Japan’s policy tug-of-war?
Reports indicate that the Japanese yen is struggling to maintain its stability as Japan’s fiscal and monetary priorities diverge in opposite directions.
Reports indicate that the Japanese yen is struggling to maintain its stability as Japan’s fiscal and monetary priorities diverge in opposite directions. A massive ¥25 trillion stimulus plan from Prime Minister Sanae Takaichi has reignited concerns about inflation and weighed on the currency, while the Bank of Japan’s cautious stance on rate hikes offers little support. The result is a yen pinned near a nine-month low, with the USD/JPY pair hovering around ¥155.
Many say Japan’s policy tug-of-war is tilting decisively against the yen. Unless the government and central bank find common ground, traders may see further weakness - especially if the dollar remains buoyed by a patient but firm Federal Reserve.
What’s driving USD/JPY
The yen’s weakness stems from a widening policy divide inside Japan’s leadership. Prime Minister Takaichi’s administration has revived Abenomics-style stimulus, prioritising fiscal expansion to boost wages and consumer demand.
Lawmakers have proposed a supplementary budget exceeding ¥25 trillion, stoking concerns over rising debt issuance and sending 40-year Japanese government bond yields to record highs.
Meanwhile, the Bank of Japan (BoJ) is caught between political pressure and macroeconomic caution. Inflation, currently around 2.9%, remains above target, yet the prime minister insists on keeping rates low until wage growth - not food or energy costs - drives price stability.
Governor Kazuo Ueda has hinted at tightening if inflation persists, but uneven growth complicates matters: GDP grew 1.1% year-on-year, yet contracted 0.4% quarter-on-quarter. This tug-of-war has left investors unsure whether Japan’s policies are reflating the economy or eroding its currency.
Why it matters
This internal conflict is redefining how global markets view the yen. Once seen as a safe-haven anchor, it’s now behaving more like a risk currency, moving with rather than against global sentiment. “Japan has added a tumultuous element - they’re a little more wild, a little more volatile,” said Juan Perez of Monex USA. That volatility reflects a new reality: fiscal expansion is now Japan’s dominant narrative, while monetary prudence takes a back seat.
For traders, the risk is that verbal intervention replaces actual action. Finance Minister Satsuki Katayama has expressed concern over the yen’s sharp depreciation, but Tokyo has so far refrained from stepping into the market. Intervention is likely only if USD/JPY breaches ¥156 decisively - a level seen as politically sensitive rather than economically critical by analysts.
Impact across markets
According to reports, the consequences of Japan’s fiscal-monetary split are evident across its bond and currency markets. The yield curve has steepened sharply as investors price in heavier debt issuance, while near-zero short-term rates keep domestic liquidity abundant. This imbalance encourages capital outflows, as investors seek higher yields abroad, further putting downward pressure on the yen.
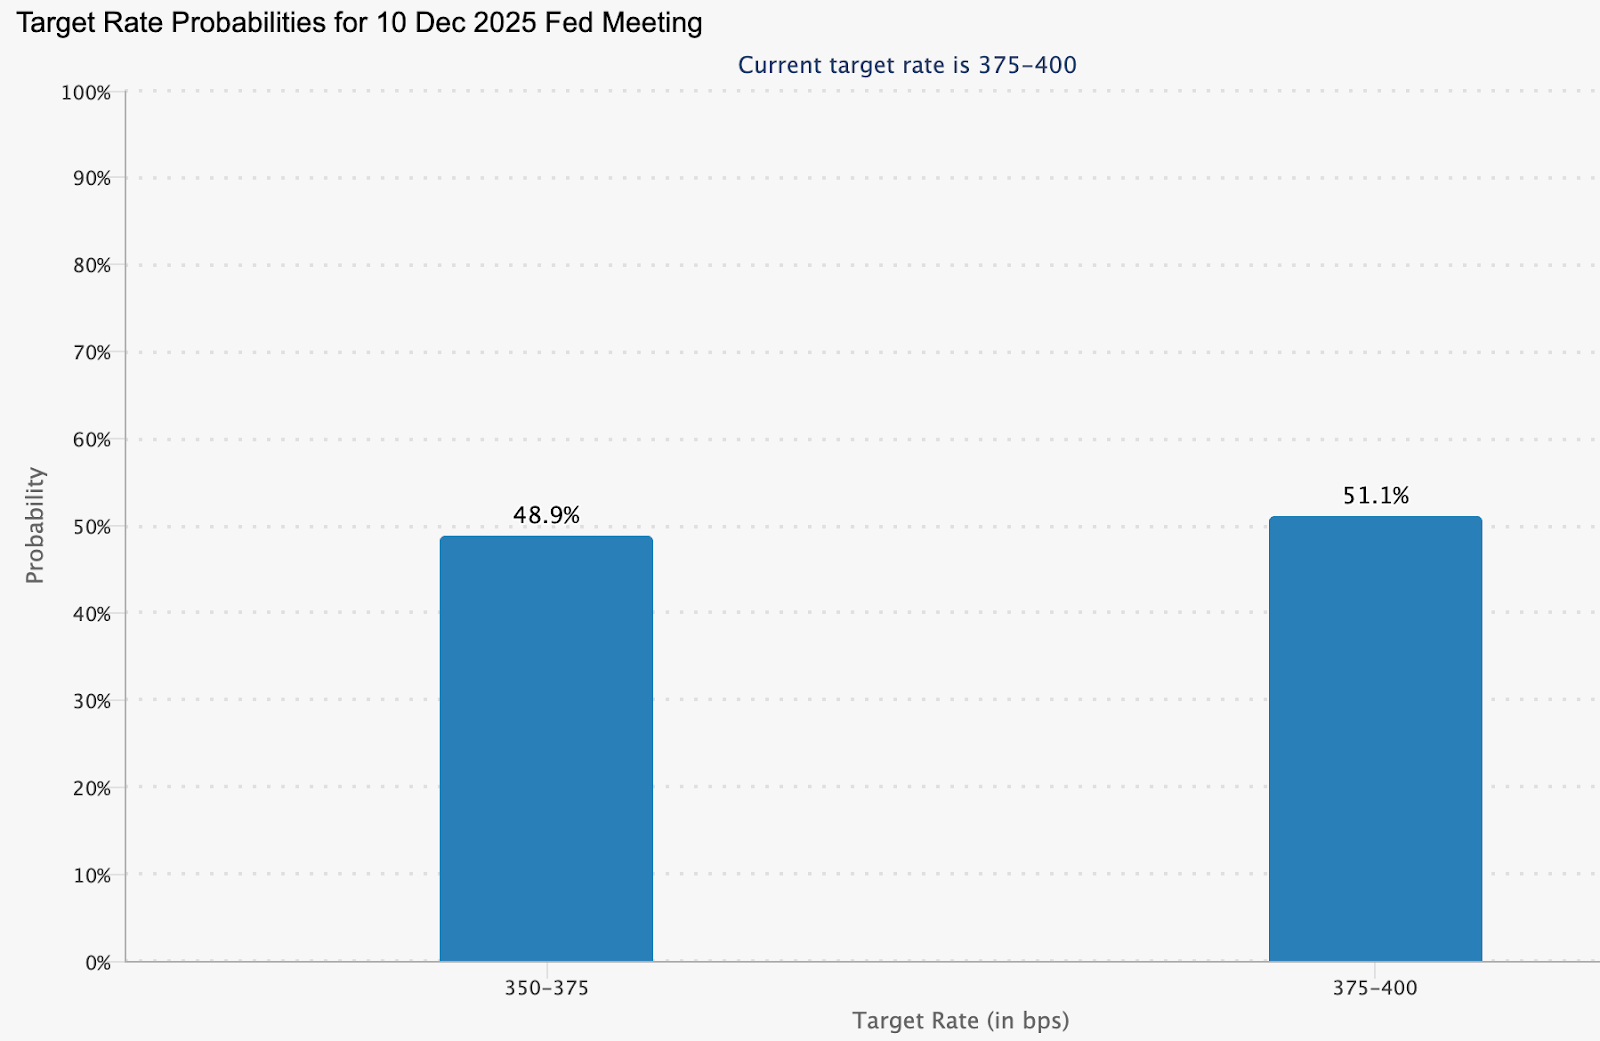
Across the Pacific, the Federal Reserve’s steadiness has reinforced dollar strength. Officials such as Philip Jefferson and Christopher Waller continue to advocate patience on rate cuts, trimming the probability of a December reduction to around 48%, down from 60% last week (CME FedWatch).
According to analysts, as long as this interest-rate gap persists, the dollar will remain structurally favoured against the yen, - and any yen rallies will likely prove temporary.
Expert outlook
Analysts see little relief for the yen in the near term. Barclays recommends holding a long position on the dollar against the yen, arguing that Takaichi’s expansionary agenda will suppress domestic yields and maintain downward pressure on the currency. Still, a sustained climb beyond ¥156 could test Tokyo’s resolve and force coordinated intervention.
The next key event is the delayed US Non-Farm Payrolls report, expected to provide fresh insight into labour market conditions. A weaker reading could trigger short-term dollar selling, allowing the yen to recover briefly. Yet without a policy shift in Japan, that reprieve may be short-lived. For now, the yen’s trajectory is dictated less by data and more by the dissonance between fiscal ambition and monetary caution.
USD/JPY technical insight
At the time of writing, USD/JPY is trading around 155.45, extending gains within a price discovery zone as bullish momentum persists. The pair is hugging the upper Bollinger Band, signalling strong buying pressure but also hinting at a possible overextension.
The RSI is climbing toward the overbought region, reinforcing the risk of a short-term pullback or profit-taking. Immediate support lies at 152.96, followed by 146.45, where a breakdown could trigger sell liquidations and accelerate downside movement.
However, as long as prices hold above the middle Bollinger Band and 153.00, the broader uptrend could remain intact, supported by policy divergence between the Federal Reserve and the Bank of Japan.

Key takeaway
Japan’s yen problem isn’t just about markets - it’s about messaging. Expansionary fiscal policy collides with a hesitant central bank, leaving investors unsure which signal to follow. The result is a currency under sustained strain, with verbal intervention doing little to stop the slide. Unless Tokyo finds alignment between stimulus and stability, the yen’s effort to hold its ground may remain more symbolic than successful.

Gold’s reversion to the mean: A pause before the next rally?
Gold has climbed back above $4,050 per ounce, stabilising after a sharp two-week selloff that pulled the metal down from record highs.
Gold has climbed back above $4,050 per ounce, stabilising after a sharp two-week selloff that pulled the metal down from record highs. The move reflects what analysts increasingly describe as a reversion to the mean - a natural correction following a steep run from $3,450 to $4,380 earlier in the quarter.
With the long-delayed US Non-Farm Payrolls (NFP) report now in focus, traders are watching whether this consolidation is a breather before the next leg up. The broader backdrop remains tense. Hawkish Federal Reserve remarks, delayed data from the US government shutdown, and continued geopolitical stress are all reshaping sentiment. Yet, behind the noise, gold’s pullback looks less like weakness - and more like equilibrium returning.
What’s driving gold’s mean reversion
The latest correction follows months of relentless buying, fuelled by soft US data, de-dollarisation flows, and record central-bank accumulation. Gold’s sprint from $3,450 to $4,380 outpaced fundamentals, leaving technical indicators stretched and sentiment euphoric.
Now, as traders recalibrate expectations for a December rate cut - pricing in a 48.9% chance according to CME FedWatch - the metal has slipped back toward its midrange, around $4,050–$4,100, where short-term and long-term averages converge.
This retreat also mirrors a psychological reset. Markets are digesting the Fed’s cautious tone, with Vice Chair Philip Jefferson urging a “slow approach” to policy changes and regional presidents Bostic and Schmid signalling preference for steady rates. Those comments, paired with delayed macro data, have thinned speculative positions and allowed gold to breathe. In effect, the market is rediscovering balance - a hallmark of mean reversion after an overextended move.
Why it matters
Gold’s mean reversion tells a deeper story about trust and monetary fatigue. As Citadel’s Ken Griffin noted, the rising price of gold reflects “a loss of trust first in US Treasuries, then in G7 bond markets.” Investors are responding not to short-term volatility, but to structural concerns about government debt and the stability of fiat currency.
Analysts at Deutsche Bank maintain that the medium-term trend remains intact, projecting an average gold price of $4,000 per ounce next year. They highlight “elevated official demand” - a reference to sustained central-bank buying.
In October, China’s central bank added 0.9 tonnes to its reserves, marking its 12th straight month of accumulation. Ongoing purchases throughout 2025 have lifted China’s official gold reserves to 2,304.5 tonnes.
This underlines that while traders may be reverting to the mean, nations are not - they’re steadily diversifying away from the dollar.
Impact across markets
In China, investor appetite for gold remains vigorous even during the correction. ETF inflows jumped RMB 32 billion (US$4.5 billion) in October, pushing total holdings to a record 227 tonnes.
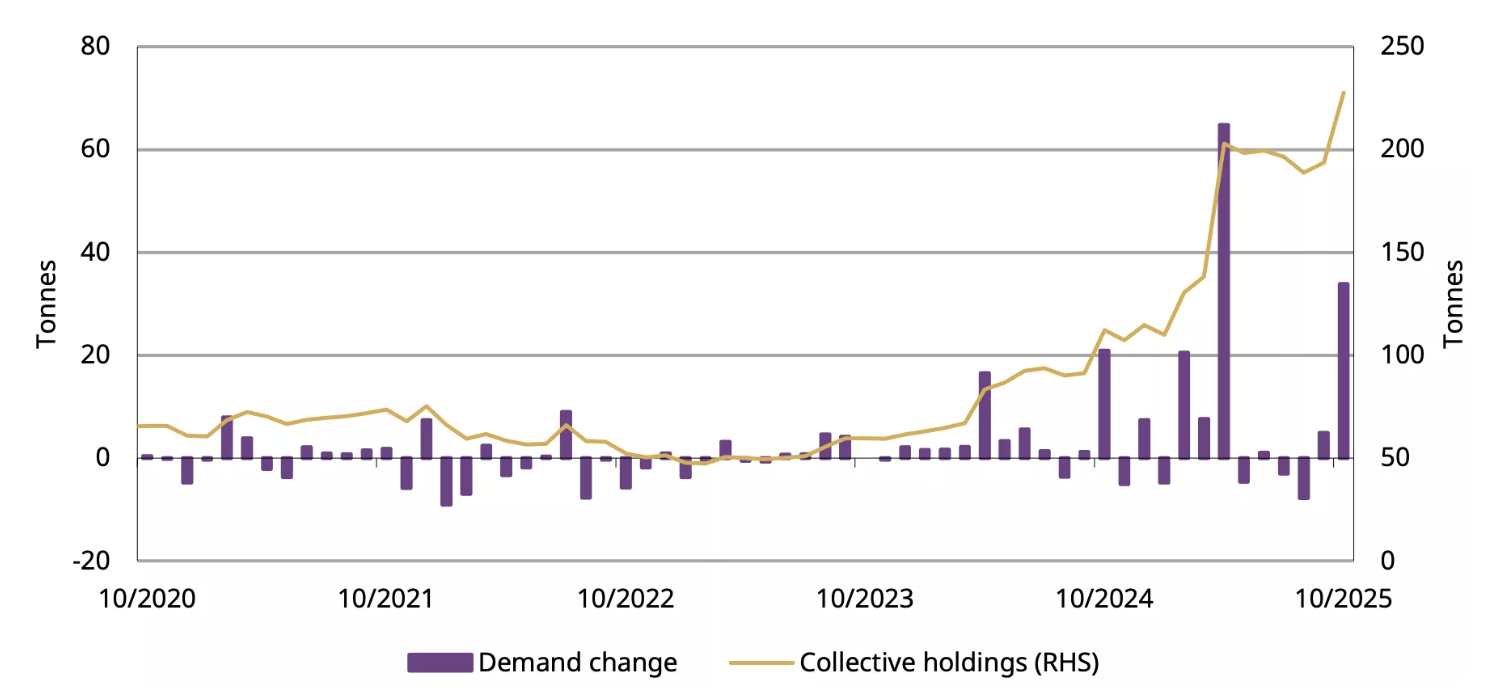
Physical demand, measured by withdrawals from the Shanghai Gold Exchange, rose 17 tonnes year-on-year to 124 tonnes, defying seasonal softness. The data suggests that investors see dips as opportunities, not red flags.
Globally, the story is similar. Soft US employment data and climbing jobless claims have tempered the dollar’s strength, nudging investors back into gold and silver.
Still, there’s awareness that a stronger NFP print or easing geopolitical risk could stall momentum. Even so, mean reversion isn’t a bearish event - it’s the market’s way of restoring order after a speculative sprint. And order, in uncertain times, is the most bullish foundation of all.
Expert outlook
Most analysts agree that gold’s medium-term trajectory remains higher, although near-term volatility will hinge on the US jobs data and the Fed’s stance in December. Independent trader Tai Wong says, “soft data is slightly boosting hopes for a December cut - helping gold and silver, which are trying to break a three-day losing streak.” That sentiment captures the current equilibrium: cautious optimism tempered by macro prudence.
If the NFP report underperforms, gold could swiftly retest $4,200, according to analysts. If it surprises to the upside, a dip toward $3,950 would complete a textbook mean reversion cycle before stabilising. Either way, the long-term bull case - driven by de-dollarisation, AI-driven labour disruption, and inflation inertia - remains intact. The question isn’t whether gold rises again, but when.
Gold technical analysis
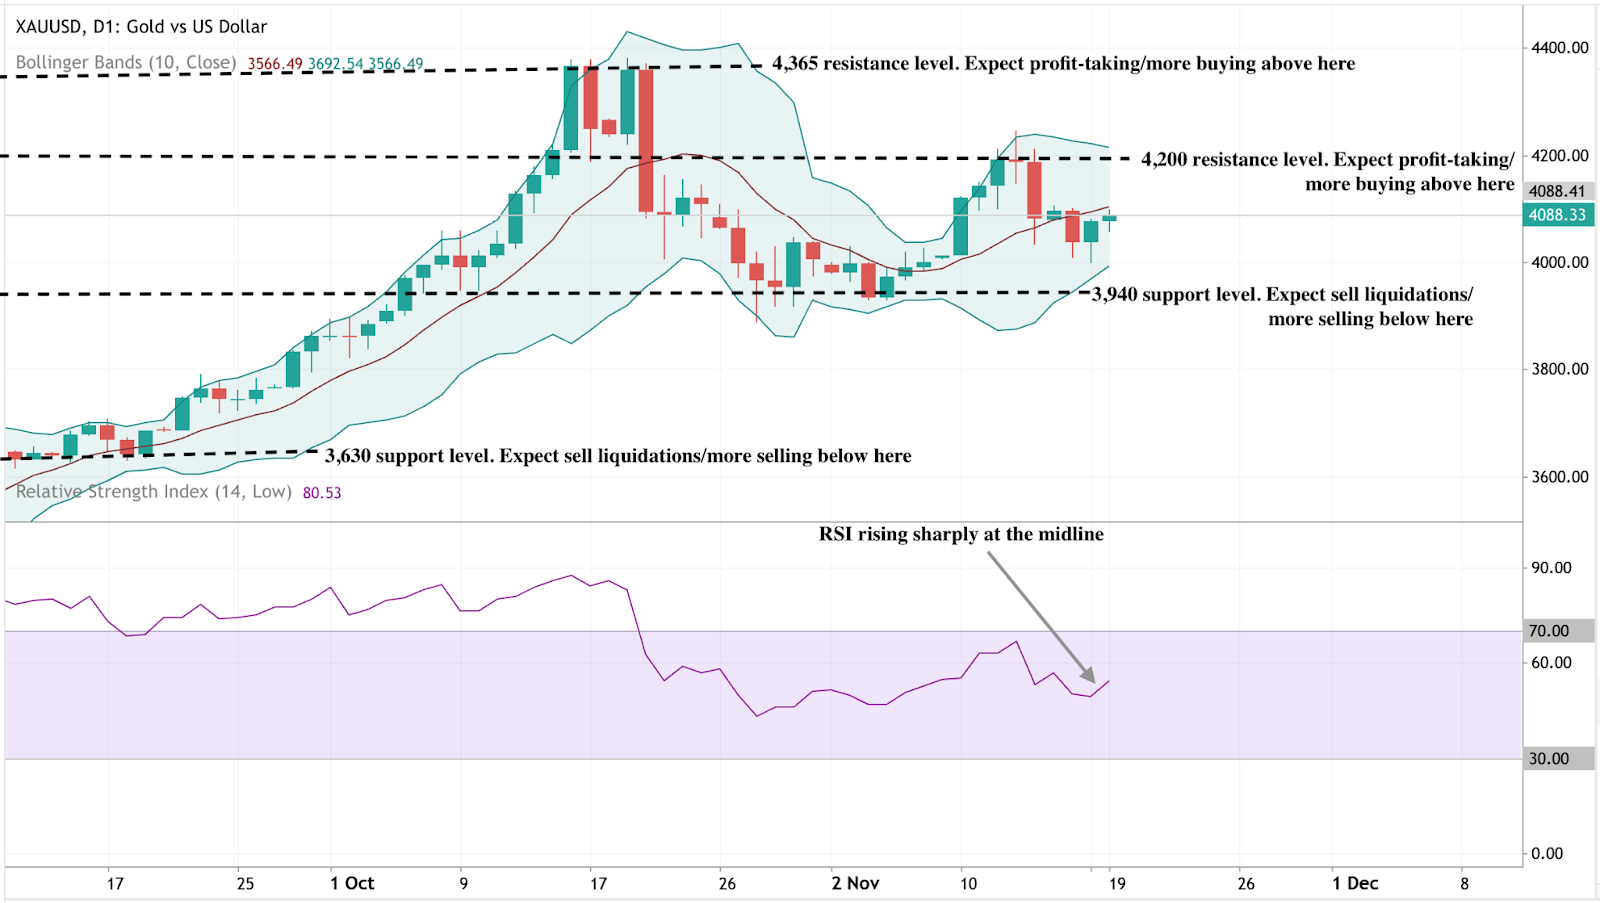
At the time of writing, XAU/USD is trading near $4,088, rebounding from the lower Bollinger Band as buyers re-enter the market. The Bollinger Bands are beginning to widen after a period of contraction, suggesting that volatility may be returning.
The RSI is rising sharply from the midline, signalling improving bullish momentum. Key resistance levels are seen at $4,200 and $4,365, where profit-taking or further buying could occur if gold breaks higher. On the downside, a fall below $3,940 would likely trigger sell liquidations, exposing deeper support at $3,630.
Overall, gold appears to be in the early stages of a potential bullish continuation, with the technical setup hinting at renewed upside pressure if momentum sustains above the mid-Bollinger Band.
Key takeaway
Gold’s pullback to the $4,000 zone isn’t weakness - it’s rhythm. A reversion to the mean after a parabolic rise is how sustainable trends reset. Beneath short-term volatility, the drivers of this bull phase - de-dollarisation, central-bank accumulation, and macro distrust - remain fully in play. As the US jobs data and Fed decisions unfold, this pause could mark the quiet before gold’s next major rally.

Bitcoin crashes under $90K as ‘death cross’ bites
Spot prices printed as low as 89,420 dollars, the weakest level since February, only six weeks after setting a record near 126,250 dollars.
Bitcoin slipped below 90,000 dollars on Tuesday, extending a selloff that has erased its 2025 gains and pushed sentiment toward the bleak end of the spectrum. Spot prices printed as low as 89,420 dollars, the weakest level since February, only six weeks after setting a record near 126,250 dollars.
The breakdown coincided with a bearish technical crossover known as a death cross and increasingly hesitant fund flows into U.S. spot ETFs.
Together with macro anxiety around the rate path, these factors have tightened liquidity and amplified swings across majors. The next phase hinges on whether price can quickly reclaim lost support and whether ETF prints stabilise from recent choppiness.
What’s driving the slide
The proximate trigger is technical: Bitcoin fell back through reclaimed support near 93,700 dollars, lost its 200-day moving average, and then registered a death cross as the 50-day slipped beneath the 200-day.
On its own the signal is imperfect, but in weak liquidity regimes it often coincides with multi-week drawdowns as momentum traders de-risk.
Flows add fuel. U.S. spot ETF activity has turned choppy after heavy intake earlier in the year, with trackers showing sequences of outflows or flat prints that blunt marginal demand. When the incremental demand fades, price tends to chase lower liquidity pockets until new buyers emerge. Recent dashboards corroborate the stop-start nature of ETF demand. CoinDesk+1.
The Mt. Gox repayments - a trigger, not the cause
Adding fuel to the fire, over 10,600 BTC (worth roughly $953 million) were transferred from Mt. Gox wallets on 18 November 2025, marking the first such movement in eight months.

The long-running repayment saga, stemming from the 2014 collapse of the world’s then-largest exchange, has left creditors waiting over a decade for compensation.
While some feared that repayments could unleash fresh supply, blockchain data shows these movements were administrative, not market sales. Still, perception alone was enough to unsettle sentiment, sparking liquidations and feeding the broader risk-off tone. Analysts now estimate over 230,000 trading accounts were liquidated within 24 hours, totalling more than $1 billion in forced sell orders.
Why this matters
Sentiment has swung hard into fear. CoinDesk flagged “extreme fear” conditions into the weekend and early week, aligning with widely followed gauges that punish downside volatility and negative breadth. In past cycles, similar extremes have marked acceleration phases within larger drawdowns or short-lived exhaustion points.
The macro overlay is not helping. Traders are parsing shifting expectations for U.S. rate cuts and inflation risks tied to policy developments, a mix that reduces risk appetite and tightens crypto liquidity. Reuters’ read-across captures the mood: a near 30 percent retreat from the October peak and growing caution among institutions.
Impact on markets and participants
Price leadership rotated back to bitcoin as traders sold altcoins to manage risk, a pattern visible when social attention and volumes consolidate in the benchmark asset during stress. Ether and other large caps have tracked lower alongside, while crypto-linked equities have generally underperformed on drawdown days, transmitting crypto volatility into listed proxies.
For allocators, ETF prints serve as the cleanest real-time barometer of spot demand. Multi-day flat or negative flows often coincide with fragility in order books and heavier slippage, which is why desks are laser-focused on whether the next sequence turns positive again. If it doesn’t, the unfilled liquidity pocket toward 86,000–88,000 dollars cited by traders continues to be a live risk.
Expert outlook
CoinDesk’s market desk notes that fear spikes of this magnitude have sometimes preceded relief rallies, particularly when realised-loss pressure begins to stabilise and ETF outflows slow. That requires confirmation: a swift reclaim of broken support and evidence of renewed net inflows. Until then, technicals and positioning argue for elevated two-way volatility.
Long-horizon investors continue to point at structural adoption and institutional participation as reasons to stay constructive on multi-year horizons. Dan Tapiero, whose 50T platform backs later-stage crypto companies, frames short-term turbulence as noise against a secular build-out, a view he has reiterated while forecasting a much larger digital-asset economy over the next decade.
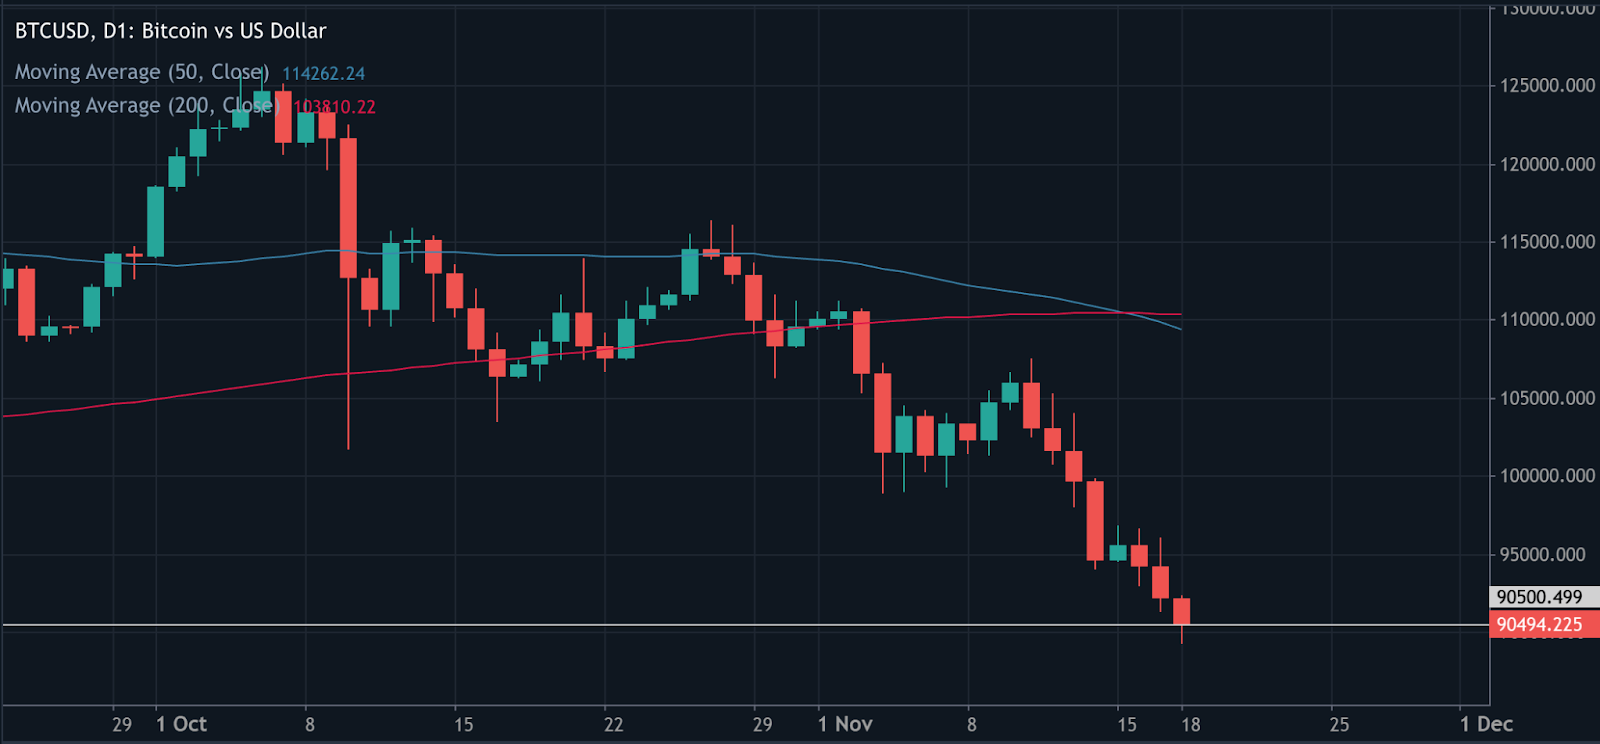
Bitcoin price technical insight
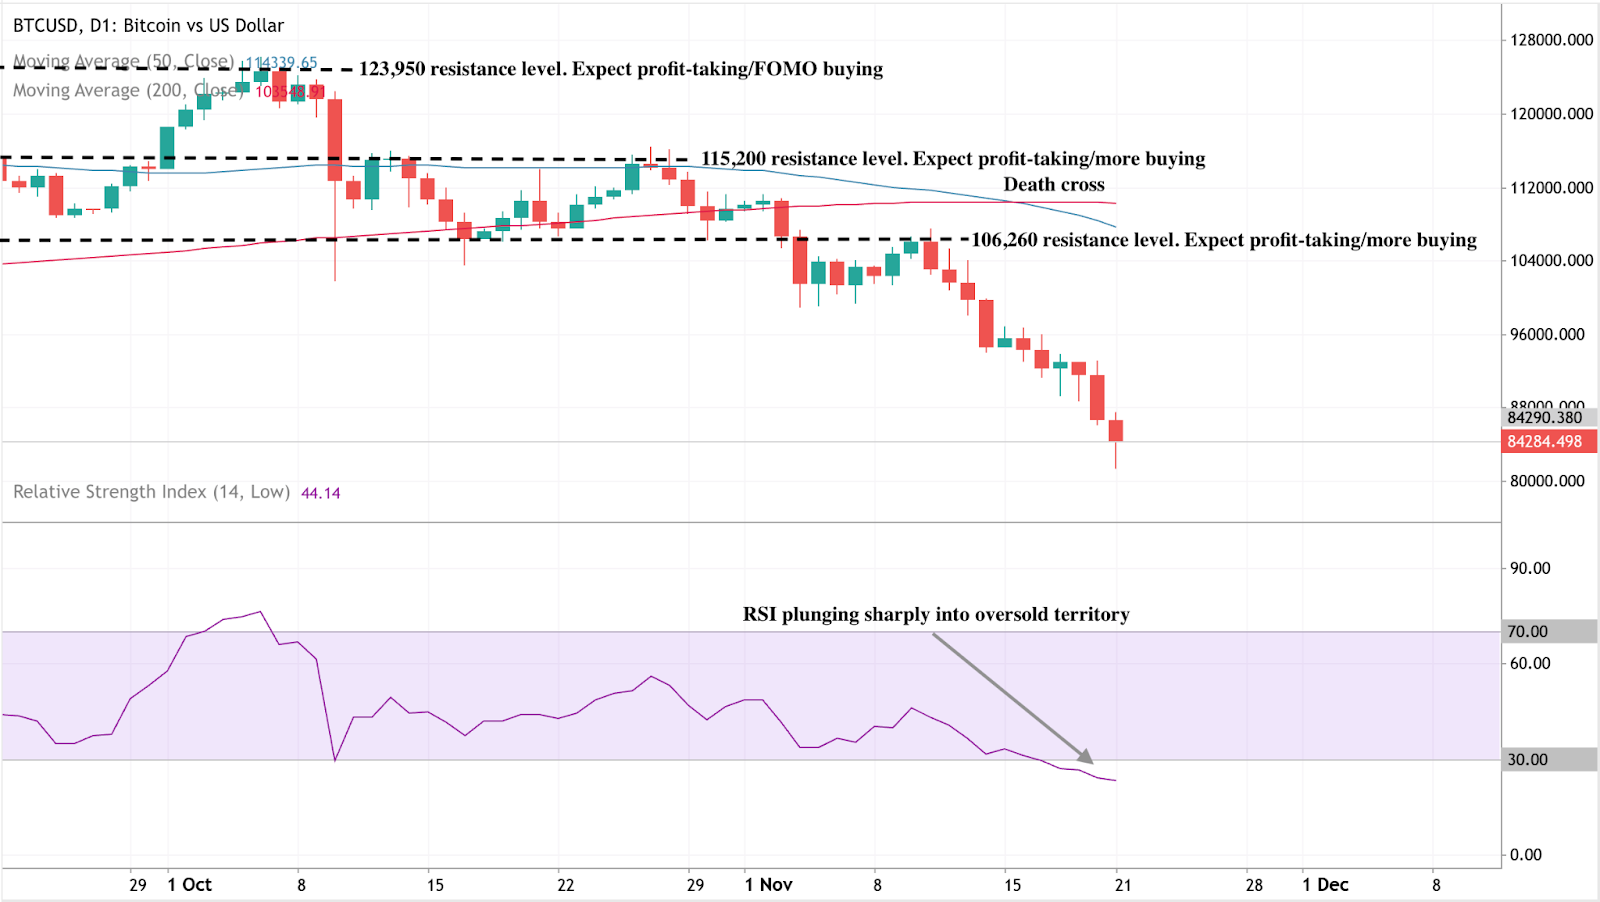
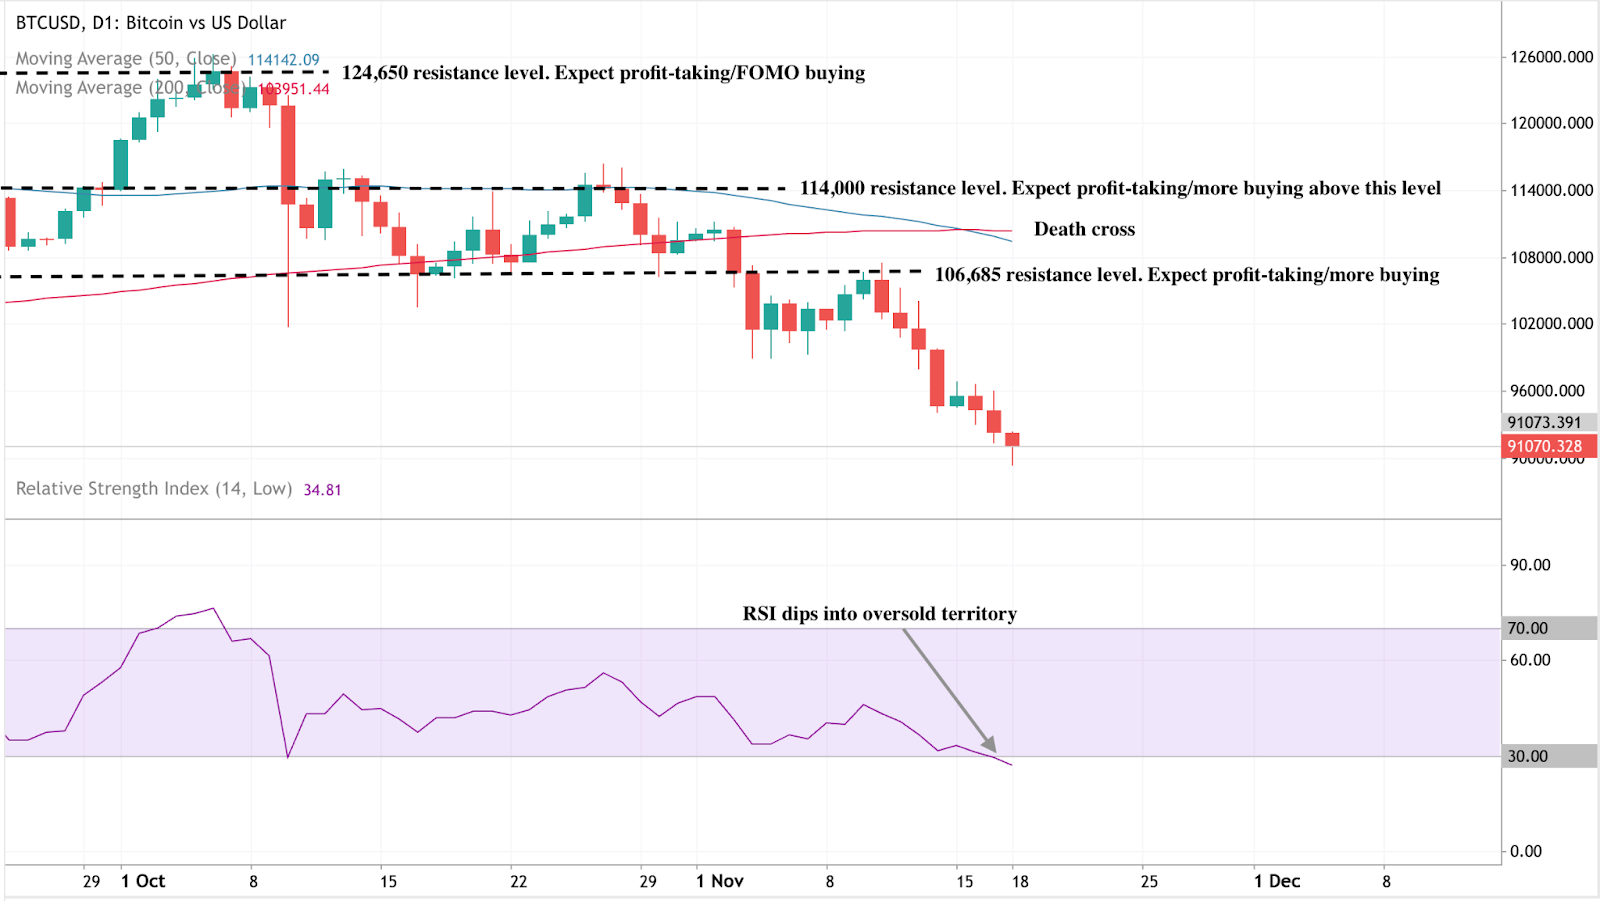
Bitcoin (BTC/USD) continues its downward trajectory after forming a death cross, with the 50-day moving average (MA) crossing below the 200-day MA - a classic bearish signal suggesting extended downside pressure. The price is currently hovering near $91,000, after repeatedly failing to hold above key resistance levels at $106,685, $114,000, and $124,650, where prior rallies saw heavy profit-taking and FOMO-driven buying.
The Relative Strength Index (RSI) has dipped into oversold territory, indicating that selling momentum may be overextended and a short-term technical rebound could occur. However, as long as BTC remains below the 50-day MA, the broader trend remains bearish, with traders likely to view any bounce as a chance to sell into strength.
Key takeaway
Bitcoin’s slide below $90,000 reflects a convergence of technical breakdown, hesitant ETF demand, and a risk-off macro tone. The resulting fear spike is typical of late-stage selloffs, but it needs flow confirmation before calling a durable low. Watch for a quick reclaim of the $ 90,000 - $93,000 zone and a run of positive ETF prints to validate any rebound attempt. Until then, expect elevated volatility and tighter liquidity conditions.

Yen carry trade in reverse: Japan’s yield shift and its impact on USD/JPY
As domestic yields rise, Japanese investors are increasingly repatriating funds from abroad, strengthening the yen and unsettling one of the world’s longest-standing funding trades.
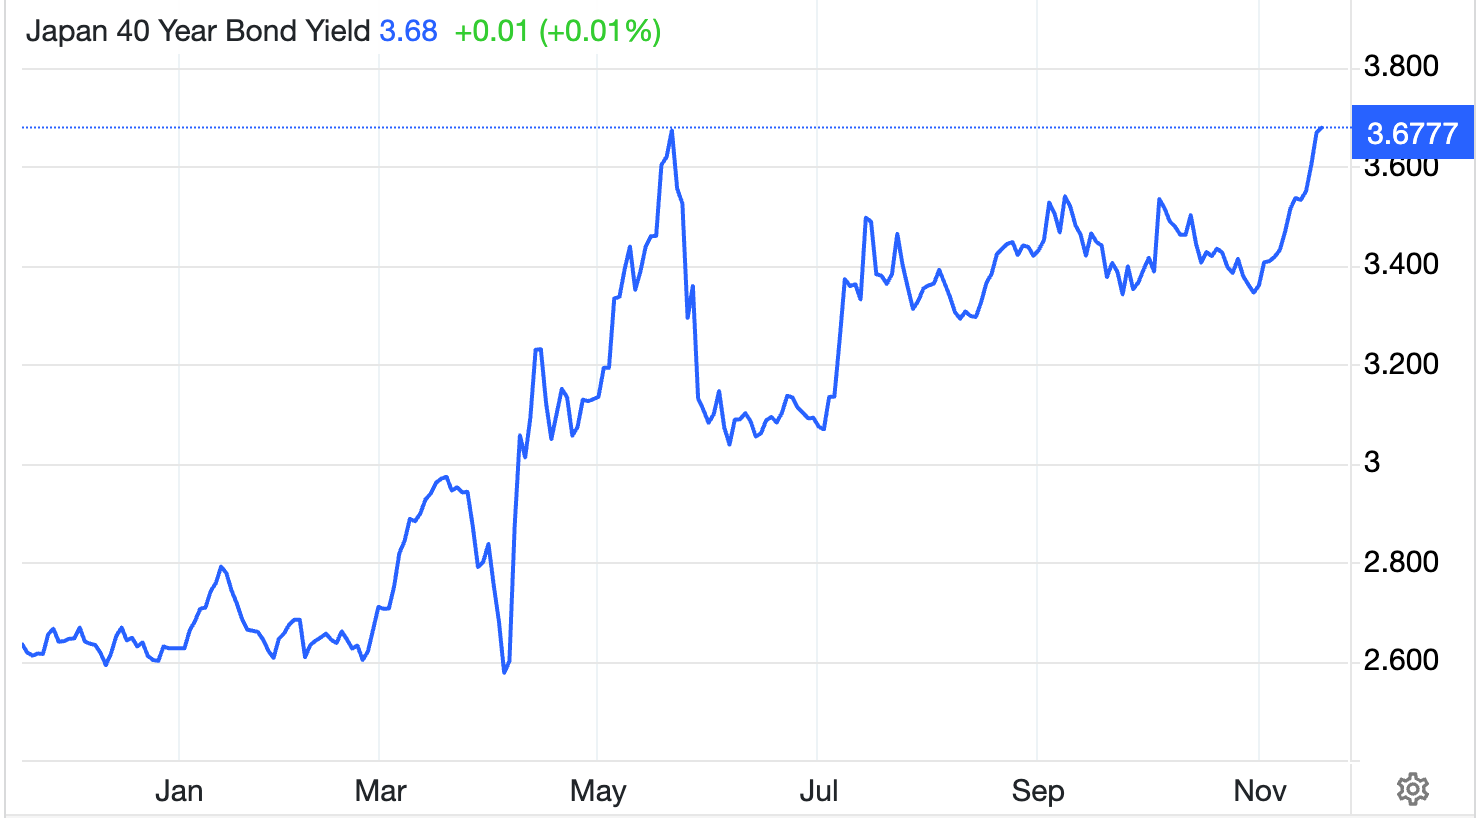
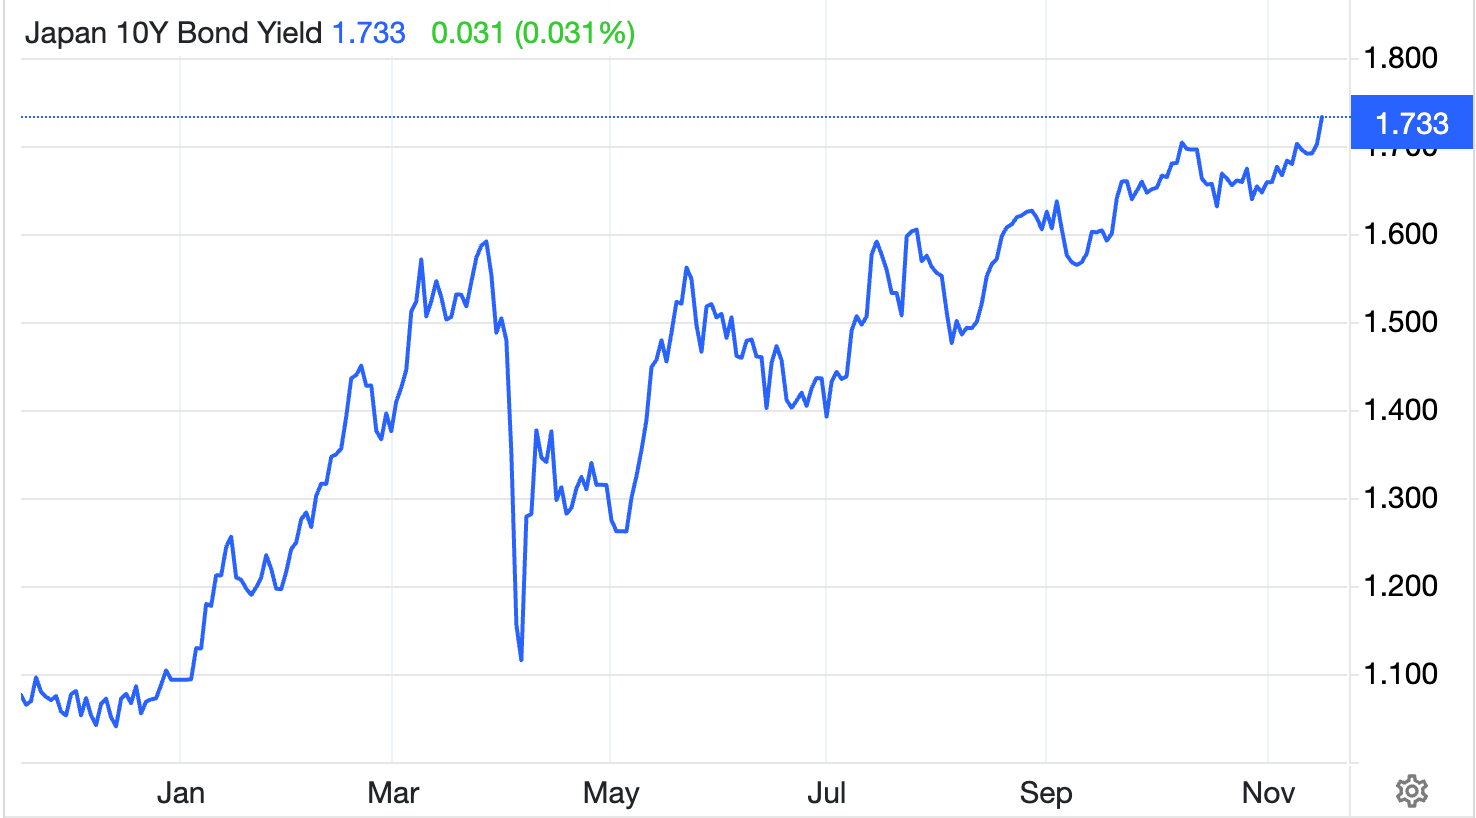
Japan’s bond market is rewriting the rules of the global foreign exchange market. The country’s 10-year government bond (JGB) yield has surged to 1.73% - its highest level since June 2008 - as markets brace for a ¥17 trillion (£88 billion / $110 billion) fiscal stimulus and a further reduction in Bank of Japan (BoJ) bond purchases. The move signals the beginning of a new phase: the yen carry trade in reverse.
As domestic yields rise, Japanese investors are increasingly repatriating funds from abroad, strengthening the yen and unsettling one of the world’s longest-standing funding trades.
The question now dominating markets is clear - will this shift pull USD/JPY back from its multi-decade highs near 156, or force the BoJ and Ministry of Finance (MoF) to intervene once again to stabilise the currency?
Key takeaways
- Japan’s 10-year bond yield has reached 1.73%, the highest since 2008, as markets price in rising inflation, fiscal stimulus, and reduced BoJ support.
- The BoJ’s gradual normalisation - with short-term rates now at 0.5% - is driving a global reassessment of the yen’s funding role.
- A planned ¥17 trillion stimulus aims to offset Japan’s 0.4% GDP contraction in Q3 but risks adding inflationary pressure.
- Rising yields are drawing capital back into Japan, prompting a partial unwinding of the yen carry trade.
- USD/JPY faces key resistance near 155–156, a zone where past interventions have been triggered.
Japan bond yields go up to breach the 1.7 mark
After nearly two decades of near-zero yields, Japan’s bond market is finally moving under its own weight.
The 10-year JGB yield, which stayed below 1% for years due to the BoJ’s Yield Curve Control (YCC), has now broken decisively higher - a sign that investors expect sustained inflation, more fiscal spending, and a lighter BoJ hand in the market.
Several forces have converged:
- The BoJ is tapering bond purchases, reducing artificial demand for JGBs.
- Short-term policy rates have been raised to 0.5%, marking the end of an era of negative rates.
- A massive stimulus plan under Prime Minister Sanae Takaichi is expected to inject over ¥17 trillion into the economy through tax cuts, infrastructure spending, and household support.
Together, these dynamics have pushed bond yields to levels unseen since the global financial crisis, marking what analysts describe as the end of Japan’s “zero-cost money” era.
Higher yields despite Japan’s fragile economy
Despite higher yields, Japan’s economy remains fragile. Data from the Cabinet Office show that GDP contracted by 0.4% in Q3, its first decline in six quarters. Weak residential investment and subdued consumer demand dragged growth lower, even as exports rebounded slightly in September.
BNP Paribas economist Ryutaro Kono noted that while the contraction is not “particularly serious”, it highlights uneven recovery momentum. Still, the forthcoming stimulus package - expected to be approved soon - aims to restore confidence and support households facing rising living costs.
Yet the market reaction suggests scepticism. Investors view fiscal expansion as inflationary and debt-heavy. With Japan’s public debt exceeding 230% of GDP, every new round of spending increases pressure on the bond market - and by extension, the yen.
The mechanics: Why higher yields strengthen the yen
The surge in Japanese yields has immediate foreign exchange implications, particularly for the USD/JPY exchange rate.
1. Repatriation of capital
Japan’s institutional investors - who collectively hold trillions of dollars in foreign bonds - are now finding better returns at home. As domestic yields climb, they begin selling U.S. Treasuries, European debt, and emerging market assets to reinvest in JGBs. This process increases demand for yen, supporting its value against major currencies.
2. Unwinding the carry trade
The yen carry trade - borrowing in low-yielding yen to buy higher-yielding assets abroad - has been a cornerstone of global markets for years. With Japanese rates rising, this trade becomes less profitable. Traders must buy yen to repay loans, triggering powerful short-term rallies.
3. Yield Differentials and Global Comparison
Even with U.S. 10-year yields near 4–5%, Japan’s rapid shift from near-zero to 1.7% is significant. For Japanese investors who once earned nothing on domestic bonds, the new yield environment is competitive enough to slow outflows and boost inflows, tilting currency dynamics in favour of the yen.
Yen policy trade-offs: Growth, debt, and stability
For the BoJ, this shift poses a major challenge. Governor Kazuo Ueda must balance a weak economy, rising inflation, and market volatility. The ¥17 trillion fiscal push could revive domestic demand, but it also risks fueling inflation expectations and adding strain to already high debt levels.
If yields rise too high, the BoJ may need to intervene in bond markets again or issue verbal guidance to temper speculation. Finance Minister Satsuki Katayama has already warned she is “watching FX moves with a sense of urgency”. Historically, such language has preceded yen-supportive interventions, particularly when USD/JPY nears 155–156 - a zone Credit Agricole analysts flag as Tokyo’s soft intervention threshold.
Geopolitics: China tensions and trade headwinds
External risks compound Japan’s policy dilemma. Relations with China have deteriorated following Takaichi’s remarks on Taiwan, prompting mutual travel warnings and raising fears of trade retaliation.
Economists such as Marcel Thieliant at Capital Economics warn that restrictions on rare earth exports or Japanese goods could escalate into a broader trade dispute - one that hurts exporters already under pressure from Chinese electric vehicle competition.
These tensions could trigger safe-haven inflows into the yen, but they also risk weakening Japan’s export engine - another reason why policymakers may resist further currency volatility.
USD/JPY forecast: Scenarios for late 2025
In the near term, a test of 145–148 remains plausible as capital returns home. But if the U.S. Federal Reserve delays rate cuts - keeping U.S. yields high - USD/JPY could stay anchored closer to 150–153.
Either way, the BoJ’s tolerance threshold around 156 is becoming a critical line for traders to watch. Traders can monitor these levels directly on Deriv MT5, which offers live market depth and advanced charting to track yen volatility in real time.
USD/JPY technical analysis

At the time of writing, USD/JPY is trading around 154.72, holding just below a fresh price discovery zone. The RSI sits flat just below the overbought threshold, signalling that bullish momentum remains strong but may be nearing exhaustion if no further upside breakout occurs.
Meanwhile, Bollinger Bands are expanding, indicating an increase in volatility. The price is hugging the upper band, reflecting sustained buying pressure - though such positioning often precedes short-term pullbacks or consolidation phases.
On the downside, immediate support lies at 153.00, with further key levels at 150.00 and 146.45. A break below these levels could trigger sell liquidations or panic selling, especially if sentiment turns against the dollar.
Overall, momentum currently favours the bulls, but with the RSI nearing overbought territory and price extended along the upper Bollinger Band, traders should watch for possible short-term corrections before any continuation higher.
Global ripple effects of yen
Japan’s yield shift is not an isolated story. As the world’s largest creditor nation, any repatriation of Japanese funds can affect global bond markets:
- U.S. Treasuries: Selling pressure from Japanese investors could lift U.S. yields.
- Europe and Australia: Investors may rebalance towards JGBs, driving global yield convergence.
- Emerging markets: Funding costs could rise as yen liquidity tightens.
The implications are profound - the end of Japan’s zero-yield era may gradually unwind two decades of global risk-taking built on cheap yen funding.
Investment and trading implications of yen
For traders, Japan’s bond market is now the most important variable in the yen equation.
- Short-term outlook: Higher JGB yields and repatriation flows could push USD/JPY lower towards 145–148, especially if U.S. yields stabilise.
- Medium-term: Fiscal stimulus and persistent inflation may keep yields elevated but volatile, anchoring USD/JPY near 150–153.
Intervention watch: If the pair nears 156, expect stronger verbal warnings and possible BoJ/MoF coordination.
抱歉,我们找不到任何匹配 的结果。
搜索提示:
- 检查拚写并重试
- 尝试其他关键字