Results for

Weekly market report – 23 May 2022
EUR/USD finished the week with solid gains just below the $1.06 mark. Although risk-aversion persists, the leading cause of this rally was the weakening US dollar. Moreover, recent inflation rates have doubled central banks’ comfort levels.
Forex

EUR/USD finished the week with solid gains just below the $1.06 mark. Although risk-aversion persists, the leading cause of this rally was the weakening US dollar. Moreover, recent inflation rates have doubled central banks’ comfort levels.
Another factor that may have contributed to the pair’s rise is the European Central Bank. With an interest rate hike in July now being a possibility, several government council members have declared their willingness to increase interest rates as soon as possible. In fact, according to financial analysts, the odds of a 50 bps rise at the start of the third quarter have risen from 40% to 52%.
This week the GBP/USD pair crossed into positive territory for the first time in over a month, allowing traders to breathe a sigh of relief. As seen in the chart above, GBP/USD started the week around the $1.23 mark, dipped and recovered to end the week near $1.25.
Although the UK data releases are strong, they still shed light on the massive problem the Bank of England (BoE) faces over the next few months. Based on 9% inflation data, the BoE suggests the inflation rate may even reach double digits in the coming months before dropping in late 2022/2023. On the other hand, the US dollar failed to capitalise on the Fed’s hawkish comments, and US Treasury yields rose, sending GBP/USD higher to test the $1.25 level.
Meanwhile, USD/JPY attracted some dip-buying near the ¥127.15 level, though a modest US dollar weakness kept further gains in check. Furthermore, a generally positive tone in the equity markets also weakened the safe-haven Japanese yen.
Level up your trading strategy with the latest market news and trade CFDs on your Deriv X Financial account.
Cryptocurrencies

The most popular cryptocurrency has seen 7 straight weeks of losses – its longest losing streak since 2011. This slump can be attributed to multiple factors such as rising inflation, the Fed’s increase in interest rates, and the Russia-Ukraine war.
Bitcoin started the week marginally above the $31,000 mark. Then the largest cryptocurrency in the world fluctuated wildly and ended the week just under the $30,000 mark. The chart above depicts the 50% retracement level acted as the primary resistance level, and the 38.2% retracement level acted as the primary support level.
On Tuesday and Thursday, Bitcoin’s prices kept bouncing back and forth off the 50% retracement level at $29,978.84 and the 76.4% retracement level at $30,671.58, which acted as its primary support and resistance levels, respectively. It then broke free and entered a dive below the $29,000 mark on both days.
Meanwhile, other cryptocurrencies have given traders some respite, ending the week with slight gains. Altcoins such as Ethereum, Binance Coin, and Litecoin increased by 1.1%, 7.4% and 7.2%, respectively.
The aftermath of Terra’s collapse has seen major cryptocurrency companies, such as Binance disclose information about their previous investments in the ecosystem and subsequent losses.
In other cryptocurrency-related news, the Federal Finance Ministry of Germany has guided the income tax treatment of cryptocurrency. Now, people in Germany will be able to sell Bitcoin and Ethereum tax-free after one year.
Maximise market opportunities by sharpening your trading strategy and trading the financial markets with options and multipliers on DTrader.
Commodities

Due to a risk-averse market environment, gold began the week by falling below the $1,800 mark – its lowest level since late January. However, it gained an upward momentum due to declining US yields and the US dollar’s demand being impacted by the disappointing earnings figures and bleak sales prospects from large retailers in the US. For the first time since mid-April, XAU/USD recorded weekly gains.
Moreover, after the announcement of zero coronavirus infections across all districts in Shanghai, the yellow metal managed to rebound and enjoy temporary relief as its price increased to reach near the $1,830 mark.
As seen in the chart above, gold ended its week near $1,846, swaying upwards midweek and is currently above its moving average, which acts as its support level. The 5-day SMA and 10-day SMA are around $1,844 and $1,842, respectively.
On the other hand, oil prices comfortably remained within recent ranges and aren’t trading with much conviction. A lack of new major crude oil-relevant fundamental developments in the last week may have resulted in the WTI moving in the $105-115ish ranges. Furthermore, the proposed EU ban on Russian oil imports still hasn’t secured the unanimous agreement amongst EU member nations that needed to go into force.
US Indices
.webp)
*Net change and net change % are based on the weekly closing price change from Monday to Friday.
Markets continued to face downward pressure, with Wednesday, 18 May 2022, marking the biggest one-day decline in the S&P 500 index since June 2020. Equity markets have continued to slip for the seventh week in a row and closed the week down by about 20% year-to-date putting it on the track to the bear-market territory.
The losses were driven by concerns about inflation after a series of disappointing earnings reports from major retailers. In particular, Walmart reported lower than expected operating margins on higher input costs from freight and fuel. Traders seem to interpret these earnings as a signal that the worst is yet to come. Additionally, fears of a recession have been driven by rising inflation, supply-chain issues, and the Federal Reserve’s determination to raise interest rates aggressively.
As traders’ concerns pile up, stocks have been struggling to recover over the last 7 weeks. Alongside, traders have closely monitored any data related to retailers and consumers to determine whether inflation will slow consumer spending.
In the coming week, the reports to watch out for include The Personal Consumption Expenditures (PCE) Price Index for April, the Fed’s preferred measure of inflation, to be released on Friday, 27 May 2022, and earnings from Zoom, Nvidia, and Alibaba.
Now that you’re up-to-date on how the financial markets performed last week, you can improve your strategy and trade CFDs on Deriv MT5 Financial and Financial STP accounts.

Non-traditional banking: Why it’s the Tesla of the financial industry
Banking services are an essential part of our lives. We get paid, pay the bills, and swipe our bank cards at grocery stores all the time. In one way or another, almost every financial operation we do goes through a bank.
Banking services are an essential part of our lives. We get paid, pay the bills, and swipe our bank cards at grocery stores all the time. In one way or another, almost every financial operation we do goes through a bank.
Yet, despite its vital necessity, the banking industry is confronted with some fierce competition. The emerging non-traditional banking trend is slowly taking over the market, and many believe it to be more aligned with evolving consumer needs.
The take-off point of the competition
The crisis of 2008 was one of the worst economic disasters for the entire world. Once the dust settled, it didn’t take long to find out that the market collapse was triggered by incompetent actions by the banks.
As the entire financial industry derailed, banks began actively investing in hedge funds, using their clients’ money. To raise more funds for this financial activity, they started signing off too many mortgages without conducting background checks. When the borrowers stopped paying, the artificially-created housing bubble burst, wrecking the entire industry along the way. Millions of people were affected, including those with no mortgages at all. Banks used their savings for investing with a high risk of no return and weren’t able to cover the deficit without the cash injection from the homeowners.
It was never a secret that when you keep your money in the bank, as a long-term deposit, for example, your resources are being used to fund other financial operations. However, when the crisis struck, it became apparent that there were no limitations or solid policy behind such utilisation. Consumer’s trust in bank services was broken. People were in need of safer solutions to manage their finances.
That’s when non-traditional banking started growing rapidly to fill the void. A little more than a decade later, temporary bank closures, caused by the worldwide pandemic and global lockdowns, served as a fertiliser to an already gaining popularity trend.
So what are these non-traditional banks?
Today we are presented with a wide range of alternatives to the good old traditional bank account. Real estate trust funds, fintech companies, or neobanks that operate solely online without any physical location are just some non-traditional banks examples. Even well-known tech giants like Google and Amazon provide money transfer services that exclude traditional banks entirely.
These new institutions offer lower fees, faster services, full transparency of transactions, extra services and a more wholesome customer service approach.
But despite growing popularity, it’s still questionable whether non-traditional banks are here to replace traditional banking. After all, the majority of alternative banks are still tied to regular banks due to licensing regulations.
Plus, it looks like traditional banking is not going to give up easily. With the strong competition breathing down their necks, banks have no other choice but to refine their services. Interactive and user-friendly mobile apps, a growing number of extra services, and increasing accessibility reveal the determination to keep up with the evolving demand.
So who is leading in this race? In a modern, ever-changing world, it’s quite hard to identify the winner or even predict the outcome of this confrontation. But we certainly need to be ready to embrace any possible scenario. And that’s our strategy at Deriv.
How does Deriv keep up with the non-traditional banking trend?
For international fintech companies like us, it’s too early to talk about discarding traditional banking entirely. That’s why we are focused on blending both traditional and non-traditional services to provide our clients with alternatives according to their preferences.
Therefore, we offer multiple deposit and withdrawal options that include both traditional and non-traditional banking – regular bank transfers, digital or crypto wallets, and peer-to-peer solutions. Our fiat to crypto exchange is one of the latest trends Deriv has embraced to bridge the two worlds.
Regardless of services our client chooses, we keep their money completely segregated from company funds to ensure its safety. Clients are free to track the movement of their funds and to withdraw them whenever they want because they aren’t merged with the company’s funds or used for business interest.
We also strive to be as accessible and supportive to our clients as possible to make sure they are always up to date and have access to high-quality modern solutions. That’s why we are continuously working on introducing new platforms, mobile apps, products, and services to deliver a reliable and seamless on-the-go experience. And our customer support is available round the clock to help with technical difficulties or general questions.
So whether non-traditional banks will take over the industry eventually or some new trend will emerge in the nearest future, we’ve got your back.

What is options trading?
Are you interested in expanding your portfolio with options trading but not sure where to start? Let us guide you through the basics of options trading and how it works!
This post was originally published by Deriv on 26 May 2022
Are you interested in expanding your portfolio with options trading but not sure where to start? Let us guide you through the basics of options trading and how it works!
What are options?
Options are timed contracts that give a trader the right, but not the obligation, to buy or sell an underlying asset at a predetermined price within a specific time frame.
This means that at any time during your contract's timespan, you can buy or sell the asset at that price, no matter the actual market price. If you go through with the transaction, it is called exercising the option.
Essentially, options trading is all about predicting future market movements — if you predict the market will rise, set a lower price to buy your asset; if you think the market will fall, set a higher price to sell the asset. If the market moves according to your prediction and you exercise the option, you'll gain a profit.
However, options trading on Deriv doesn't involve an exchange of assets. When you trade options on Deriv, you only predict the market movements, and you'll earn a payout if the market moves in your favour.
What is options trading on Deriv?
Deriv offers a variety of options that you can trade on where you don't need to own the underlying asset:
- Digital options - you predict the outcome from two possible results and earn a fixed payout if your prediction is correct.
- Lookbacks - your payout is determined by the highest or lowest price point during your contract's duration.
- Call/put spreads - you earn up to a predetermined payout depending on the market price when your contract expires.
You can trade digital options on forex, commodities, stock indices, and our synthetic indices, which are available 24/7, including weekends and public holidays. Meanwhile, lookbacks and call/put spreads are available exclusively on synthetic indices.
Deriv offers multiple platforms to trade options — Deriv Trader and SmartTrader are powerful, user-friendly trading platforms. In contrast, Deriv Bot offers the tools you need to build your own trading bot, even if you have no coding experience.
On these platforms, you can customise the parameters of your trade, such as trade conditions, your preferred stake or payout amount, or even the contract's start time if you don't want your trade to start immediately.
Benefits of options trading on Deriv
- Limited risk
When you trade options on Deriv, huge price fluctuations won't affect any potential losses from your trades. In fact, your losses will only be limited to your stake.
- Low capital requirement
Options trading allows you to enter the market with minimal capital. On Deriv, the minimum deposit amount to start trading is 5 USD, and the minimum capital to open an options trade is less than 1 USD.
- Flexibility
Options trading gives you flexibility as you benefit from both rising and falling prices, as opposed to owning the underlying asset and incurring a loss if prices fall. Plus, on Deriv, you get to take advantage of price movements on various financial markets.
Start your options trading journey on Deriv risk-free with a demo account pre-loaded with virtual money. For further reading, here are the differences between CFD trading and options trading [or check out the most common types of technical indicators you can use to analyse markets and predict future movements].

Weekly market report – 13 Jun 2022
The Consumer Price Index (CPI) inflation reading for May, a key economic report, was released on Friday, 10 June 2022. However, the inflation data surpassed expectations due to a surge in oil and food prices, thereby impacting the markets.
The Consumer Price Index (CPI) inflation reading for May, a key economic report, was released on Friday, 10 June 2022. However, the inflation data surpassed expectations due to a surge in oil and food prices, thereby impacting the markets.
Forex

Despite the hawkish European Central Bank (ECB) announcement, the Euro dropped to its lowest level since late April against the US dollar. Moreover, the ECB’s monetary policy meeting was the main cause for the greenback’s rally.
As the above chart depicts, EUR/USD kept bouncing back and forth between the $1.0650 and $1.0750 levels for the first 4 days of the week before entering a nosedive on Friday, 10 June 2022. The pair ended the week at the $1.0519 level, which lies slightly under the SMA 10 at $1.0527 and coincides with the SMA 5 at $1.0519.
The GBP/USD pair declined for 4 consecutive days and closed the week at the $1.2316 level, which lies marginally above its SMA 5 at $1.2122. The pair’s bearish stint is being reinforced by the Brexit woes and political instability in the UK. Furthermore, the receding resistance line has countered any upside movements by the cable pair since mid-April. The pair now awaits the Fed and Bank of England (BoE)’s monetary policy decisions coming later this week for the next directional bias.
Meanwhile, the USD/JPY pair has almost reached the ¥135 level, hitting over two-decade highs. This price movement can be attributed to relentless dollar demand in the US due to inflation and stronger yields. As a result, the pair came under selling pressure, which caused a drop from the long-term highs.
Level up your trading strategy with the latest market news and trade CFDs on your Deriv X Financial account.
Commodities

Gold prices continued to fluctuate before finishing the week at $1,872. The yellow metal's price went up significantly after a higher-than-expected inflation result. As seen within the chart, gold dipped below the $1,835 mark post the CPI data's release but bounced back to post a 1.64% change for the week.
Bond yields and gold are in an inverse relationship once again. With the expectation that the Fed will raise rates by 75 basis points at least once in the next 3 meetings to combat rampant inflation, the benchmark 10-year yield is at its highest since 2018.
Rising yields are heating the zero-yielding gold, which has also caused the US dollar to rise. Additionally, Fed tightening expectations have overshadowed rising recession fears while influencing the XAU/USD price. Traders are now anticipating the Fed's rate hike announcement on Wednesday, 15 June 2022 and its impact on related assets.
Meanwhile, oil prices dropped on Friday, 10 June 2022 but remained near three-month highs. This scenario resulted from US consumer prices growing faster than expected. Additionally, Shanghai's COVID-19 lockdown actions have outweighed stable fuel demand.
Cryptocurrencies

After 8 weeks of declines, the cryptocurrency market failed to hold on to its gains. Except for Cardano (ADA), which was up by 6% in the last 7 days, all top 10 cryptocurrencies have fallen by at least 3%. Altcoins like Binance Coin (BNB), Dogecoin (DOGE) and Litecoin (LTC) fell by around 6-10% for the week.
Market leader Bitcoin fared better than other coins, falling by only 3% in the past 7 days. At the time of writing, BTC is currently under the $30,000 mark.
Ethereum, on the other hand, did not fare so well. The second-largest cryptocurrency by market capitalisation fell by around 11% last week and was trading below $1,500. As seen in the chart above, there has been a constant dip since Friday, 10 June 2022, and ETH ended its week below the 5 and 10 SMA, respectively.
In the last month, stock market losses, especially tech stocks, correlated more closely with crypto prices. Despite the recession in the US, regulators continue to propose crypto rules and guidelines that could impact demand for cryptos.
This week, the New York State Department of Financial Services (DFS) issued its first regulatory guidance for dollar-backed stablecoins. The guidelines describe the "baseline criteria" for securing, redeeming, and auditing stablecoins.
Maximise market opportunities by sharpening your trading strategy and trading the financial markets with options and multipliers on Deriv Trader.
US stocks market
.webp)
*Net change and net change % are based on the weekly closing price change from Monday to Friday.
Friday’s declines lead to the S&P 500 posting its worst week since January. The Dow index fell for its 10th week in the past 11, while the S&P 500 and Nasdaq lost for the 9th week in the past 10.
This fall was influenced by the Consumer Price Index (CPI) report that showed the annual inflation rate rose to a 40-year-high of 8.6% in May – the highest reading since December of 1981.
The key driver of inflation continues to be rising global food and energy prices. The May CPI was discouraging as traders hoped inflation levels had peaked. However, the data suggested that inflation remains elevated and has not yet peaked in the US.
Tech stocks were under pressure as traders were concerned about higher rates and a potential recession. Apple dropped by nearly 3.9%, and Microsoft fell by 4.5% with many other stocks following the decline.
Market watchers will be anticipating the Federal Open Market Committee’s key interest rate decision on Wednesday, 15 June 2022. The Feds have already endorsed 0.50% rate hikes for the June and July meetings. However, after the inflation readings, it increases the odds of a potential 0.50% rate hike in September too.
Now that you’re up-to-date on how the financial markets performed last week, you can improve your strategy and trade CFDs on Deriv MT5 Financial and Financial STP accounts.

How to build a basic trading bot with Deriv Bot
Build a simple strategy for your trading bot with Deriv Bot. Find out how to set the basic trade parameters, open your first personalised trade.
This article was originally published on 30 Nov 2022 and updated on 14 May 2024.
Explore our latest content refresh—now featuring an engaging video overview! Watch the video for a quick overview, or read on below for more in-depth insights.
Once you log in to your Deriv account and select Deriv Bot from the trader’s hub, you will see the Deriv Bot’s workspace with 4 pre-set blocks – 3 mandatory (trade parameters, purchase condition and trade again) and 1 optional (sell condition). The mandatory blocks are essential to have your trading bot running, and the optional one gives you an opportunity to upgrade your trading strategy.
As discussed in our previous blog post, the pre-set parameters in these blocks let you start trading right away. But you also have the freedom to adjust these parameters to your personal trading strategy. In this blog post, we will review each pre-set block and explain how to customise them to place your first personalised trade on Deriv Bot.
Set your mandatory blocks
The mandatory blocks contain the crucial elements for trading information, like the market you prefer to trade on and when exactly to execute your trade.
Trade parameters
Trade parameters is the first mandatory block; you can find it under the ‘Trade parameters’ tab. In this block, you can set the following information:
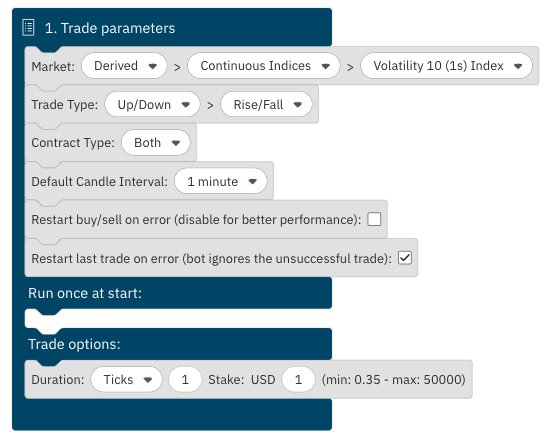
Market
Select the market and asset you want to trade on – derived indices, forex, stock indices, and commodities.
Trade type
Choose your desired trade type – from Up/Down to Only ups/Only downs if you want to trade options. Alternatively, select multipliers.
Some trade types are offered in a few variations. For example, the Digits have Matches/Differs, Even/Odd, or Over/Under.
Make sure to check this section, too, and select your preferred variation.
Contract type
Your next step is to decide which contract type you want. You can leave this as ‘Both’ as later on, you can select the direction under ‘Purchase conditions’.
Default candle interval
This section is important for setting up indicators for technical analysis. We cover technical analysis on Deriv Bot in another blog post, so we’ll leave this as it is for now.
Other parameters you can also set:
- Restart buy/sell on error – let your bot know whether you want it to buy or sell a contract if this action was interrupted due to some error. This is disabled by default.
- Restart last trade on error – let your bot know whether you want it to restart your last trade if it was interrupted due to some error. This is enabled by default.
Run once at start
The instructions set in this section are only executed one time — when you start your bot — and are not repeated every time the new trade is executed.
Here you can set some additional parameters like custom text notification, but it’s optional and requires a little more technical understanding.
We’ll cover more details in our ‘How to set up advanced parameters for Deriv’s trading bot’ blog post. For the time being, you can leave it blank.
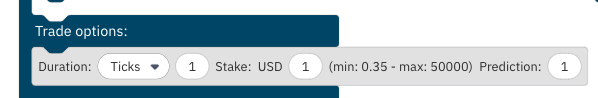
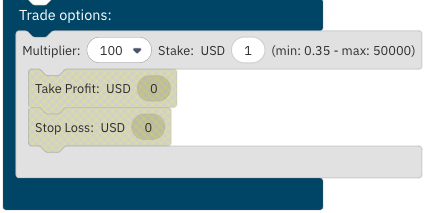
Trade options
In this block, you need to add the essential parameters of your trade, such as the desired trade duration and stake amount when you trade options. Take note that some Digits options have an additional input field called ‘Prediction’. With this, you’ll need to enter a number from 0–9. This is your prediction of the last digit of the asset’s price when the contract closes.
For the multipliers trade type, you’ll need to add a multiplier value and stake amount, along with take profit and stop loss amounts. Take profit and stop loss are the conditions to close the open positions.
Determine your purchase conditions

Purchase conditions is the most important block as it tells your bot what trade to execute. You can also select additional parameters to specify certain conditions to be met before executing a trade.
Set restart trading conditions

Using this block, you can tell your bot to continue or stop trading. You can also adjust the parameters for your next trade and implement stop loss or take profit. For now, you can leave it as is.
Once you set these 3 mandatory blocks, your trading bot is ready to run trades for you. You can activate it by clicking the green ‘Run’ button, located at the top right side of your screen, right under your balance indicator.
Bear in mind that once you run your bot, the trade you have set will be repeated indefinitely until you stop it manually by clicking the ‘Stop’ button. If you stop your bot before the current trade is closed, the bot will wait until its duration is over and won’t execute a new trade.
Add an optional block to refine your strategy
The optional block can be used to potentially improve your trading strategy and add additional parameters.
Sell conditions
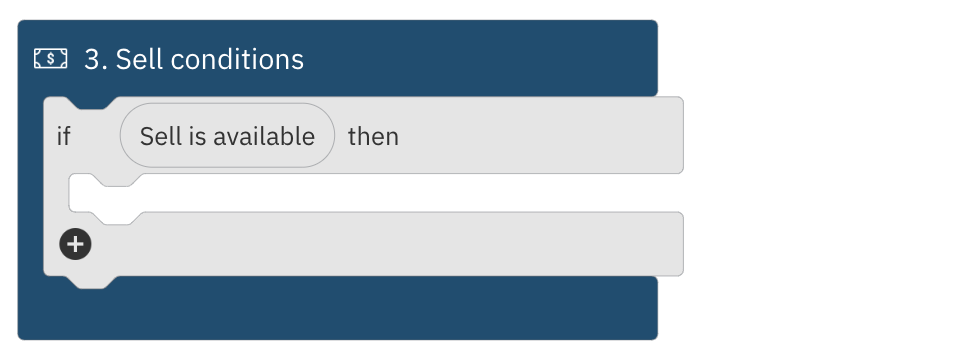
With the sell conditions block, you can sell your trades at the market price before their duration is over. This block can’t be used with tick contracts, and selling availability also depends on the duration of the contract and current market conditions. In general, the sell conditions block is more applicable for trading multipliers.
If you are just setting up a simple strategy, you can leave the optional block blank or remove it from your workspace. Your bot is good to go with just the 3 mandatory blocks.
In our “How to set up advanced parameters for Deriv’s trading bot” blog post, we’ll go over all the details on how to add some additional instructions to your trading bot and how to set the optional block to make the most out of the automated trading!
You can also head over to Deriv Bot and practise setting up mandatory blocks on your risk-free demo account, preloaded with a 10,000 USD of virtual currency.

Weekly market report – 06 Jun 2022
Last week, fears of the Federal Reserve tightening its monetary policy resulted in a heavy sell-off, which wiped out gains secured earlier in the week.
Last week, fears of the Federal Reserve tightening its monetary policy resulted in a heavy sell-off, which wiped out gains secured earlier in the week.
Forex
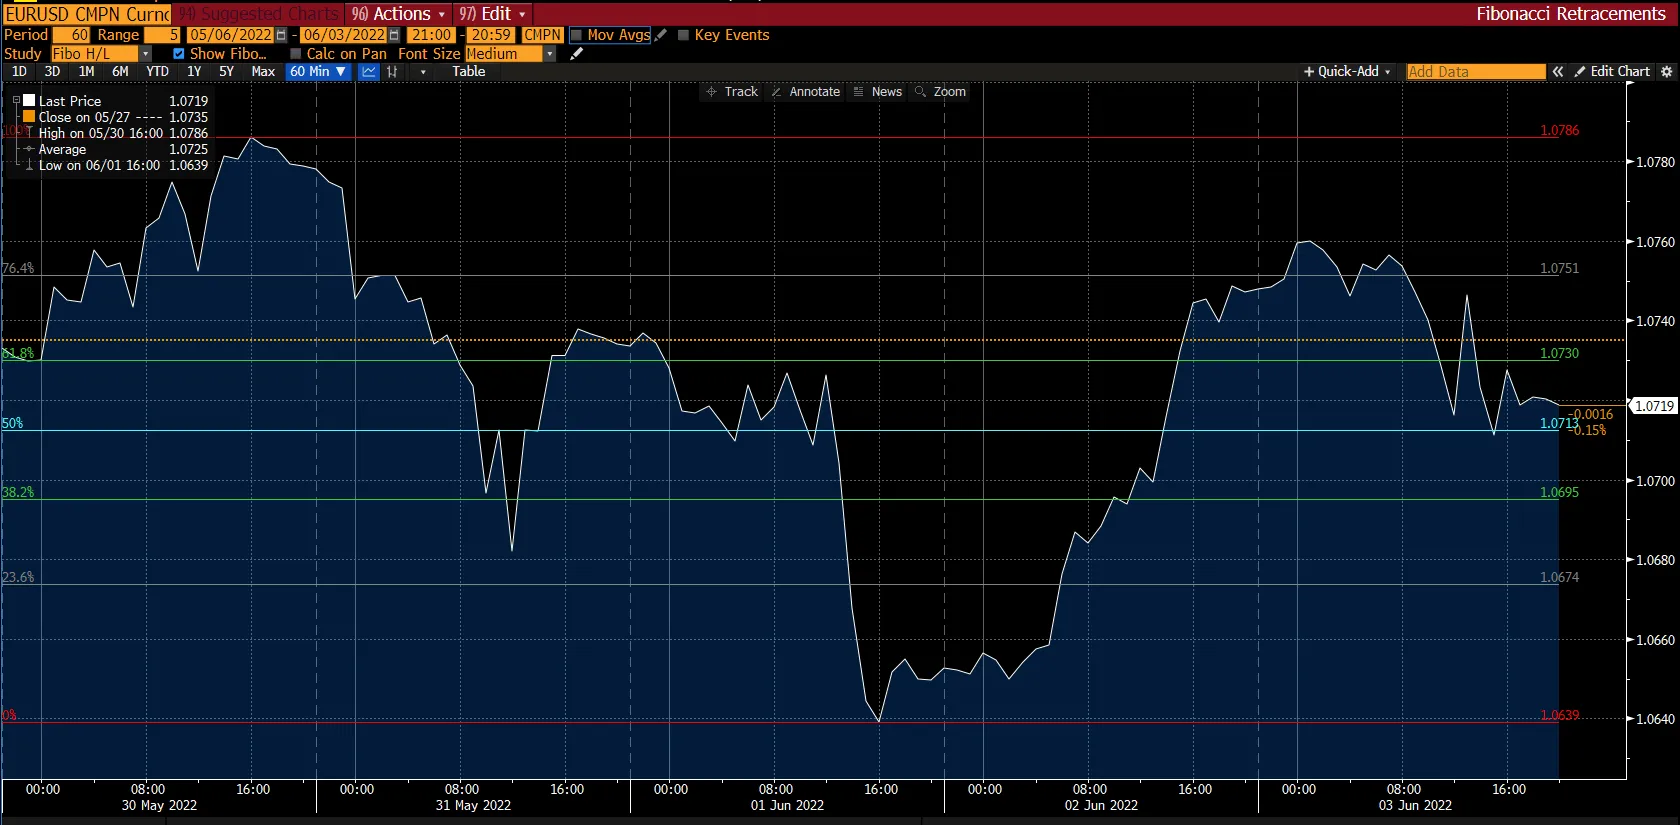
Despite reaching a high of $1.0787 last week, EUR/USD finished the week essentially unchanged, in the range of $1.0720/30. The pair’s price increase was largely driven by government bond yields and inflation-related concerns.
Looking at the chart above, EUR/USD is priced between the 61.8% and 50% retracement levels near $1.0730 and $1.0713, respectively. On the upside, its next resistance level would be at the 76.4% retracement level at around $1.0751. However, on the downside, its next support level would be at the 38.2% retracement level at approximately $1.0695.
In the holiday-shortened US week, GBP/USD suffered its first weekly loss in 3 weeks. Although the US dollar continued with its corrective decline, the pair failed to capitalise on this factor after troubling inflation data and a negative growth outlook for the UK soured market sentiment.
This week, the US Consumer Price Index is likely to steal the show. There are no significant economic releases until Friday, 10 June 2022, so traders will prepare for this critical event as policymakers enter their blackout period before the next Federal Open Market Committee (FOMC) meeting. On the other hand, the European Central Bank (ECB) will announce monetary policy decisions ahead of the US inflation report, mostly confirming a July liftoff.
Level up your trading strategy with the latest market news and trade CFDs on your Deriv X Financial account.
Commodities

Gold prices fell ahead of the weekend due to a renewed US dollar strength, reactions to the upbeat jobs report and the benchmark 10-year US Treasury bond yield surging by 3%.
Gold ended its week at $1,851.18. As per the above chart, gold is priced just below the 50% retracement level at around $1,851.63. If this level is breached, its next resistance level would be at the 61.8% retracement level near $1,856.78. On the downside, its support level is at the 38.2% retracement level at around $1,846.47.
WTI ended the week above $118, marking a gain of over 3%. Additionally, the US job market grew faster than expected in July, indicating that economic growth will continue, thereby boosting crude and refined product demand.
Despite easing virus restrictions, oil prices have risen as demand has increased. Moreover, supply from one of the three largest producers has been reduced by Russia's invasion of Ukraine. However, China, the largest crude importer globally, has the potential to rebound in consumption, further pushing up prices.
Cryptocurrencies
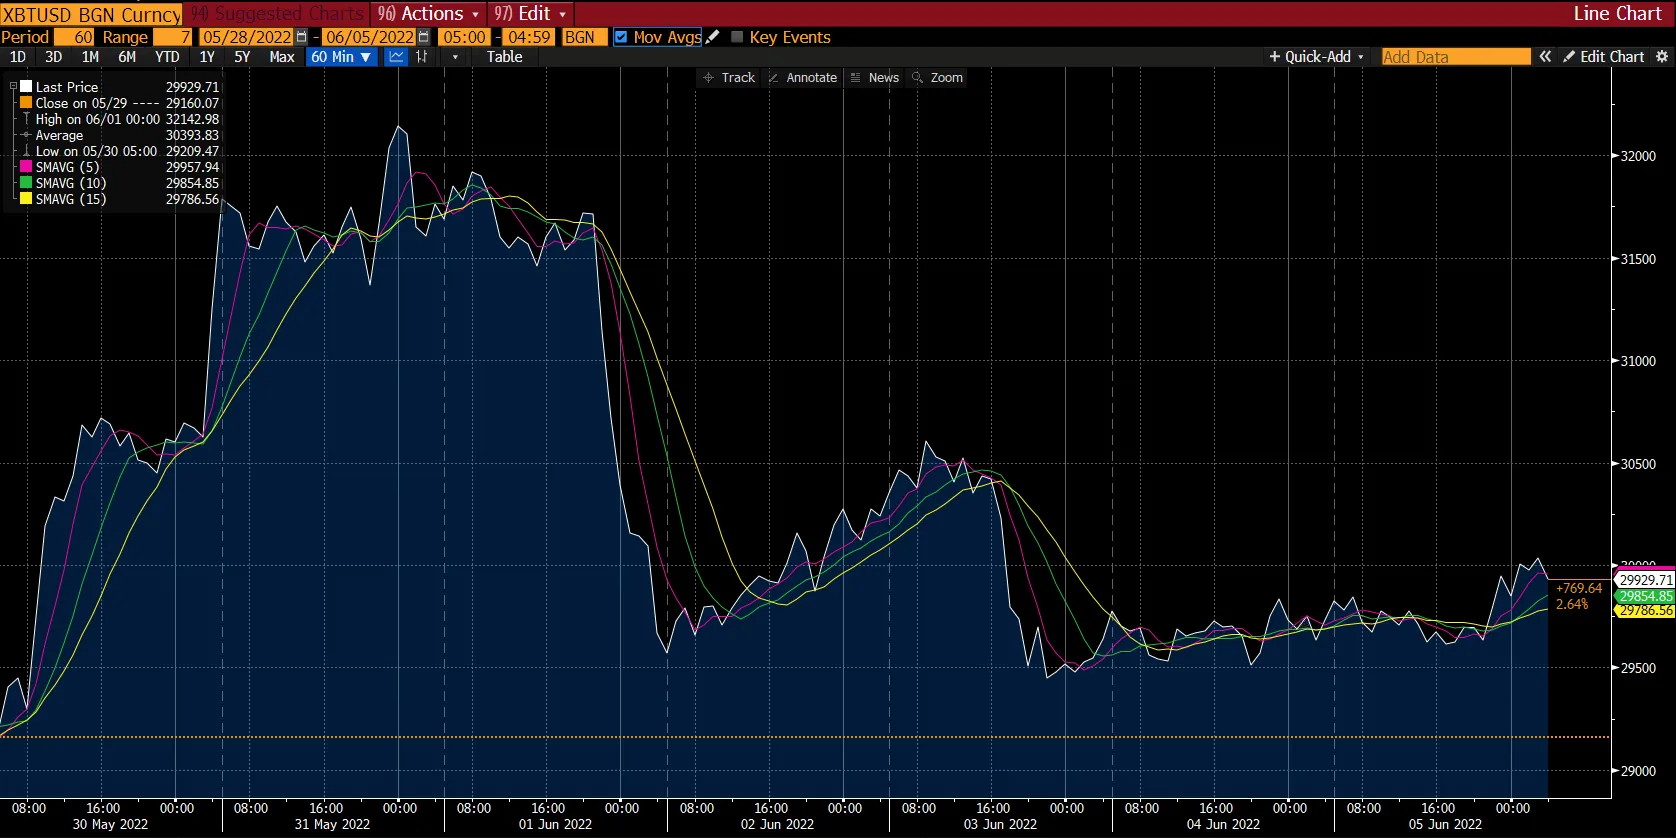
Last week, the price of the largest cryptocurrency, Bitcoin, was just above $30,000. There was a slight increase from Friday, 3 June 2022, but it continued to trade in the shadows as it has for the past month.
Since early May, the price of Bitcoin has been fluctuating around this range as traders nervously await clear signs on the direction of inflation and the global economy. As seen in the chart above, the moving average fluctuated back and forth between the support and resistance levels since the start of the week.
Meanwhile, Ethereum was recently trading well within the range it has held over the last 2 weeks – just above $1,800. The upward price movement is due to the team's upgrades. Among these upgrades, Ethereum 2.0 will transform the network's process from showing proof-of-work (PoW) to proof-of-stake (PoS). Naturally, this transition will enhance the network's scalability, efficiency, and speed.
Maximise market opportunities by sharpening your trading strategy and trading the financial markets with options and multipliers on DTrader.
US Indices
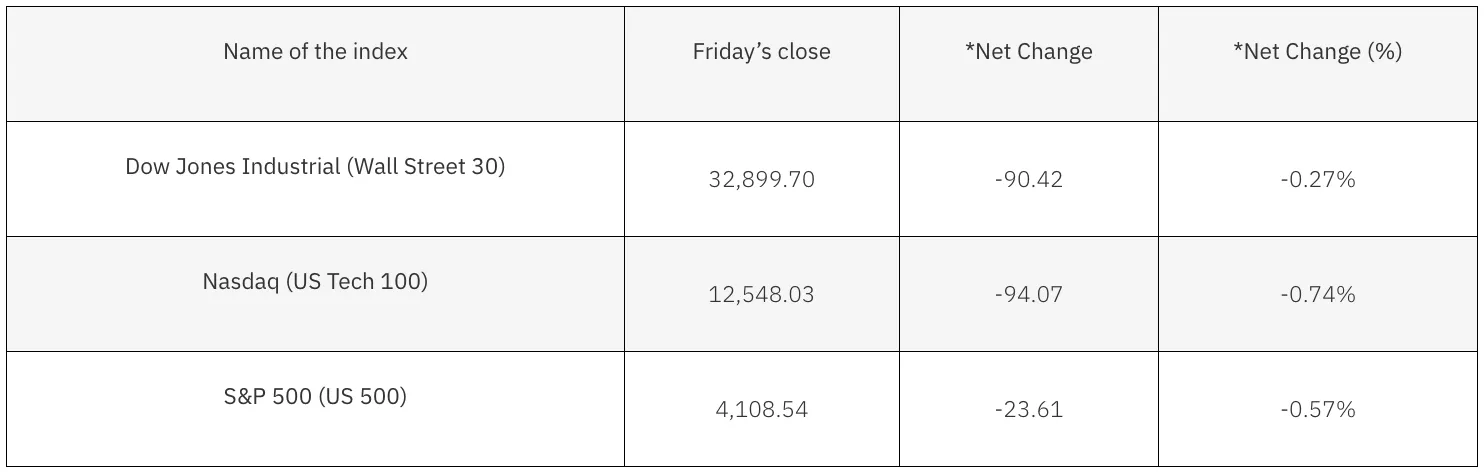
*Net change and net change % are based on the weekly closing price change from Tuesday to Friday.
For the week, the Dow lost 0.27%, the S&P 500 index declined by 0.57%, and the Nasdaq index shed 0.74%. US equity markets lost their gains earlier in the week after a heavy sell-off on Friday, 3 June 2022, that was driven by expectations of a tighter monetary policy following a stronger-than-expected May jobs report.
The non-farm payrolls added 3,90,000 jobs last month, and the unemployment rate remained steady at 3.6% for the third straight month. Traders who sold stocks reacted to the rise in interest rates with fears of the Federal Reserve tightening monetary policy at the forefront. Traders fear higher rates will slow the economy and lead the market into a recession.
Although key indicators, including inflation, jobs reports, and consumer spending, are now smoother, they may not necessarily signify economic recovery. For instance, Tesla CEO Elon Musk is thinking about freezing hiring and laying off 10% of its employees because he is worried about the economy. So, traders may still be cautious since the sentiments of businesses can change very quickly.
The highlight of this week will be the highly-anticipated May update to the consumer inflation rate in the US, which could indicate whether inflation may have peaked.
Now that you’re up-to-date on how the financial markets performed last week, you can improve your strategy and trade CFDs on Deriv MT5 Financial and Financial STP accounts.

The 4 most common types of technical indicators
Using technical indicators is an efficient way to analyse markets and predict price movements. In this blog, we review the 4 most common groups of indicators.
From our What is technical analysis in trading blog post, you may already know that technical indicators are mathematical calculations that can help you predict the price movements of an asset. These calculations evaluate an asset from multiple angles and can become a really powerful tool, providing valuable insights and helping you step up your trading strategies.
There are dozens of indicators you can use, but they are usually divided into groups by the type of information they provide. Some indicators may provide multiple sets of information and can therefore belong to more than one group.
In this blog, we’ve grouped indicators into 4 main types and briefly explain how each group helps traders identify trading opportunities.
1. Trend indicators
In trading, trend refers to the direction of the price movement over an extended period of time. For example, when the price is consistently increasing, it’s an uptrend, and when it’s decreasing, it’s a downtrend.
Trend indicators can help determine the direction the market will take.
Some common trend indicators are:
- Moving average (MA)
- Parabolic stop and reverse (Parabolic SAR)
- The Ichimoku Cloud
2. Volume indicators
In trading, volume refers to the number of trades executed within a particular time frame. It’s a direct indication of the asset’s supply and demand.
By measuring the volume of trading, volume indicators indicate whether a trend is likely to last.
For example, high volume on the uptrend indicates high demand and therefore, a further price increase. It works the same way in the reversed scenario: high volume on the downtrend indicates high supply and a likelihood of a further price drop.
Some common volume indicators are:
- On balance volume (OBV)
- Accumulation / Distribution indicator
- Money flow index
3. Volatility indicators
Volatility in trading determines the degree to which a price moves over time. High volatility indicates fast and unpredictable price changes. Volatility indicators measure the price range of an asset and help to catch the moments of high volatility.
Many traders favour highly volatile assets and markets because they present numerous trading opportunities along with faster and higher gains.
The most common volatility indicators are:
- Bollinger bands
- Donchian channel
- Average true range (ATR)
4. Momentum indicators
Momentum in trading refers to the speed of the price change. Momentum indicators measure this speed, which can be helpful to see an upcoming trend change.
The most common momentum indicators are:
- Relative strength index (RSI)
- Moving average convergence divergence (MACD)
- Stochastic oscillator
What is the best way to use technical indicators?
When traders use technical indicators, they usually apply 2-3 of them at once and compare their findings to increase the likelihood of making a correct trading decision. For example, if a trend indicator predicts the change of trend, they check the volume as well to make sure there is enough buying or selling power to support this change. But it’s important to remember that technical indicators, just like chart patterns, are still a prediction and don’t give 100% accuracy.
It’s also always a good idea to test and try different combinations on your risk-free demo account first before trading with real money.
Alternatively, if you want to know another non-technical way of analysing financial markets, head to our Fundamental analysis blog post and find out how major political and economic events can affect prices.

Market news – Week 1, July 2022
Half of 2022 has ended, and while inflation remains at the forefront of trader sentiment, last week highlighted that traders also fear the onset of an economic slowdown.
Half of 2022 has ended, and while inflation remains at the forefront of trader sentiment, last week highlighted that traders also fear the onset of an economic slowdown. There are fears of recession in all 4 markets, with some assets experiencing their worst quarter for the year and others experiencing their worst first two quarters in over 50 years.
Forex

Last week, EUR/USD appreciated briefly before resuming its bearish trend. Despite holding above the $1.06 level in the first half of the week, the leading currency pair plunged as low as $1.0366 – its lowest level since June. Although US dollar bulls rallied throughout the week, recession fears pushed it back. Based on the chart above, the pair ended the week at around $1.0414, establishing a bearish tone with lower lows and lower highs.
Traders were concerned that aggressive rate hikes by the Federal Reserve and European Central Bank would tip the global economy into recession. There was a ray of hope, however, that emerged from China lifting its lockdown, alleviating inflation and growth concerns and temporarily favouring US dollar bears.
Meanwhile, the recent bearish consolidation re-energised GBP sellers, who smashed GBP/USD below $1.20 for the first time in 2 weeks. Last week, the pair lost around 200 pips, effectively ending the previous week's recovery. GBP was under pressure due to Brexit fears and recession fears.
In the coming week, the markets are awaiting the minutes of the June Federal Open Market Committee (FOMC) meeting and the US Nonfarm Payrolls for a new direction.
Level up your trading strategy with the latest market news and trade CFDs on your Deriv X Financial account.
Commodities
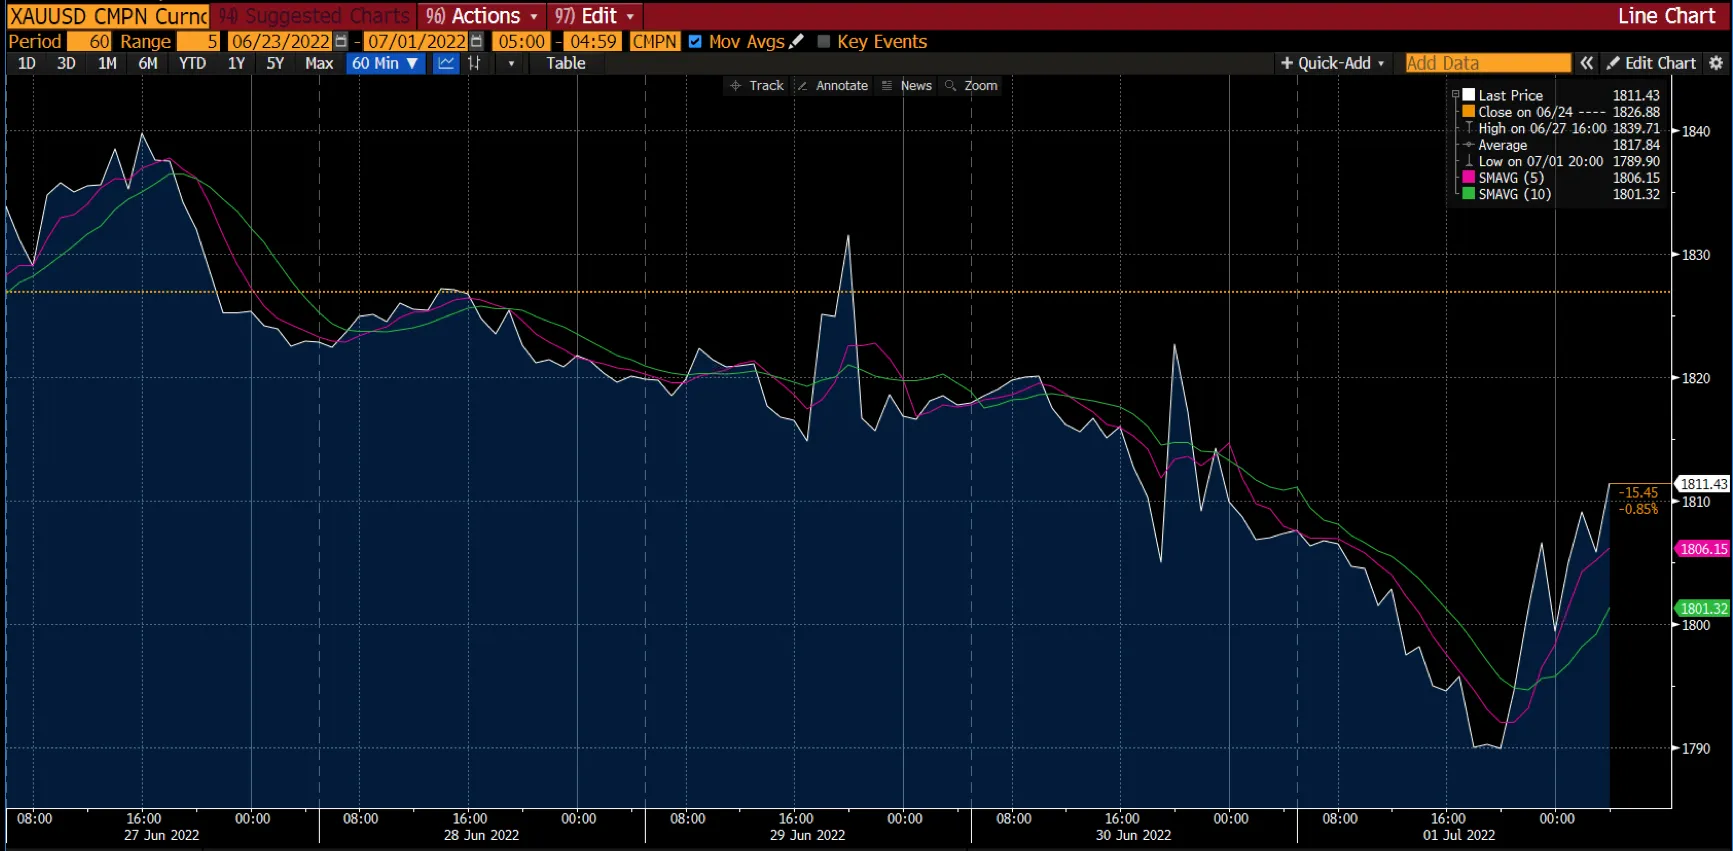
Gold started the week at around $1,830 but ended near $1,811. In the last week, spot gold prices dropped by 1.04%.
The US ISM Manufacturing Purchasing Managers' Index (PMI) statistics released on Friday, 1 July 2022, fueled fears of a recession and sent gold prices to their lowest level in five weeks – $1,783.50. In June, the US ISM Manufacturing PMI dropped to 53.0 from 54.9 and 56.1 in May, marking the lowest reading in 2 years.
Powell's semi-annual congressional testimony on Wednesday, 29 June 2022, didn't stimulate the gold market but came off as sufficiently hawkish to drive gold prices down for the week. Furthermore, due to hawkish monetary policies from top central banks, gold, which doesn't pay interest, suffered its worst quarter in more than a year.
As seen in the chart above, gold maintained its bearish tone. However, it bounced back on the last day of the week and held its position above the 5 and 10 SMA at $1,806 and $1,801, respectively.
In addition, oil prices declined for the week as concerns about a worldwide recession weighed on the market at a time when supply remains constrained due to OPEC (Organisation of the Petroleum Exporting Countries) production declines, unrest in Libya, and sanctions against Russia.
Cryptocurrencies
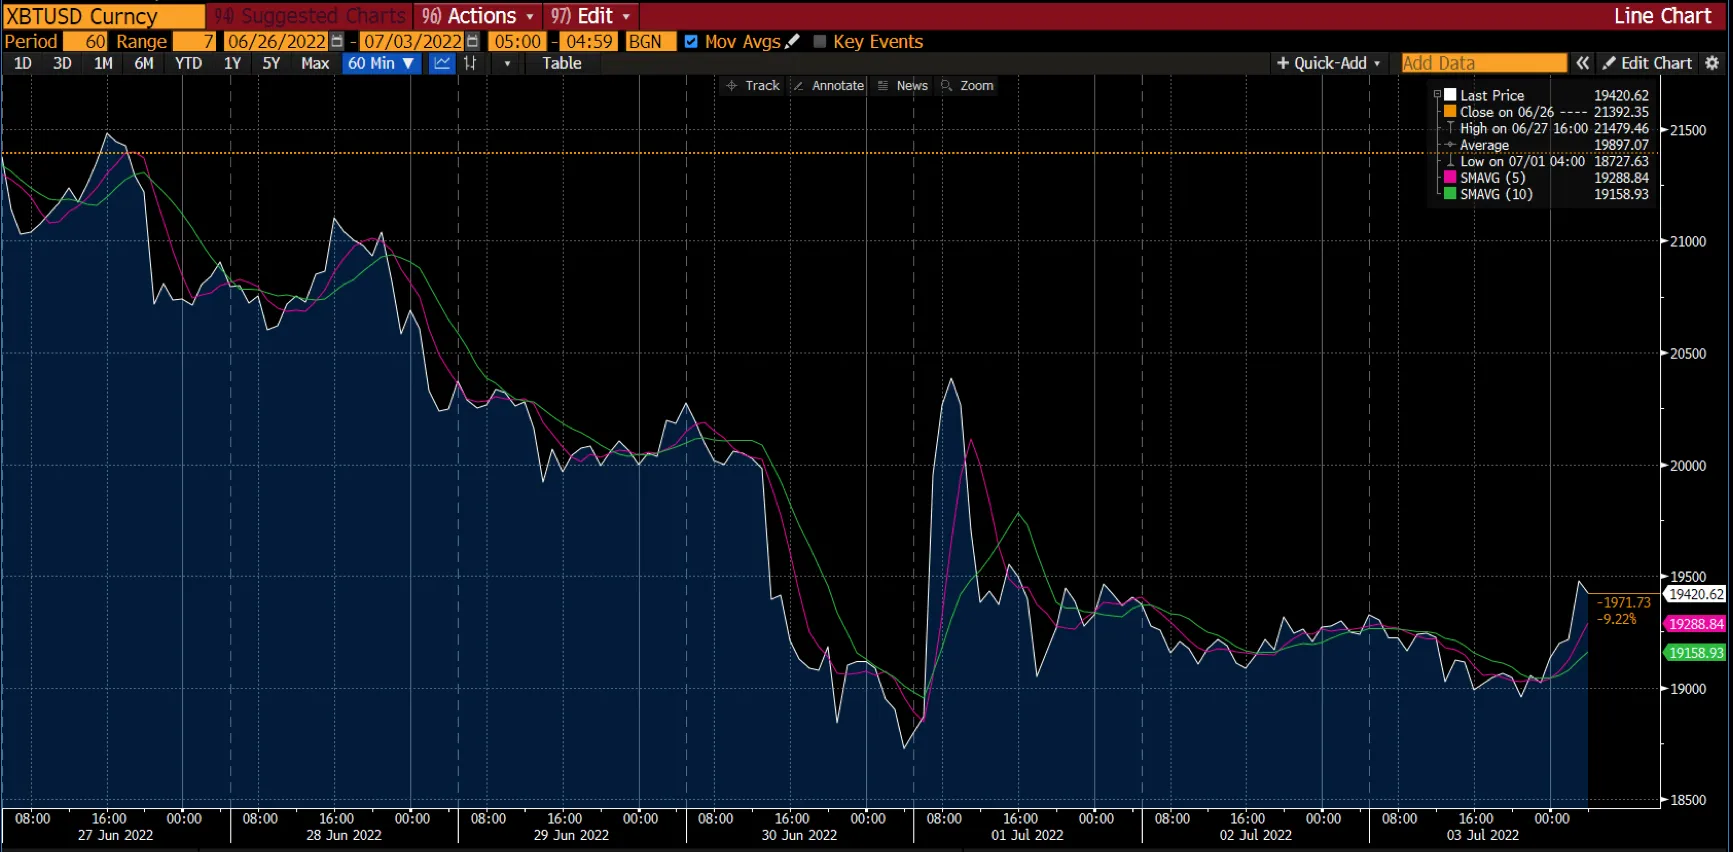
After recovering more than 20% from its lowest prices in 2022, the cryptocurrency industry made a complete U-turn and dropped 12% last week. Bitcoin, the biggest and most popular cryptocurrency, fell below $20,000 while almost all altcoins, starting from Ethereum, bled.
Bitcoin entered the week with a solid $21,073.55 and closed below $20,000. This was the third-worst monthly closing in history with high uncertainty in the global economy and the crypto market.
As seen in the chart above, Bitcoin hit its lowest on Friday, 1 July 2022, when the price reached $18,728. However, since then, it managed to gain traction and maintain a sideways position for the week at around $19,421.
Ethereum, on the other hand, failed in its attempt to recover. It instead followed a stable downward trend with an opening price of $1,203.85, finishing the week at $1,072.16 while struggling to stay in the $1,100 price zone.
In addition, traders' massive sell-off and crypto company Celsius' pausing of withdrawal services appear to have triggered the crypto crash.
Maximise market opportunities by sharpening your trading strategy and trading the financial markets with options and multipliers on DTrader.
US stock markets
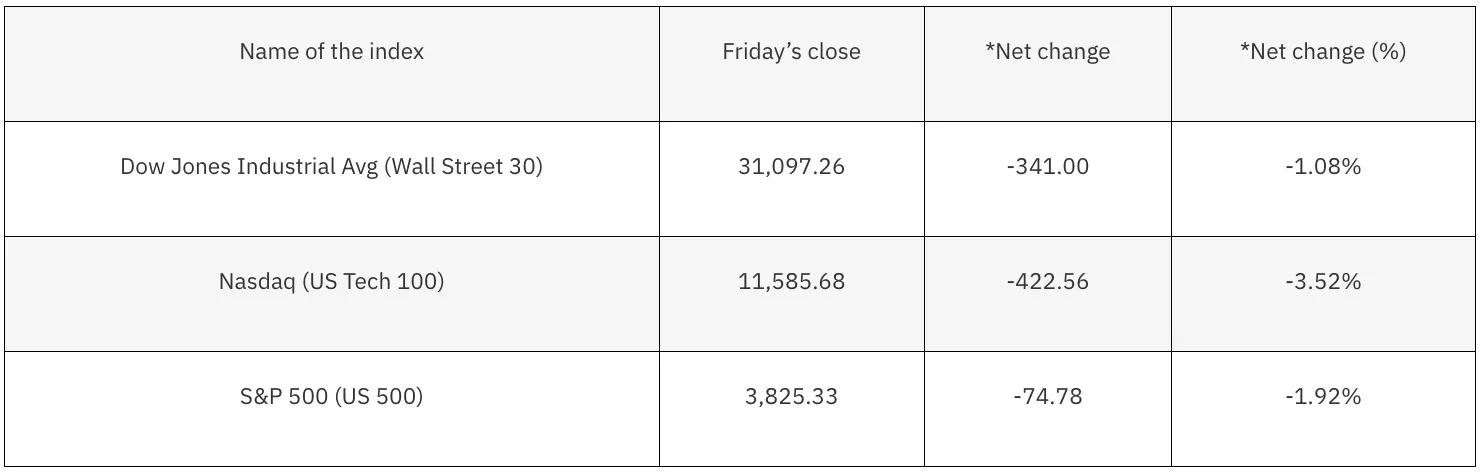
*Net change and net change (%) are based on the weekly closing price change from Monday to Friday.
US stock markets finished their worst first half in over 50 years as the economy heads into the second half of 2022. Currently, all 3 indices are in a bear market as they lost their fourth week in a row out of the past 5 weeks. To sum up, the Dow fell by 1.08% for the week. The S&P 500 lost 1.92%, and the Nasdaq finished lower by 3.52%.
The US equity markets declined for the week despite a rally on Friday, 1 July 2022, as concerns over persistently high inflation, expectations for aggressive central bank tightening, and recession risks prevailed.
Furthermore, May's Personal Consumption Expenditures (PCE) data showed that consumers were also cutting back. As a result of inflation, purchases fell by 0.4% in May – the first decline in 2022.
This week, minutes of the FOMC's latest policy meeting, which was held in mid-June, will be available on Wednesday, 6 July 2022. On Friday, 8 July 2022, the June Nonfarm Payrolls report from the Labor Department will be released.
Now that you’re up-to-date on how the financial markets performed last week, you can improve your strategy and trade CFDs on Deriv MT5 Financial and Financial STP accounts.

Market news – Week 4, June 2022
Cryptocurrencies experienced one of their worst weeks in history thanks to the Fed’s announcement to raise interest rates. However, other markets also experienced setbacks due to this announcement.
Cryptocurrencies experienced one of their worst weeks in history thanks to the Fed’s announcement to raise interest rates. However, other markets also experienced setbacks due to this announcement.
Forex

Although the core inflation result for May 2022 came in as expected and strengthened the Euro, the currency does not seem to be reversing its long-term plunge. This further intensifies the inflationary pressure on the European Central Bank (ECB) as it battles the concern of a fading Euro. On the other hand, the continued strengthening of the US dollar has caused the EUR/USD pair to close the week in the negative territory.
As seen in the chart above, after starting the week on a downtrend and falling to $1.1971, the GBP/USD pair experienced a short-term rally on Thursday, 16 June 2022, and prices reached a three-day high of around $1.2381. Furthermore, the release of disappointing US macro data weakened the greenback and served as support to the declining GBP/USD pair.
Moreover, its slight recovery from two-year lows faltered due to the diverging monetary policy announcements by the Fed and Bank of England (BoE) towards the end of last week. As a result, the currency pair ended the week at $1.2227, slightly above the SMA 10 at $1.2220 and nearly bisecting at its SMA 5 and SMA 15 at $1.2211 and $1.2245, respectively. Now, all eyes are on the UK inflation report and the Fed Chairman’s testimony for fresh directional commands for the cable pair.
The Bank of Japan (BoJ) governor announced that the monetary policy could be eased further if needed. This triggered a JPY sell-off, which, combined with the US dollar rebound, explains the USD/JPY bullish run.
Level up your trading strategy with the latest market news and trade CFDs on your Deriv X Financial account.
Commodities
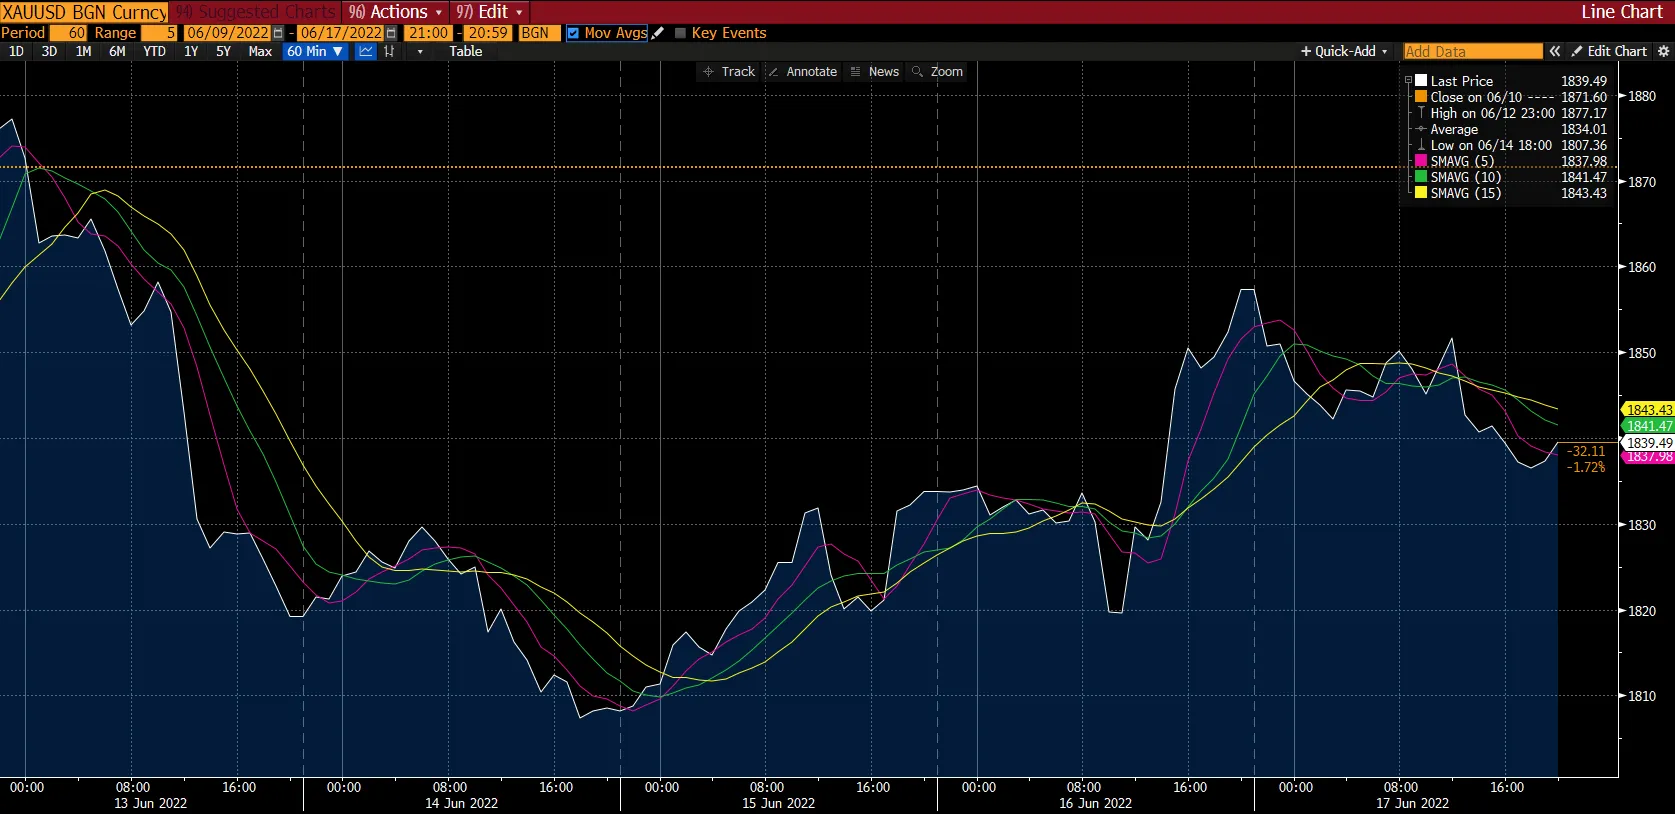
After starting the week above $1,870, gold prices plummeted below $1,810 on Tuesday, 14 June 2022, for the first time since traders began withdrawing from the market in February.
Gold is often regarded as an inflation hedge, but the opportunity cost of holding it is higher when the Fed raises short-term interest rates since the metal yields no interest.
Despite closing the week at $1,840 on Friday, 17 June 2022, gold closed at its lowest level in almost a month as a stronger US dollar and interest rate hikes from the Federal Reserve, Swiss National Bank, and Bank of England dented the safe-haven metal’s appeal.
As seen in the chart above, gold ended the week trading right above its support level of $1,837. The outlook for interest rate policies and inflation expectations shifts in the coming week will significantly impact the yellow metal.
Meanwhile, oil prices suddenly reversed from the long-term uptrend after climbing up to almost $125 a barrel earlier this month. On Friday, 17 June 2022, oil prices fell by 6% to a four-week low and ended the week at around $112 a barrel. This occurred due to the interest rate hike by major central banks that would slow down the global economy and limit energy demand.
Cryptocurrencies

The crypto market fell below $1 trillion for the first time since January 2021. With a loss of $300 billion in seven days, last week was one of the worst weeks in crypto history.
In the chart above, the price of Bitcoin continued to slump, dropping by 34% in the past 7 days and trading below the $20k mark. However, Bitcoin has clawed its way back to around the $20k mark on Sunday, 19 June 2022. This movement may indicate a swift turnaround after the recent successive declines since institutional traders may see a buying opportunity after Bitcoin reaches the rock-bottom level.
Meanwhile, Ethereum, in particular, performed poorly, going down by 40% over the same period and trading at around $1,000.
In part, macroeconomic factors were to blame for the downfall of the crypto market. Recently, cryptocurrencies have not been working as an inflation-proof asset as the performance of equity and bond markets has directly impacted Bitcoin. Inflation has been rising lately, causing central banks to raise interest rates, hitting risky assets.
Due to the extreme market conditions, several cryptocurrency-lending companies have halted their operations in withdrawals, transfers, and swaps requests. This has indirectly led to a sell-off from crypto traders as this raises concerns about the future of cryptocurrencies.
Maximise market opportunities by sharpening your trading strategy and trading the financial markets with options and multipliers on DTrader.
US stocks market
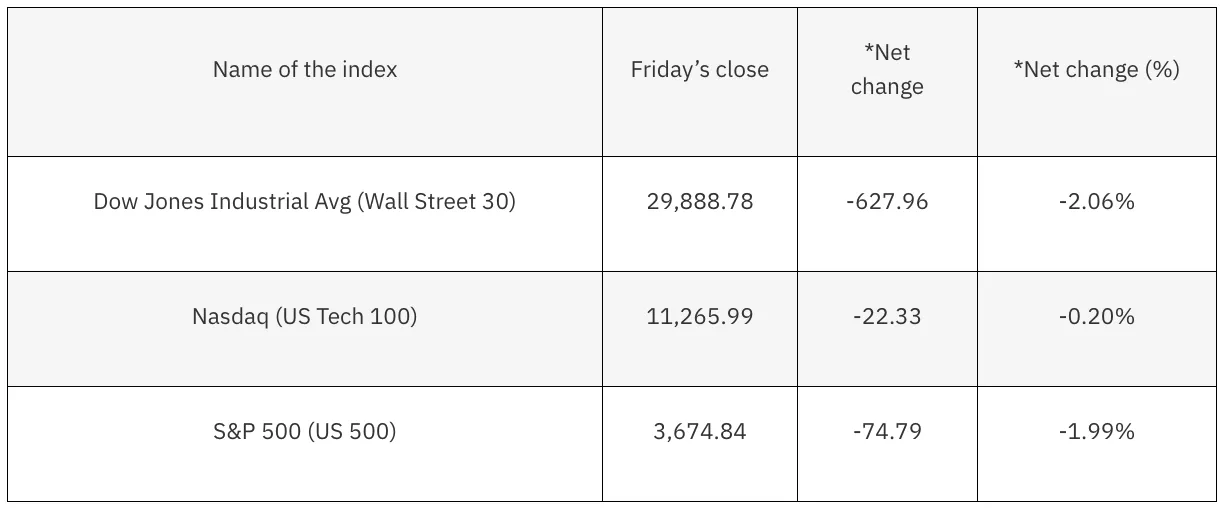
*Net change and net change (%) are based on the weekly closing price change from Monday to Friday.
All 3 major indices finished the week with sharp losses. This was the most significant decline for the S&P 500 since the pandemic hit markets in March 2020. Furthermore, the Dow faced its biggest drop for the week since October 2020. The market has now lost ten times in the last 11 weeks overall.
Since every company in the index was in the red at least once during the week, the S&P 500 is officially in a bear market.
On Wednesday, 15 June 2022, the Federal Reserve announced a 0.75% interest rate increase — the largest since 1994. Stocks were on the rise, however; after the announcement, the Dow dropped to levels not seen since January 2021. Furthermore, all 11 stock market sectors saw declines.
Amid growing recession fears, Home Depot, Intel, and JPMorgan hit new 52-week lows. Meanwhile, tech giants like Amazon, Apple, and Netflix sank by nearly 4%.
The Fed's comments on Friday, 17 June 2022, echoed their commitment to clamping down inflation after hiking rates by 75 basis points earlier in the week. Now, traders are looking forward to Powell's testimony later this week as the Fed appears to remain focused on returning inflation to its 2% target.
Now that you’re up-to-date on how the financial markets performed last week, you can improve your strategy and trade CFDs on Deriv MT5 Financial and Financial STP accounts.
Sorry, we couldn’t find any results matching .
Search tips:
- Check your spelling and try again
- Try another keyword