Results for

Is the gold safe haven trade back as Fed rate cuts near?
Gold prices rose 1% last week and touched a two-week high of $3,385 after Jerome Powell signalled that the Federal Reserve could cut interest rates at its September policy meeting.
Gold prices rose 1% last week and touched a two-week high of $3,385 after Jerome Powell signalled that the Federal Reserve could cut interest rates at its September policy meeting. According to the CME FedWatch tool, traders now see an 84% probability of a 25bps rate cut and are pricing in the chance of two quarter-point reductions before year-end. The growing expectation of easier policy is boosting gold’s appeal, but inflation risks and political interference with the Fed raise questions about how far the rally can run.
Key takeaways
- Gold traded to $3,385, with traders eyeing the $3,400 level as the next technical breakout point.
- Markets are pricing in two US rate cuts in 2025, but the Fed has not committed to such an aggressive path.
- Political pressure on the Fed escalated after President Trump attempted to remove Governor Lisa Cook, raising concerns about the central bank’s independence.
- The next test for gold comes with the PCE inflation report, GDP revisions, and consumer spending data.
- Global economic releases in Europe, Asia, and Canada add further uncertainty for gold’s near-term direction.
Powell's Jackson Hole speech opens the door to rate cuts
In his Jackson Hole speech, Powell balanced two competing risks: slowing growth and stubborn inflation. He noted that the labour market shows signs of weakening, particularly in job creation and participation, and that downside risks to employment are rising.
At the same time, inflation remains above the Fed’s 2% target, and Powell warned that the central bank cannot declare victory too soon.
Still, his remarks were interpreted as dovish. Powell said monetary policy remains accommodative and that the balance of risks may require adjustment. Economists argue that this language signals that the Fed is leaning toward a September rate cut. Markets reacted accordingly, with traders expecting at least one reduction this year and building in expectations for a second by December.
However, the Fed has stopped short of endorsing that aggressive trajectory. Dallas Fed President Lorie Logan and other policymakers have suggested the central bank has flexibility but must remain data-dependent.
Trump vs Fed independence
The political dimension has become a new factor for markets. President Trump announced that he was removing Fed Governor Lisa Cook, citing allegations of mortgage fraud. Cook rejected the claim and asserted that Trump had “no authority” to dismiss her.
This episode matters because it highlights the risk of political interference in monetary policy. Trump has previously criticised Powell and pushed for immediate rate cuts. If Cook were replaced by a Trump ally, the Fed’s seven-member board would tilt further toward his preferred policy of looser financial conditions.
Markets view any erosion of the Fed’s independence as a blow to credibility. Historically, when confidence in central bank autonomy weakens, saf-haven assets such as gold attract capital flows. That dynamic has already been visible in this week’s rally, as traders balance the Fed’s policy path against rising political risks.
Data-driven risks to gold’s rally
Gold’s push toward $3,400 is not guaranteed. The coming data releases will decide whether the rally holds or fades:
- PCE inflation report: The Fed’s preferred inflation gauge will be the most important release. A hot reading would strengthen the dollar and lower the likelihood of further cuts, weighing on gold.
- GDP updates: Revised second-quarter GDP growth will show whether the economy is slowing as much as feared. Stronger growth could undercut the case for rate cuts.
- Consumer spending and income: These figures reveal household resilience. If consumption stays strong, the Fed may keep rates higher for longer.
- Durable goods and housing data: Weakness here would bolster the case for easing and support gold.
In other words, gold’s path depends on whether economic weakness outweighs inflation risks.
Global market drivers
Beyond US releases, global economic events could add volatility. Eurozone inflation prints this week will be watched for signs of easing price pressures, which could have implications for European Central Bank policy. The ECB’s latest meeting report will offer clues on whether further rate cuts are being considered.
In Asia, China’s official PMI will provide an update on manufacturing activity, while Japan’s month-end releases will show consumer and industrial performance. Canada and India are also set to publish GDP figures. Together, these data points shape global growth sentiment, which influences safe-haven flows into gold.
Corporate earnings could also play a role. Nvidia’s results will test global tech momentum. Weakness in equities often boosts demand for gold as a portfolio hedge.
Market impact and price scenarios
Analysts say the base case is that the Fed delivers one rate cut in September, which would support gold above $3,385 and open the door to $3,400+. If the Fed signals a second cut by December, momentum could push prices higher toward $3,425 or $3,450.
The downside case is that inflation remains hot, forcing the Fed to pause. That would strengthen the dollar, lift Treasury yields, and keep gold capped below resistance. In this scenario, prices could retrace toward $3,360 or even $3,325.
Gold price technical analysis
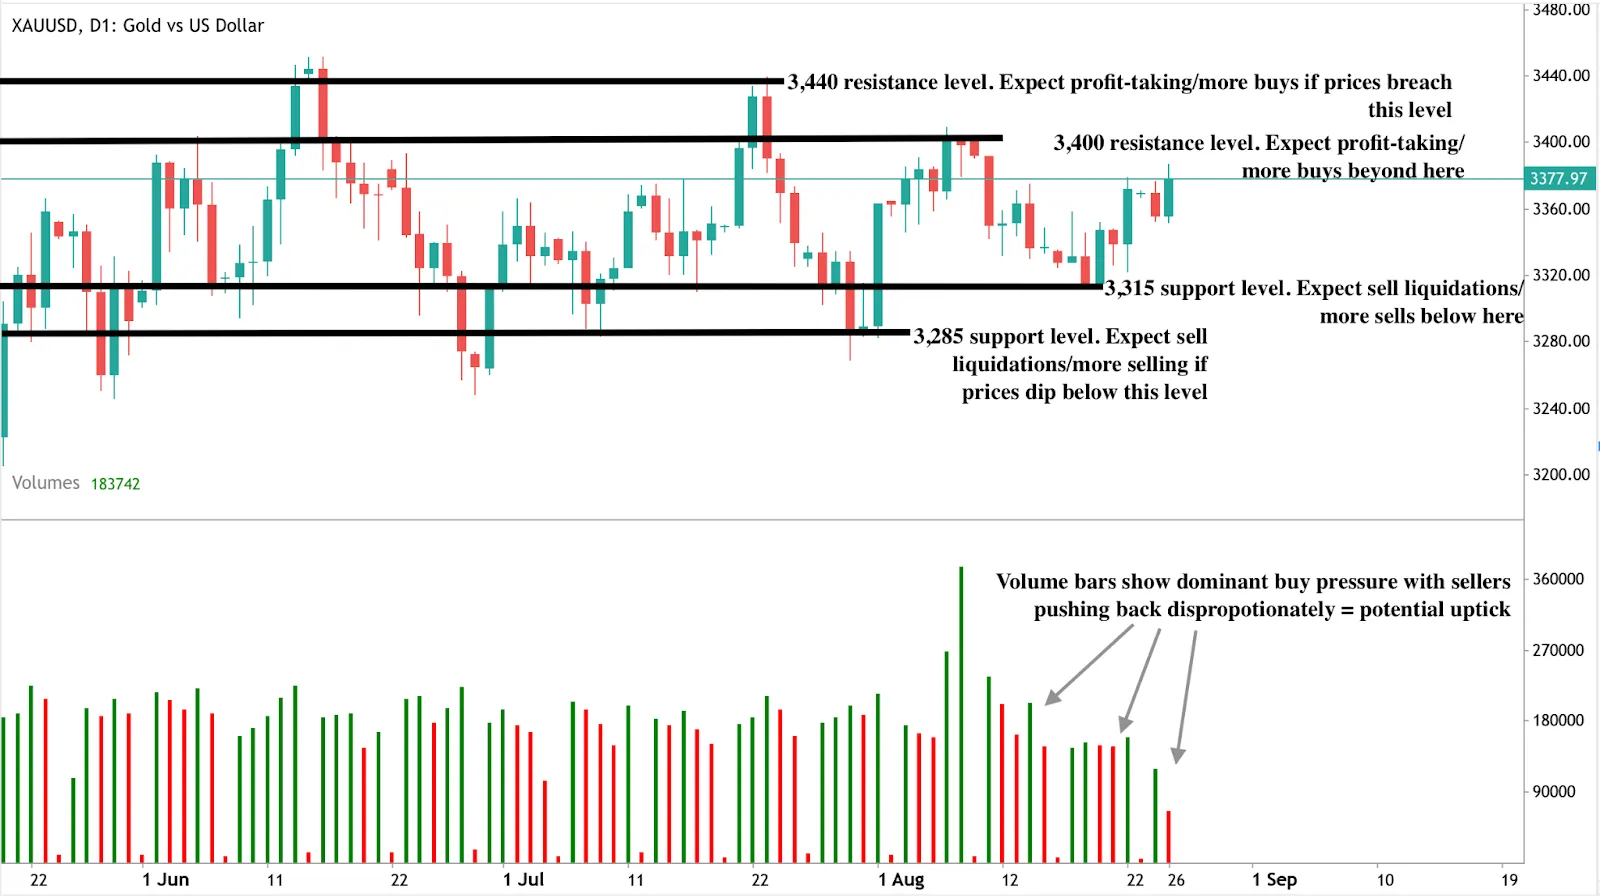
Technically, gold is consolidating just below resistance at $3,400. A sustained close above this level would confirm a breakout, with the next resistance at $3,440. Support sits at $3,315, with stronger levels at $3,385.
Investment implications
For traders, the balance of risks points to near-term volatility around US economic data. Short-term positioning may favour tactical plays on a breakout above $3,400 if the PCE report confirms cooling inflation. Medium-term strategies should account for the possibility that the Fed cuts less than markets expect, limiting gold’s upside and keeping it in a $3,325–$3,400 range.
Political risks surrounding Fed independence provide an additional safe-haven bid, meaning downside could be cushioned even if US data is stronger than expected. Longer-term investors may see this as a period where gold remains supported by uncertainty, even if breakouts are capped.
Frequently asked questions
Why could gold break above $3,400?
Markets expect a September rate cut, which reduces the opportunity cost of holding gold and weakens the dollar.
What could prevent a breakout?
Hot inflation data or stronger GDP growth could delay rate cuts, supporting the dollar and limiting gold’s upside.
How does Trump’s move against Lisa Cook matter?
It raises concerns over Fed independence, undermines trust in policy, and drives safe-haven demand for gold.
What other global data is relevant?
Eurozone inflation, China’s PMI, Canada and India GDP, and Japan’s month-end releases will all influence gold via risk sentiment.

What Powell’s dovish tilt and Ueda’s hawkish stance mean for USD/JPY
The U.S. dollar slipped to a four-week low after Federal Reserve Chair Jerome Powell signalled that downside risks to employment were growing, fuelling expectations for a September rate cut.
The U.S. dollar slipped to a four-week low after Federal Reserve Chair Jerome Powell signalled that downside risks to employment were growing, fuelling expectations for a September rate cut. At the same time, Bank of Japan Governor Kazuo Ueda pointed to accelerating wage growth in Japan, reinforcing expectations that the BoJ may resume tightening by October. The combination highlights a policy divergence that could decide whether USD/JPY climbs toward 150 or reverses closer to 140.
Key takeaways
- Powell’s Jackson Hole speech increased market conviction of a September rate cut, with traders pricing 84% odds.
- Markets now expect a total of 53 basis points in cuts by year-end, though the path depends on upcoming U.S. inflation and labour data.
- The dollar index fell more than 1% on Powell’s comments, sending USD/JPY lower before a retracement bounce in Asia trading.
- U.S. debt has surged by $1 trillion in just 48 days, raising long-term concerns about fiscal sustainability and safe-haven appeal.
- Ueda flagged broadening wage growth and Japan’s tight labour market, sustaining expectations of a BoJ hike by October.
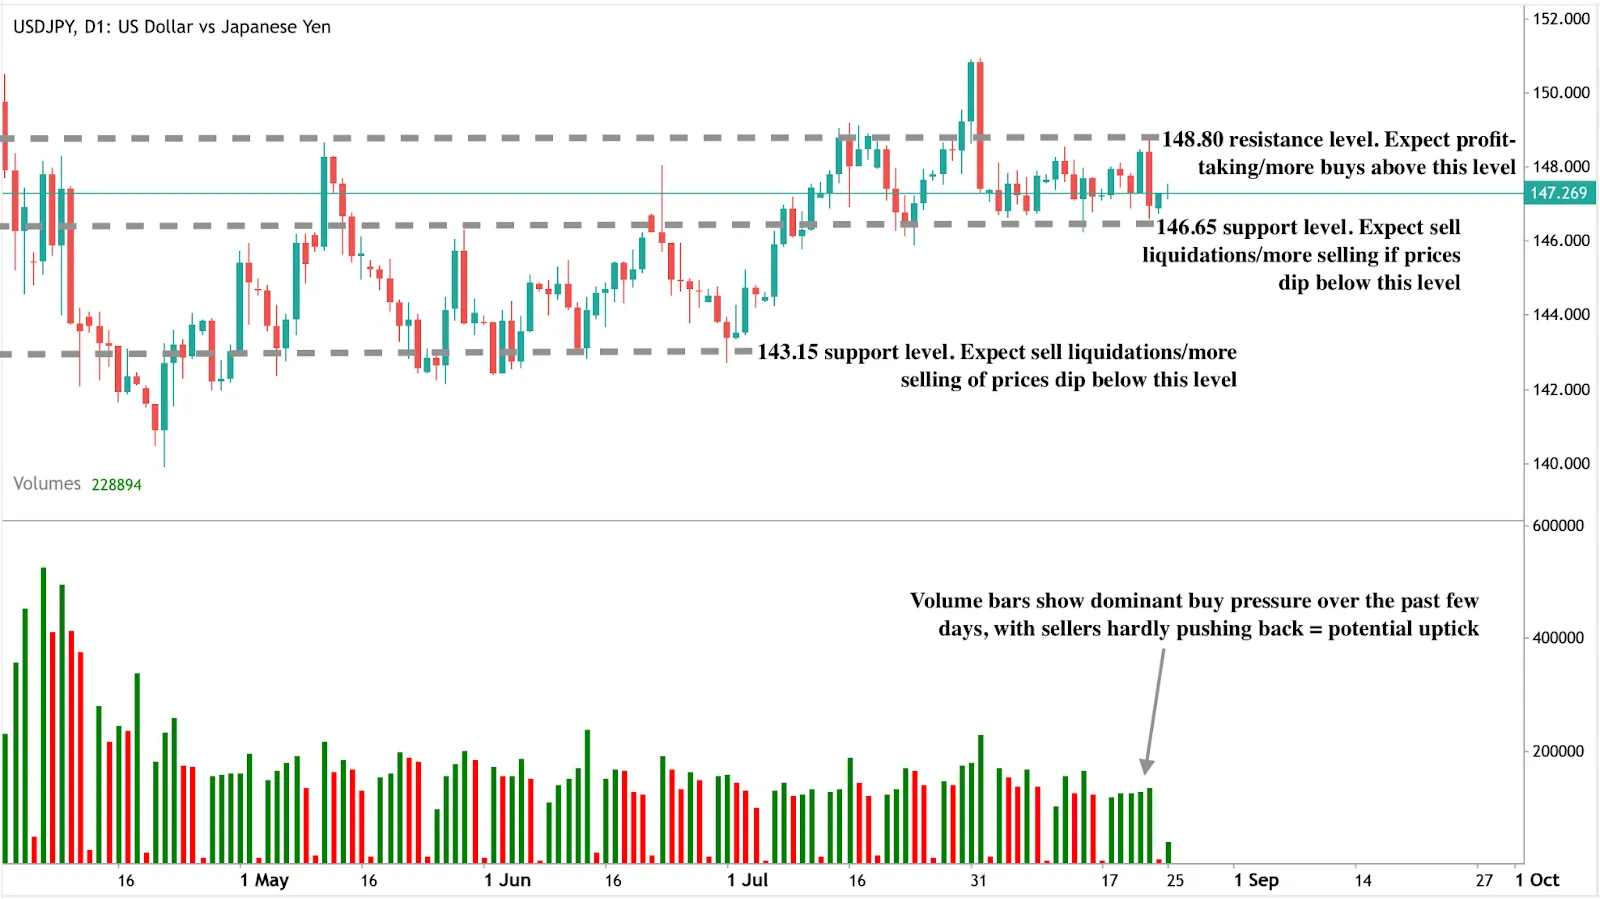
- Traders see USD/JPY capped near 147.50 resistance, with a breakout toward 150 or reversal toward 140 hinging on Fed-BoJ timing.
Powell’s dovish tilt: Fed rate cut expectations
At Jackson Hole, Powell told an audience of global economists and policymakers that “downside risks to employment are rising. And if those risks materialise, they can do so quickly.”
Markets immediately interpreted the statement as a dovish shift, raising bets on near-term easing. According to CME and LSEG data:
- 87% chance of a quarter-point cut at the 17 September FOMC meeting.
- Around 53 bps of cuts are priced in for the rest of 2025.
This pivot comes after months of shifting expectations:
- Early August: weak payrolls boosted cut bets.
- Mid-August: hot producer price inflation (PPI) and robust business surveys forced traders to scale back expectations.
- Post-Jackson Hole: Powell’s remarks effectively “cleared the bar” for dovishness, reviving confidence that cuts are imminent.
Goldman Sachs analysts noted that Powell’s message “cleared the market’s low bar for dovishness following a steady erosion in Fed cut pricing. It will be up to the data to determine the pace and depth of cuts.”
U.S. debt pressures weigh on the dollar
Beyond monetary policy, the U.S. fiscal backdrop is deteriorating rapidly. Federal debt has increased by $1 trillion in just 48 days, equivalent to $21 billion per day. Since 11 August 2025, alone, an additional $200 billion has been added, pushing totals close to $38 trillion.
Government spending now consumes 44% of GDP annually, levels not seen since World War II or the 2008 crisis - except this time, without an economic emergency.

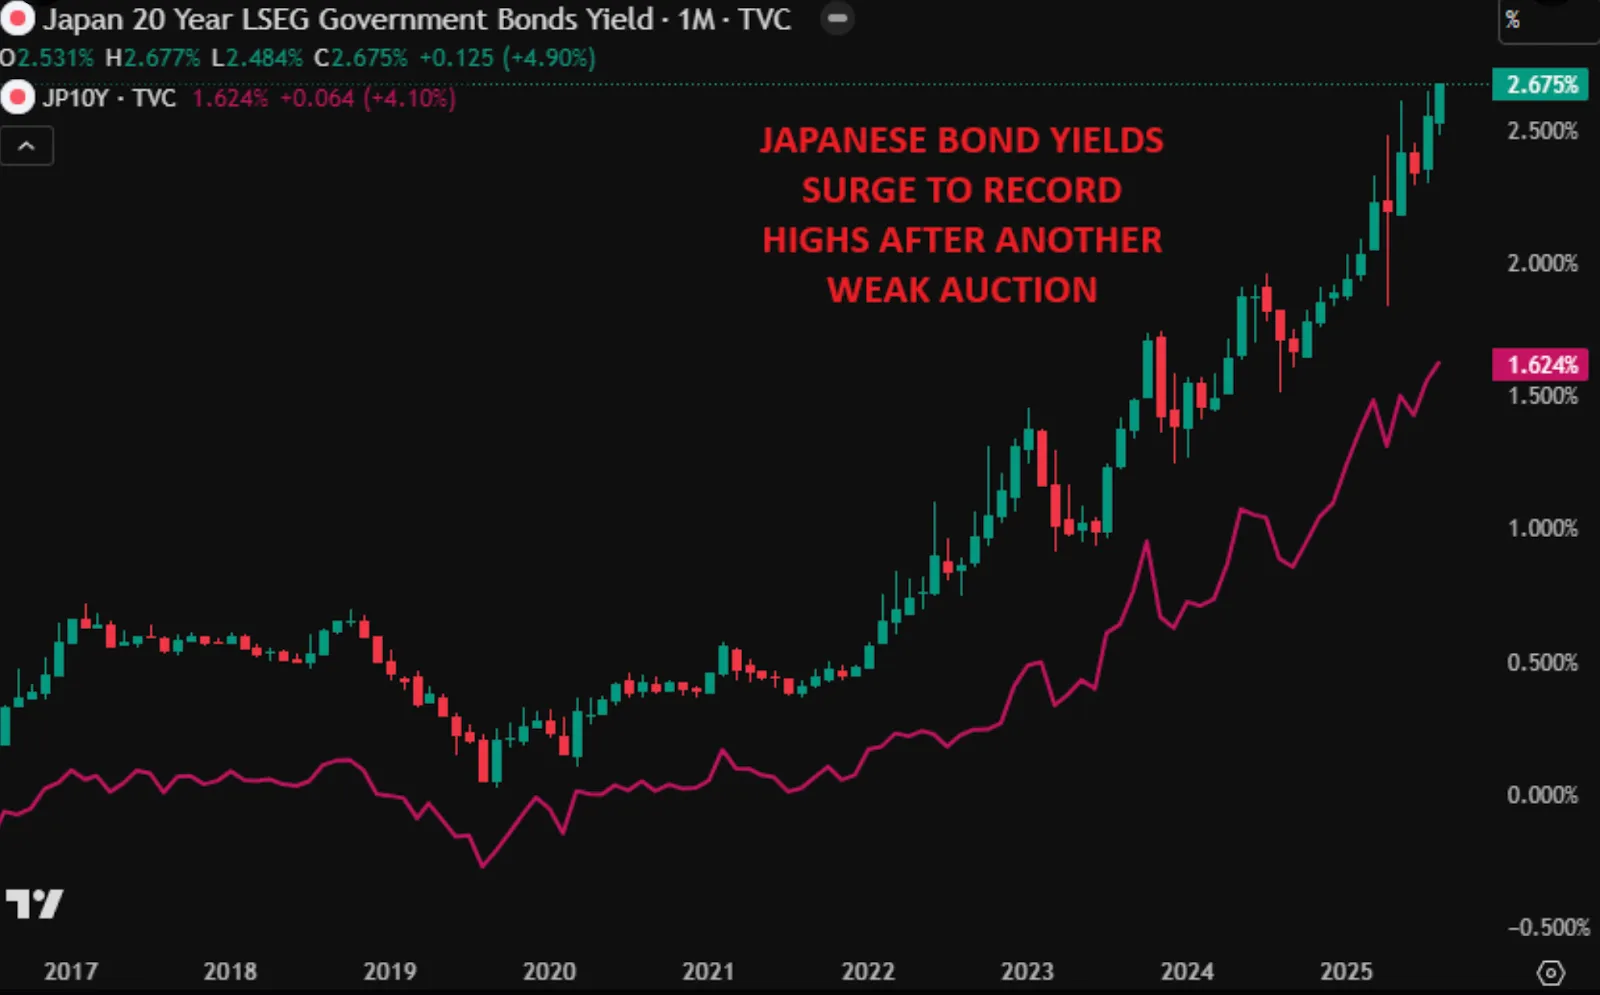
Bond auctions have already shown signs of weakening demand, with investors requiring higher yields to absorb new issuance.
For FX markets, this creates a dual pressure:
- If the Fed cuts, the U.S. yield advantage erodes.
- If debt keeps ballooning, investors may question the dollar’s safe-haven appeal.
The combination leaves the dollar vulnerable even before accounting for Fed dovishness.
Trump’s attacks add credibility risk
Adding to dollar pressure is growing political friction. President Donald Trump has repeatedly criticised Powell - first for not cutting rates and more recently for cost overruns in the Fed building renovation.
Last week, Trump escalated by targeting Fed Governor Lisa Cook, saying he would fire her if she did not resign over mortgage holdings in Michigan and Georgia. These interventions have raised questions about the Fed’s independence, further clouding the U.S. policy outlook.
For global investors, a dovish Fed combined with political pressure risks undermining confidence in U.S. monetary stability, amplifying dollar weakness.
Ueda’s hawkish stance: Labour market drives BoJ outlook
In sharp contrast, BoJ Governor Kazuo Ueda struck a more confident tone at Jackson Hole. He noted that wage hikes are spreading from large enterprises to small and medium firms and are likely to accelerate further due to a tightening job market.
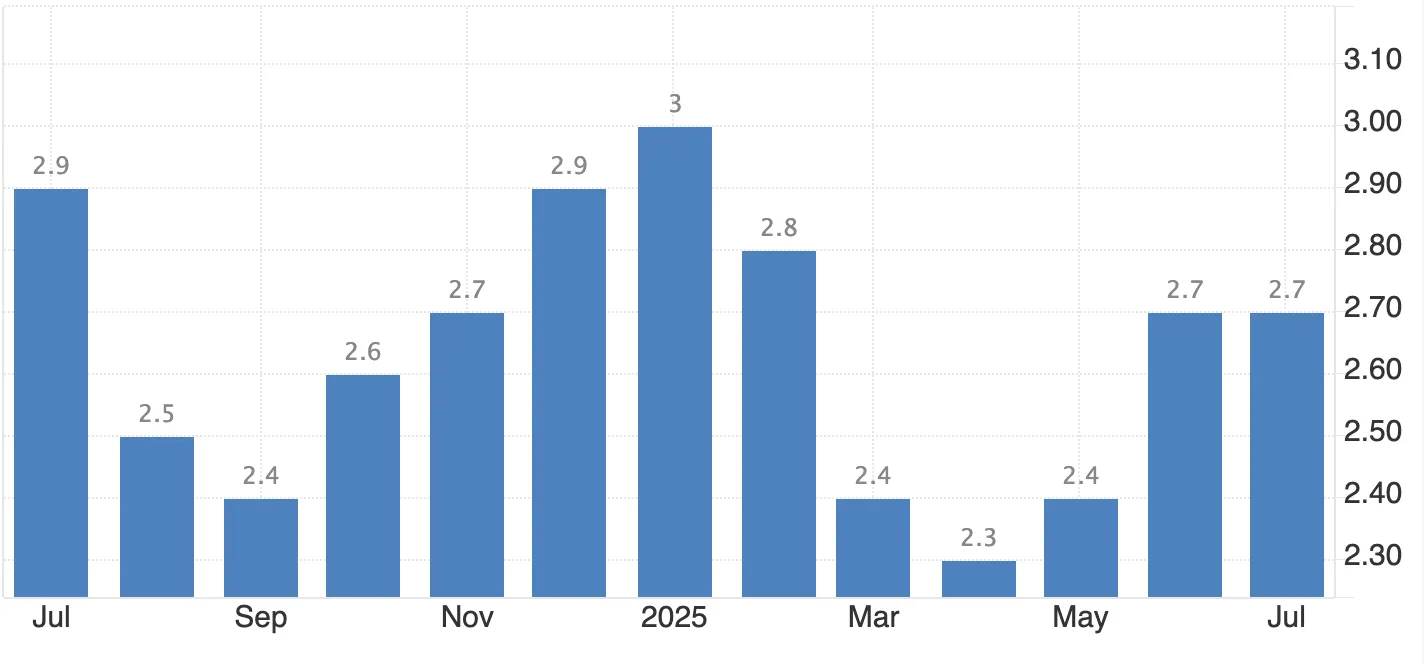
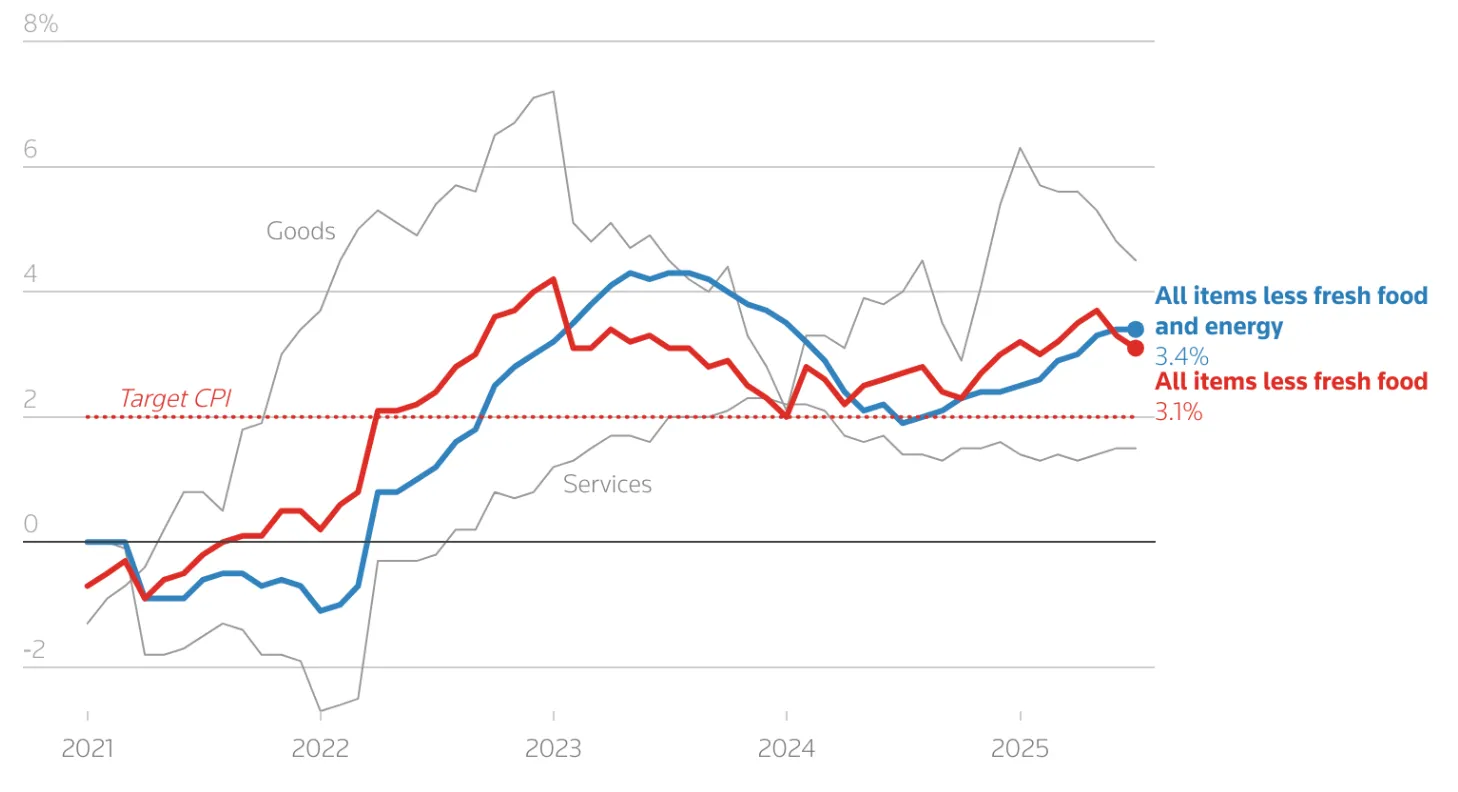
Japan’s core CPI rose 3.1% year-on-year in July, above forecasts and still well above the BoJ’s 2% target, even as inflation slowed for a second consecutive month.
This combination of sticky inflation and rising wages supports the case for the BoJ to resume rate hikes after pausing after January’s increase. Markets now see the probability of an October hike at around 50% - a coin toss.
USD/JPY: Central bank policy divergence in focus
The Fed leaning dovish while the BoJ leans hawkish sets up a clear inflection point for USD/JPY:
- Upside case (150): If U.S. data proves strong enough to delay cuts, or if safe-haven flows rise due to fiscal or geopolitical stress, USD/JPY could test 150.
- Downside case (140): If Powell delivers a September cut and Ueda follows with a BoJ hike in October, the divergence could spark a sharper yen rebound.
Currently, the pair trades near 147.40–147.50, a key resistance zone. The next catalysts are:
- PCE inflation (Friday) - the Fed’s preferred gauge.
- August payrolls (next week) - critical for confirming labour market risks.
USD/JPY technical analysis
At the time of writing, the pair is trading close to a support level, hinting at a potential price uptick. The volume bars showing dominant buy pressure with little pushback from sellers add to the bullish narrative. Should a price uptick materialise, prices could find resistance at the $148.89 price level. Conversely, if we see a dip, prices could find support at the $146.65 and $143.15 support levels.
Investment implications
For traders, USD/JPY positioning is highly sensitive to Fed-BoJ sequencing:
- Short-term: Tactical selling near 147.50–150 may appeal if U.S. data confirms a September cut.
- Medium-term: Yen strength could build if the BoJ hikes in October while the Fed continues easing.
- Risks: U.S. fiscal instability and political pressure on the Fed could accelerate dollar weakness beyond policy drivers.
With both central banks shifting, the next decisive move in USD/JPY hinges on which policy change comes first: a Fed cut or a BoJ hike.
Frequently asked questions
Why did Powell’s speech weaken the dollar?
Because it increased the likelihood of imminent Fed rate cuts, reducing U.S. yield appeal.
How much easing is priced in?
Markets see an 87% chance of a cut in September and 53 basis points of reductions by year-end.
Why is U.S. debt important for USD/JPY?
Exploding debt raises doubts about U.S. fiscal sustainability, making the dollar less attractive as a safe haven.
What supports BoJ hawkishness?
Broadening wage growth, sticky inflation above 2%, and structural labour shortages.
What are the key levels for USD/JPY?
Upside resistance near 147.50–150, downside support toward 140.
Have we entered the late stage of the Bitcoin bull market cycle?
Bitcoin’s latest price action suggests the current bull market may be entering its later stages, with factors suggesting the cycle may be further advanced than many realise.
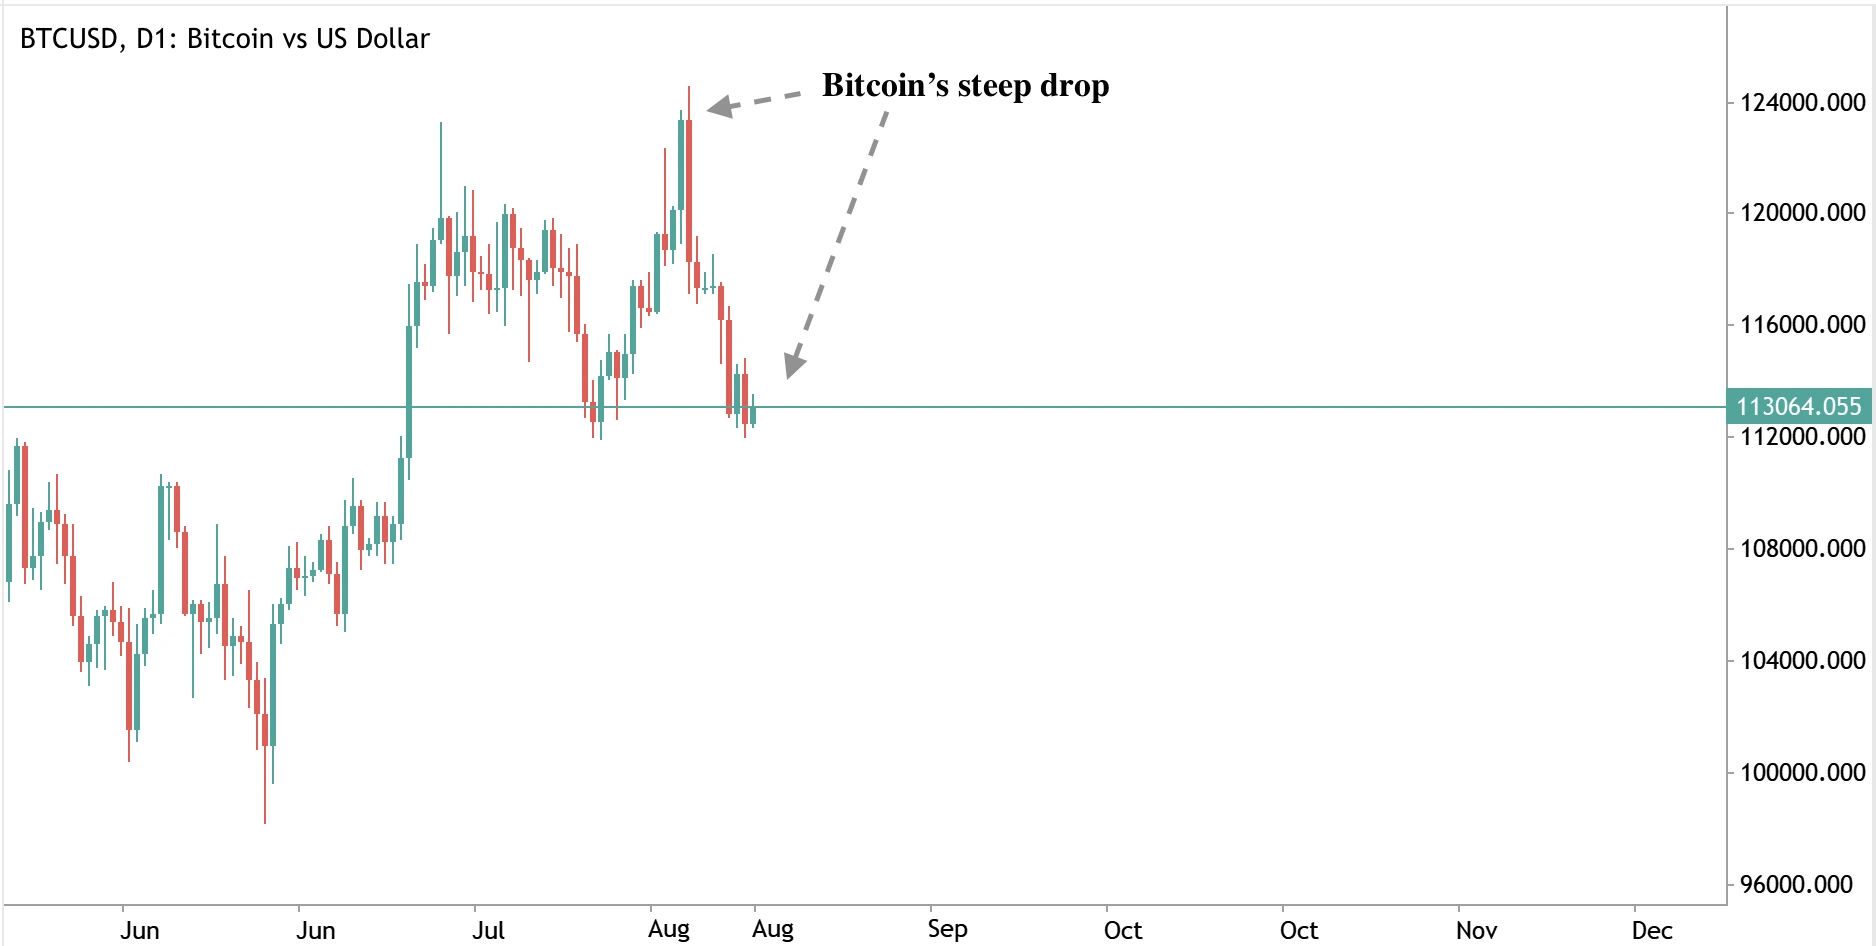
Bitcoin’s latest price action suggests the current bull market may be entering its later stages. After reaching a record high of $124,128 in mid-August 2025, Bitcoin has since retreated by 8% to trade near $113,222.
On-chain data from Glassnode shows long-term holders are taking profits at levels historically seen near cycle peaks, while spot Bitcoin exchange-traded funds (ETFs) have posted nearly $1 billion in outflows over just four trading days.
At the same time, capital has rotated into altcoins, a pattern often seen late in Bitcoin bull markets. Together, these factors suggest the cycle may be further advanced than many investors realise.
Key takeaways
- Bitcoin fell 8% from its August peak of $124,128 to around $113,222.
- Long-term holders are realising profits at levels consistent with prior late-cycle euphoric phases.
- Spot Bitcoin ETFs recorded $975M in outflows over four trading days.
- Altcoin open interest briefly hit $60B before correcting by $2.5B.
- Accumulator addresses - wallets that never sell - hit record demand in 2025.
- Glassnode suggests a cyclical peak could occur as early as October 2025.
Bitcoin’s late-cycle signals hint at a maturing
Glassnode’s analysis highlights that long-term holders, defined as investors who hold coins for more than 155 days, are taking profits at levels comparable to Bitcoin’s past euphoric peaks. In previous cycles, this type of activity coincided with late-stage rallies that eventually gave way to corrections.
Demand data supports this pattern. Despite reaching new all-time highs, Bitcoin’s ability to attract fresh inflows has weakened. Spot Bitcoin ETFs, which drove significant demand earlier in the cycle, saw $1,155.3 million in outflows across five consecutive trading days. This cooling appetite for exposure suggests institutional buyers are becoming more cautious.
Bitcoin ETF outflows and demand fatigue
ETF flows have been one of the clearest signals of demand for Bitcoin in 2025. Earlier in the year, large inflows helped propel Bitcoin through successive highs. Now, the reversal in flows indicates fatigue in the rally. For context, Bitcoin’s fall from $124,000 to $113,000 aligns with this drop-off in capital, showing how sensitive the price remains to institutional flows.
Historically, when ETF inflows slow while long-term holders distribute coins into strength, Bitcoin is often in the later stages of its cycle. This adds weight to the view that the market may be closer to its peak than many expect.
Altcoin speculation rises
Weaker Bitcoin demand has coincided with a sharp rise in speculative activity elsewhere. Altcoin open interest briefly surged to a record $60.2 billion before correcting by $2.5 billion. Glassnode notes that such pronounced capital rotation into altcoins is a hallmark of late-cycle dynamics, where investors shift from Bitcoin into higher-risk calls.
Ethereum, in particular, has seen perpetual futures volume dominance climb above Bitcoin’s, highlighting the rotation of capital into alternative ecosystems.
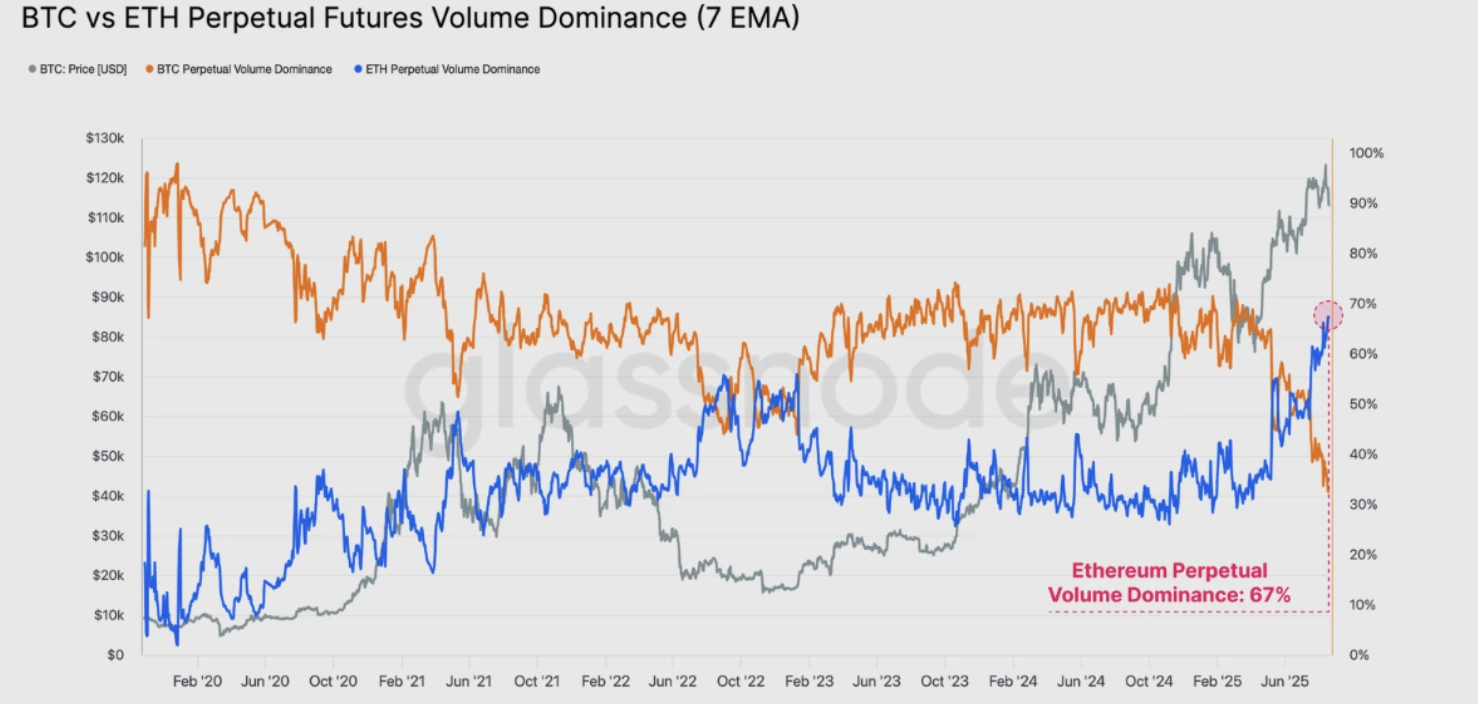
Historically, this type of rotation often precedes the formation of an “altseason” - a period when smaller cryptocurrencies outperform Bitcoin during the final leg of a bull cycle.
The four-year cycle debate
One of the most contested questions in the current market is whether Bitcoin’s four-year halving cycle still holds. Glassnode argues that Bitcoin’s price behaviour continues to mirror prior halving-driven cycles. If history repeats, a cyclical peak could occur as early as October 2025. Analysts such as Rekt Capital also point to the timeline aligning with the 2020 cycle, where the peak occurred roughly 550 days after the halving.
However, not all agree. Some industry leaders argue that institutional adoption has permanently altered Bitcoin’s structure. Jason Williams recently noted that the top 100 treasury companies collectively hold nearly 1 million BTC, worth more than $112 billion. Meanwhile, Bitwise CIO Matt Hougan has said the halving cycle is “dead,” predicting Bitcoin will likely see another “up year” in 2026, extending beyond traditional patterns.
This divide reflects the uncertainty in today’s market: historic cycle signals still resonate, but new institutional dynamics may reshape the trajectory.
Accumulators add to Bitcoin long-term holders
Despite slowing inflows and profit-taking, conviction among long-term buyers remains strong. Data from CryptoQuant shows demand from accumulator addresses - wallets that only buy and never sell - reached an all-time high in 2025.
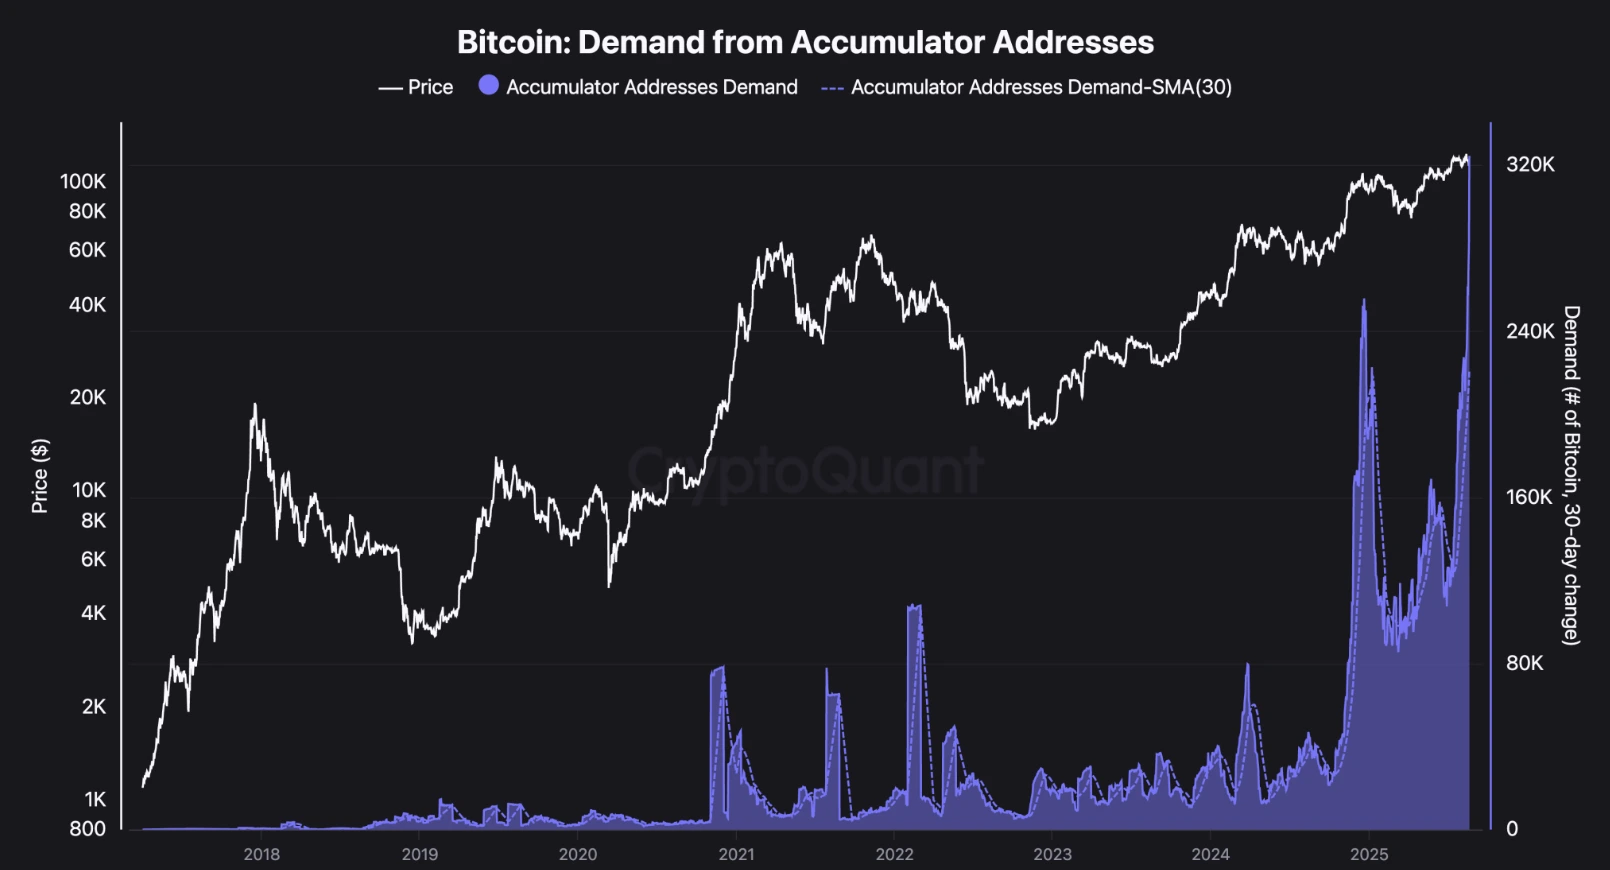
These addresses steadily absorb supply regardless of price action, providing a structural underpinning for Bitcoin’s value.
This behaviour contrasts with the caution among short-term traders. Analyst Axel Adler points out that Bitcoin’s “visible demand” metric, which measures net holdings of coins moved within the past year, has slipped to 30,000 BTC. While still positive, this decline suggests newer participants are less active, adding to the sense of cooling momentum.
Bitcoin price scenarios
Given these dynamics, Bitcoin sits at a critical crossroads:
- Bullish case: If demand stabilises within the $107,000 - $110,000 support zone, Bitcoin could rebound toward $120,000. A breakout above that level opens the path to a retest of $130,000.
- Base case: Consolidation continues between $107,000 and $115,000, allowing the market to reset momentum before its next decisive move.
- Bearish case: If $107,000 fails and visible demand declines further, Bitcoin could slide toward $102,000 - $104,000, with risk of testing the $100,000 psychological level.
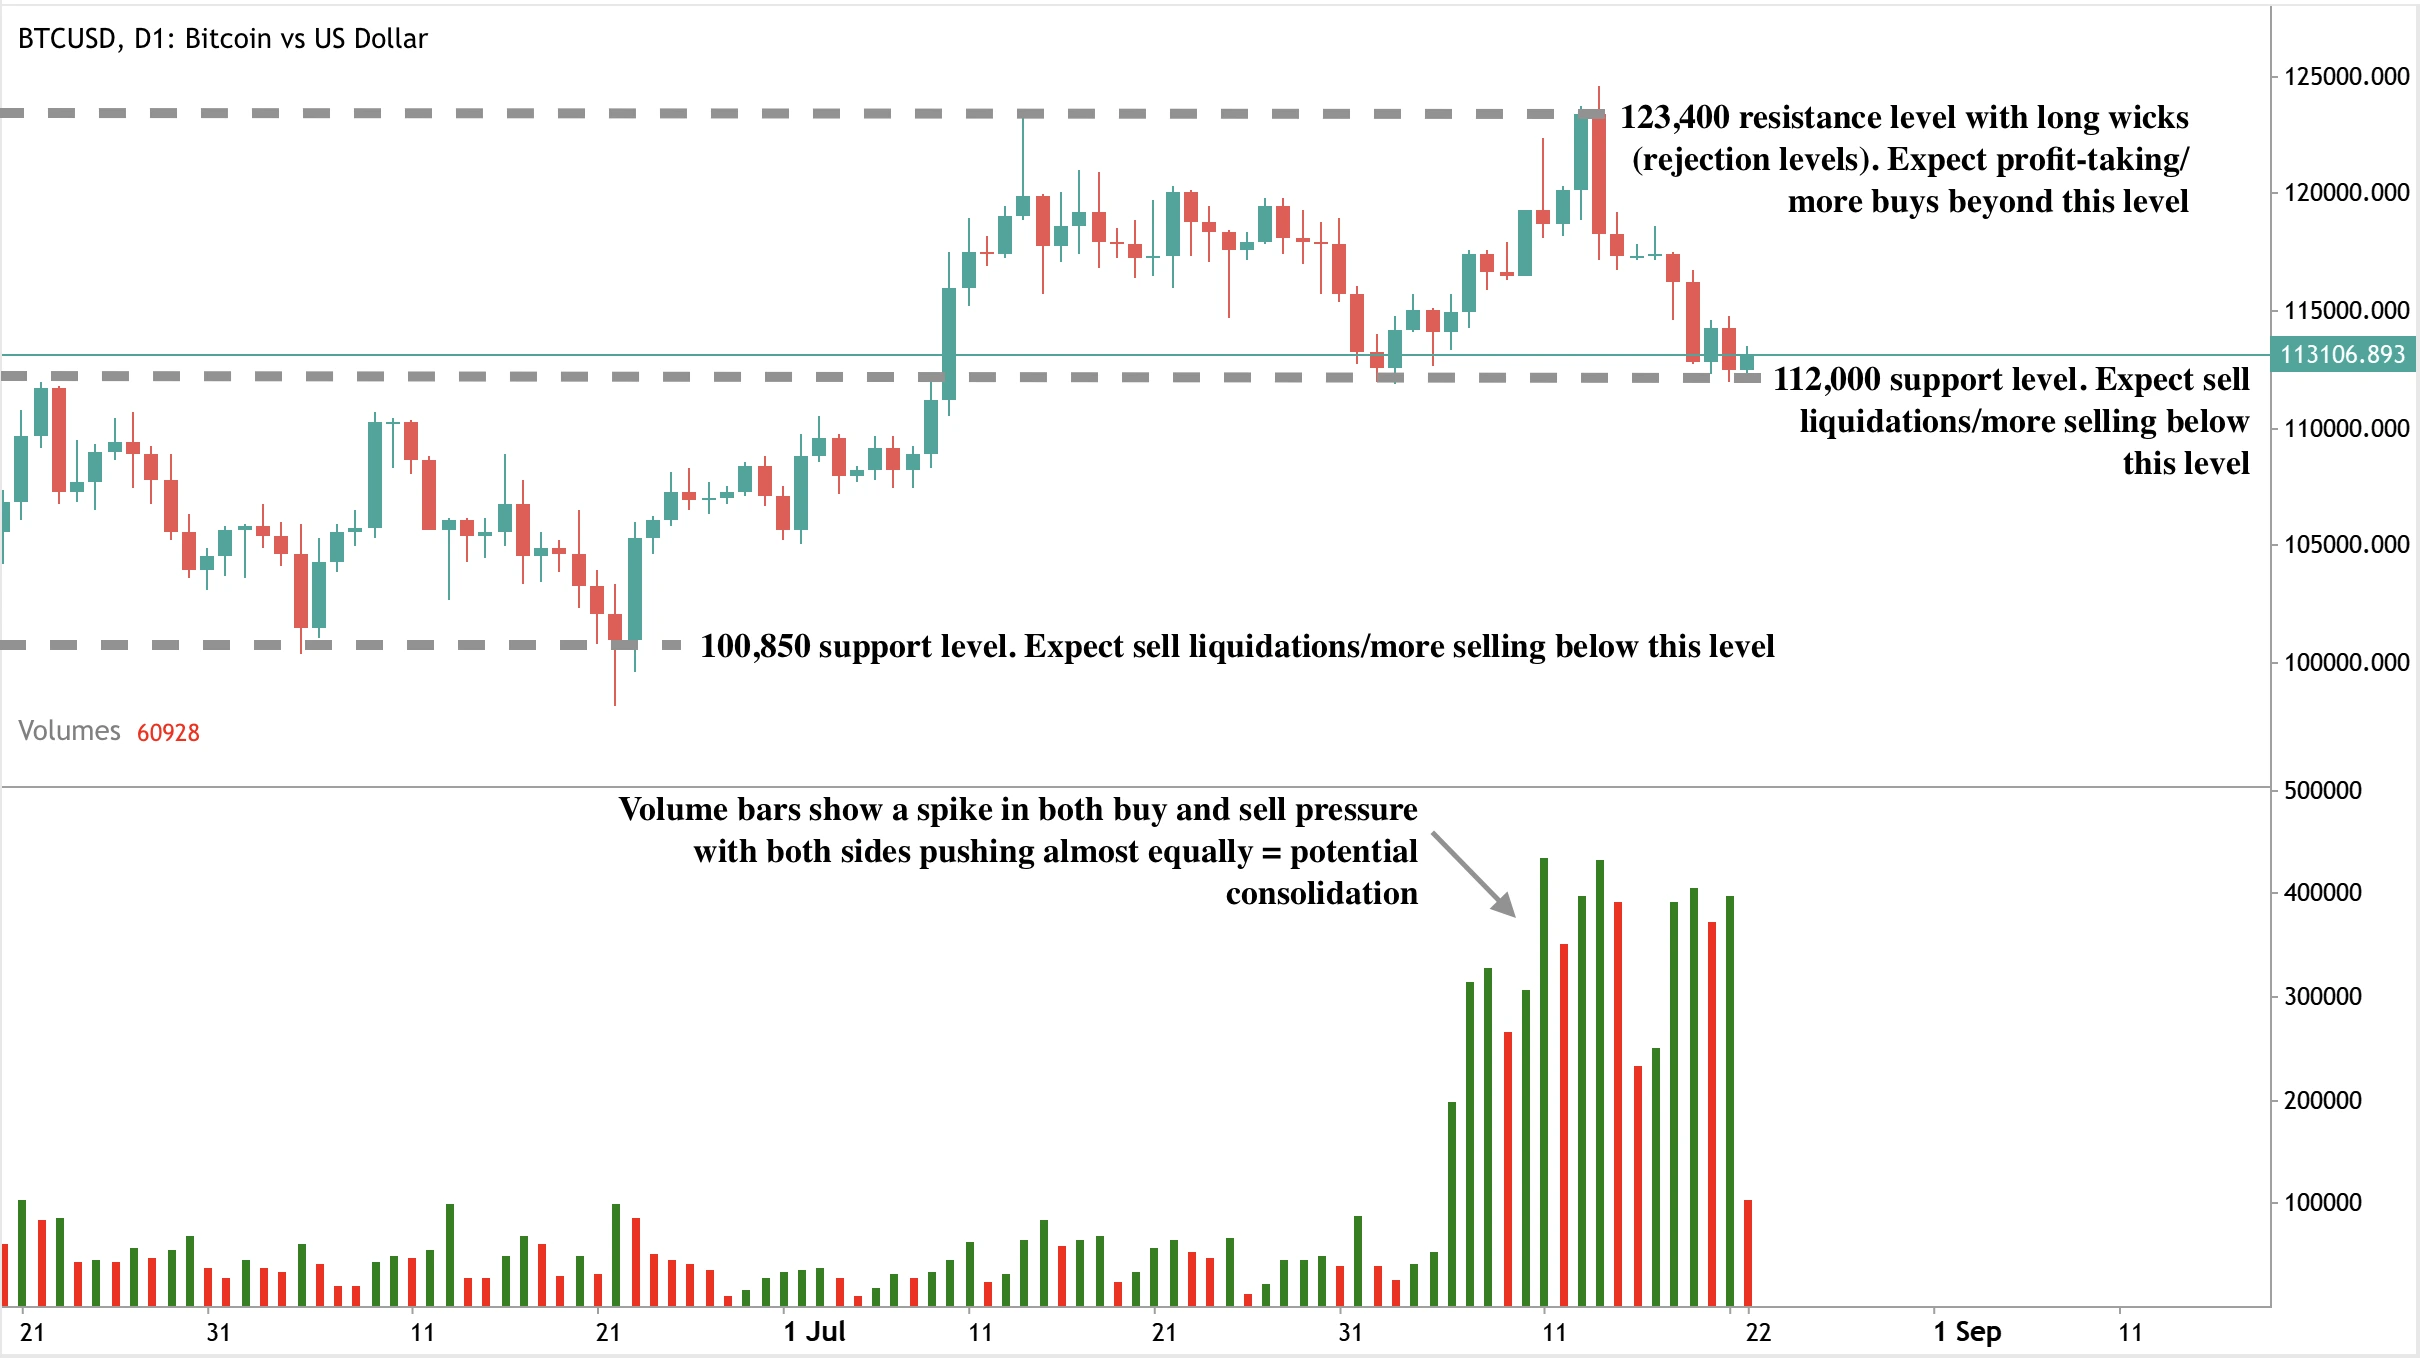
Bitcoin technical analysis
At the time of writing, Bitcoin prices have dropped near a key support level around $112,000, hinting that a potential bounce could be in play. Volume bars, however, show a near equal tug-of-war between bulls and bears, suggesting that price may consolidate rather than break decisively in the short term.
If buying momentum strengthens, the next resistance level to watch is $123,400. A successful breakout above this threshold could set the stage for a retest of August’s highs near $124K and potentially higher. On the downside, a failure to hold $112,000 support could trigger a sharper decline toward the $100,850 level, with the $100,000 psychological zone acting as the final line of defence.
Investment implications
For traders, the $112,000 -$110,000 range is critical. Holding this zone could allow for a rebound toward $123,000 -$130,000, while a breakdown risks a deeper move to $100,000.
For investors, the mix of late-cycle signals and strong accumulator demand suggests heightened volatility ahead. While short-term demand appears weaker, structural adoption continues to underpin Bitcoin’s long-term outlook. Portfolio strategies should balance the risk of a late-cycle correction with the possibility of one final leg higher if the four-year cycle remains intact.
Speculate on the next movements of Bitcoin with a Deriv MT5 account today.
Frequently asked questions
Why is Bitcoin showing late-cycle signals?
Because long-term holders are realising profits, ETF inflows have slowed, and speculative capital is rotating into altcoins - all patterns consistent with previous late-cycle phases.
Is the four-year cycle still intact?
Glassnode suggests yes, with a potential peak by October 2025. Some analysts disagree, citing institutional adoption and ETFs as new factors reshaping the cycle.
What supports Bitcoin’s price despite weaker inflows?
Record demand from accumulator addresses reduces liquid supply, reinforcing long-term confidence in Bitcoin’s role as a reserve asset.
What are the key support and resistance levels?
Support is centred around $112,000 and the $107,000 - $110,000 band, while resistance sits near $123,400 and $130,000. A break below $112,000 could open a move toward $100,000.

Retail trader inflows raise the stakes for Nvidia earnings
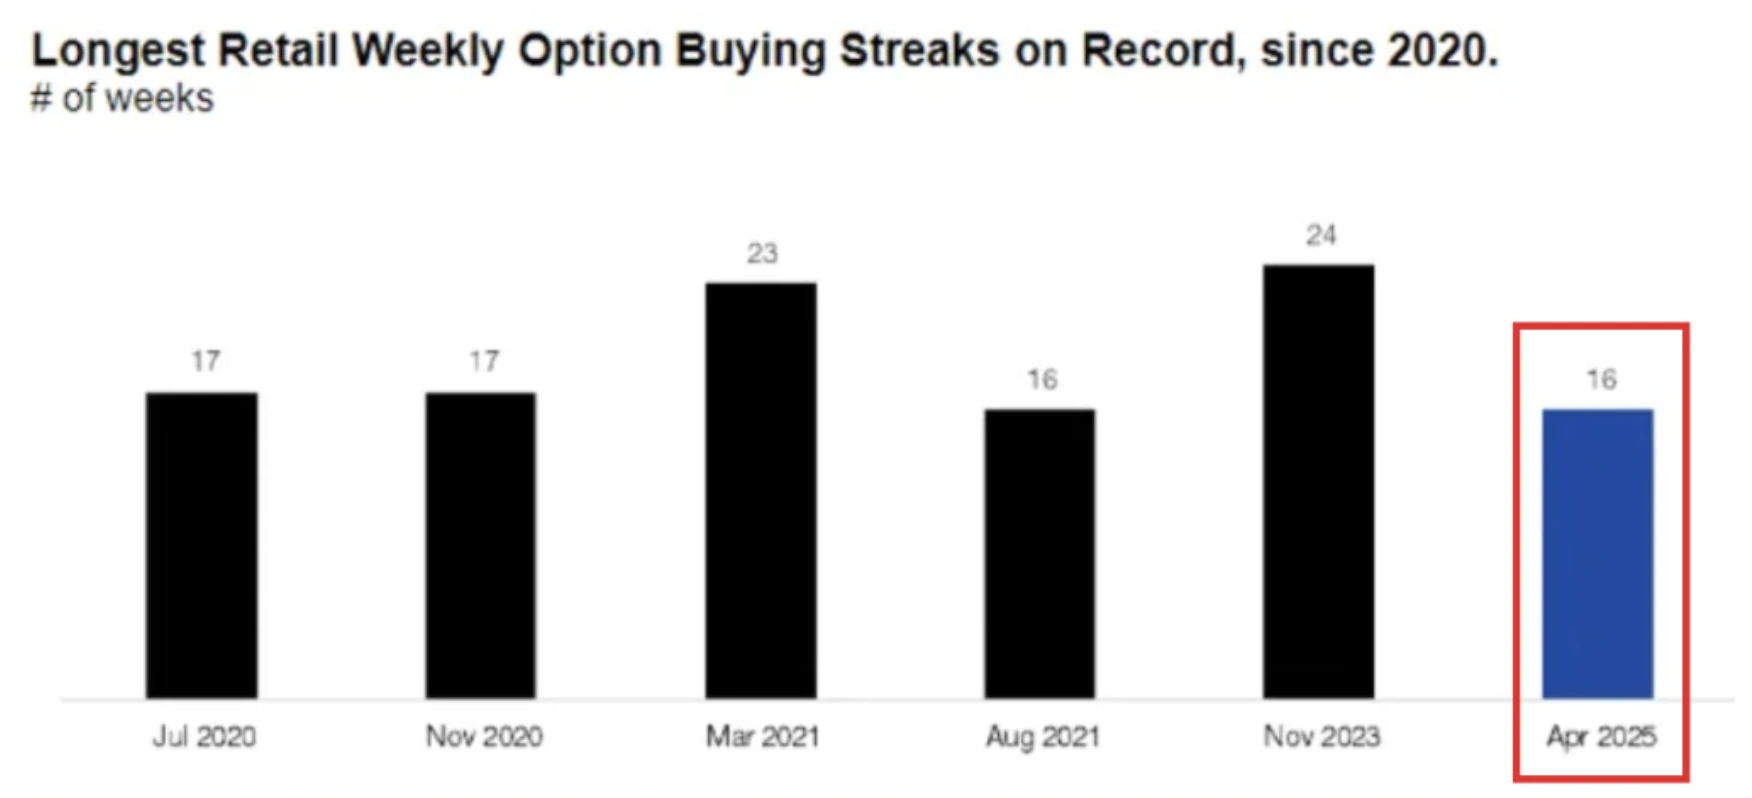
Retail traders have fuelled a historic 16-week streak of net equity buying with Nvidia as one of their top targets ahead of its Q2 2026 earnings release.
Retail traders have fuelled a historic 16-week streak of net equity buying - the longest since 2020 - with Nvidia as one of their top targets ahead of its 27 August fiscal Q2 2026 earnings release. Consensus estimates stand at $45.9 billion in revenue and $1.00 in adjusted EPS, but Nvidia’s stock has already climbed 83% since April. That rally, combined with heavy retail inflows, sets a high bar. The key test is whether strong results and guidance can keep retail momentum intact, or if disappointment triggers a meme-style pullback.
Key takeaways
- Retail investors have been net buyers of Nvidia for weeks, making it July’s most purchased stock on Charles Schwab platforms.
- Nvidia’s Q2 revenue consensus is $45.9B, slightly above its $45B guidance that excluded an $8B China headwind from H20 restrictions.
- A newly granted U.S. licence for H20 shipments to China could allow Nvidia to recover part of that lost revenue.
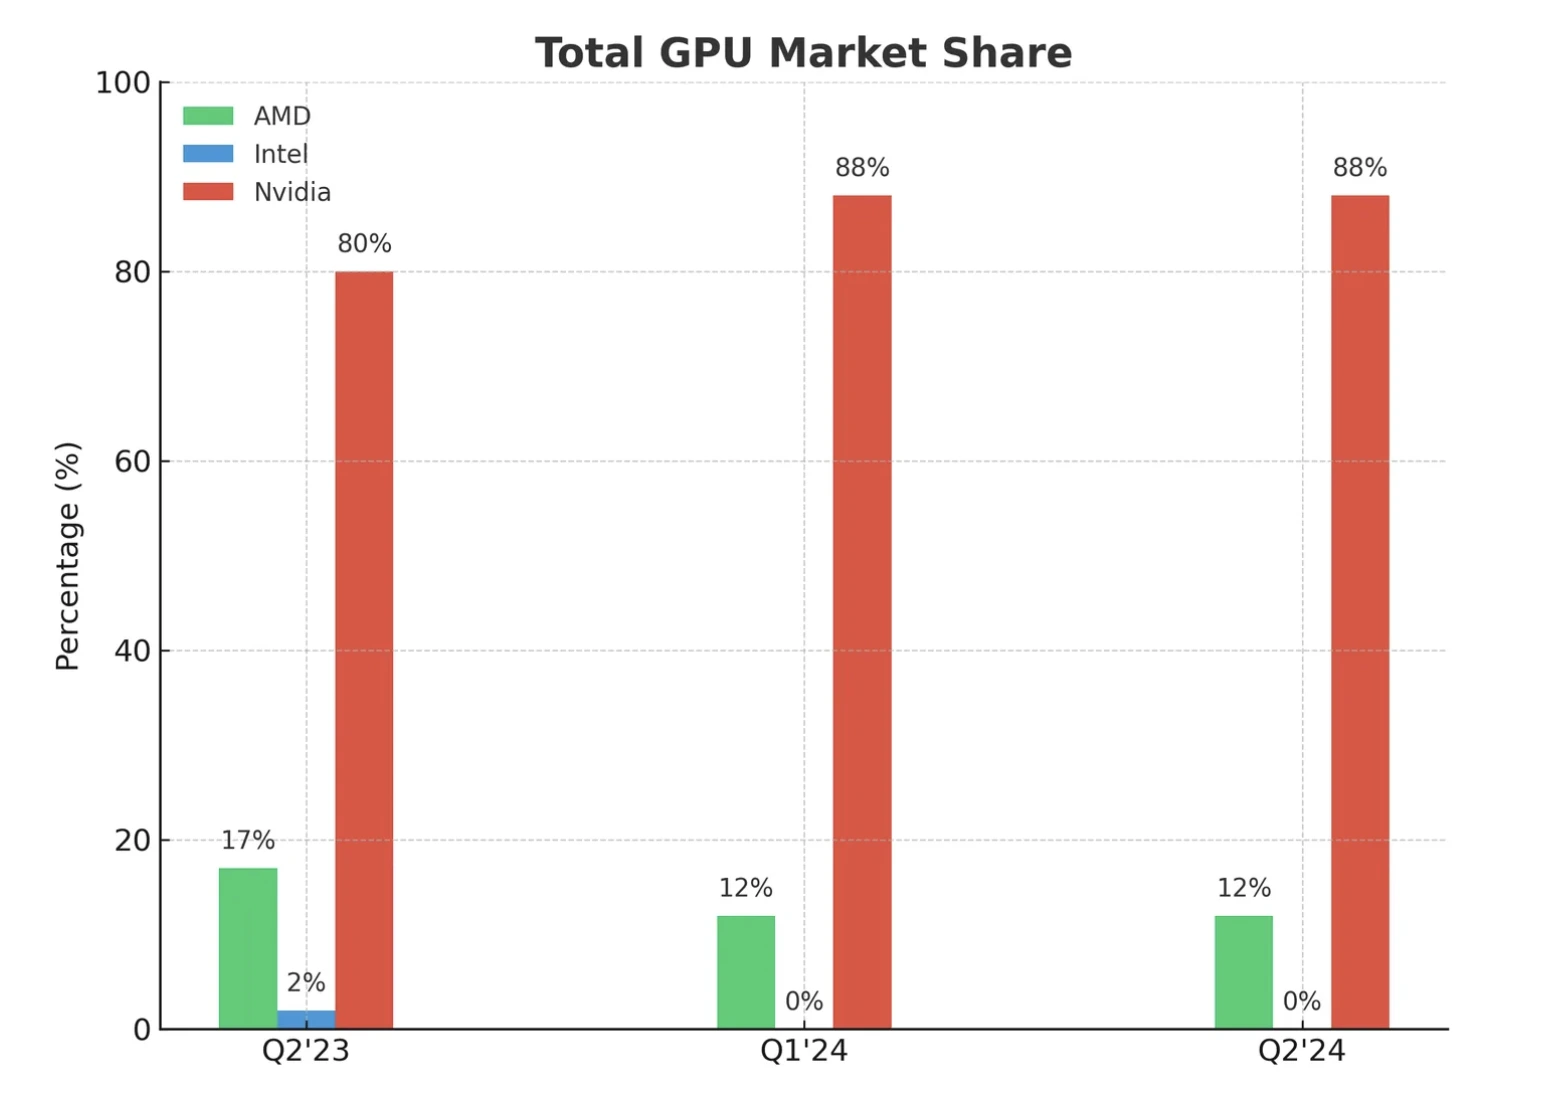
- Hyperscalers are projected to spend $364B on capex in 2025, up sharply from $325B, underpinning Nvidia’s 80% AI chip market share.
- Retail inflows contrast with institutional caution, as speculators hold their largest short positions in $SPY this year.
- Nvidia trades at 58x earnings, more than double the S&P 500, leaving little room for error if guidance disappoints.
Retail trader flows set up a high-stakes earnings event
According to Citadel Securities, retail traders have been net buyers of equity options for 16 straight weeks, the sixth-longest streak since 2020. Nvidia and Tesla are central to this activity, with UnitedHealth also ranking high on retail flows.
In July, Nvidia was the single most-bought stock by retail clients at Schwab.
This activity mirrors the meme-stock era of 2020 - 2021, but with two key differences:
- Retail demand is concentrated in mega-cap tech rather than smaller speculative names.
- Investors are using commission-free platforms and API-driven data access to trade more strategically.
The result is that Nvidia enters its earnings call not just as a corporate bellwether, but as a test case for whether retail flows can sustain tech valuations at record highs.
Nvidia earnings preview and the AI chip market share
When Nvidia released Q1 results, it guided for $45B in Q2 revenue, while warning of an $8B hit tied to U.S. restrictions on its China-specific H20 chip. The restrictions led to a $2.5B revenue loss and a $4.5B charge in Q1.
Since then, developments have shifted:
- Licence reinstatement: In July, the U.S. Commerce Department granted Nvidia approval to ship H20 chips to China, on the condition that 15% of sales revenue be remitted to the government.
- Timing impact: Applications began on 15 July, two weeks before the quarter closed. Some H20 revenue may therefore appear in Q2, with more upside potential in Q3.
- Demand backdrop: Despite ongoing U.S. - China tensions, AI chip demand in China remains acute due to supply shortages, suggesting strong uptake for the H20.
Beyond China, hyperscaler investment remains the dominant growth driver. Amazon, Microsoft, Meta, and Alphabet are projected to lift 2025 capex to $364B, a 64% YoY jump and 5 percentage points faster than 2024. With Nvidia steadily controlling ~80% of the AI GPU market, this spending spree is effectively a direct revenue pipeline.
Retail vs institutional positioning
The contrast between retail enthusiasm and institutional hedging is stark. Retail traders continue to rotate into Nvidia, but CFTC data show speculators are heavily short $SPY, reflecting broader caution on U.S. equities. Morgan Stanley analysts note that while demand indicators are “remarkable, insatiable, massive”, supply chain factors remain the near-term bottleneck.
This divergence raises the stakes: if Nvidia beats, retail momentum could amplify gains. But if results or guidance disappoint, heavy retail positioning could flip into a sharp unwind. Historical parallels with GameStop and AMC suggest that retail-fuelled rallies often end abruptly once momentum fades.
Valuation and risk of a pullback
Nvidia’s valuation underscores the tightrope. At 58x forward earnings, it trades at more than twice the S&P 500’s 25x. Bulls argue this premium is justified by expected EPS growth of +47% YoY in Q2, more than five times the index average.
Still, the setup is binary:
- Upside case: Q2 revenue tops guidance as H20 exports resume, capex guidance rises, and Blackwell architecture transition runs smoothly. Stock could push past $200 resistance.
- Downside case: Conservative commentary on China, or weaker-than-expected data centre trends, could spark profit-taking. A drop toward $175 support would align with seasonal retail slowdowns seen in late summer.
Market impact and price scenarios
- Bullish outcome: Earnings surprise to the upside, retail inflows sustain momentum, and Nvidia extends its 83% rally since April.
- Bearish outcome: Guidance stays conservative, institutional shorts gain traction, and retail enthusiasm fades - sharp correction.
- Volatility outcome: Large positioning on both sides drives oversized post-earnings moves, regardless of direction.
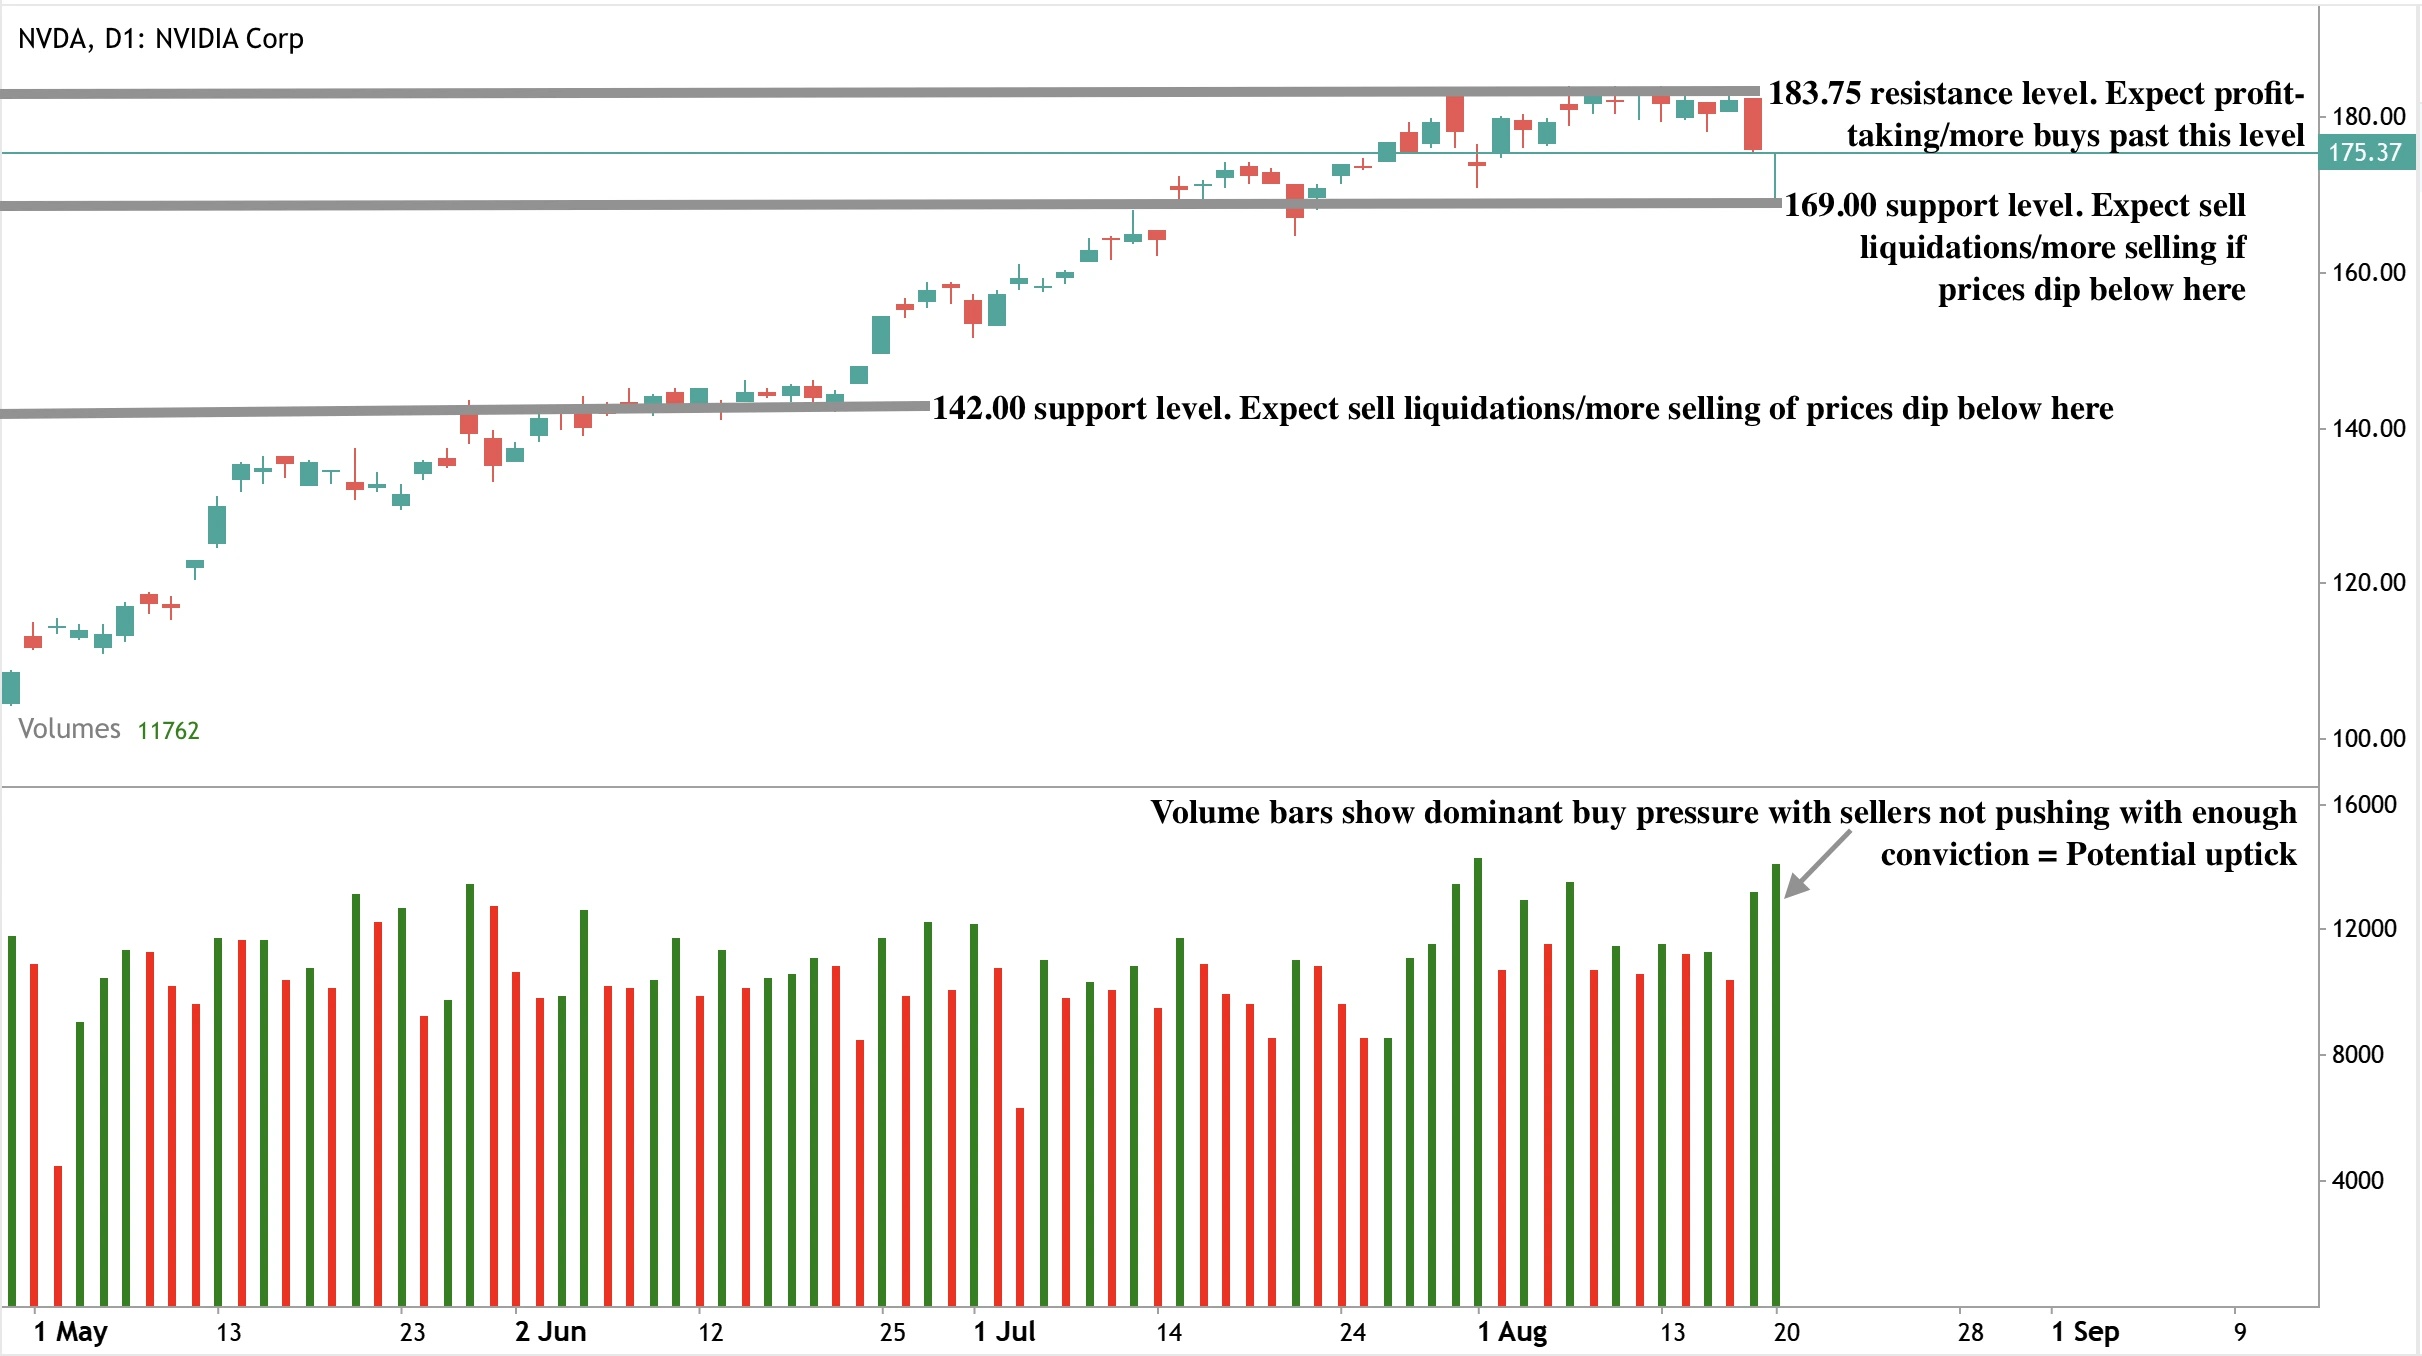
Nvidia technical analysis
At the time of writing, the stock price is seeing a significant dip after bouncing off a resistance level - hinting at a potential further dip. However, volume bars show dominant bullish pressure with sellers not pushing with enough conviction. Should a further drawdown materialise, prices could find support at the $169.00 and $142.00 levels. If we see an uptick, on the other hand, prices could face resistance near $183.75.
Investment implications
For traders, Nvidia’s 27 August earnings are not just about one company - they are a test of whether retail flows can keep powering U.S. tech higher. Short-term strategies should anticipate volatility around $175–$200 technical levels.
Medium-term positioning hinges on whether Nvidia can turn reinstated China exports and accelerating hyperscaler spending into earnings momentum that validates its premium multiple. Retail traders have set the stage. Nvidia’s results will decide whether the rally extends or gives way to a correction.
What will happen to Nvidia's prices after the earnings release? Speculate on its next movements today with a Deriv MT5 account.
Frequently asked questions
Why are retail traders so focused on Nvidia?
Because it offers the cleanest exposure to AI infrastructure, with unmatched dominance in GPUs for data centres.
What could make earnings stronger than expected?
China H20 licence sales, higher hyperscaler spending, and accelerating sovereign AI infrastructure demand.
What are the biggest risks?
High valuation, conservative guidance, and volatility if retail inflows reverse.
How does Tesla relate to this trend?
Tesla is the other main beneficiary of retail flows, alongside Nvidia, making both central to the broader retail-driven tech rally.

Will gold in 2025 remain a hedge or turn policy-driven?
The gold price is struggling to hold above $3,300, raising the question of whether bullion still works as a traditional hedge or has become primarily a policy-driven asset.
The gold price is struggling to hold above $3,300, raising the question of whether bullion still works as a traditional hedge or has become primarily a policy-driven asset. While the Federal Reserve’s higher-for-longer stance and a firm US dollar are capping upside momentum, steady central bank purchases led by China are providing a structural floor. Geopolitical risks and tariff concerns that once fuelled safe-haven demand appear to have less impact, suggesting that gold’s identity may be shifting.
Key takeaways
- Gold trades near $3,318 after a notable downturn, with a death cross formation looming.
- The Fed’s cautious stance and persistent inflation risks keep the US dollar strong, limiting safe-haven appeal.
- Odds of a September Fed rate cut are 82.9%, down from 100% last week, reflecting tempered easing expectations.
- China added 60,000 oz in July, marking its ninth consecutive month of gold buying.
- Central banks collectively purchased 415 tonnes in H1 2025, down 21% year-on-year but still historically strong.
- Silver diverges from gold, with high prices discouraging coin sales but encouraging ETF inflows.
Fed policy exerts pressure on gold
The primary driver for gold in 2025 has been the Federal Reserve’s stance. Markets initially priced in two rate cuts this year, with the first expected in September, but stronger US data and sticky inflation have trimmed those expectations.
The CME FedWatch Tool shows an 82.9% probability of a September cut, down from 100% a week earlier.
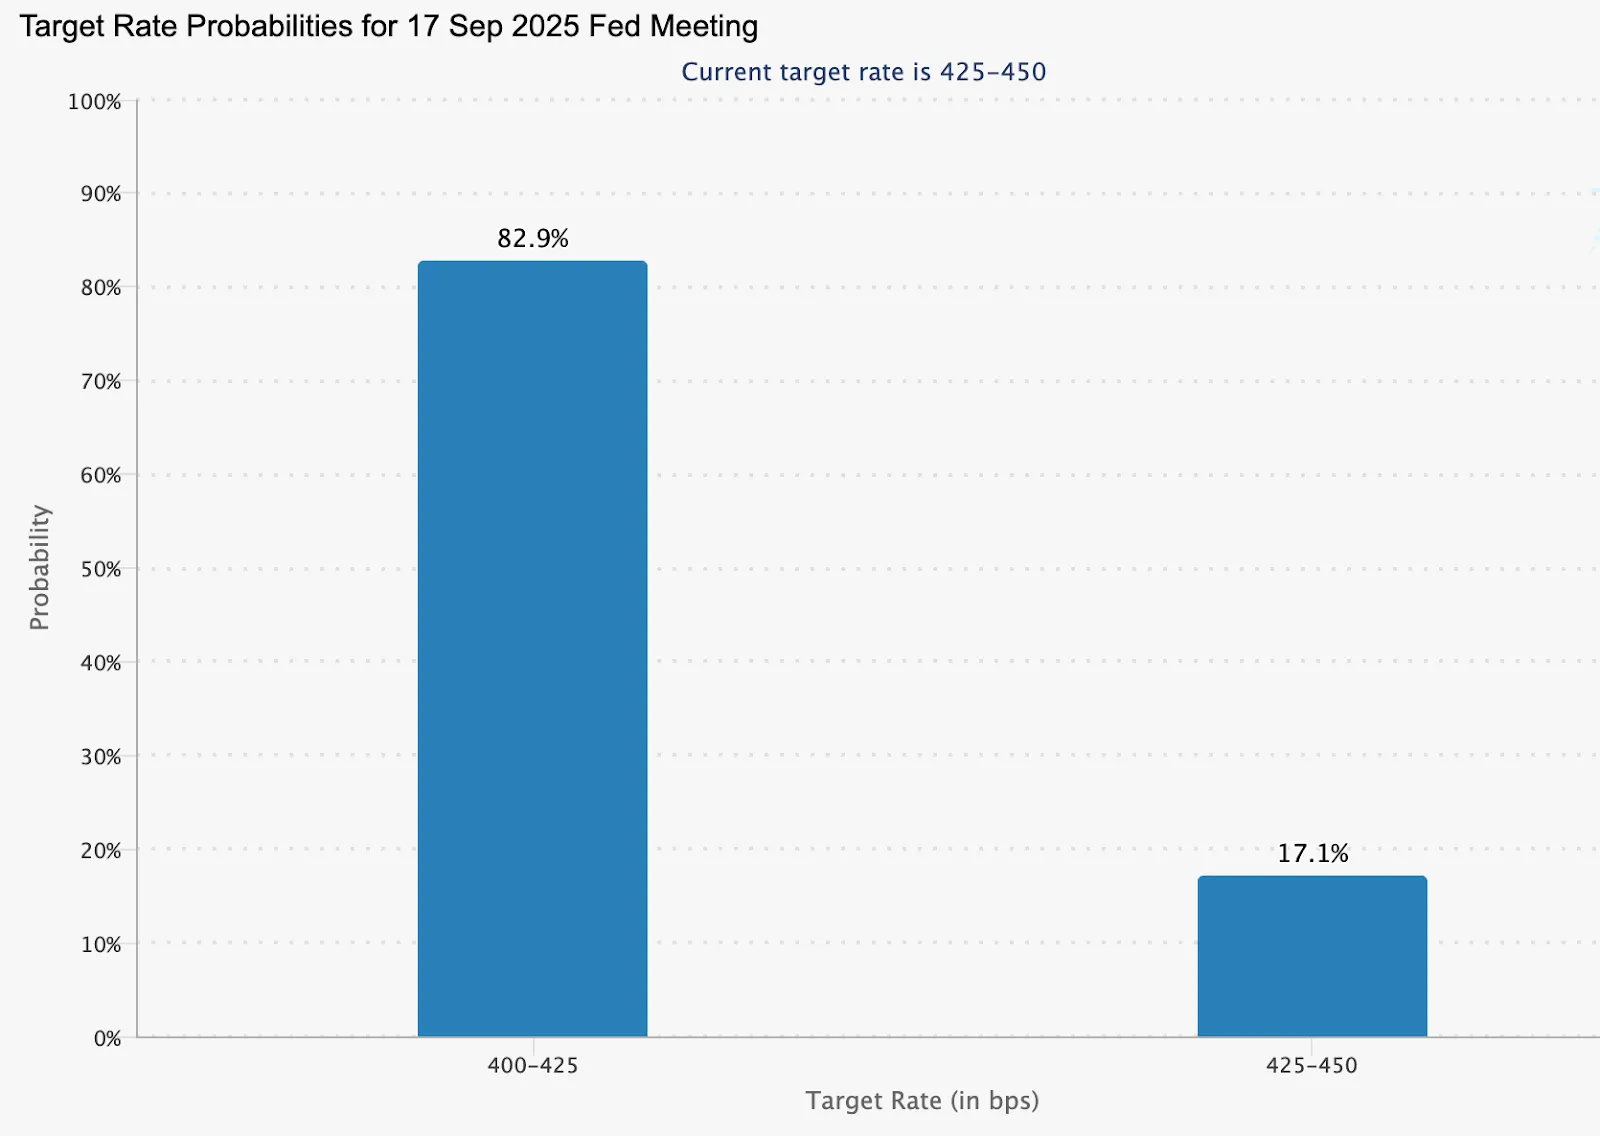
Alt text: Bar chart showing Fed target rate probabilities for the 17 September 2025 meeting.
Source: CME
US housing data released this week added to the dollar’s strength, while the Fed’s July minutes are unlikely to provide clarity as they pre-date July jobs and CPI numbers. The immediate focus is on Jerome Powell’s upcoming remarks at the Jackson Hole Symposium. His guidance will be critical in determining whether gold stabilises or breaks lower.
Gold Safe haven appeal weakens
Gold’s reaction to geopolitical events has been subdued. Despite successful talks between US, EU, and Ukrainian leaders and discussions of a potential Putin-Zelenskiy meeting, gold has not rallied meaningfully. Similarly, President Trump’s decision to rule out ground troops in Ukraine - while suggesting possible air support - had little effect.
In previous years, such developments might have triggered a stronger bid for bullion. Now, with the threat of a trade war dissipating and tariffs largely removed from the equation, gold’s role as a safe haven appears diminished. Investors are watching the Fed more closely than they are global flashpoints.
Central bank gold purchases provide structural support
While short-term trading is dictated by Fed expectations, central banks continue to underpin gold demand. China’s central bank added 60,000 ounces in July, marking the ninth consecutive month of accumulation and bringing reserves to 73.96 million ounces.
Globally, central banks bought 166.5 tonnes in Q2 and 415 tonnes in H1 2025. Although this is 21% lower than last year’s record pace, it remains strong compared to historical norms.
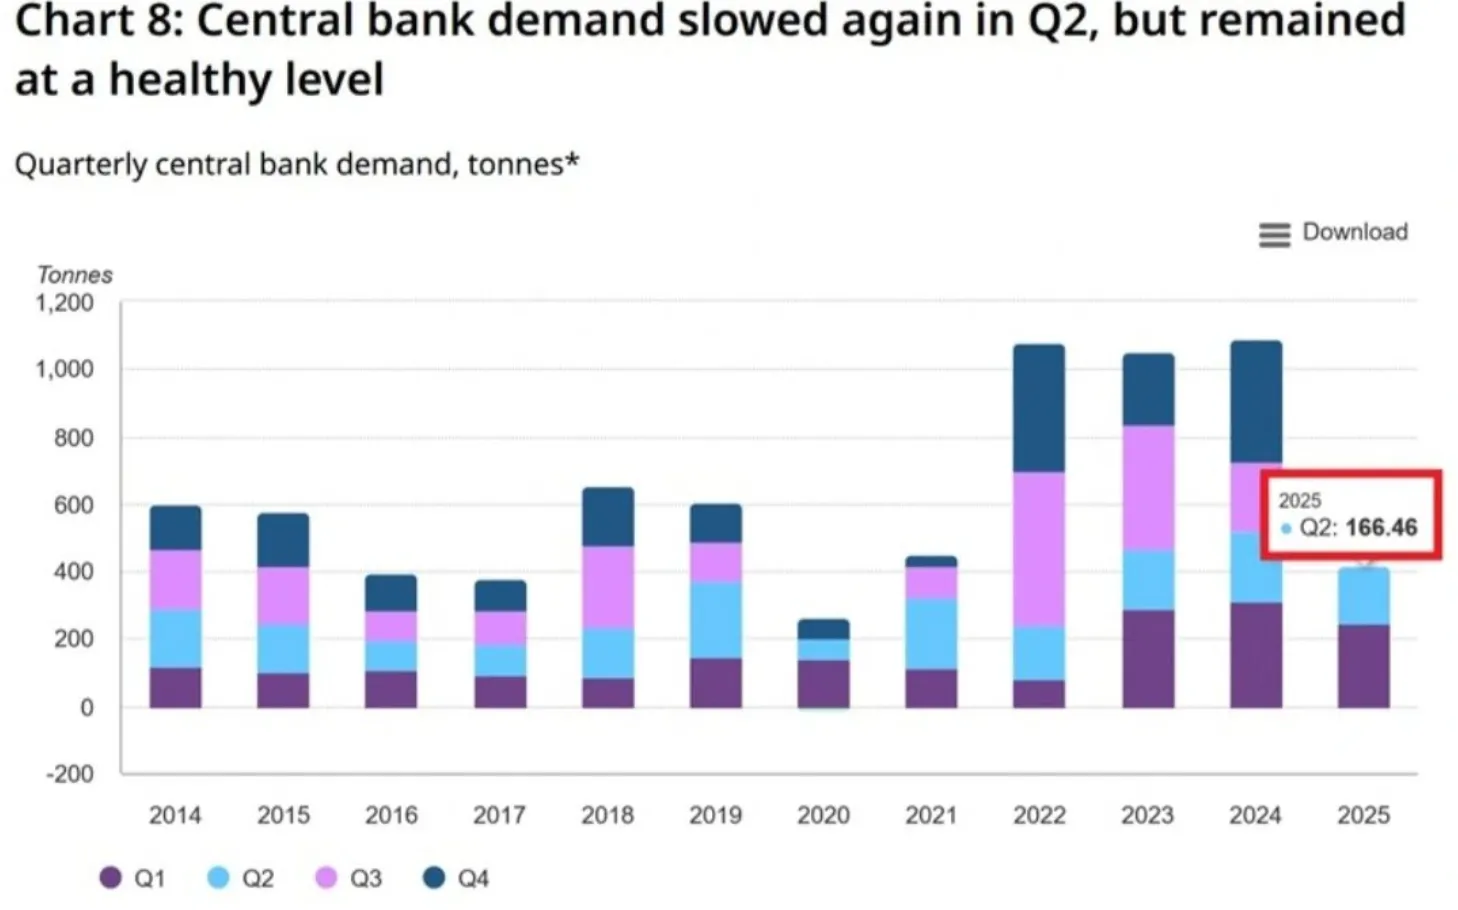
Alt text: Stacked bar chart showing quarterly central bank gold demand in tonnes from 2014 to 2025.
Source: World Gold Council, Metals Focus
Refinery services provider Heraeus notes that gold is unaffected by US tariffs and has held steady in the face of global turbulence. The firm highlights that if the Fed does eventually cut rates, a weaker dollar could help gold prices recover.
Gold vs silver performance
Silver presents a contrasting picture. On 15 August, prices closed at $37.9/oz, near multi-month highs.
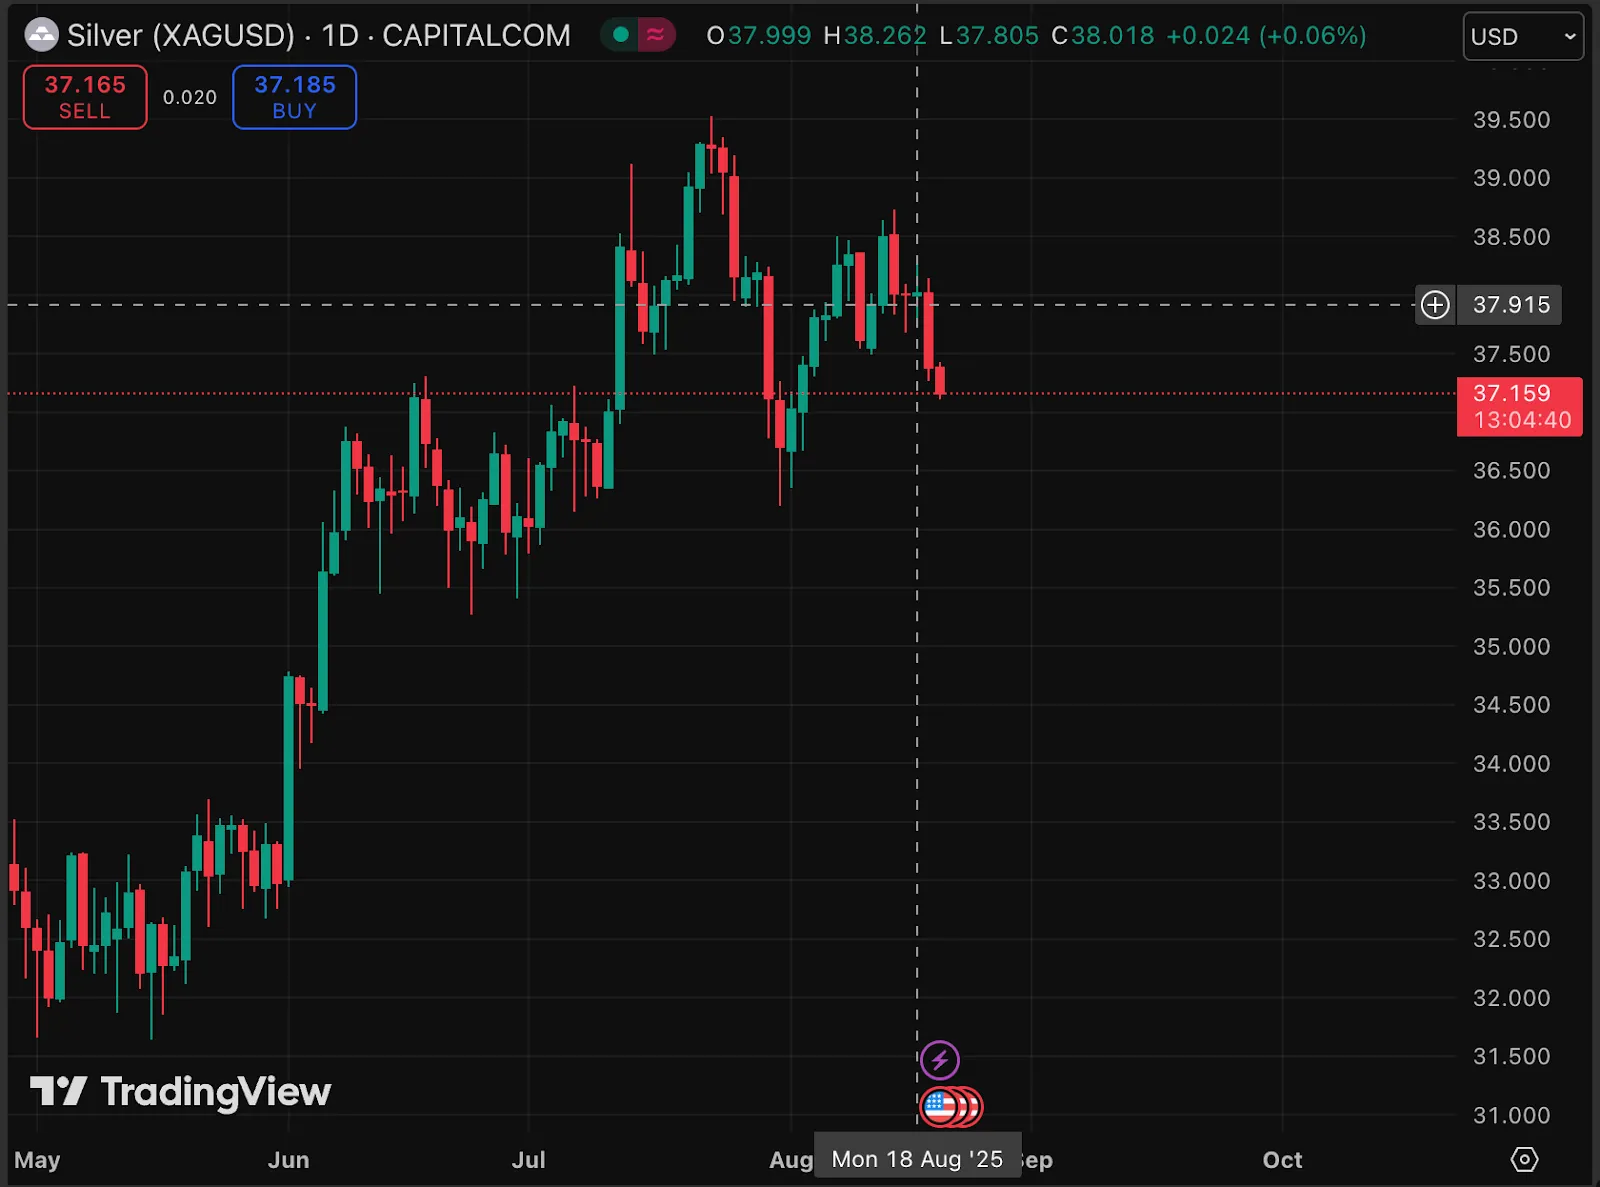
Alt text: Daily candlestick chart of Silver (XAG/USD) on TradingView from May to August 2025.
Source: TradingView
High prices have discouraged physical coin sales but boosted exchange-traded fund (ETF) inflows. This indicates that investors remain interested in exposure to silver but prefer financial instruments over physical purchases.
The divergence underscores a broader theme: while gold is increasingly policy-driven, silver is attracting demand through financial markets and industrial relevance, reshaping how each metal responds to macroeconomic conditions.
Gold price technical analysis
At the time of writing, gold is hovering around the $3,318 level after a notable downturn, with a death cross formation on the cards. This suggests the potential for a further downturn. However, the volume bars show dominant buy pressure, hinting at a possible upmove.
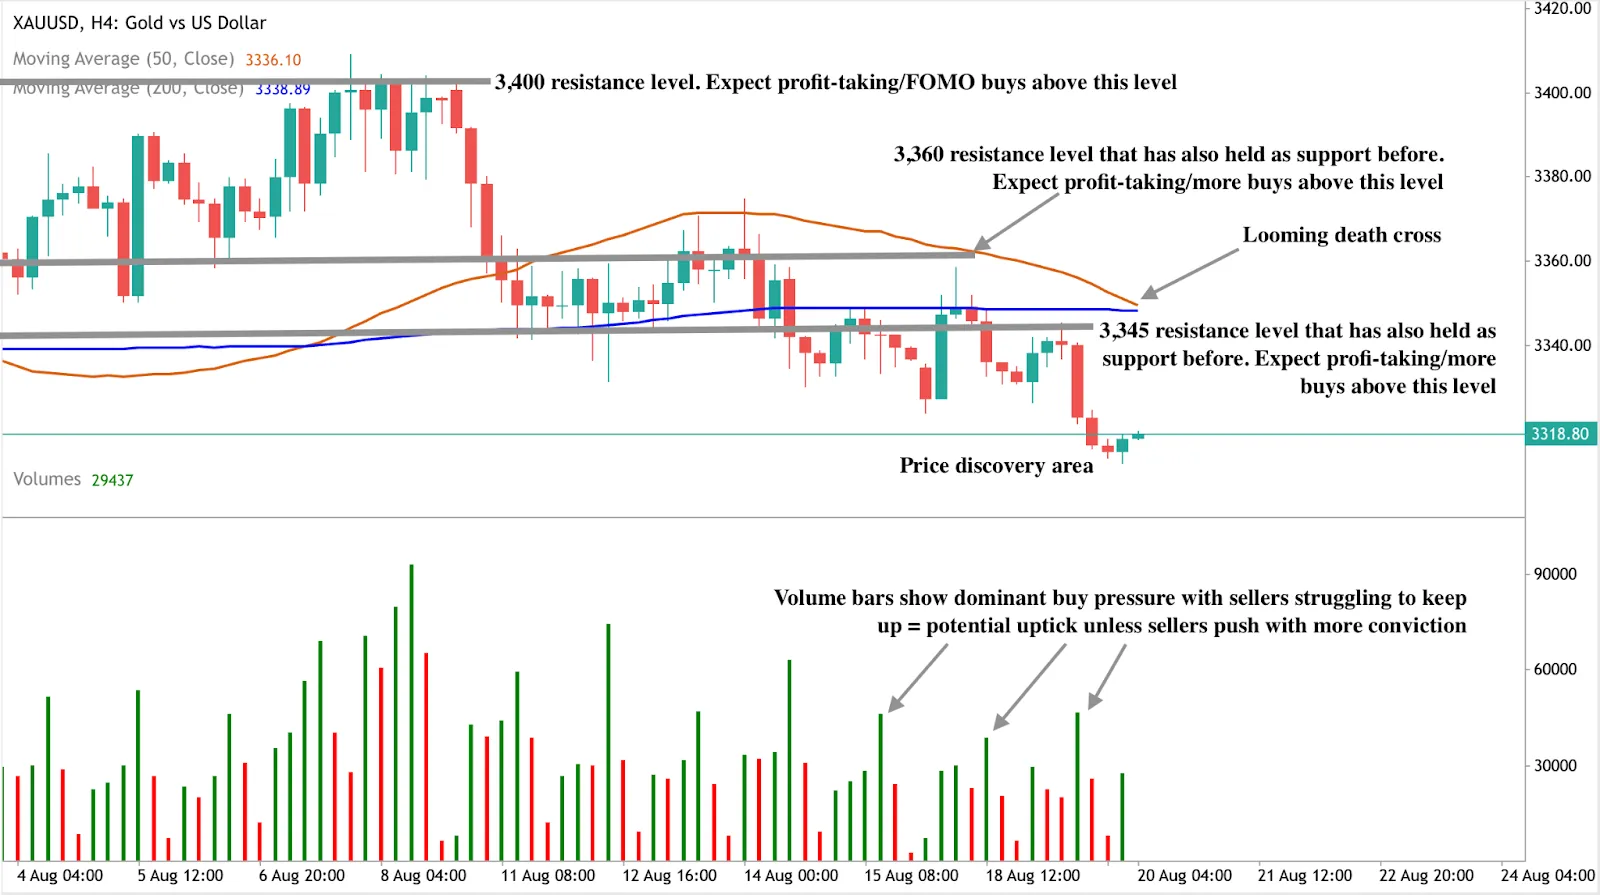
Alt text: Gold (XAU/USD) 4-hour candlestick chart with 50-day (orange) and 200-day (blue) moving averages, showing resistance levels at 3,345, 3,360, and 3,400.
Source: Deriv MT5
- If the death cross materialises, gold could see another leg down.
- If price action defies the looming formation, an uptick could target resistance at $3,345 and $3,360.
- A stronger rally would likely face a resistance wall near the $3,400 level.
Market impact and scenarios
- Bearish scenario: A confirmed death cross and break below $3,248 would signal a deeper trend change, reinforcing the Fed-driven bearish bias.
- Neutral scenario: Holding within the $3,282–$3,311 range would keep gold range-bound, awaiting Powell’s guidance and future inflation data.
- Bullish scenario: A dovish Fed shift or weakening dollar could trigger a rebound, supported by ongoing central bank buying.
Investment implications
For traders, gold’s technical setup highlights the $3,248–$3,400 zone as critical for near-term strategies. Short-term signals favour caution until Powell’s comments clarify the Fed’s direction.
For portfolio managers, gold is showing signs of an identity shift. Its safe-haven function is fading, with Fed policy cycles and central bank strategies increasingly dictating price action. While silver may offer more dynamic investor-driven opportunities, gold’s strategic role in central bank reserves ensures its long-term relevance.
Frequently asked questions
Why is the gold price under pressure?
Because the US dollar remains firm as the Fed resists aggressive rate cuts, reducing gold’s traditional safe-haven demand.
Is gold still a safe haven?
Recent muted reactions to geopolitical risks suggest gold is increasingly policy-driven rather than crisis-driven.
What role do central banks play?
They continue to accumulate gold, with China leading the way, providing long-term demand even as short-term momentum weakens.
How is silver behaving differently?
Silver’s high price has reduced coin sales but boosted ETF inflows, highlighting financial investor appetite.

What slowing U.S. manufacturing signals for EUR/USD traders in 2025
U.S. manufacturing contracted in July, raising stagflation concerns and putting pressure on the dollar.
U.S. manufacturing contracted in July, raising stagflation concerns and putting pressure on the dollar. The ISM Manufacturing PMI fell to 48.0 in July 2025, while new orders saw a slight boost to 47.1 compared to June’s 46.4. The employment index dropped slightly to 43.4. At the same time, prices paid for inputs remained elevated in July, signalling persistent inflation. This combination of weak growth and high prices leaves the Federal Reserve in a difficult position and places EUR/USD traders at a key turning point.
Key takeaways
- ISM Manufacturing PMI at 48.0 marks four straight months of contraction.
- New orders and employment index at 47.1 and 43.4% confirm industrial weakness.
- Input costs remaining elevated fuel stagflation risks, forcing a difficult Fed choice.
- Markets see an 83% probability of a September Fed rate cut, but inflation could delay.
- EUR/USD is trading in a buy zone, with potential support at 1.1590 and 1.1400 and resistance at 1.1731 and 1.1790.
U.S. manufacturing PMI slowdown highlights stagflation risk
The weakness in U.S. manufacturing has become one of the clearest signals that the economy is losing momentum. The PMI contraction underlines a decline in industrial demand, with new orders jumping slightly while employment in manufacturing slides further.

This erosion of the factory base matters because it traditionally anchors U.S. growth and supports dollar strength. At the same time, higher input costs show that inflationary pressures remain embedded. A prices-paid index nearing 64.8 means companies are paying more to produce less, a combination that squeezes margins and weighs on hiring.
Economists warn that this backdrop resembles the stagflation environment of the 1970s, when growth stalled but prices kept rising - a period that also saw sustained dollar weakness.
Fed policy dilemma and dollar outlook
The Federal Reserve now faces a familiar bind. On one hand, markets are pricing an 83% chance of a rate cut in September, with further cuts expected into October and December.

These expectations stem from the slowing economy, weak consumer sentiment, and falling industrial activity. On the other hand, stubborn inflation tied to higher input prices could push the Fed to keep rates steady or even maintain a hawkish tone to reassure markets.
This tug-of-war leaves the dollar exposed. Rate cuts would reduce its yield appeal and weaken the greenback, giving the euro an opportunity to extend gains. However, if the Fed signals hesitation or delays easing, the dollar could regain temporary strength and cap EUR/USD advances. Traders remain divided, with some positioning for long-term euro upside while hedging against near-term dollar rebounds.
Geopolitical drivers support euro resilience
Beyond U.S. domestic policy, geopolitics continues to shape the EUR/USD narrative. The Trump-Putin summit in Alaska raised the possibility of a Ukraine ceasefire, though no breakthrough has yet been confirmed. A durable peace agreement would be euro-positive by lowering global energy costs, improving confidence in Europe’s industrial base, and reducing risk premiums tied to the war.
Lower oil and gas prices, particularly, would benefit Germany and other energy-intensive Eurozone economies, restoring some of the competitiveness lost since 2022.
Analysts at UBS note that a meaningful de-escalation could propel EUR/USD toward 1.21 by year-end, adding to euro strength if Fed easing overlaps with geopolitical stabilisation.
Manufacturing policy uncertainty adds to risks
Tariffs and industrial policy are complicating the backdrop further. Trump’s sweeping tariffs on over 100 countries are raising costs for U.S. manufacturers instead of lowering them.
Economists warn that inconsistent trade policy - frequent changes, legal challenges, and lack of targeted focus - discourages long-term investment in factories. The Joint Economic Committee estimates nearly $490 billion in lost manufacturing investment by 2029 if tariff uncertainty persists.
This matters for FX markets because a weaker, less competitive U.S. manufacturing base reduces long-term support for the dollar. Unlike targeted policies under the Biden administration (which boosted semiconductors and EV investment), broad tariffs without a clear industrial direction risk creating short-term volatility while eroding long-term competitiveness.
EUR/USD technical levels
At the time of writing, the pair is seeing a downturn within a buy zone - hinting at a potential move up. This bullish narrative is buttressed by volume bars showing dominant buy pressure that could be countered if sellers push with conviction. If sellers push down further, we could see the prices held at 1.1590 and 1.1400. Conversely, if the upmove resumes, we could see bulls held at the 1.1731 and 1.1790 resistance levels.

Investment implications
For traders, the current backdrop combines short-term uncertainty with medium-term opportunity. U.S. factory weakness and stagflation risks suggest the dollar’s structural strength is eroding, particularly if the Fed is forced to ease rates. However, sticky inflation could provide short bursts of dollar support, keeping EUR/USD capped until clearer policy signals emerge.
A tactical approach may favour buying dips above 1.1590 with an eye on a breakout if geopolitical conditions improve. Longer-term, a Ukraine peace agreement combined with Fed rate cuts could push EUR/USD toward the 1.20–1.21 range by late 2025, while persistent policy uncertainty around U.S. tariffs and manufacturing investment will remain a drag on
Frequently asked questions
Why does slowing U.S. manufacturing matter for EUR/USD?
Because weak growth reduces dollar demand while inflation complicates Fed policy, leaving the greenback vulnerable.
What is stagflation, and why is it relevant here?
It is when low growth coincides with high inflation, limiting central bank options and historically weakening the dollar.
Could a Ukraine peace deal affect EUR/USD?
Yes. A ceasefire would lower energy costs, boost Eurozone confidence, and strengthen the euro.
Where are the key EUR/USD levels now?
Support is at 1.1590 and 1.1400. Resistance is at 1.1731 and 1.1790.

Is Intel’s stock price surge a turning point or a temporary boost?
While the surge lifted Intel’s year-to-date gain to 19%, unusual trading activity before the announcement has fuelled insider speculation, raising questions about whether the move is sustainable or short-lived.
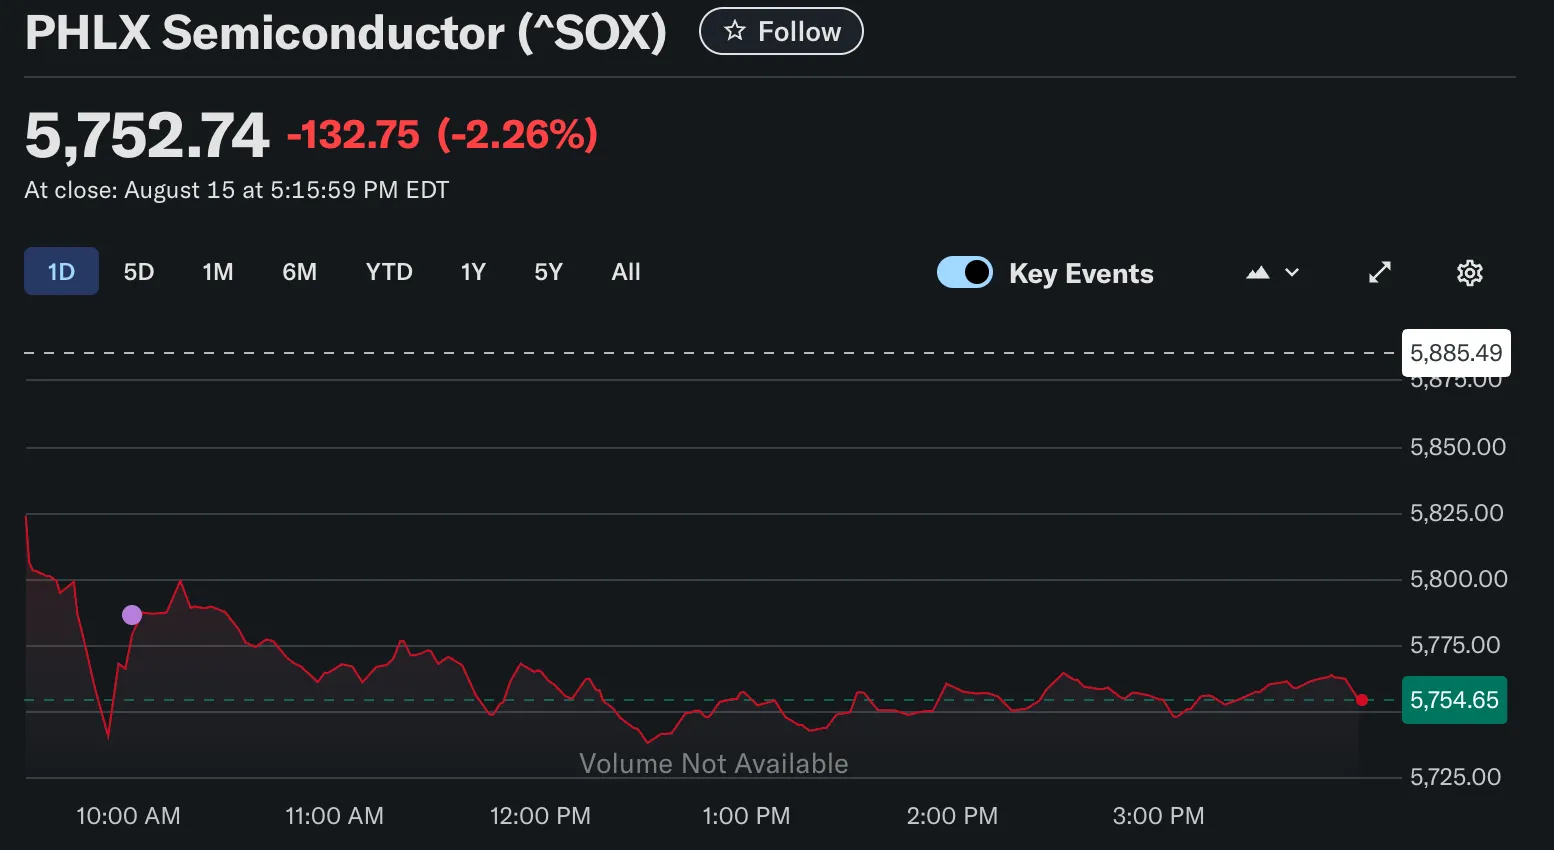
Intel shares surged following reports that the Trump administration may invest directly in the chipmaker. The rally came even as the broader PHLX Semiconductor Index fell more than 2%, highlighting Intel’s unusual strength in a weak sector. While the surge lifted Intel’s year-to-date gain to 19%, unusual trading activity before the announcement has fuelled insider speculation, raising questions about whether the move is sustainable or short-lived.
Key takeaways
- Intel shares rose 8.9% to $24.20 on reports of potential U.S. government investment, bucking a semiconductor sector decline.
- President Trump signalled tariffs of 200%–300% on imported chips, boosting hopes of domestic industry support.
- Intel CEO Lip-Bu Tan met Trump days before the rally, though Trump had previously criticised him over alleged China ties.
- Unusual call option activity before the announcement raised suspicions of insider trading.
- Analysts see government support as a potential “lifeline” for Intel, but retail investors question market fairness.
- Intel’s Ohio fab project and 14A process development are central to government stakeholder discussions.
Intel’s rallies strongly amid sector weakness
Intel’s surge was notable because most chip stocks were under pressure after Trump threatened steep new tariffs on imported semiconductors, promising rates of 200%–300% “next week or the week after.”
The comments rattled the sector, sending the PHLX Semiconductor Index down more than 2%. Intel, however, was among the few to rise - a reaction tied to reports that the U.S. government is considering taking a direct equity stake in the firm.
The potential investment could be partially funded by the CHIPS Act, despite Trump’s earlier criticism of the programme. Talks reportedly accelerated after Intel CEO Lip-Bu Tan met with Trump on 11 August. The meeting was controversial: just days earlier, Trump had publicly called for Tan’s resignation, citing alleged ties to China.
Intel’s rally was preceded by some suspicious trading
Intel’s rally was preceded by unusual call option activity. Significant volumes traded in the days before the government stake reports surfaced, with prices favouring sellers who likely made millions.
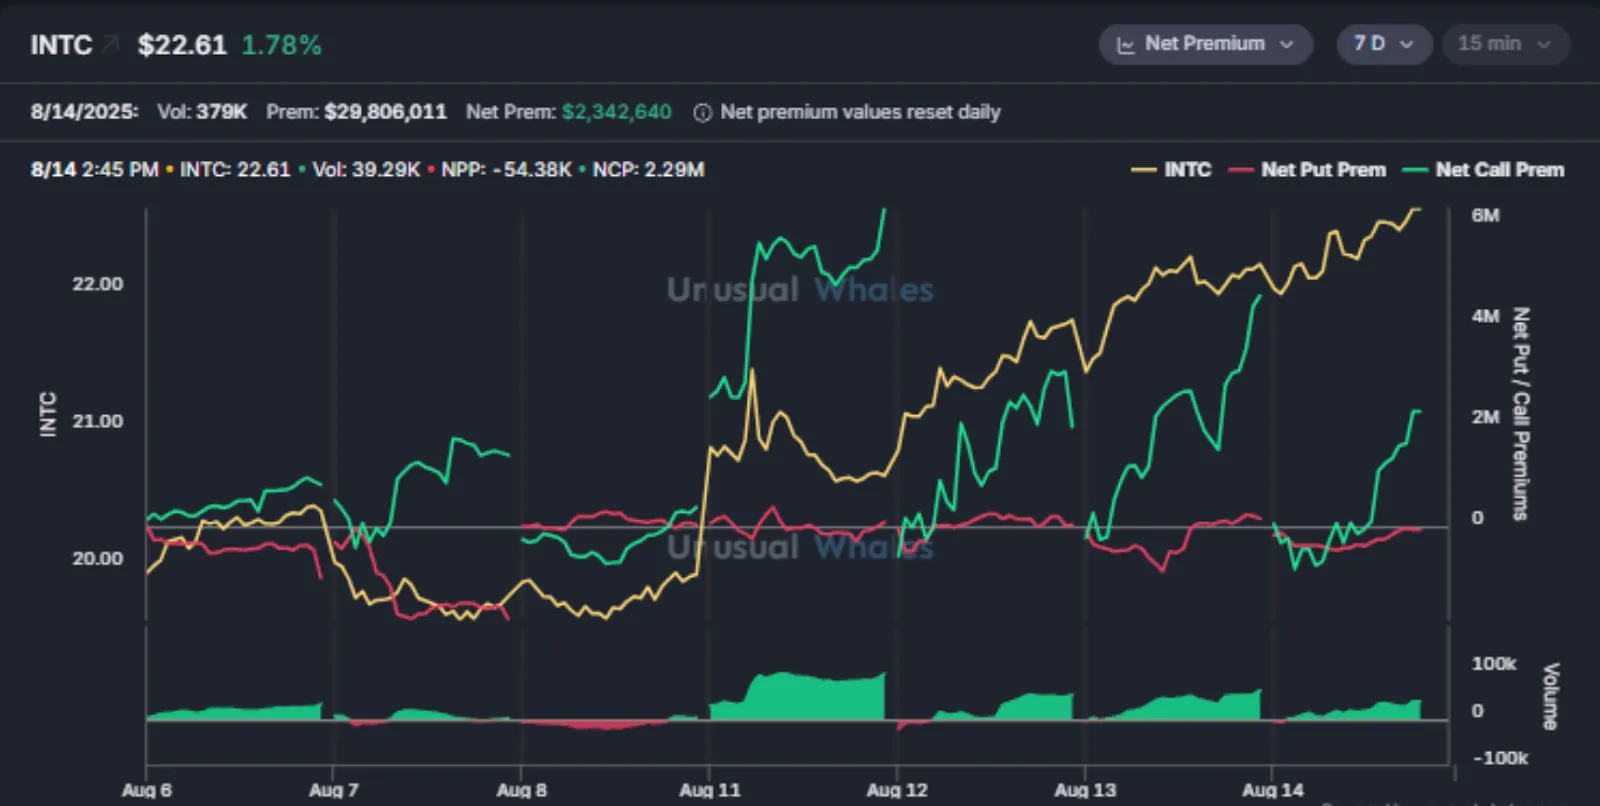
This has fuelled speculation that some investors had advance knowledge of the announcement. Research published in the Journal of Financial Economics in 2021 found that abnormal option trading volumes increase by up to 50% in the one to three days before major corporate news. Intel’s case fits this pattern closely.
Yet, despite these signals, enforcement remains inconsistent. A 2023 ScienceDirect study found the SEC only pursues around 60% of identified insider trading cases, leaving a gap that undermines retail investor confidence. For many, Intel’s spike reinforces the perception that the market rewards insiders while leaving ordinary traders reacting after the fact.
Government stake in chipmakers as a strategic shift
Analysts say a direct government stake could provide Intel with critical support. Bernstein’s Stacy Rasgon noted that U.S. backing could help fund Intel’s 14A process - a next-generation chip architecture aimed at narrowing the gap with rivals Nvidia and TSMC. It would also provide capital to sustain costly fab construction, particularly Intel’s $20 billion Ohio project, which has faced repeated delays.
But questions remain about what the government might want in return. In recent months, the administration has forced Nvidia and AMD into revenue-sharing agreements, requiring both companies to hand over 15% of Chinese revenues in exchange for export licences on AI chips. Similar arrangements could be sought from Intel in exchange for support.
Intel’s US chip manufacturing struggles
Intel’s market value has fallen by more than half since 2020, down to $107 billion.

Intel has lost ground in the AI race, with Nvidia seizing leadership in high-performance GPUs and AI accelerators. It has also faced cancelled factory projects in Germany and Poland, and delays to its flagship Ohio fab have hampered U.S. efforts to build domestic chipmaking capacity.
Former CEO Pat Gelsinger had begun an ambitious push to expand Intel’s global manufacturing footprint but stepped down in December 2024 after cash burn and repeated setbacks. Lip-Bu Tan, who took over in March 2025, has emphasised financial discipline and a renewed focus on catching up in AI.
Some analysts, including Jim Cramer and Morningstar’s Brian Colello, argue that Intel “needs the help.” Cramer noted a government stake could complete projects that Gelsinger started but could not afford to finish.
Toward U.S. state capitalism?
The reported move would represent a break with the U.S.’s traditional laissez-faire approach. Recent actions suggest a shift toward state capitalism, with Washington intervening directly in strategic industries:
- The Department of Defense bought $400 million in preferred shares of MP Materials, a rare earths miner.
- A “golden share” was taken to allow Nippon Steel’s acquisition of U.S. Steel.
Globally, this mirrors models in Asia. Taiwan’s sovereign wealth fund holds 6.4% of TSMC, providing a precedent for governments directly supporting chipmakers.

Analysts such as David Nicholson of Futurum Group say Intel could be a “special case,” strategically vital to U.S. competitiveness in semiconductors and national security.
Market implications for investors
Intel’s sharp rise highlights optimism around a potential government-backed rescue. But the company’s underlying challenges - delayed projects, shrinking market share, and heavy cash burn - remain unresolved.
For retail traders, the episode underscores both opportunity and risk. If government support is confirmed, Intel could stabilise its finances and invest in catching up technologically. If talks stall or fail, the rally could fade quickly, leaving late buyers exposed.
Intel stock technical analysis
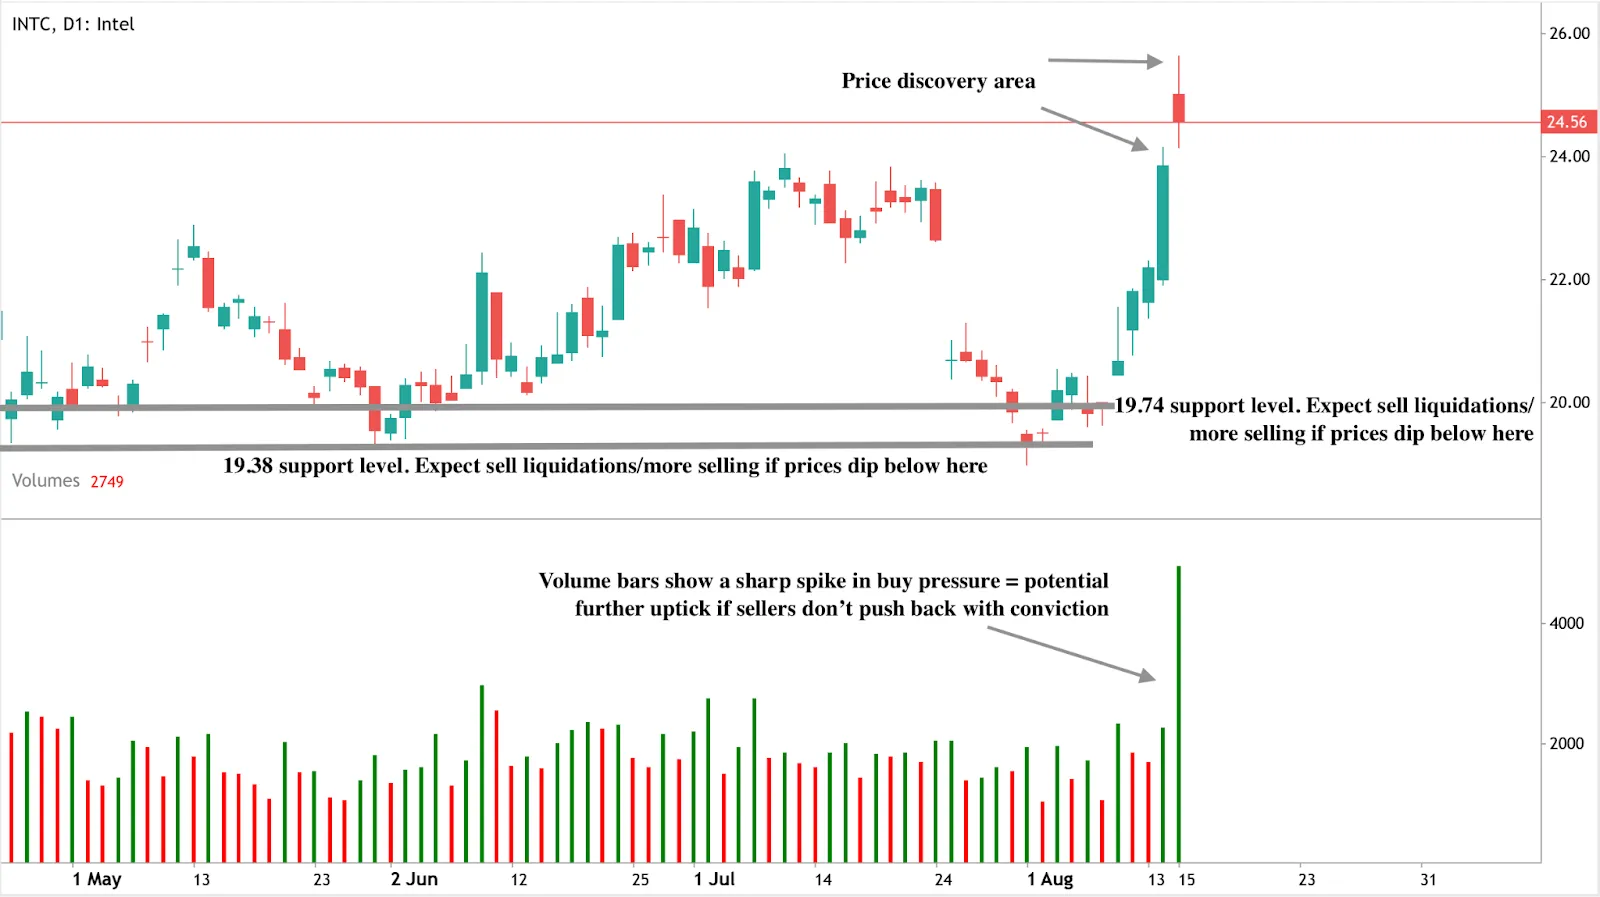
At the time of writing, the stock price is seeing some retreat after a sharp rally and is in price discovery mode. Despite the retreat, volume bars show a sharp spike in buy pressure - hinting at a further price uptick. Should we see a further uptick, prices could surge towards the $26.00 mark. Conversely, if sellers pile on the pressure, we could see prices held at the $19.74 and $19.38 support levels.
Investment implications
- Short term: Intel’s stock could remain volatile as headlines around tariffs and stake talks continue. Traders should watch for signs of confirmation from Washington.
- Medium term: If government support materialises, Intel could stabilise its balance sheet and fund its 14A chip development. Without it, cash burn and fab delays may pressure shares.
- For retail investors: The Intel case underscores the importance of monitoring not just headlines but also unusual trading flows that can signal insider activity.
Frequently asked questions
Why did Intel stock surge in August 2025?
This is because of reports that the Trump administration may take a direct stake in Intel and Trump’s announcement of possible 200%–300% tariffs on imported chips.
What raised speculation of insider trading?
A surge in call option trading volumes was detected before the government stake news, consistent with historical insider trading patterns.
What does the government want from Intel in return?
Analysts suggest possible revenue-sharing arrangements or strategic guarantees, similar to deals imposed on Nvidia and AMD.
Why is Intel’s Ohio project central to this?
The $20 billion facility is critical to U.S. chipmaking ambitions, but delays and funding shortfalls have slowed progress.
Is this common in the U.S. market?
No. Direct equity stakes by the U.S. government in private companies are rare, but have recently increased in strategic sectors like steel and rare earths.

Are global oil prices heading for a $50 price floor?
According to the IEA, global oil supply is set to outpace demand growth by a wide margin in 2025 and 2026, raising the prospect of a multi-million barrel per day surplus.
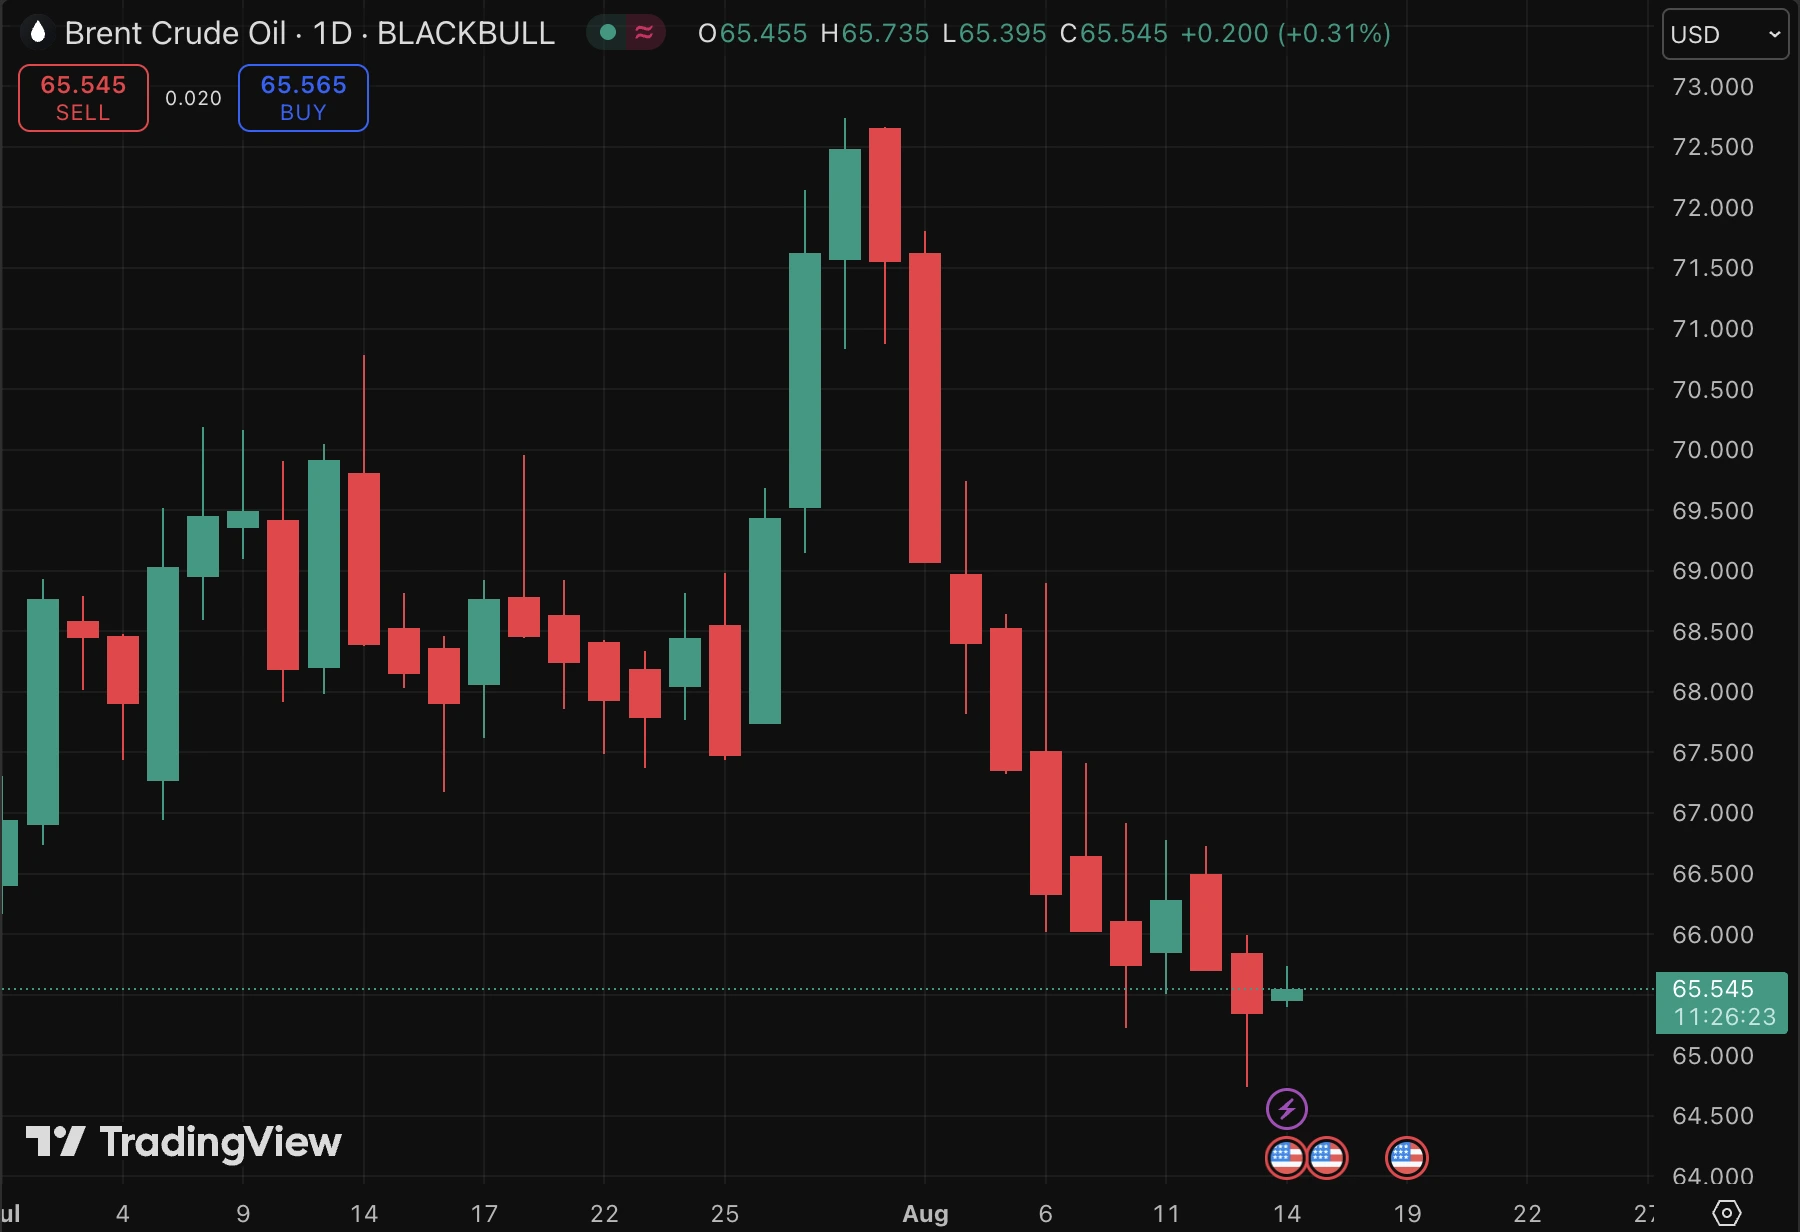
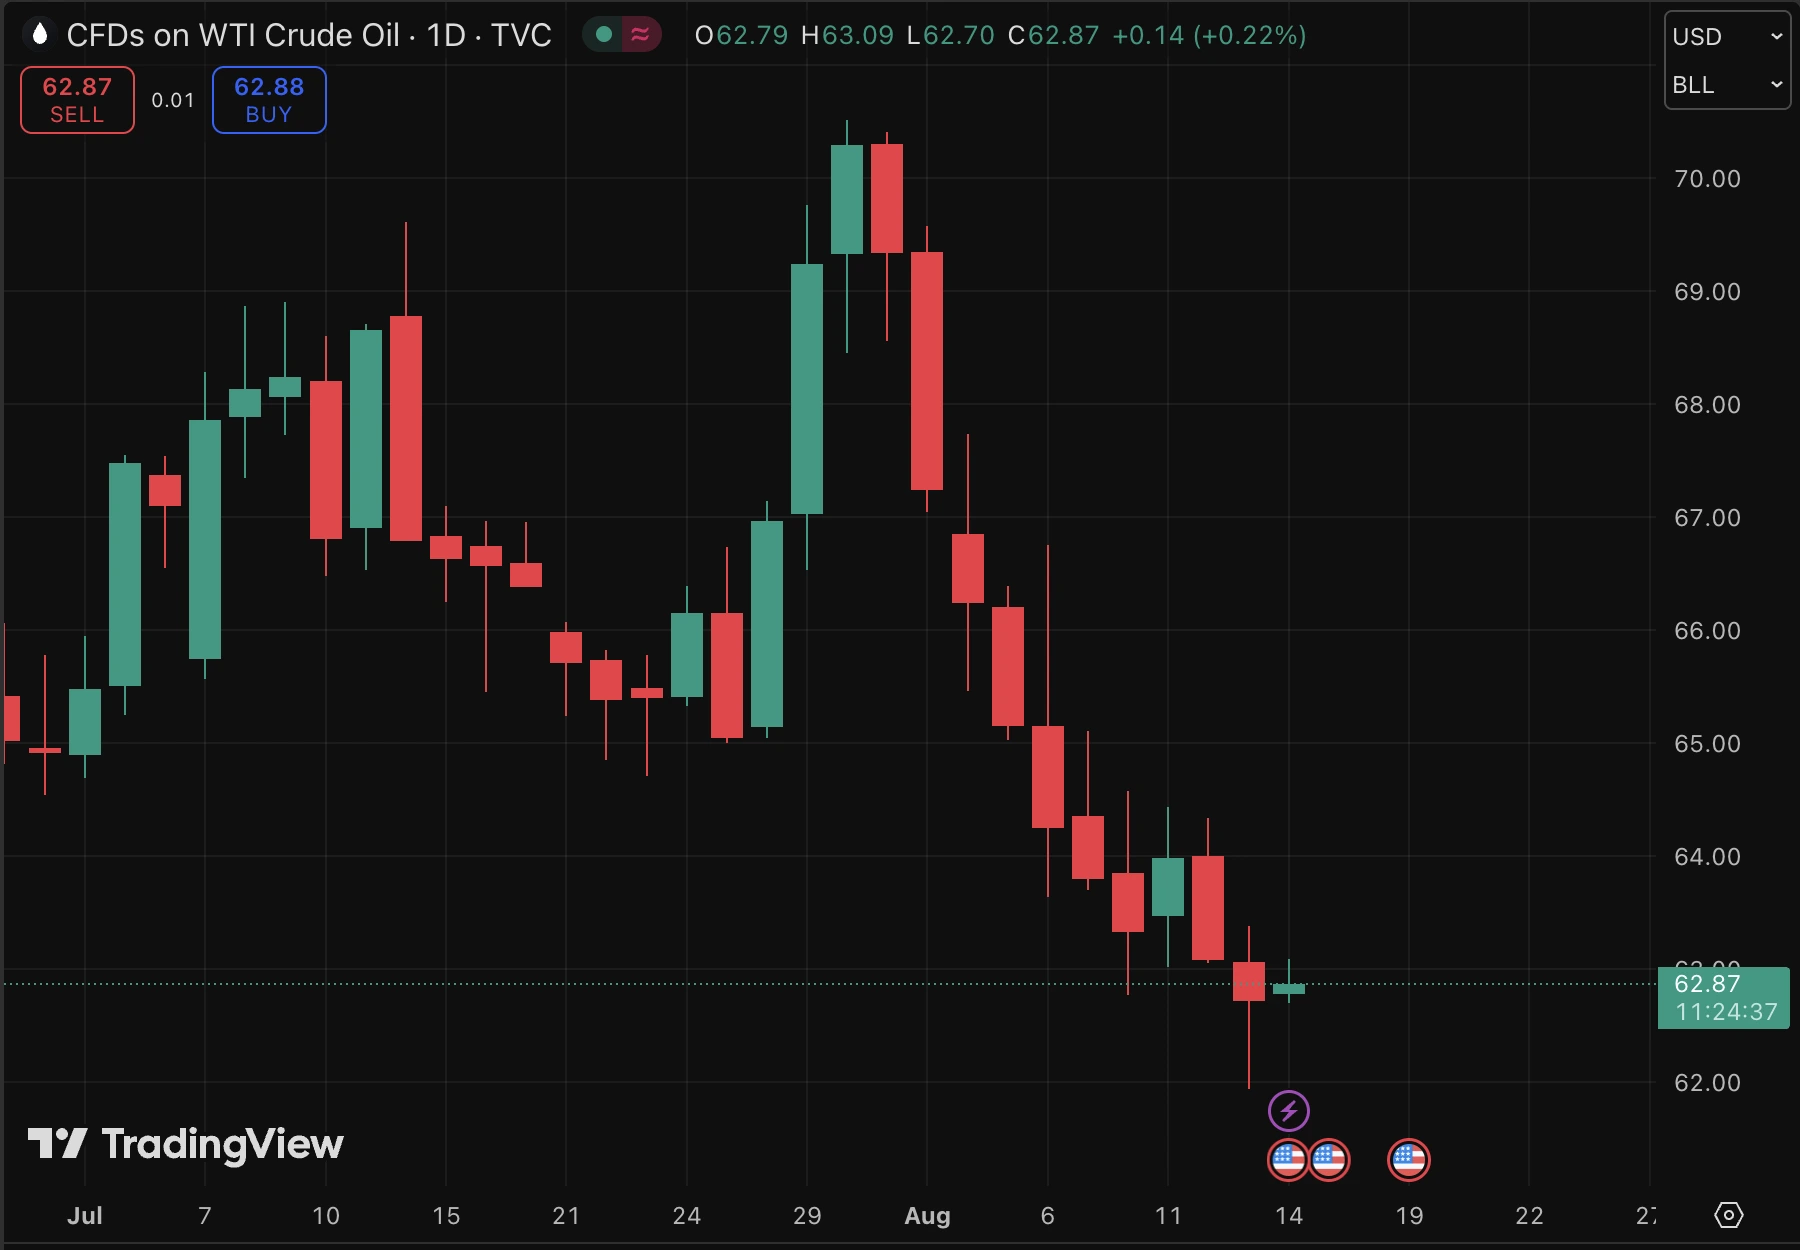
According to the International Energy Agency (IEA), global oil supply is set to outpace demand growth by a wide margin in 2025 and 2026, raising the prospect of a multi-million barrel per day surplus. Brent crude has already fallen below $66 per barrel, with West Texas Intermediate (WTI) near $62 - levels not seen in over two months.
The combination of record U.S. production, faster-than-expected OPEC+ output increases, and weaker demand forecasts is creating a supply-heavy environment that could push prices towards a $50 per barrel floor unless significant geopolitical disruptions tighten the market.
Key takeaways
- Record U.S. oil output of 21 million bpd in 2025 despite fewer rigs, driven by shale efficiency and technology.
- OPEC+ unwinding cuts early, adding more barrels into the market alongside strong growth from the U.S., Brazil, Canada, and Guyana.
- IEA demand growth forecasts for 2025 and 2026 are less than half OPEC’s, at +0.68m and +0.70m bpd, citing weak consumer confidence.
- A 2026 surplus projection of nearly 3 million bpd - larger than the pandemic-era glut - could pressure prices into the $50s.
- Short-term bullish risks include sanctions on Russia and Iran and Chinese stockpiling for energy security.
- Goldman Sachs base case sees Brent averaging $64 in Q4 2025 and $56 in 2026.
OPEC production increases are overwhelming the market
The IEA’s August 2025 monthly report revised global oil supply growth higher: +2.5 million bpd in 2025 (from +2.1 million) and +1.9 million bpd in 2026.\
This is being driven by two main forces:
- As reported by Reuters, OPEC+ production increases after deciding to unwind recent output cuts faster than planned.
- Non-OPEC growth led by the U.S., Canada, Brazil, and Guyana.
In the U.S., total oil liquids production has seen unprecedented growth. This growth has been achieved with 50% fewer fracking crews than in 2022, thanks to extended-reach drilling, faster well completions, and tapping drilled-but-uncompleted wells (DUCs).
IEA says oil demand growth is slowing
The IEA expects oil demand to grow by just 680,000 bpd in 2025 and 700,000 bpd in 2026 - both 20,000 bpd lower than its prior forecast. Weakness is concentrated in major economies where consumer confidence remains low.
OPEC, however, projects nearly double the demand growth in 2025 at +1.29 million bpd, creating a stark divergence in market outlooks. The IEA’s more conservative stance reflects its assumption of a faster shift to renewables, while OPEC sees continued strong transport fuel demand in emerging markets.
The 2026 glut warning
The IEA projects a potential supply surplus of almost 3 million bpd in 2026, driven mainly by non-OPEC growth. This would surpass the 2020 pandemic-era glut, which sent prices crashing.
Brent’s drop below $66 and WTI’s fall to $62 this week reflect investor concern that even with record refining runs - forecast to reach 85.6 million bpd in August - the market may not absorb the extra crude.
Geopolitics could slow the fall
Political risks remain a wildcard:
- Sanctions on Russia and Iran could restrict output from the world’s third- and fifth-largest producers.
- China’s stockpiling for energy security absorbed surplus barrels earlier this year.
- Trump - Putin - Ukraine talks could introduce further volatility if new measures target Russian exports.
Goldman Sachs sees these factors as potential short-term supports but still expects Brent to average $64 in Q4 2025 before falling to $56 in 2026.
Market impact and price scenarios
If the projected surplus materialises and demand fails to accelerate, Brent could test the $50–$55 range in 2026, according to analysts. However, unexpected supply cuts or geopolitical disruptions could keep prices above $60.
For now, the balance of risk is skewed towards lower prices as supply growth continues to outstrip demand.
Oil price technical analysis
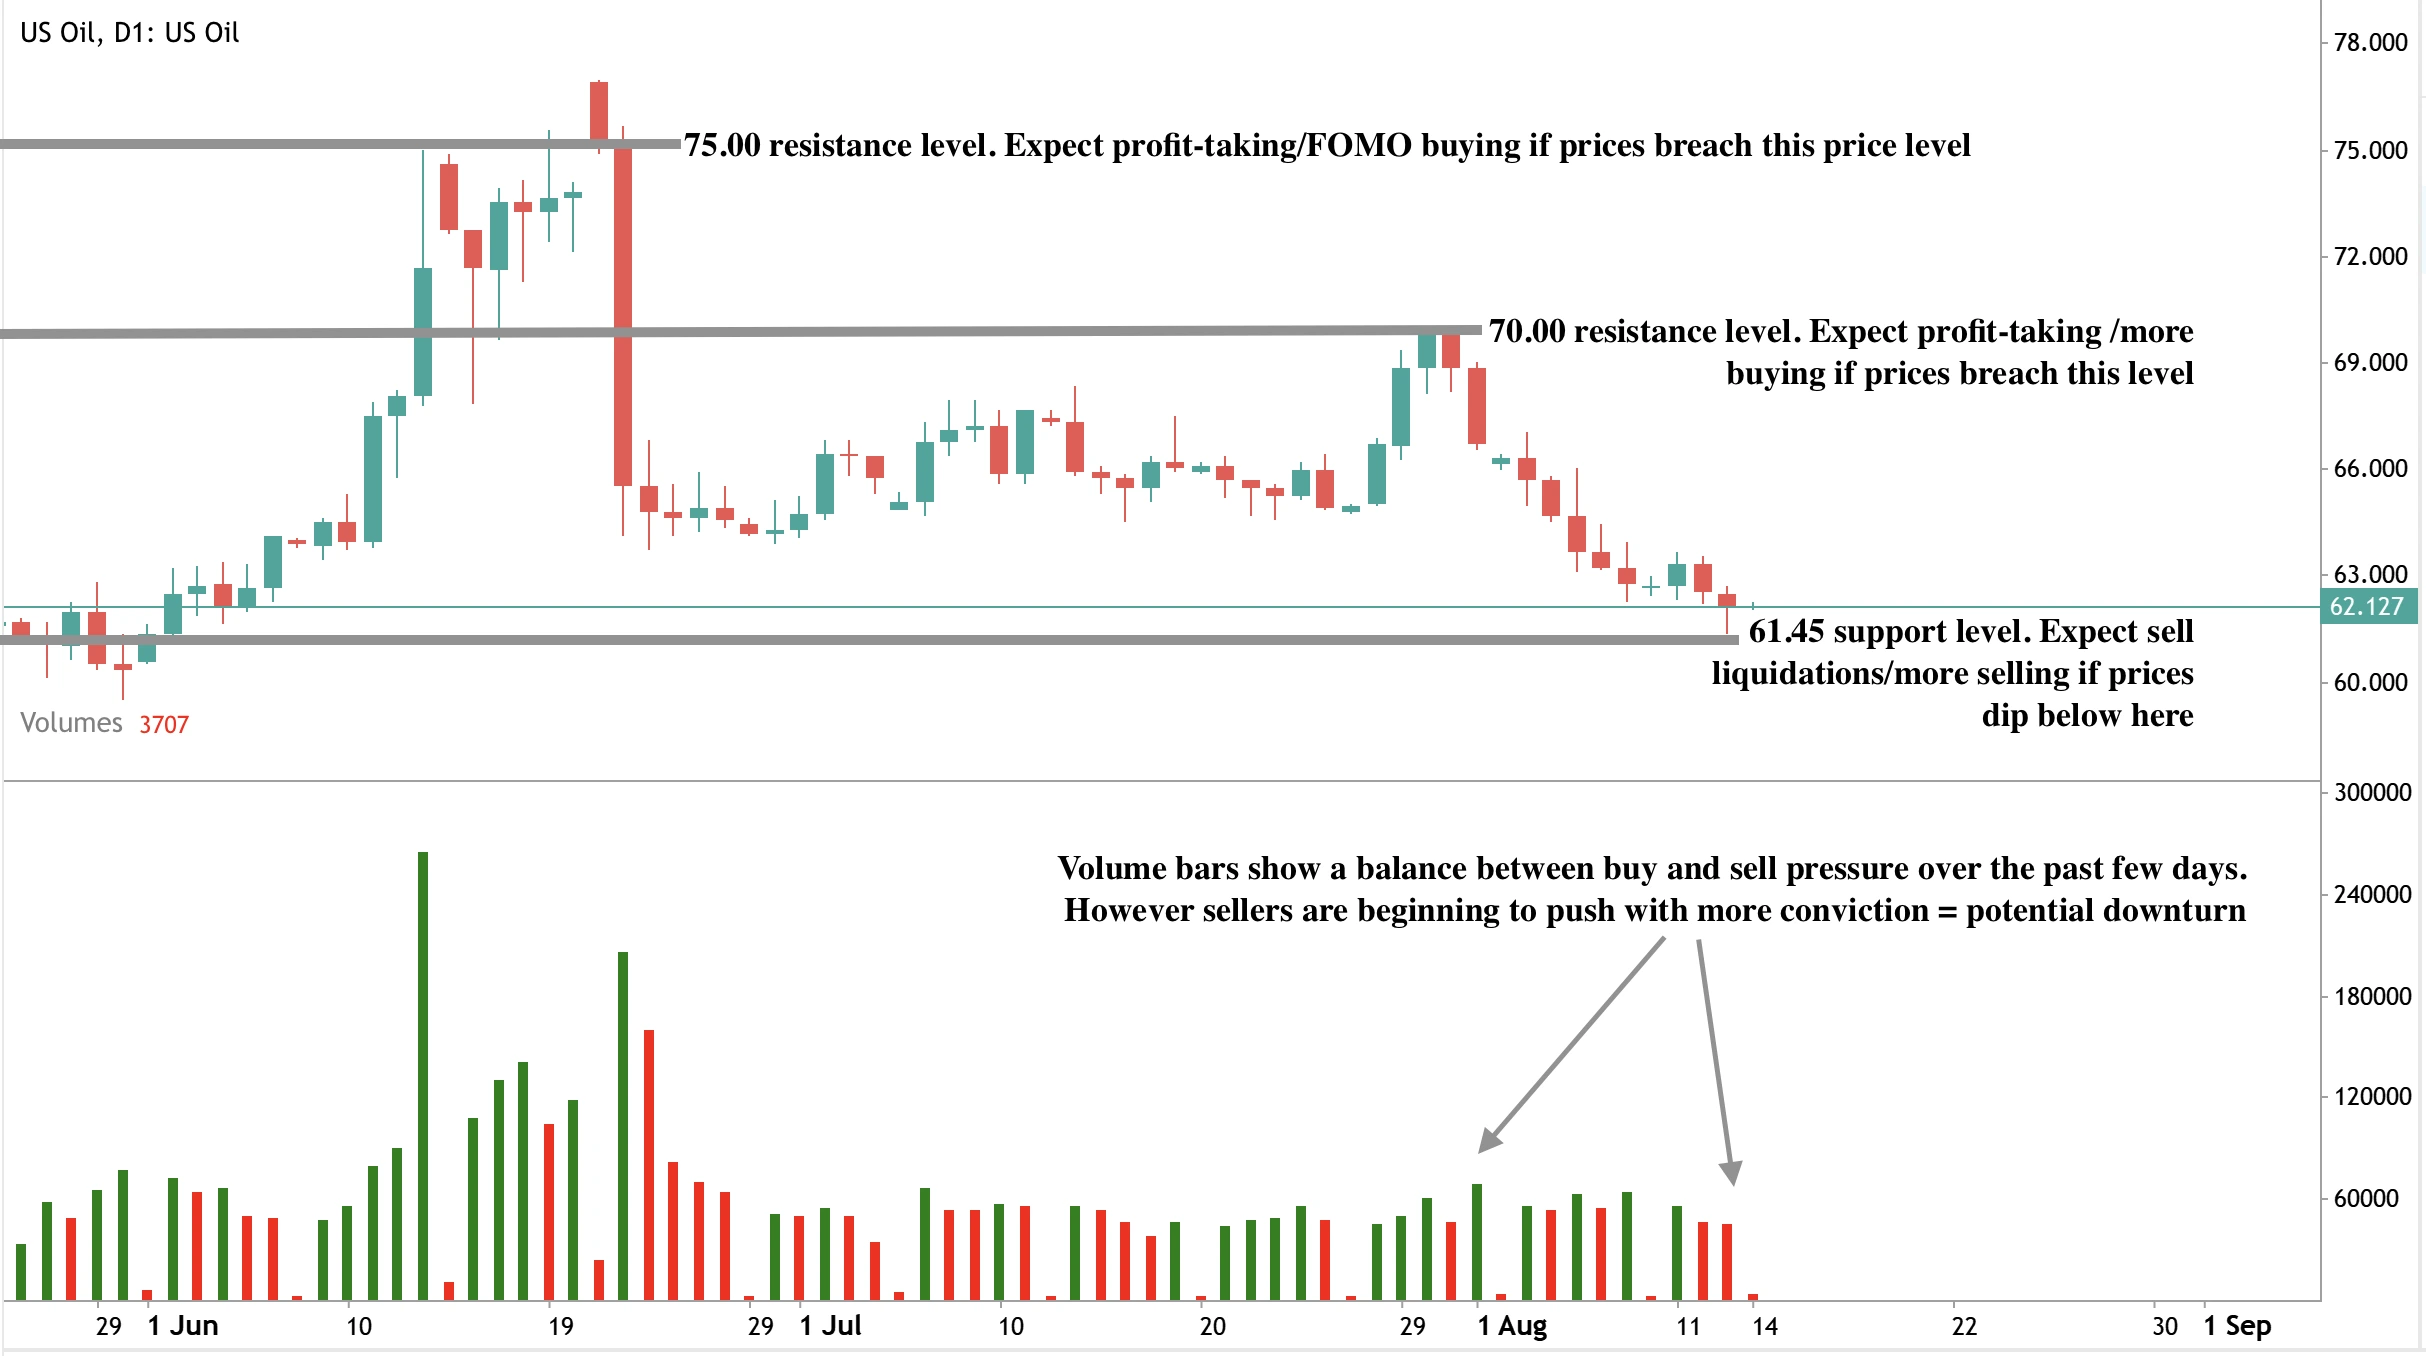
At the time of writing, oil prices are dipping near a significant support level - hinting that we might see a price rebound if prices touch the $61.45 support level. However, volume bars show that sellers are putting up a spirited fightback against buy pressure - suggesting that we could see a downturn unless buyers pick up momentum. If buyers shrug off the news, prices could see a significant rise with resistance levels at $70.00 and $75.00.
Investment implications
For traders and portfolio managers, the current oil market setup suggests heightened downside risk over the medium term, with a clear bias towards prices moving into the $50–$55 range in 2026 if the projected surplus materialises.
- Short-term strategies may favour tactical buying near strong support levels like $61.45 if geopolitical headlines or sanctions provide temporary price boosts.
- Medium-term positioning should account for the IEA’s bearish demand outlook and the potential for prolonged oversupply, which could keep rallies capped below $70–$75.
- Energy equities tied to U.S. shale and low-cost producers may outperform due to their efficiency and resilience, while higher-cost offshore projects could face margin pressure.
Refining companies could remain profitable given record processing volumes, even if crude prices weaken further.
Trade the next movements of oil with a Deriv MT5 account today.
Frequently asked questions
Why could oil prices fall to $50?
Because global supply is rising nearly four times faster than demand, creating a large surplus that could depress prices into the $50 range.
Which countries are driving supply growth?
The U.S., Canada, Brazil, and Guyana lead non-OPEC growth, while OPEC+ is adding barrels faster than initially planned.
What could prevent a drop to $50?
Sanctions on major producers, Chinese stockpiling, or unexpected demand rebounds could tighten the market and keep prices above $60.
How does refining activity fit into this?
Refining runs are at record highs, but they will not be enough to absorb the projected surplus if the crude supply continues to accelerate.

Why Nvidia's market value surpassed the UK stock market
According to LSEG data, Nvidia’s market value has surged past $4 trillion, overtaking the combined worth of every publicly listed company in the United Kingdom.
According to LSEG data, Nvidia’s market value has surged past $4 trillion, overtaking the combined worth of every publicly listed company in the United Kingdom. The AI chipmaker’s dominance in high-performance computing, combined with record demand for artificial intelligence infrastructure, has made it the most valuable publicly traded company in history and the single largest driver of S&P 500 performance. At 7.3% of the index, Nvidia now has more influence over US equity benchmarks than any other stock in decades.
Key takeaways
- Nvidia’s $4 trillion market cap is larger than the total value of the UK’s stock market.
- The company controls 92% of the discrete GPU market and supplies AI infrastructure to Microsoft, Amazon, and Google.
- Nvidia’s rally has been a key contributor to the S&P 500 breaking above 6,400 for the first time.
Nvidia’s GPU market share and AI leadership drive valuation
Nvidia’s record valuation is built on its control of the high-performance GPU market - hardware critical for training and deploying large-scale AI systems. In 2025, industry data from Statista showed the company commanding 92% of the discrete GPU market, with its chips powering AI data centres worldwide.
Its Q1 2025 revenue reached $44.1 billion, up 69% from a year earlier, and its Q2 guidance is set at $45 billion ± 2%.
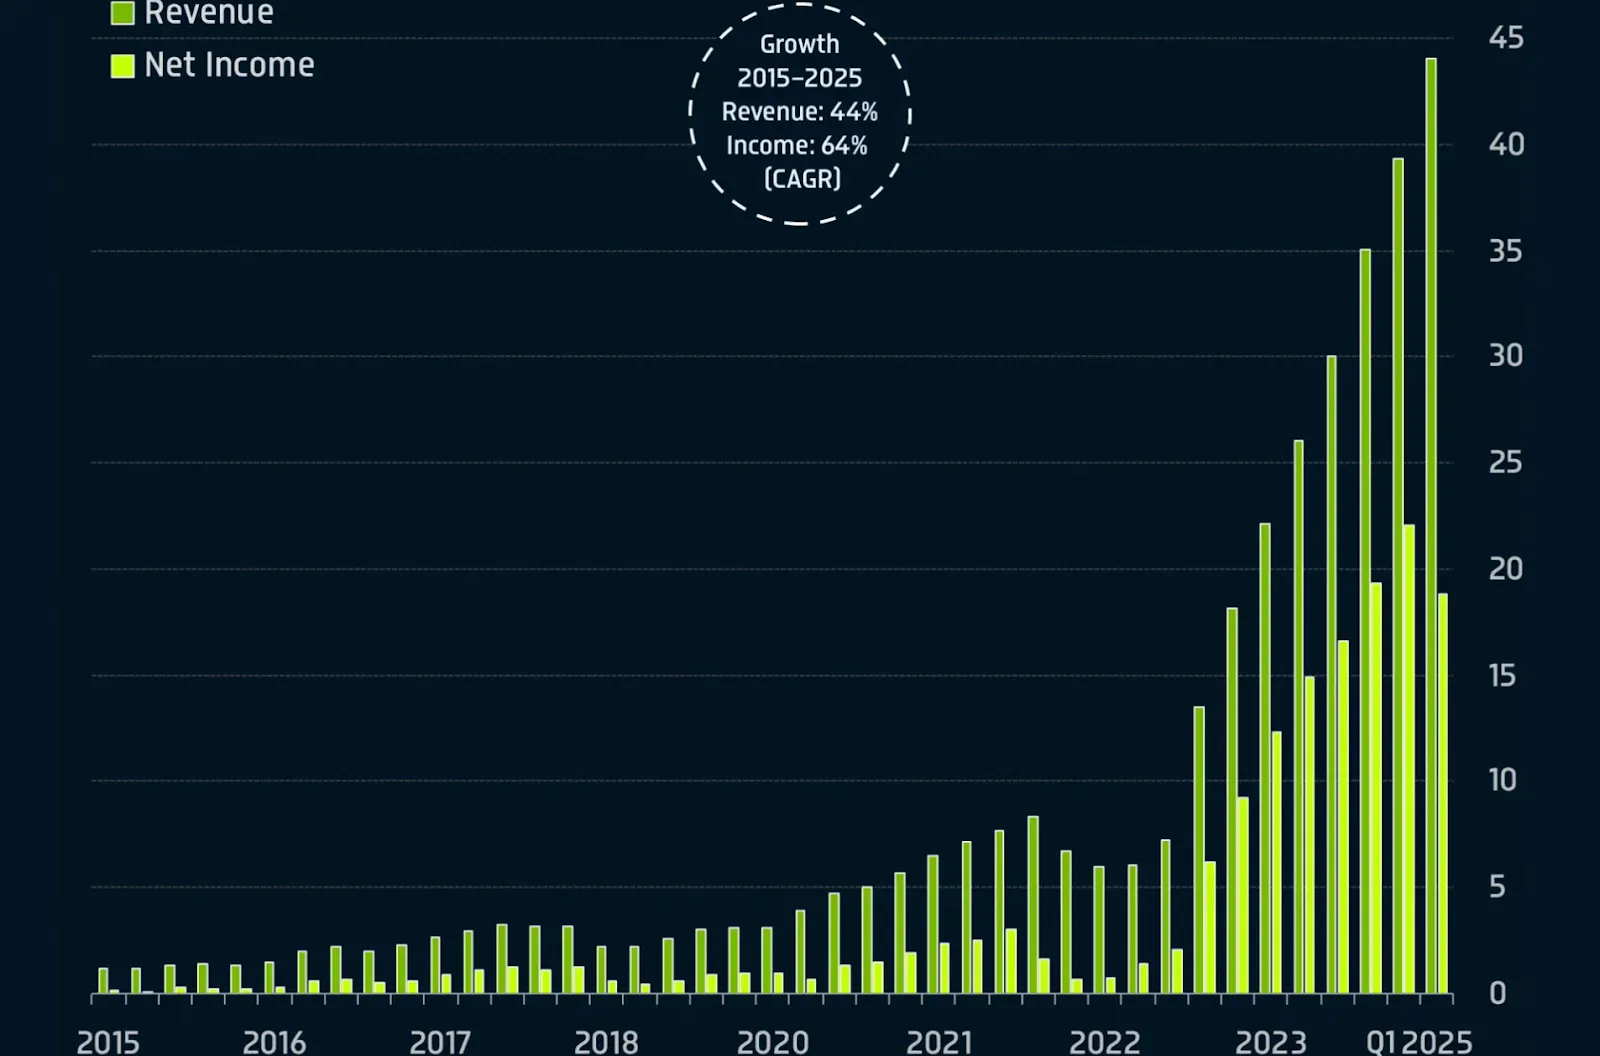
These figures underscore the scale of the AI boom, where companies are shifting billions in spending toward computational power. Nvidia’s CUDA software platform has become the industry standard for AI development, effectively locking in developers and enterprises to its ecosystem.
The scale of this dominance means that Nvidia alone is now worth more than the UK’s entire public market, which includes major global names such as Shell, HSBC, AstraZeneca, and BP. This valuation gap highlights the extent to which investors are betting on AI as the next major economic growth driver.
Nvidia’s AI dominance is driving the S&P 500 to record highs
The broader market impact of Nvidia’s rally has been historic. On 12 August 2025, the S&P 500 closed above 6,400 for the first time ever, capping a four-month surge that added $13.5 trillion in market value.
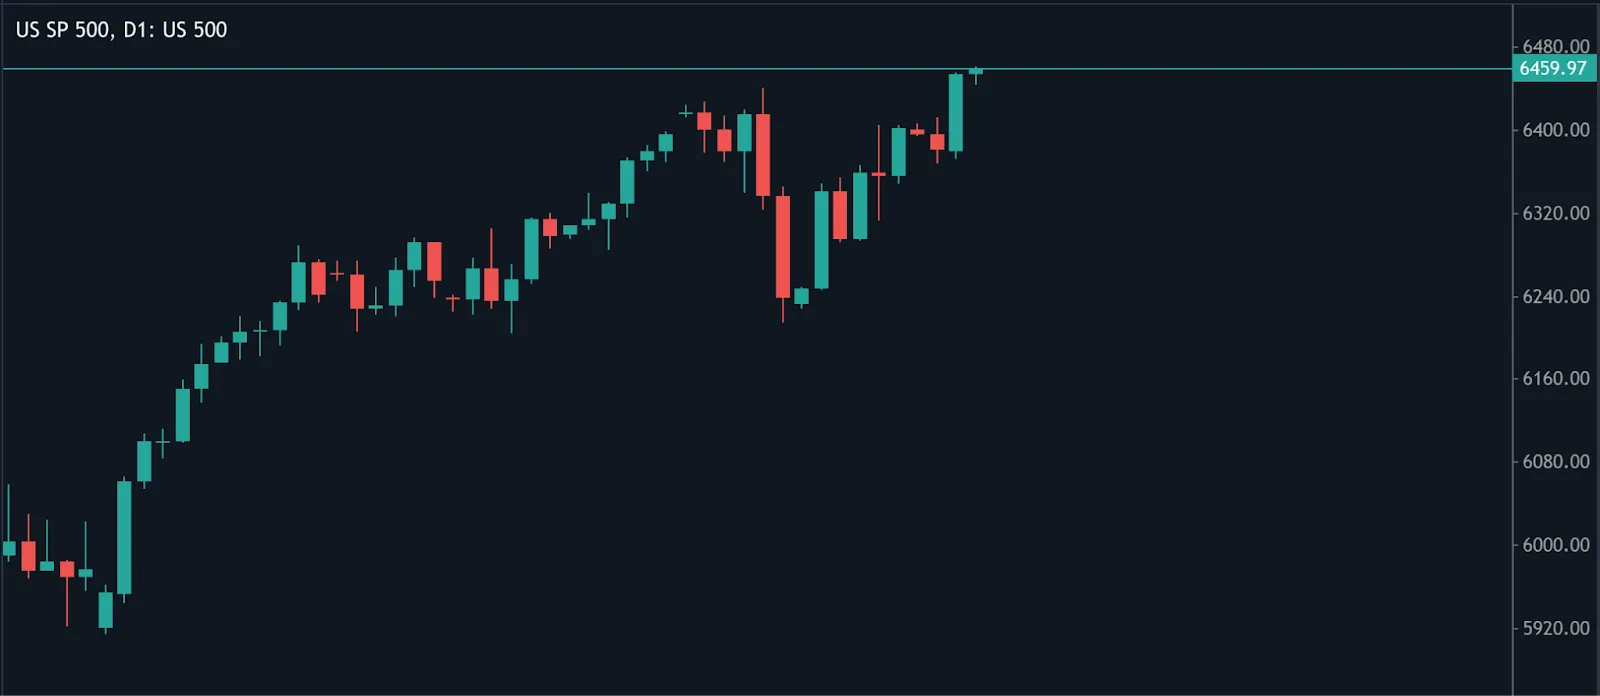
Analysts point to a combination of moderating headline inflation and aggressive rotation into technology stocks as the catalysts, with Nvidia at the centre of both trends.
Its outsized index weighting means Nvidia’s share price moves can account for a significant portion of the S&P 500’s daily changes. For example, an 8.2% gain in Nvidia’s stock once made up 44% of the index’s entire daily rise. In the latest rally, Nvidia’s valuation milestone coincided with the index’s breakout, underscoring how much this single stock now drives overall market sentiment.
Policy and geopolitics
Nvidia’s rise has not been without challenges. In April 2025, the Trump administration blocked the export of high-end AI chips to China, including Nvidia’s H20, costing the company billions in potential revenue. However, BBC reports Nvidia and AMD negotiated a deal to resume sales in exchange for paying the US government 15% of their revenues from China chip sales.
This agreement reopens the second-largest GPU market in the world to Nvidia. Analyst estimates suggest H20 and AMD MI380 sales to China could generate $35 billion annually, with around $5 billion going to the US Treasury. While this trims profit margins, regaining China market access supports Nvidia’s revenue base and reduces the risk of Chinese tech firms replacing US technology with domestic alternatives.
CEO Jensen Huang has argued that allowing China to buy US chips is better for US national security than forcing it to develop its own competing hardware. The White House appears to agree, preferring controlled sales over pushing demand into black market channels.
Market impact and concentration risk
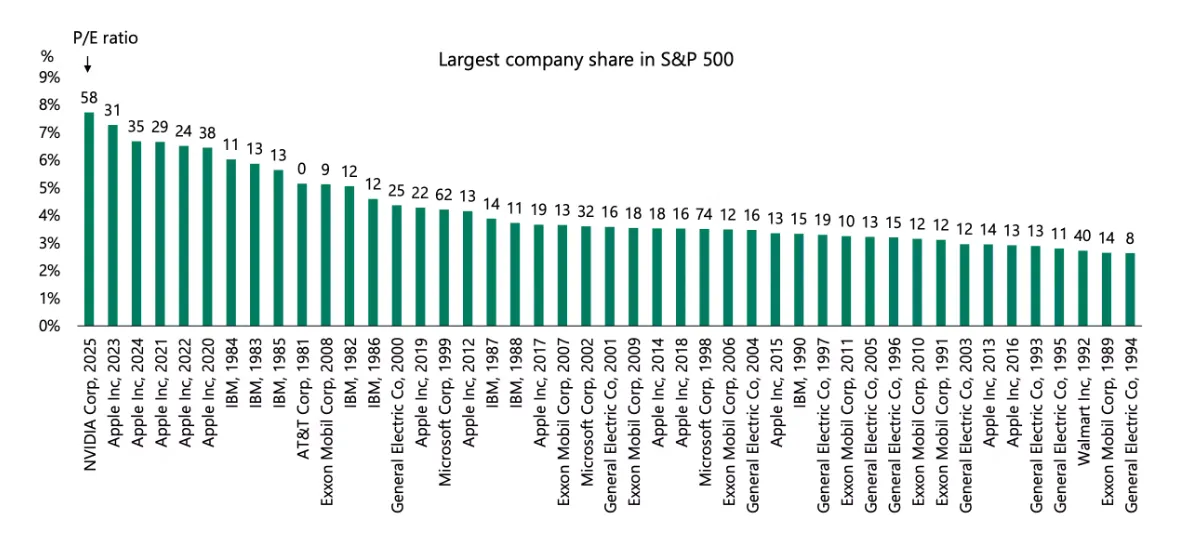
Nvidia’s influence over the S&P 500 is unprecedented in modern markets. Historical data shows that even at the height of the dot-com bubble, no company ever exceeded 6% of the index’s weighting. At 7.3%, Nvidia can move the market on its own - and in 2025, it has been the single largest contributor to the S&P 500’s record-breaking rally.
The top 10 companies in the S&P 500 now make up 38% of the index’s total value, a level of concentration that raises both opportunity and risk.
For bullish investors, Nvidia’s dominance signals leadership in a high-growth sector. For cautious market participants, it highlights vulnerability: any slowdown in AI spending or geopolitical disruption could drag down the broader market.
Nvidia stock technical analysis
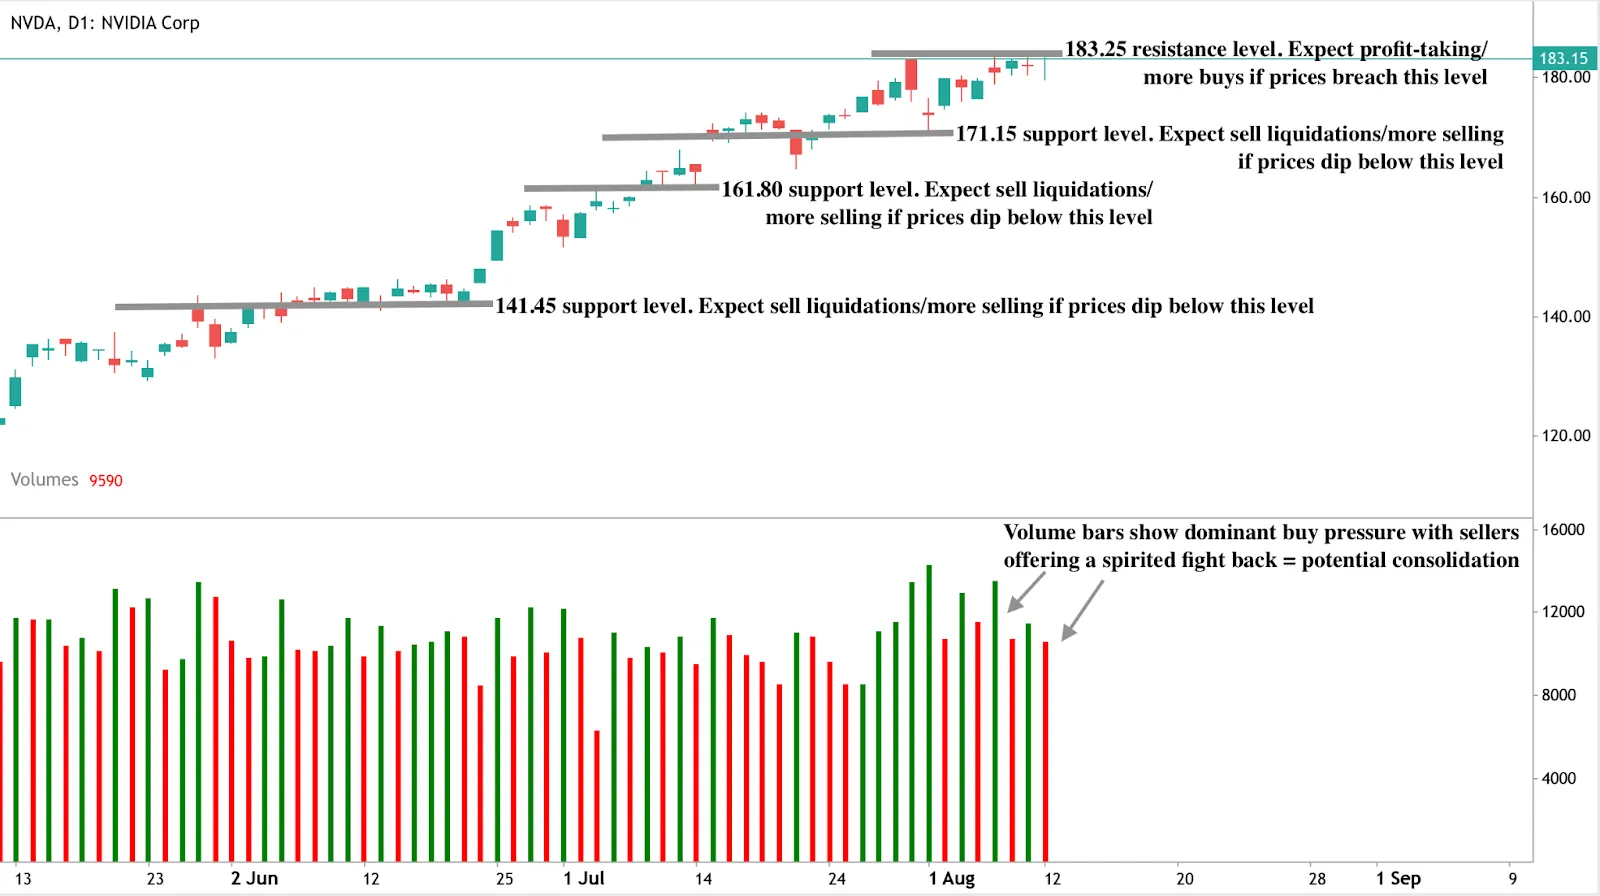
At the time of writing, Nvidia’s stock price is holding at around $183.15 with neither bulls nor bears making a decisive move - hinting at potential consolidation. Volume bars showing strong seller pushback also add to the potential consolidation narrative. Prices could struggle to breach current levels and bounce off the $183.25 resistance level. If we see a dip, prices could find support floors at $171.15, $161.80, and $141.45.
Frequently asked questions
Why is Nvidia worth more than the UK stock market?
Because its AI hardware dominance, explosive revenue growth, and entrenched software ecosystem have created a valuation larger than an entire developed market.
What role does China play in Nvidia’s valuation?
China accounted for 13% of Nvidia’s sales in 2024. Regaining access through the export deal could restore billions in lost revenue despite the 15% revenue share paid to the US government.
What risks does Nvidia face?
Geopolitical tensions, competition from AMD and Huawei, possible limits on data centre expansion due to power constraints, and the risk of AI spending slowing after a period of rapid buildout.
How sustainable is Nvidia’s lead?
Its CUDA lock-in, integration of GPUs with networking hardware, and unmatched manufacturing partnerships provide a strong moat, but its high valuation leaves little margin for error.
Investment implications
Many say Nvidia’s valuation eclipsing the UK stock market coincides with the S&P 500’s historic break above 6,400, cementing the company’s role as the market’s most influential stock. With market share dominance, strategic alignment with US policy, and renewed access to China, Nvidia could maintain its lead.
However, its unprecedented size and influence over major indices mean that Nvidia’s fortunes are now deeply intertwined with broader market performance. For investors, this makes Nvidia both the most important AI growth story and one of the biggest concentration risks in modern market history.
Sorry, we couldn’t find any results matching .
Search tips:
- Check your spelling and try again
- Try another keyword