Have we entered the late stage of the Bitcoin bull market cycle?
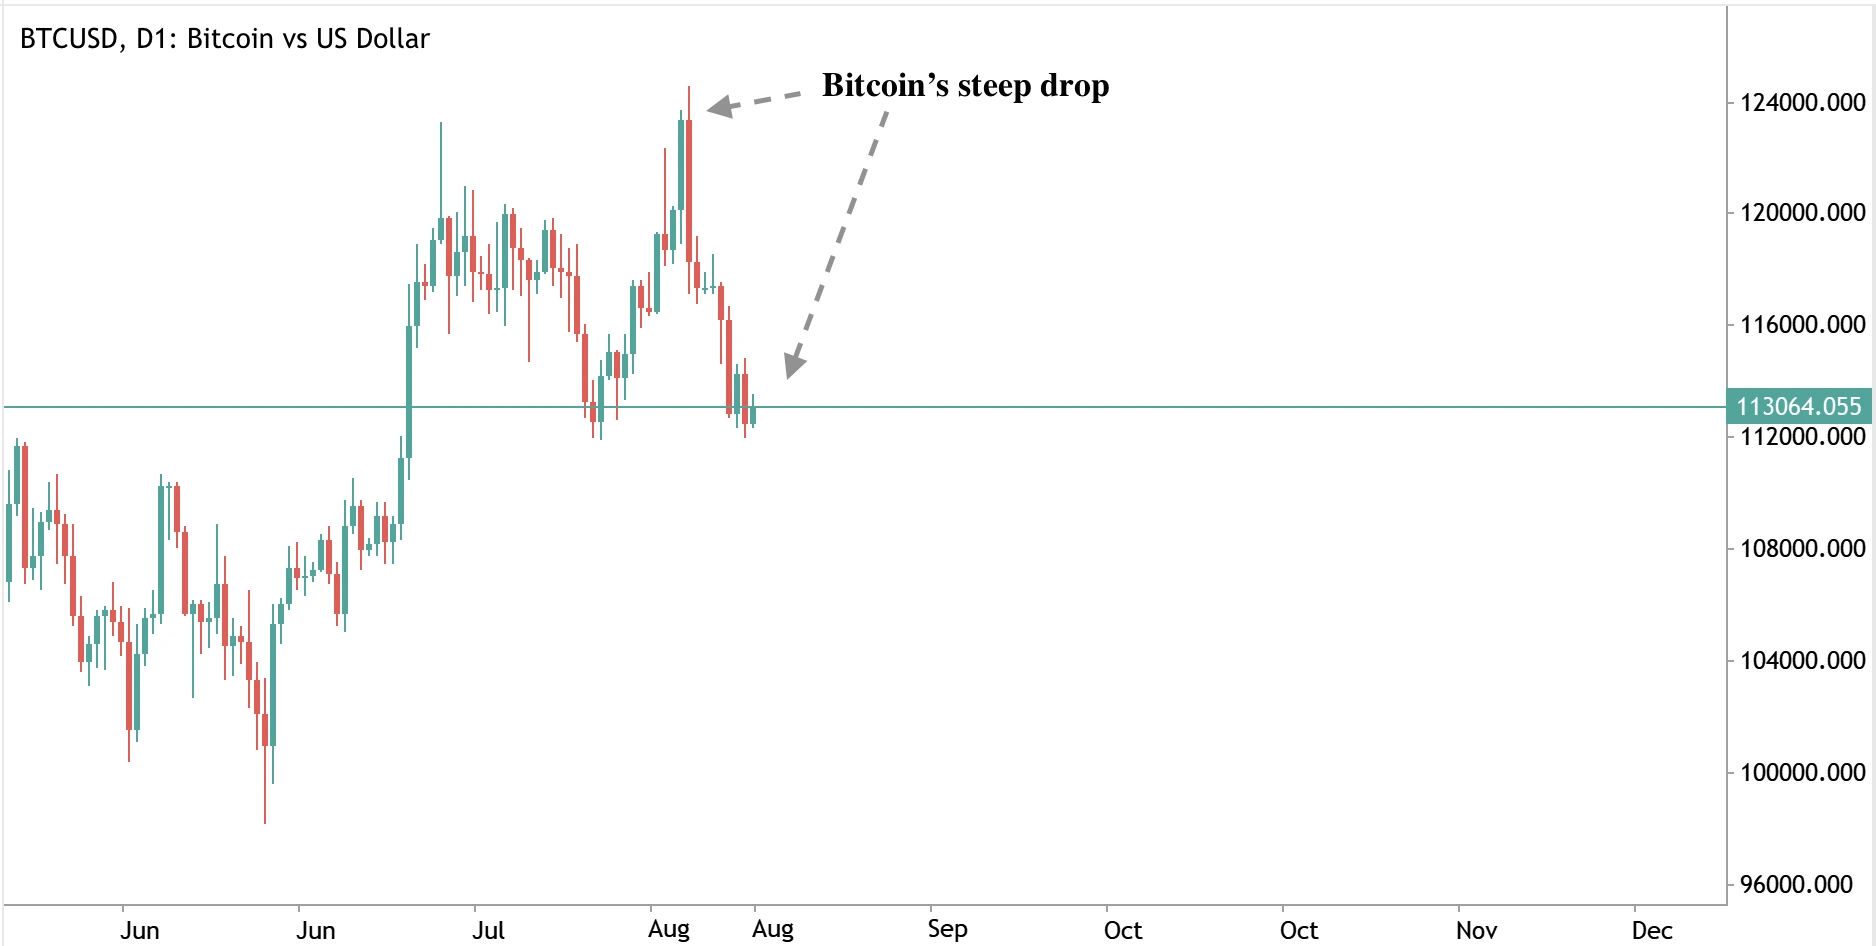
Bitcoin’s latest price action suggests the current bull market may be entering its later stages. After reaching a record high of $124,128 in mid-August 2025, Bitcoin has since retreated by 8% to trade near $113,222.
On-chain data from Glassnode shows long-term holders are taking profits at levels historically seen near cycle peaks, while spot Bitcoin exchange-traded funds (ETFs) have posted nearly $1 billion in outflows over just four trading days.
At the same time, capital has rotated into altcoins, a pattern often seen late in Bitcoin bull markets. Together, these factors suggest the cycle may be further advanced than many investors realise.
Key takeaways
- Bitcoin fell 8% from its August peak of $124,128 to around $113,222.
- Long-term holders are realising profits at levels consistent with prior late-cycle euphoric phases.
- Spot Bitcoin ETFs recorded $975M in outflows over four trading days.
- Altcoin open interest briefly hit $60B before correcting by $2.5B.
- Accumulator addresses - wallets that never sell - hit record demand in 2025.
- Glassnode suggests a cyclical peak could occur as early as October 2025.
Bitcoin’s late-cycle signals hint at a maturing
Glassnode’s analysis highlights that long-term holders, defined as investors who hold coins for more than 155 days, are taking profits at levels comparable to Bitcoin’s past euphoric peaks. In previous cycles, this type of activity coincided with late-stage rallies that eventually gave way to corrections.
Demand data supports this pattern. Despite reaching new all-time highs, Bitcoin’s ability to attract fresh inflows has weakened. Spot Bitcoin ETFs, which drove significant demand earlier in the cycle, saw $1,155.3 million in outflows across five consecutive trading days. This cooling appetite for exposure suggests institutional buyers are becoming more cautious.
Bitcoin ETF outflows and demand fatigue
ETF flows have been one of the clearest signals of demand for Bitcoin in 2025. Earlier in the year, large inflows helped propel Bitcoin through successive highs. Now, the reversal in flows indicates fatigue in the rally. For context, Bitcoin’s fall from $124,000 to $113,000 aligns with this drop-off in capital, showing how sensitive the price remains to institutional flows.
Historically, when ETF inflows slow while long-term holders distribute coins into strength, Bitcoin is often in the later stages of its cycle. This adds weight to the view that the market may be closer to its peak than many expect.
Altcoin speculation rises
Weaker Bitcoin demand has coincided with a sharp rise in speculative activity elsewhere. Altcoin open interest briefly surged to a record $60.2 billion before correcting by $2.5 billion. Glassnode notes that such pronounced capital rotation into altcoins is a hallmark of late-cycle dynamics, where investors shift from Bitcoin into higher-risk calls.
Ethereum, in particular, has seen perpetual futures volume dominance climb above Bitcoin’s, highlighting the rotation of capital into alternative ecosystems.
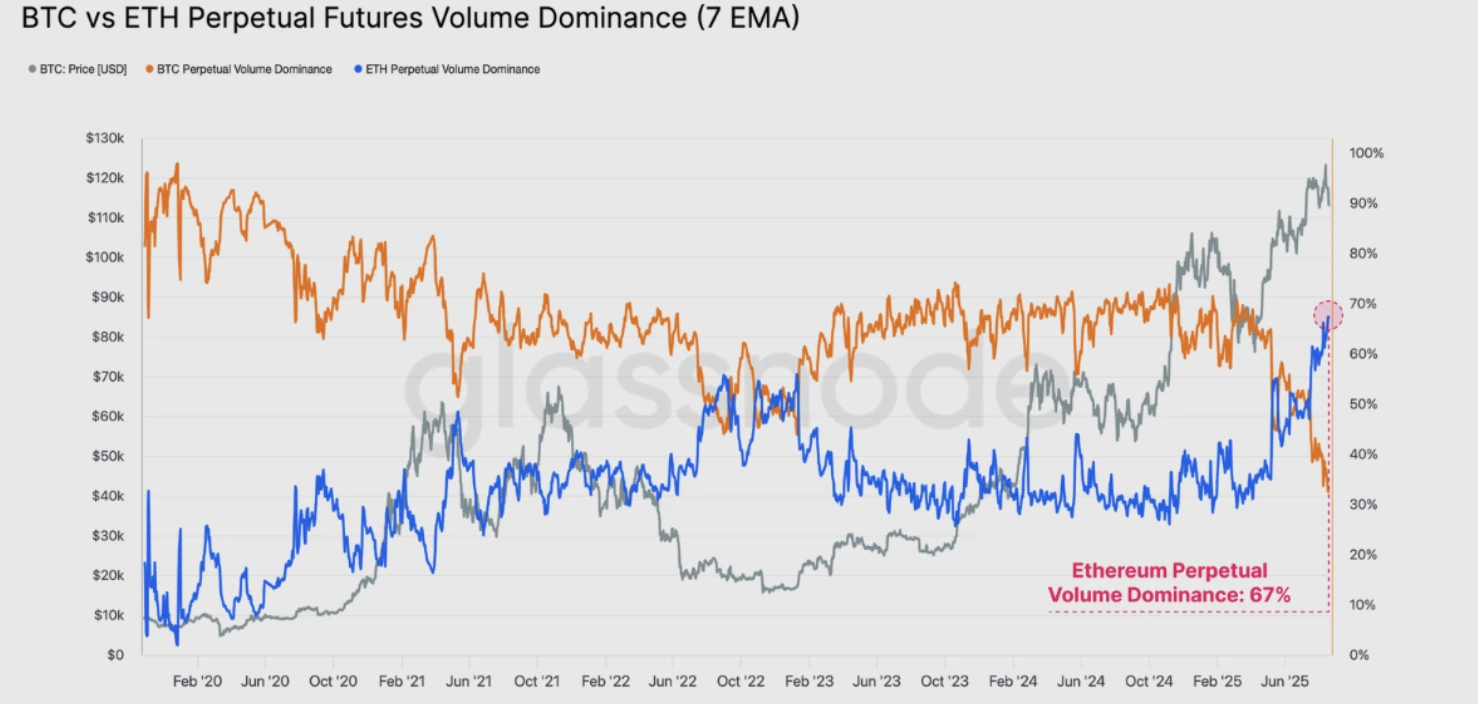
Historically, this type of rotation often precedes the formation of an “altseason” - a period when smaller cryptocurrencies outperform Bitcoin during the final leg of a bull cycle.
The four-year cycle debate
One of the most contested questions in the current market is whether Bitcoin’s four-year halving cycle still holds. Glassnode argues that Bitcoin’s price behaviour continues to mirror prior halving-driven cycles. If history repeats, a cyclical peak could occur as early as October 2025. Analysts such as Rekt Capital also point to the timeline aligning with the 2020 cycle, where the peak occurred roughly 550 days after the halving.
However, not all agree. Some industry leaders argue that institutional adoption has permanently altered Bitcoin’s structure. Jason Williams recently noted that the top 100 treasury companies collectively hold nearly 1 million BTC, worth more than $112 billion. Meanwhile, Bitwise CIO Matt Hougan has said the halving cycle is “dead,” predicting Bitcoin will likely see another “up year” in 2026, extending beyond traditional patterns.
This divide reflects the uncertainty in today’s market: historic cycle signals still resonate, but new institutional dynamics may reshape the trajectory.
Accumulators add to Bitcoin long-term holders
Despite slowing inflows and profit-taking, conviction among long-term buyers remains strong. Data from CryptoQuant shows demand from accumulator addresses - wallets that only buy and never sell - reached an all-time high in 2025.
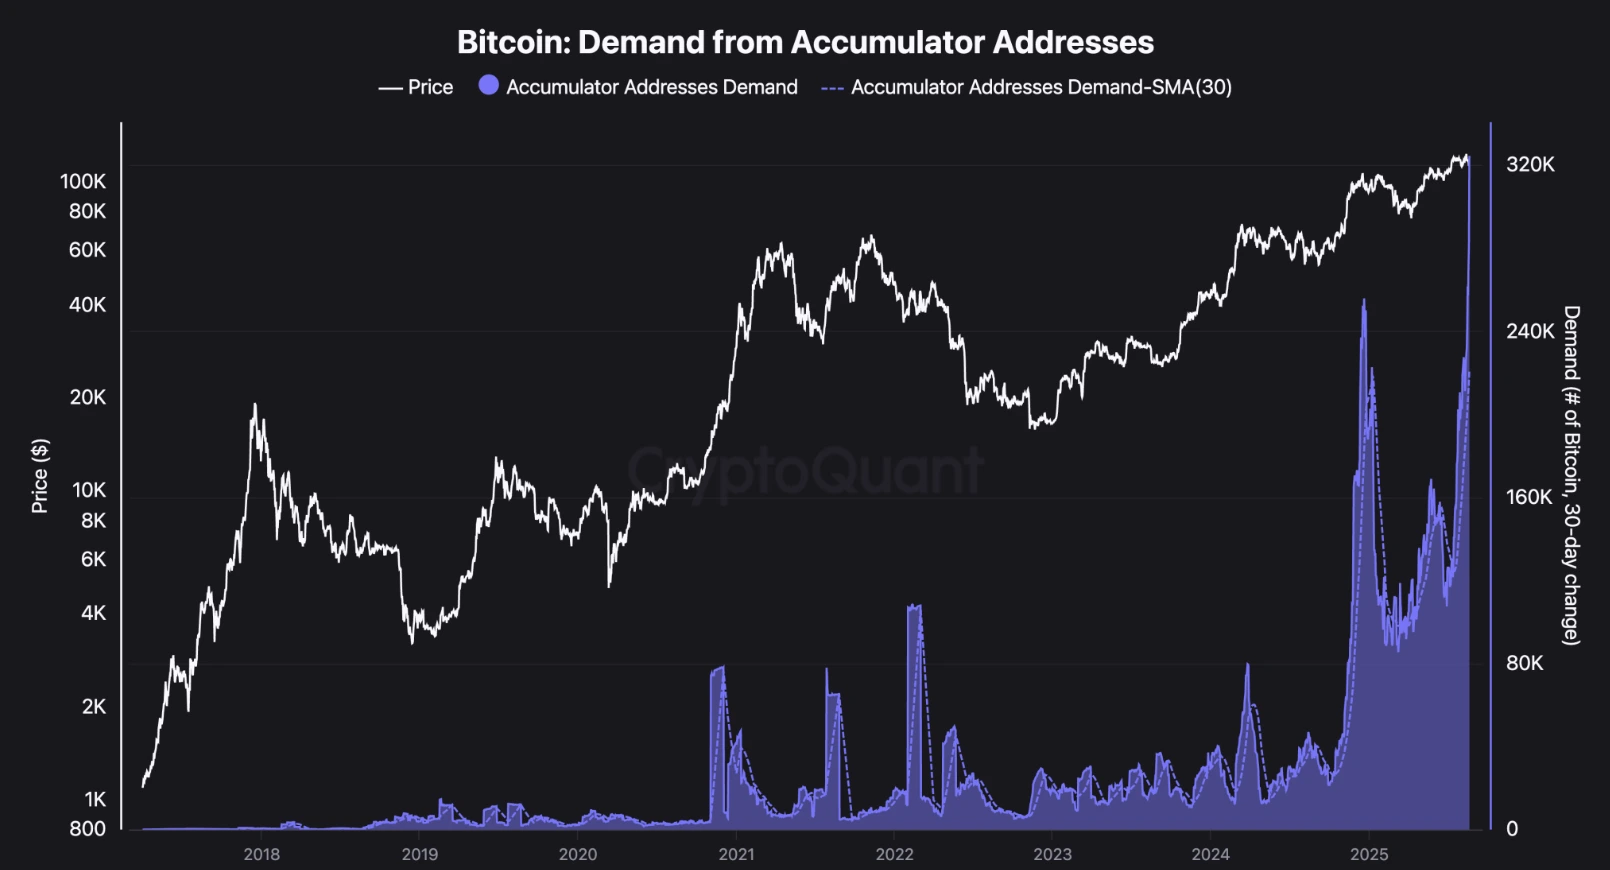
These addresses steadily absorb supply regardless of price action, providing a structural underpinning for Bitcoin’s value.
This behaviour contrasts with the caution among short-term traders. Analyst Axel Adler points out that Bitcoin’s “visible demand” metric, which measures net holdings of coins moved within the past year, has slipped to 30,000 BTC. While still positive, this decline suggests newer participants are less active, adding to the sense of cooling momentum.
Bitcoin price scenarios
Given these dynamics, Bitcoin sits at a critical crossroads:
- Bullish case: If demand stabilises within the $107,000 - $110,000 support zone, Bitcoin could rebound toward $120,000. A breakout above that level opens the path to a retest of $130,000.
- Base case: Consolidation continues between $107,000 and $115,000, allowing the market to reset momentum before its next decisive move.
- Bearish case: If $107,000 fails and visible demand declines further, Bitcoin could slide toward $102,000 - $104,000, with risk of testing the $100,000 psychological level.
Bitcoin technical analysis
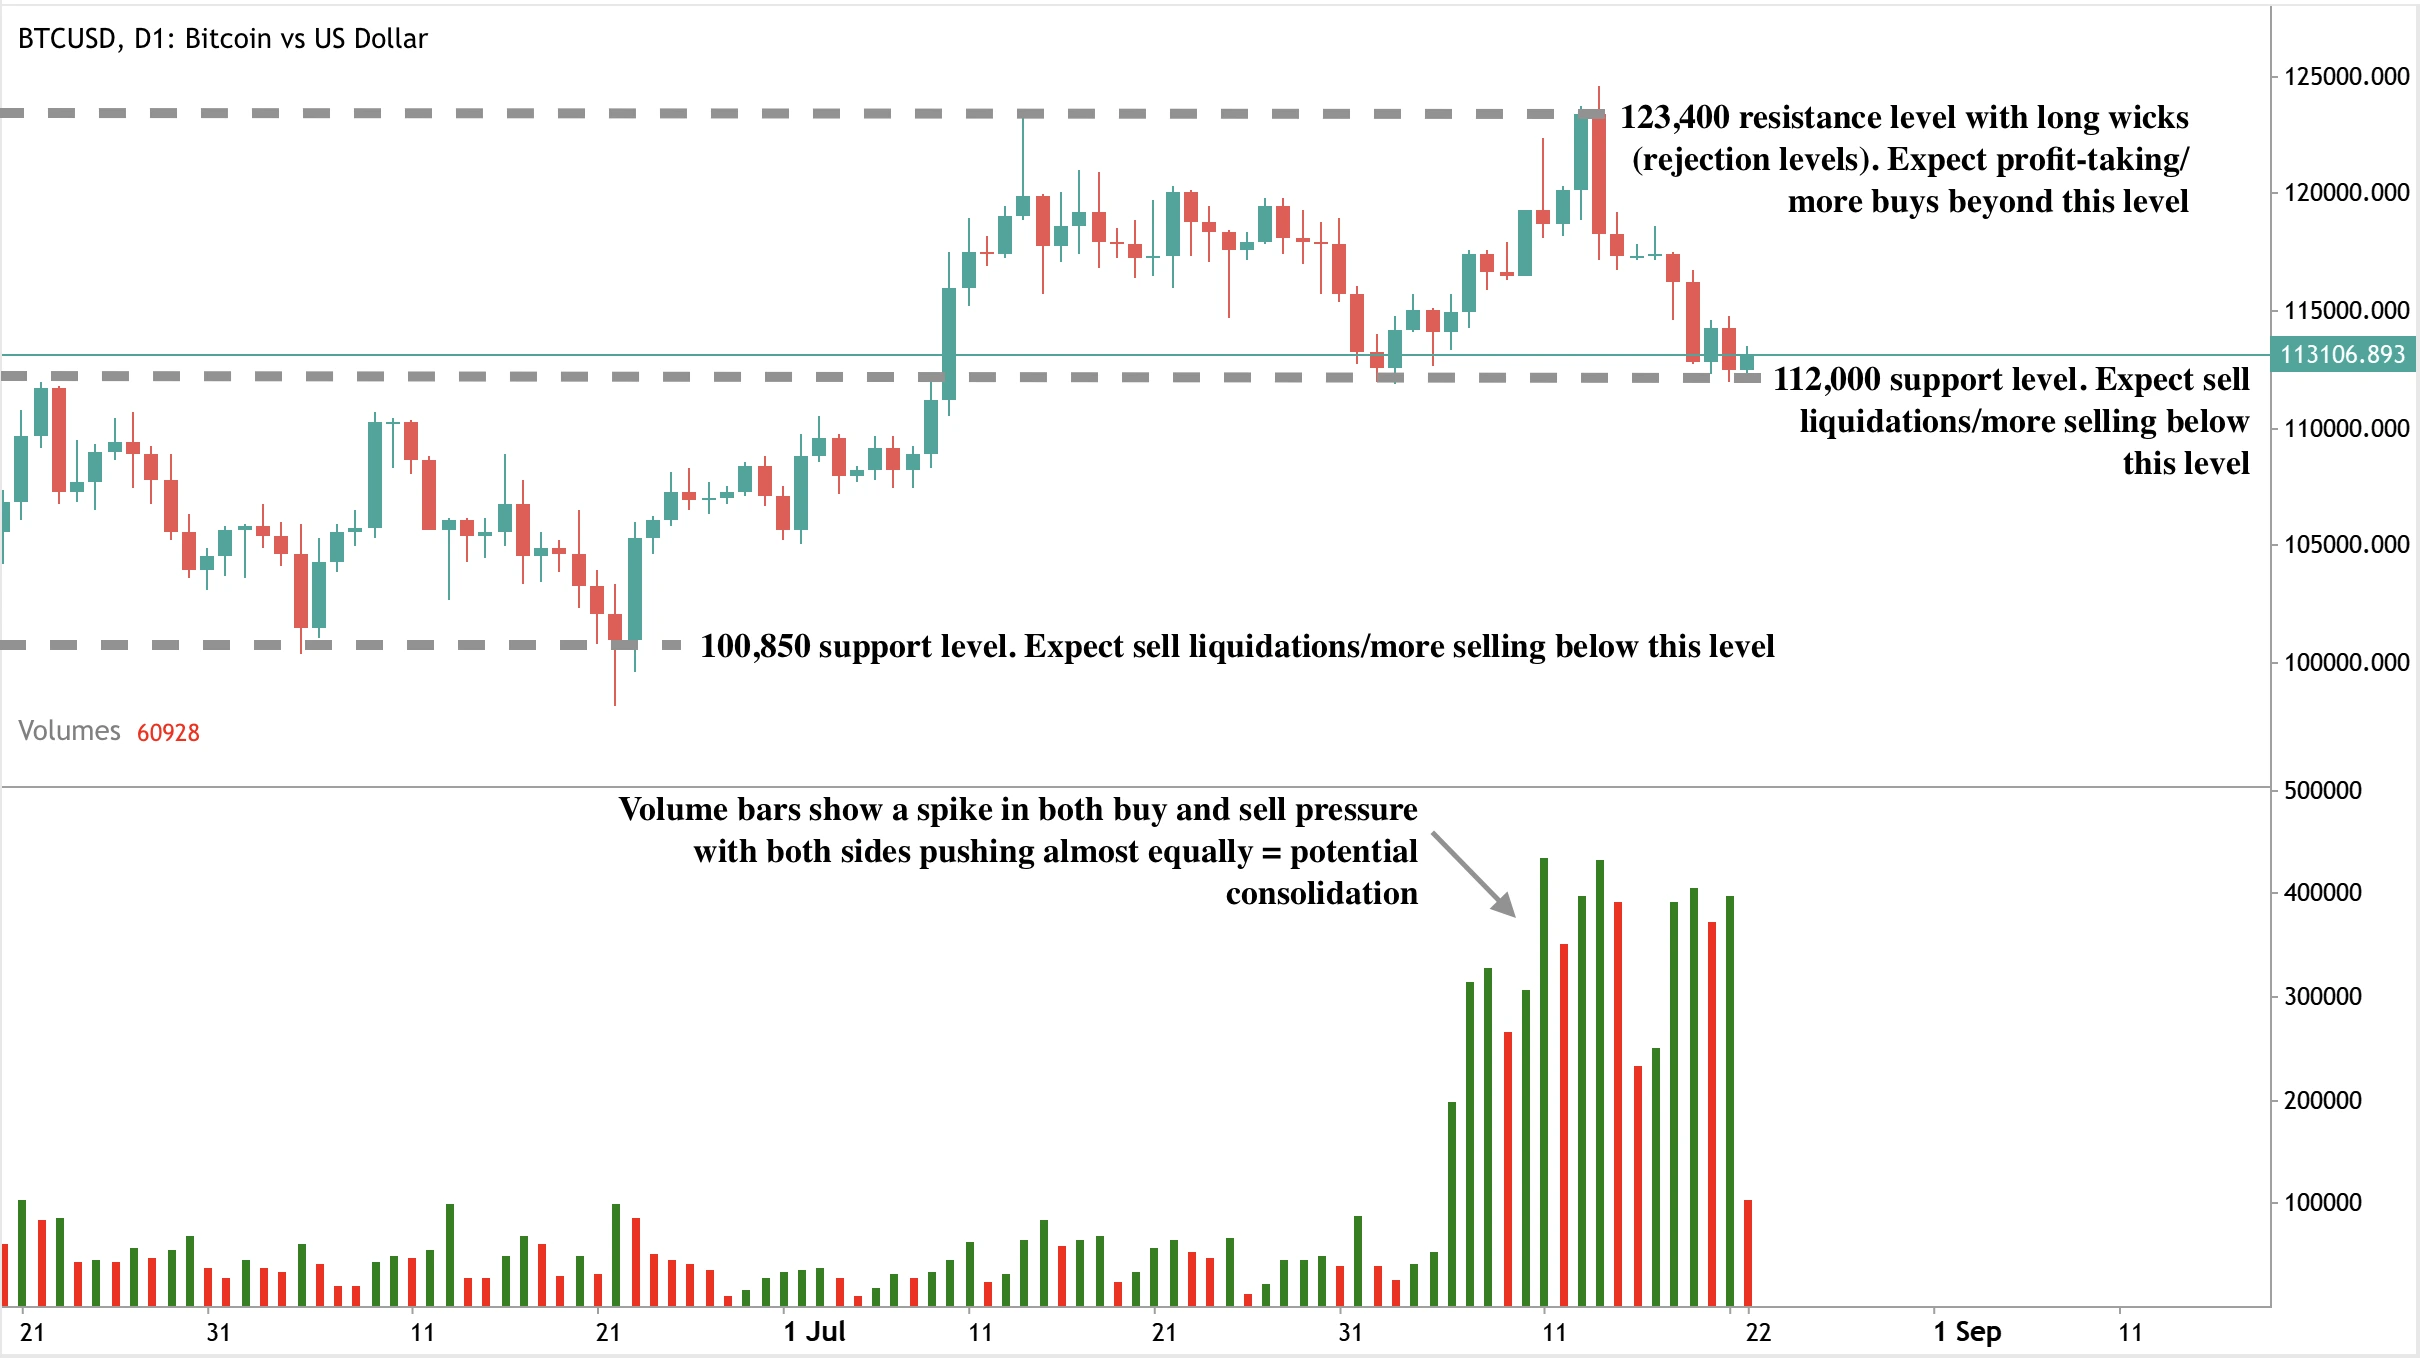
At the time of writing, Bitcoin prices have dropped near a key support level around $112,000, hinting that a potential bounce could be in play. Volume bars, however, show a near equal tug-of-war between bulls and bears, suggesting that price may consolidate rather than break decisively in the short term.
If buying momentum strengthens, the next resistance level to watch is $123,400. A successful breakout above this threshold could set the stage for a retest of August’s highs near $124K and potentially higher. On the downside, a failure to hold $112,000 support could trigger a sharper decline toward the $100,850 level, with the $100,000 psychological zone acting as the final line of defence.
Investment implications
For traders, the $112,000 -$110,000 range is critical. Holding this zone could allow for a rebound toward $123,000 -$130,000, while a breakdown risks a deeper move to $100,000.
For investors, the mix of late-cycle signals and strong accumulator demand suggests heightened volatility ahead. While short-term demand appears weaker, structural adoption continues to underpin Bitcoin’s long-term outlook. Portfolio strategies should balance the risk of a late-cycle correction with the possibility of one final leg higher if the four-year cycle remains intact.
Speculate on the next movements of Bitcoin with a Deriv MT5 account today.
Frequently asked questions
Why is Bitcoin showing late-cycle signals?
Because long-term holders are realising profits, ETF inflows have slowed, and speculative capital is rotating into altcoins - all patterns consistent with previous late-cycle phases.
Is the four-year cycle still intact?
Glassnode suggests yes, with a potential peak by October 2025. Some analysts disagree, citing institutional adoption and ETFs as new factors reshaping the cycle.
What supports Bitcoin’s price despite weaker inflows?
Record demand from accumulator addresses reduces liquid supply, reinforcing long-term confidence in Bitcoin’s role as a reserve asset.
What are the key support and resistance levels?
Support is centred around $112,000 and the $107,000 - $110,000 band, while resistance sits near $123,400 and $130,000. A break below $112,000 could open a move toward $100,000.
Disclaimer:
The performance figures quoted are not a guarantee of future performance.


