Results for

What is driving Central Bank Gold demand instead of US Treasuries in 2025?
Gold is holding at all-time highs at around $3,609, up 37% this year after a 27% gain in 2024.
Gold is holding at all-time highs at around $3,609, up 37% this year after a 27% gain in 2024. The main driver is a shift in reserve preference: central banks are steadily buying gold instead of US Treasuries, signalling a reordering of how nations hedge against financial risk. Weak US jobs data and expectations of Federal Reserve rate cuts are accelerating this shift, while speculative traders and retail demand are adding momentum. The question is no longer whether gold is a safe-haven asset, but whether it is becoming a foundation for a new monetary order.
Key takeaways
- Gold price is at $3,609, supported by central bank demand and Fed rate cut expectations.
- US Treasuries are losing appeal, as central banks seek diversification in gold reserves.
- China’s PBoC added gold for the 10th consecutive month in August, increasing holdings to 74.02 million ounces.
- Traders are fully pricing in a 25 bps Fed cut on 17 September, while Gold has surged 37% in 2025, outpacing the S&P 500 and acting like a growth asset.
- Speculative demand is rising, with net long positions climbing by 20,740 contracts in early September.
- Silver prices are also surging, hitting a 14-year high, reflecting broader demand for hard assets.
Gold vs US Treasuries: Central banks drive gold higher
The most significant force behind gold’s rise is central banks shifting away from US Treasuries. The People’s Bank of China (PBoC) purchased gold for the 10th straight month in August, lifting reserves from 73.96 to 74.02 million fine troy ounces. This is not an isolated move: global central banks have steadily reduced their Treasury holdings in favour of bullion as a hedge against US debt risk, sanctions exposure, and dollar volatility.
The decision reflects a structural realignment. Treasuries, once considered the safest store of value, now carry risks tied to Washington’s fiscal position, political disputes, and reliance on Fed monetary policy. By contrast, gold offers liquidity and neutrality, making it increasingly attractive for reserve diversification.
Fed policy and weak US data amplify the shift
The latest US jobs report has reinforced gold’s momentum. Nonfarm Payrolls (NFP) showed only 22,000 jobs added in August compared to expectations of 75,000, while unemployment rose to 4.3%, the highest since 2021.
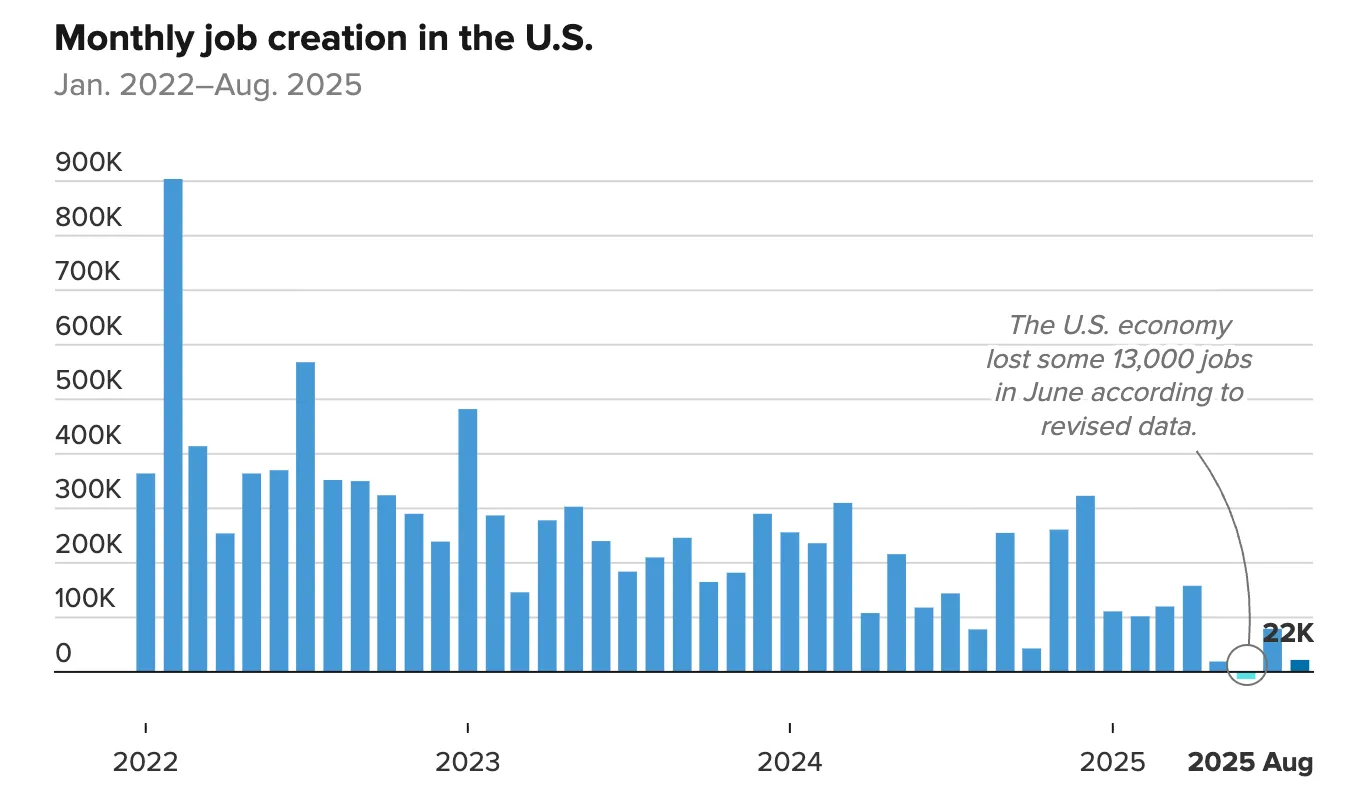
This weakness confirms labour market softening, undermining the case for higher rates.
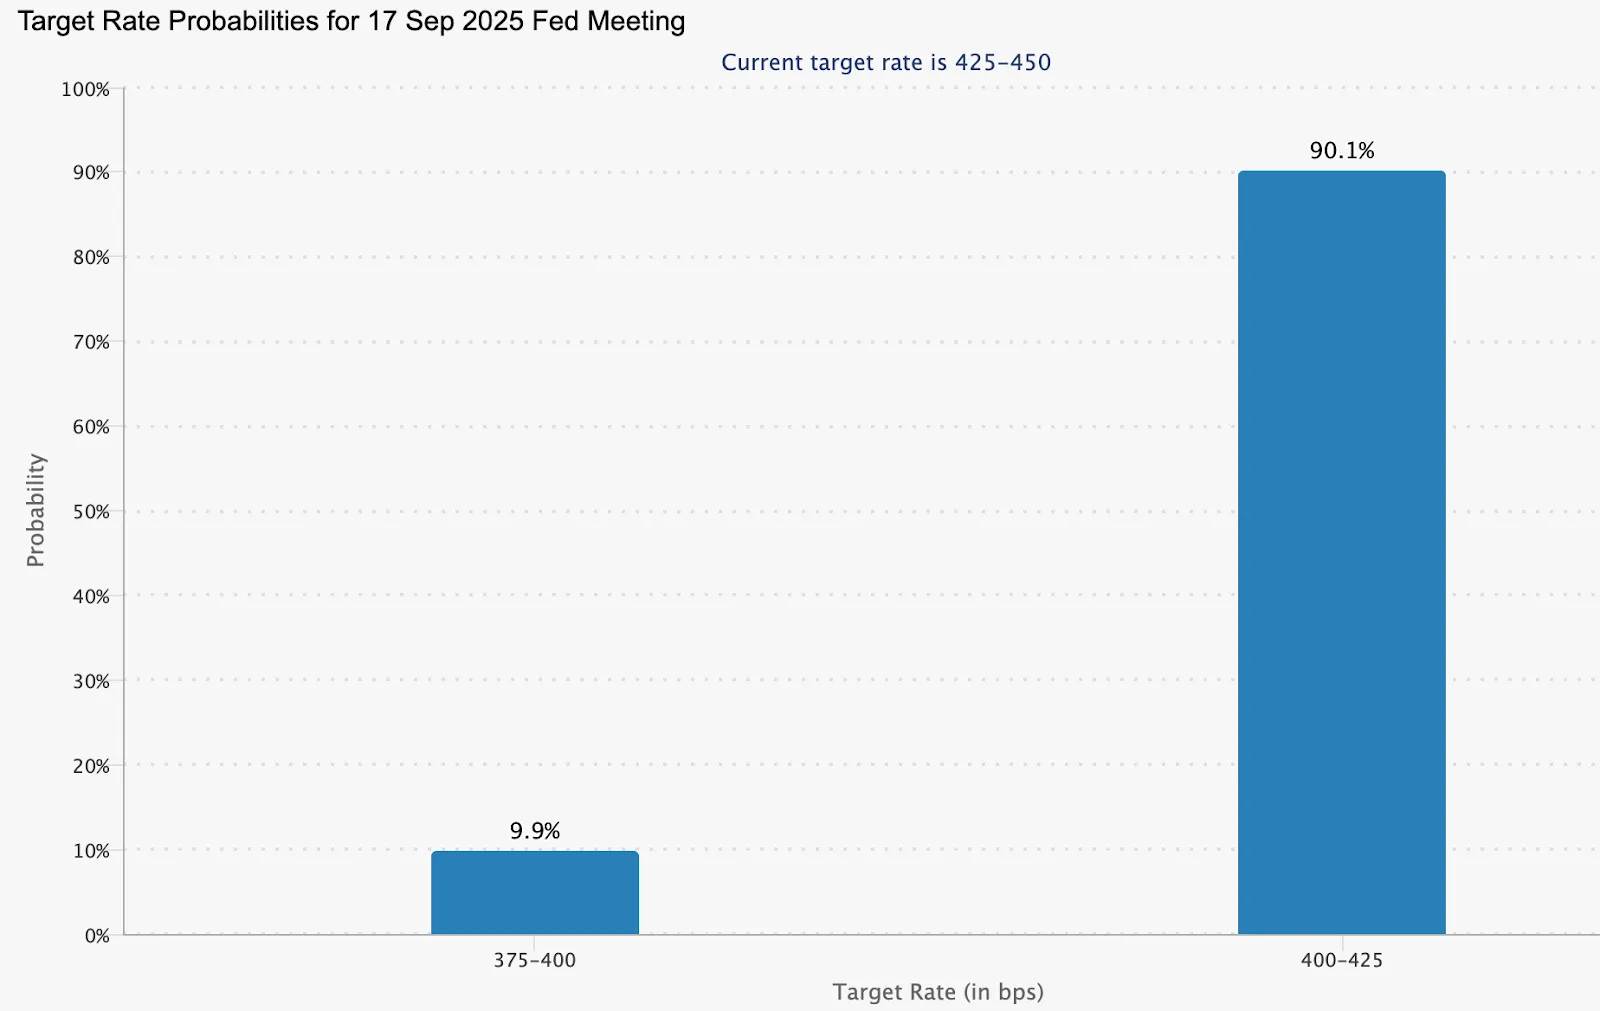
Markets are now almost certain the Fed will cut rates on 17 September, with a 90.1% probability of a 25-basis-point cut.
Lower interest rates reduce the opportunity cost of holding gold, while weighing on the US dollar. This creates a dual boost: Treasuries lose yield appeal, and gold becomes relatively more attractive for both official and private investors.
Speculative and retail flows add fuel
Alongside central bank buying, speculative positioning is rising sharply. Gold net long futures contracts increased by 20,740 in the week ending 2 September, bringing the total to 168,862. This shows momentum traders are leaning into the rally, amplifying the move.
Retail and domestic markets are also joining the surge. In India, weakness in the rupee has made gold and silver more attractive as hedges against currency risk. According to analysts, the dual demand from official institutions and private investors creates a powerful base of support above $3600.
Silver price higher highs
Gold’s surge is not occurring in isolation. Silver hit a 14-year high last week, signalling a broader appetite for precious metals as alternatives to fiat-denominated assets.
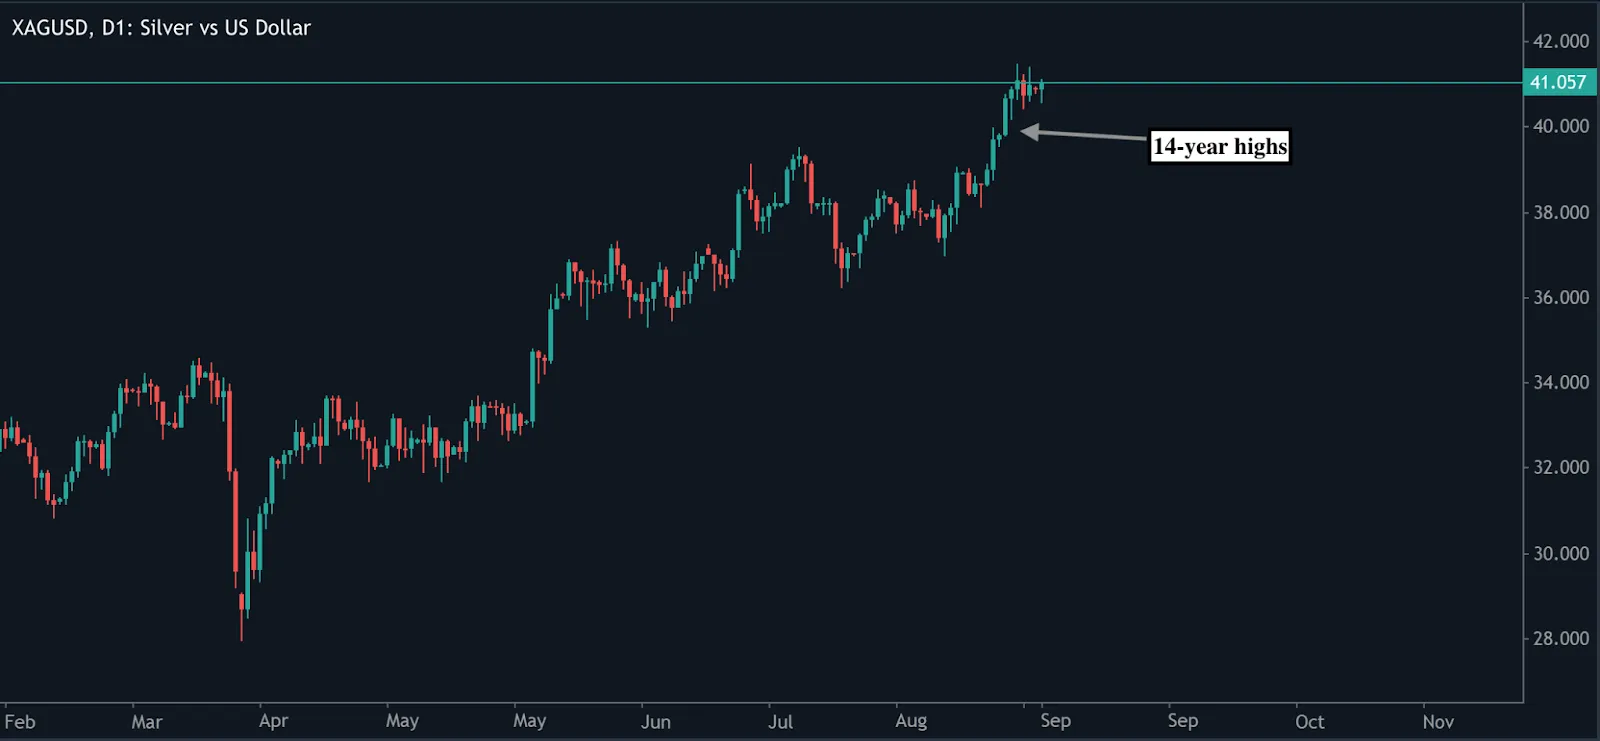
Silver’s dual role as both an industrial metal and a safe-haven asset makes its rally a confirming signal that investors are hedging systemic risk, not just trading short-term volatility.
Will prices decisively stay above $3,600?
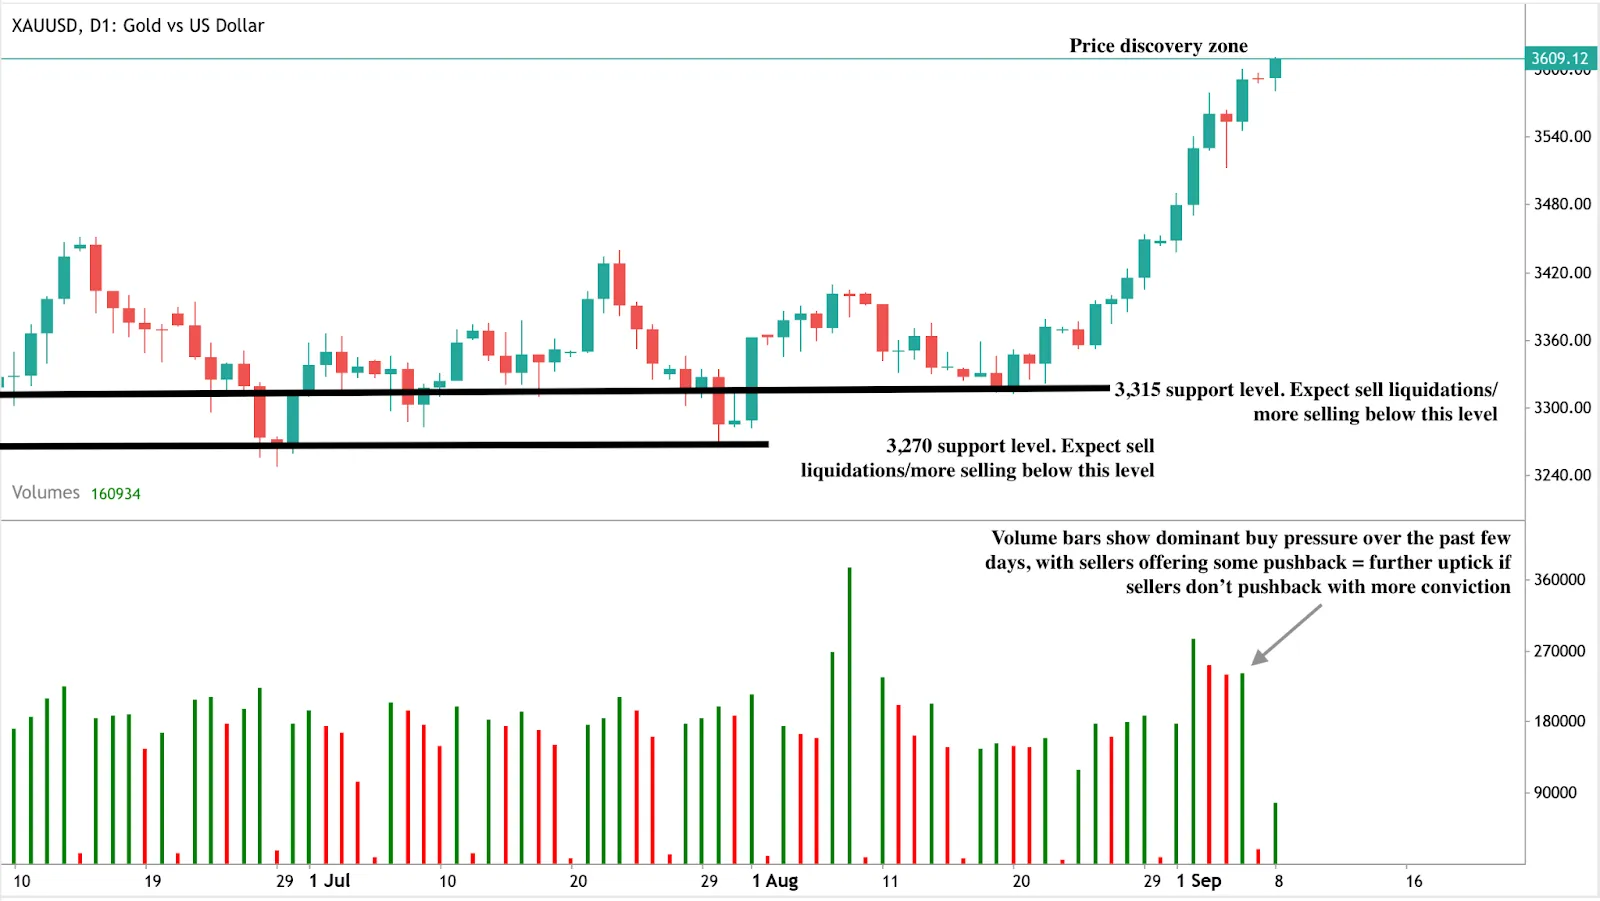
Gold is now in price discovery mode.
- Breakout case: Central bank demand, weak US jobs data, and Fed cuts could lift prices decisively above $3,600, opening the path for a new trading range.
- Stall case: The near-term risk is the upcoming US inflation report (Thursday). A hotter-than-expected print could strengthen the dollar and delay a clean breakout, leading to a temporary consolidation before the next move.
Gold Market outlook and scenarios
Gold’s performance so far in 2025 has reshaped its role:
- As a hedge, it continues to protect against inflation, dollar weakness, and geopolitical uncertainty.
- As a growth asset, gold has outperformed major equity benchmarks, with 74% compounded gains from 2024 to 2025.

In the short term, inflation data could inject volatility, but the structural drivers - central bank diversification away from Treasuries, sustained official purchases, and weakening US macro signals - underpin a higher long-term floor.
If central bank demand continues and the Fed delivers multiple cuts, gold could establish a new plateau way above $3,600. Conversely, if inflation runs hot and the dollar rebounds, traders may see consolidation before the next surge.
Gold technical insights
At the time of writing, Gold is going parabolic, slightly going past the $3,600 mark - bullish signals are evident on the daily chart. The volume bars also tell a bullish story with buy pressure dominating over the past few days. If sellers don’t push back with conviction, we could see a decisive move past the $3,600 mark. Conversely, if sellers offer more pushback, we could see prices tank. A change in the fundamentals, coupled with profit-taking, could see prices crash to find support at the $3,315 and $3,270 price levels.
Investment implications
For investors, the message is clear:
- Short-term: Watch Thursday’s inflation data and the Fed’s 17 September meeting. These are the catalysts above the $3,600 level.
- Medium-term: Central bank diversification away from Treasuries suggests gold demand is structural, not cyclical, supporting a higher price floor.
Strategy: If inflation shocks cause pullbacks, traders can look for tactical opportunities near support. For longer-term allocations, gold’s outperformance versus equities argues for treating it as a core growth asset, not just an emergency hedge.
Introducing VIX and DXY to monitor market moves and USD trends
Deriv has launched trading on VIX (Volatility Index) and DXY (U.S. Dollar Index). These benchmarks help traders track global market sentiment and the strength of the U.S. dollar—two widely followed signals that shape trading decisions worldwide.
Deriv has launched trading on VIX (Volatility Index) and DXY (U.S. Dollar Index). These benchmarks help traders track global market sentiment and the strength of the U.S. dollar—two widely followed signals that shape trading decisions worldwide.
VIX measures expected volatility in the U.S. stock market over the next 30 days, based on S&P 500 option prices. Often called the fear gauge, it rises in times of uncertainty and reflects market sentiment.
Meanwhile, DXY tracks the U.S. dollar’s value against a basket of six major currencies (EUR, JPY, GBP, CAD, SEK, CHF). It highlights shifts in dollar strength, influenced by interest rates, trade flows, and economic confidence.
Quick takeaways
- VIX helps traders anticipate changes in market sentiment.
- DXY provides a clear measure of U.S. dollar strength against global currencies.
- Together, they offer a broader perspective of global markets beyond individual stocks or forex pairs.
How VIX and DXY differ from traditional indices and forex pairs
Unlike individual stocks, indices, or forex pairs, VIX and DXY reflect broader market signals.
- VIX (Volatility Index): Based on S&P 500 option prices, VIX rises in times of uncertainty and helps traders assess market sentiment.
- DXY (U.S. Dollar Index): Tracks the dollar’s value against six major currencies, highlighting shifts influenced by interest rates, trade flows, and economic confidence.
Why trade VIX and DXY
Both indices react to major events such as monetary policy changes, economic data releases, and geopolitical developments.
Trading them provides a bigger-picture perspective of global markets:
VIX (Volatility Index)
- Monitor shifts in uncertainty: Spot when volatility expectations are rising and adjust your strategy.
- Diversify beyond equities: Trade an index that behaves differently from traditional indices. On Deriv, VIX can also complement strategies built on Synthetic Indices, which run 24/7.
- Hedge against downturns: VIX often spikes when equities fall, making it a tool traders may use to manage stock market risk.
DXY (U.S. Dollar Index)
- Track currency strength: Monitor how the U.S. dollar moves against other key currencies.
- Anticipate ripple effects: Understand how dollar shifts can influence Commodities and Forex markets. DXY movements can also provide context for trading USD-based forex pairs.
- Watch Fed signals: DXY reacts strongly to U.S. interest rate changes and central bank policy moves.
- Follow commodity pricing: Because oil and gold are priced in USD, a stronger or weaker dollar often affects their trends.
Start trading VIX and DXY today
Log in to your Deriv account and explore VIX and DXY with a Deriv MT5 Financial account. Or if you’re new to Deriv, sign up now to start trading.

Will the US dollar recover as the manufacturing recession nears an end?
Not right away, according to analysts. While the manufacturing slump since 2022 may be drawing to a close, the greenback’s recovery is far from guaranteed.
Not right away, according to analysts. According to recent data, US manufacturing is showing signs of life - the ISM Manufacturing PMI rose to 48.7 in August and new orders returned to expansion at 51.4 for the first time in seven months - but the dollar remains under pressure. Tariffs, softening employment, and the prospect of Fed rate cuts all weigh on its outlook. So, while the manufacturing slump since 2022 may be drawing to a close, the greenback’s recovery is far from guaranteed.
Key takeaways
- ISM Manufacturing PMI rose to 48.7 in August, with new orders at 51.4, the first expansion since January.
- Tariff pressures remain high, with 75% duties on Chinese imports and 25% on Canada, Mexico, and the EU, raising costs for US firms.
- Fed outlook is dovish, with a 99% probability priced in for a 25 bps September cut, despite green shoots in manufacturing.
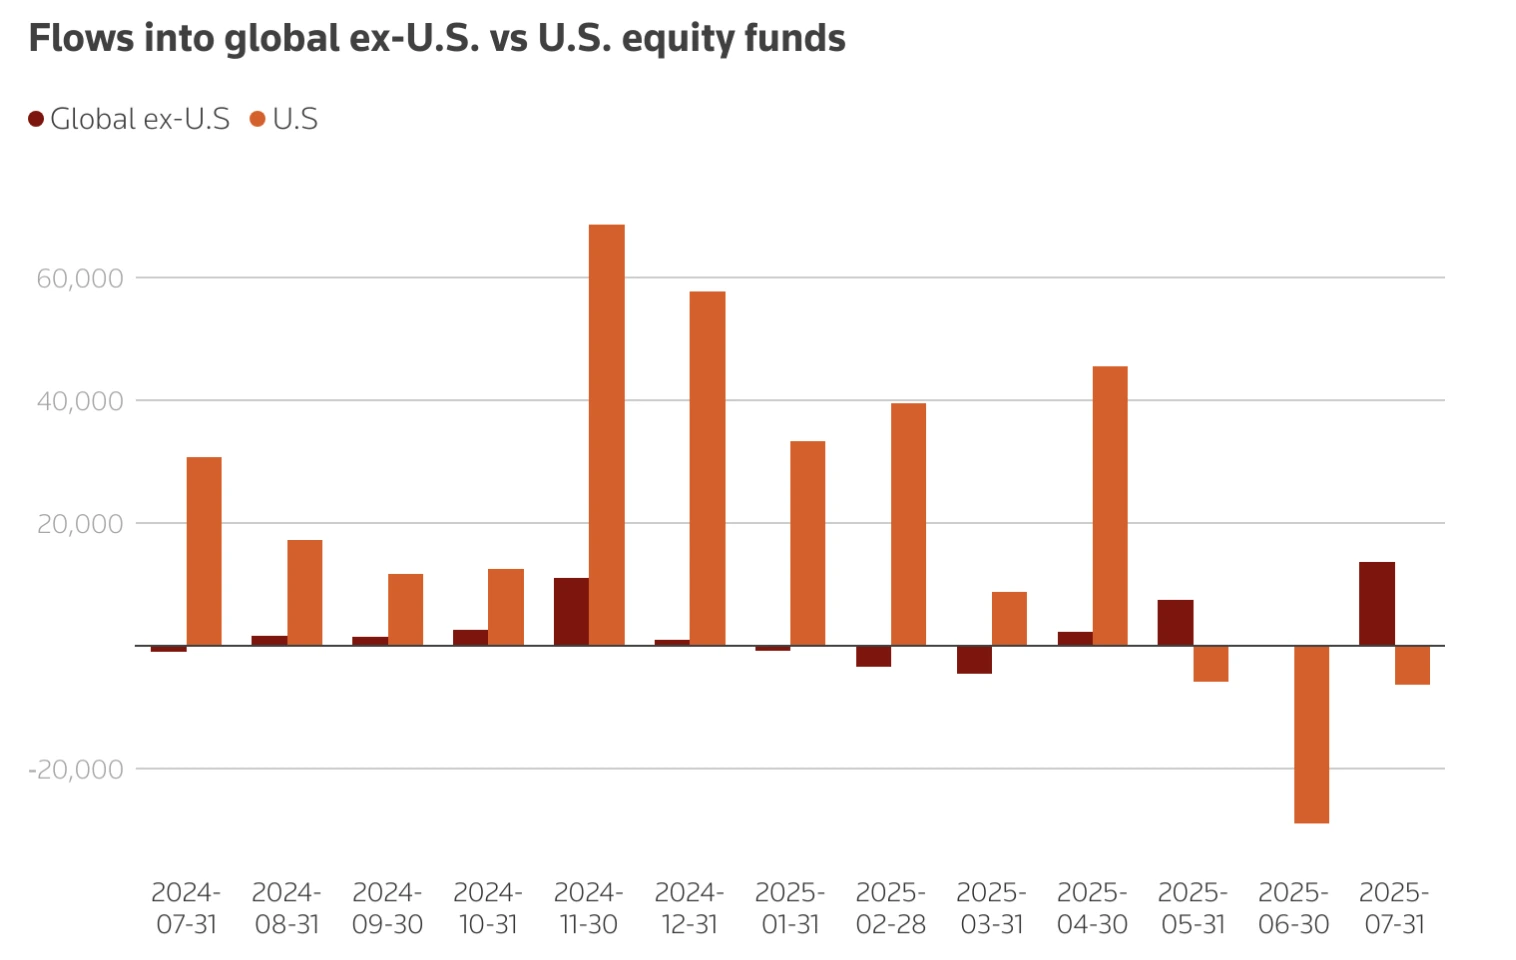
- Capital flows are shifting away from the US, with European ETFs seeing $42 billion of inflows while US inflows halved in 2025.
- Employment lags, with the ISM jobs index at 43.8 and national unemployment at 4.2%–4.3%, underscoring fragile labour conditions.
ISM Manufacturing PMI shows first signs of recovery
The ISM Manufacturing PMI increased by 0.7 points in August to 48.7, its highest since late 2024.

More importantly, the new orders sub-index jumped 4.3 points to 51.4, breaking into expansion for the first time in seven months. This is significant because new orders are a forward-looking gauge of demand, suggesting output could stabilise in the months ahead.
Prices paid eased slightly, down 1.1 points to 63.7, hinting at some relief on input costs. Still, the employment index remains subdued at 43.8, highlighting that job creation in the sector is far from a rebound.
Manufacturing makes up just over 10% of GDP, but it has historically been a leading indicator for investor sentiment and capital flows. Positive surprises in PMI have often coincided with short-term USD gains, with early 2025 readings triggering rallies of 0.7% or more against G10 peers.
What this could mean for the dollar
Experts say a manufacturing recovery could support the USD through three main channels:
- Growth signal: Expansion in new orders suggests stronger demand, which could boost confidence in the US growth outlook and attract global capital inflows.
- Monetary policy: Signs of resilience may reduce pressure on the Federal Reserve to deliver deep rate cuts, supporting USD yields. In early 2025, the dollar rallied against the euro from 1.12 to 1.02 as markets scaled back easing calls.
- Trade balance: A recovery in exports could narrow the deficit, strengthening the USD. However, a stronger dollar and tariff costs continue to undermine the competitiveness of US goods.
Counterweights to a stronger dollar
Tariff headwinds
The Trump administration’s 2025 tariff package - 75% on Chinese imports, 25% on Canada, Mexico, and the EU - has raised costs on intermediate goods, which make up about half of all US imports. Economists estimate the tariffs represent a $430 billion tax increase, equivalent to 1.4% of GDP. This risks slowing growth and limiting manufacturing’s rebound. At the same time, tariffs tend to push the USD higher by increasing demand for dollar-based transactions, making US exports less competitive.
Capital outflows
Foreign investors are reallocating away from US markets. Net flows into US equity ETFs dropped to $5.7 billion in 2025, compared with $10.2 billion a year earlier. By contrast, European investors redirected $42 billion into local ETFs. This reduces structural support for the USD, even if manufacturing data improves.
Employment weakness
The ISM Employment Index rose only 0.4 points to 43.8, still signalling contraction. Nationally, payroll growth has slowed, with July adding just 73,000 jobs and unemployment edging up to 4.2%. Economists such as Mark Zandi warn that if job declines accelerate, the economy is “on the precipice” of recession, which would erode USD support.
Federal reserve rate cut outlook
The Federal Reserve has kept rates at 4.25%–4.50% through mid-2025, balancing above-target inflation with weaker growth. Markets are now pricing a near-100% probability of a 25 bps September cut, up from 89% just a week earlier, after July JOLTS job openings fell to 7.18 million - the weakest since September 2024.

Fed officials are divided:
- Neel Kashkari has warned that tariffs are raising consumer costs, keeping inflation sticky.
- Raphael Bostic acknowledges inflation risks but sees labour weakness pointing to a single cut this year.
- Political tension has heightened after Trump’s comments about replacing Jerome Powell, though Fed nominee Stephen Miran pledged to uphold central bank independence.
This policy uncertainty adds volatility to USD trading.
Market impact and scenarios
- Bullish USD case: Sustained PMI gains push the index above 50, reducing Fed cut expectations and attracting inflows. This could lift the USD against peers, with forecasts pointing to EUR/USD near 1.19 and USD/JPY at 141 by late 2025.
- Bearish USD case: Tariff costs, capital outflows, and weak jobs undercut recovery, driving the dollar lower. J.P. Morgan projects EUR/USD at 1.22 by March 2026.
- Neutral case: Modest manufacturing gains are offset by dovish Fed policy, keeping the USD range-bound around current levels.
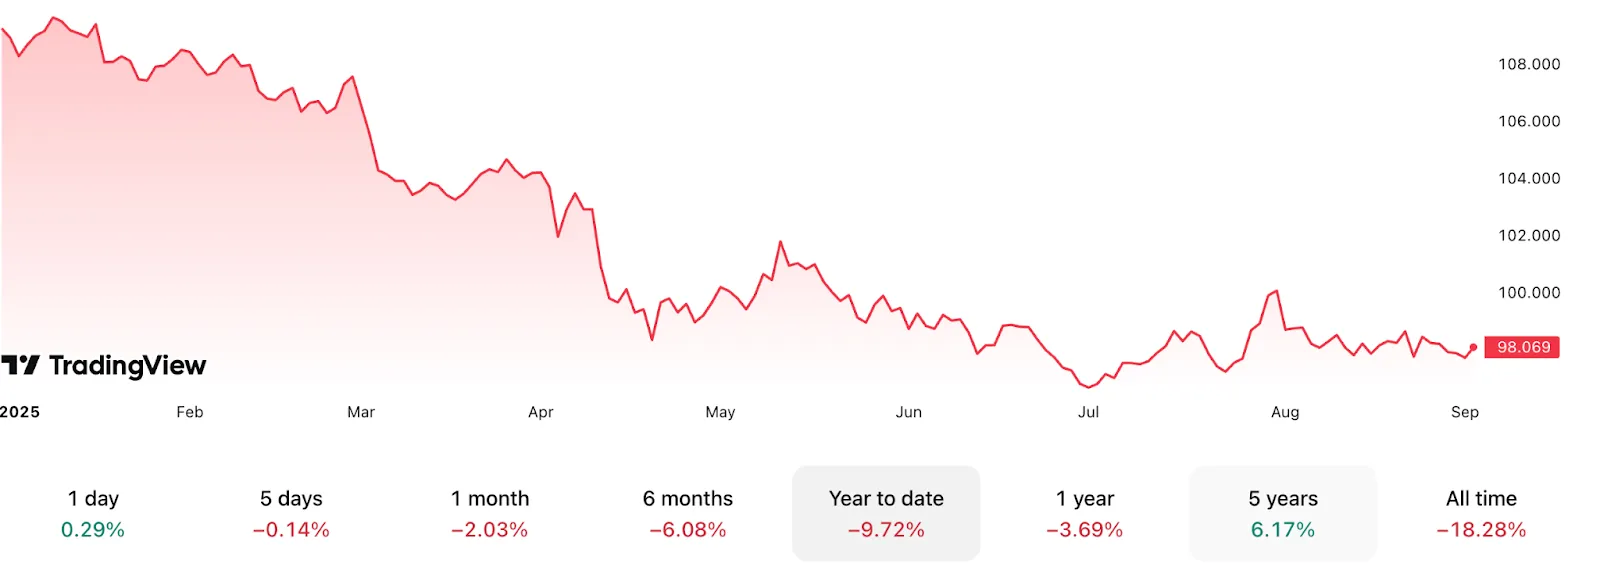
Dollar index technical insights
At the time of writing, the dollar is seeing a slight rebound close to the $98.29 resistance level - hinting at a potential drawdown. Volume bars slightly dominant bullish pressure - buttressing the case for an uptick unless sellers push back with more conviction. If a strong uptick materialises, it could breach the $98.29 resistance level on the way to the next resistance level at $100.10. Conversely, if we see a drawdown, prices could find support at the $97.70 price level.

Investment implications
For traders and portfolio managers, the USD’s outlook in 2025 is finely balanced.
- Short term: PMI surprises and NFP releases will dominate USD moves, with volatility likely around data prints.
- Medium term: Manufacturing recovery could offer support, but tariff and employment headwinds limit upside.
- Long term: Fiscal concerns and global capital reallocation suggest structural risks for the dollar, even if near-term resilience holds.
Investors are expected to monitor PMI releases, labour data, and tariff developments closely. Tactical opportunities may emerge around PMI-driven rallies, but medium-term positioning should hedge against downside risks if recovery momentum stalls.
Trade the next movements of the US dollar with a Deriv MT5 account today.

Can Google maintain its rally as US tech stocks hit $22.7 trillion in value?
Alphabet’s rally has solid foundations in earnings growth, cloud momentum, and AI integration, but its sustainability will depend on whether broader market concentration triggers a correction.
Yes - Alphabet’s rally has solid foundations in earnings growth, cloud momentum, and AI integration, but its sustainability will depend on whether broader market concentration triggers a correction. Google’s stock is up 9.2 percent over the past month, adding $123 billion in value after a favourable court ruling, and analysts now project double-digit revenue and earnings growth through 2026. This strength suggests further upside is possible, though the sheer dominance of US tech - now worth $22.7 trillion and 40 percent of the S&P 500 - means risks are amplified if sentiment turns.
Key takeaways
- Alphabet stock jumped 5 percent on 2 September 2025 after a court confirmed it would not have to sell Chrome.
- Market cap closed at $2.57 trillion, with a 9.2 percent gain over the past month.
- Google Cloud revenue rose 32 percent year over year in Q2 2025, outpacing Microsoft Azure and Amazon Web Services.
- Alphabet’s EPS forecast for 2025 is $10, up 24.4 percent year over year, with positive revisions in the last month.
- The top 10 US stocks together equal 40 percent of the S and P 500, an all-time high.
Google Chrome ruling sparked a rally
Alphabet’s September rally was sparked by regulatory relief. Investors had feared a forced divestiture of Chrome, which would have weakened Google’s integrated ecosystem. The favourable ruling cleared that risk, restoring confidence in Alphabet’s ability to defend its market share across Search, YouTube, and Ads.

Alphabet earnings forecast adds to the optimism
The company’s fundamentals are reinforcing this optimism:
- Earnings momentum: EPS is projected at $2.33 for the current quarter (+9.9 percent YoY) and $10 for fiscal 2025 (+24.4 percent YoY). Estimates have been revised upward in recent weeks, a positive signal historically correlated with near-term price strength.
- Revenue trajectory: Q3 2025 revenue is forecast at $84.53 billion (+13.4 percent YoY). For the full year, Alphabet is expected to generate $334.62 billion in sales, rising to $375.31 billion in 2026 (+12.2 percent).
- Cloud growth: Google Cloud’s 32 percent YoY growth in Q2 makes it the fastest-expanding among the top three cloud providers. Alphabet is scaling capital expenditure in 2025 to meet accelerating AI-driven demand for cloud services.
- AI integration: CEO Sundar Pichai highlighted that AI is “positively impacting every part of the business.” Google Search is seeing adoption of AI Overviews and AI Mode features, advertisers are reporting higher conversion rates from AI tools, and YouTube has rolled out Veo, an AI-powered text-to-video platform.
Alphabet’s diversified portfolio positions it uniquely: Search and Ads remain core profit engines, Cloud is a high-growth vertical, YouTube is being reshaped by AI tools, and Waymo provides long-term optionality in the autonomous ride-hailing space.
US tech stocks are now valued at $22.7 trillion
The scale of US tech concentration is historic. With a combined market cap of $22.7 trillion, the top 10 US companies now outsize the entire Chinese and EU stock markets. The top five alone - Nvidia, Microsoft, Apple, Alphabet, and Amazon - are collectively larger than every non-US market in the world.

Analysts say this dominance reflects the transformative impact of technology on the global economy. But it also heightens systemic risks. With 40 percent of the S&P 500 tied to just 10 names, investor exposure is heavily concentrated in a narrow group of megacap stocks. International markets are increasingly dwarfed, underscoring a global capital imbalance. And while dominance can sustain momentum during growth cycles, it also raises the possibility that a shock to any of these companies could ripple far more widely than in the past.
Bull case for Google
- Earnings revisions are rising, historically linked to continued share price momentum.
- Diversification across Search, Ads, YouTube, and Cloud creates multiple growth engines.
- AI adoption is accelerating monetisation in advertising and content creation.
- Waymo could emerge as a high-value business line in autonomous mobility.
- Regulatory clarity from the Chrome ruling reduces uncertainty.
Bear case for Google
- US megacap concentration leaves markets vulnerable if sentiment shifts.
- Ongoing regulatory scrutiny, especially around AI and antitrust, could re-emerge.
- Macroeconomic risks - higher-for-longer interest rates, inflationary pressures, and stagflation fears - may compress tech valuations.
- Competitors, particularly Microsoft and Amazon in the cloud, pose continued pressure.
Market impact and scenarios
Alphabet is only 20 percent away from the $3 trillion mark, putting it in direct contention to join Apple, Microsoft, and Nvidia in the $3T club. Amazon and Meta are also contenders, with AI acting as the common driver.
If current trends hold, Alphabet could hit $3 trillion as soon as 2026. However, if regulatory or macro headwinds materialise, the high concentration of market power could amplify downside risks. For now, momentum and earnings upgrades are supportive, but the rally is tied closely to broader confidence in US tech.
Google stock technical analysis
At the time of writing, Google stock is in price discovery mode after the post-ruling rally. Volume bars paint a picture of dominant buy pressure with little pushback from sellers -hinting at a potential further rally. If sellers push back and the rally doesn’t materialise, we could see a drawdown stall around the $207.06 support level. A further drawdown could find support at the $197.00 price level, with a further crash finding support at the $174.00 price level.

Investment implications
Alphabet offers a strong case for continued growth, backed by earnings upgrades, AI-driven monetisation, and cloud leadership. Traders may find opportunities in short-term momentum strategies, especially if earnings revisions remain positive and technical support holds above current levels.
However, the extraordinary concentration of US tech - now worth more than China and the EU combined - introduces systemic risks. A correction in megacaps could drag broader indices lower. Medium-term investors may balance exposure to Alphabet with risk management tools, recognising both the upside potential of a $3 trillion valuation and the fragility that comes with such heavy concentration.
For now, the balance tilts toward continued momentum, but sustainability depends on how long AI demand, cloud growth, and investor sentiment can outweigh the structural risks of over-concentration.

Silver prices hit 14-year highs driving a potential commodities rally
Data shows silver has surged to $40.80 per ounce in 2025, its highest level in 14 years.
Data shows silver has surged to $40.80 per ounce in 2025, its highest level in 14 years. The move raises a critical question for investors. Will silver push through the $50 threshold or stall before its next major leg higher? At the same time, the S&P 500-to-Commodity Index ratio has reached a record 17.27, showing commodities are trading at one of their steepest discounts to equities in decades. According to analysts, this divergence suggests a broader commodity rebound could be taking shape, with silver positioned at the forefront.
Key takeaways
- Silver trades at $40.80, up over 30% year to date, its strongest performance since 2011.
- The S&P 500-to-Commodity Index ratio has tripled since 2022, signalling extreme equity outperformance relative to raw materials.
- Gold-silver ratio remains stretched at 88, far above the long-term average of 60, pointing to continued undervaluation.
- Speculative demand is rising, with net long futures positions in silver up 163% in 2025.
- Silver faces a persistent supply deficit, with the Silver Institute reporting a 184.3 million ounce shortfall in 2024.
- Risks include a rebound in the US dollar, slower demand in China, and short-term overbought conditions.
Commodities appear stretched against equities
The S&P 500-to-Commodity Index ratio has reached 17.27, one of its highest readings in decades. Since the 2022 bear market, US equities have soared by 71% while the global Commodity Price Index has dropped 31%.
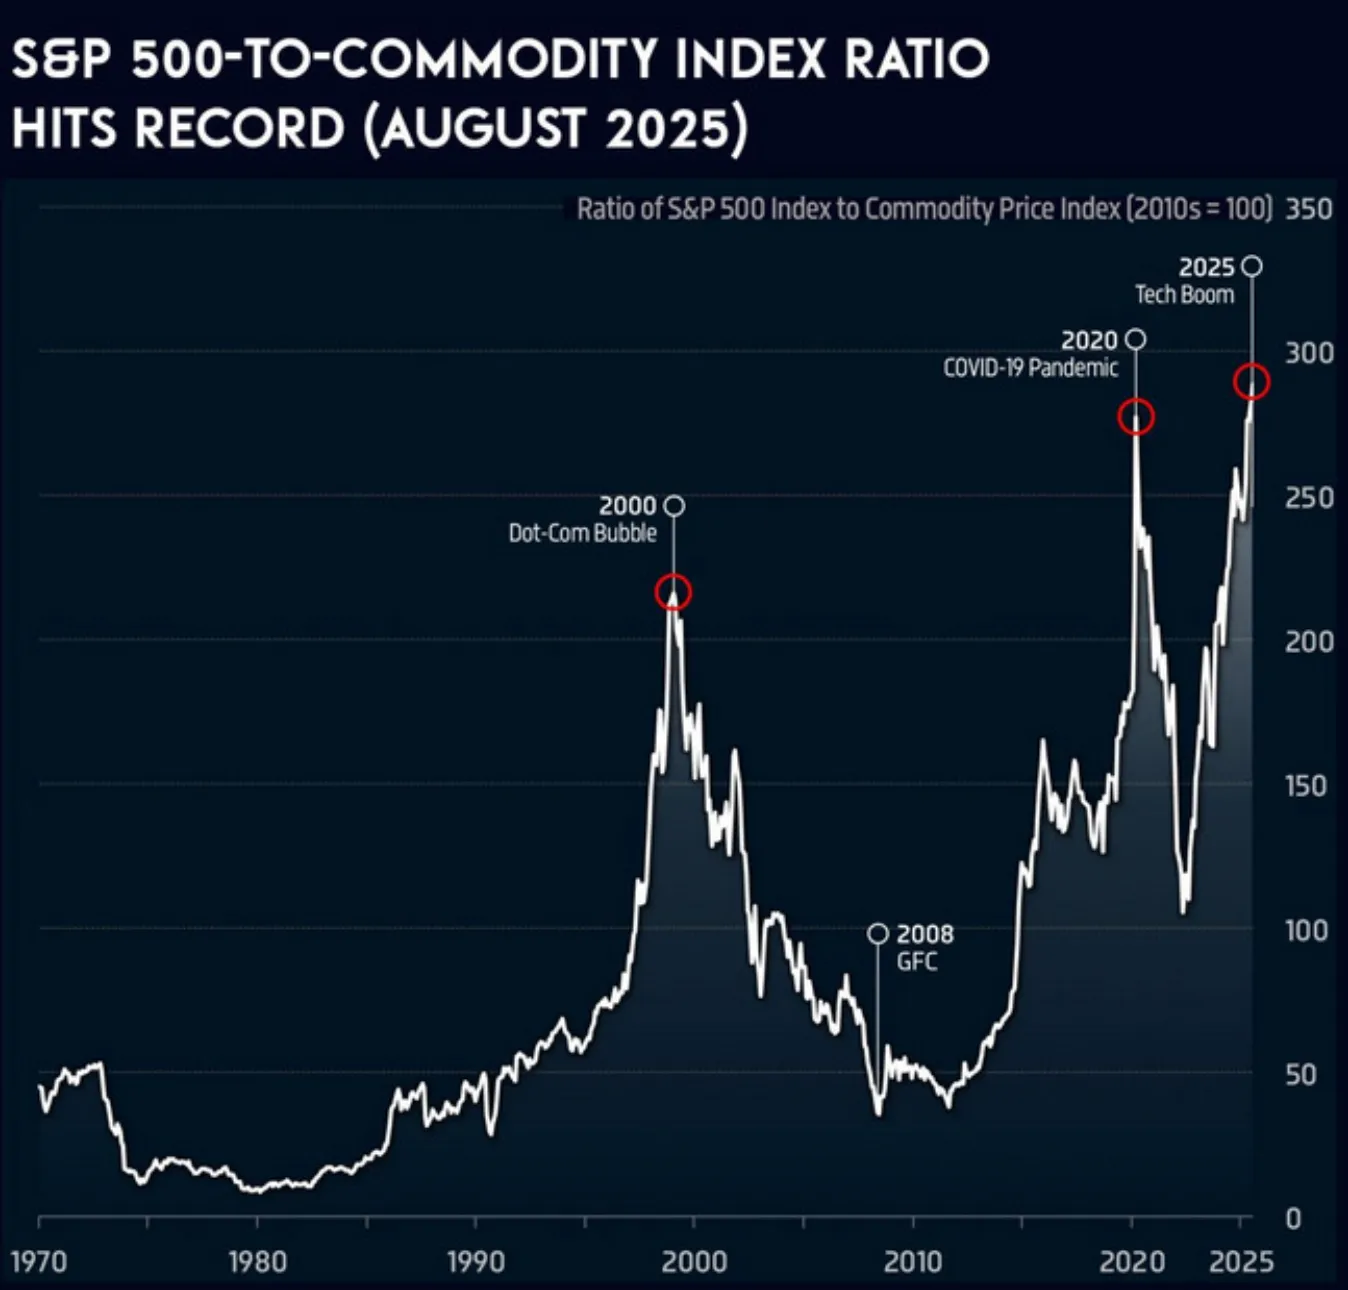
The divergence now surpasses the levels seen during the 2000 dot-com bubble, a period marked by equity overvaluation and eventual reversal. Historical cycles show that when this ratio becomes overstretched, capital often rotates from equities into commodities. Wells Fargo has already cautioned investors about trimming equity exposure, suggesting that quality bonds and commodity allocations could provide better risk-adjusted returns.
Silver broke $40 per ounce, marking a record surge
Silver has broken above $40 for the first time since September 2011, consolidating near $40.80. The breakout has been supported by a weaker US dollar - down 9.79% year to date - and growing expectations of Federal Reserve rate cuts in September 2025.
Futures markets show investors are aggressively positioning for further gains, with net long positions surging 163% in the first half of the year. Despite the rally, silver remains undervalued relative to gold, with the gold-silver ratio at 88 compared to a historical mean of around 60. This implies significant upside potential if silver begins to close the valuation gap.
Industrial demand for silver stands out in the commodity complex
Silver is unique because it straddles two markets: industrial demand and safe-haven investment. Industrial use continues to expand, and silver is critical for solar panels, electric vehicles, and AI-driven electronics.
The global push toward renewable energy means consumption is set to grow, with solar panel manufacturing alone expected to increase silver demand significantly in 2025. At the same time, geopolitical tensions are reinforcing silver’s safe-haven role.
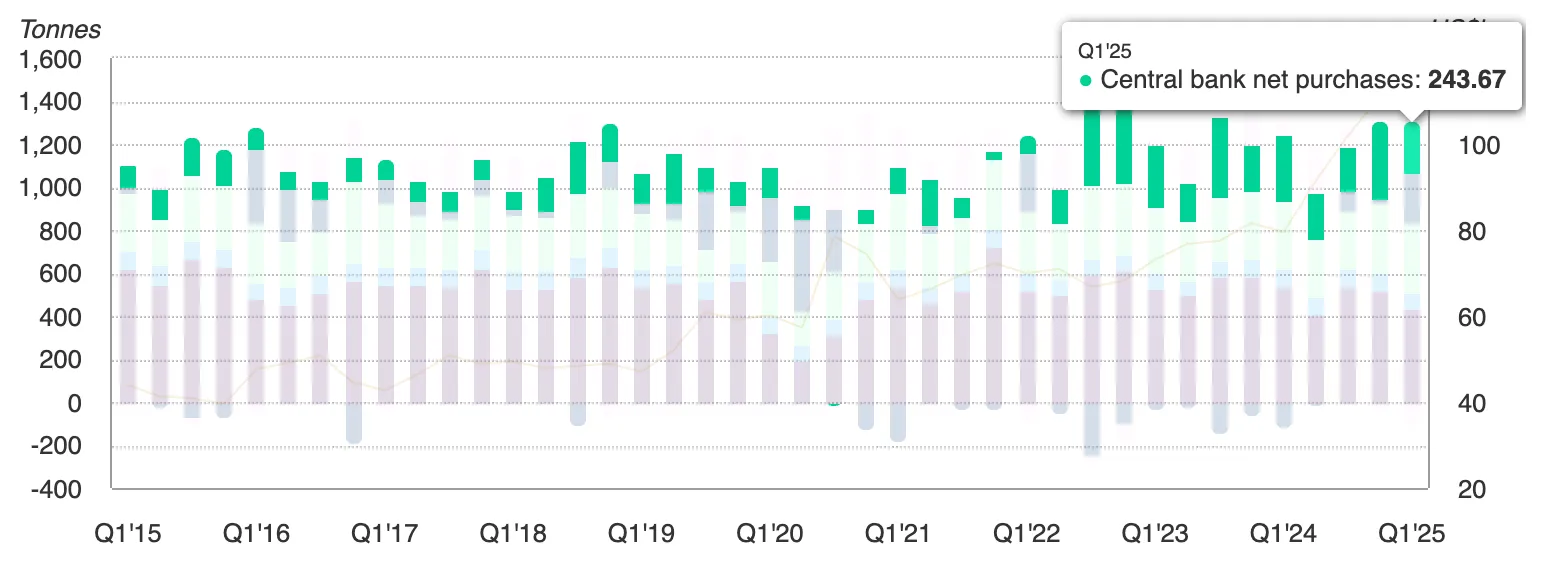
Central banks added 244 tonnes of gold in Q1 2025, and silver often follows gold during periods of monetary and political stress.
With inflation still above 2% and monetary easing on the horizon, silver is benefiting from both structural and cyclical demand drivers.
Risks to the rally
Silver’s 30% year-to-date rally raises concerns about overbought conditions in the short term. Technical indicators suggest the market could face pullbacks before mounting another leg higher.
A stronger US dollar remains a key risk, particularly if DXY returns to the 100–110 range. Weakening demand in China or advanced economies would also hurt silver’s industrial side, especially in electronics and renewables. These risks suggest silver’s path to $50 may not be linear, but the broader macro and supply-demand picture remains supportive.
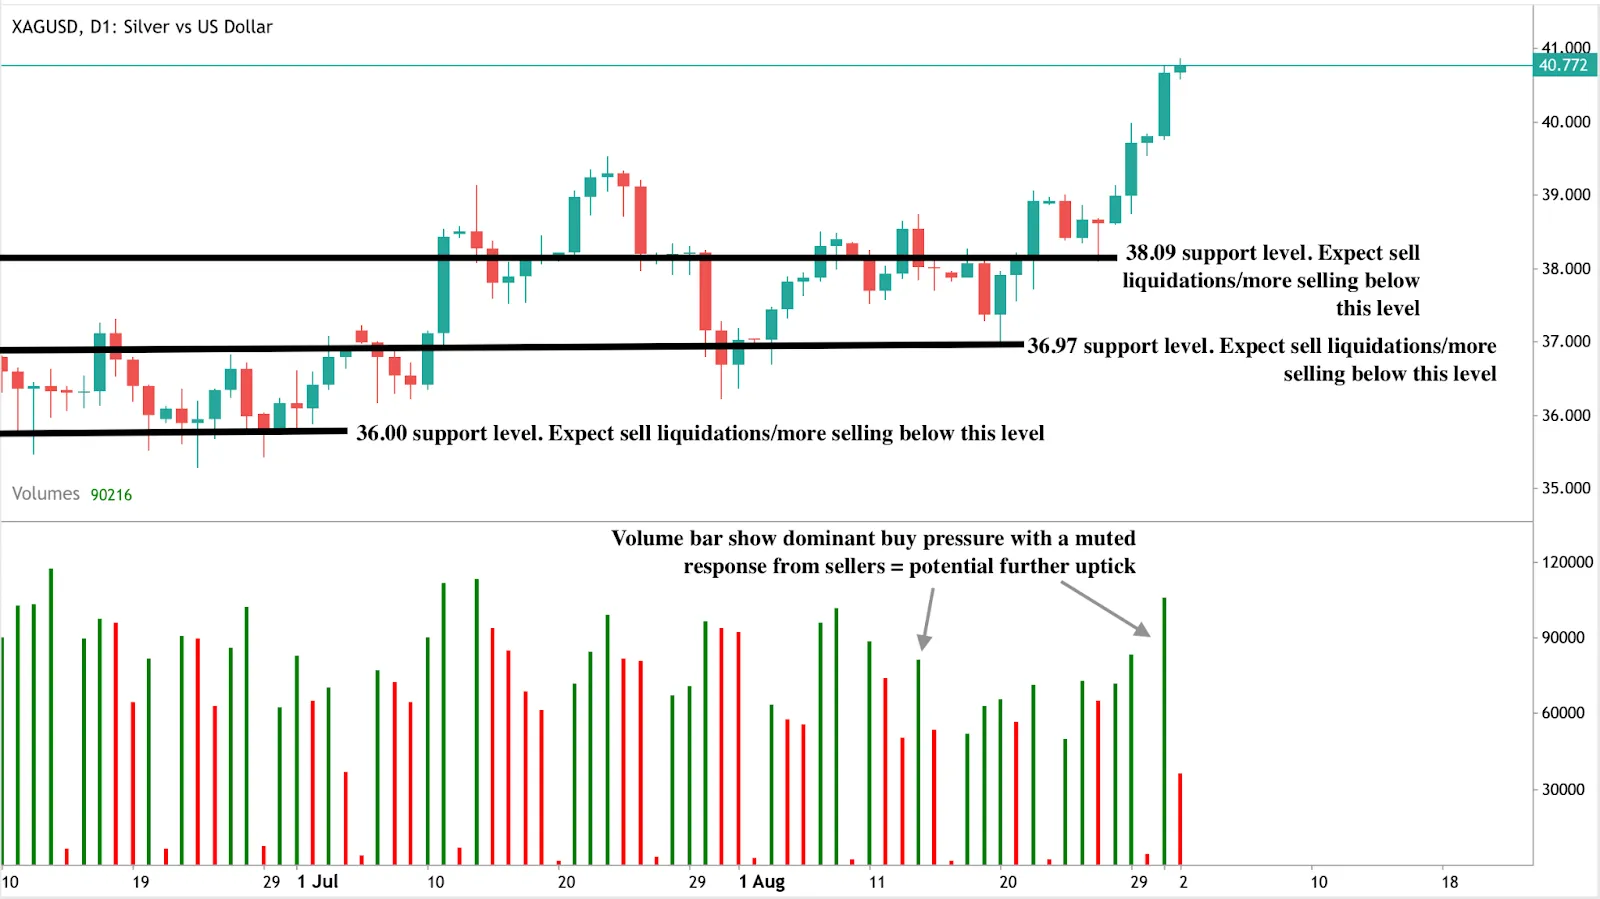
Silver technical analysis
At the time of writing, silver is in price discovery mode with potential higher highs in sight. The volume bars showing dominant buy pressure support this bullish narrative. If the rally extends, the industrial metal could test $45 on the way to $50. Conversely, if selling pressure emerges, immediate support sits at $38.09, with deeper pullbacks potentially holding at $36.97 and $36.00. These levels are crucial for traders monitoring downside risk, as they mark the floors where buyers may attempt to re-enter the market.
Investment implications
For traders, silver’s breakout above $40 confirms bullish momentum, but the metal’s high volatility means risk management is essential. Short-term strategies may focus on buying dips near support levels at $38.09, $36.97, and $36.00, with upside targets at $45 and $50. A breakout above $50 would mark a structural shift in silver’s long-term trend and could invite further speculative inflows.
For medium - to long-term investors, silver’s undervaluation relative to gold and equities, combined with structural supply deficits, supports holding exposure as part of a broader commodity allocation. Silver-linked ETFs, mining equities, and commodity baskets that include precious and industrial metals offer ways to capture upside.
For portfolio managers, the extreme S&P 500-to-Commodity Index ratio suggests it may be prudent to trim equity exposure and rebalance into undervalued commodities. Silver, with its unique mix of industrial growth demand and safe-haven qualities, stands out as a leading candidate for outperformance if the next commodity cycle begins in 2025.

Can Bitcoin ETF inflows shift the asset into its next bull cycle?
The immediate question for traders is whether these flows can lift Bitcoin through resistance or if the rally will pause as gold continues to attract safe-haven demand.
Yes - sustained ETF inflows are already reshaping Bitcoin’s market structure and could act as the catalyst for its next bull cycle. Bitcoin ETFs have doubled their assets under management in the past year to $150 billion, compared with $180 billion for gold ETFs. Inflows remained strong, with $179 million added in a single day on 28 August, led by Ark 21Shares and BlackRock’s IBIT fund.
This momentum reflects accelerating institutional adoption, which has reduced Bitcoin’s volatility by 75% from 2023 levels. The immediate question for traders is whether these flows can lift Bitcoin through resistance or if the rally will pause as gold continues to attract safe-haven demand.
Key takeaways
- Bitcoin ETF assets have surged 100% in the past year to $150 billion, closing in on gold ETFs at $180 billion.
- BlackRock’s IBIT fund leads globally with $86.2 billion in AUM and nearly all U.S. Bitcoin ETF inflows.
- Daily inflows remain strong, with $179 million added in one session and $2.54 billion traded.
- ETF adoption has made Bitcoin more investable, reducing volatility and aligning it with institutional portfolios.
- Gold continues to attract central bank demand, with 710 tonnes purchased in 2025 and ETF inflows of $21.1 billion.
- Portfolio strategies increasingly combine both assets: 5–10% Bitcoin, 10–15% gold.
Bitcoin ETF assets are closing in on gold ETF
Just three years ago, gold ETFs were five times larger than Bitcoin ETFs. Today, Bitcoin ETF assets have reached $150 billion against gold’s $180 billion. If current growth continues, Bitcoin ETFs could surpass gold ETFs as early as 2026.
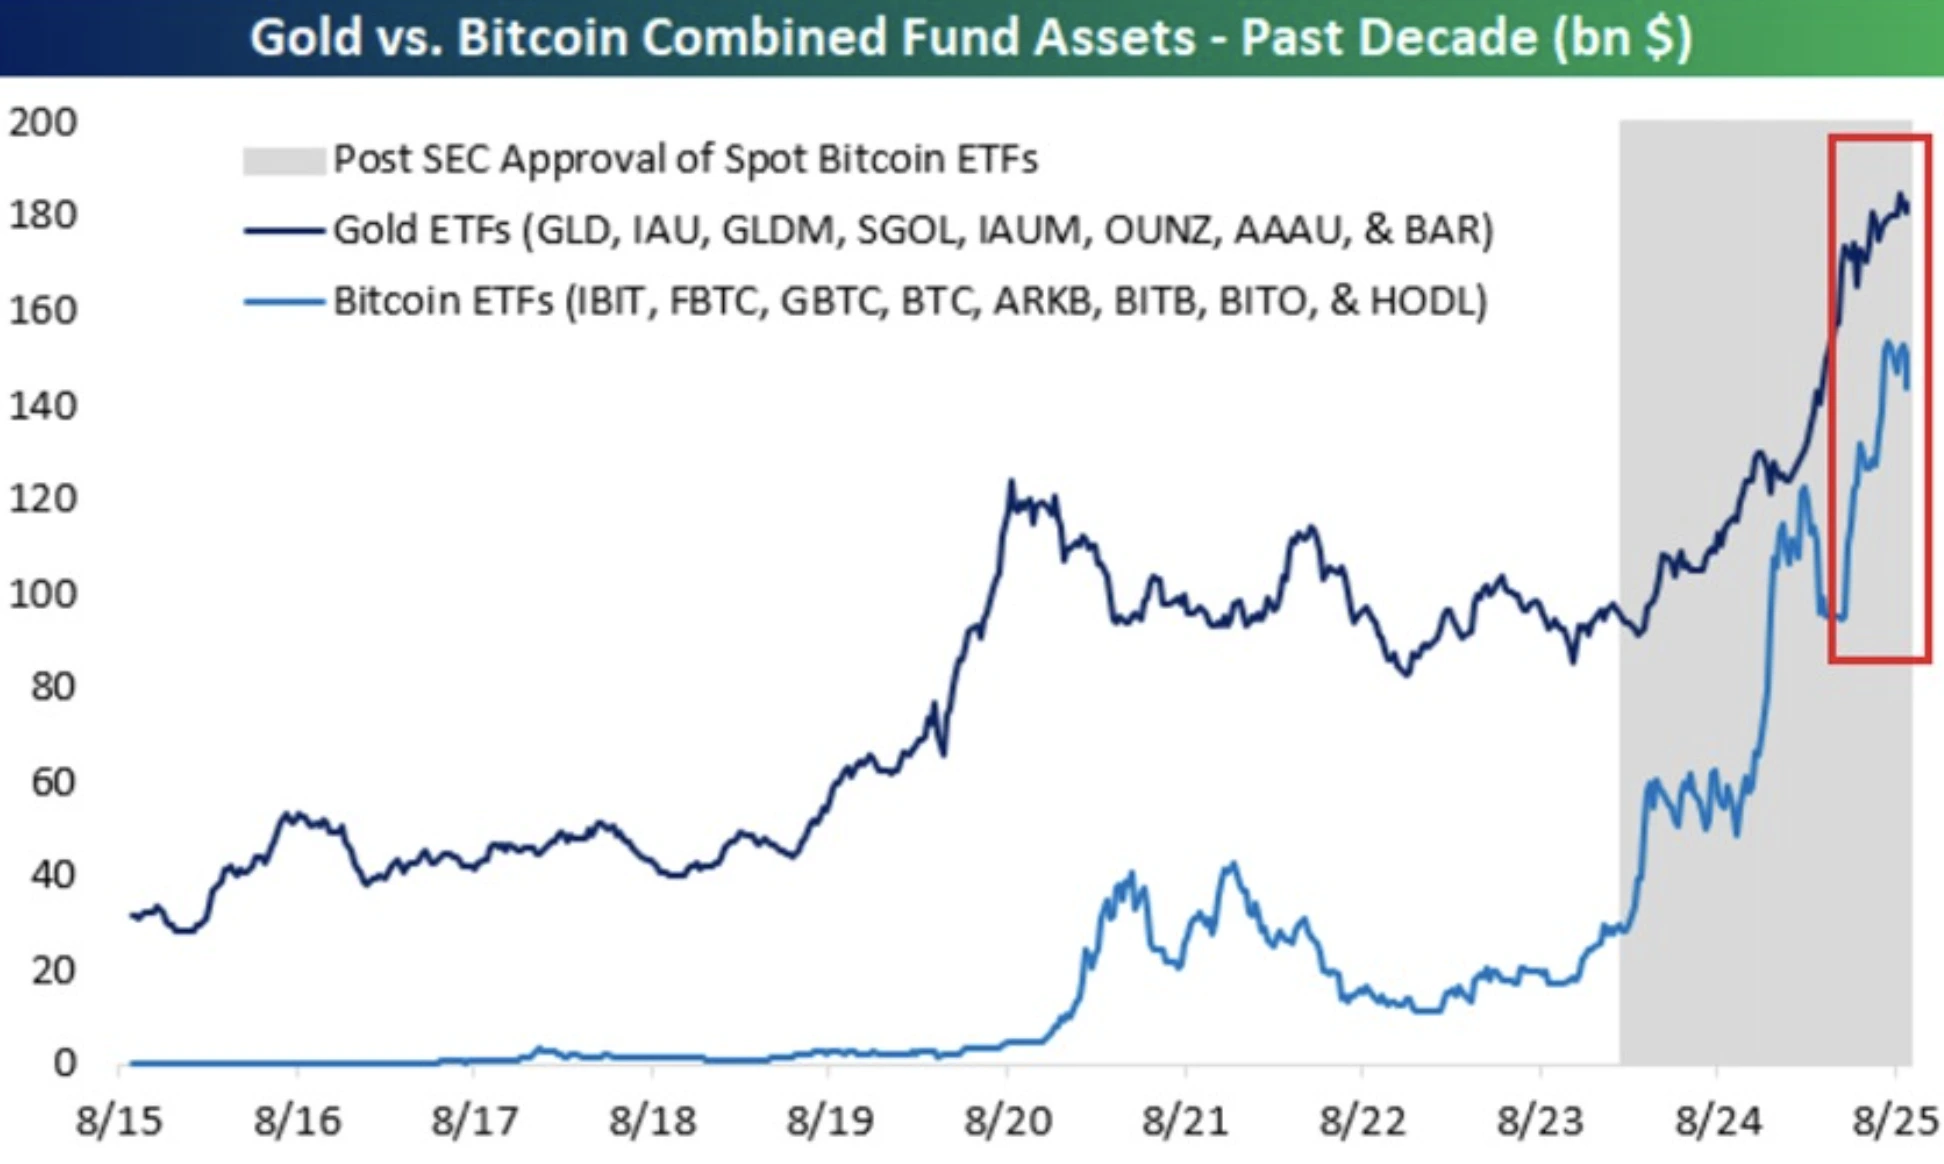
This narrowing gap signals a broader shift in investor confidence from a centuries-old safe haven to a digital store of value less than two decades old.
Inflows signal strong institutional demand
Bitcoin ETFs are recording consistent inflows. On one day alone, $179 million flowed into Bitcoin ETFs, with no outflows reported.
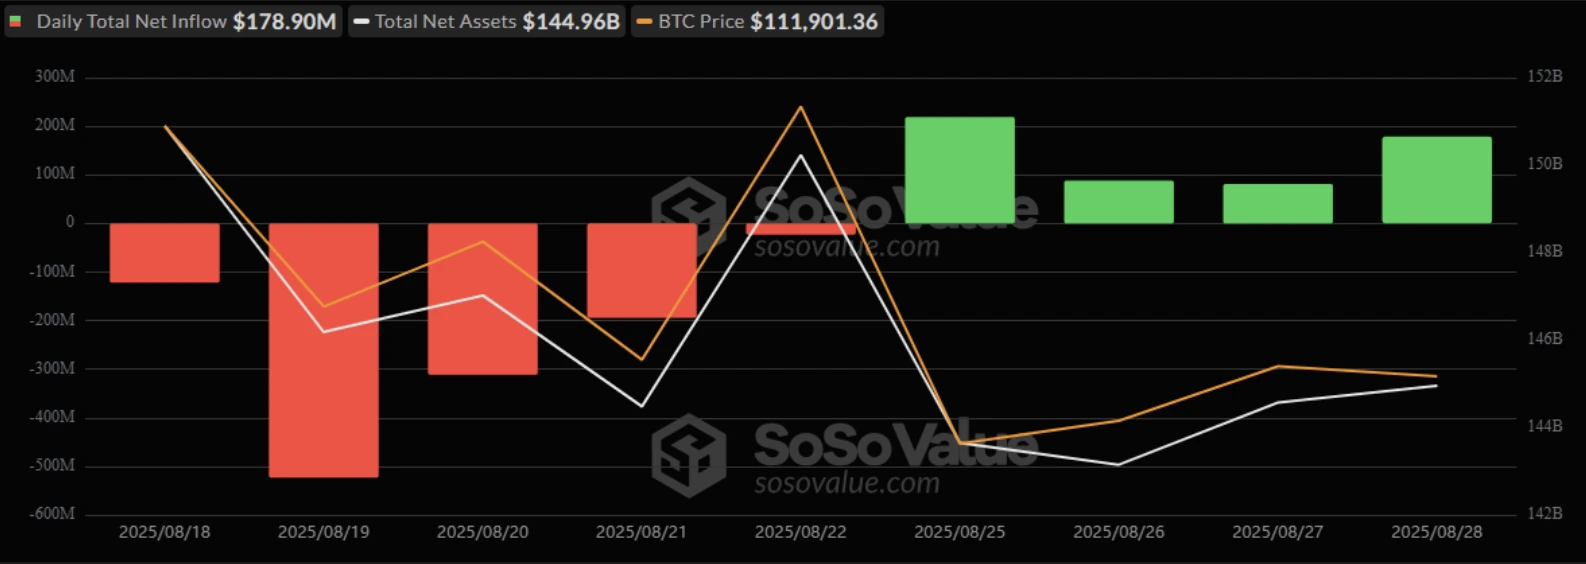
Ark 21Shares’ ARKB led with $79.81 million, followed by BlackRock’s IBIT with $63.72 million. Additional inflows came from Bitwise’s BITB ($25.02 million), Grayscale’s Bitcoin Mini Trust ($5.45 million), and Fidelity’s FBTC ($4.89 million). This lifted sector AUM to $144.96 billion, with $2.54 billion in total trading volume for the day.
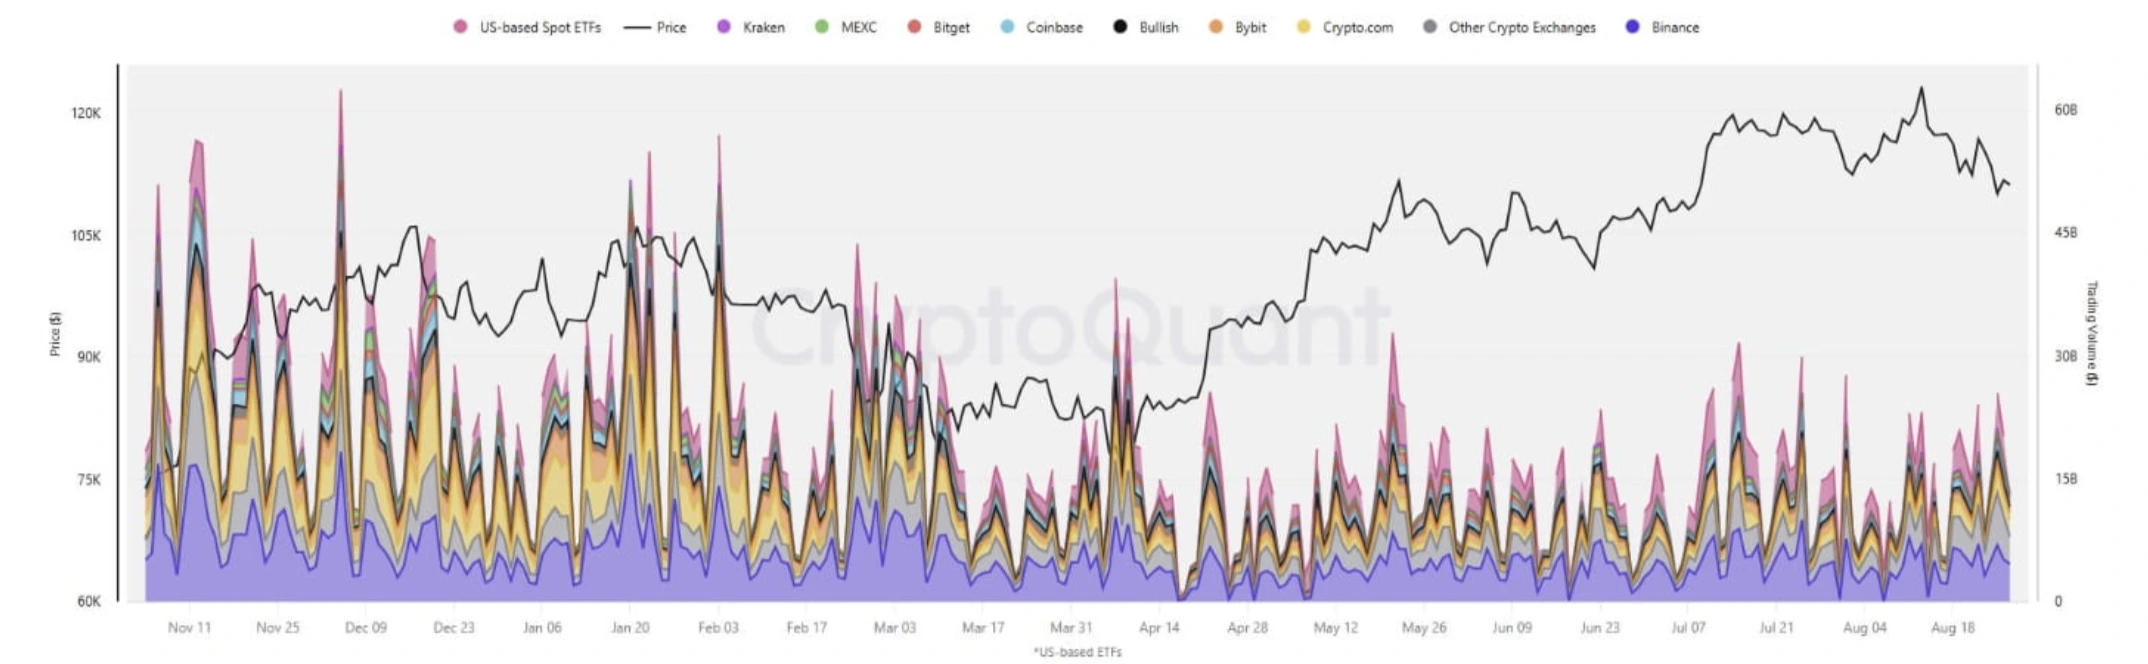
Such inflows highlight ETFs as the new engine of Bitcoin liquidity. Spot Bitcoin ETFs in the U.S. now generate $5-10 billion in daily volumes on peak days, providing institutional-scale entry points. With ETFs now accounting for roughly 20% of new liquidity entering the crypto market, they are increasingly decisive in shaping Bitcoin’s trajectory.
Bitcoin adoption through regulation
The SEC’s approval of spot Bitcoin ETFs provided the breakthrough for institutional adoption. BlackRock’s IBIT dominates with $86 billion in AUM, capturing nearly 97% of Q2 inflows. For institutions, Bitcoin now offers a hedge against monetary easing and inflation, with correlations to both equities and interest rate cycles.
Bitcoin ETF vs gold ETF: Gold still plays the safe-haven role
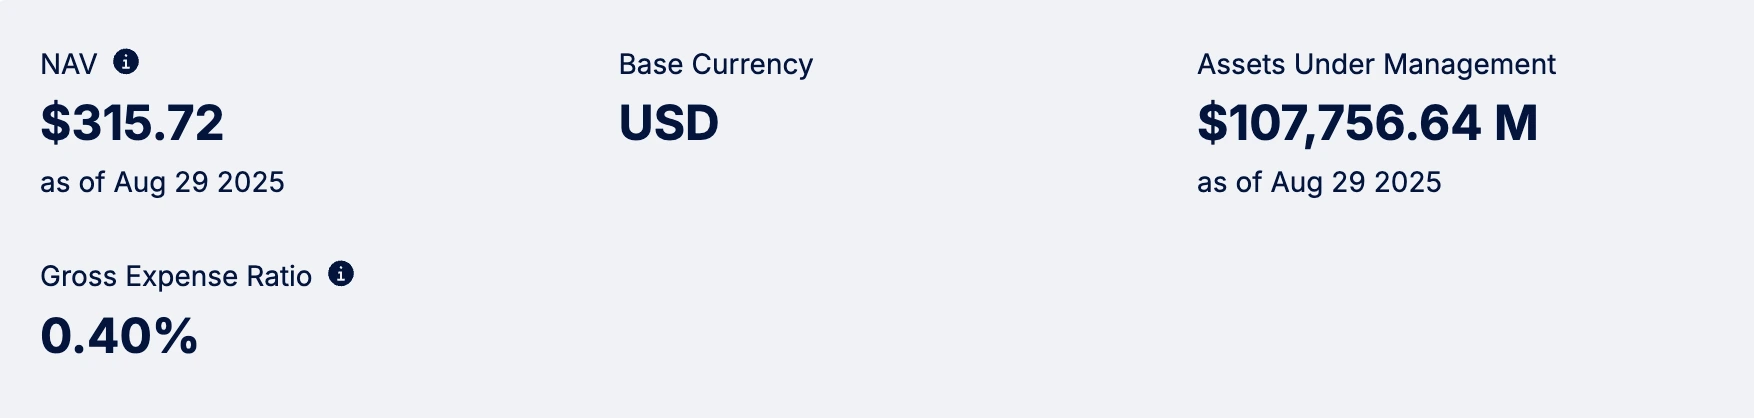
Despite Bitcoin’s rapid rise, gold remains a cornerstone in global portfolios. Central banks bought 710 tonnes in 2025, while ETFs absorbed $21.1 billion in inflows. The SPDR Gold Shares (GLD) remains the largest fund with $104.45 billion in AUM.
During Q2 2025, gold ETFs attracted $3.2 billion in inflows during geopolitical stress, demonstrating that gold still outperforms Bitcoin when risk aversion spikes.
Generational and institutional divide
Investor surveys confirm shifting preferences. Among 730 respondents, 73% of Millennials and Gen Z preferred Bitcoin over gold for long-term allocation, citing transparency and growth potential.
Institutions are catching up, with 59% now allocating over 5% or more of portfolios to Bitcoin. ETF structures have lowered custody and compliance barriers, accelerating adoption across the professional investment space.
Bitcoin price technical analysis
For traders, the central question is whether ETF inflows can lift Bitcoin through resistance. Analysts see long-term potential up to $200,000 by 2026–2027, but near-term moves hinge on whether flows remain strong. Recent streaks of daily inflows, combined with reduced volatility and deepening liquidity, suggest the foundation is in place for a breakout if momentum continues.
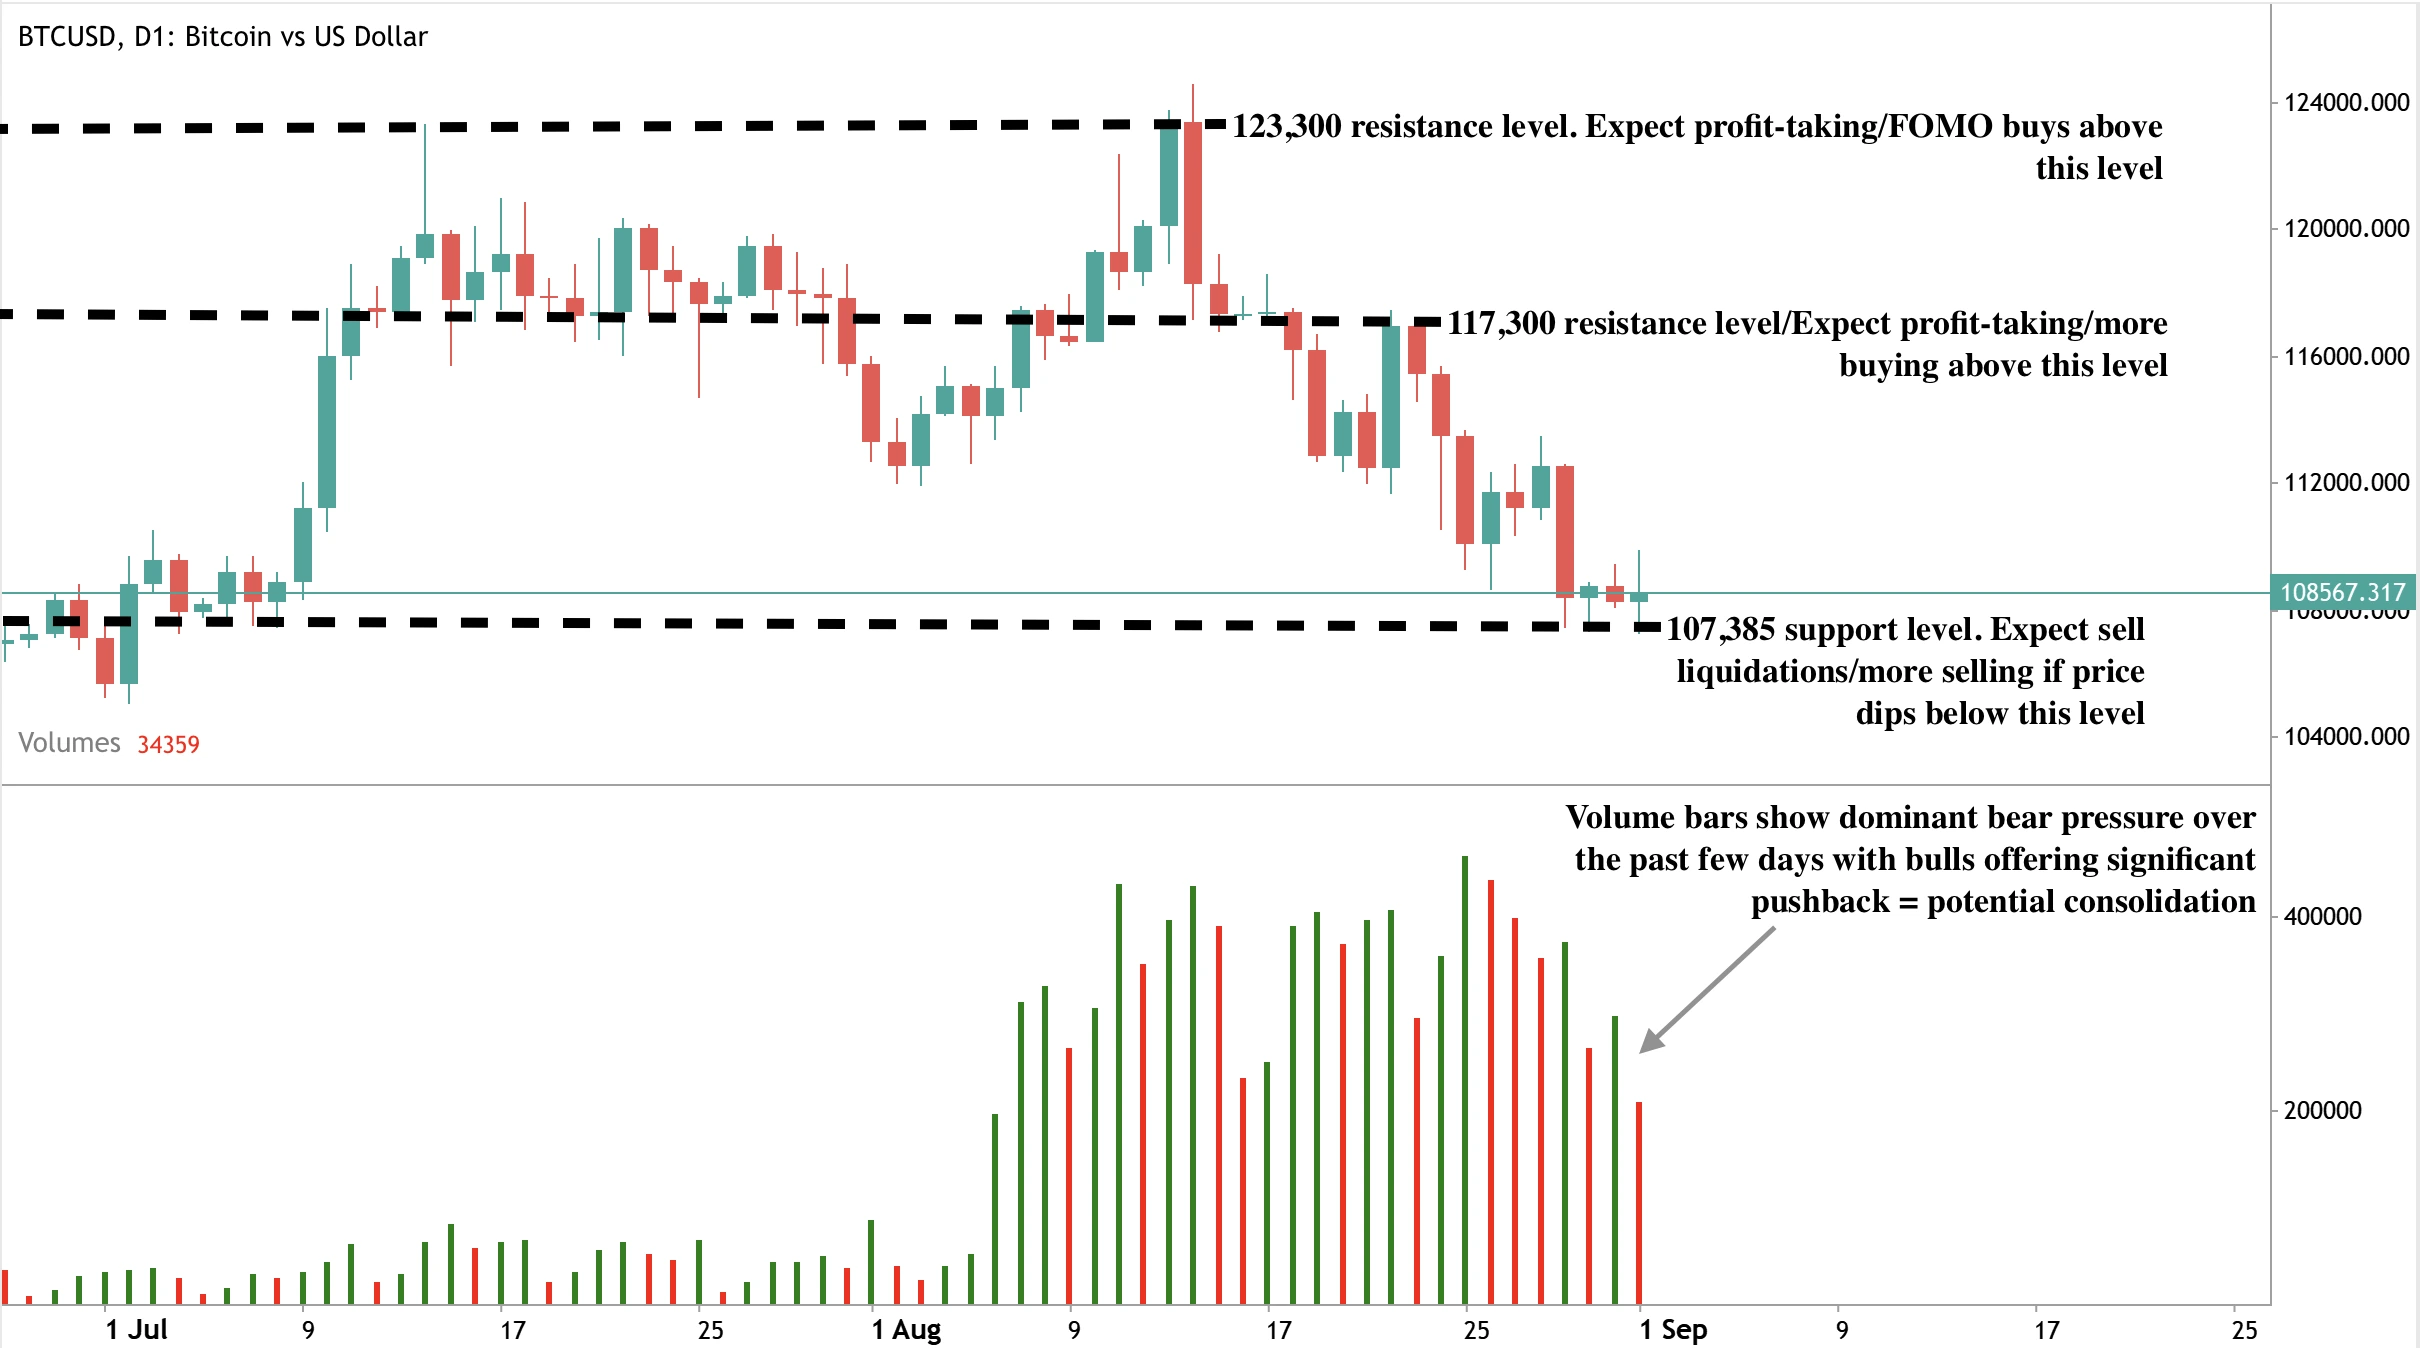
At the time of writing, Bitcoin is sitting at a support and resistance level, with sellers closing in on a buy zone. If sellers breach current levels and send prices tumbling, they could find support at the $107,385 price level. If we see an uptick, prices could find resistance at the $117,300 and $123,380 resistance levels.
Investment implications
ETF inflows are now the dominant force behind Bitcoin’s market structure. For traders, this means that institutional demand is the key indicator to watch. If inflows continue at current levels, Bitcoin has the liquidity base to enter its next bull cycle. If flows stall, resistance could cap near-term rallies.
For medium-term investors, a dual allocation strategy remains optimal: Bitcoin for growth and inflation hedging and gold for crisis protection. As ETFs accelerate the adoption of both assets, Bitcoin’s challenge to gold is not just about performance - it marks a structural change in global capital allocation.
Trade on the next movements of Bitcoin with a Deriv MT5 account today.
Frequently asked questions
Why are Bitcoin ETFs growing so quickly?
The SEC’s approval of spot ETFs in 2024 gave institutions a regulated entry point. This unlocked large inflows, with BlackRock’s IBIT alone managing over $86 billion. ETFs now trade billions daily, making Bitcoin far more accessible and liquid than in previous cycles.
Why does gold remain relevant?
Gold still dominates in crises. Central banks bought 710 tonnes in 2025, and ETFs attracted over $21 billion. During geopolitical shocks, gold consistently outperforms Bitcoin as the go-to safe haven.
What is the typical portfolio allocation in 2025?
Most diversified strategies allocate 5–10% to Bitcoin and 10–15% to gold. This balance captures Bitcoin’s upside while keeping gold as a stabiliser against macro and geopolitical risks.
Can ETF inflows really move Bitcoin’s price?
Yes. On one recent day, Bitcoin ETFs pulled in $179 million with no outflows. With ETFs now providing about 20% of new crypto liquidity, sustained inflows are a direct driver of Bitcoin’s price action around resistance.

Will gold central bank buying sustain its rally as dollar reliance fades?
The short-term outlook hinges on shifting variables, which will determine whether gold can push above $3,450 or remain capped below it.
Yes, central bank demand is a powerful force shaping gold’s long-term trajectory, as countries diversify reserves away from the US dollar and reinforce a trend of de-dollarization. This steady official-sector buying provides a strong foundation for prices, acting as a safety net even in volatile conditions. At the same time, the short-term outlook hinges on shifting variables — from Federal Reserve policy decisions and dollar strength to broader geopolitical tensions — which will determine whether gold can push above the critical $3,450 resistance or remain capped below it.
Key takeaways
- Foreign central banks now hold more gold than US Treasuries, the first time since the 1990s.
- Global official sector gold demand hit 244 metric tons in Q1 2025, far above the five-year average.
- Gold-backed ETFs attracted $38 billion in inflows in H1 2025, after $15 billion of outflows in 2024.
- Retail buying in India and China is surging as households shift savings into gold.
- ASEAN and BRICS are formalising local-currency trade settlement systems to reduce dollar use.
- The dollar’s reserve share has slipped below 47%, while gold’s share is climbing toward 20%.
- Fed independence concerns and high September rate-cut odds are further boosting demand for non-yielding assets.
Gold central bank buying and its return as a reserve anchor
The latest World Gold Council data shows central banks bought 244 tons of gold in the first quarter of 2025, the strongest Q1 in years.
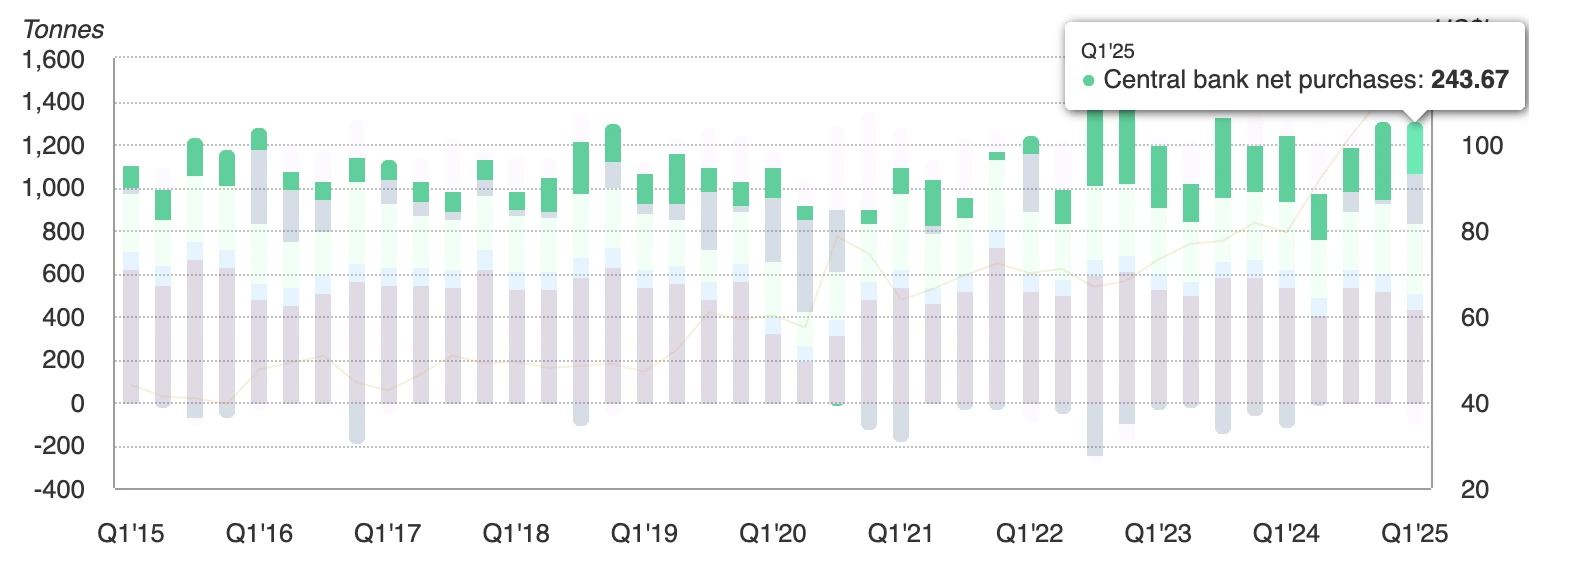
Gold now accounts for nearly one-quarter of total annual inflows, the highest proportion since the late 1960s.
This shift isn’t confined to one region. Purchases are geographically broad - from China and India to the Middle East and Latin America - underscoring how central banks are rebalancing away from dollar-denominated assets. The seizure of Russia’s reserves in 2022 accelerated this rethink, highlighting the political risk embedded in holding Treasuries.
De-dollarization trend moves from rhetoric to policy
For years, de-dollarization was a buzzword. In 2025, it has become policy.
ASEAN’s 2026–30 Strategic Plan prioritises local-currency trade settlement for goods and investment. Analysts at Bank of America estimate this could cut dollar invoicing in the bloc by 15% within five years.
BRICS economies are also expanding their cross-border payment networks, including currency-swap agreements and settlement platforms that bypass the dollar.
These initiatives are reinforced by political factors such as Trump’s protectionist stance is unnerving trading partners, while the weaponisation of dollar assets - sanctions and reserve seizures - has pushed policymakers to diversify faster.
Academic research suggests that once the perceived cost of holding dollars rises above a threshold, diversification becomes self-reinforcing. That threshold may be in sight soon with some analysts predicting that the dollar’s reserve share may drop below 50% within the next decade - down from more than 70% at the start of the century.
Gold ETF inflows renaissance as trust shifts
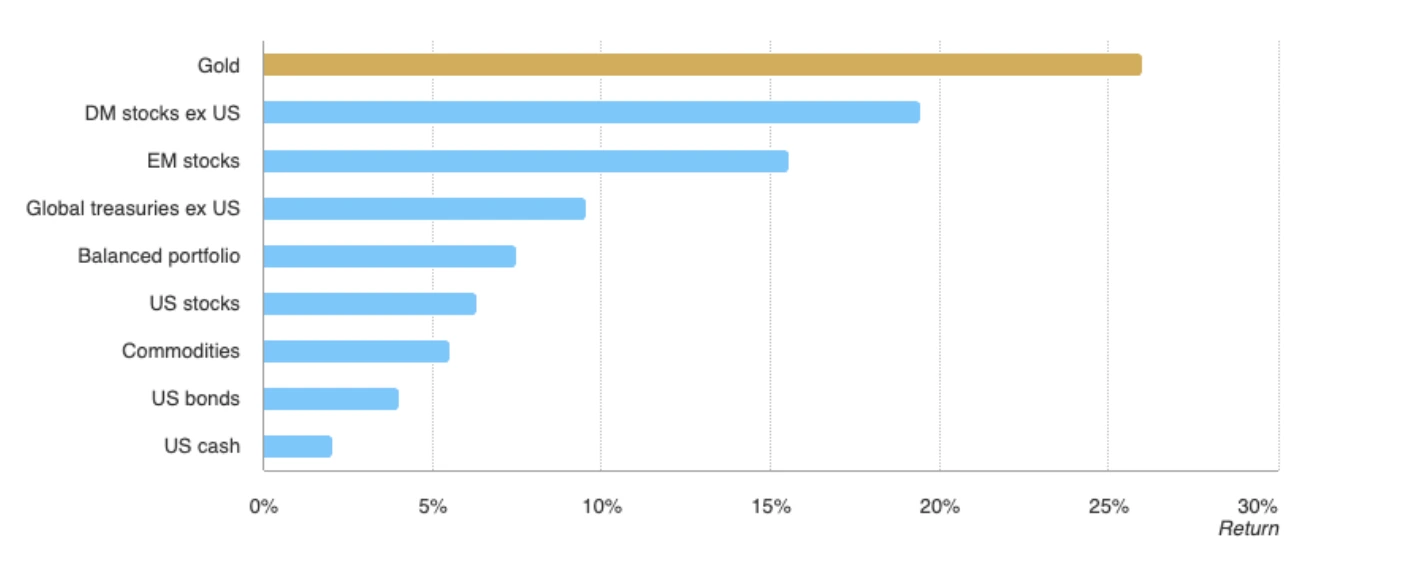
Gold has outperformed the MSCI World Index and the Bloomberg Aggregate Bond Index in 2025, as well as major global asset classes, extending its role beyond a dollar hedge to a foundation of global trust.
After two sluggish years, global gold ETFs saw inflows of nearly $38 billion in H1 2025, equivalent to 322 tons, marking the strongest start to a year since 2020. Indian and Chinese households are also buying physical gold at record levels, viewing it as a reliable store of value as local currencies face volatility.
If this trend spreads beyond Asia, spot prices could push past $3,400 toward $3,450 and beyond. Meanwhile, the traditional inverse relationship between gold and the Dollar Index continues to hold, with dollar weakness reinforcing bullion’s strength.
Fed politics add fuel to the rally
The gold rally is also being fed by political instability in Washington. President Trump’s attempt to fire Fed Governor Lisa Cook sparked a legal standoff that raised fresh doubts about the independence of the Federal Reserve.
Markets are now pricing in an 85% probability of a September rate cut, up from 84.7% a week earlier, according to CME FedWatch.

Chair Powell has acknowledged some labour market cooling, though he remains cautious on the inflation impact of Trump’s policies.
Lower interest rates reduce the opportunity cost of holding gold, reinforcing central bank and retail demand. Meanwhile, the dollar has retreated on weaker rate expectations, further boosting bullion.
Gold at $3,400 - momentum or exhaustion
Gold’s resilience around the $3,400 level has created a pivotal moment. The outlook splits into two clear paths:
- Bullish drivers
- Central bank and ETF demand is structural, not cyclical.
- De-dollarization policies are anchoring long-term flows.
- September Fed rate cut bets remain high, lowering the opportunity cost of holding gold.
- Central bank and ETF demand is structural, not cyclical.
- Bearish risks
- US GDP expanded 3.3% in Q2 2025, showing economic resilience.
- Inflation remains above target, which may slow or cap Fed easing.
- A stronger dollar rebound could stall momentum below $3,450 resistance.
- US GDP expanded 3.3% in Q2 2025, showing economic resilience.
Gold technical insights
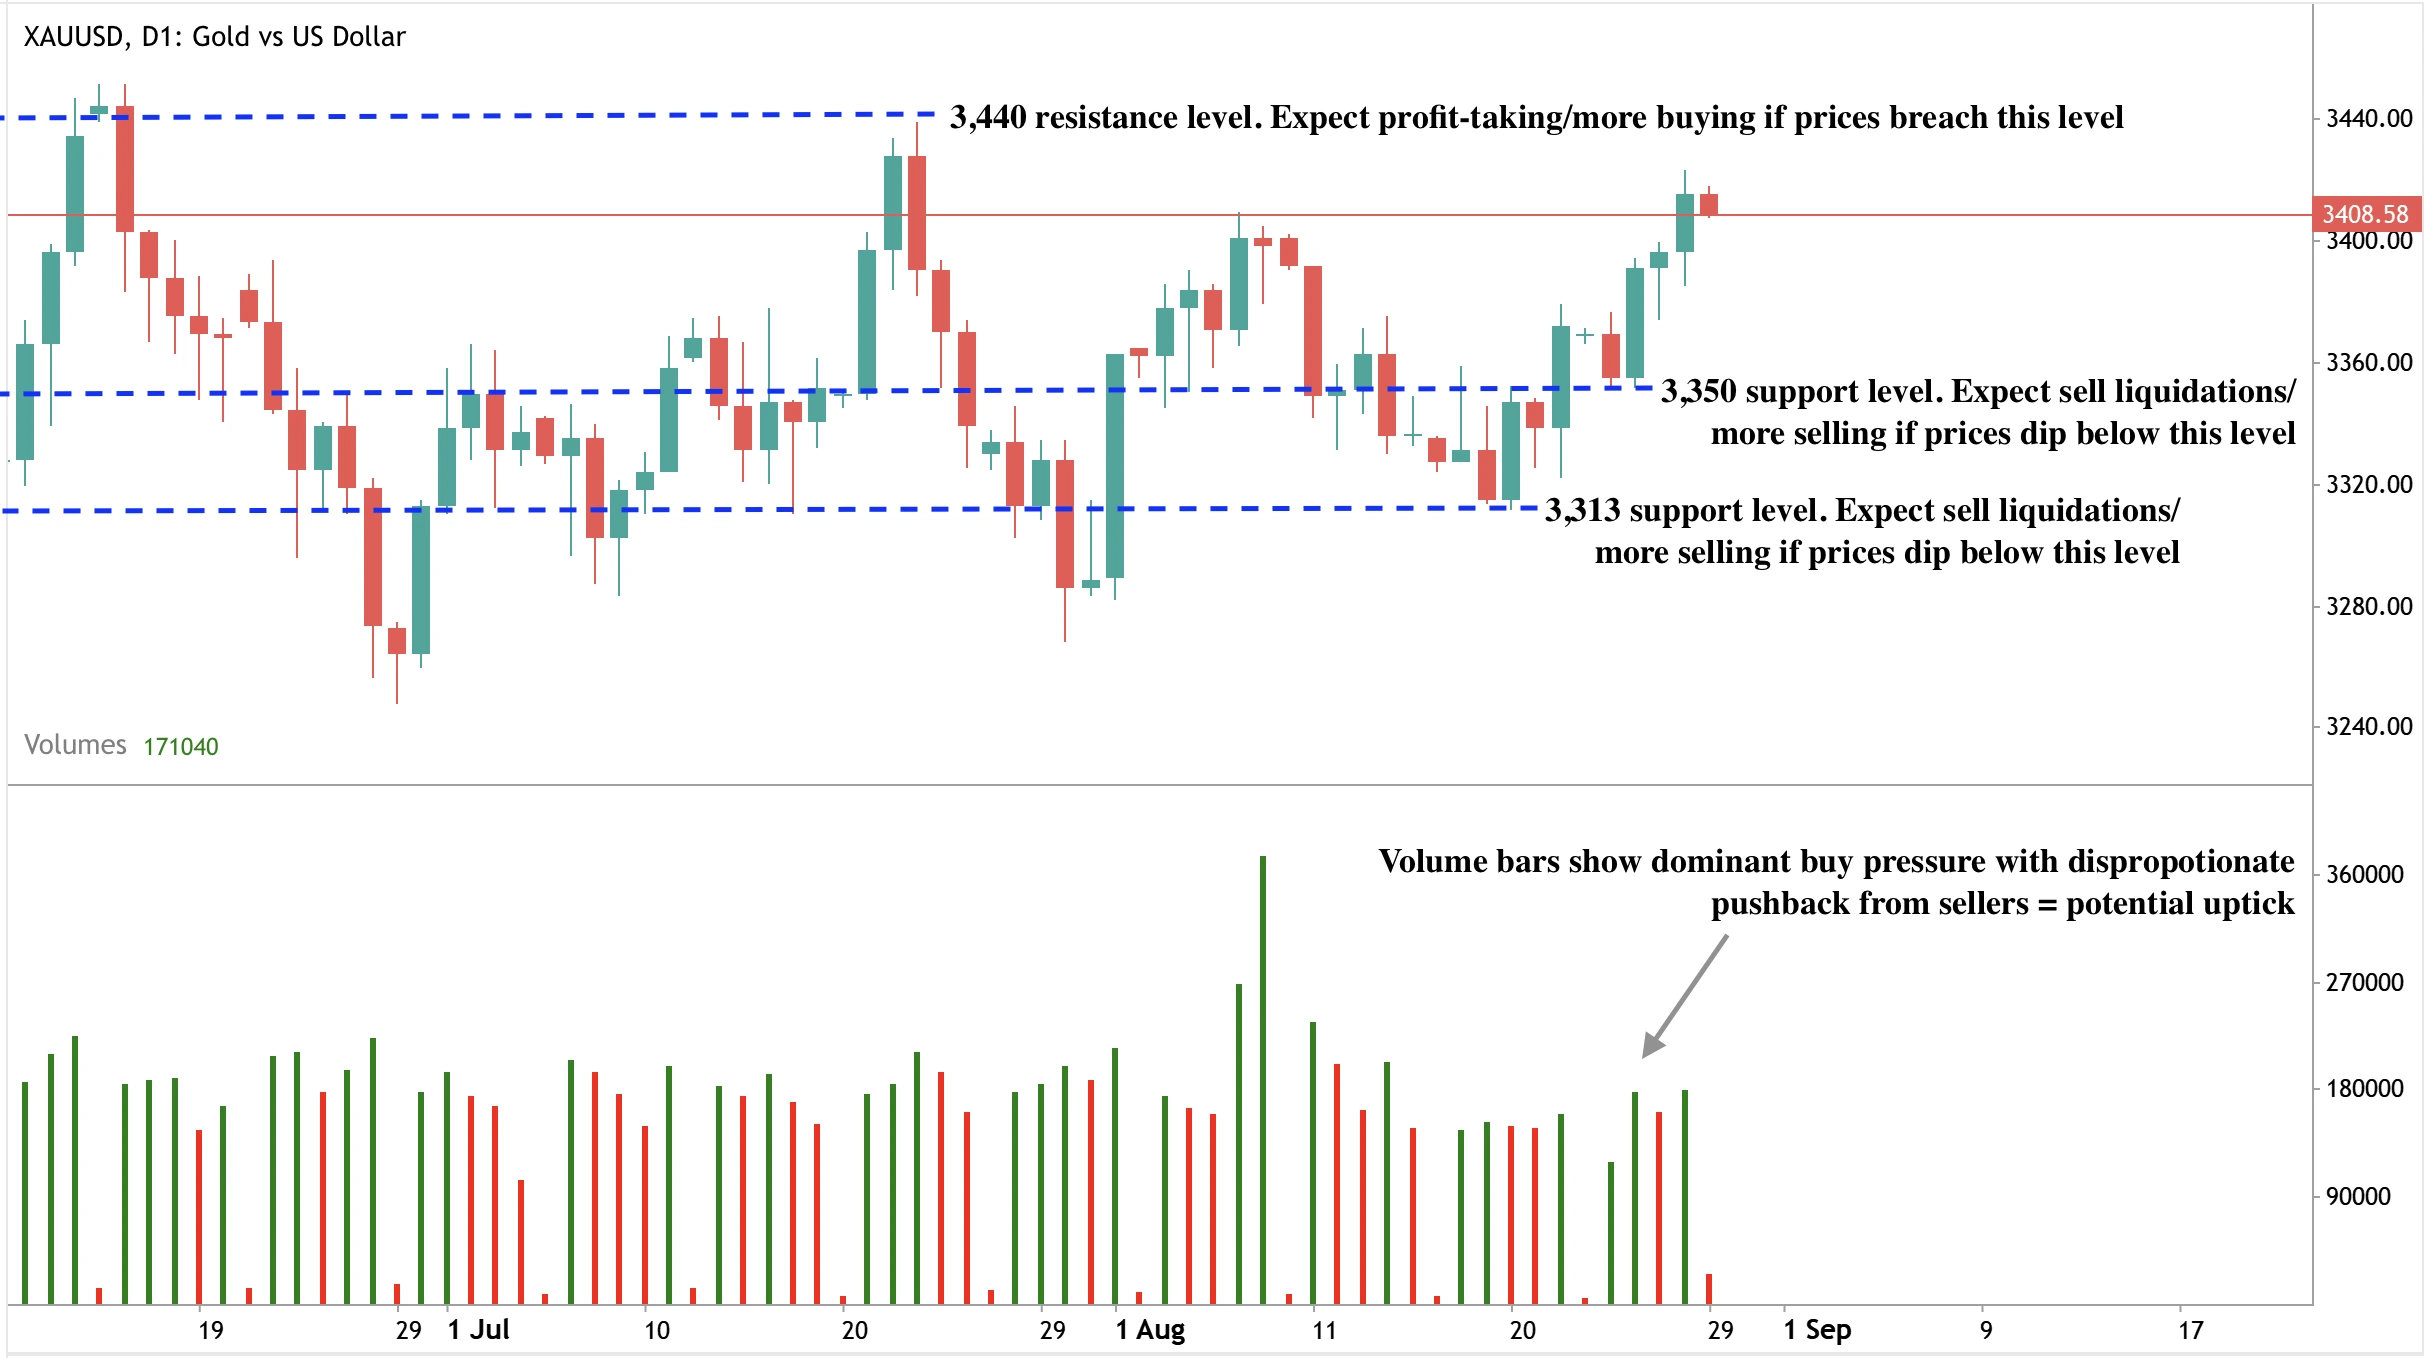
At the time of writing, gold has retreated from its monthly high rally close to a resistance level - hinting at potential reversal. However, the volume bars show dominant buy pressure with little pushback from sellers, suggesting a potential further leg up. If prices extend higher, they may face resistance at the $3,440 level. Conversely, if momentum fades, gold could find support at $3,350 and $3,313, which now form key floors for traders to watch.
Market outlook and price scenarios
If central bank and ETF demand remain firm, a break above $3,450 could trigger a new wave of technical buying, opening the path toward record highs. Conversely, if the Fed holds back on easing or inflation remains sticky, gold may consolidate below resistance and risk a pullback.
Either way, the balance of risks favours stronger long-term prices. The structural decline in dollar dominance is not a short-term trade, but a reordering of the reserve system — with gold back at the centre.
Investment implications
For investors, gold remains a portfolio diversifier rather than an all-in bet. Its role is strengthening as central banks reshape their reserves and as policymakers pursue de-dollarization strategies. In the short term, traders will watch the $3,450 level as a pivot point. In the long term, the erosion of dollar primacy suggests gold’s renaissance is far from over.
Frequently asked questions
Why are central banks buying more gold than US Treasuries?
Because Treasuries now carry both market and political risks. The 2022 seizure of Russia’s reserves showed the vulnerability of dollar assets, while gold offers neutrality, liquidity, and no counterparty risk. This makes it a more reliable anchor for reserves.
Can gold break above $3,450?
Yes, but it depends on alignment between central bank demand and Fed policy. Strong ETF inflows and Asian retail buying already support prices, and a September rate cut could be the catalyst for a clean breakout.
What risks could stall the rally?
Upside momentum could be capped if US growth stays firm, inflation proves sticky, or the dollar rebounds. Any of these would make it harder for gold to sustain levels above $3,450.
Is gold replacing the dollar as the world’s reserve asset?
Not yet - the dollar still dominates global reserves. But its share has slipped below 47% while gold is nearing 20%, showing a clear shift toward diversification. Gold is becoming a complement, not a replacement.

Nvidia’s growth outlook and the road to a $5 trillion valuation
Nvidia is unlikely to hold the title of Wall Street’s first $5 trillion giant, according to some analysts. The road ahead looks increasingly dependent on whether AI demand can sustain its current pace.
Nvidia is unlikely to hold the title of Wall Street’s first $5 trillion giant, according to some analysts. The company’s valuation has already cleared $4 trillion, and while quarterly results continue to beat forecasts, the market reaction shows investors are questioning how much upside is left. Some analysts still see Nvidia hitting $5 trillion by 2026, but the road ahead looks increasingly dependent on whether AI demand can sustain its current pace.
Key takeaways
- Q2 revenue of $46.7B vs $46.2B expected, EPS $1.05 vs $1.01 expected.
- Net income surged 59% YoY to $26.4B.
- Data centre revenue of $41.1B came in slightly below estimates, falling 1% sequentially as H20 sales dropped out.
- Guidance for Q3 of $54B ±2% does not include any H20 shipments to China.
- Nvidia approved a $60B share repurchase programme, with $9.7B already spent in Q2.
Nvidia China chips question: Is China the growth wildcard?
Nvidia’s blockbuster quarter was delivered without any contribution from China, as the company booked no sales of its H20 processors into the market. These chips, specifically designed to comply with U.S. export restrictions, have become central to Nvidia’s growth debate.
Analysts estimate that if approvals are granted, shipments could add between $2 billion and $5 billion in revenue per quarter, representing a meaningful 4–10% lift to total revenue. The geopolitical backdrop makes this opportunity highly uncertain.
The Trump administration initially banned Nvidia’s chip sales to China in April, reversed the decision in July, and then introduced a 15% levy on sales in August. Trump has also threatened a 100% tariff on semiconductors not built in the U.S., though Nvidia is likely to be exempt.
On the other side, Beijing has warned domestic companies against using Nvidia’s chips, citing alleged security risks. Nvidia has denied the claims and said it is working with Chinese authorities to address them.
The H20 itself has already created significant financial strain. Nvidia incurred $4.5 billion in writedowns related to the chip and previously said it could have added as much as $8 billion to Q2 revenue if sales had been allowed.
According to CFO Colette Kress, the company could ship between $2 and $5 billion in H20 revenue during the current quarter if the geopolitical environment permits. In short, China is both Nvidia’s greatest untapped growth driver and its most unpredictable risk.
Nvidia data centre revenue and Blackwell ramp
Nvidia’s data centre revenue rose 56% year on year to $41.1 billion, though it missed consensus estimates by $200 million.

The sequential decline reflected the loss of H20 sales, but the division remains Nvidia’s largest and most important. Revenue was $33.8 billion, down 1% quarter on quarter, while networking sales nearly doubled from a year ago to $7.3 billion.
The real story is the ramp of Nvidia’s Blackwell platform. CEO Jensen Huang confirmed that production is “ramping at full speed” and demand is “extraordinary.” Blackwell chips already account for roughly 70% of data centre revenue, with sales up 17% sequentially.
With hyperscalers such as Amazon, Microsoft, Alphabet, and Meta making up half of Nvidia’s data centre business, Blackwell’s adoption underlines Nvidia’s central role in the AI infrastructure buildout.
Nvidia’s gaming and robotics segments are strengthening
Outside the data centre, Nvidia’s gaming revenue reached $4.3 billion, up 49% year on year and above expectations. The company also highlighted GPUs tuned to run OpenAI models on PCs, broadening its reach into consumer AI.
Robotics revenue was $586 million, a 69% increase, though the segment remains relatively small. Meanwhile, Nvidia’s board authorised a new $60 billion share buyback programme, signalling confidence in its long-term growth trajectory.
Nvidia’s valuation pressures
Despite record earnings and raised guidance, the stock’s reaction highlights the challenges of a $4 trillion-plus valuation. Since the generative AI boom began in 2023, Nvidia has posted nine consecutive quarters of more than 50% revenue growth.

Yet this quarter marked its slowest growth since early fiscal 2024. With expectations sky-high, even a minor miss in data centre revenue was enough to spark a pullback.
The dynamic is clear: Nvidia is delivering near-flawless execution, but investors are demanding fresh catalysts to justify its market capitalisation. The $5 trillion milestone looks within reach, but only if growth accelerates beyond what is already priced in.
Nvidia technical analysis
At the time of writing, the stock price is almost touching a resistance level, hinting at a potential drawdown. Volume bars showing dominant sell pressure with little pushback from buyers - adds to the bearish narrative. Should the drawdown materialise, prices could tumble towards the $172.75 support level. If we see a surprising crash, prices could be held further down at the $142.00 support level. Resistance holds at the $182.54 price level.

Price action scenarios
- Bull case: China approvals allow H20 sales, which will add $2–5B per quarter and push Nvidia closer to $5T.
- Bear case: Valuation concerns and slowing growth keep the stock under pressure.
- Neutral case: Shares consolidate as investors await clarity on China and regulatory policy.
Investment implications
Nvidia remains the most important player in global AI infrastructure, with Blackwell chips and hyperscale demand supporting growth. But at $4.3 trillion, its valuation leaves little margin for error. China represents both the most significant upside and the most volatile risk factor.
For traders, the setup points to volatility. Buybacks and product leadership provide a cushion, but without progress on China, price action could remain capped. Long-term investors must decide whether Nvidia’s unmatched role in AI is enough to justify the premium, or whether the stock is already priced too far ahead of reality.
Frequently asked questions
Why did the stock fall despite strong results?
Nvidia shares slipped after its Q2 data centre revenue came in below expectations, raising fresh questions about the pace of AI demand.
What role does China play in Nvidia’s future?
China could add $2-5B in quarterly sales, but regulatory approvals and political risks mean the timeline is highly uncertain.
How important is Blackwell?
Blackwell already represents 70% of data centre revenue and is ramping fast, reinforcing Nvidia’s leadership outside of China.

What policy divergence and politics mean for EUR USD in September 2025
Many predict EUR USD will enter September at a critical juncture as traders weigh policy divergence between the Federal Reserve and European Central Bank alongside rising political risk in Europe.
Many predict EUR USD will enter September at a critical juncture as traders weigh policy divergence between the Federal Reserve and European Central Bank alongside rising political risk in Europe. Based on recent data, the pair has pulled back from last week’s post-Jackson Hole rally, with the euro pressured by French political turmoil while the dollar finds short-term support in higher yields. The key question is whether September’s data and central bank meetings will confirm a sustained rebound for the euro or extend dollar dominance.
Key takeaways
- Fed expected to cut rates on 17 September from 4.50 to 4.25 as labour market weakness deepens.
- ECB likely to hold deposit rate at 2.00 on 10 September with inflation back at target.
- Political uncertainty in France adds pressure on the euro ahead of a 9 September confidence vote.
- EUR USD trading near 1.1630 with volatility compressed ahead of data releases.
- Breakout risk rising as September meetings and data could realign rate expectations.
Fed ECB interest rate difference
The ECB’s current position reflects stabilisation in inflation and a more balanced economic outlook. July’s consumer price index showed a 2 per cent annual increase, perfectly in line with the ECB’s target.

This marks a significant improvement from the 2022–2023 inflation spike, when eurozone CPI ran above 8 per cent and forced aggressive hikes.

At Jackson Hole, Christine Lagarde stressed that the ECB will monitor economic indicators closely rather than commit to further tightening. She pointed to factors such as migration, supporting labour markets and steady wage growth as reasons why the eurozone economy remains stable despite high rates.
Markets now see an 87 per cent probability of a hold at the 10 September meeting.

The deposit rate is widely expected to stay at 2.00, with the ECB essentially signalling that policy is neither restrictive nor accommodative - a wait-and-see stance. For traders, this means the euro has no immediate rate-driven catalyst, leaving the focus squarely on external drivers like the Fed.
Fed rate cut decision
The contrast with the Federal Reserve is stark. The US labour market, once a pillar of strength, is showing visible cracks.
July’s nonfarm payrolls report added just 73,000 jobs, far below the 200,000+ average seen through 2023–24. Unemployment ticked up to 4.2 per cent, and wage growth has slowed.
Jerome Powell acknowledged this slowdown at Jackson Hole, marking his first major shift in tone this year. He noted that inflation appears “more contained” and that the Fed’s priority is now employment and sustaining growth.
This pivot sets the stage for a potential rate cut on 17 September, with CME FedWatch showing an 87 per cent probability of a reduction to 4.25 per cent. If confirmed, this would be the first cut of the 2025 cycle - a major turning point in policy.
For EUR USD, it would narrow the interest rate gap that has supported the dollar for the past two years. The short-term question is whether the Fed moves aggressively in September or adopts a slower, gradual path.
French political risk to the euro
On the European side, politics adds a layer of complication. Prime Minister François Bayrou faces a confidence vote on 9 September, with opposition parties united against his €44 billion budget plan. A failure to pass the vote would threaten the stability of his minority government, potentially forcing coalition talks or even new elections.
Markets reacted quickly: the CAC 40 fell 1.7 per cent earlier this week, and French bond spreads widened against German Bunds. Political instability weighs directly on the euro by undermining investor confidence in European assets at a time when the ECB is trying to project stability.
This dynamic contrasts with the US, where political risk has emerged in the form of central bank independence. President Donald Trump’s dismissal of Fed Governor Lisa Cook over mortgage allegations has raised concerns about political interference in monetary policy. While the dollar initially shrugged this off, institutional credibility could become a medium-term drag if independence is seen as compromised.
EUR USD volatility: Drivers to watch
September is packed with data releases that will shape rate expectations:
- This week:
- US consumer confidence (expected at 98, up from 97 in July).
- House price index and durable goods orders for insight into household and business investment.
- Richmond Fed manufacturing index for regional activity.
- GDP (second estimate) for Q2 growth momentum.
- PCE inflation report, the Fed’s preferred measure, to confirm whether price pressures are easing.
- US consumer confidence (expected at 98, up from 97 in July).
- Next week:
- August nonfarm payrolls. Another weak print would seal expectations for a cut.
- August nonfarm payrolls. Another weak print would seal expectations for a cut.
- The following week:
- CPI data just before the Fed meeting, crucial for judging the inflation trajectory.
- CPI data just before the Fed meeting, crucial for judging the inflation trajectory.
Each release has the potential to shift EUR USD. Stronger consumer confidence or GDP could reduce the urgency for Fed cuts, while weak data would do the opposite.
Market impact and scenarios
- Euro bullish case: Fed cuts rates in September, ECB holds steady. Yield gap narrows, lifting EUR USD from its lows.
- Dollar bullish case: US data surprises to the upside, and the Fed delays cuts. The dollar stays strong while the euro struggles with politics.
- Mixed case: Fed cuts but French political turmoil intensifies, offsetting gains and keeping EUR USD range-bound.
For now, EUR USD trades near 1.1607, a level that reflects hesitation rather than conviction. Traders are positioning lightly until September’s events provide direction.
Euro Dollar technical outlook
Technically, EUR USD is consolidating after retreating from last week’s highs. Support is forming around 1.1594, a level that has held in previous sell-offs. A sustained break lower could open the door to 1.1424. On the upside, resistance lies near 1.1724 and 1.1790, which coincides with the recent rally peak.
Momentum indicators suggest that volatility is compressed, with traders waiting for a catalyst. Once September’s data and meetings hit, a breakout in either direction is likely.

Investment implications
For traders, EUR USD is in a holding pattern, but volatility is building. Short-term strategies may focus on range trading between 1.16 and 1.18 until major data releases arrive. Medium-term positioning should prepare for two scenarios:
- Euro rebounds if the Fed cuts and the ECB holds, narrowing the yield spread.
- Dollar resilience if US data proves stronger than expected, delaying Fed easing.
French politics adds further uncertainty, meaning September could be decisive for EUR USD. Traders should expect the calm of late August to give way to higher volatility as policy divergence and politics collide.
Sorry, we couldn’t find any results matching .
Search tips:
- Check your spelling and try again
- Try another keyword