Results for

Why the Bitcoin price at 118K may be cheaper than it looks
Bitcoin has pulled back to around 118,800 after briefly breaking above 122,000 earlier this week.
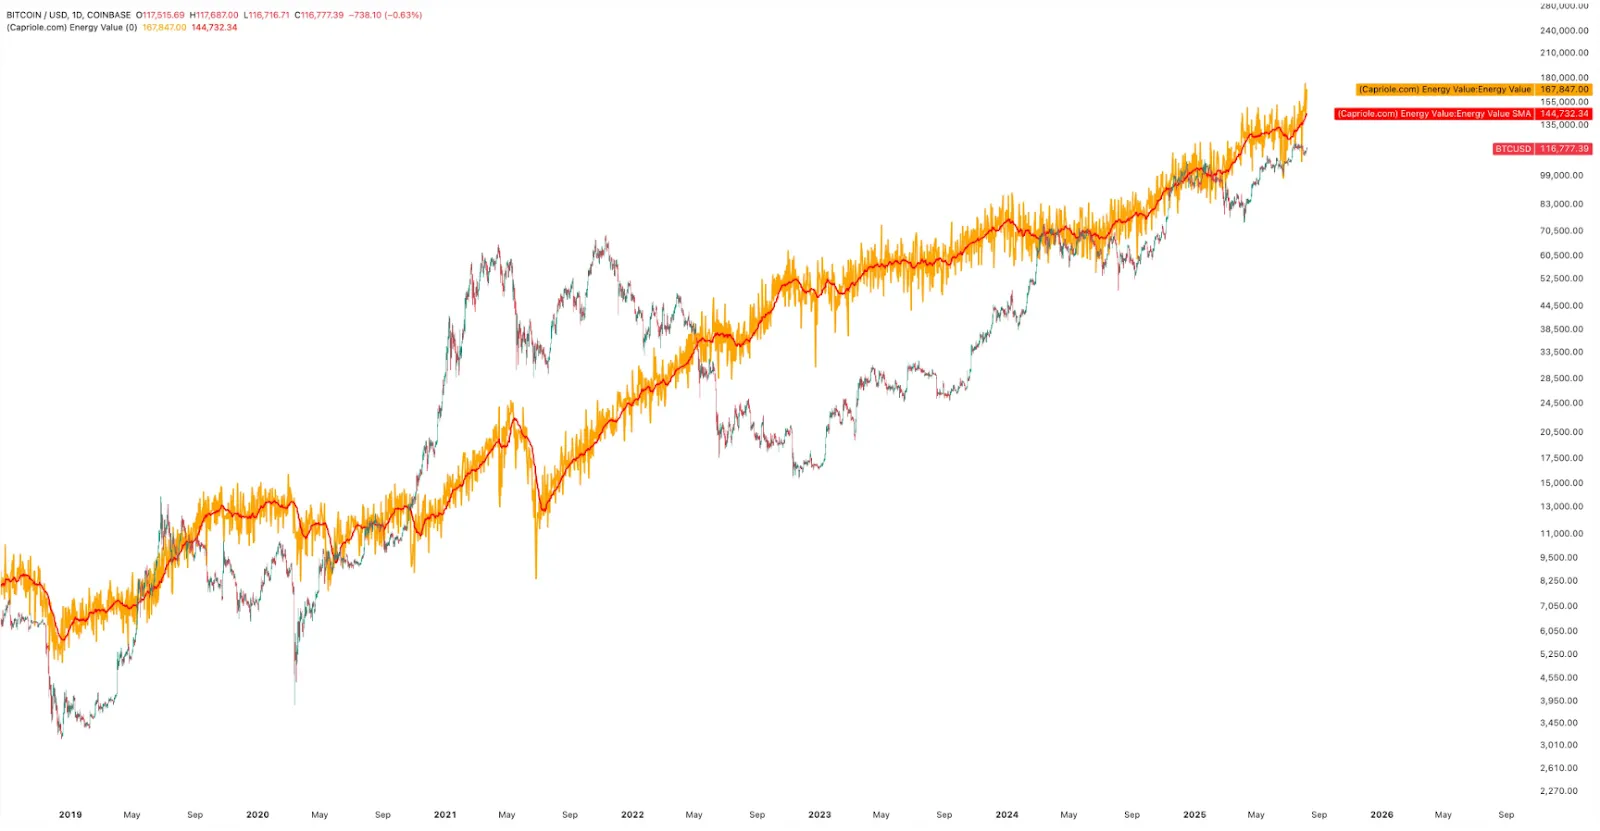
Bitcoin has pulled back to around 118,800 after briefly breaking above 122,000 earlier this week. While some traders see this as a sign of short-term exhaustion, key valuation metrics suggest the market may be underpricing the asset’s long-term potential. The most notable of these is Bitcoin’s Energy Value - a network-based valuation framework that now puts BTC’s fair value between 145,000 and 167,800. That means Bitcoin is trading at a 31 percent discount to the energy it consumes to sustain its decentralised network, a dynamic not seen since the 2020 pre-bull run phase.
Key takeaways
- Bitcoin’s Energy Value has reached as high as 167,800, while the market price has pulled back to 118,800
- BTC is trading at a deeper discount to value now than it was at 10K in 2020
- On-chain data shows retail traders dominate recent flows while institutional whales sit out
- Hash Ribbon and hash rate data suggest miners remain confident
Bitcoin is trading below its energy-based valuation
The Bitcoin Energy Value model, developed by Capriole Investments, estimates BTC’s fair price based on the energy expended to secure the network. This model views Bitcoin like a commodity, where energy input serves as a proxy for value. According to recent calculations, this metric now ranges between 145,000 and 167,800 - significantly higher than current spot prices.
Charles Edwards, founder of Capriole, has pointed out that Bitcoin is now at a greater discount to its Energy Value than it was in September 2020, when it traded at just 10,000. That historical moment preceded a multi-month rally to new all-time highs.
Today, that discount is just as striking. According to Edwards, with hash rates soaring, the Energy Value’s simple moving average sits at $167,800 - placing Bitcoin roughly 31% below its estimated fair value. It’s a level of undervaluation that echoes past setups before major bull runs.
While past performance isn’t a guarantee, the current discount reflects a rare deviation between market price and network fundamentals. It signals an undervalued condition that could invite renewed buying interest if momentum returns.
Institutional interest remains selective
Despite clear signs of undervaluation, institutional flows remain measured. While ETFs and corporate treasuries like MicroStrategy still hold substantial Bitcoin reserves (MicroStrategy alone holds over 628,000 BTC), there’s little evidence of aggressive buying into this recent pullback.
On-chain data reinforces this view. Execution size data shows an uptick in small-lot trades, suggesting that recent activity has been retail-led.
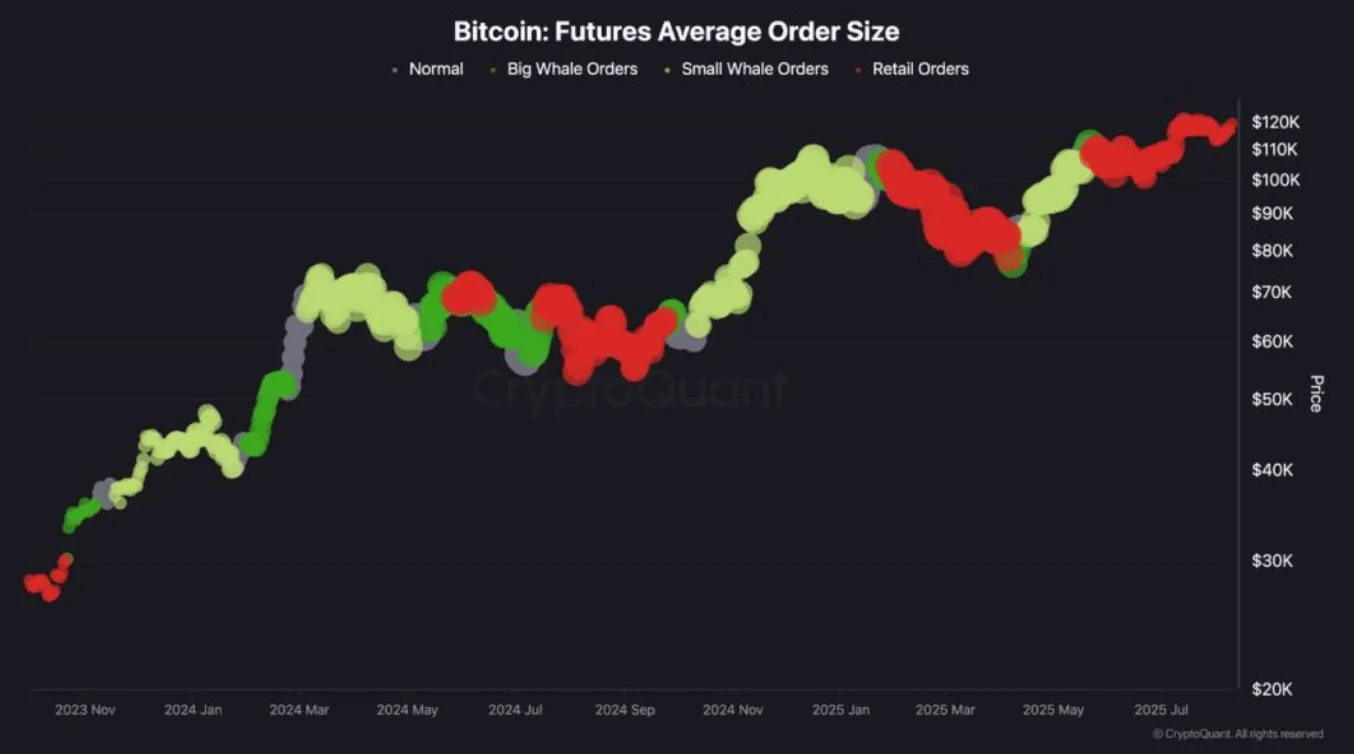
In contrast, previous major rallies were often marked by an increase in large-lot orders, consistent with whale or institutional accumulation.
This implies that institutions are waiting on the sidelines, likely seeking technical confirmation. A decisive close above 125,000 could re-ignite their interest. Until then, the current structure resembles a market in transition - strong underlying value but cautious capital deployment.
Miners show resilience despite volatility
Bitcoin’s hash rate remains near all-time highs, indicating robust miner engagement. This suggests confidence in the network’s long-term viability. More notably, the Hash Ribbons indicator flashed a “Buy” signal in late July - a historically reliable marker for potential upside.
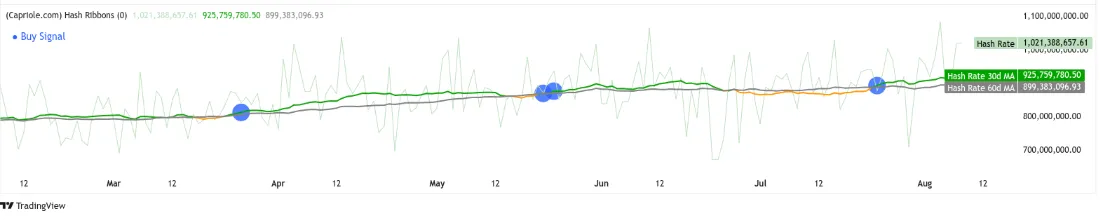
The premise behind the Hash Ribbons model is straightforward: when short-term hash rate drops below the long-term average and then recovers, it signals miner capitulation followed by recovery. In past cycles, this shift often preceded multi-month rallies. The recent signal suggests that miners are not only weathering volatility but actively recommitting resources.
Miners increasing their energy input further supports the upper band of the Energy Value model, creating a compelling narrative that current market prices undervalue the network’s operating fundamentals.
What the shift to retail means for price action
The rising presence of retail-sized orders suggests a speculative environment, often characterised by short-term momentum trading and emotional swings. Historically, phases where retail dominates and institutional players remain passive tend to generate heightened volatility.
However, analysts note that this isn’t necessarily a bearish signal. If institutional investors believe retail traders are building a solid price floor, they could re-enter the market aggressively - especially if macroeconomic conditions turn supportive. Potential Federal Reserve rate cuts in September, for instance, may act as a catalyst for renewed sentiment and capital inflows.
Bitcoin technical analysis
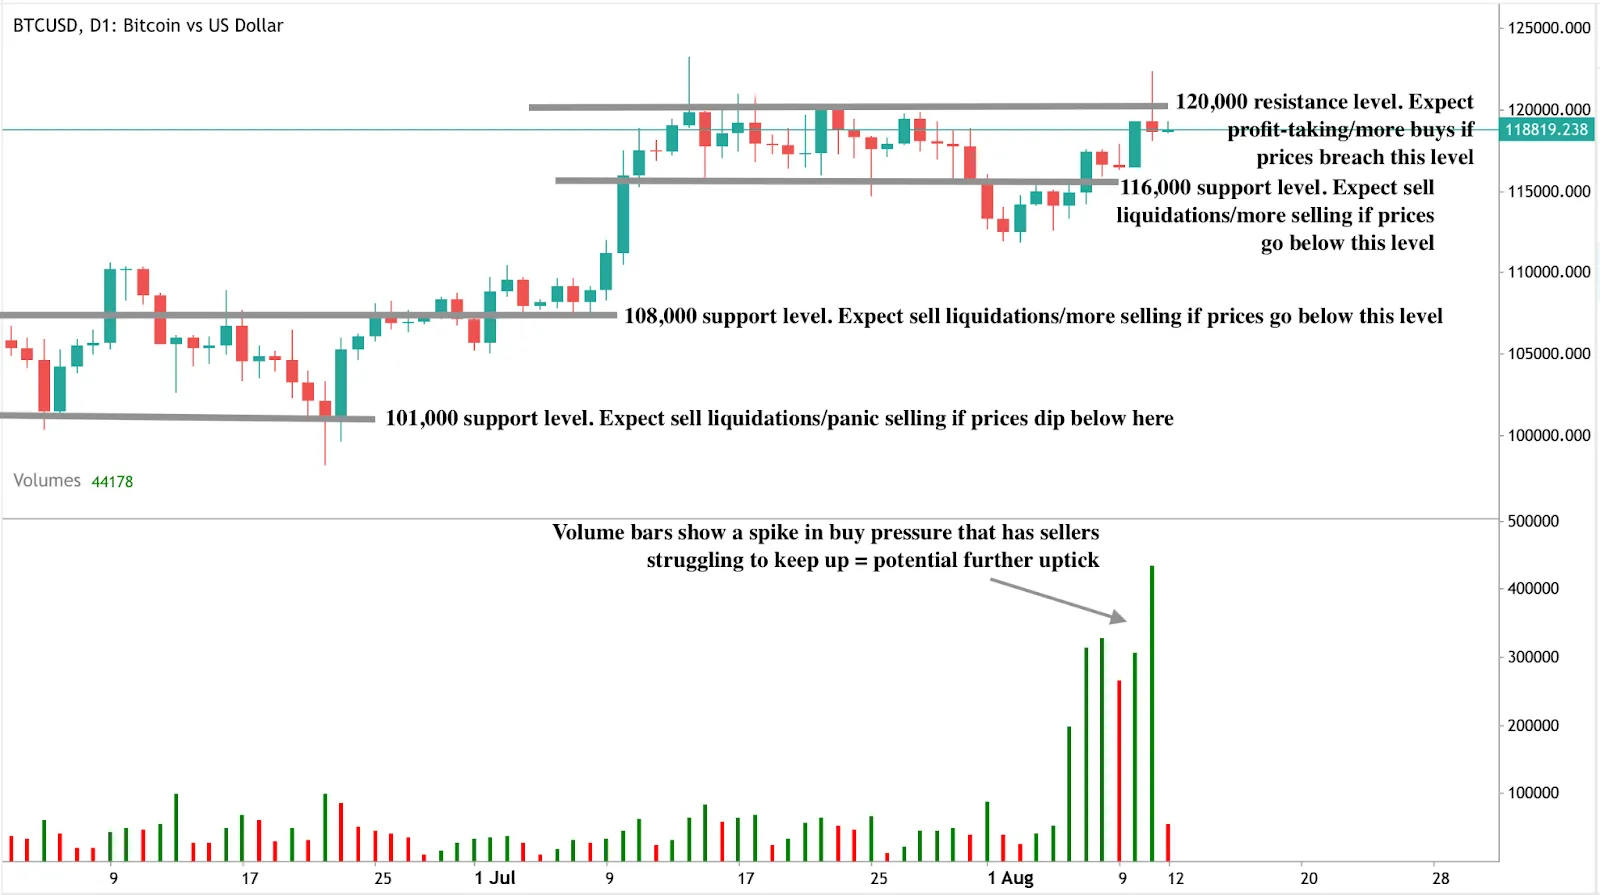
At the time of writing, BTC is seeing a significant pullback from its recent upmove, with sellers attempting to push the price down toward the 118,000 mark. However, volume bars show a noticeable spike in buy pressure, with sellers offering limited resistance. This indicates that if sellers fail to follow through with conviction, Bitcoin could bounce back in the short term.
A rebound from current levels could meet resistance around the 120,000 mark, which now acts as a short-term ceiling. On the downside, a deeper correction could find support at 116,000. In a more bearish scenario, stronger support levels sit at 108,000 and 101,000, which align with previous consolidation zones and psychological levels.
These technical levels, when combined with undervaluation signals from the Energy Value model and miner confidence indicators, provide a framework for assessing short-term risk and longer-term opportunity.
Frequently asked questions
Why is Bitcoin’s Energy Value relevant now?
Because it highlights that the network is consuming more energy to secure itself than what the market currently values it at. This discrepancy often precedes upward price adjustments.
Are institutions still buying?
Yes, but cautiously. Most large players are holding from lower levels, and there’s little evidence of aggressive buying into this pullback.
Is miner behaviour supportive of current prices?
Yes. The hash rate is rising, and Hash Ribbons have turned positive, indicating miner confidence and a reduced risk of forced selling.
What would trigger further upside?
A decisive break above 125,000 could shift market sentiment and invite institutional re-entry, especially as macro tailwinds (like expected Fed rate cuts) remain in play.
Investment implications
Bitcoin’s pullback to 118,800 may be offering a value entry point rather than signaling the end of the rally. With the asset trading well below its network-derived fair value and miners showing no signs of stress, the setup resembles early-stage momentum phases rather than distribution tops.
If institutions resume buying above 125,000, this dip may be remembered as a strategic accumulation window. The energy value gap, supported by resilient miner behaviour, makes Bitcoin’s current price potentially more attractive than it appears on the surface.

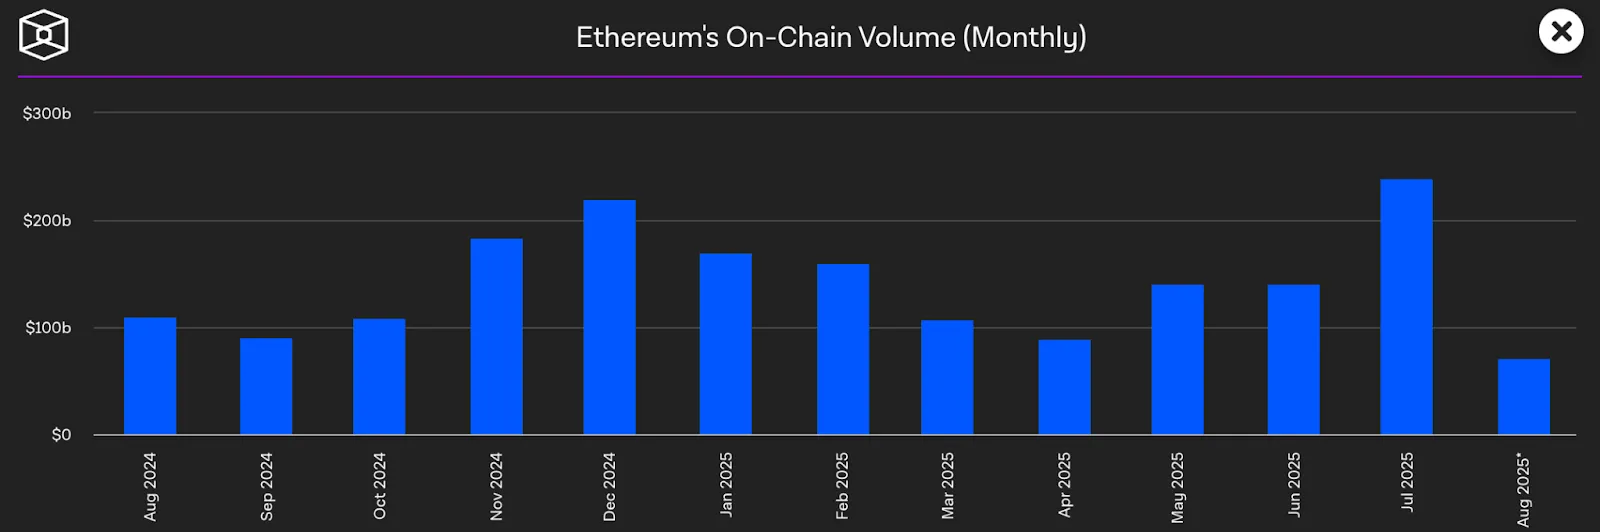
What is driving the Ethereum prices towards $5K in 2025?
Ethereum’s price has surged past $4,300 in August 2025, marking its highest level since late 2021.
Ethereum’s price has surged past $4,300 in August 2025, marking its highest level since late 2021. With bullish momentum accelerating and staking inflows reaching new highs, traders and analysts are now asking whether this is the rally that could push ETH to $5,000. Key on-chain indicators, institutional positioning, and a breakout from long-term technical patterns are all pointing in the same direction - Ethereum may finally be on the verge of a new all-time high.
Key takeaways
- Ethereum’s transition to proof of stake and recent Layer-2 upgrades are reducing supply and increasing throughput across the network.
- An anonymous whale staking 10,999 ETH and earning $13.53 million in profit signals a growing institutional appetite for Ethereum staking products.
- Ethereum’s seven-year price channel suggests that a breakout beyond $4,800 could initiate a new price discovery phase with targets above $5,000.
- Analysts say demand for ETH in DeFi, staking, and real-world tokenisation is broadening, with retail and TradFi participation at multi-year highs.
Ethereum price breaks above $4,300
As of 11 August, Ethereum is trading around $4,327, up significantly from its mid-June levels. This rally is underpinned by a sharp increase in ETH staked across protocols like ETH2.0 and EigenLayer, which has reduced circulating supply and added price pressure.
On-chain metrics show low selling activity and strong accumulation patterns across both whale and institutional wallets.
Notably, a single whale staked 10,999 ETH (worth over $46 million) in June and has already made a profit of $13.53 million.
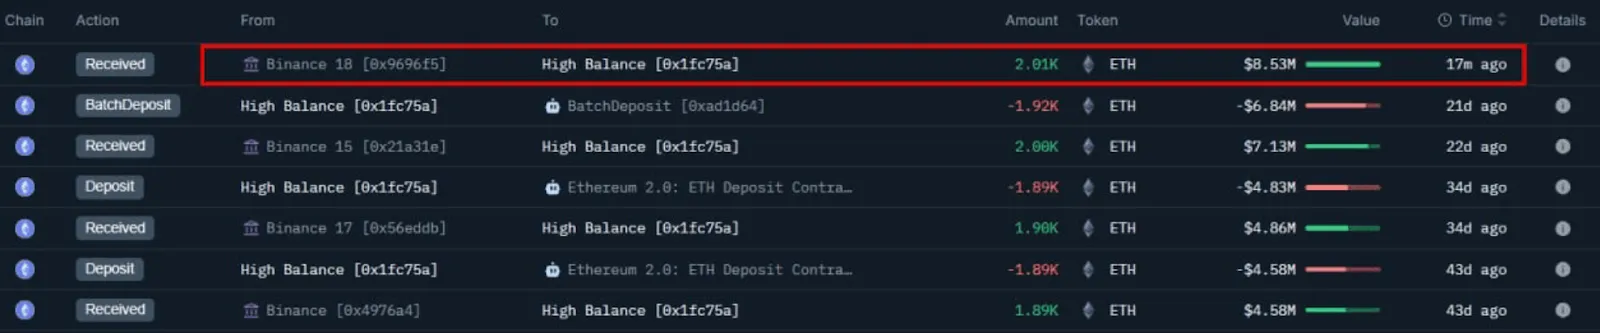
Analysts see this move as a bellwether for larger institutional interest in Ethereum’s maturing proof-of-stake economy.
The Ethereum network is becoming financial infrastructure
Ethereum is no longer positioned as a speculative tech asset, according to analysts. Since the 2022 Merge and subsequent Shanghai upgrade, the network has shifted from a high-fee experimental layer to a scalable, modular ecosystem powering:
- Decentralised finance (DeFi)
- NFT marketplaces
- Real-world asset tokenisation
- Institutional staking
- Cross-border remittance rails
Layer-2 networks like Arbitrum and Optimism now handle more daily transactions than Ethereum Layer-1, allowing the base network to function as settlement infrastructure. This has made Ethereum more attractive to TradFi institutions looking for scalable, regulated on-chain exposure.
ETH technical analysis
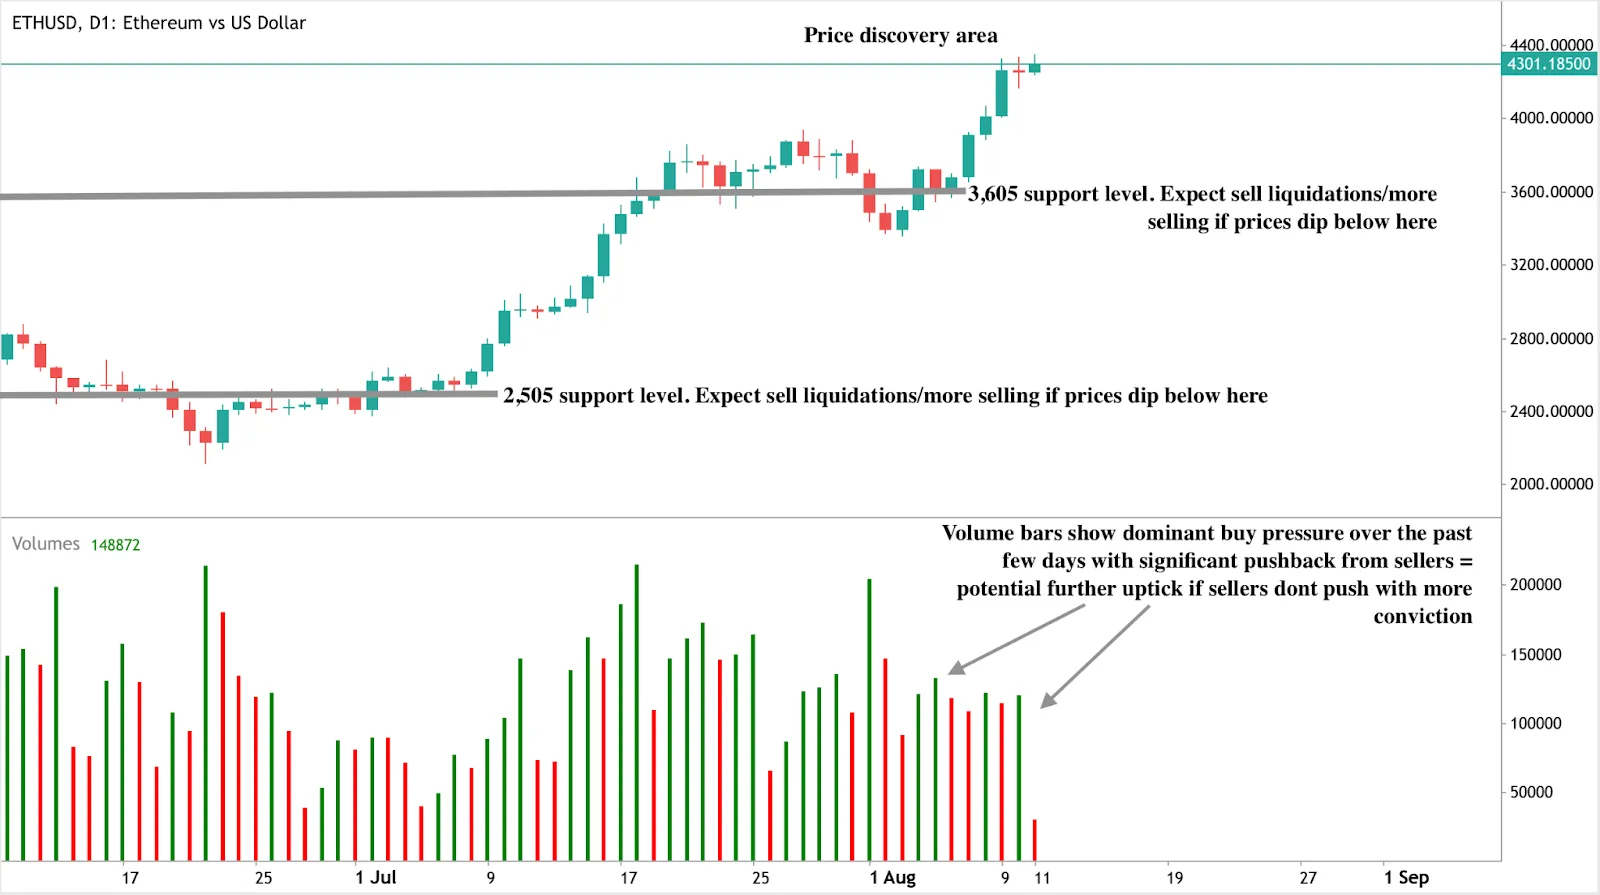
At the time of writing, ETH is in price discovery mode above $4,300 - within a buy zone - hinting at a potential further uptick. However, volume bars show that sellers are putting up a spirited fight. If sellers push with more conviction, the up move could begin to stall. A sharp reversal could see prices fall back to the $3,605 and $2,505 support zones, both of which have historically acted as liquidity levels during consolidation phases.
ETH fundamentals are supporting price stability
Ethereum’s economic structure now resembles that of a scarce yield-bearing asset:
- Over 30 million ETH is currently staked, reducing the liquid supply to roughly 29% of the total supply.

- Gas fees are consistently being burned, keeping net ETH issuance deflationary.
- Demand for ETH as collateral in DeFi and RWA protocols continues to rise.
- TradFi funds are launching ETH staking products aimed at pension and endowment investors.
These dynamics make it increasingly difficult for sell-side volume to overwhelm buy-side pressure, especially in a low-liquidity macro environment favouring digital assets.
Ethereum price prediction: Will momentum push it to $5000?
Many say much of Ethereum’s price path from here will depend on two factors: macro conditions and the strength of the crypto market cycle. If global markets remain risk-on, and if Ethereum continues gaining traction as a settlement layer for tokenised assets and smart contracts, $5,000 is not only achievable - it may be conservative.
That said, analysts warn of headwinds, including potential regulatory crackdowns, market saturation, or temporary profit-taking should ETH hit psychological resistance levels. Still, the fundamentals underpinning this rally are markedly different from the 2021 surge, with far more institutional infrastructure in place to absorb demand.
Frequently asked questions
What is causing Ethereum’s price to rise in 2025?
Increased staking inflows, reduced circulating supply, and rising institutional adoption across DeFi and Layer-2 platforms.
Why is $5,000 seen as a key level for ETH?
It’s slightly above Ethereum’s all-time high of $4,875 and represents a major psychological and technical milestone.
How does Ethereum’s network upgrade impact its price?
The shift to proof of stake and Layer-2 scaling has made ETH more efficient, more scarce, and more attractive as a yield-bearing asset.
Are institutions investing in Ethereum?
Yes. Institutional-grade ETH staking products are growing, and a recent whale stake of 10,999 ETH signals deeper capital rotation into Ethereum.
Could ETH fall after hitting $5,000?
Short-term corrections are possible, but long-term fundamentals - including staking, adoption, and deflationary supply - support strong price floors.
Investment implications
According to reports, if Ethereum successfully breaks through the $4,875 all-time high and enters a sustained rally toward $5,000, it could trigger renewed interest from both retail traders and institutional allocators. ETH’s role as a foundational smart contract layer—coupled with its staking yield and deflationary design - strengthens the case for long-term holdings in diversified crypto portfolios.
Investors considering entry at current levels should remain aware of volatility and potential retracement zones, but the macro and network-specific setup offers a compelling asymmetric risk-reward profile. With ETH trading in price discovery mode and institutional demand accelerating, Ethereum’s transformation from a speculative asset into digital infrastructure may justify higher valuation multiples over time.

What’s supporting gold prices near $3,400 despite a stronger US dollar?
While the dollar typically pressures gold to the downside, current macro and political conditions are shifting the balance.
According to analysts, safe-haven demand amid escalating global trade tensions, renewed expectations of aggressive Federal Reserve rate cuts, and supply disruptions triggered by new US tariffs on gold imports are driving the divergence between the two. While the dollar typically pressures gold to the downside, current macro and political conditions are shifting the balance.
Key takeaways
- Gold prices hover near $3,400, supported by safe-haven flows and persistent macro uncertainty, despite a modest US dollar rebound.
- US tariff measures now include one-kilo gold bars, impacting global bullion trade - particularly from Switzerland, the world’s largest gold refining hub.
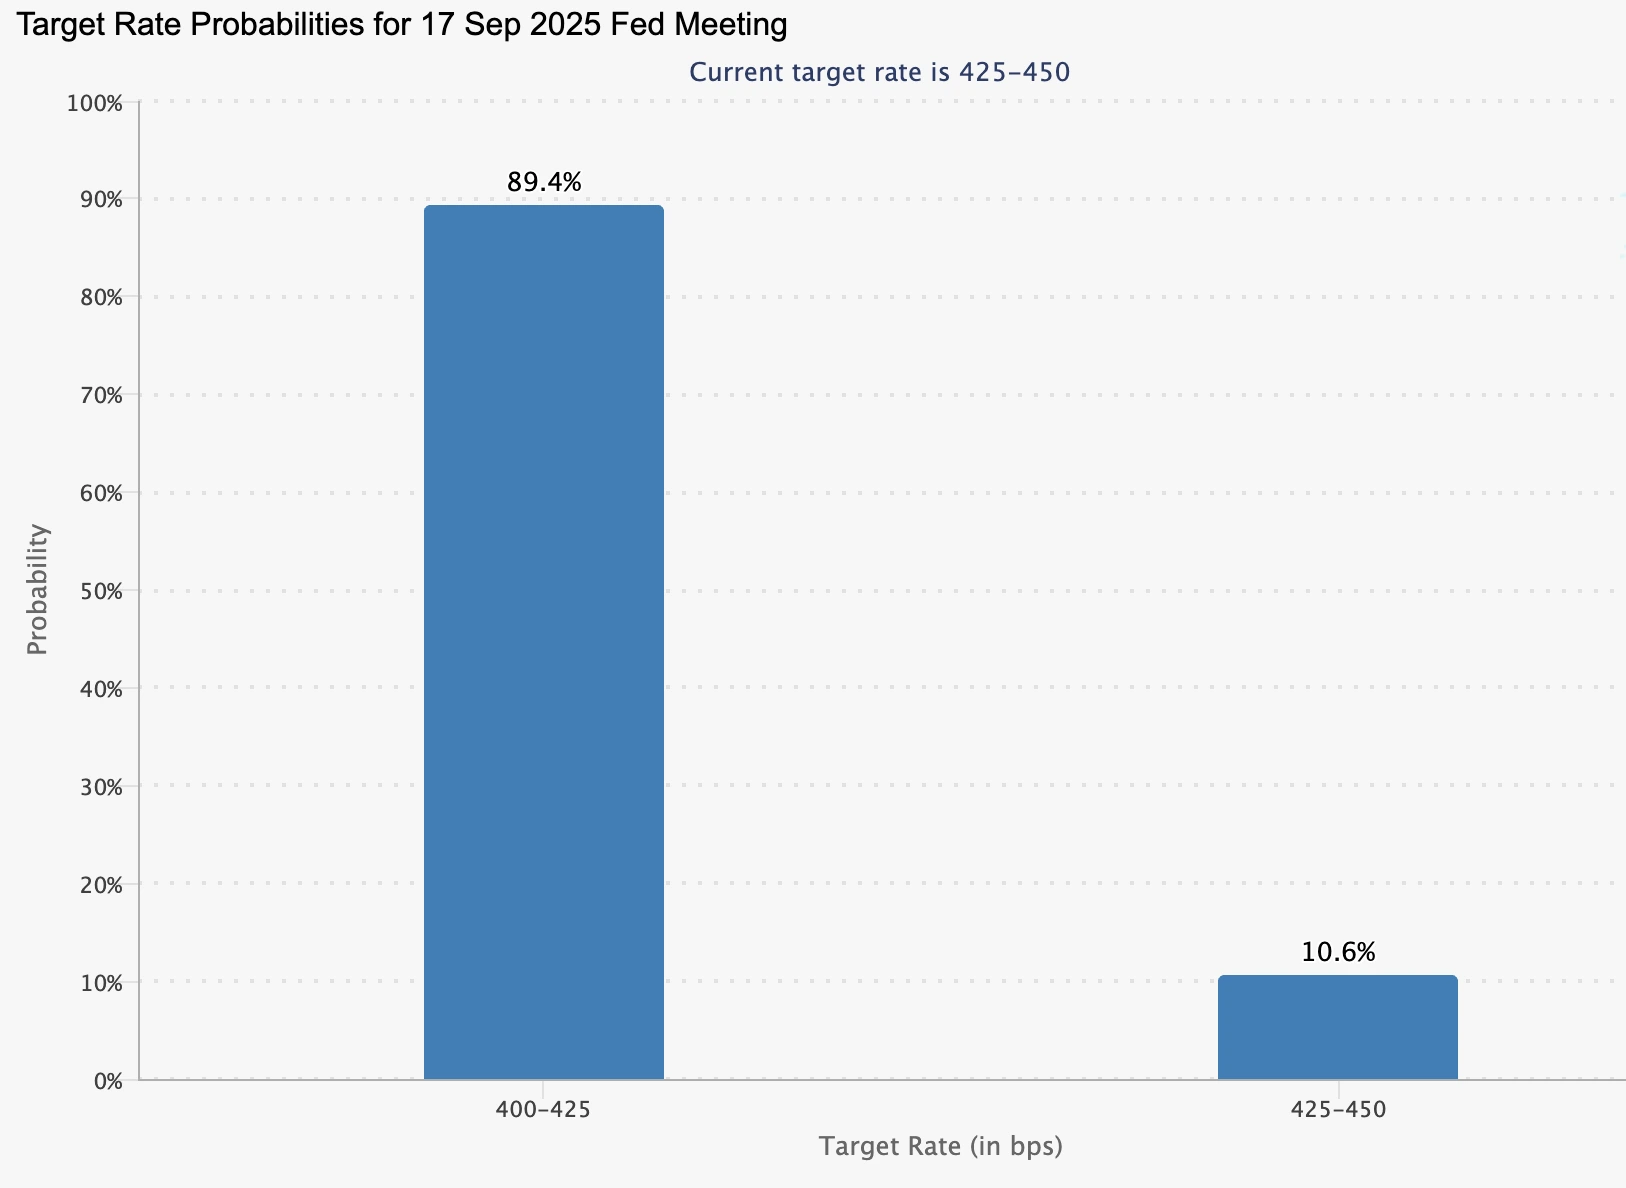
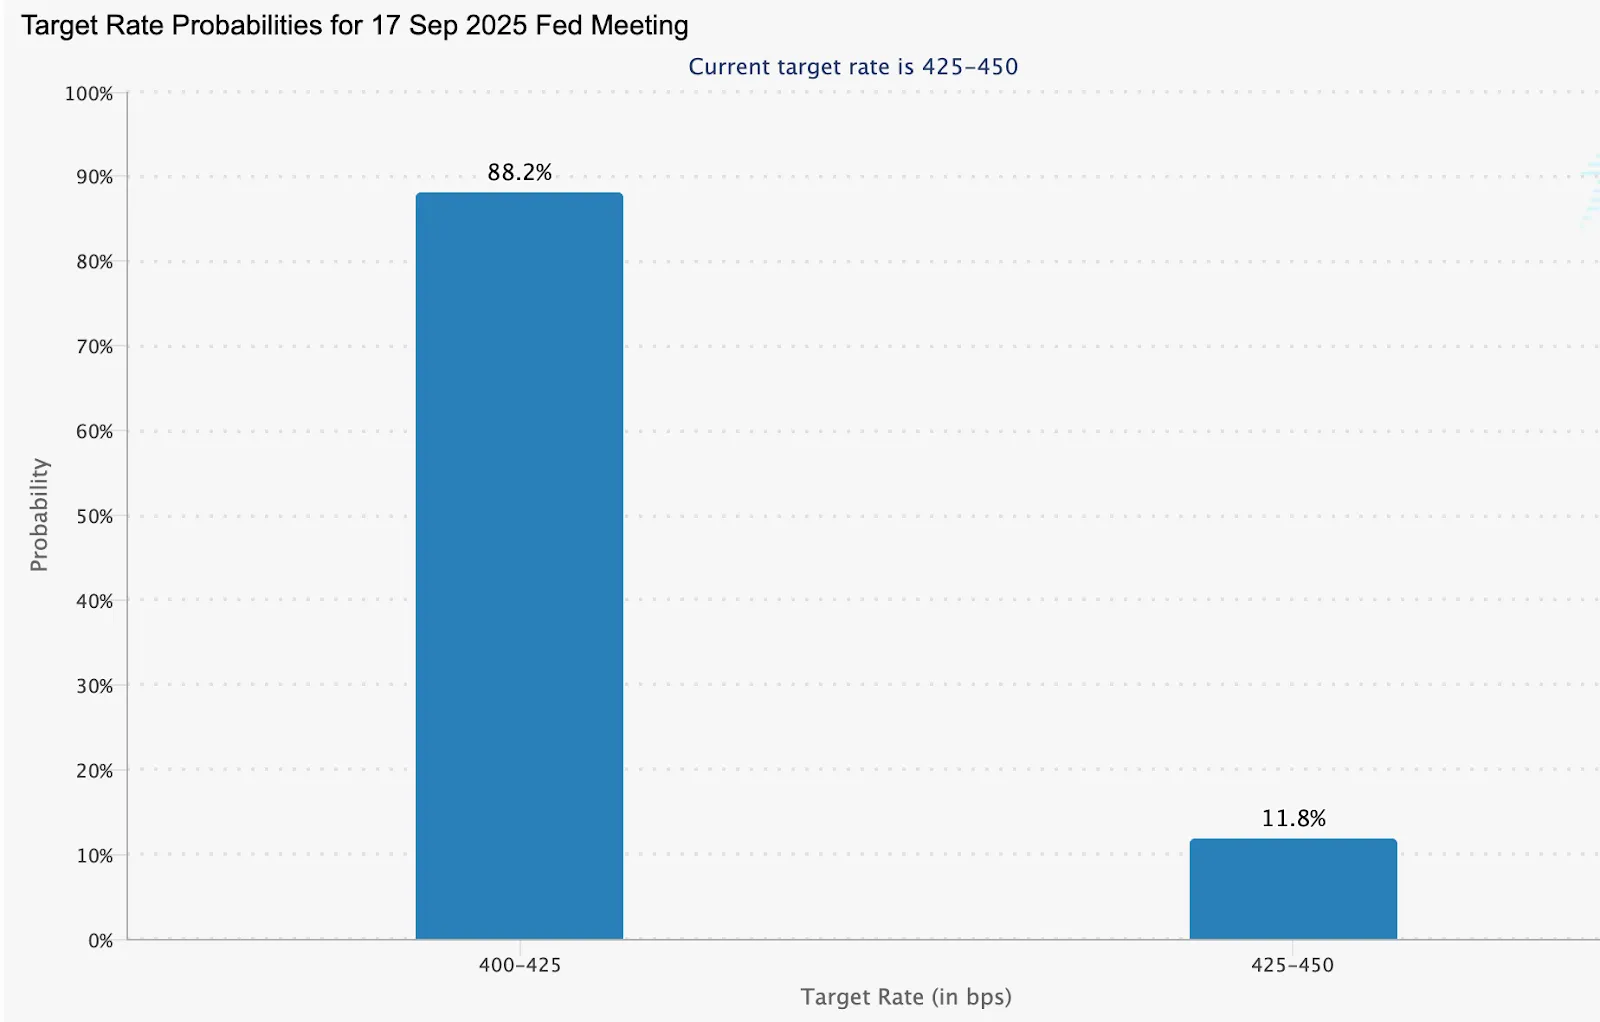
- Fed rate cut expectations surged after weak jobs data, with markets now pricing in a 89.4% probability of a 25bps cut in September and 100bps total by early 2026.
- Physical gold demand remains robust, with China’s central bank adding to reserves for a ninth consecutive month and ETF inflows holding steady.
- Concerns over Fed independence have grown after Trump nominated economist Stephen Miran and continues floating replacements for Chair Jerome Powell.
Gold Safe-haven demand drives stability near $3,400
Rising geopolitical tensions and renewed trade disputes are reinforcing gold’s role as a risk hedge. The US administration’s aggressive tariff strategy - including a 100% levy on imported semiconductors and new 25–50% duties targeting China, India, and potentially Japan - has reintroduced uncertainty into global markets.
The inclusion of gold in this tariff sweep, specifically targeting one-kilo bars, is especially significant. Switzerland, the world’s largest gold refining hub, is directly affected. Disruptions to physical gold supply chains are already being reflected in futures markets.
Meanwhile, regional instability is adding to the safe-haven narrative. Israeli Prime Minister Benjamin Netanyahu’s announcement of a potential military takeover of Gaza is fuelling broader geopolitical concern. This, paired with global trade frictions, is keeping investor demand for gold elevated - even in the face of a stronger dollar.
Fed policy expectations soften the dollar’s edge
While the US dollar has stabilised after a two-week decline, its strength remains capped by dovish expectations for the Federal Reserve. The CME FedWatch Tool shows a 89.4% probability of a 25 basis point rate cut in September, with the market now anticipating a full percentage point of easing by early 2026.
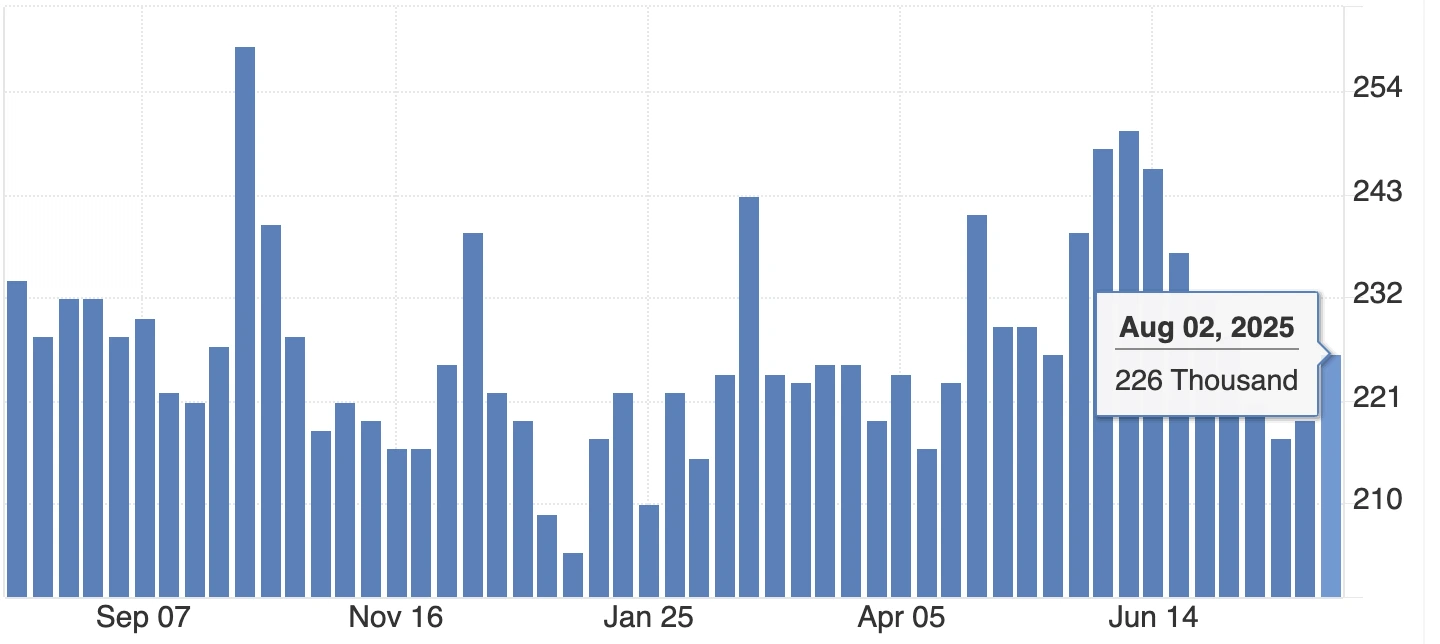
These expectations have grown following a stream of weaker labour market data, including a one-month high in jobless claims and downward revisions to nonfarm payrolls.
The credibility of the Fed has also come under scrutiny. President Trump’s nomination of Stephen Miran to the Board of Governors and his public calls to replace Chair Jerome Powell have sparked concern about central bank independence. Traders appear increasingly sceptical that the Fed will be able to maintain a hawkish posture in the face of political pressure and deteriorating macro conditions - a dynamic that supports gold.
Physical market frictions reinforce structural support
Tariffs on physical gold imports are not just symbolic - they could reshape global bullion flows according to analysts. Customs documents confirm the US has placed new levies on one-kilo gold bars, a format widely used by institutions and refiners. This reportedly has immediate implications for exports from Switzerland and London, where most global bars are processed and shipped. The resulting uncertainty is feeding into price stability and could limit downside in the near term.
Gold central bank buying
Central bank demand remains robust. China’s central bank continued its gold accumulation for a ninth consecutive month in July, and while overall official sector purchases have moderated since Q1, they remain above long-term averages.
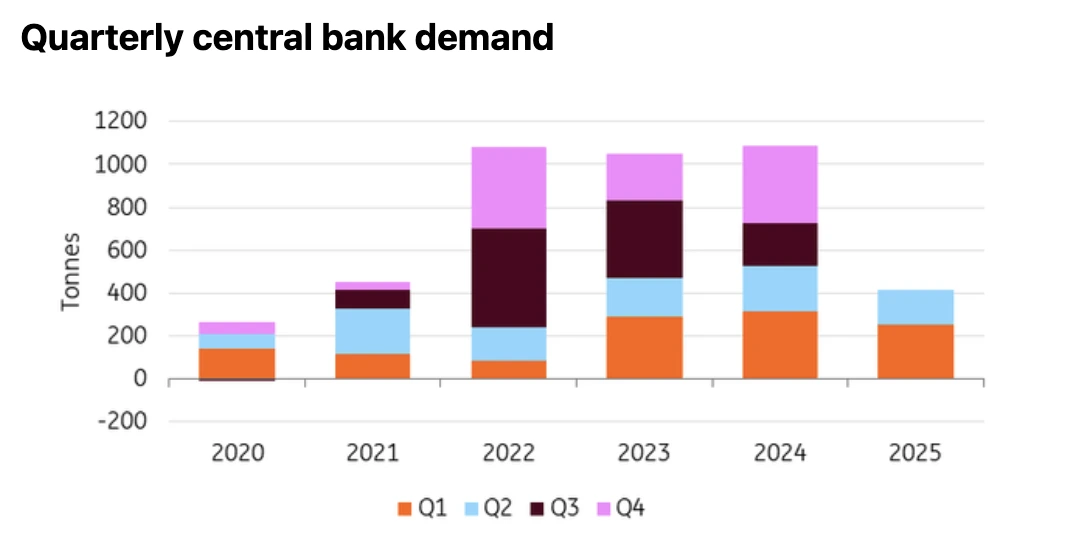
This steady baseline demand, combined with renewed investor flows into ETFs, adds a layer of resilience to spot and futures pricing.
Gold technical analysis 2025: Bulls hold - but sellers test the zone
At the time of writing, gold is seeing some retreat within a known sell-zone - hinting that we could be in for a further downturn. However, volume bars paint a picture of dominant buy pressure, with sellers yet to push back with enough conviction.
If sell momentum doesn’t pick up soon, we could see a renewed price uptick. Should an uptick occur, prices could encounter resistance at the $3,440 level. On the downside, any deeper pullback may find support at $3,265 and $3,185, levels that traders will be watching closely for signs of renewed accumulation.
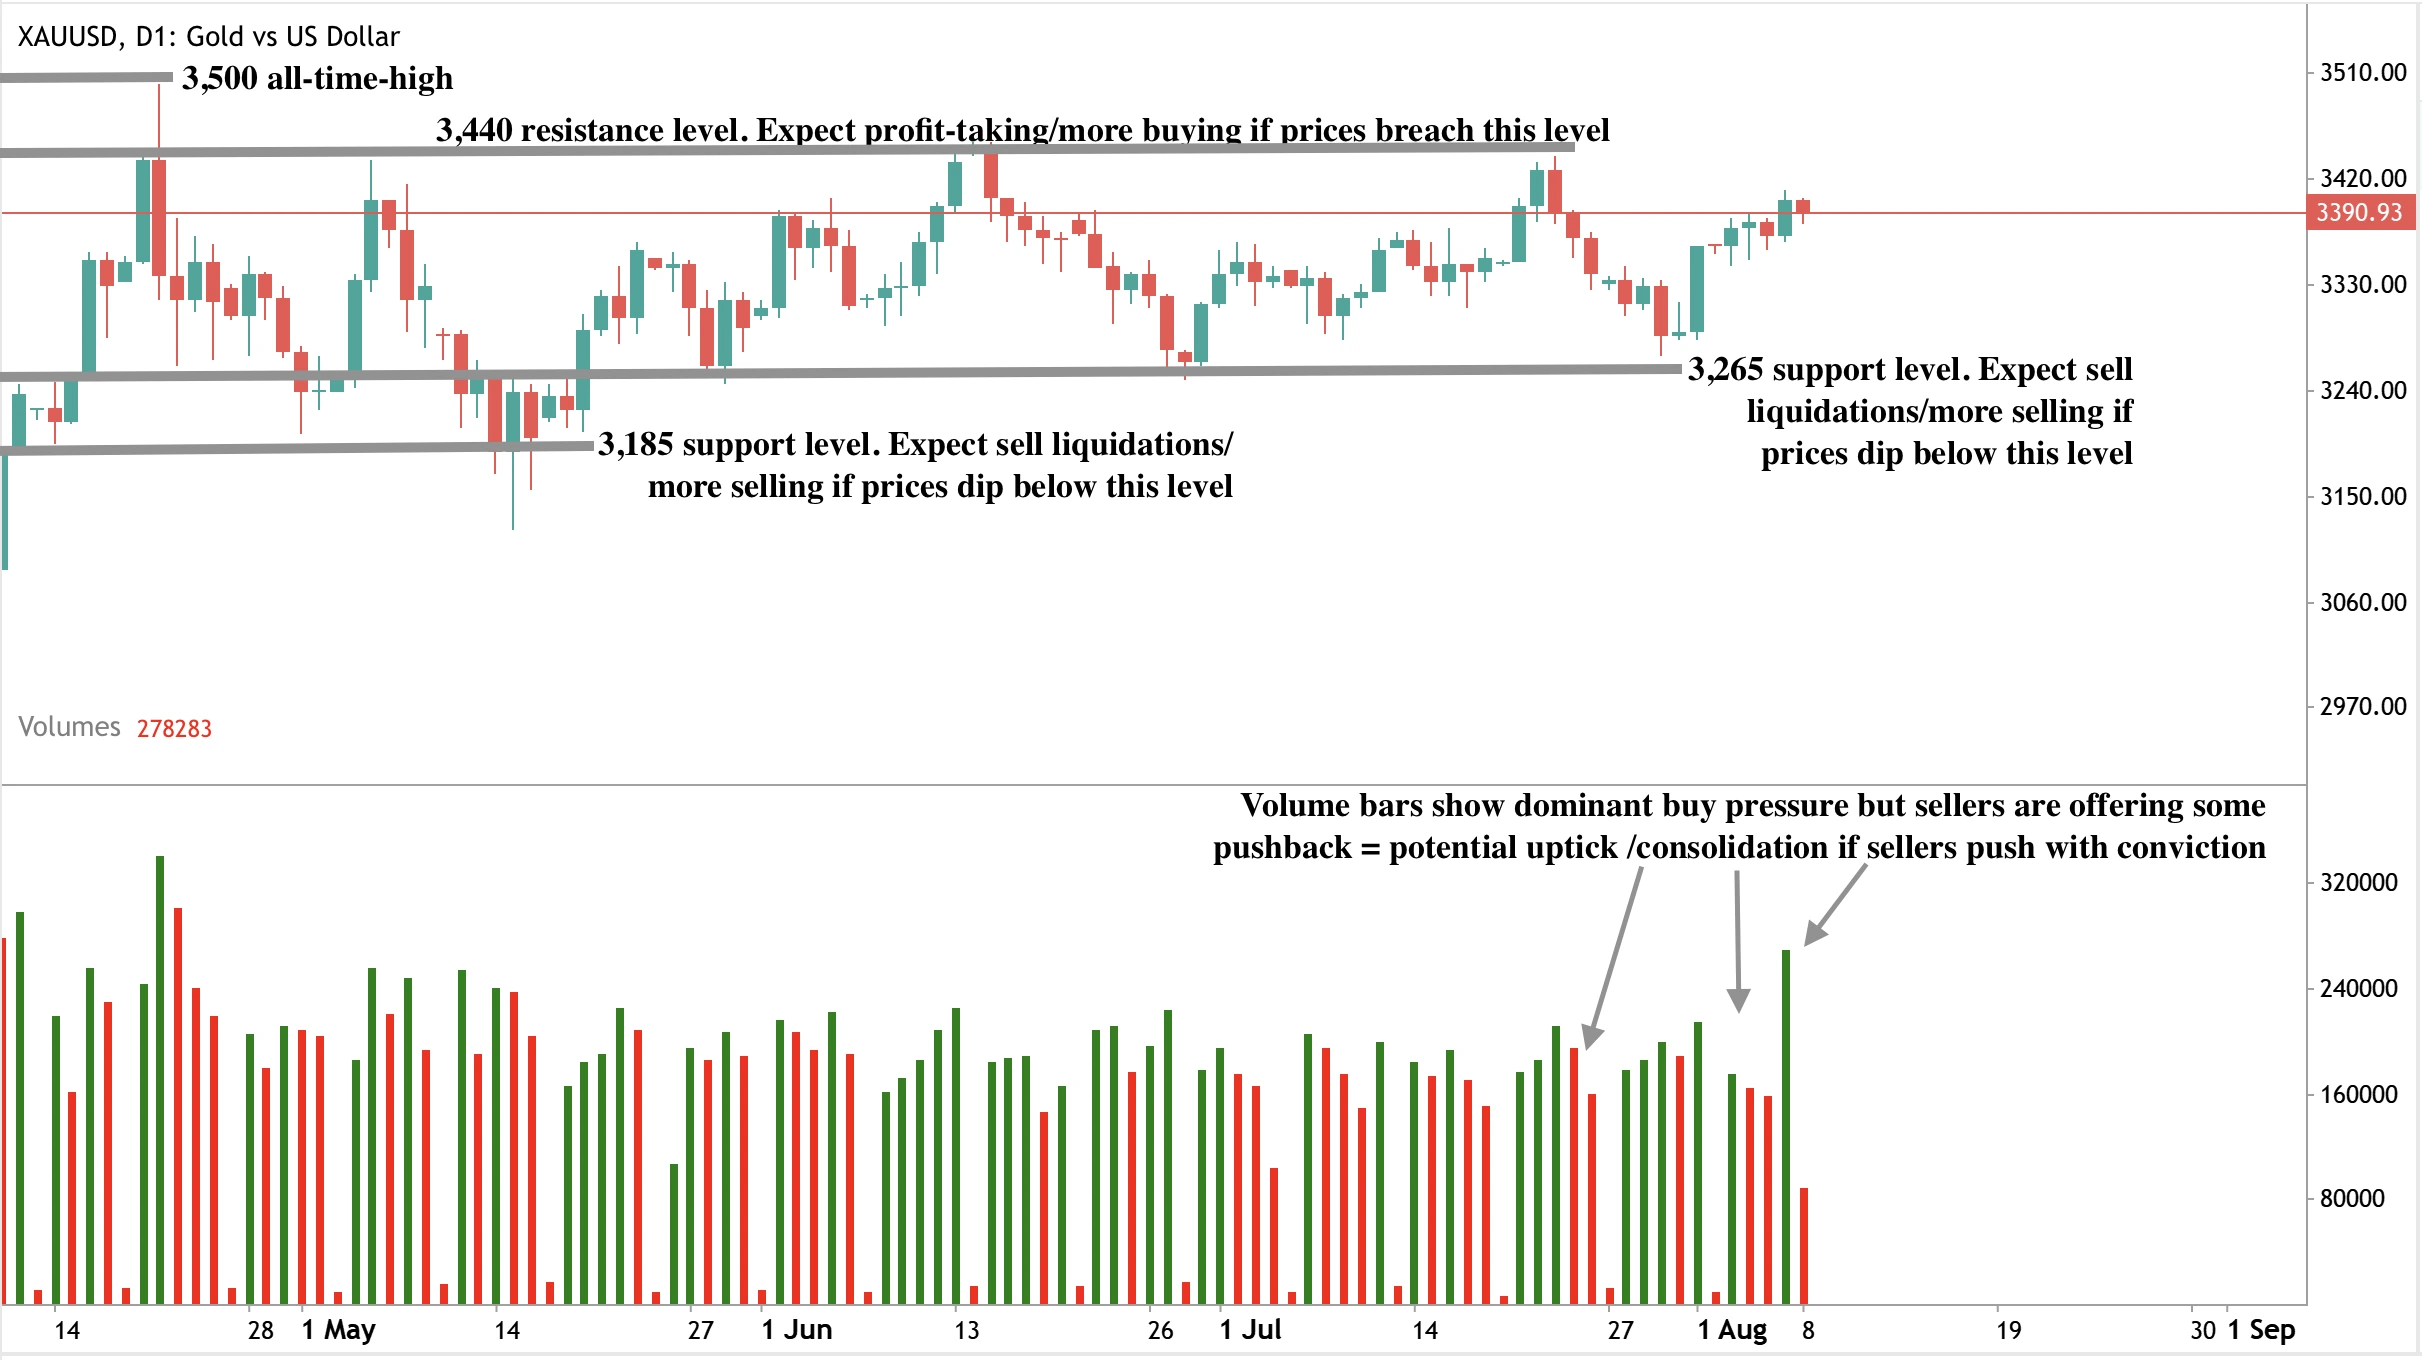
This setup suggests that while sellers are testing the market, the broader bullish sentiment is still intact - leaving the door open for potential upside if the sell zone doesn’t hold.
Investment implications
Gold’s ability to hold near $3,400 despite a firmer dollar signals a macro-driven bullish setup. With global supply under pressure, central bank demand steady, and Fed rate cuts expected soon, the case for further upside remains strong.
Traders should look for direction from next week’s US CPI data, upcoming Fed speeches, and any further tariff escalations. A decisive breakout above $3,400 could confirm a bullish continuation toward $3,440–$3,500, while dips toward $3,265 or $3,185 may offer accumulation opportunities.
According to analysts, gold’s resurgence is no longer just a defensive move - it’s becoming a strategic allocation in an increasingly unstable macro environment.
Trade the next moves of gold with a Deriv MT5 account today.
Frequently asked questions
Why is gold rising while the dollar is strengthening?
Typically, a stronger dollar weighs on gold, but current conditions - including Fed rate cut bets, trade disruptions, and geopolitical risks - are boosting safe-haven demand and offsetting currency headwinds.
What are the main macro factors behind gold’s strength?
Aggressive tariff policy, slowing US economic data, expectations of monetary easing, and central bank gold buying are all contributing to gold’s resilience.
How do tariffs affect gold prices directly?
Tariffs on gold bars restrict supply chains and increase costs, especially when they target large-scale exporters like Switzerland. This adds upward pressure to bullion prices.
What role does Fed uncertainty play?
Concerns about the Fed's politicisation, combined with a dovish shift in expectations, are weakening confidence in the dollar’s long-term strength - a net positive for gold.

Trump’s 100% semiconductor tariff could trigger a $500B Nvidia tailwind
U.S. trade policy is once again the centre of market focus as President Trump prepares to implement a 100 percent tariff on imported semiconductors.
U.S. trade policy is once again the centre of market focus as President Trump prepares to implement a 100 percent tariff on imported semiconductors. According to reports, while the move has sparked concern across Asia’s semiconductor supply chains, investors are already rotating into one key beneficiary - Nvidia. The AI chipmaker’s $500 billion U.S. manufacturing pledge, announced earlier this year, could not only exempt it from the coming import tax but also accelerate its transition from global supplier to domestic infrastructure leader.
Key takeaways
- Trump’s planned 100% tariff on imported semiconductors could reshape global chip flows, but firms like Nvidia with U.S. fab investments are likely to be exempt.
- Nvidia has committed up to $500 billion toward domestic AI infrastructure, a move that aligns with trade policy and could support a longer-term stock rally.
- Analysts say Nvidia’s networking segment - often overlooked - is critical to AI scale and increasingly central to its bullish thesis.
Nvidia’s US manufacturing may become its moat
Data showed that with Nvidia’s stock already up over 59% in the past three months, traders are now reassessing the impact of geopolitics on AI infrastructure. The semiconductor tariff, initially seen as a threat, is increasingly being reframed as a policy tailwind for companies that localise production. In Nvidia’s case, the combination of CHIPS Act incentives, networking dominance, and strategic White House proximity may further insulate it from near-term risks.
In April 2025, Nvidia pledged to invest up to $500 billion in U.S.-based chip manufacturing and AI infrastructure, including partnerships with TSMC, Foxconn, and American-based server suppliers. This move now appears not just strategic, but prescient. With Trump favouring companies that “build in America”, Nvidia’s early pivot may qualify it for tariff exemptions.
According to administration sources, exemptions are expected for firms actively building capacity within U.S. borders. This would give Nvidia - already flush with CHIPS Act funding - an edge over peers more exposed to Asian supply chains. AMD, for instance, continues to rely heavily on Taiwan’s TSMC and is still scaling up its Arizona-based production. Intel and Broadcom are also expected to benefit, but Nvidia’s dominant role in the AI GPU market makes it a standout.
Nvidia networking is the hidden growth engine
Beyond chips, Nvidia’s lesser-known networking business is driving increasing revenue. In fiscal 2025, the segment contributed $12.9 billion, more than the company’s entire gaming revenue.
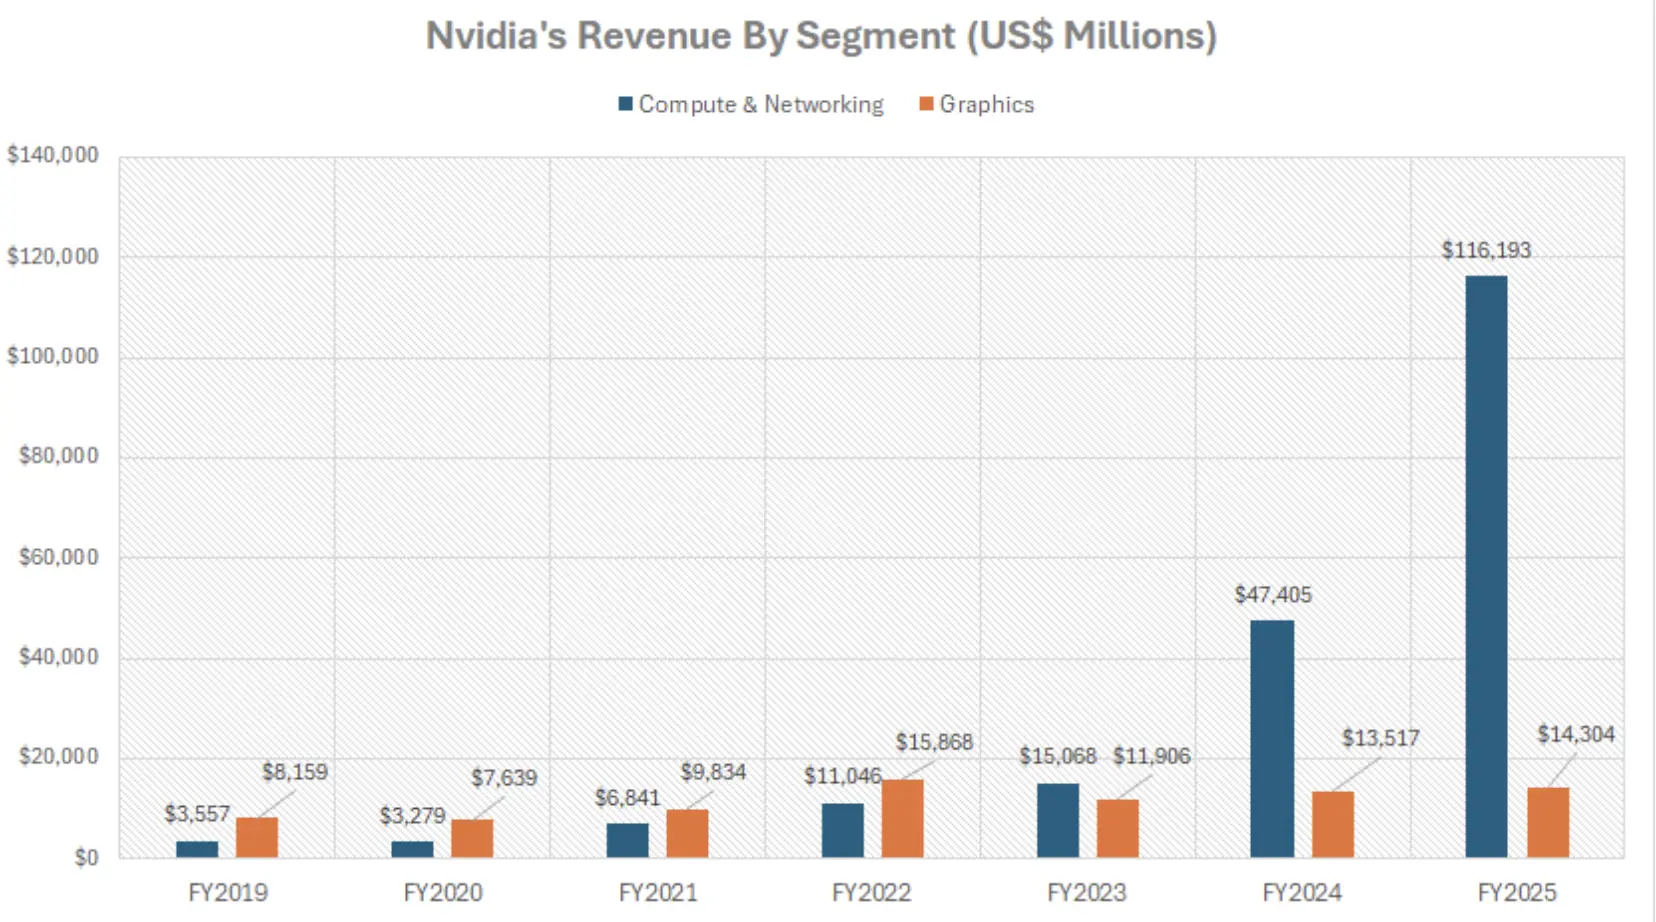
Its NVLink, InfiniBand, and Ethernet systems allow massive AI clusters to function efficiently - a critical feature as AI workloads shift toward inferencing and real-time processing.
This infrastructure edge is growing more important as tech giants like Microsoft and Amazon seek to deploy large-scale AI systems. Nvidia’s ability to offer tightly integrated GPU–DPU–networking packages positions it as the full-stack provider of choice - and further justifies its valuation premium.
Nvidia technical outlook
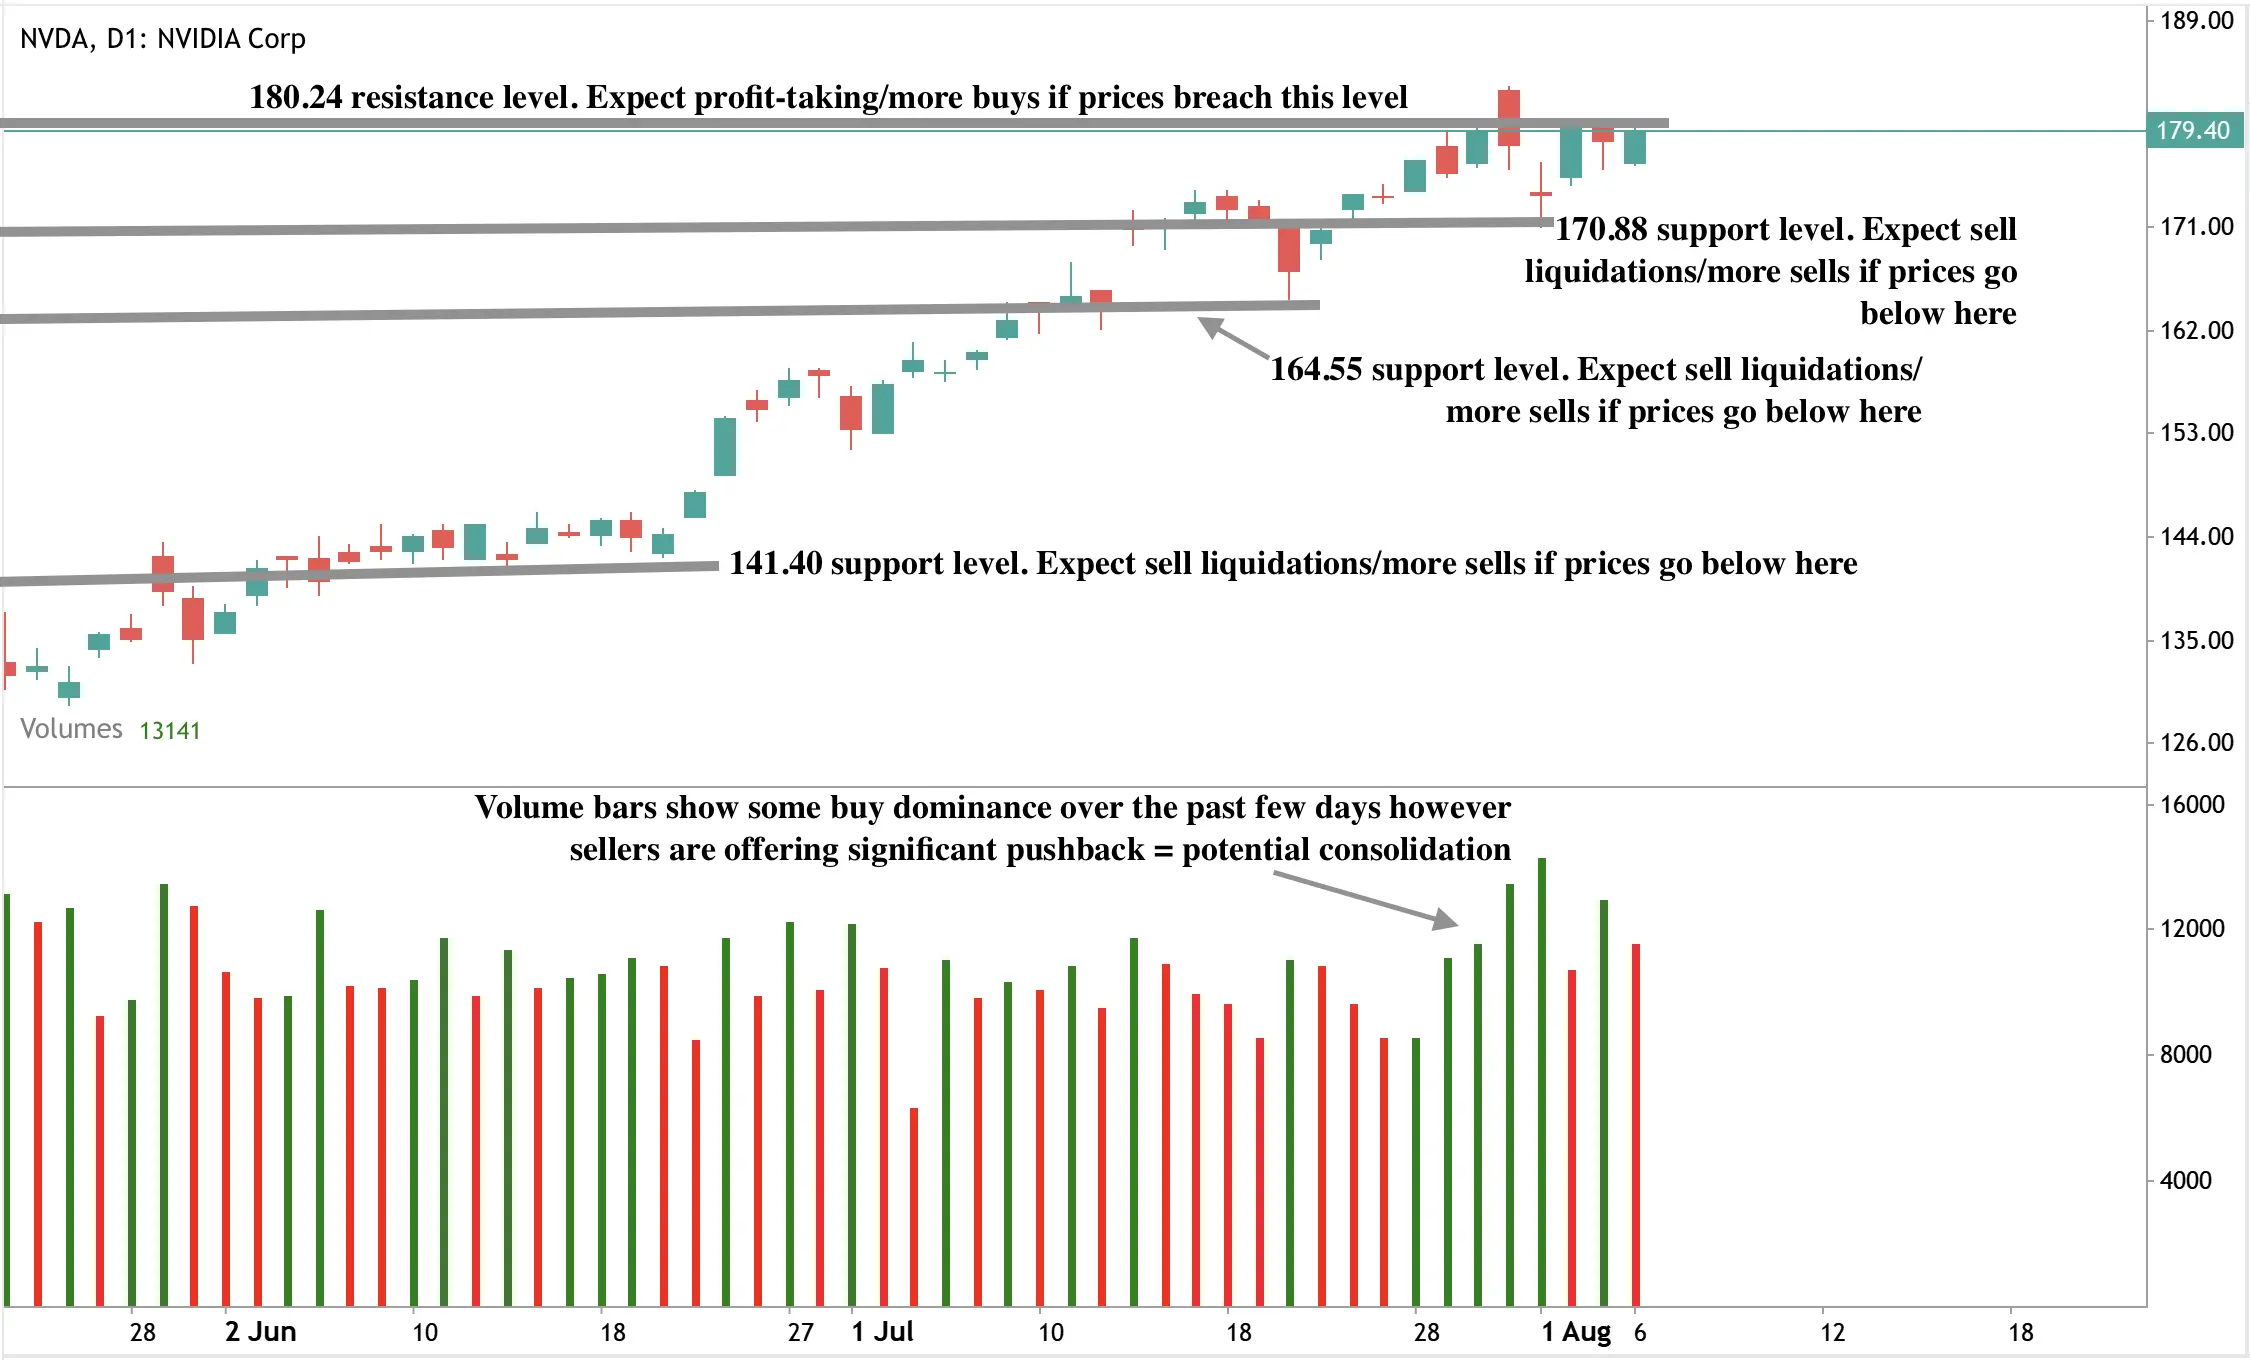
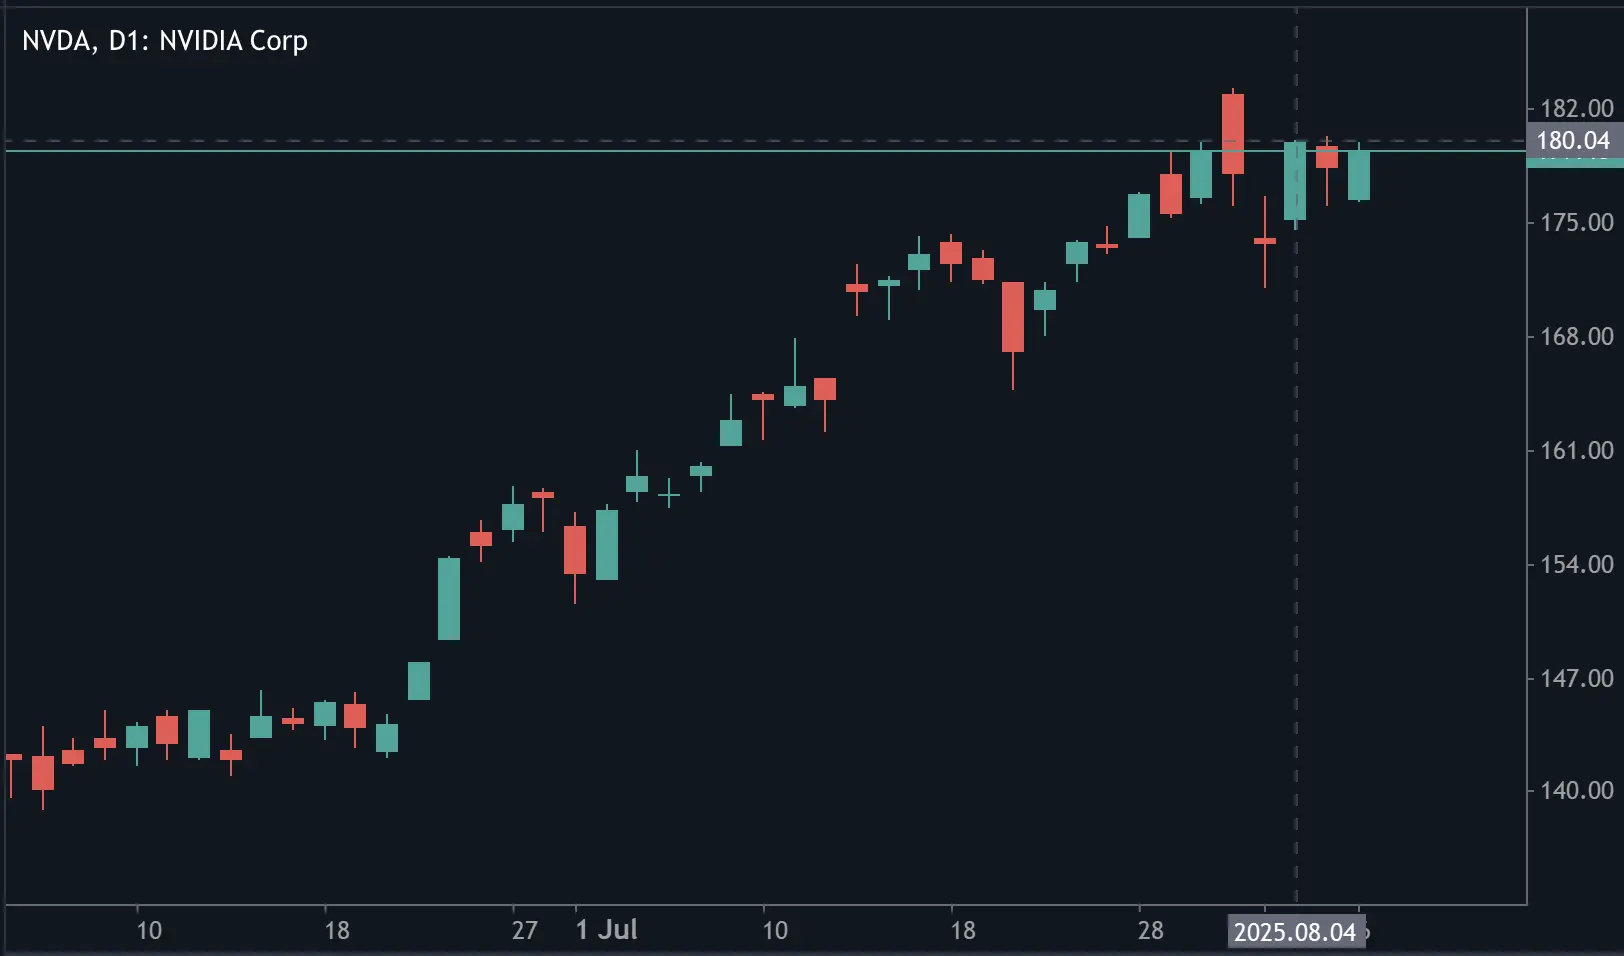
At the time of writing, Nvidia’s price is seeing a significant uptick as tariff wars rage on. However, volume bars show that sellers are offering significant pushback to buyer dominance - hinting at a potential consolidation. Should we see a further uptick, prices could find resistance at the $180.24 level. Conversely, should we see a dip, prices could be held at the $170.88 and $164.55 support levels.
Market positioning and potential upside
As of 4 August, Nvidia traded near its 52-week high at $180 per share, having outperformed rivals like Broadcom, Marvell, and Qualcomm over the last quarter.
Despite geopolitical tensions and Chinese export restrictions, the company forecasts Q2 revenue of $45 billion - a 50% year-over-year jump.
Wall Street expects revenue to grow by 52% in fiscal 2026 and earnings by over 40%. While some caution remains around Nvidia’s elevated forward P/E of 36.3x, analysts argue that its policy alignment, scale, and demand tailwinds justify the valuation.
The policy risk narrative is shifting
Trump’s tariff push marks a pivot from incentive-led semiconductor policy under the Biden administration to a more punitive “build here or pay up” model. While critics warn this could disrupt global supply chains and stoke inflation, investors appear to be pricing in exemptions and selective enforcement.
Semiconductor stocks initially wavered on the announcement but have since stabilised - with Nvidia leading the rebound. The belief that Trump’s policy will reward companies with a domestic footprint is fuelling speculative inflows, and Nvidia’s CEO Jensen Huang has already met with Trump twice in recent months, including just hours before the policy was floated publicly.
Frequently asked questions
Why is Nvidia seen as a beneficiary of Trump’s tariffs?
Because it has committed to large-scale U.S. production and is likely to receive policy exemptions.
Is the $500 billion investment confirmed?
Nvidia’s announced pledge includes spending on chip fabs, AI servers, and infrastructure over four years, with public–private funding support via the CHIPS Act.
What role does networking play in Nvidia’s business?
Networking technologies like NVLink and InfiniBand allow AI chips to function efficiently at scale. It’s a $12B+ business and a key part of Nvidia’s AI stack.
Are other firms affected by the tariff?
Yes. Countries like the Philippines and Malaysia have raised concerns, while firms without a U.S. manufacturing base may face cost pressures.
Investment implications
If Trump formalises the 100 percent tariff and carves out exemptions for companies with U.S. manufacturing, Nvidia could be uniquely positioned for further upside. Its combination of AI leadership, domestic alignment, and infrastructure scale provides a strong case for institutional inflows - especially if inflation and geopolitical pressures persist.
In a policy environment that now punishes global exposure and rewards national alignment, Nvidia may not just survive the tariff era - it could dominate it.
Trade on the next movements of Nvidia with a Deriv MT5 account today.

Why EUR/USD traders should be watching American grocery aisles
U.S. consumer behaviour is shifting decisively, with inflation-adjusted spending falling for the first time since the pandemic.
U.S. consumer behaviour is shifting decisively, with inflation-adjusted spending falling for the first time since the pandemic. Personal consumption expenditures declined by 0.15% in the first half of 2025, while major retailers report reduced demand - even among wealthier households. This downturn in household spending comes as EUR/USD consolidates around 1.1570, with traders awaiting the next macro trigger. According to analysts, signs of frugality - like shrinking basket sizes, rising coupon usage, and a move toward low-cost brands - could be early indicators of broader economic weakness that may influence both Federal Reserve policy and the direction of the currency pair.
Key takeaways
- U.S. consumers are cutting back on spending, even on essentials, as high prices and economic uncertainty take hold.
- Analysts say this shift in behaviour could feed into the Federal Reserve’s policy path and weaken the dollar.
- EUR/USD is consolidating around 1.1581, but a breakout could occur if policy and sentiment shift.
The U.S. consumer is retreating - and not quietly
Retail data, brand commentary, and day-to-day observations all point to the same trend: the free-spending habits that emerged after COVID-19 are waning.
Across demographics - from college students in Detroit to upper-middle-class families in Los Angeles - there’s a clear move toward restraint. Coupons, bargain-hunting, and downgrades to cheaper product lines are back in fashion.
Major consumer brands are feeling the shift. Mondelez, the maker of Oreo and Ritz, reported that U.S. sales have declined, even though global numbers remain strong. Chipotle has seen a dip in premium burrito orders, while Domino’s Pizza has leaned into “buy two, get one free” promotions to maintain traffic.
Procter & Gamble, which owns brands like Tide and Pantene, has noticed a slowdown in demand for essentials. Even Invisalign has reported that some consumers are opting for cheaper metal braces.
According to the Wall Street Journal, this trend reflects a deeper, more strategic shift in purchasing behaviour - what some analysts describe as a structural response to persistent inflation and economic anxiety, rather than a short-term adjustment.
Empower, a U.S. retirement asset manager, found in a June survey that over half of American adults now spend about four hours a day managing financial concerns. That’s the equivalent of a part-time job, all centred on making money stretch further.
Federal Reserve policy EUR/USD
As of 6 August, the EUR/USD pair trades in a tight range around 1.1581. Investors appear hesitant to take fresh positions, awaiting both U.S. inflation data and potential changes at the Federal Reserve. However, the clues may already be in the aisles of American supermarkets.
Historically, when economic uncertainty rises, the U.S. dollar often gains strength as investors seek safe-haven assets. Analysts suggest the recent drop in personal consumption expenditures - down 0.15% in the first half of 2025, the steepest fall since the pandemic - could be an early sign of recessionary conditions.

This narrative is reinforced by weak July data showing flat services sector growth and rising input costs. In the short term, these developments tend to support the dollar, as markets position defensively. But this dynamic could reverse if the Federal Reserve interprets the consumer pullback as a signal to pivot.
According to CME FedWatch data, traders are already pricing in over an 85% chance of a rate cut in September, with more cuts expected through the end of the year.

If realised, many anticipate this would reduce the appeal of U.S. assets and put downward pressure on the greenback, potentially lifting EUR/USD toward the 1.1590 –1.1800 region.
Meanwhile, Europe has its own sensitivities. The Eurozone, particularly Germany, relies heavily on exports to the U.S. A slowdown in American demand could weigh on Eurozone growth and, by extension, the Euro itself. However, analysts point out that if the European Central Bank holds rates steady while the Fed loosens policy, the narrowing rate gap may support the Euro, partially offsetting trade-related weaknesses.
EUR/USD technical analysis
At the time of writing, the pair is held in a tight range, with sell pressure evident on the daily chart. The volume bars show dominant buy pressure over the past few days, with sellers showing a strong reaction in the past two days. This hints at either a consolidation or a potential downturn. Should the downturn materialise, we could see prices find support floors at the 1.1529 and 1.1392 levels. Conversely, a price uptick could find resistance at the 1.1770 price level.

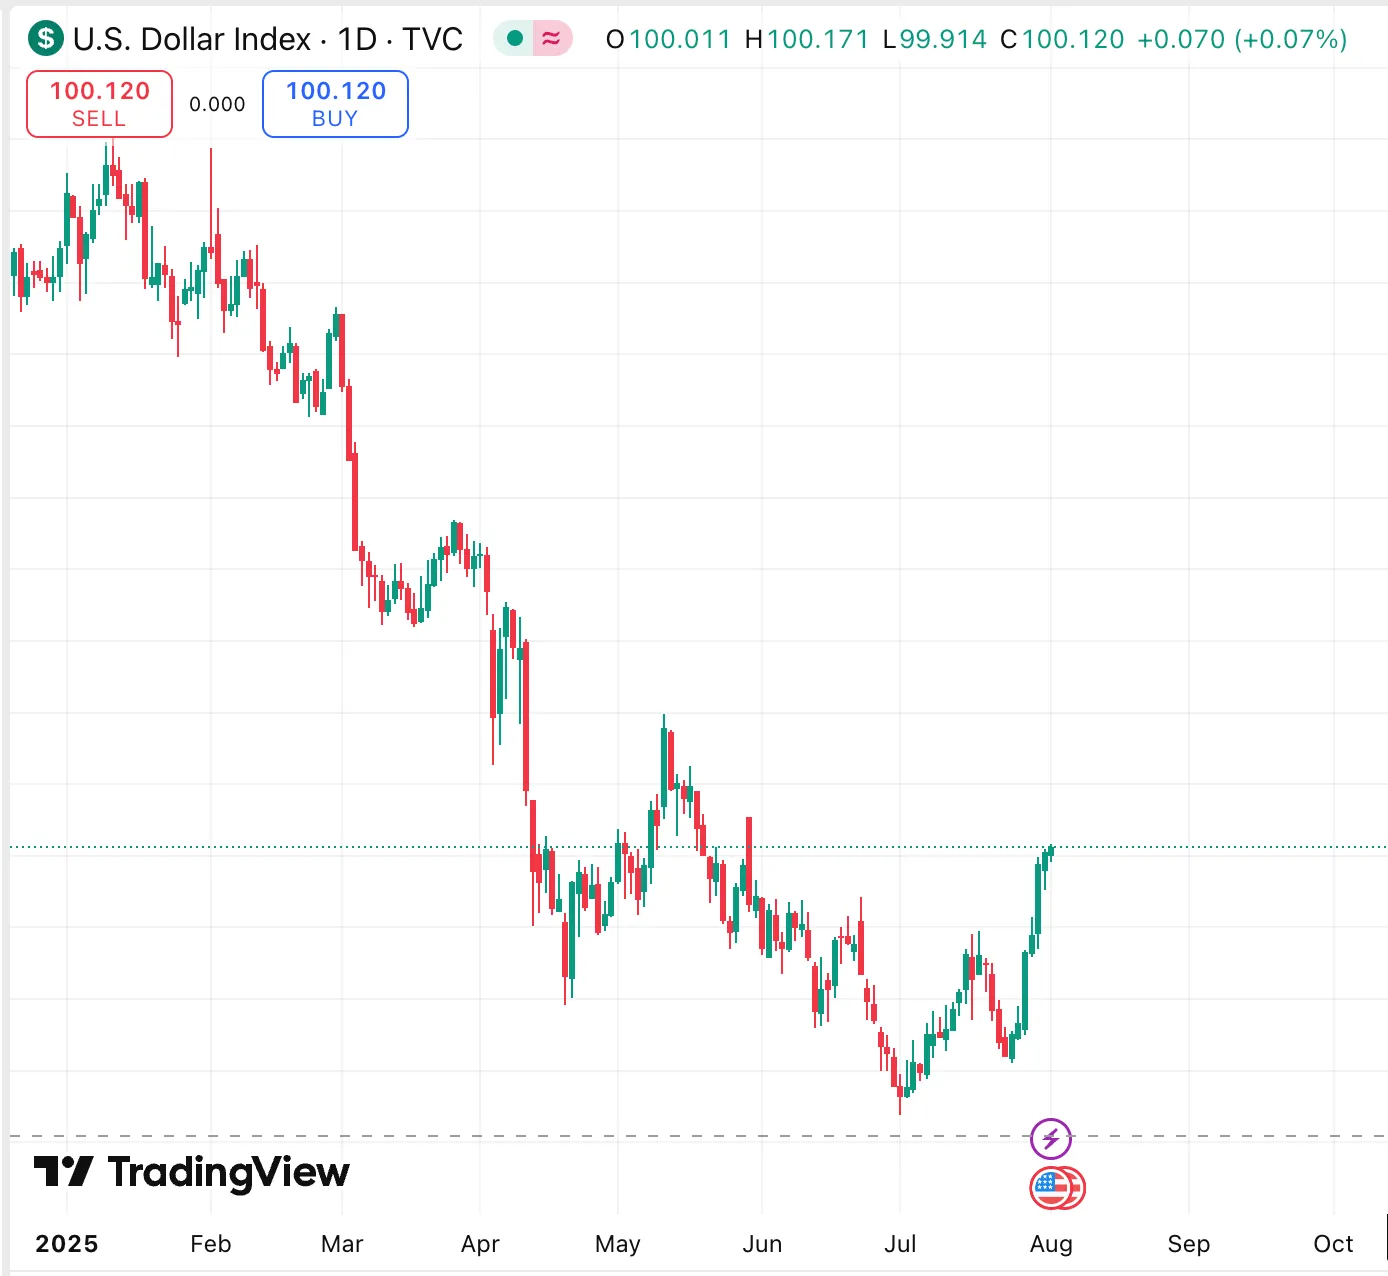
The U.S. Dollar Index (DXY) is hovering around 98.80, consolidating after a sharp fall driven by last week’s disappointing jobs report. Despite this, traders remain cautious, awaiting the next round of inflation data and President Trump’s announcements regarding Federal Reserve leadership changes.
The case for the grocery aisle becoming the new macro signal
What’s unfolding in the cereal aisle may offer better foresight than some traditional indicators. Kroger, a major U.S. retailer, has reported that while store visits are rising, basket sizes are shrinking. Consumers are putting fewer items in their carts and choosing private-label goods over big-name brands. These micro-decisions - made thousands of times a day - are shaping the macro landscape.
Analysts suggest this pattern of cautious spending could signal further demand-side weakness ahead. If households continue to cut back, the Fed may find itself compelled to act more decisively. And if it does, currency markets will feel it first.
Frequently asked questions
Why does U.S. consumer spending affect EUR/USD?
Because the USD is a global reserve currency. Weak spending reduces growth expectations, influencing the Fed’s policy path and the dollar’s value versus the Euro.
Are tariffs contributing to the spending shift?
Yes. Trump’s expansion of tariffs on semiconductors, pharma, and consumer goods has raised prices and added pressure on household budgets, fuelling this behavioural reset.
Is Europe immune to the slowdown?
Not entirely. Europe’s export-driven economies are vulnerable to U.S. demand weakness. However, ECB policy decisions could help support the Euro if the Fed turns dovish.
What should traders watch now?
Key data includes U.S. CPI, Eurozone retail sales, Fed rate guidance, and any policy signals from Trump’s upcoming Fed appointments.
Investment implications
EUR/USD may remain rangebound in the short term, but analysts warn that consumer spending data could be the hidden catalyst for a breakout. A deeper pullback in U.S. demand - especially if it leads to policy easing - could weaken the dollar and push the pair higher. On the other hand, if global recession risks mount, EUR/USD could move lower as both currencies face headwinds.
For now, traders may want to focus less on spreadsheets and more on shopping lists. The economic story is being told one grocery basket at a time.

The case for a gold price breakout as market volatility returns
Gold prices continued climbing into August 2025 as traders brace for renewed volatility in equity markets and prepare for a widely expected pivot by the U.S. Federal Reserve.
Gold prices continued climbing into August 2025 as traders brace for renewed volatility in equity markets and prepare for a widely expected pivot by the U.S. Federal Reserve. The Volatility Index (VIX) has lingered near its yearly low of 15 but is seasonally primed to rise through October, a pattern historically associated with surging demand for safe-haven assets like gold.
According to World Gold Council data, Q2 2025 saw a record $132 billion in global gold demand - driven by ETF inflows, retail investor activity, and growing inflation and trade risks.
Key takeaways
- The VIX hovers near 17.48, historically near a seasonal bottom. CBOE data shows a typical 30% rise from August to October, creating conditions for risk-off sentiment.
- Global gold demand reached a record $132 billion in Q2 2025, with investment flows up 78% year-on-year and ETF inflows at the strongest level since 2020.
- Expectations of a Fed rate cut in September rose to 87.8% following weak job data and rising PCE inflation, creating bullish conditions for gold.
- Tariffs imposed by the U.S. on key trading partners, including Canada, India, and Brazil, increase inflation risks and global trade uncertainty - both key drivers of gold interest.
Gold and market volatility: The safe-haven play
The VIX, often referred to as Wall Street’s “fear gauge,” has declined over 45% since April and now sits near multi-month lows. But history suggests this calm won’t last.
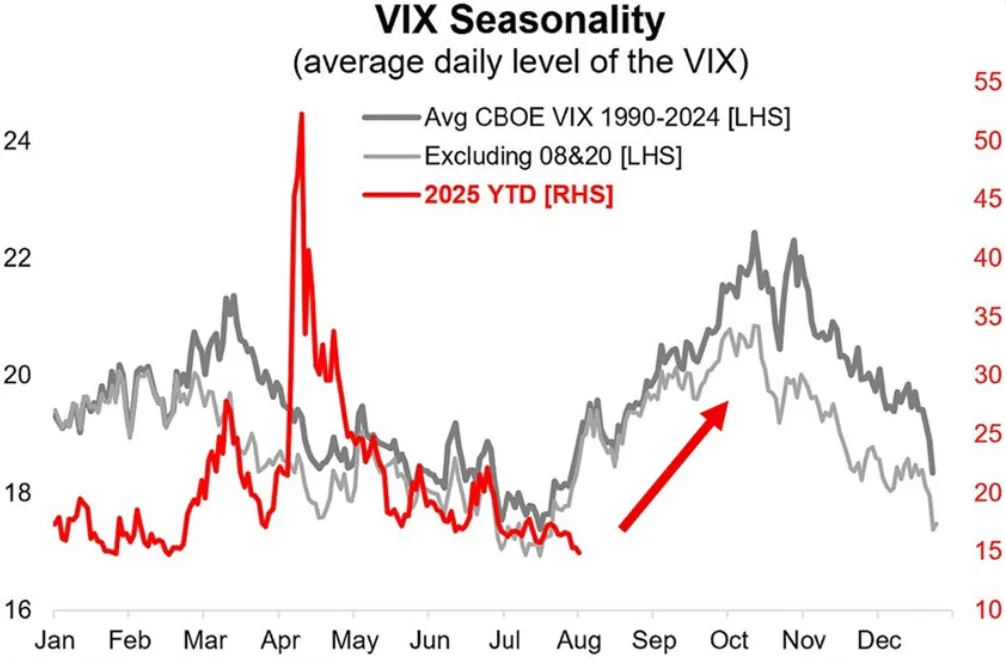
According to seasonal data tracked by market analysts, the VIX typically rises from August through October, as institutional rebalancing, earnings volatility, and geopolitical concerns emerge.
Periods of rising VIX often coincide with stronger gold prices. As risk sentiment flips, institutional and retail investors typically move capital into gold ETFs and physical bullion. A 2021 study found that gold returns positively correlate with implied volatility during periods of heightened market stress.
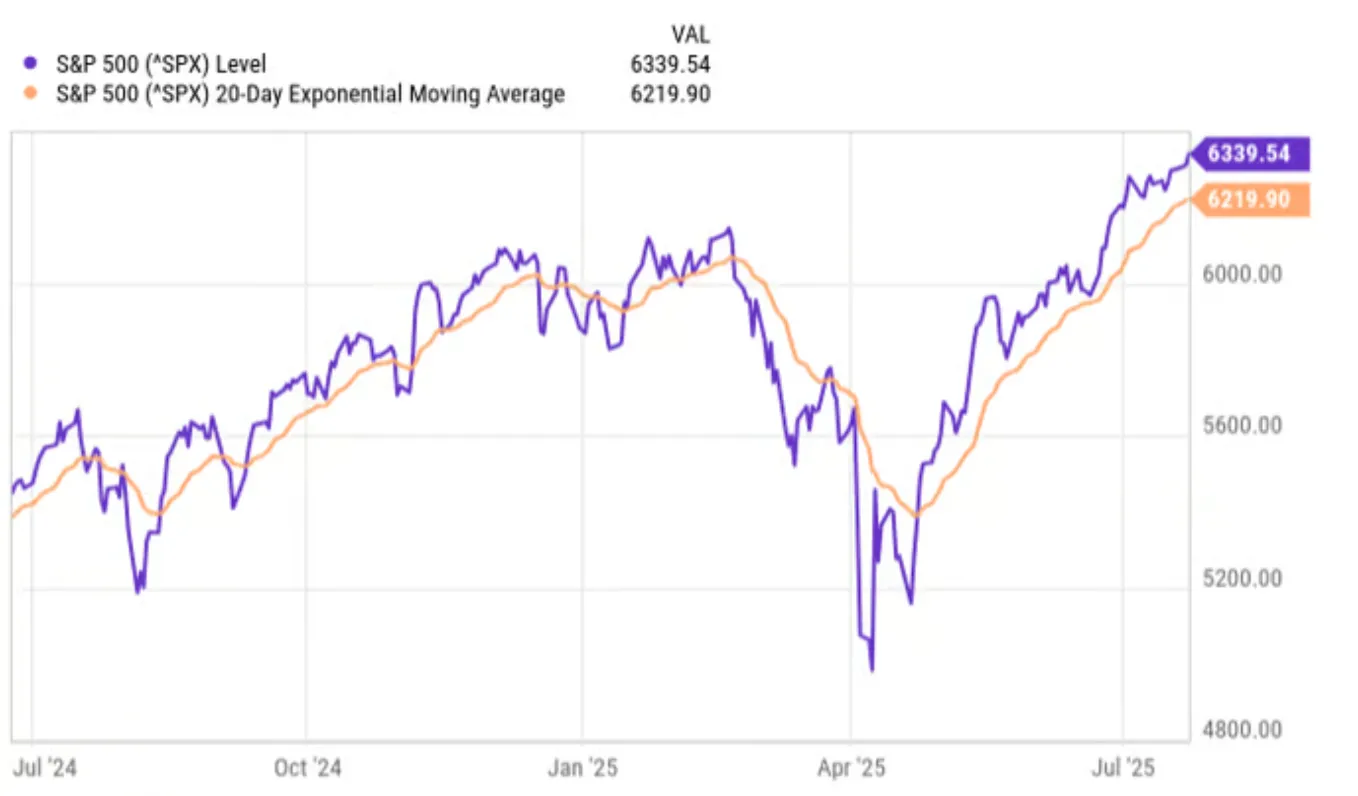
The S&P 500 has now traded above its 20-day moving average for 68 straight sessions - the longest stretch since the 1990s.
Market complacency, as measured by low implied volatility and high equity valuations, suggests gold may be well-positioned if sentiment turns sharply risk-off.
Monetary policy and inflationary tailwinds
Gold’s appeal is rising alongside growing expectations for monetary easing. The CME FedWatch Tool shows an 87.8% probability of a Fed rate cut in September, up from 63% just one week earlier. Market pricing now reflects an additional cut in December.
Recent U.S. labour market data showed nonfarm payroll revisions slashed 258,000 jobs from prior reports, reinforcing the view that the Fed may ease to avoid deeper economic weakness. Meanwhile, the Fed’s preferred inflation gauge - the Personal Consumption Expenditures (PCE) Index - rose 0.3% in June, up from a revised 0.2% in May, driven in part by rising costs linked to trade tariffs.
Lower rates reduce the opportunity cost of holding non-yielding gold, while persistent inflation reinforces gold’s value as a store of wealth. The World Gold Council predicts global inflation could exceed 5% in the second half of 2025, even as growth remains subdued - a classic stagflation setup historically favourable for gold.
Record-breaking demand and Gold ETF inflows
According to the World Gold Council’s Q2 2025 report:
- Total gold demand by volume rose 3% year-on-year to 1,249 metric tons.
- By value, demand surged 45% to $132 billion — the highest on record.
- ETF inflows reached 170 metric tons in Q2, with H1 demand at 397 metric tons — the strongest six-month performance since H1 2020.
- Bar and coin demand remained strong in China and Europe. In China, retail investment in gold surpassed jewellery consumption for the first time in years.
OTC and institutional demand also rose, while central bank gold purchases - though down 33% from Q1 - remained above historical averages at 166 metric tons.
Divergence in jewellery and tech demand
While investment demand soared, gold demand for jewellery and technology applications weakened:
- Global jewellery demand fell to 341 metric tons — the lowest since Q3 2020 and 30% below the five-year average.
- Technology-sector gold usage slipped 2% year-on-year to 79 metric tons amid trade uncertainty and declining East Asian manufacturing activity.
The WGC noted that demand from AI-related technologies helped offset the broader decline in electronics.
Supply-side dynamics and gold price resilience
Gold supply rose to 1,249 metric tons in Q2 2025, driven by a record 909 metric tons in mine production and a 4% increase in recycling activity. However, recycling remains subdued relative to historical patterns, suggesting holders are reluctant to sell amid rising prices and economic uncertainty.
Gold price technical outlook and trading range
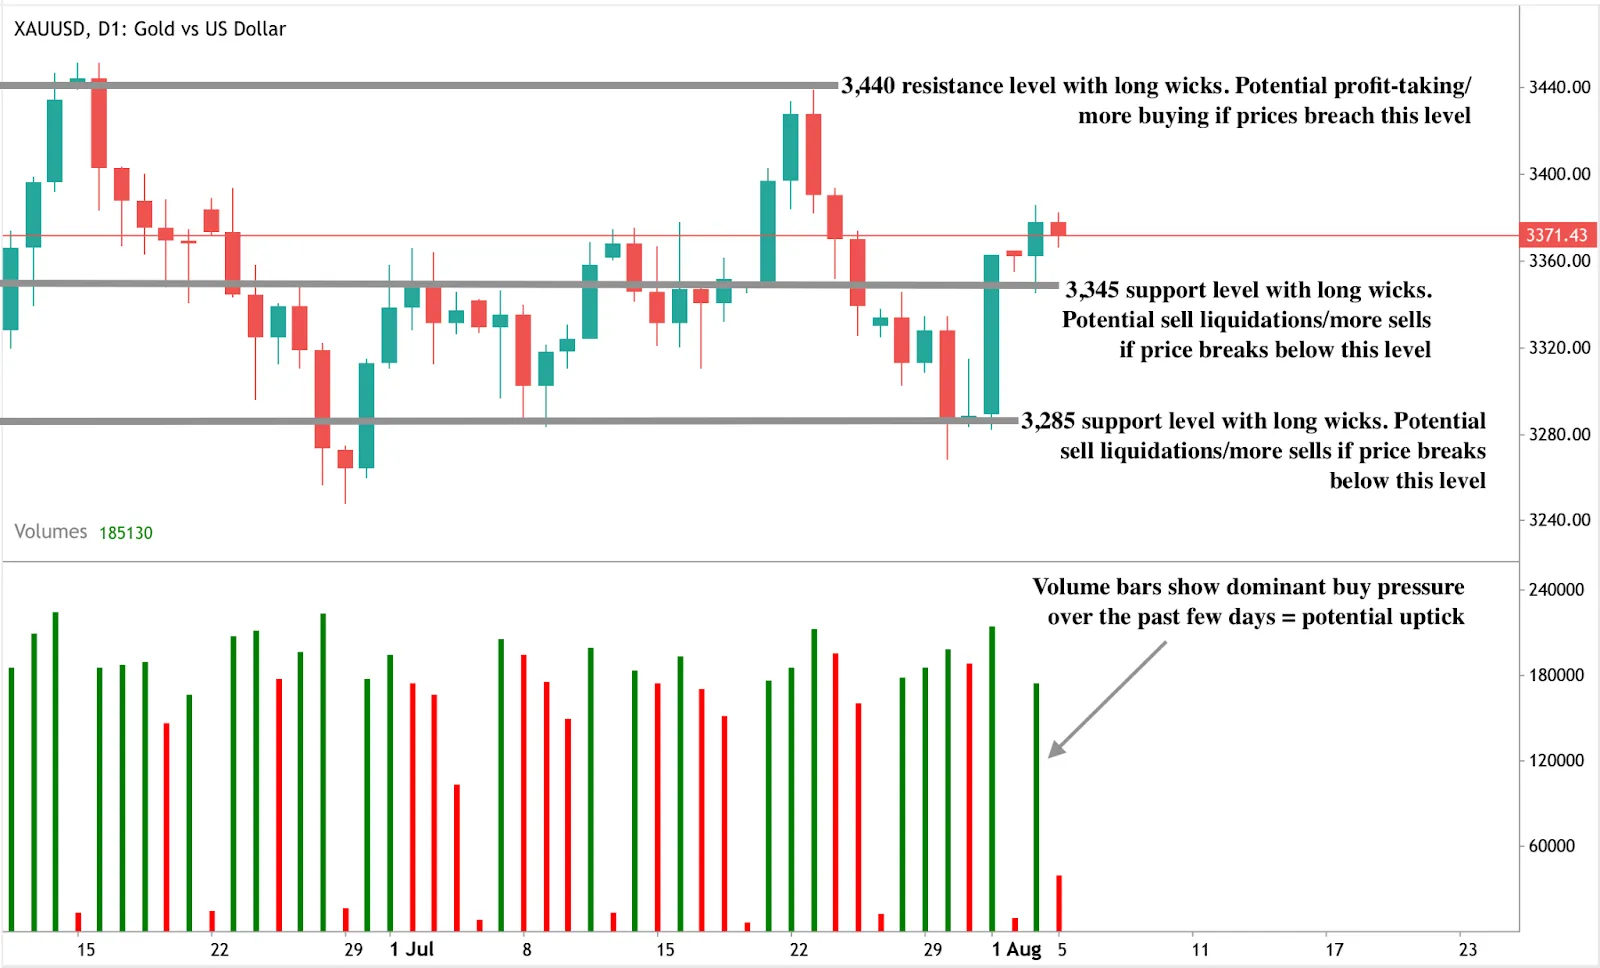
At the time of writing, gold is seeing some retreat from a strong price uptick. The pullback is occurring within a known sell zone, which could hint at further downside in the short term. However, volume analysis reveals dominant buy pressure, reinforcing the broader bullish narrative.
If prices manage to breach current levels and push higher, gold could encounter resistance at the $3,440 level. On the downside, any pullback may find support at $3,345 and $3,285, levels that traders will be watching closely for potential accumulation zones.
What does this mean for gold in 2025?
Gold appears poised to benefit from a convergence of macro catalysts:
- Rising market volatility (VIX) tends to correlate positively with gold in periods of financial stress.
- Rate cuts are increasingly priced in, making non-yielding assets like gold more attractive.
- Sticky inflation and new tariffs could further reinforce gold’s role as a hedge.
- Robust investment flows, particularly in ETFs and physical bars, signal strong investor conviction.
Frequently asked questions
Why is gold considered a hedge during market volatility?
Gold often appreciates when market risk rises, serving as a safe haven against equity downturns, geopolitical instability, and inflation.
What are the key technical levels for gold in H2 2025?
Resistance is identified near $3,440, while support levels lie at $3,345 and $3,285. Volume trends suggest bullish sentiment remains dominant.
How do interest rates impact gold prices?
Lower rates reduce the opportunity cost of holding gold, increasing its appeal. Gold prices often rise as rate cut expectations build.
Is the record $132 billion in gold demand sustainable?
Investment demand is expected to remain firm. However, jewellery and tech demand may stay weak amid global trade tensions and high prices.
Investment implications
Gold is regaining its safe-haven status as markets prepare for renewed volatility. With record demand, strong ETF inflows, and dovish central bank expectations, the setup for a breakout rally is in place. Investors should monitor upcoming CPI data, Fed meeting outcomes, and VIX levels for confirmation signals.
For traders, a break above $3,440 could signal the beginning of a new bull run. For long-term investors, gold offers both a diversification tool and an inflation hedge in what remains an unpredictable macro environment.
Is the U.S. manufacturing slowdown pushing oil prices toward $60-70?
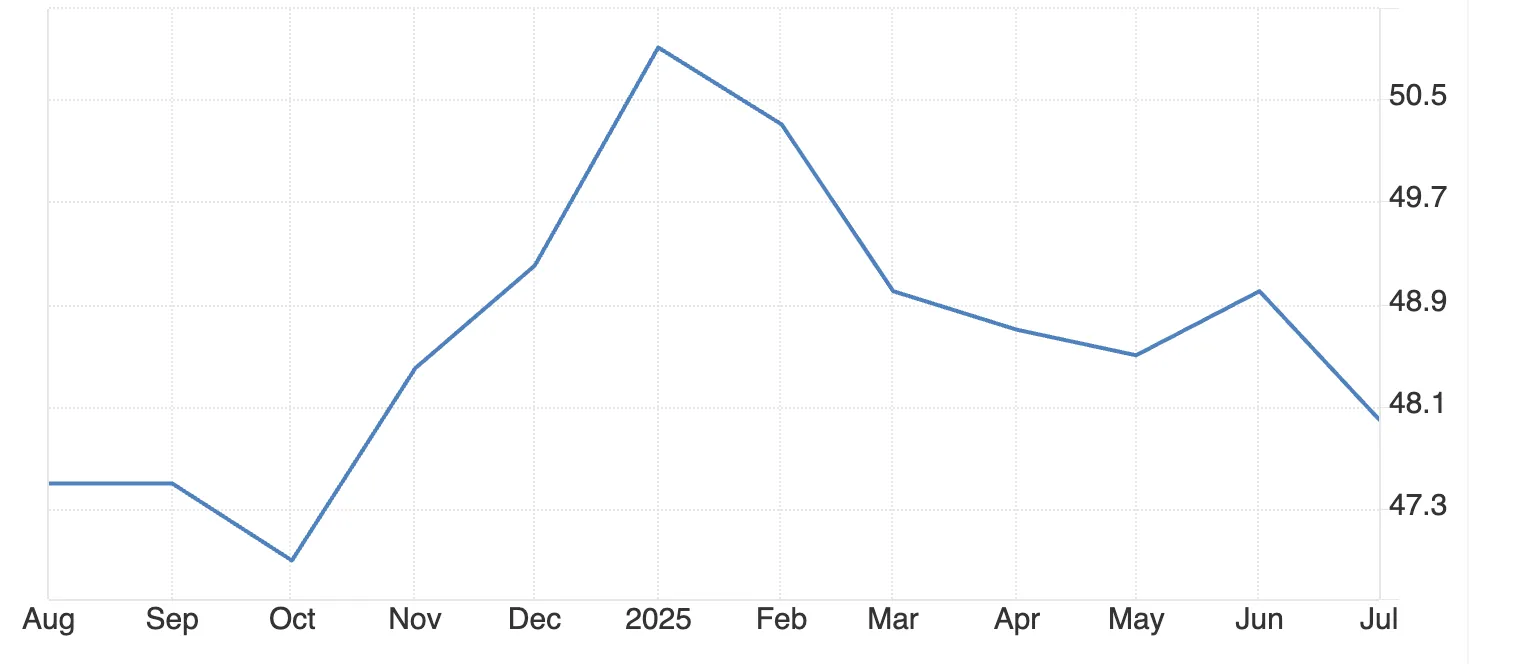
The U.S. manufacturing sector contracted for the fifth consecutive month in July 2025, with the Institute for Supply Management (ISM) PMI falling to 48, creating significant downward pressure on oil demand.
The U.S. manufacturing sector contracted for the fifth consecutive month in July 2025, with the Institute for Supply Management (ISM) PMI falling to 48, creating significant downward pressure on oil demand. This trend, combined with weakening industrial activity, could drive crude prices toward the $60-70 range seen in previous economic slowdowns, according to analysts.
Key takeaways
- The U.S. manufacturing sector contracted to 48 PMI in July 2025, continuing a five-month decline that threatens global oil demand.
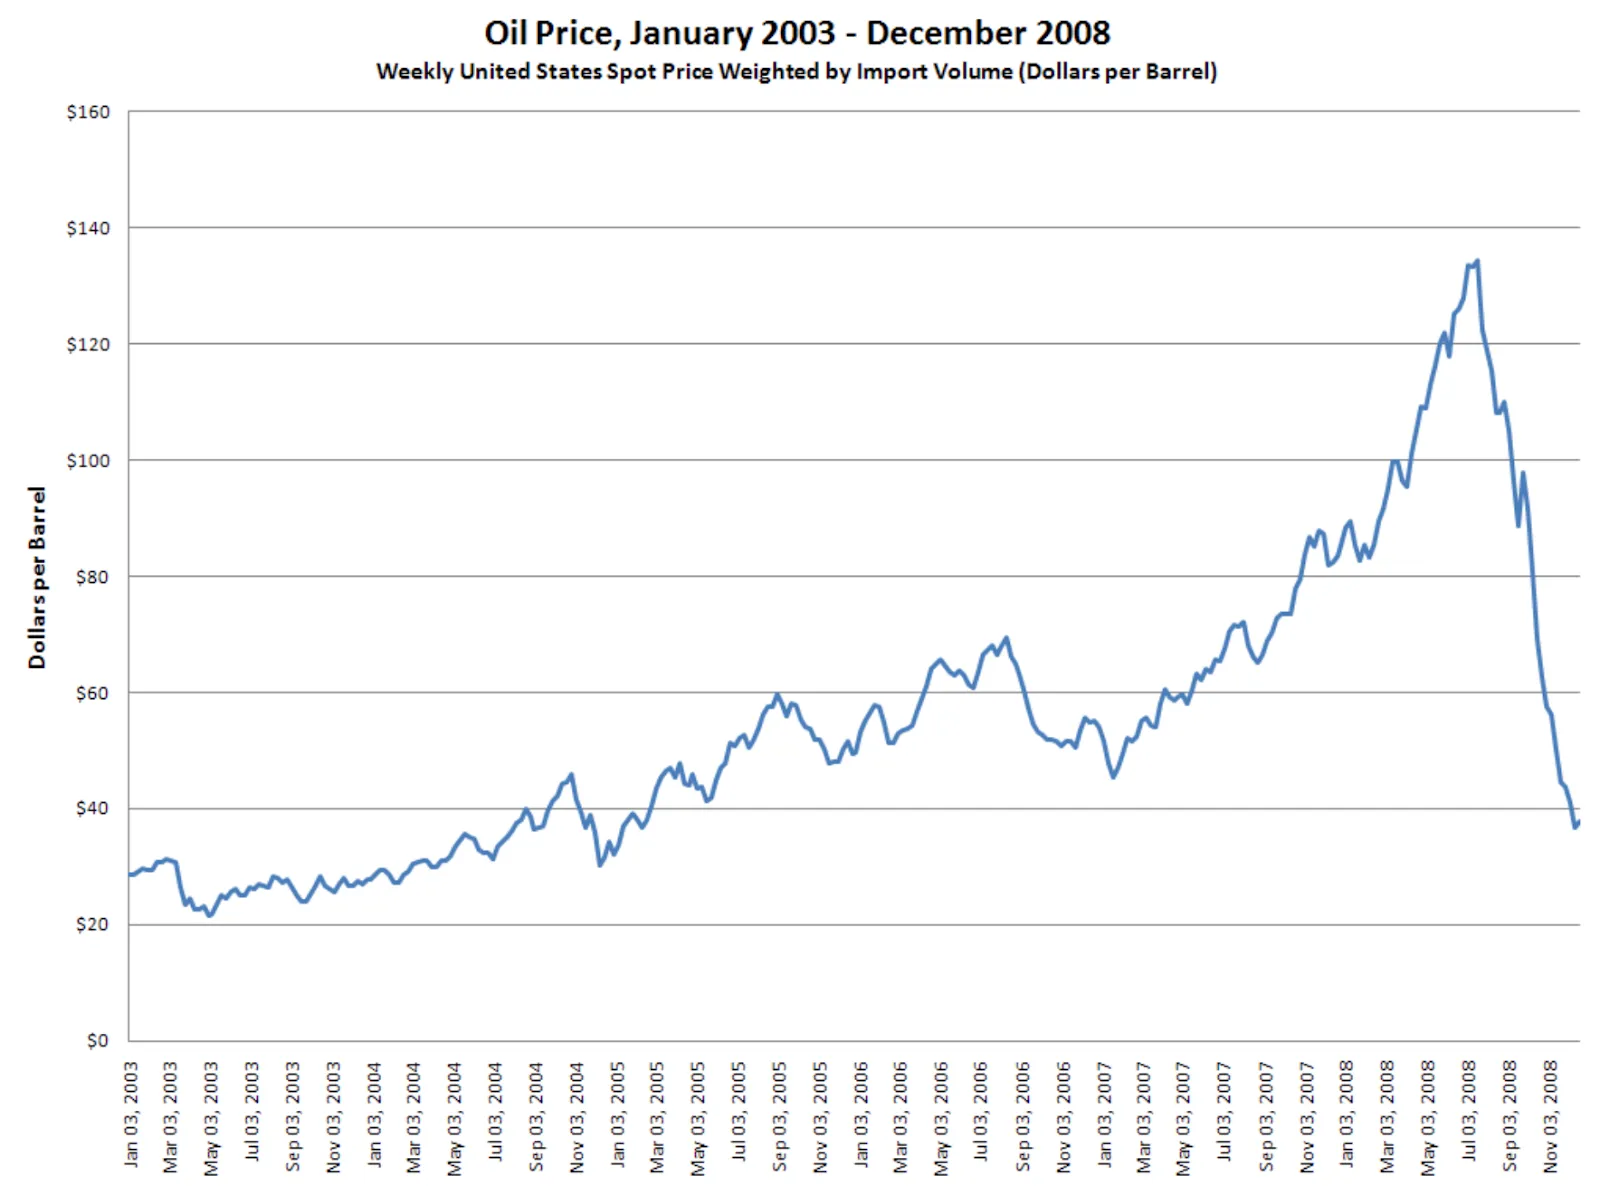
- Manufacturing employment dropped 25% (the sharpest cut since COVID-19) while new orders fell for 6 consecutive months. Historical precedent from 2008 shows similar manufacturing weakness preceded oil price crashes from $147 to under $40 per barrel.
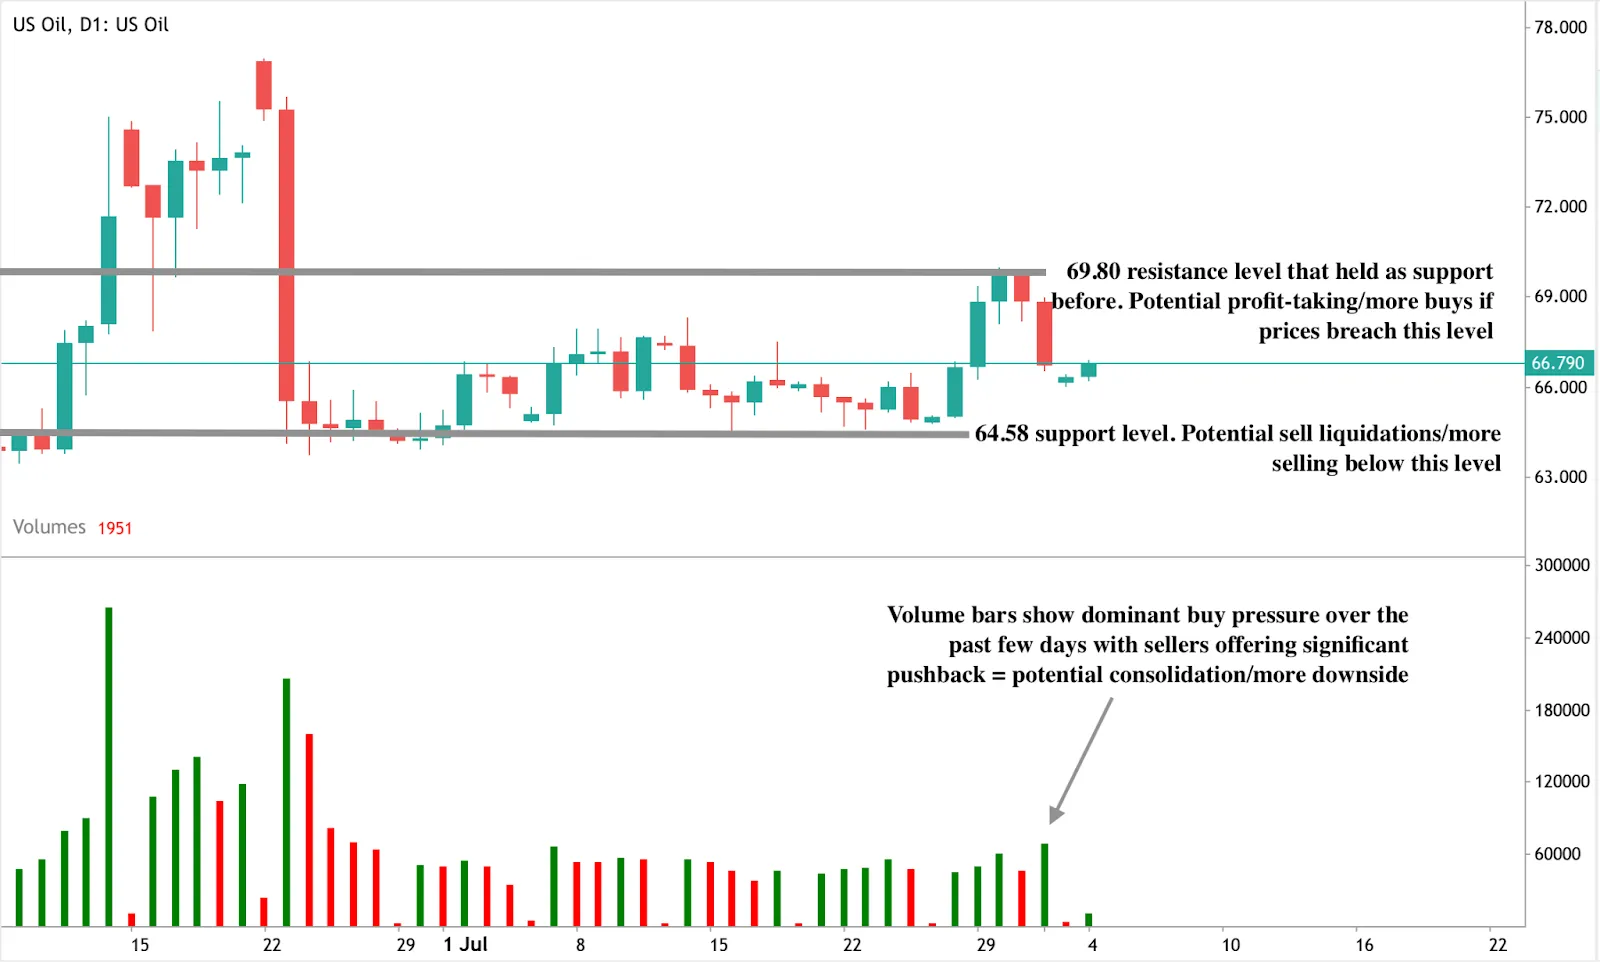
- Current crude prices around $66-67 face downward pressure, with key support at $64.58 and resistance at $69.80.
Manufacturing and oil demand connection
Manufacturing drives oil consumption through three primary channels. Heavy machinery requires diesel fuel for operations, while transportation networks need petroleum products to move goods. Supply chain logistics consume significant gasoline and diesel volumes when factories operate at full capacity.
The July 2025 Manufacturing PMI of 48 indicates contraction below the neutral 50 threshold. This directly correlates with reduced petroleum demand across industrial sectors. The Institute for Supply Management data shows manufacturing activity declining for 31 out of the last 33 months, creating sustained downward pressure on oil consumption.
Employment data reveals deeper structural concerns. The manufacturing employment index reached 43.4 in July 2025, marking a post-pandemic low. Fewer manufacturing workers means reduced commuting fuel demand, lower industrial production, and decreased supply chain activity.
Historical precedent for manufacturing-driven oil price declines
The 2008 financial crisis demonstrates how manufacturing contractions impact oil markets. Crude prices collapsed from $147 per barrel in July to under $40 by December 2008 as industrial demand evaporated.
Current conditions show similar patterns as noted by experts: sustained PMI readings below 50, rising input costs, and constrained business investment.
Manufacturing weakness typically precedes broader economic slowdowns that significantly reduce oil demand. The current five-month contraction period matches early warning signs from previous recessionary periods that led to substantial crude price declines.
Policy headwinds amplifying demand weakness
Tariff policies increase manufacturing input costs, while the Federal Reserve interest rate policy constrains business expansion. Higher production costs reduce industrial activity and logistics volumes, two major petroleum consumption drivers. These policy factors compound underlying manufacturing weakness.
The U.S. Energy Information Administration projects crude oil production declining from 13.5 million barrels per day in April 2025 to 13.3 million barrels per day by end-2026. WTI crude prices are forecast to fall to $53 per barrel through 2026, representing a 22% decline from June 2025 levels.
Global demand cannot offset U.S. manufacturing decline
India’s oil consumption reportedly increased 3.1% to 5.6 million barrels per day in 2025, while China’s declined 1.2% to 16.4 million barrels per day. However, emerging market energy consumption often involves subsidised pricing that provides limited support for global oil prices.
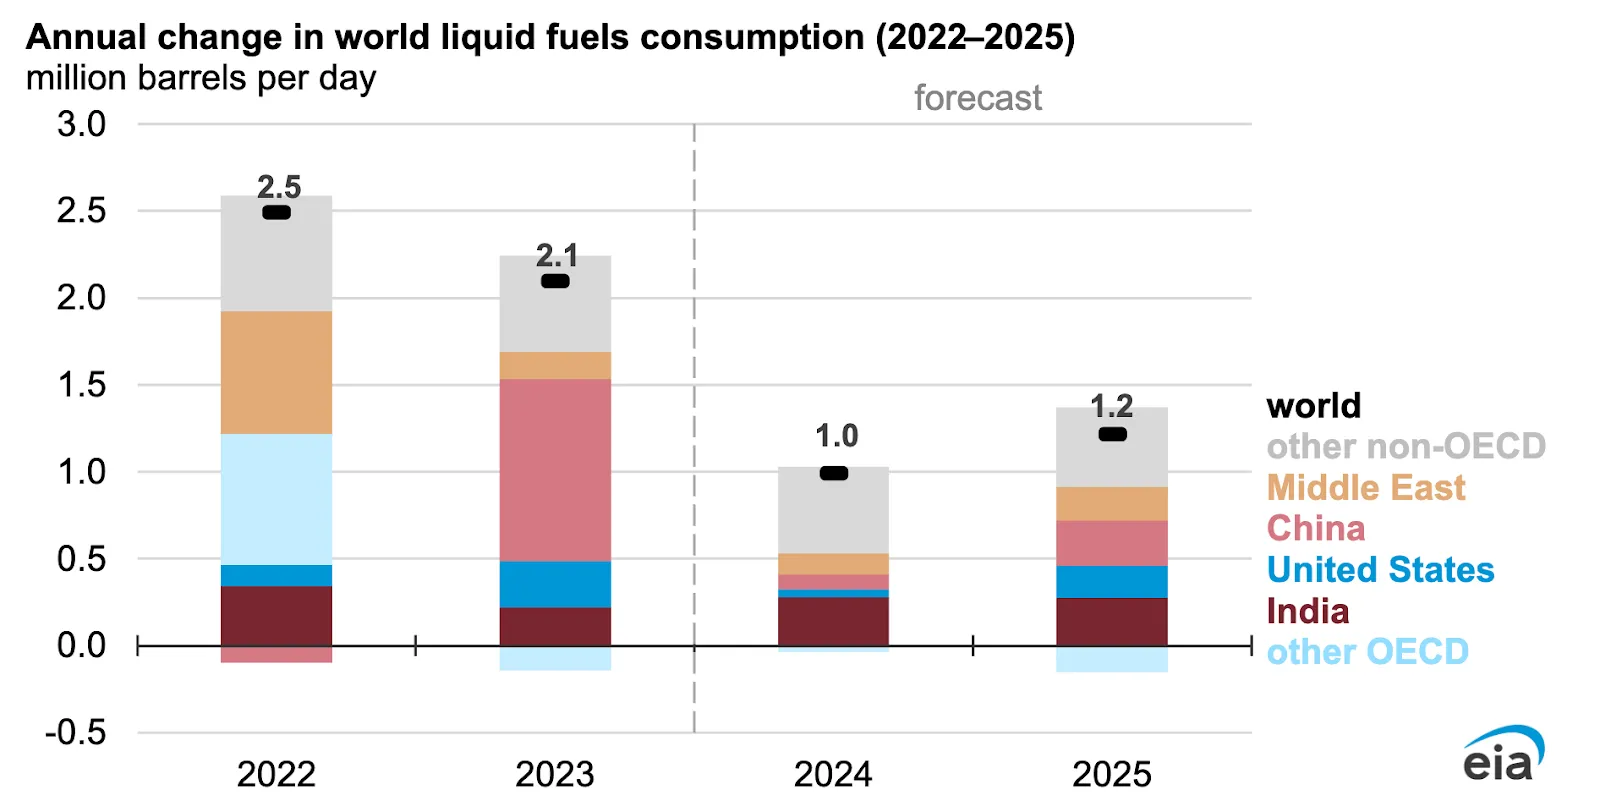
Global manufacturing shifts to lower-cost countries represent demand reshuffling rather than net demand growth. Given America's position as the world's largest oil consumer, emerging market consumption increases cannot fully offset potential U.S. industrial demand declines.
Supply-side factors and geopolitical risks
OPEC+ gradually unwinds voluntary production cuts while global output remains stable at 101.8 million barrels per day. Geopolitical tensions, including Israel-Iran conflicts and potential secondary sanctions on Russian oil buyers, create upside price risks, according to analysts.
Supply disruptions could temporarily support prices, but sustained manufacturing weakness suggests demand-side factors will dominate market direction. Unless significant geopolitical events occur, oversupply conditions may develop as industrial demand continues declining.
Oil price outlook and trading levels
Current technical analysis shows oil prices recovering from weekend lows with buying pressure emerging. Key resistance stands at $69.80 while critical support remains at $64.58. Break below support levels could accelerate moves toward the $60-70 target range.
The EIA's forecast of $53 per barrel WTI by end-2026 aligns with manufacturing-driven demand weakness. Declining U.S. production combined with reduced industrial consumption creates a bearish price environment absent major supply shocks.
What does this mean for oil prices in 2025?
Manufacturing PMI readings below 50 for five consecutive months signal sustained industrial weakness. New orders declining for six months indicate continued manufacturing contraction ahead. Employment cuts of 25% suggest reduced energy consumption across multiple sectors.
Oil prices are likely to drift toward the $60-70 per barrel range unless manufacturing conditions improve or significant supply disruptions occur. The quiet decline of U.S. industrial activity may prove more impactful than dramatic geopolitical events on crude price direction.
Frequently asked questions
- How does U.S. manufacturing affect global oil prices?
The U.S. consumes approximately 20% of global oil production. Manufacturing drives demand for diesel, gasoline, and petroleum products through industrial operations, transportation, and supply chain logistics.
- What manufacturing PMI level signals oil market concern?
PMI readings below 50 indicate manufacturing contraction. The current 48 level sustained for five months suggests significant petroleum demand weakness ahead.
- Can emerging markets offset U.S. manufacturing decline?
Emerging market oil demand growth involves subsidised energy pricing and cannot fully replace potential U.S. industrial demand losses given America’s consumption scale.
- What are key oil price levels to watch?
The trading range is defined by current resistance at $69.80 and support at $64.58. Breaks below $64.58 could accelerate moves toward $60-70 targets.
Investment implications
Manufacturing weakness suggests sustained downward pressure on oil prices through 2025 according to analysts. The $60-70 per barrel range represents realistic expectations absent supply shocks. Geopolitical risks remain the primary upside catalyst, while manufacturing data indicates continued demand headwinds.
Investors should monitor manufacturing PMI, employment data, and new orders as leading indicators of petroleum demand trends. Policy changes affecting trade or monetary conditions could alter the trajectory.

American exceptionalism is back as foreign inflows pour into US markets
With tariffs looming, yields rising, and other markets gaining ground, the question is: Can the US keep the magic alive?
Just when it looked like the narrative of US dominance was starting to fray - cue April’s market wobble, Trump’s tariff tantrums, and a dollar in decline - global investors pulled a sharp U-turn. In June alone, foreign buyers poured a record $51.1 billion into US stocks and bonds, reversing a rare retreat the month before.
It’s the kind of comeback that has Wall Street veterans buzzing and doomsayers scrambling. The S&P 500 is once again eyeing fresh highs, and talk of “American exceptionalism” isn’t just back - it’s booming. Whether it’s faith in the strength of US institutions, a bet on consumer resilience, or simply a global flight to safety, one thing’s clear: the world is still betting big on brand America.
But with tariffs looming, yields rising, and other markets gaining ground, the question is: Can the US keep the magic alive?
A record rebound in foreign capital inflows
April was messy. The S&P 500 flirted with bear market territory, the Nasdaq fell through it, and Treasury yields went on a rollercoaster as investors braced for a wave of uncertainty. Trump’s surprise return to tariff hikes - dubbed “Liberation Day” by traders - sparked fears of capital flight, currency instability, and a potential unraveling of US market supremacy.
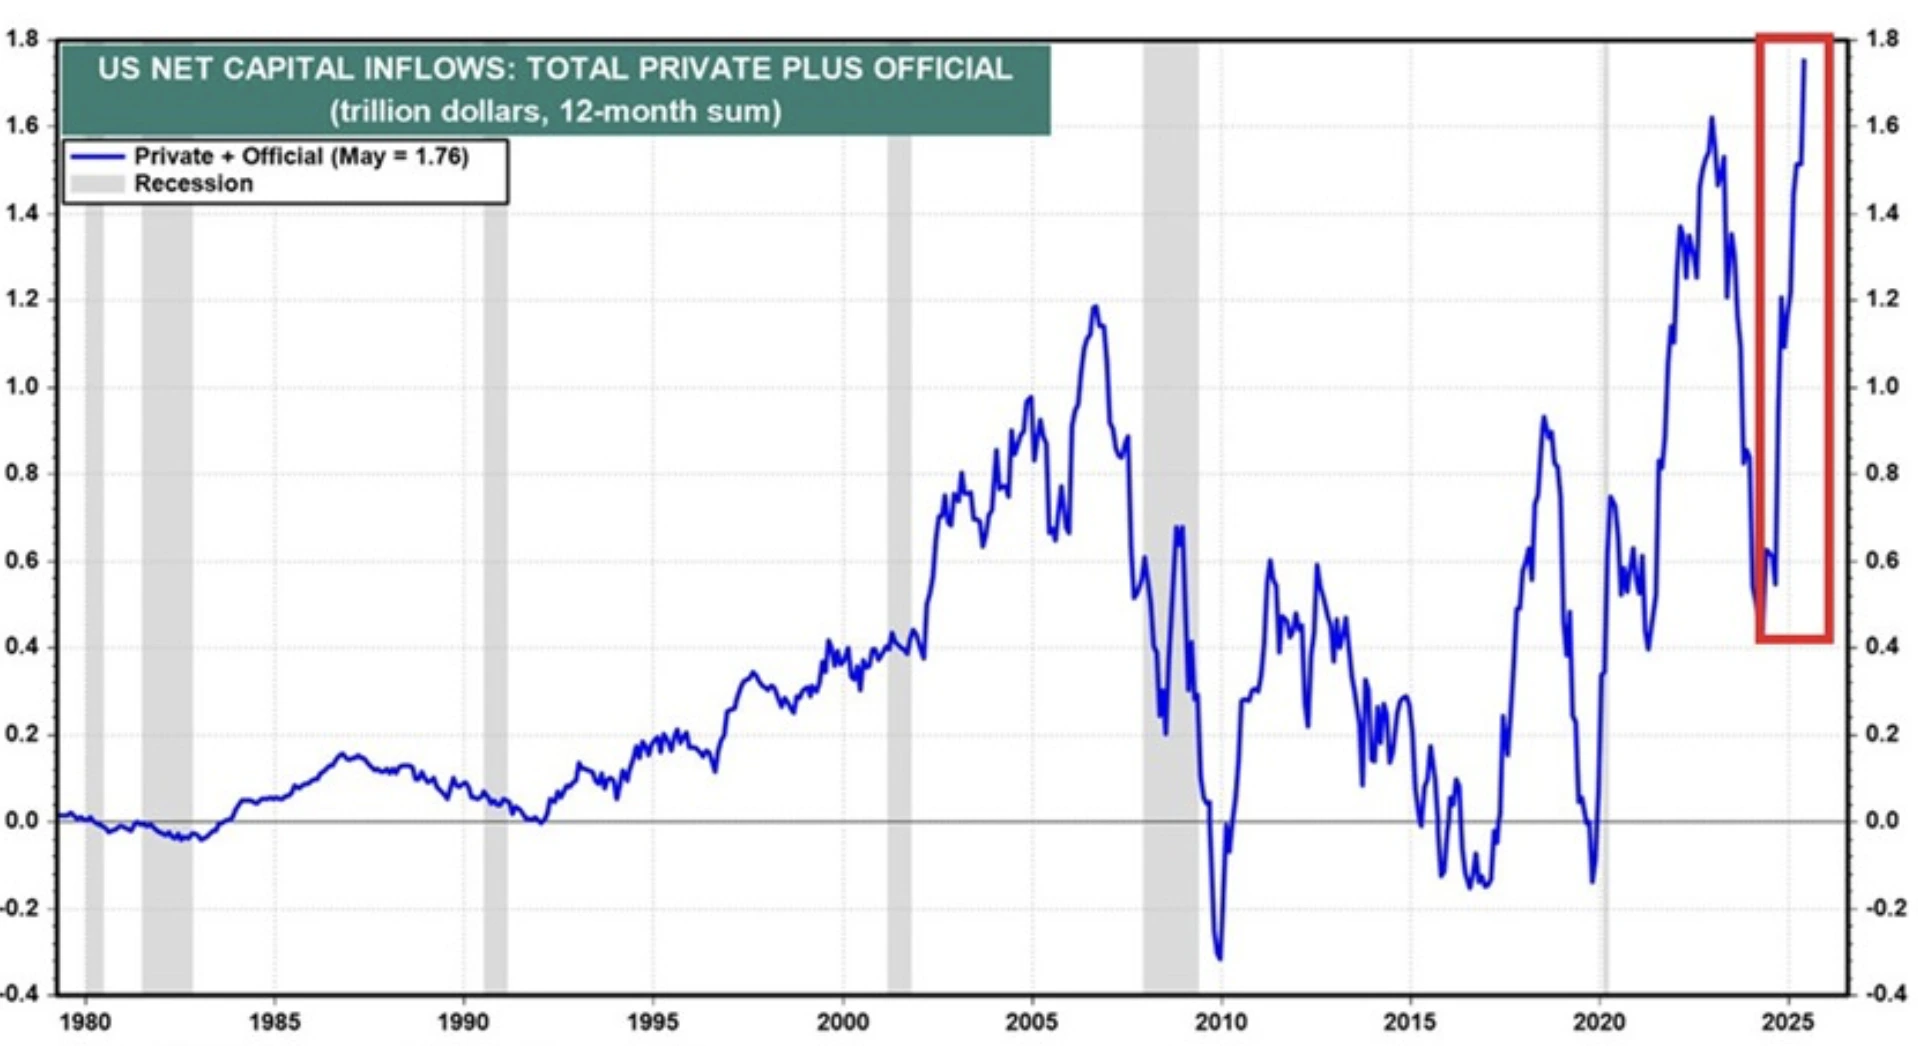
And then, just weeks later, came the whiplash: $311 billion in net foreign inflows in May, the highest monthly total ever recorded. That followed a modest $14.2 billion outflow in April, making the turnaround even more dramatic.
The numbers don’t lie. For the 12 months through May, net foreign inflows are fast approaching the record $1.4 trillion peak seen in July 2023 - right when “American exceptionalism” last dominated headlines.
Why investors are flocking back to the US markets in 2025
Let’s break it down. What’s pulling all this foreign cash into US markets?
- Tariff shock therapy: The worst of Trump’s tariff threats are, for now, on hold. That pause has given markets time to breathe - and time for investors to snap up assets before things potentially escalate again.
- US consumer strength: Americans, somehow, are still spending. That’s propping up corporate earnings and fuelling optimism that the domestic economy can stay afloat even as global growth falters.
- The dollar and safe-haven appeal: Despite its recent slump, the dollar remains the world’s default safety blanket. With the World Bank forecasting just 2.3% global growth this year, investors are playing it safe - and US assets fit the bill.
- No real alternative: Europe’s in a slowdown. China’s recovery is patchy. When push comes to shove, the US still offers the deepest, most liquid financial markets on the planet.
As Robin Brooks of the Brookings Institution put it: “Markets are far more accepting of all the ups and downs than people realise. US exceptionalism is alive and well.”
The Dollar's safe-haven status has been under threat
Of course, not all that glitters is gold. The dollar just clocked its worst first half in over 50 years.
At the same time, the S&P 500 and Nasdaq have retaken prior highs, indexes in Europe and China have outperformed in recent months. There’s also the very real risk that ongoing trade negotiations could fall apart, triggering even higher tariffs down the line.
Then there’s the long-term picture. Critics like Ken Griffin argue the US is “tarnishing its brand” with erratic policy moves, while Deutsche Bank warns that the US’s structural edge - particularly the ability to finance cheaply through dollar dominance - is beginning to erode. Economist Jim Reid stated that they maintain a long-term negative outlook on the US dollar and anticipate a continued rise in US term premia.
Translation? Borrowing could get more expensive, and investors may not always be so forgiving.
The market’s mood right now
The mood right now is marked by relief and a renewed sense of confidence. While bond yields remain high, they’ve levelled off, and stocks are on the rise once more.
Crucially, any notion that global investors might turn their backs on the US has been firmly set aside, at least for now. Market veteran Ed Yardeni noted with a touch of irony that the latest Treasury data reaffirmed investors’ continued faith in the support of foreign buyers.
It’s a cheeky way of saying what many in the markets are thinking: when the chips are down, the world still chooses the US.
US markets 2025 outlook: Will the S&P 500 hit a new record?
That’s the trillion-dollar question. The ingredients are certainly in place:
- Record-breaking foreign inflows
- Easing tariff anxiety
- Earnings holding up
- A global economy still searching for footing
But the headwinds are real - high interest rates, policy unpredictability, and a crowded geopolitical calendar. If global investors get spooked again, this resurgence could quickly stall.
Still, for now, the stars seem to be aligning. The US is back in favour, the S&P 500 is climbing, and the narrative of American exceptionalism - once declared dead - is suddenly alive, well, and buying stocks.
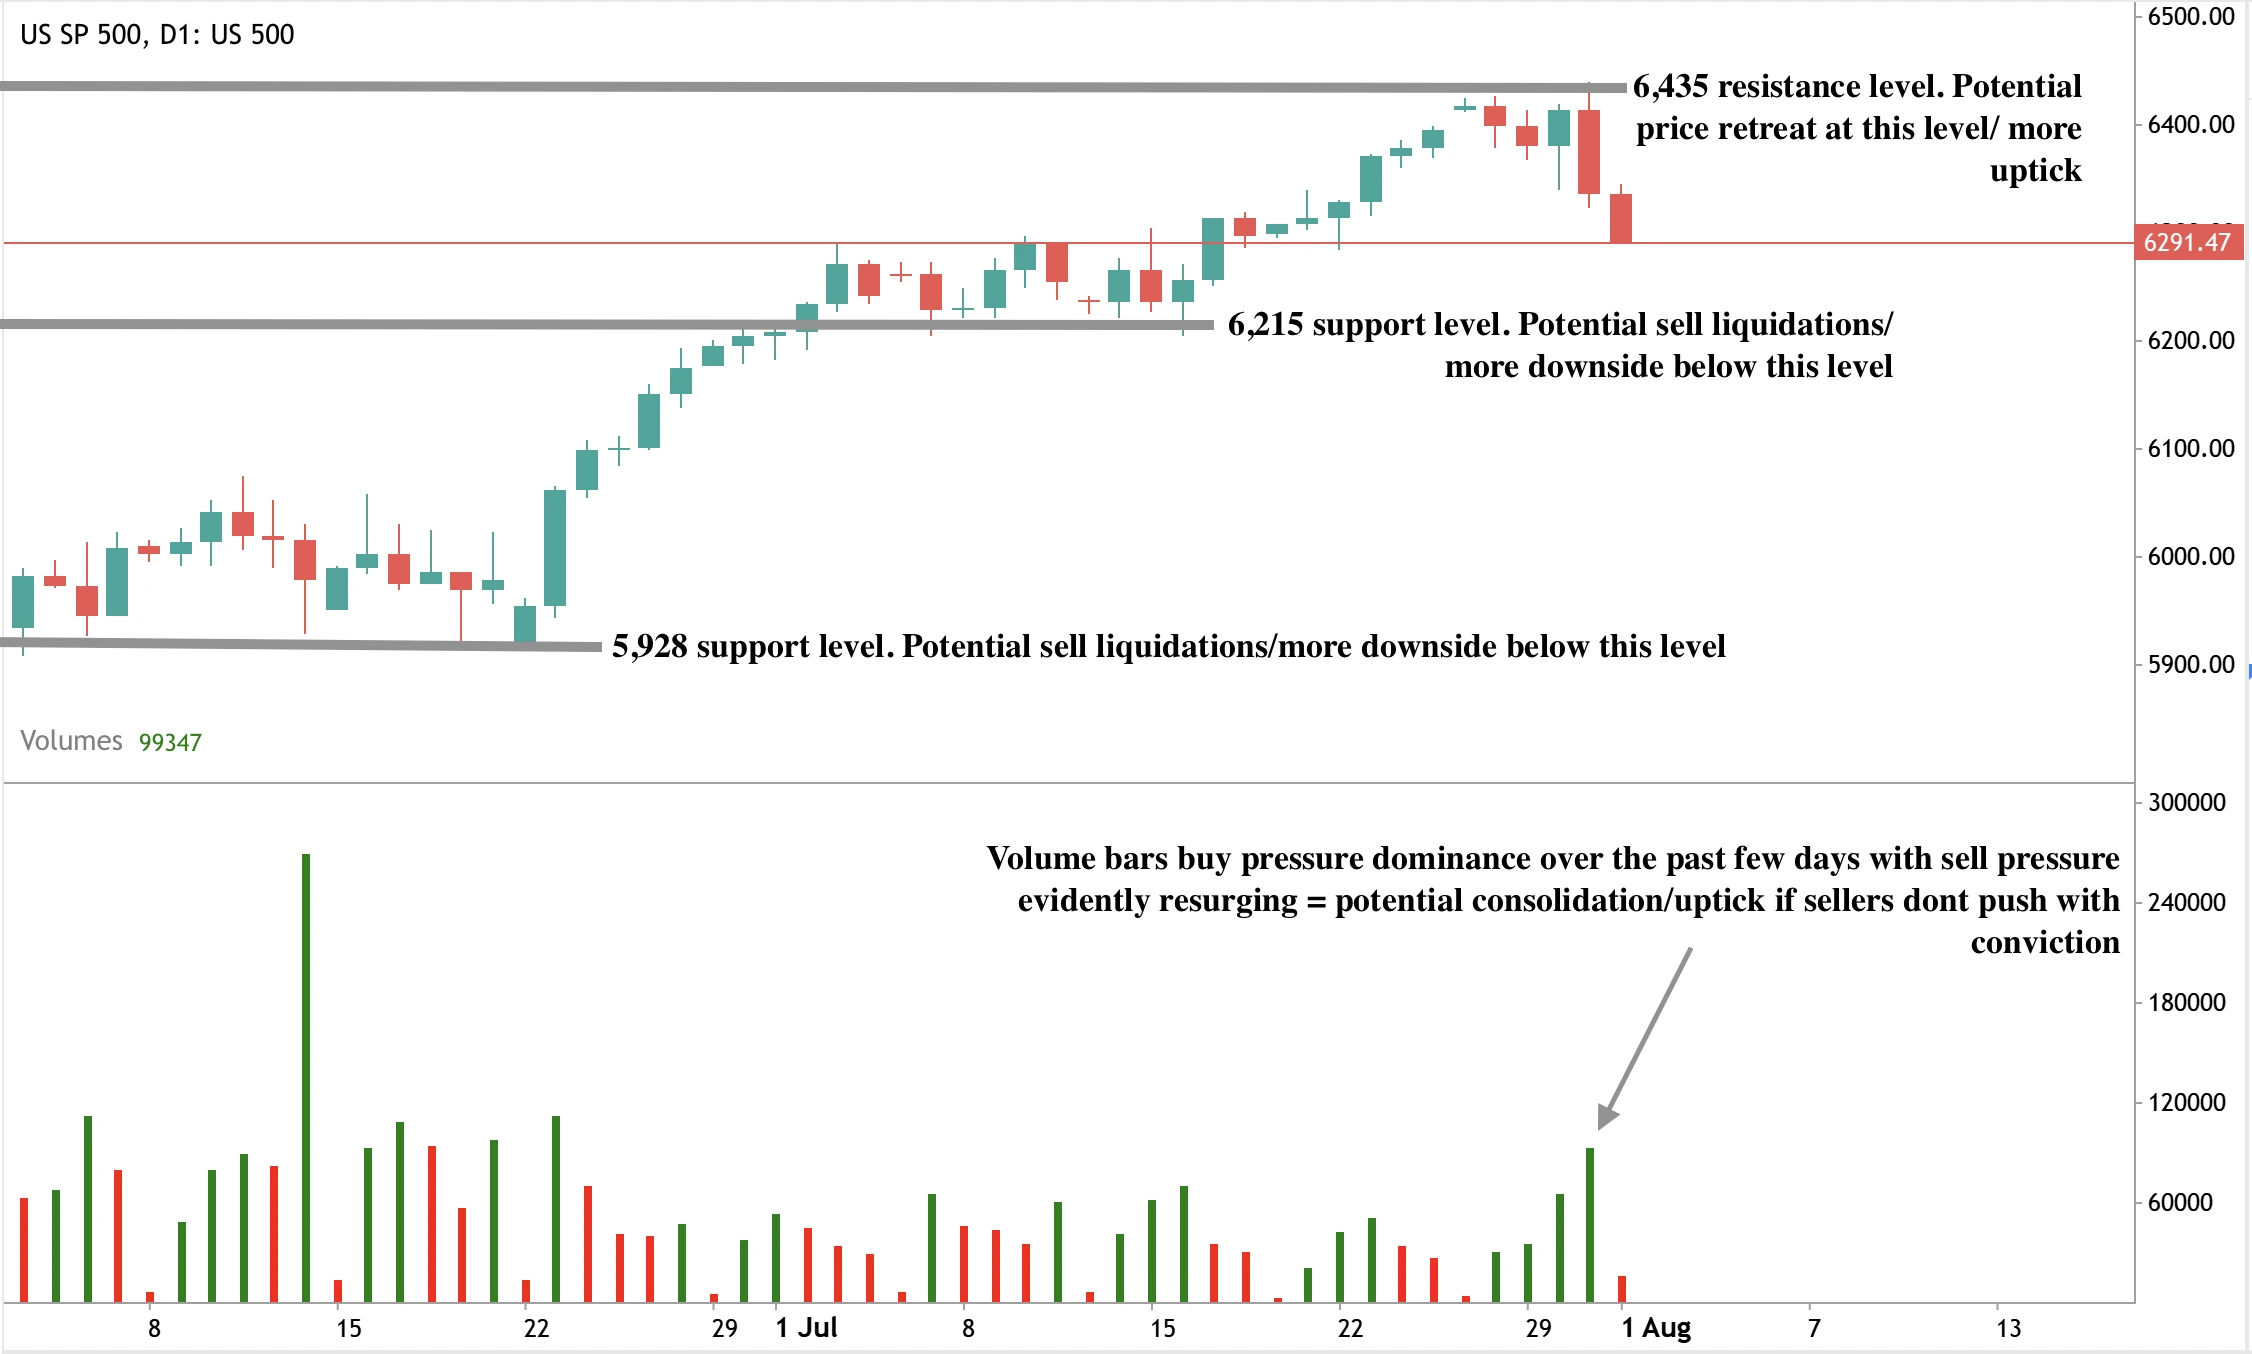
At the time of writing, the S&P 500 price has retreated considerably even as significant capital inflows pour in. Volume bars show dominant buy pressure, with sellers offering some resistance, albeit without much conviction - hinting at a potential price reversal if sellers don’t offer much resistance. If we see an uptick, bulls could challenge the $6,435 price level, where the price has been rebuffed before. Conversely, should we see more downside, prices could find resistance at the $6,215 and $5,928 support levels.
Is the S&P 500 set for a major comeback? You can speculate on US markets with a Deriv MT5 account.

Will this earnings cycle propel $AMZN stock past $250?
With Amazon earnings set to drop, the question is whether this quarter will be the catalyst that finally pushes Amazon past that $250 mark.
It’s been a wild ride for Amazon investors this year. From a shaky start that saw the stock tumble nearly 25%, to a confident rebound powered by AI buzz, Prime Day strength, and a surprise legislative tailwind - $AMZN is now back in the spotlight. With earnings set to drop after the bell, the question on everyone’s mind is whether this quarter will be the catalyst that finally pushes Amazon past that elusive $250 mark.
Wall Street’s feeling bullish. Analysts are hiking price targets, AWS is gaining fresh momentum, and a cool £12 billion in extra free cash flow is about to land in Amazon’s lap thanks to the recently passed “One Big Beautiful Bill.” But with macro headwinds still swirling and whispers of a cooling cloud market, the stakes are higher than ever.
So, is Amazon gearing up for another leg higher - or is the market getting ahead of itself? Let’s break it down.
Analyst buzz: Wall Street’s big call
If analyst sentiment were a game show buzzer, it’d be lighting up non-stop for Amazon. Every major bank with skin in the game is leaning bullish. Morgan Stanley is holding steady at a $300 target, calling Amazon the biggest winner from the “One Big Beautiful Bill.”

UBS has nudged theirs to $271, BMO to $270, and Wedbush has just crossed the magic threshold with a target of $250 flat.
Not one of the 26 analysts tracked by Visible Alpha has dared to hit “Sell.” The average target? A hair above $250. That’s not just optimism, according to analysts; that’s consensus conviction.
The big boost: £12 billion in Amazon's free cash flow
What’s fuelling all this excitement? Free cash flow - and loads of it. Thanks to the new legislation “One Big Beautiful Bill”, Amazon could pocket an extra $15 billion a year from 2025 to 2027, followed by $11 billion in 2028. In Sterling, we’re talking about a tidy £12 billion boost per annum. That’s capital with teeth.
Morgan Stanley reckons much of this cash will be pumped straight into Amazon Web Services (AWS), Amazon’s cloud giant. Think AI acceleration, warehouse automation, and possibly a more dominant edge in the cloud wars. The bank suggests even reinvesting just half of it could lead to billions in savings through next-gen automation.
AWS: The silent powerhouse
While Microsoft and Nvidia steal most of the AI spotlight, Amazon’s AWS is quietly becoming the engine room of the AI economy. AWS growth has picked up speed again, with analysts predicting stronger performance in the second half of the year.
And here’s where things get really interesting: BMO Capital believes “agentic capabilities” - a fancy way of saying intelligent AI decision-making - are still flying under the radar. They’ve even raised their AWS estimates, arguing these underappreciated tools could dramatically improve efficiency across Amazon’s cloud infrastructure.
Amazon Prime Day Performance
Retail’s not sitting in the back seat either. Amazon’s longest-ever Prime Day just wrapped - a four-day shopping marathon that broke records. Early signs suggest that gross merchandise value (GMV) during that period grew in the mid-teens compared to last year, with same-day delivery coverage expanding 17% year-on-year.
Even tariffs didn’t shake the cart. Prices held firm, shoppers kept spending, and Amazon came out looking stronger than ever on the consumer front.
From slump to swagger: A stock rebound story
As of mid-April, $AMZN was down 24% year-to-date. Fast-forward to today, and it’s sitting nearly 6% higher for the year. That’s a serious turnaround, and it didn’t happen by accident.

Behind the scenes, eight analysts have revised earnings per share estimates upward in the past month alone. The Street is now expecting Q2 revenue of $162.19 billion, with EPS climbing to $1.33 - up from $1.26 a year ago.
And if Amazon delivers, it won’t just meet expectations - it could rewrite the next chapter of the stock’s rally.
Risks still lurking
Now, before getting carried away. There are still clouds on the horizon (pun intended).
- Tariffs and geopolitical tensions remain a wild card - Amazon even closed its Shanghai AI lab recently, hinting at growing U.S.-China friction.
- Project Kuiper, Amazon’s satellite internet play, is expensive and still years away from profit.
- And then there’s the ever-present macro uncertainty, from inflation to foreign exchange headwinds.
But here’s the rub: even with these risks, analysts believe Amazon’s risk/reward balance still skews positively - especially if AWS keeps firing.
Technical outlook: Could it break $250?
With the earnings call just hours away, all eyes are on Amazon. If it posts a solid beat and signals confidence in AWS and AI-driven efficiencies, that $250 ceiling could finally shatter - and fast. But if guidance is soft, or if cloud growth cools, we could be in for a temporary stall.
Either way, Amazon’s comeback story is well underway - and this earnings cycle may just be the plot twist that propels it into its next big chapter.
At the time of writing, the stock is dipping on the daily chart with volume bars indicating an even tug-of-war between bulls and bears. If the past three days are anything to go by, we’ve seen dominant buy pressure - hinting at a potential price reversal and a move north. If an uptick materialises, we could see the stock’s price rise towards $235.00 and beyond.
On the other hand, if we see a further dip, prices could find support floors at the $226.00 and $219.75 support levels. A further collapse could see prices find support at the $207.35 price level.

Trade Amazon's next movements with a Deriv MT5 account today.
Sorry, we couldn’t find any results matching .
Search tips:
- Check your spelling and try again
- Try another keyword