结果

美国通胀数据和劳动力数据公布前的EUR/USD展望
随着市场等待延迟的美国通胀数据明朗,EUR/USD维持区间震荡。
随着市场等待延迟的美国通胀数据明朗,EUR/USD维持区间震荡。该货币对在1.156至1.166之间波动,交易者在消费者价格指数(CPI)数据揭示联邦储备是否将维持鸽派立场或暂停进一步宽松之前,持观望态度。
数据缺失降低了波动性,使欧元在美元走软的情况下保持稳定,市场权衡增长放缓、利率预期变化以及全球风险情绪改善。
主要要点
- EUR/USD在1.1642附近保持稳定,在1.156–1.166的狭窄区间内交易,交易者等待CPI数据。
- 政府停摆导致美国数据延迟,冻结了市场方向,削弱了美元动能。
- 政策分歧正在缩小,联储倾向于降息,而欧洲央行保持稳定。
- 欧元区稳定和情绪改善与美国不确定性形成对比,支持欧元韧性。
- 波动性压缩预示着通胀数据发布后可能出现突破。
美国通胀和劳动力数据延迟导致市场停滞
美国通胀和劳动力数据的延迟发布使市场失去方向。劳工统计局(BLS)仍在处理近期政府停摆造成的干扰,部分十月数据可能永远不会发布的可能性增加。
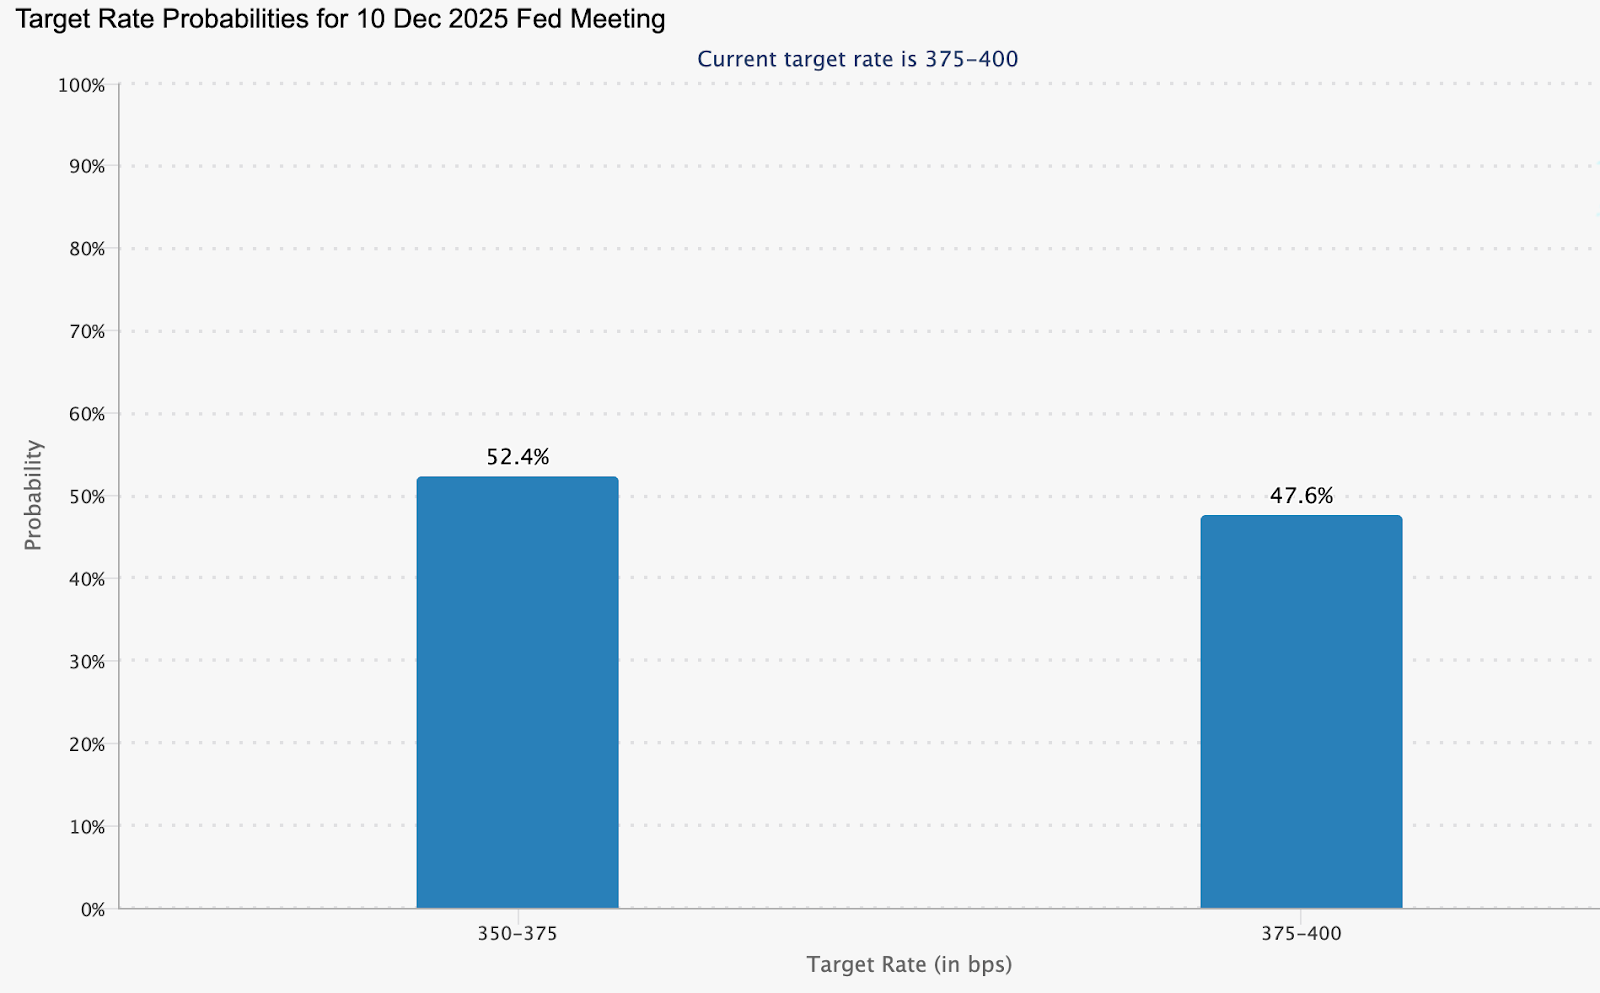
这种缺乏透明度使交易者和政策制定者陷入瘫痪。没有CPI或非农就业数据,联储的决策只能靠猜测。根据CME FedWatch工具,市场目前预计12月降息25个基点的概率为52.4%,但信心迅速减弱。
与此同时,风险偏好正在改善,欧洲股指保持稳定——这种组合通常会削弱美元。随着风险偏好情绪蔓延,欧元从改善的资本流动和对避险资产需求减少中获得被动支持。
随着ECB与Fed政策差距和增长分歧缩小,欧元走强
除了当前的数据黑洞,更广泛的基本面倾向于支持欧元。国际货币基金组织预测美国GDP增长将从2.8%放缓至2025年的2.0%,而欧元区增长率预计将从0.9%上升至1.2%。这一缩小的增长差距削弱了美元的传统优势之一。
货币政策也在趋同。欧洲央行(ECB)可能已结束宽松阶段,而Federal Reserve 随着美国经济动能放缓,似乎更接近降息。收益率差距的缩小对EUR/USD历来是利好。
同时,欧元区的稳定性正成为一种资产。能源风险减退,政治波动缓解,消费者信心出现微弱复苏迹象。结构性风险减少且货币政策稳定,欧元不再需要依赖乐观情绪上涨——只需保持稳定,而美元则在寻找方向。
CPI数据影响:市场最大盲点
通胀仍是关键点。如果美国CPI意外上升,市场可能重新定价联储暂停的预期,推动EUR/USD下跌。反之,较弱的数据显示鸽派前景,将增强欧元的优势。
目前,通胀数据的缺失本身已成为催化剂。没有新数据,交易者越来越依赖情绪和技术信号而非基本面。这压缩了波动性并降低了信心,但持续时间越长,最终突破可能越强烈。
EUR/USD投资启示:动能遇阻
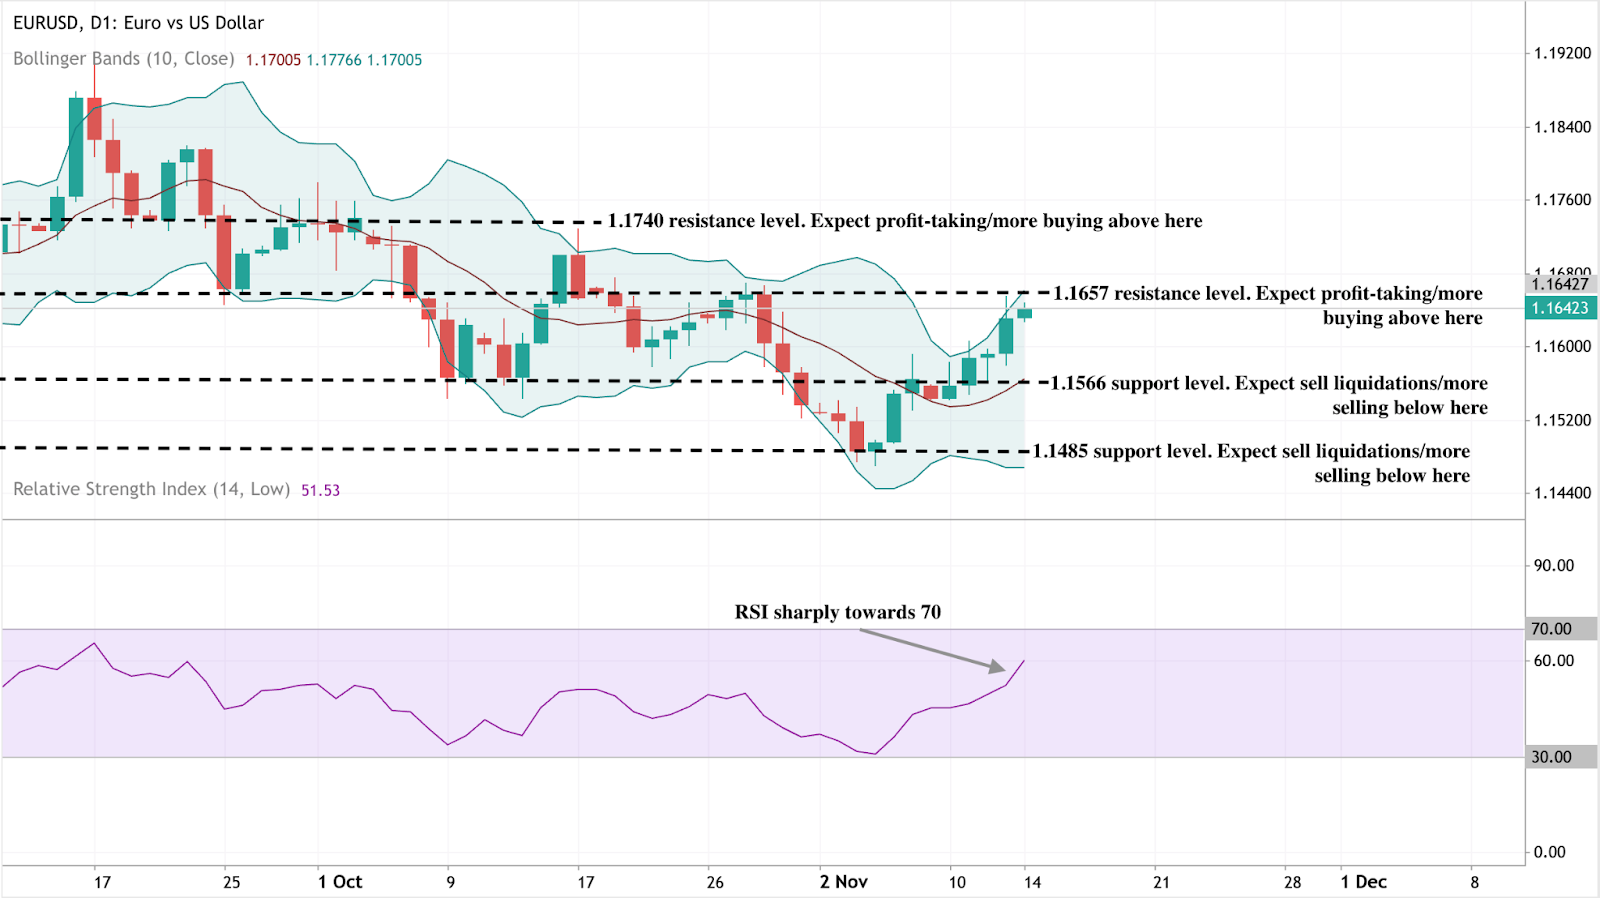
撰写本文时,EUR/USD在1.1642附近交易,动能偏多但面临关键阻力区。
布林带显示价格正逼近上轨,表明波动性加剧和买盘强劲。然而,随着汇价接近1.1657,交易者可能预期获利了结或短期盘整,然后才会有进一步上涨。
若能果断突破1.1740,将强化看涨情绪并吸引更多买盘。下方即时支撑位于1.1566,较深支撑在1.1485。跌破这些水平可能引发卖盘清算和新一轮下行压力。
同时,RSI接近70,显示该货币对接近超买区,暗示趋势恢复上涨前可能出现短期调整。
EUR/USD投资启示
对于交易者而言,这是一个以耐心而非激进为特征的市场。围绕1.156–1.166的区间交易仍然可行,但鉴于数据驱动突破的风险,紧密止损至关重要。
中期投资者应注意,欧元的基本稳定性、缩小的增长差距和降低的欧元区风险,若美元在2026年初继续走弱,可能支撑欧元逐步上涨至1.18–1.20。
随着波动性压缩,风险管理变得尤为重要。利用Deriv交易计算器,交易者可以在建仓前估算点值、保证金需求及潜在盈亏。这种精准有助于围绕关键水平(如1.156支撑或1.174阻力)管理风险——这是低波动市场中的重要优势。
随着EUR/USD徘徊于关键技术水平,交易者可在Deriv MT5上实时跟踪价格走势,并利用Deriv交易计算器规划数据驱动的入场点。CPI报告发布时,这两种工具将对识别突破动能和实时管理风险至关重要。

白银价格预测:为何此次金属涨势更具韧性
分析师称,白银过去五天的涨势并非虚假曙光,而是基于基本面的上涨,而非恐慌。
分析师称,白银过去五天的涨势并非虚假曙光,而是基于基本面的上涨,而非恐慌。与以往的投机性暴涨不同,此次上涨反映了货币宽松预期、供应紧张状况以及来自可再生能源和半导体制造的工业需求激增的汇聚。
随着美元承压,交易员预计12月将降息,白银近期的强势表明这是一个由基本面驱动的阶段开始,而非又一次短暂的乐观情绪爆发。
主要要点
- 白银价格接近54.40美元,延续自10月以来最强劲的涨势。
- 美联储降息概率升至68%,促使投资者转向无收益资产,如白银。
- 自2016年以来,矿产供应下降了7%,工业需求超过产量。
- 可再生能源和电动汽车需求现占白银总消费量的一半以上。
白银政策转变与数据疲软推动买盘
白银最新的涨势由利率预期的急剧转变引发。近期美国数据显示经济动力减弱——根据ADP数据,截至10月底,私营部门每周新增就业人数减少约11,000人。经济放缓增强了市场对美联储12月降息的信心,降息概率从62%升至68%,由CME FedWatch工具追踪。
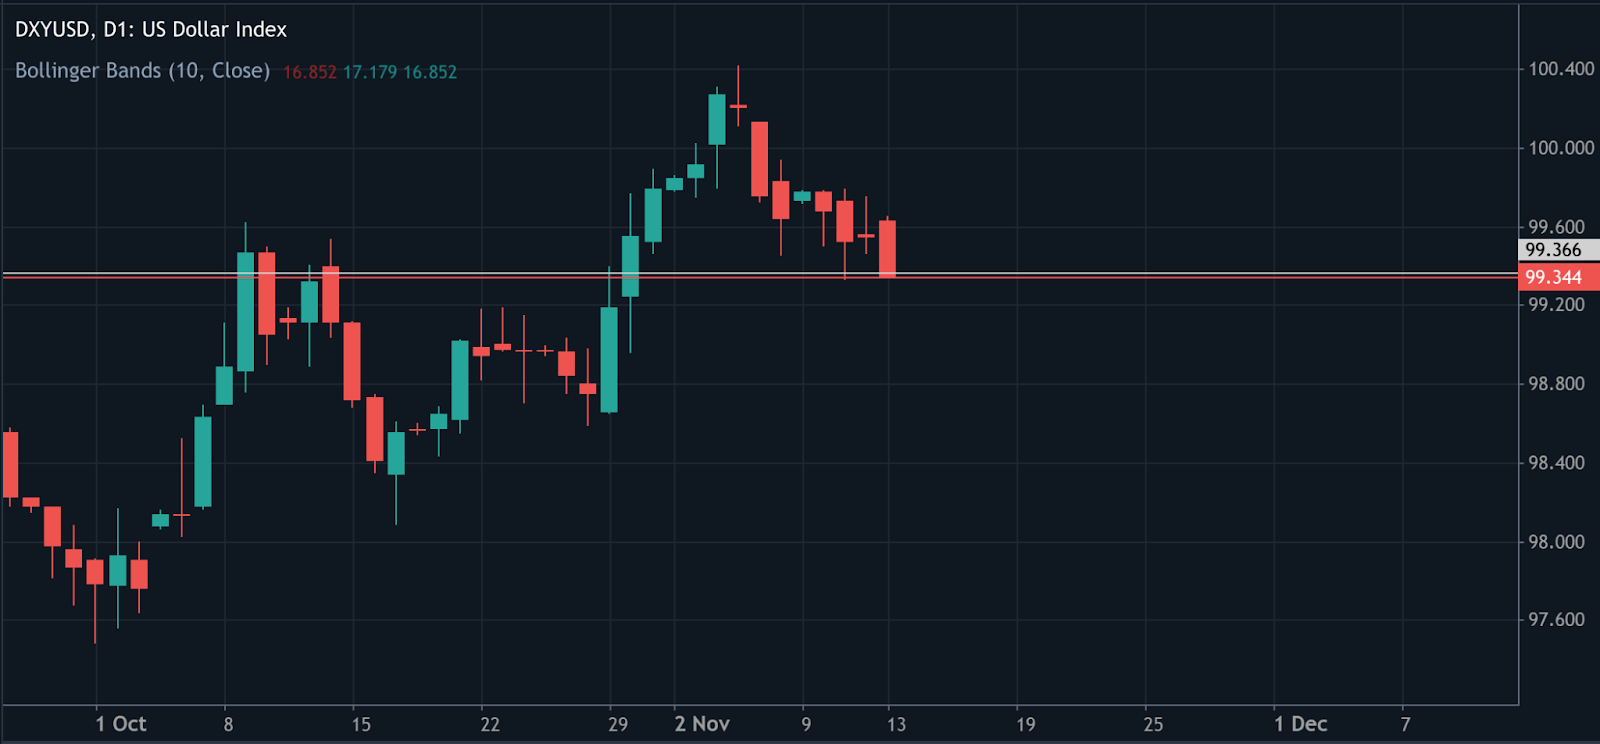
较低的利率通常会削弱美元,提升对无收益避险资产的需求。美元指数(DXY)已下滑至约99.60,随着投资者寻求低收益现金的替代品,黄金和白银的涨幅被放大。
通常,美国政府停摆的进展会抑制避险需求,但这次,政策预期超过了政治因素。市场反应的是一个更广泛的故事:增长放缓和美联储被迫宽松。
从恐慌到基本面:白银的供应赤字与需求故事
此次涨势标志着与以往由投机交易驱动的阶段的不同。根据Sprott资产管理公司的说法,白银的强势现已基于结构性供应赤字和工业扩张,而非炒作。自2016年以来,矿产总产量下降了7%,而来自可再生能源、电动汽车(EV)和电子产品的需求稳步上升。
白银工业需求持续超过供应增长
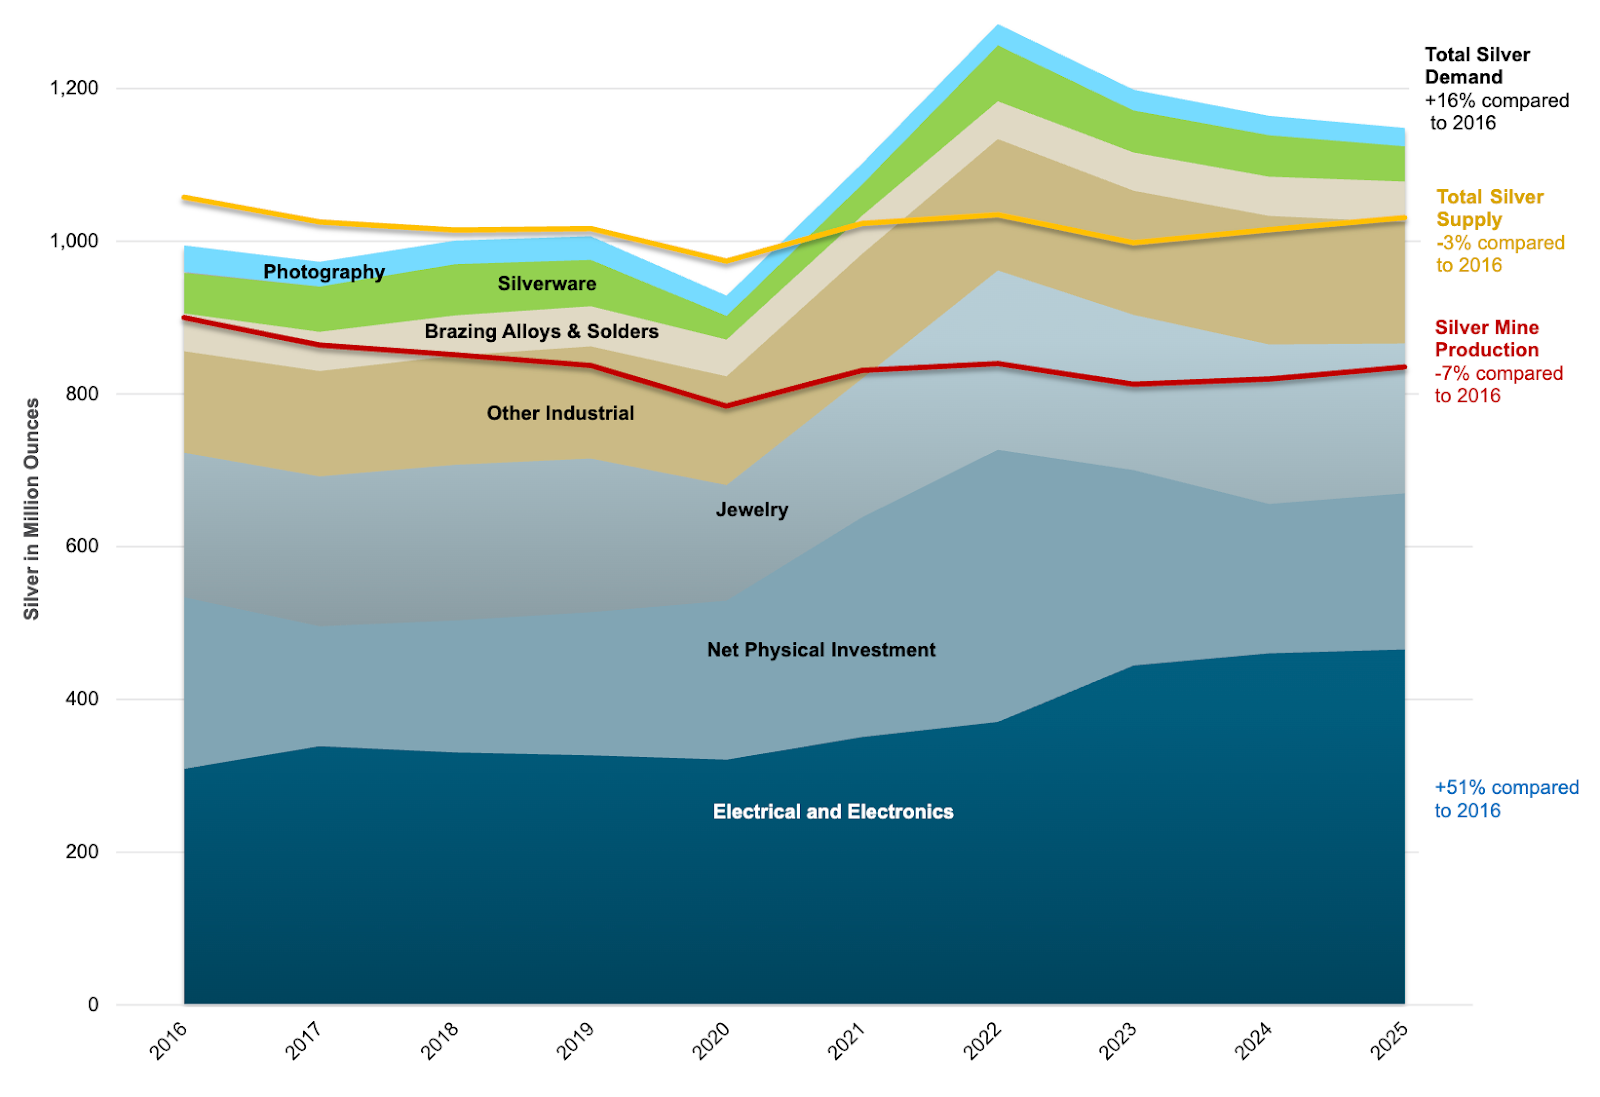
白银总需求中超过一半来自工业应用——主要是太阳能电池板制造、半导体和电动汽车零部件。然而,供应未能跟上步伐。回收量仅有适度增长,新矿投资仍然有限,市场日益紧张。
正如一位分析师所言,“这是多年来首次由工厂需求而非恐慌驱动的白银涨势。”
如果您计划入场交易,Deriv交易计算器可帮助您估算保证金、隔夜利息和潜在利润,适用于Deriv平台,如Deriv MT5。
宏观背景:美元疲软与鸽派政策
更广泛的环境强化了白银的强势。美元走弱、收益率下降和经济指标疲软的组合为贵金属创造了理想的环境。密歇根大学消费者信心指数降至2022年以来最低水平,零售活动放缓,表明美联储的紧缩周期已接近尾声。
美国消费者信心


黄金也推动了该板块的动能,10月曾短暂突破每盎司4,300美元。白银传统上波动更大,受益于投资者为预期的长期货币宽松而在金属间分散投资的溢出效应。
与此同时,铜供应紧缩进一步支持了整个金属板块进入供应主导的重新估值阶段的观点。铜中出现的结构性短缺现象如今也在白银中显现,强调了一个共同的叙事:关键大宗商品的需求增长超过产量。
工业力量:白银周期的新驱动力
白银兼具避险金属和工业金属的双重角色,使其在大宗商品中独树一帜。
黄金主要依赖投资者和央行需求,而白银则受益于其在清洁能源和技术供应链中的作用。预计2025年太阳能装机量将创纪录,而电动汽车的普及持续加速。
分析师估计,可再生能源和电子产品的需求将在未来至少两年内增长速度超过矿产产量,预计2025年价格上涨34%,2026年上涨8%。由于持续的供应赤字,即使是适度的消费增长也会引发价格的过度反应。
白银技术面洞察
撰写本文时,白银(XAG/USD)正测试54.30美元阻力位,这是一个关键区域,强劲的多头涨势后获利了结可能增加。相对强弱指数(RSI)徘徊在69附近,接近超买区,显示买盘动能可能耗尽,短期内可能出现盘整或回调。
布林带显示价格紧贴上轨,表明强劲的多头压力,但也存在短期过度延伸的风险。若能果断突破54.30美元,可能吸引更多买盘,目标指向新高。
然而,若未能突破该水平,可能触发回撤至47.00美元支撑位,届时买盘可能重新出现。若跌破此位,下一个关键支撑位为41.28美元,标志着早期积累的更深支撑区。

白银的风险与潜在反转
尽管前景强劲,但仍存在一些风险:
- 若美国数据强劲,美元反弹可能暂时限制涨幅。
- 工业复苏放缓或可再生能源推广减少可能削弱需求增长。
- 短期获利了结可能引发50–52美元区间的波动。
然而,这些更可能是暂时的调整,而非趋势反转。供应紧张和坚实的工业基本面为市场提供了坚实的支撑。
白银展望:由实质支撑的涨势
白银的上涨更多源于结构性变化,而非投机。随着货币政策转向宽松,工业需求加速,市场正从反应性交易转向长期重新估值。
分析师预计2025年白银价格将保持在每盎司50美元以上,若降息实现且工业活动稳定,可能重测10月54美元高点。宏观经济宽松、绿色能源扩张和供应赤字的结合,为此次涨势提供了十多年来最可信的基础。
简而言之,恐慌可能点燃了涨势,但现在是基本面在驱动它。

人工智能、电动汽车和能源需求增长会让铜成为下一个石油吗?
铜在全球经济中的角色正从工业投入品转变为支撑能源和技术转型的战略资源。
是的——数据越来越支持这一观点。铜在全球经济中的角色正从工业投入品转变为支撑能源和技术转型的战略资源。伦敦金属交易所(LME)铜价接近每吨11,000美元,自2025年1月以来上涨约27%,因人工智能数据中心、电动汽车(EV)和可再生能源基础设施的需求激增。
随着全球供应难以跟上步伐,分析师认为铜很快可能成为现代增长中与20世纪石油同等重要的资源——为从高压电网到数字时代的人工智能服务器提供动力。
主要要点
- 铜价维持在接近历史高位,受到人工智能数据中心、电动汽车和可再生能源项目需求的支撑。
- 智利和秘鲁的供应中断,加上矿石品位下降和项目延迟,正在收紧全球产量。
- 养老基金和主权财富基金等机构资金流入,使铜成为战略投资资产。
- 摩根大通预计铜价将在2026年初达到每吨12,000美元,摩根士丹利预测供应缺口将持续扩大至2029年。
- 贸易政策不确定性和谨慎的联储可能带来短期波动,但结构性基本面依然极为看涨。
铜供应短缺遇上需求激增
与以往商品繁荣不同,铜价上涨并非投机产物,而是对深层结构性失衡的反应。全球产量持续受限,约有6%的供应因南美的劳工罢工、天气干扰和基础设施瓶颈而停产。
智利和秘鲁合计约占全球铜产量的40%,正面临严峻的运营压力。受损的物流网络、延迟的维护计划和有限的运输能力限制了矿石运输,而老化的冶炼厂产能不足。
地质条件也加剧了问题。新的铜矿床矿石品位较低——通常铜含量为0.3%至0.8%,而早期几十年为2%至5%。这意味着矿工必须处理更多矿石以获得相同的金属产量,从而增加了成本和环境影响。
与此同时,矿山开发周期延长至7至18年,限制了新供应对需求增长的响应速度。摩根士丹利预测2026年全球铜缺口为59万吨,预计到2029年将扩大至110万吨——为二十多年来最大缺口。

铜需求革命:人工智能、电动汽车与清洁能源
未来十年的铜需求将不再来自建筑或传统制造业,而是来自推动全球能源和数据转型的技术。
人工智能数据中心已成为铜需求的重要新来源。根据美国能源部和劳伦斯伯克利国家实验室的研究,数据中心到2028年可能消耗美国总电力的6.7%至12%,而2023年为4.4%。每个新设施都需要大量铜用于电缆、变压器和电力分配。
电动汽车(EV)是另一个关键增长驱动力。每辆电动汽车含铜约40至50公斤,约为汽油车的四倍。随着电动汽车产量在全球范围内扩大,铜在汽车制造中的作用迅速增长。
与此同时,可再生能源领域,尤其是风能和太阳能,持续吸纳前所未有的铜用量。单个2至3兆瓦的海上风力涡轮机在发电机线圈、布线和控制系统中使用5至7吨铜。电网现代化和电池储能投资进一步增加了铜的需求强度。
这些力量共同推动了许多分析师所称的“千载难逢的需求转型”,使铜成为电气化、数字化和脱碳之间的关键纽带。
铜的势头:从工业金属到战略资产
铜不再仅仅是工业金属——它现在也是金融和战略资产。伦敦金属交易所仍是全球定价的主要基准,但2025年铜期货和ETF的交易量激增。
包括养老基金和主权财富基金在内的机构投资者增加了对铜的配置,作为对全球能源转型的对冲。这种机构需求加剧了现有的供应压力,形成价格上涨吸引更多资本流入的反馈循环。
商品策略师指出,这一周期正变得自我强化:“只要缺口存在,投资者就会持续买入短缺的铜,”一位分析师观察道。
在Deriv MT5上,交易者可以通过先进的图表和技术指标直接监控铜价(XCU/USD)走势——获得专业交易环境中使用的机构级分析工具。
铜关税、政策与联储谨慎态度
尽管基本面强劲,铜的短期表现仍受贸易和货币政策影响。
今年早些时候,特朗普政府对精炼铜的关税政策变动导致芝加哥商品交易所(CME)和伦敦金属交易所(LME)基准价出现波动。关税最初提出时,美国铜价因进口商抢购供应而飙升。精炼铜获豁免后,价格回调——但这一差距凸显了政治风险对金属市场的影响。
2026年的关税审查仍是关键风险事件,若豁免取消,交易者预计将出现更多市场错位。BCA Research的Roukaya Ibrahim等分析师认为,“精炼铜关税的悬而未决将继续影响市场”,使美国价格保持溢价。
与此同时,联邦储备对降息的谨慎态度暂时减缓了商品的投机性资金流入。但对长期投资者而言,铜供应的结构性紧张压倒了短期政策噪音。
铜投资展望:迈向12,000美元及更高
摩根大通预测铜价可能在2026年初达到每吨12,000美元,较当前水平上涨11%。其看涨观点基于:
- 对可再生能源、电动汽车和人工智能基础设施的投资不断扩大。
- 主要生产商短期内供应响应有限。
- 漫长的矿山开发周期延缓新产出。
- 机构对商品敞口的持续需求。
同样,摩根士丹利预计市场将进入22年来最严重的缺口,高盛则称铜是“工业金属领域最具吸引力的长期机会”。
如果这些预测成真,铜价即使在短期宏观经济放缓的情况下,也可能维持在每吨10,000美元以上的新价格底部。
铜技术分析
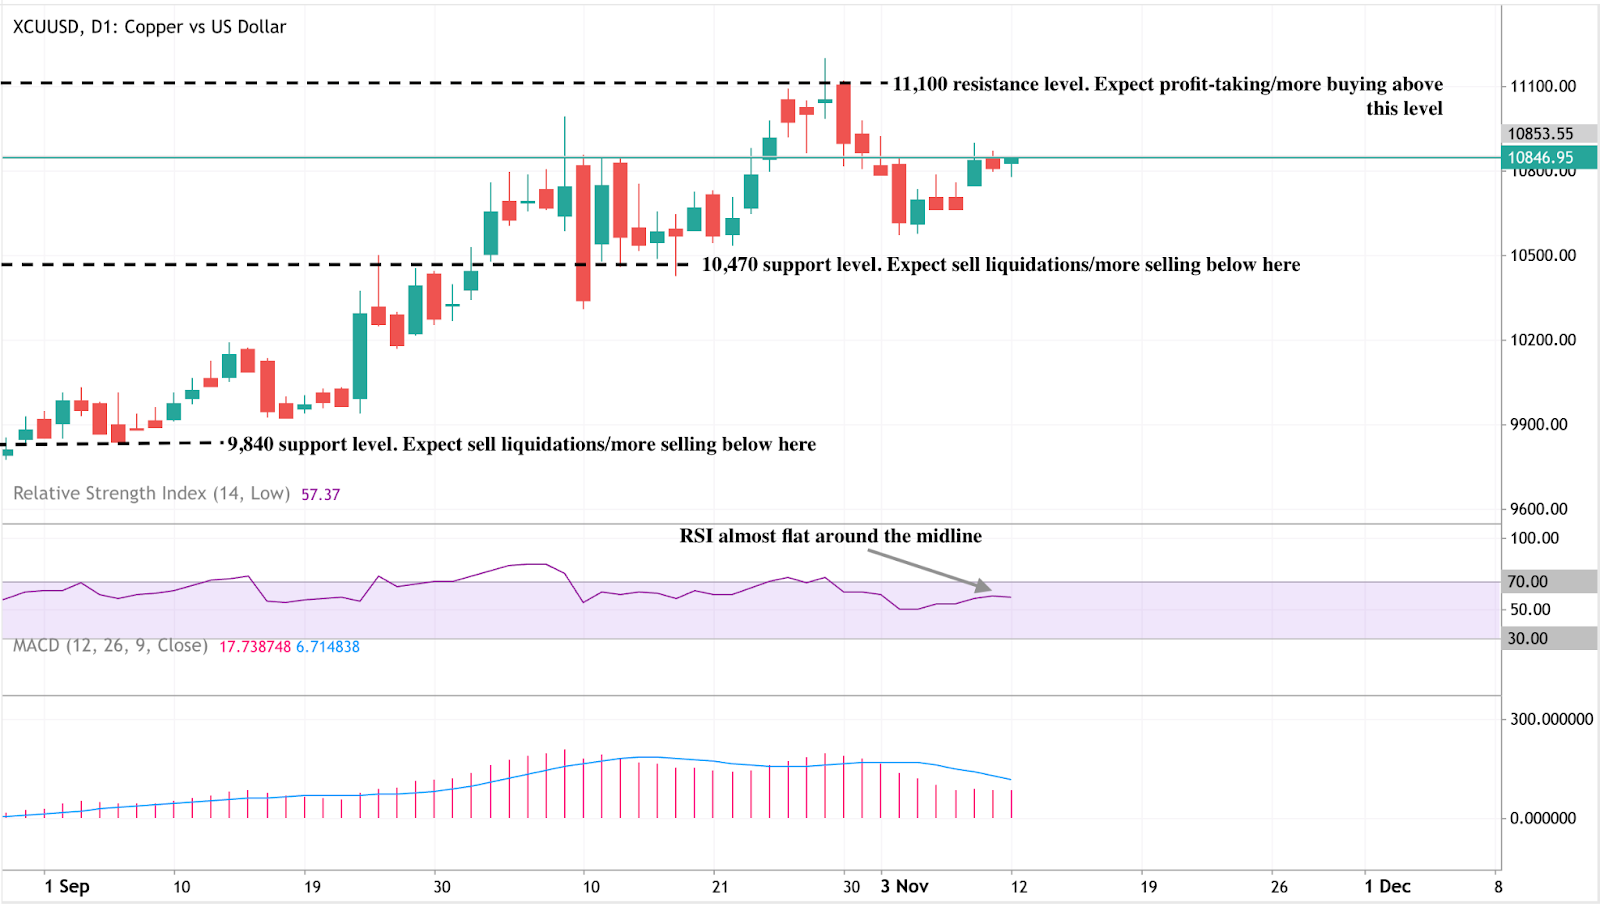
撰写本文时,铜(XCU/USD)价格接近10,850美元,在关键支撑区10,470美元和阻力位11,100美元之间盘整。突破11,100美元可能触发新一轮看涨动能,而跌破10,470美元则可能引发新的抛售压力。下一个较低支撑位约为9,840美元,若市场情绪转向避险,可能出现进一步清算。
相对强弱指数(RSI)徘徊在57附近,几乎持平于中线,显示中性偏向——既不明显超买也不超卖。这表明市场处于观望状态,动能缺乏明确方向。
同时,MACD线略高于信号线,但动能减弱,反映看涨势头减弱。如果MACD下穿信号线,可能确认短期看跌情绪。
交易者可使用Deriv交易计算器估算交易铜及其他金属时的保证金需求和盈利潜力。欲深入了解商品交易策略,可浏览Deriv详尽的商品交易指南,适合新手及高级交易者。
铜的短期波动与长期信心
尽管长期趋势看涨,短期仍存在阻力。中国房地产行业放缓继续影响工业金属情绪,而更紧的金融环境可能延缓投机资金流入。
然而,分析师普遍认为任何价格回调都是短暂的,长期基本面依然支持价格。基金将9,000至9,500美元区间的回调视为买入机会,为2026年下一轮上涨做准备。
分析:是什么推动了黄金价格和美国股市的同步上涨?
黄金价格和美国股市的同步上涨有些不同寻常,因为传统上,黄金被视为“避险”资产。
黄金价格和美国股市的同步上涨有些不同寻常,因为传统上,黄金被视为一种“避险”资产,通常在经济不确定时期表现良好,而股票则更多与经济增长和风险偏好相关。分析师指出,有多个因素同时推动这两个市场上涨。
根据CME的FedWatch工具,交易员认为12月降息25个基点的概率为63%。这一单一叙事——更便宜的资金——推动了通常走势相反的资产上涨:黄金,经典的避险资产,以及股票,传统的风险资产。
两个市场都在依赖政策驱动的乐观情绪,而非经济实力。疲软的就业数据、低迷的消费者信心和财政压力迹象促使交易员预期货币政策将更温和,推动了一场流动性反弹,模糊了安全与投机的界限。
主要要点
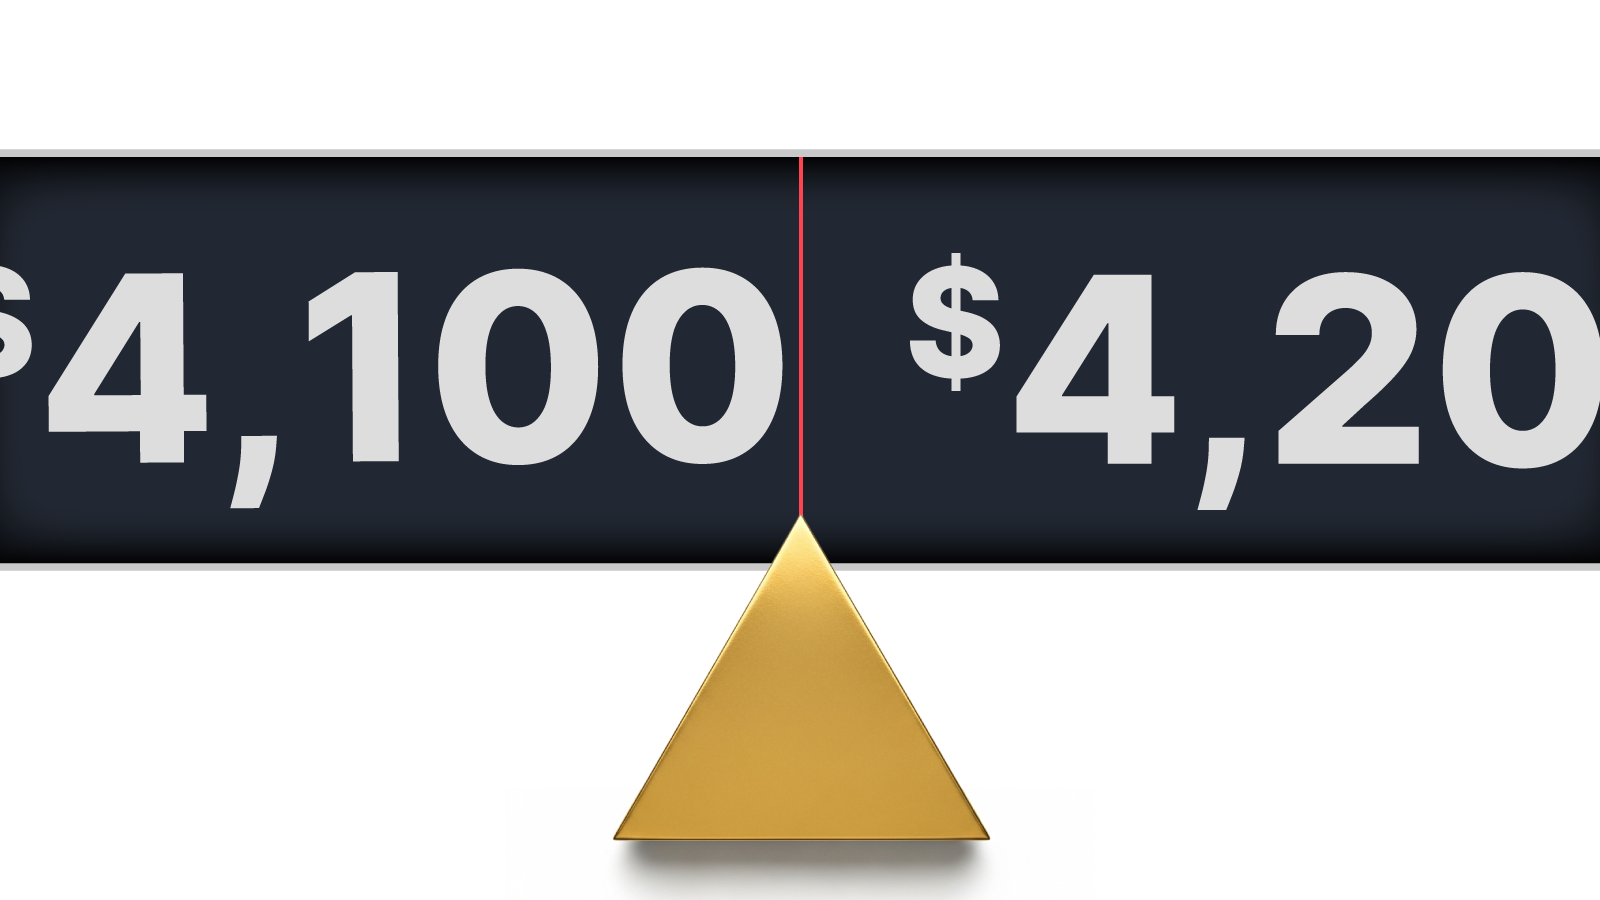
- 黄金维持在每盎司4100美元以上,达到两周来的最高水平,交易员预期美联储将放松政策。
- 美国股市也在上涨,因较低的利率预期提升了未来盈利估值。
- 这波反弹反映的是流动性信心,而非增长——市场由央行驱动,而非基本面。
- 财政焦虑和美国国债收益率上升为黄金提供了第二层支撑。
- 印度和各国央行的强劲实物需求支撑了价格,超越了投机浪潮。
美联储降息预期推动黄金和美国股市
这次联合反弹源于明显的宏观转变。近期美国经济数据表明动能减弱——10月私人就业疲软,政府和零售岗位减少,消费者信心降至数月低点。市场将此解读为美联储将在12月转向降息的确认信号。
较低的利率同时影响市场两端:
- 对股票而言,降低了借贷成本,提高了企业盈利的现值。
- 对黄金而言,降低了持有无收益资产的机会成本。
结果是同步的上涨。投资者不再在安全与风险之间选择;他们同时买入两者,统一的预期是——宽松货币政策的回归。
对于使用Deriv MT5的交易员来说,这种跨资产动态创造了新的多元化机会,因为指数、大宗商品和金属的波动都响应同一政策脉动。
美国财政政策重新成为隐性驱动力
美国政府停摆及其暂时解决方案使财政稳定性成为焦点。参议院两党妥协重启政府——获得特朗普总统支持——缓解了短期市场压力,但提醒投资者美国的长期债务问题。
正如Saxo Bank的Ole Hansen所指出,“由财政焦虑而非经济实力推动的收益率上升,历来对投资金属有支持作用。”在此背景下,较高的债券收益率反映的是对债务可持续性的担忧,而非经济更强——强化了持有黄金作为财政不确定性对冲的理由。
政府机构的重新开放也将恢复官方经济数据的获取,为市场提供更大清晰度。然而,鉴于这些数据可能确认经济活动放缓,交易员认为这为美联储采取行动提供了更多理由。
黄金与股票:市场罕见的双重上涨
黄金和股票传统上走势相反。一个代表恐惧,另一个代表信心。然而,2025年的市场表现表明,两者现在都是流动性预期的体现。
当投资者预期货币宽松时,所有受益于廉价资金的资产都会上涨——从黄金到成长型科技股。这种相关性变化凸显了市场运作的结构性变化:政策预期已取代基本面成为主要价格驱动因素。
即使美元走强,黄金仍能上涨,进一步强化了这一转变。货币动态正被央行政策在全球资产定价中的主导地位所取代。
黄金需求为反弹增添深度
除了投机叙事,黄金上涨有强劲的现实支撑。实物需求依然强劲,尤其是在印度和各国央行:
- 2025年前10个月,印度黄金ETF流入达到29亿美元——相当于26吨黄金,几乎与2020至2024年总和持平。
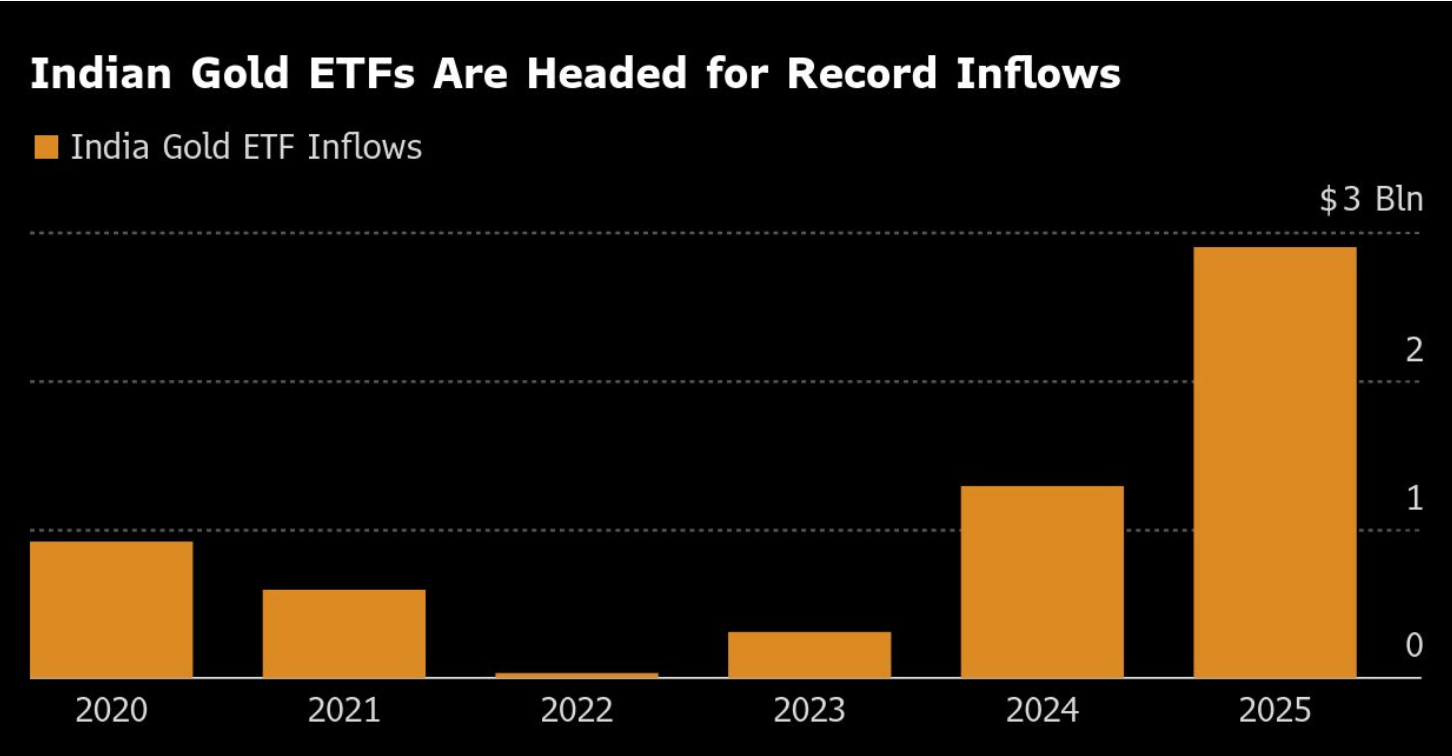
- 仅10月就有8.5亿美元新流入,继9月创纪录的9.42亿美元之后。
- 印度ETF总持有量现为83.5吨,价值超过110亿美元。
这一需求表明反弹并非纯粹投机,而是反映了全球对黄金作为长期价值储存手段的真实需求——对货币和财政不确定性的平衡。
黄金矿业公司反映投资者信心
黄金市场的企业端也反映了这一情绪。全球最大生产商之一Barrick Gold (ABX.TO)在报告调整后利润超预期后,将季度股息提高了25%,并扩大了5亿美元的股票回购计划。
- 平均实现黄金价格:每盎司3457美元,高于一年前的2494美元。
- 产量从943,000盎司降至829,000盎司,而全包维持成本略升至每盎司1538美元。
尽管面临运营挑战及因失去马里矿山而计提的10亿美元减值,Barrick向北美生产的战略转型显示出对黄金价格持续高位的信心。
然而,马里争端——包括员工被拘留和出口限制——凸显了全球黄金供应的地缘政治脆弱性,若未解决,可能进一步收紧市场。
市场背景:债务、收益率与政策悖论
今年黄金上涨超过50%,不仅仅是通胀担忧的反映。它是对财政脆弱性和市场对流动性依赖的回应。
国债收益率上升更多是对债务可持续性的警告,而非经济健康的信号。投资者购买黄金以对冲这些结构性风险,同时基于流动性将持续流入的假设推高股市。
这种同时寻求安全与风险的双重行为,是2025年市场心理的定义性悖论。
未来数月黄金与美国股市的情景
- 看涨突破
如果美联储12月降息并暗示进一步宽松,黄金可能迅速突破4200美元,受财政担忧和央行稳定需求支撑。
- 短期盘整
美联储采取谨慎或延迟立场,黄金可能在4050至4150美元间徘徊,股市则可能维持涨势,直到流动性预期减弱。
无论如何,关键结论是黄金和股票现在响应的是同一宏观经济驱动力——资金价格,而非对立的情绪力量。
黄金技术面洞察
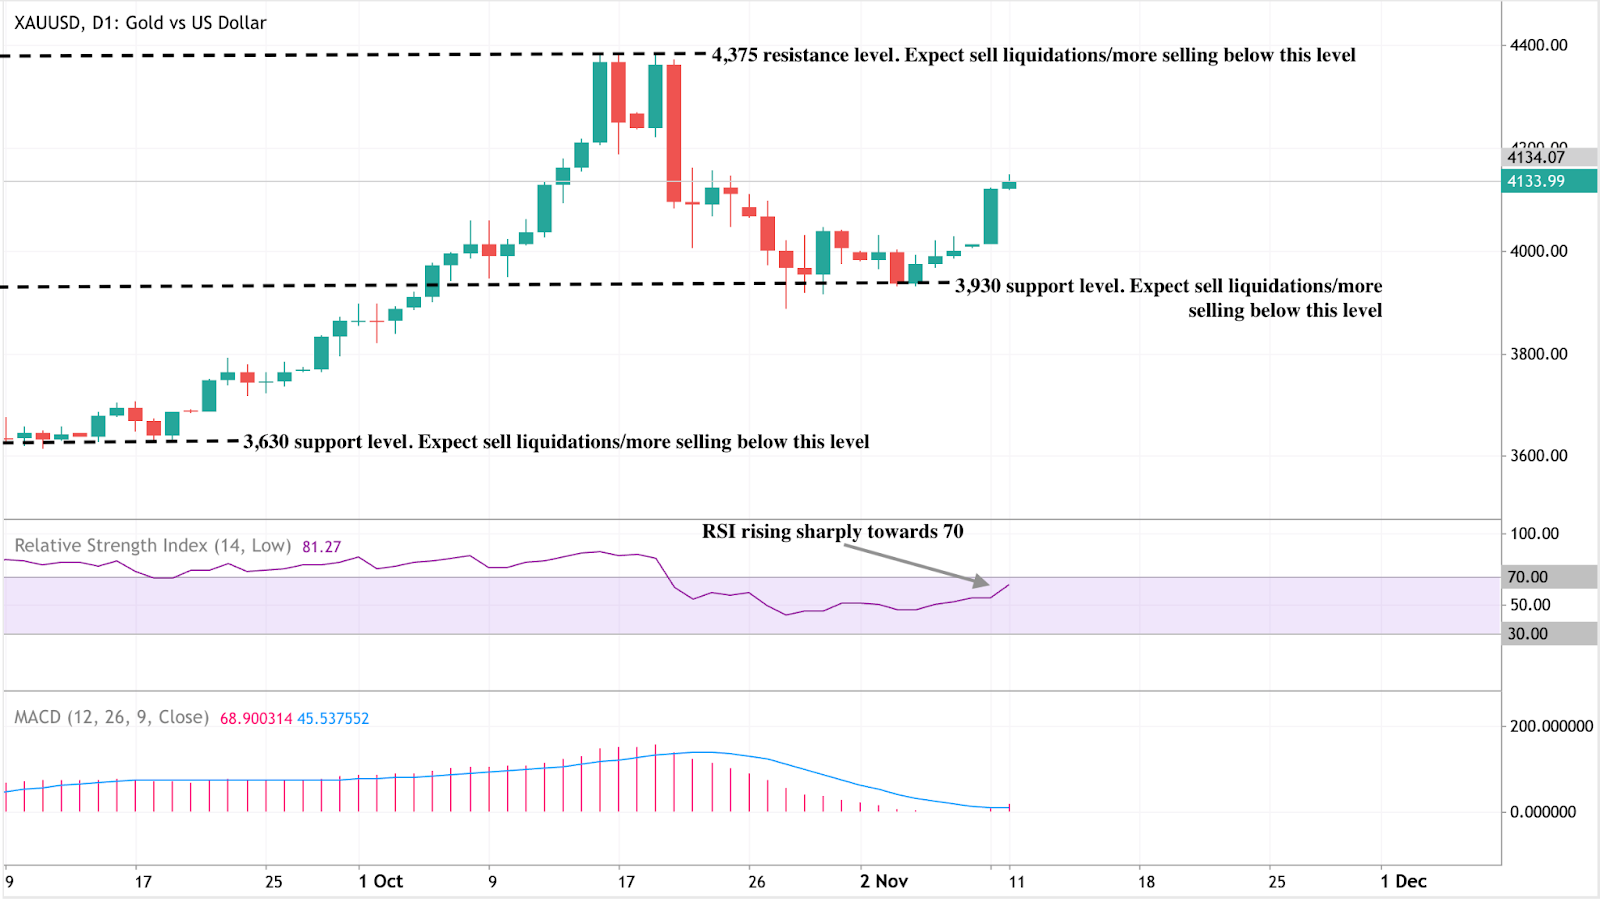
黄金(XAU/USD)交易于4134美元左右,在关键水平间盘整——阻力位在4375美元,支撑位在3930美元。突破4375美元可能延续反弹,而跌破3930美元则可能引发新一轮抛售,目标3630美元。
RSI(81)显示强劲的看涨动能,但也提示超买,暗示可能出现短期盘整或回调。同时,MACD保持看涨交叉,确认持续买盘压力。
总体来看,黄金在3930美元以上偏多,但交易员应关注超买区附近动能的降温。您可以直接在Deriv MT5上监控这些水平,或使用Deriv交易计算器尝试保证金和风险设置,规划金属和指数的仓位。
黄金投资展望
- 短期交易者:在美联储12月决议前,4100至4200美元区间是关键关注范围。
- 中期投资者:财政压力、实际收益率波动和印度需求构成持续走强的核心驱动力。
投资组合经理:黄金与股票的相关性演变意味着它现在表现为一个对政策敏感的平行资产,而非纯粹的对冲工具。多元化策略应考虑这一结构性变化。

Can a tariff dividend create a new liquidity cycle for Bitcoin in 2025?
Analysts suggest that President Donald Trump’s proposed $2,000 “tariff dividend” has fuelled a wave of market optimism rather than a genuine injection of liquidity.
Yes - but only in sentiment, not in substance. Analysts suggest that President Donald Trump’s proposed $2,000 “tariff dividend” has fuelled a wave of market optimism rather than a genuine injection of liquidity.
The announcement triggered a short-lived crypto rebound, lifting Bitcoin back above $104,000, as traders drew parallels with the 2020 pandemic payments that helped fuel the last major bull run. Yet with limited fiscal backing and political obstacles, many believe this rally may be driven more by sentiment than by substance.
Key takeaways
- Trump’s $2,000 “tariff dividend” prompted a brief rally in Bitcoin and Ethereum, despite serious doubts over its feasibility.
- Funding gap: The proposed payout would cost around $300 billion, but tariff revenues generate only about $90 billion net.
- Institutional demand remains strong, with $2.7 billion in ETF inflows and BlackRock’s IBIT managing close to $100 billion in BTC.
- The Federal Reserve’s 25-basis-point rate cut and improved risk appetite continue to support Bitcoin above the $100K mark.
- Analysts see two paths: A climb towards $120K–$125K if optimism holds, or a slide below $100K once political enthusiasm fades.
- Crypto’s sensitivity to liquidity narratives underscores how sentiment - not policy - often leads market direction.
Trump’s tariff dividend promise and the market reaction
In a Truth Social post, President Trump claimed that the United States was generating “trillions of dollars” from tariffs and could use those funds to both reduce its $38 trillion national debt and finance a “dividend” for most Americans, excluding high earners.
The statement triggered a modest crypto rally as traders priced in the possibility of more household liquidity.
Markets quickly drew comparisons to the pandemic-era stimulus cheques that helped spark a historic bull market. Traders, long conditioned to respond to any hint of fresh money supply, reacted instinctively - even though the policy remains more political talking point than fiscal plan.
Why the maths don’t add up
Despite the excitement, the numbers simply do not work. Fiscal experts note that Trump cannot unilaterally authorise such payments; they require Congressional approval and a new funding bill.
The funding shortfall is also substantial:
- A $2,000 payment for 150 million adults would cost around $300 billion.
- Tariff collections to date total $120 billion, and after factoring in slower economic growth and lower tax receipts, net revenue sits closer to $90 billion.
As Erica York, Vice President of Federal Tax Policy, explained: “Each dollar raised through tariffs offsets about 24 cents in income and payroll tax revenue.” In short, the government lacks both the legal authority and the financial headroom to execute this plan, making any near-term payout highly unlikely.
Stimulus Déjà Vu: Why markets still care
The crypto rally reflects not fiscal reality but liquidity psychology. Even without concrete policy action, the mere suggestion of a “dividend” rekindles traders’ belief in free-flowing money and renewed risk-taking.
This mirrors 2020, when stimulus payments coincided with a surge in Bitcoin and altcoins as retail investors redirected government cheques into digital assets.

Although the scale is smaller this time, the pattern remains: crypto markets respond instantly to liquidity cues - whether real or imagined.
Bitcoin ETF inflows and structural strength
Beyond political headlines, Bitcoin’s structural outlook remains solid. Institutional inflows into U.S. spot Bitcoin ETFs exceeded $2.7 billion in early November, led by BlackRock’s IBIT and Fidelity’s FBTC. IBIT alone now holds $80.47 billion, cementing its position as the fastest-growing ETF in U.S. history.
Macroeconomic conditions are also supportive:
- The Federal Reserve’s 25-basis-point rate cut has lifted risk appetite.
- Trump’s pardon of Binance founder Changpeng Zhao signalled a more conciliatory stance towards crypto.
- Thailand and Malaysia are exploring the inclusion of Bitcoin in national reserves, marking a step towards mainstream adoption.
These developments indicate that even if Trump’s “dividend” proves politically untenable, the underlying liquidity narrative remains alive.
Market impact and price scenarios
If bullish sentiment and ETF inflows persist, Bitcoin could extend towards $120,000, driven by institutional accumulation and looser policy. However, should enthusiasm fade, a pullback below $100,000 remains a possibility as traders reassess the fundamentals.
So far, Bitcoin’s stability above $100,000 reflects confidence from institutional investors - although analysts warn that the rally is driven more by belief than by financial logic.
Bitcoin technical insights
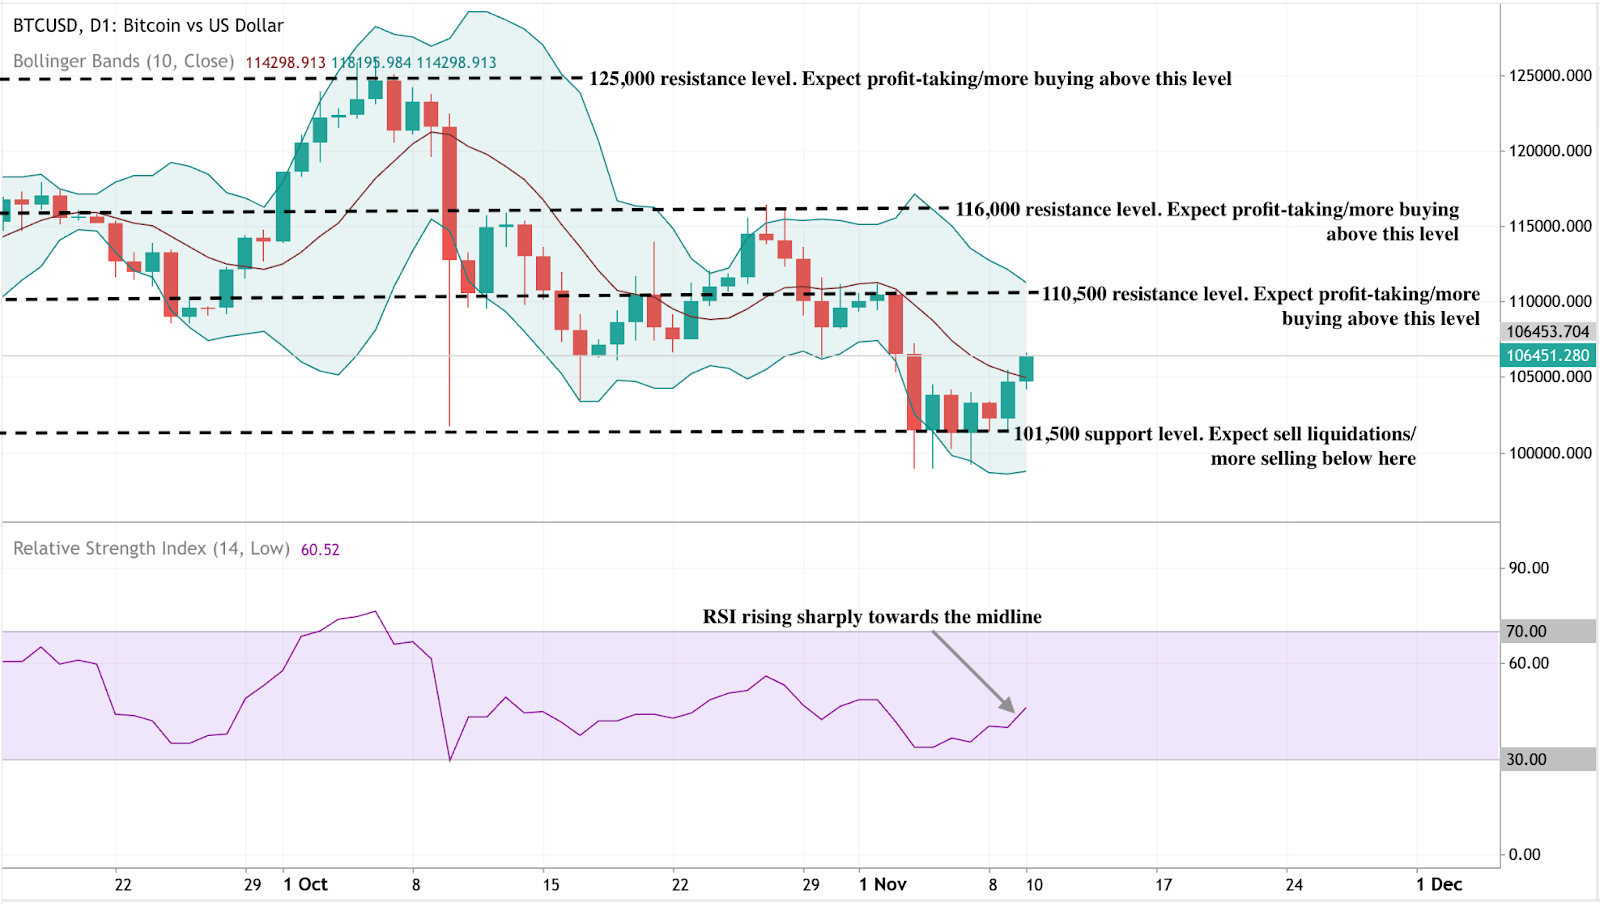
Bitcoin’s price action shows early signs of recovery after holding above the key $101,500 support level, where sellers appear to have exhausted their momentum. This level remains crucial - a decisive break below could trigger further liquidations. On the upside, $110,500 serves as the first major resistance, followed by $116,000 and $125,000, where profit-taking is likely to intensify.
The Bollinger Bands are beginning to narrow after a period of strong volatility, suggesting potential consolidation before the next breakout. The price is also attempting to climb back toward the middle band (the 10-day moving average), signalling an improving short-term outlook.
Meanwhile, the RSI (14) has risen sharply to around 60, pointing to strengthening bullish momentum without yet entering overbought territory. If RSI continues upward past 60–70, it would confirm a shift in market sentiment toward renewed buying pressure.
Investment implications
For traders, sentiment remains the main short-term driver. Bitcoin’s $100K level represents the critical dividing line between bullish conviction and renewed caution.
Those trading crypto through Deriv MT5 can access advanced charting tools and cross-market analysis, making it easier to track correlations between Bitcoin, gold, and the U.S. dollar - especially during policy-driven volatility.
Meanwhile, traders can use the Deriv Trading Calculator to estimate potential profits, required margin, and swap rates before entering a position, ensuring tighter risk control in fast-moving conditions.
- Short term: Tactical buying opportunities exist above $102K–$104K if ETF inflows remain robust.
- Medium-term: Expect volatility tied to political announcements and monetary policy signals.
Long-term: Institutional accumulation and steady global adoption continue to underpin a structurally bullish outlook, even if near-term hype cools.

Is Filecoin’s price surge the start of a broader crypto market recovery?
According to experts, Filecoin’s 50% surge could mark the early stages of a broader recovery across the cryptocurrency market, driven by renewed interest in utility-based blockchain assets.
According to experts, Filecoin’s 50% surge could mark the early stages of a broader recovery across the cryptocurrency market, driven by renewed interest in utility-based blockchain assets. The decentralised storage token’s sharp rebound above the $2 level has placed it at the forefront of the DePIN (Decentralised Physical Infrastructure Network) rally - a niche sector that has gained roughly 11% overall in recent days.
Analysts point to rising network activity, strong developer funding, and growing institutional focus on real-world blockchain utilities as reasons why Filecoin’s latest move may represent more than just a speculative bounce. Still, whether the rally extends further will depend on broader market sentiment and sustained adoption within the decentralised storage ecosystem.
Key takeaways
- Filecoin leads crypto recovery: Up over 50% in 24 hours, Filecoin is outperforming most major tokens and driving gains in the DePIN sector.
- DePIN sector strength: Decentralised infrastructure projects have collectively gained 11%, signalling investor interest in tokens with tangible use cases.
- Ecosystem investment expanding: Protocol Labs has launched RetroPGF Round 3, allocating 585,000 FIL to support developer projects from November 2024 to September 2025.
- Market capitalisation: Filecoin’s valuation now stands at $1.52 billion, ranking it among the top 50 public blockchains.
- A short-term focus on maintaining momentum above $2 could pave the way for a move to $3, a key technical resistance level.
- Long-term outlook: Experts see Filecoin as a leading project in the growing Web3 infrastructure and decentralised storage economy.
Filecoin rally leads the market’s structural recovery
Filecoin’s performance is part of a broader market trend where investors are shifting capital towards utility-based projects - tokens that provide real-world functionality. Within this trend, DePIN networks stand out. These projects bridge physical resources such as computing power, energy, and data storage with blockchain incentive mechanisms, creating measurable productivity within decentralised systems.
The DePIN sector’s 11% rise reflects a shift in sentiment from speculative trading towards functional blockchain services. Filecoin’s 50% rally to above $2.00 has cemented its status as the flagship token for decentralised storage and one of the strongest indicators that the market is rediscovering value in blockchain infrastructure.

Filecoin vs traditional cloud storage
Launched in October 2020 by Protocol Labs, Filecoin provides a peer-to-peer marketplace for data storage. It enables users to rent out unused hard drive space, earning FIL tokens in exchange. Unlike traditional storage services such as Google Drive, iCloud, or Dropbox, Filecoin’s system operates without a central authority - meaning that pricing, availability, and access are determined entirely by the network.
The system relies on two unique consensus mechanisms:
- Proof-of-Replication (PoRep): Verifies that storage providers hold exact copies of the data they claim to store.
- Proof-of-Spacetime (PoSt): Confirms that the data remains stored for the entire agreed period.
Together, these mechanisms make Filecoin’s network verifiable, secure, and tamper-resistant, addressing long-standing challenges in data storage trust and transparency.
Decentralised storage: From research to real-world impact
Filecoin’s origins date back to 2014, when Protocol Labs developed the InterPlanetary File System (IPFS) - a decentralised file-sharing protocol designed to replace centralised web servers. Filecoin was later introduced as the economic layer of IPFS, incentivising users to store and maintain data using blockchain rewards.
In August 2017, Filecoin completed one of the largest token offerings in crypto history, raising $257 million in its Initial Coin Offering (ICO). Major investors, including Sequoia Capital, Union Square Ventures, and Digital Currency Group, backed the project.
By the time its mainnet launched in October 2020, Filecoin had become one of the most anticipated blockchain networks globally. Its price soared to an all-time high of $236.97 in 2021 before correcting sharply alongside the broader market downturn. Despite that decline, the network has continued to expand and maintain strong developer interest, positioning it as one of the most credible decentralised storage solutions in the Web3 space.
Filecoin’s ecosystem expansion reinforces fundamentals
While price volatility has dominated headlines, Filecoin’s ecosystem growth has been quietly strengthening. Protocol Labs recently launched RetroPGF Round 3, allocating 585,000 FIL to projects that contributed to the ecosystem between late 2024 and 2025.
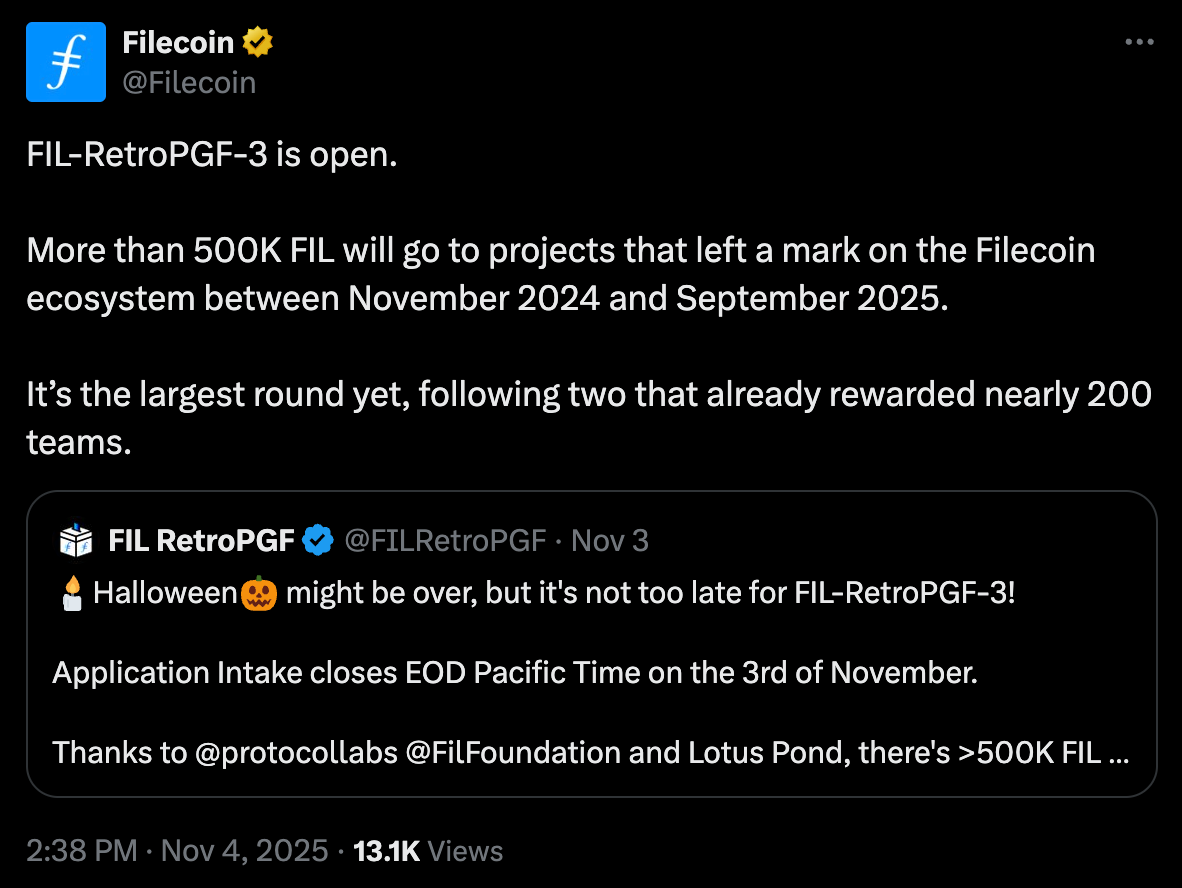
This round follows two earlier programmes that rewarded nearly 200 development teams, supporting innovations in decentralised computing, data retrieval, and dApp integration. The funding initiative underscores Filecoin’s commitment to sustainable growth - a key differentiator in a market often driven by short-term speculation.
Such ecosystem support not only encourages innovation but also signals confidence to institutional investors who are increasingly assessing Web3 infrastructure projects as long-term opportunities.
Market outlook: Can Filecoin sustain momentum?
Breaking past the $2 psychological level marks a pivotal moment for Filecoin. The next major resistance sits near $3, a level last tested in mid-2023. Technical analysts suggest that continued momentum could propel prices toward this mark if trading volumes remain high and the DePIN rally sustains.
However, Filecoin still trades far below its 2021 highs, underscoring both its potential for recovery and its vulnerability to market sentiment. Short-term corrections are possible as traders take profits, but experts say the latest surge is supported by more robust fundamentals than previous speculative rallies.
With a market cap of $1.52 billion and growing integration across decentralised applications, Filecoin is viewed as a key player in Web3’s evolving infrastructure layer. Its combination of utility, decentralisation, and developer support could allow it to benefit from the next major rotation into functional crypto assets.
Filecoin technical analysis
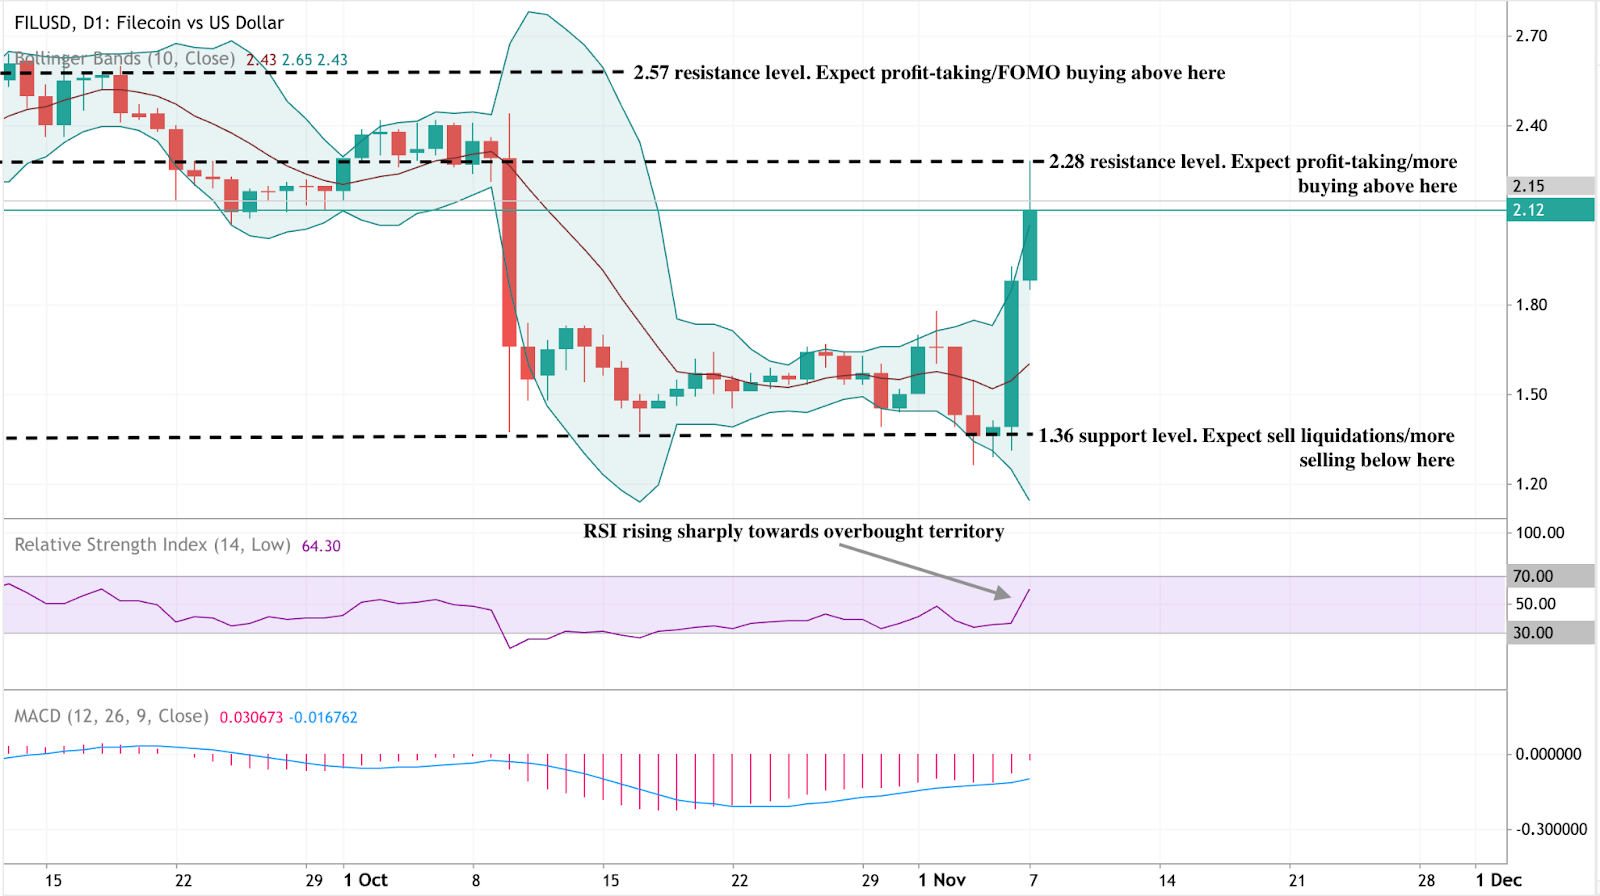
At the time of writing, Filecoin (FIL/USD) is trading around $2.12, extending its rally after rebounding from the $1.36 support level. The Bollinger Bands have expanded, reflecting heightened volatility, with price now testing the upper band - often a sign of short-term exhaustion. The RSI, at 64.3, is rising sharply toward the overbought zone, suggesting momentum remains strong but could soon face a cooling period.
Meanwhile, the MACD has turned positive with a fresh bullish crossover, reinforcing the current uptrend. However, traders should monitor momentum closely as the histogram begins to flatten. The next key resistance levels sit at $2.28 and $2.57, where profit-taking or renewed buying may occur. On the downside, $1.36 remains the critical support level - a break below it could trigger another wave of selling.
To explore and analyse these setups in real-time, traders can track Filecoin price action directly on Deriv MT5, which provides advanced charting tools, indicators, and multi-asset trading access for crypto, forex, and commodities markets.
Filecoin’s short-term outlook is bullish but nearing overbought territory, hinting at a potential cooldown if resistance levels hold.
Filecoin investment implications
For traders, Filecoin’s recent breakout offers short-term momentum opportunities above the $2 level, with upside potential towards $3 if DePIN sector strength continues. Caution remains warranted given crypto market volatility, but the technical setup favours buyers as long as Filecoin holds its newly reclaimed support zone.
For long-term investors, Filecoin stands out as one of the few blockchain networks with clear real-world use cases. Its robust developer base, institutional backing, and role in the decentralised data economy make it an appealing bet on the future of Web3 infrastructure.
Competition from centralised cloud giants and other blockchain storage protocols could cap growth if adoption plateaus. Filecoin’s success will depend on scaling efficiently, maintaining ecosystem incentives, and integrating more deeply into decentralised application frameworks.
Before entering Filecoin positions, traders can use the Deriv trading calculator to estimate potential profit and loss based on position size, leverage, and price movement - an essential tool for managing risk in volatile crypto markets.
Trading Filecoin on Deriv
- Momentum trading: Traders can use RSI and MACD crossovers on Deriv MT5 to capture short bursts of volatility during rallies above key breakout levels.
- Range trading: When Filecoin consolidates between $1.80–$2.50, short-term traders may use Bollinger Band reversals to enter positions at range extremes.
- Breakout strategy: A sustained move above $2.57 could signal a new bullish leg toward $3.00 - traders can confirm signals using MT5’s volume indicators and EMA crossovers.

How Solana’s real-world integrations are redefining crypto in 2025
From institutional ETFs to payment infrastructure and decentralised finance (DeFi) applications, Solana is reshaping what it means for a blockchain to operate at scale in 2025.
Solana’s expanding real-world integrations - ranging from institutional ETFs to payment infrastructure and decentralised finance (DeFi) applications - are redefining what it means for a blockchain to operate at scale in 2025. The network’s steady ETF inflows, validator reforms, and partnership activity show that Solana’s growth story is no longer simply about price volatility; it is about building financial and operational depth across both on-chain and institutional layers.
Key takeaways
- Institutional inflows remain steady: Solana ETFs have recorded six consecutive days of positive inflows, signalling confidence from long-term investors.
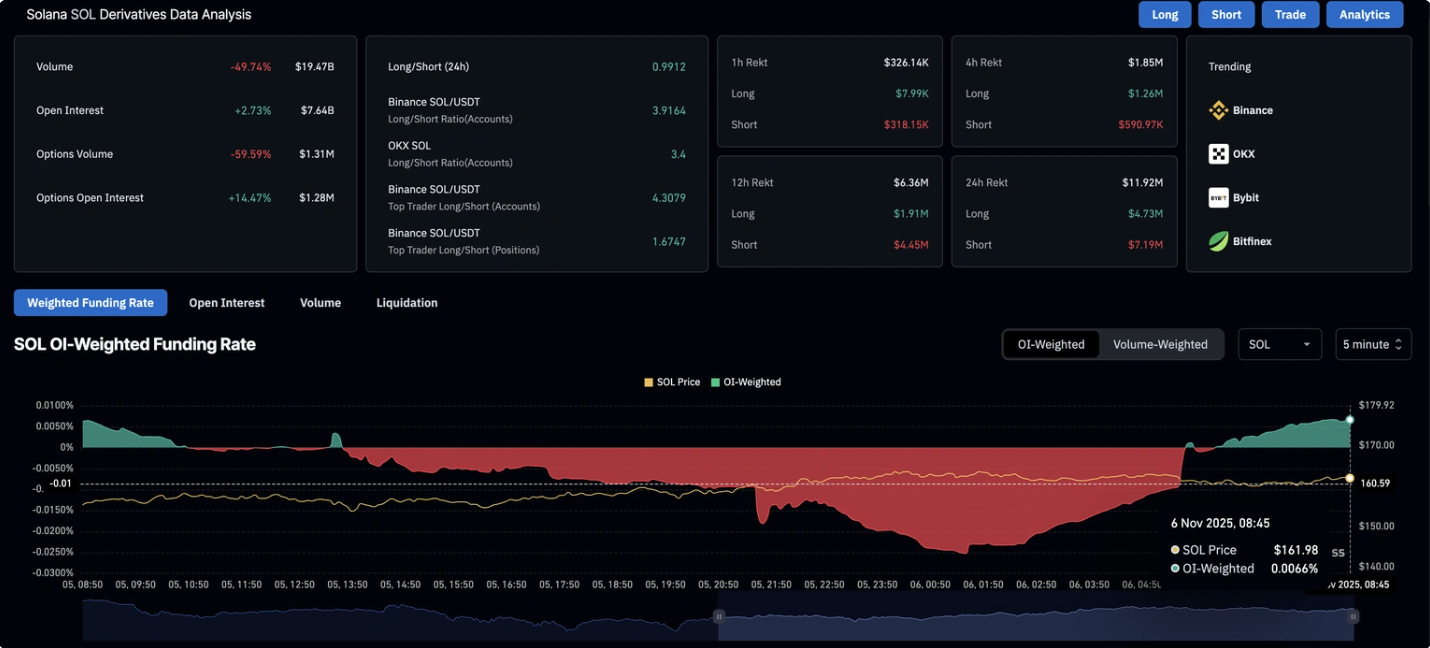
- Retail activity returns: Futures open interest has climbed to $7.64 billion, up 2.73% in 24 hours, while funding rates have turned positive - a sign of renewed retail optimism.
- Real-world integration grows: Solana is under evaluation for Western Union’s blockchain-based remittance pilot, positioning it for mainstream financial use.
- Network efficiency improves: Validator count has fallen 64% since early 2023, yet performance has strengthened as outdated operators were removed.
- Liquidity risks persist: Despite Solana total value locked (TVL) rising to $10.2 billion, stablecoin liquidity has declined 8.16% in a week - a warning for on-chain demand.
Solana institutional investment anchors Solana’s 2025 momentum
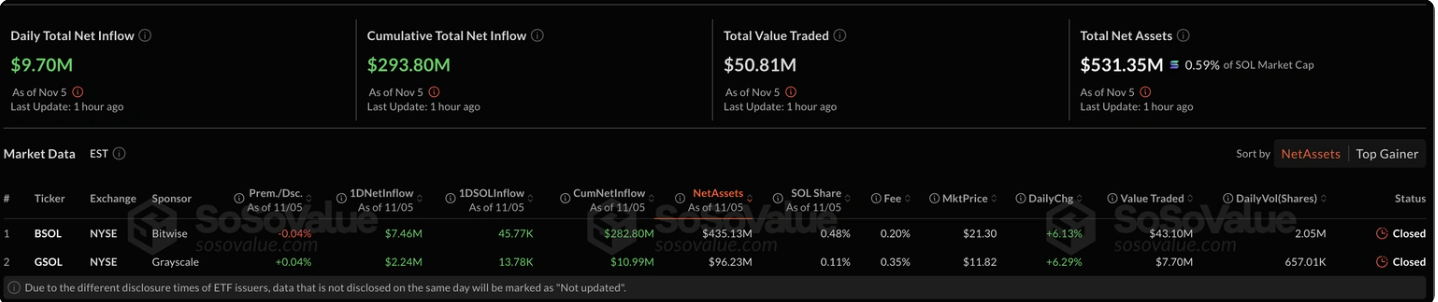
Institutional interest has become the foundation of Solana’s resilience this year. The Bitwise Solana Staking ETF (BSOL) drew $417 million in its debut week - outpacing even Bitcoin and Ethereum products - while the Grayscale Solana Trust (GSOL) attracted more than $1 million on its first day.
This consistent flow marks Solana’s shift from speculative trade to structured investment vehicle. For the sixth consecutive day, Solana ETFs have reported net inflows totalling $9.7 million mid-week, as professional investors position for long-term exposure despite macroeconomic uncertainty.
The rise of ETFs also introduces new liquidity and transparency. Each inflow represents a vote of confidence in Solana’s sustainability, particularly significant in a market shaped by cautious institutional allocators following the turbulence of 2022–23.
Solana retail traders re-engage as on-chain data strengthens
Following a weak start to the week, retail interest in Solana has picked up. According to CoinGlass, open interest in Solana futures increased 2.73% within 24 hours, and funding rates flipped from negative to positive territory. This indicates an expansion in leveraged long positions as traders bet on a continued rebound from the $155 support zone, with potential tests at $174–$177.
Short liquidations totaling $7.19 million exceeded long liquidations of $4.73 million, indicating that bearish positions were squeezed out and adding upward pressure on the price. The long-to-short ratio of 0.9912 indicates a market leaning cautiously bullish, yet still balanced.
Solana validator reforms make the network leaner and faster
Solana’s validator count has declined from around 2,500 to under 900 since 2023 - a 64% reduction - but this contraction reflects strategic consolidation rather than weakness. Many of the removed validators were outdated, slow, or linked to exploitative trading behaviours such as “sandwich” attacks.
The Solana Foundation has restructured its subsidy programme, now removing three subsidised validators for every new one added. The result: lower congestion, smoother transaction flow, and a healthier infrastructure.
As Tomas Eminger, Chief Infrastructure Officer at RockawayX, noted, this shift improves hardware quality and eliminates inefficiencies that previously slowed the network.
Solana real-world adoption: From DeFi to payments
Beyond market speculation, Solana is strengthening its institutional relevance through real-world adoption. Western Union has officially partnered with Solana to develop and test blockchain-powered cross-border transfer systems.
If adopted, the integration could channel significant transactional volume through Solana’s ecosystem, lifting both TVL and stablecoin demand. Simultaneously, developers are expanding Solana’s DeFi and asset-listing infrastructure:
- New perpetual markets are live.
- Launchpads are enabling faster token distribution.
- A revised asset-listing process simplifies onboarding for fintech and DeFi projects.
Together, these improvements suggest that Solana’s next growth phase will be driven less by speculative yield-farming and more by functional adoption - a shift reminiscent of how cloud computing matured from experimentation to enterprise utility.
Solana’s liquidity constraints: The risk beneath the rally
Despite these advances, the network faces liquidity constraints. DeFiLlama data shows Solana’s TVL rose 2.27% in 24 hours to $10.215 billion, but its stablecoin market capitalisation fell 8.16% over the week to $13.816 billion.

Falling stablecoin liquidity often signals shrinking capital reserves for decentralised applications, potentially reducing on-chain activity even as price metrics remain elevated.
If this decline continues, Solana may require stronger external inflows, such as ETF-driven liquidity or new payment-related transactions, to sustain ecosystem growth.
Comparing Solana’s institutional path to gold’s macro role
Solana’s 2025 performance mirrors gold’s cautious yet persistent rally amid uncertainty from the Federal Reserve. Both assets now reflect investor demand for alternatives that combine liquidity with long-term value preservation.
Just as gold ETFs legitimised physical gold as a mainstream portfolio component in the early 2000s, Solana’s regulated ETFs are giving institutions a compliant channel to access crypto exposure.
If the Fed’s December meeting signals prolonged policy tightness, risk assets could falter - yet steady institutional inflows suggest Solana is maturing into a digital asset capable of weathering policy-driven volatility.
Solana trading strategies on Deriv
- Breakout trading: Use Bollinger Bands or trendlines on Deriv MT5 to identify volatility-driven price movements. A confirmed breakout above resistance levels, such as $178 could indicate a bullish momentum continuation.
- Swing trading: Analyse Solana’s RSI and moving averages to time short- to medium-term entries. Combining this with the Deriv Trading Calculator can help manage position sizes and margin efficiently.
- Range trading: During consolidation, consider buying near support and selling near resistance using smaller lot sizes to manage risk effectively.
Deriv provides tight spreads, flexible leverage, and 24/7 access to crypto markets, allowing traders to act swiftly as Solana’s price responds to institutional flows or network developments.
Solana technical insights
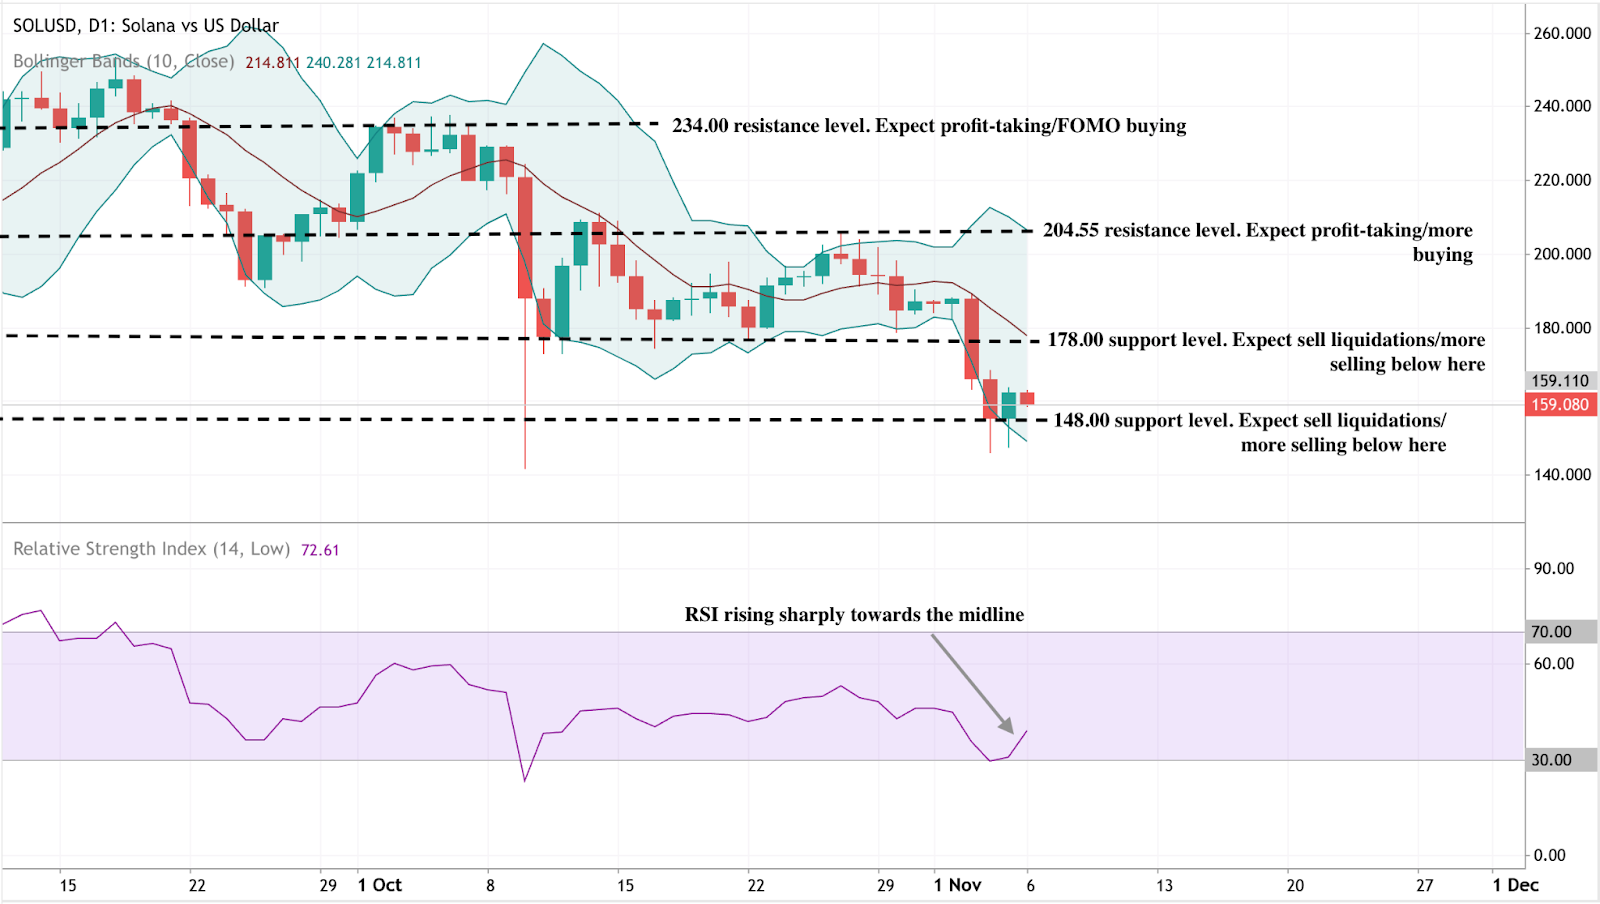
Solana is consolidating around $159 after bouncing from the $148 support, a key level where further sell-offs could accelerate if breached. The RSI at 72.6 is rising sharply towards the midline, signalling improving momentum and the potential for a short-term rebound.
The Bollinger Bands indicate that the price is hugging the lower band, suggesting oversold conditions with room for mean reversion if buying pressure strengthens. Immediate resistance lies at $178, followed by $204.55, where profit-taking is likely. A sustained break above $178 could signal a move towards $200–$210, while a failure to hold $148 risks a slide towards $135.
For traders interested in capitalising on such opportunities, Solana CFDs are available on Deriv MT5.
Solana price prediction and investment outlook
For portfolio managers, Solana’s transformation signals a gradual shift from a speculative token to an institutional-grade digital infrastructure.
- In the short term, price performance may remain tied to macroeconomic sentiment and ETF flows.
- Medium-term: The adoption of payment rails and DeFi applications could deepen liquidity.
- In the long term, continued integration with global finance and efficient network scaling may establish Solana as one of the few crypto assets offering both utility and institutional credibility.
In 2025, the real story is not the daily price chart - it is the quiet institutional infrastructure forming beneath it.

Ethereum price crash: Are we in a crypto winter or just a profit-taking phase?
Ethereum’s sharp fall below $3,500 looks less like the beginning of a crypto winter and more like a large-scale profit-taking reset.
Ethereum’s sharp fall below $3,500 looks less like the beginning of a crypto winter and more like a large-scale profit-taking reset. Data across on-chain, derivatives, and institutional flows suggest the market is undergoing a correction after months of aggressive gains, rather than entering a prolonged bearish cycle.
While retail traders and exchange-traded funds (ETFs) are showing fear, whales and institutional treasuries are using the pullback to accumulate - hinting that the current phase could set the foundation for a late-year recovery.
Key takeaways
- Ethereum trades at around $3,312, down 8.92% over the past month.
- Over $1.1 billion in leveraged positions were liquidated within 24 hours, as 303,000 traders were forced out.
- The Crypto Fear & Greed Index dropped to 20 (“Fear”), down from 59 (“Greed”) a month ago.
- Whale wallets added 1.64 million ETH (~$6.4 billion) in October, despite declining prices.
- The Fusaka hard fork upgrade scheduled for 3 December 2025 introduces PeerDAS, expected to cut Layer-2 fees by up to 95%.
- November has historically been Ethereum’s best-performing month, with an average return of +6.9% over the past eight years.
Crypto Market sentiment turns fearful
The Crypto Fear and Greed Index has plunged to 20, signaling widespread unease among investors.
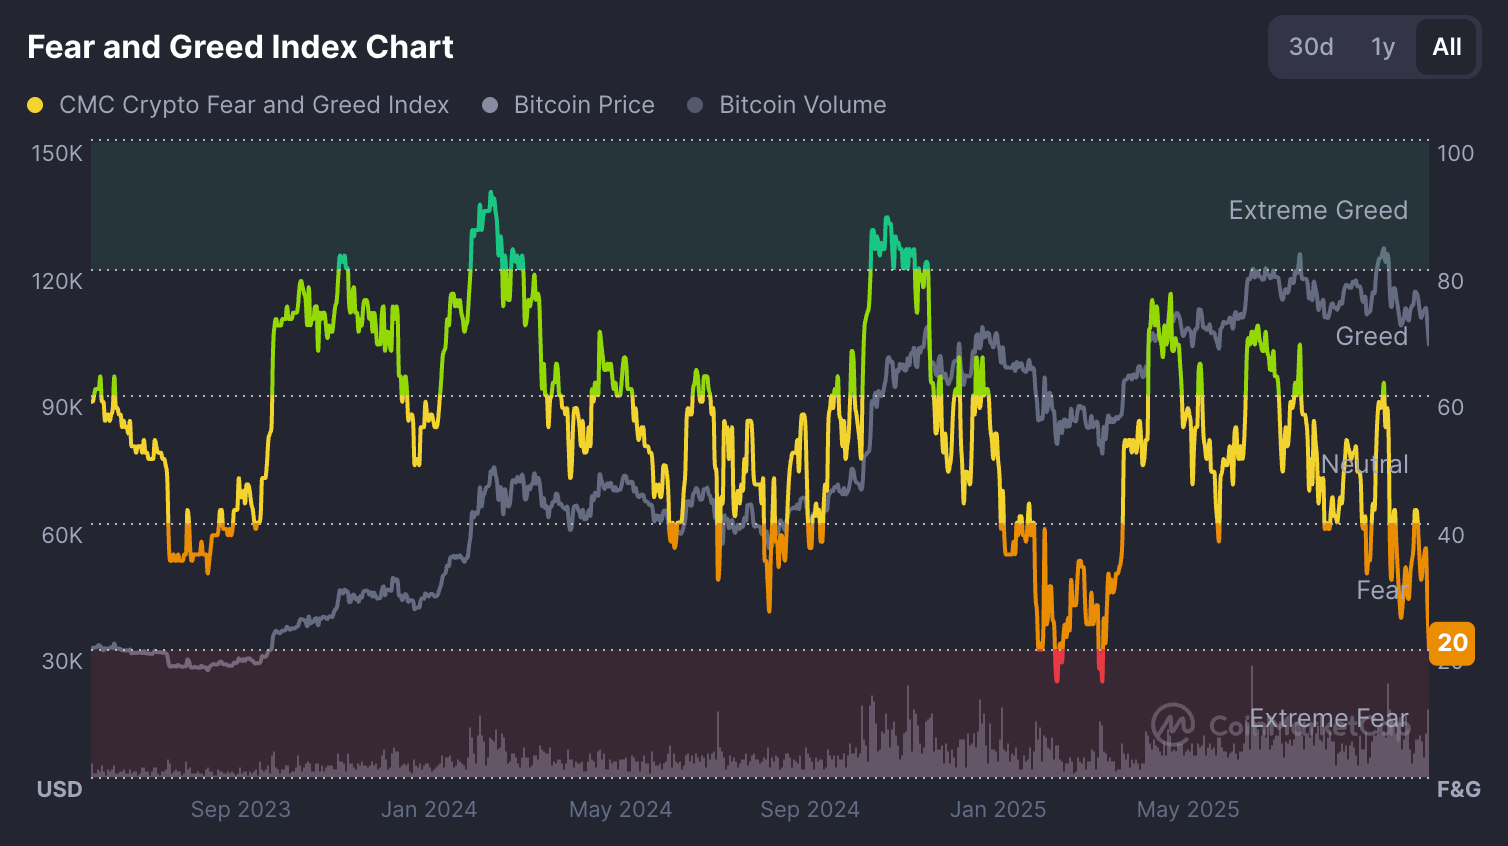
Just a month ago, readings above 50 showed moderate greed. The shift underscores a dramatic shift in sentiment as traders move from optimism to caution.
Across the broader market, nearly every major asset has turned red. Bitcoin fell 2.8% to $104,577, Solana dropped 11%, BNB lost 8.3%, XRP fell 6.7%, and Cardano slid 7.4% in the past 24 hours. The total cryptocurrency market cap has slipped 4% daily, erasing over $140 billion in value.
The macro backdrop compounds the pressure. The Federal Reserve’s uncertain rate outlook and a strengthening U.S. dollar are draining liquidity from risk assets - a dynamic often associated with crypto drawdowns.
ETH Whale accumulation intensifies while retail retreats
While fear dominates headlines, blockchain data reveals that the largest holders are quietly accumulating Ethereum. According to analytics firm Santiment, wallets holding between 1,000 and 100,000 ETH increased their balance from 99.28 million to 100.92 million ETH during the month of October.

This buying occurred even as Ethereum fell around 7% that month - a strong sign that institutional and high-net-worth investors view current prices as attractive entry points.
In contrast, long-term retail accumulation has slowed. Glassnode data show that the Holder Accumulation Ratio has declined from 31.27% to 30.45% since late October.
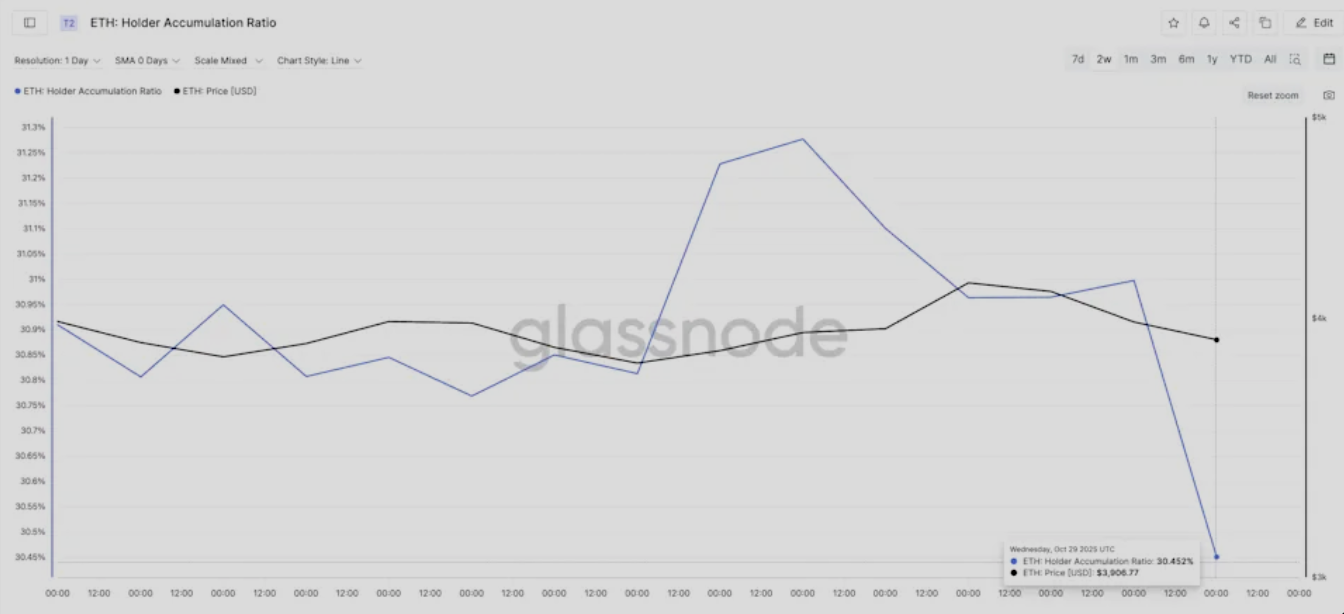
Retail investors are reducing exposure, waiting for clearer signals before re-entering. This divergence between whale buying and retail caution has become the defining feature of the current correction.
Institutional positioning: ETFs and treasuries diverge
Institutional flows paint a mixed picture. On the one hand, U.S. spot Ethereum ETFs experienced $135.76 million in outflows on 3 November.
- BlackRock’s ETHA: −$81.7 million
- Fidelity’s FETH: −$25.1 million
- Grayscale’s ETHE: −$15 million
These redemptions came alongside $186.5 million in Bitcoin ETF outflows, as institutional desks reduced exposure amid heightened volatility.
On the other hand, corporate treasuries are accumulating. Publicly traded BitMine Immersion Technologies (BMNR) added 82,353 ETH last week - worth roughly $294 million - bringing its total holdings to 3.39 million ETH, or 2.8% of Ethereum’s circulating supply. The company’s average purchase price stands around $3,909, suggesting confidence in long-term upside.
BMNR’s chairman, Tom Lee, told CNBC that the market is “consolidating after a reset,” adding that fundamentals such as stablecoin volume and application revenues are at all-time highs. Lee predicts a possible rally toward $7,000 for Ethereum before the end of the year, framing current conditions as a healthy correction rather than a crisis.
Liquidations reveal a market reset
The most dramatic signal of the correction came from the derivatives market. Data from Coinglass shows that over 303,000 traders were liquidated in just 24 hours, resulting in a total of $1.1 billion in forced positions. Within a single hour, more than $300 million was wiped out - $287 million of which were long positions.
This scale of liquidation reveals how over-leveraged bullish bets unraveled once prices broke below key support levels. Ethereum and Bitcoin accounted for the bulk of the wipeout, while high-beta altcoins like Solana and BNB saw even sharper declines.
The outcome is paradoxically constructive: leverage has been purged, funding rates have normalised, and open interest now reflects disciplined accumulation rather than speculative excess. Ethereum’s open interest remains high at $19.9 billion, but funding rates are flat - an equilibrium that often precedes a more stable recovery phase.
Fusaka upgrade offers long-term optimism
While short-term traders react to price volatility, developers are preparing for one of Ethereum’s most ambitious upgrades yet.
The Fusaka hard fork, confirmed for 3 December 2025, introduces Peer Data Availability Sampling (PeerDAS) - a technology that increases block capacity from 6 to 48 per block. This upgrade could reduce Layer-2 transaction fees by up to 95%, significantly improving scalability for DeFi and rollup networks.
Such infrastructure improvements strengthen Ethereum’s long-term competitiveness against alternative Layer-1 chains. With stablecoin transactions on Ethereum hitting $2.8 trillion in October, network fundamentals remain robust despite price turbulence.
Ethereum’s November historical pattern: a bullish bias
Seasonality may soon lend support. Over the past eight years, Ethereum has averaged a monthly return of +6.9 % in November. In 2024, it recorded a remarkable 47.4% rally, marking one of its strongest months ever.
The Net Unrealised Profit/Loss (NUPL) ratio - which measures the percentage of investors in profit - has fallen from 0.43 to 0.39, near the monthly low of 0.38 that last triggered a 13% rebound from $3,750 to $4,240.
This trend suggests selling pressure may be fading as investor incentives to take profits decline.
Macro context: profit-taking, not panic
Ethereum’s downturn mirrors the broader behavior of risk assets. After months of double-digit gains across cryptocurrencies, profit-taking has accelerated amid global liquidity concerns. The U.S. dollar index strengthened sharply, and Fed officials have hinted at slower rate cuts, encouraging investors to rotate out of speculative assets.
Unlike prior bear-market conditions, however, there is no collapse in network activity or developer engagement. DeFi revenue remains strong, stablecoin velocity is high, and whale inflows indicate rotation rather than retreat. The sell-off, therefore, aligns more with profit-locking behavior than the sustained capital flight that characterised the 2022–2023 crypto winter.
Traders on Deriv MT5 can track these shifts across multiple assets, from cryptocurrencies to forex, to gauge broader market sentiment in real-time.
Ethereum technical insights: Stabilisation vs. further weakness

Ethereum is currently trading near $3,313, rebounding after a sharp decline that tested the $3,745 support level. This zone has acted as a key area where sell liquidations intensified, but the recent bounce suggests early signs of buyer interest.
The Bollinger Bands have widened significantly, indicating elevated volatility, while price action remains near the lower band - typically a sign of short-term oversold conditions. A sustained close above the middle band could confirm a recovery in momentum.
Meanwhile, the Relative Strength Index (RSI) has risen sharply from 33, signaling improving bullish momentum after near-oversold readings. A further RSI move above 50 would reinforce a potential short-term reversal.
Resistance levels remain at $4,250 (where profit-taking and more buying may emerge) and $4,700, marking a stronger ceiling for any extended rally. Overall, ETH shows early signs of recovery but still faces strong resistance ahead.
The near-term outlook depends on whether ETF outflows stabilise and whether the whale accumulation trend continues through November. With fear levels elevated, contrarian traders are closely watching for a potential bottoming process similar to past mid-cycle corrections. The Deriv trading calculator can help traders assess potential profit and margin exposure before taking positions in such volatile environments.
Ethereum investment implications
For short-term traders, Ethereum’s setup suggests a high-volatility environment with tactical entry opportunities near the $3,500–$3,700 support range. Upside targets into December sit between $4,400 and $4,600, assuming sentiment stabilises and ETF outflows slow.
For medium-term investors, current levels represent an accumulation window. Whale buying, the Fusaka upgrade, and seasonal patterns point to improving fundamentals beneath the surface fear. Institutional participation is likely to return once macroeconomic uncertainty eases and on-chain stability confirms a bottom.
In essence, Ethereum’s decline is a market normalisation, not a meltdown. As leverage unwinds and fundamentals strengthen, the groundwork for the next leg higher may already be forming.

Coffee price forecast: Can U.S. trade talks cool a weather-fuelled rally?
Arabica coffee futures remain caught between drought in Brazil and tariffs in Washington.
Arabica coffee futures remain caught between drought in Brazil and tariffs in Washington. Until either rainfall normalises or a U.S.–Brazil trade deal removes the 50% import duty, prices are likely to stay near multi-month highs. A continued supply squeeze could lift Arabica above $425, while quick diplomatic progress or heavier rains could drag it back toward $380.
Key takeaways
- Brazil’s Minas Gerais drought has cut rainfall to 75 % of normal, the latest in a string of dry years.
- Vietnam’s crop risk from Typhoons Kalmaegi and Fengshen threatens robusta output in the Central Highlands.
- U.S. tariffs on Brazilian coffee have pushed exchange inventories to their lowest since 2024.
- Vietnam logged a record US$8.4 billion in exports, offsetting part of the global shortfall.
- La Niña probability of 71 % points to further dryness through early 2026.
- Global production ≠ ample supply: Arabica deficits persist despite record total output.
Brazil’s drought deepens the arabica deficit
Weather agency Somar Meteorologia reported Minas Gerais - the heart of Brazil’s arabica belt - received just 33 mm of rain in late October, barely three-quarters of the historical average, following a near-dry week earlier. The soil moisture deficit poses a threat to flowering and bean development for the 2026/27 crop.
NOAA’s September update lifted the probability of a La Niña event to 71%, reinforcing expectations of continued dryness across southern Brazil. Conab cut its 2025 arabica estimate by 4.9 % to 35.2 million bags, and total coffee output to 55.2 million bags. Years of sub-par rainfall have already reduced bean size and yields, creating what traders call a “climate premium” in arabica futures.
Trade barriers tighten U.S. supply
In July 2025, Washington imposed a 50 % tariff on Brazilian beans - part of a wider trade confrontation between Presidents Trump and Lula. Brazil supplies roughly a third of America’s unroasted coffee; the duty instantly disrupted shipments.
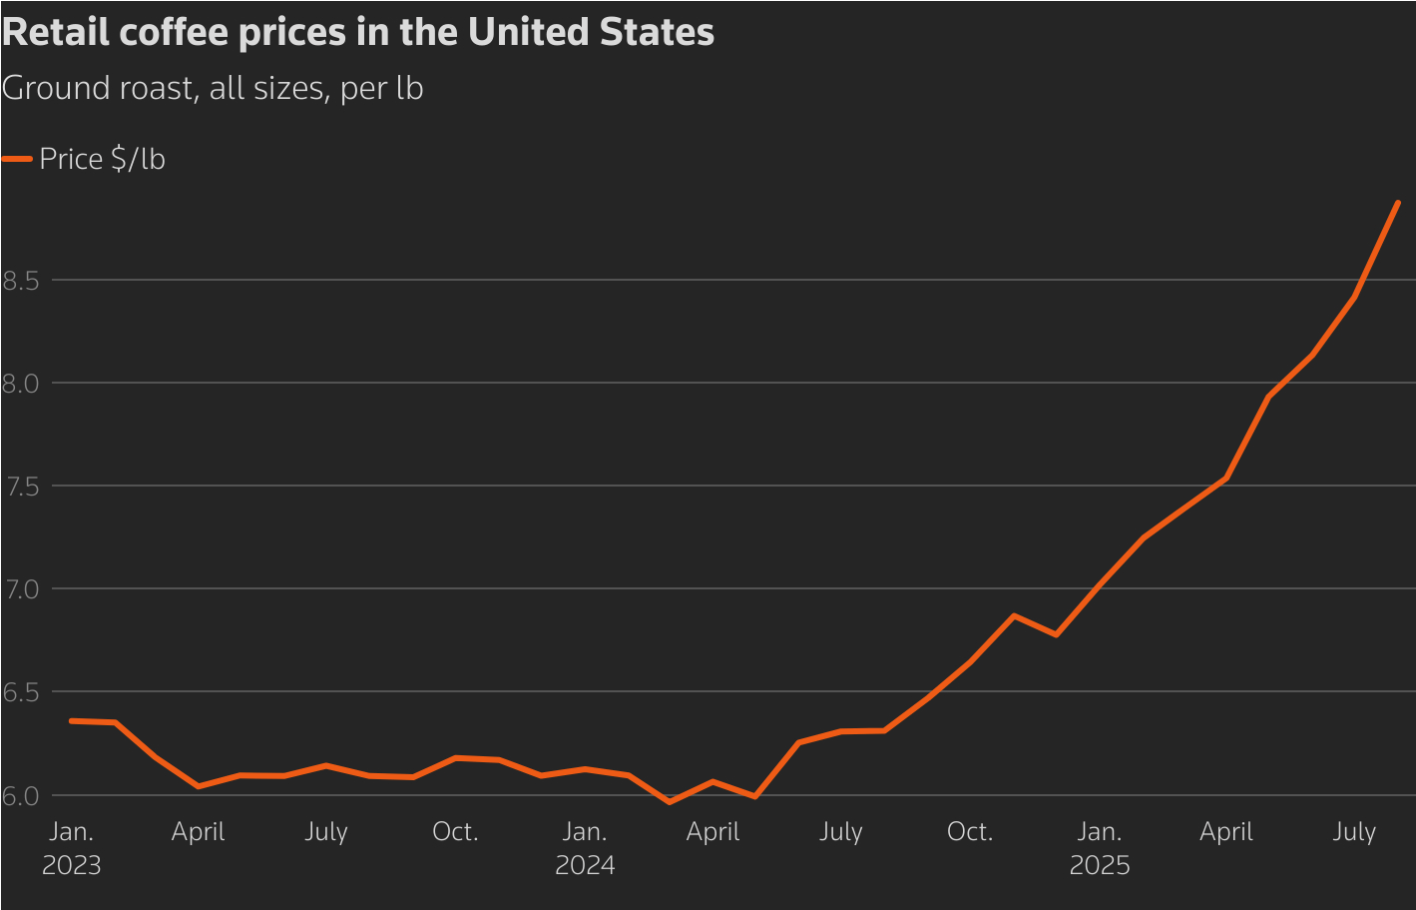
Importers rerouted cargoes to Canada, paid $20–25 per bag cancellation fees, or warehoused beans under bond in Florida to delay tax payment. ICE-monitored arabica stocks have since plummeted to a 1.75-year low of ≈ approximately 431,481 bags, while robusta holdings have declined to ≈ approximately 6,053 lots. Retail coffee prices in U.S. stores rose 41% year-over-year, adding to food inflation.
Both sides now signal progress: Trump described the latest meeting as “positive,” and Lula hinted at a “definitive solution” soon. Any rollback of tariffs would reopen the world’s largest consumer market and relieve U.S. roasters by mid-2026.
Vietnam’s robusta boom - and its limits
Vietnam has been the outlier in 2025’s volatile market. Exports for 2024–25 reached 1.5 million tonnes worth US$8.4 billion, up 55% in value despite minimal volume growth. Average prices jumped 52% to US$5,610 per tonne, reflecting the global supply squeeze.
Europe absorbed 47% of shipments, led by Germany, Italy, and Spain. Farm-gate prices around VND 116,000–118,000 per kg (≈ US$4.6) deliver strong profits, given production costs of VND 35,000–40,000.
However, Typhoons Kalmaegi and Fengshen threaten flooding and landslides in the Central Highlands. Vicofa forecasts a 5–10% increase in 2025/26 output, but warns that persistent storms or fertilizer shortages could reverse those gains. The sector’s new EU “low-risk” status on traceability protects access to European buyers but not against climate volatility.
To explore how traders can capitalise on such volatility, Deriv’s trading calculator help estimate margin and profit scenarios for coffee, gold, and oil positions.
Global production: Record high, but shortages remain
According to the USDA FAS, world coffee production for 2025/26 will reach a record 178.7 million bags (+2.5 %). Yet, arabica output is expected to fall 1.7% to 97 million bags, while robusta rises 7.9% to 81.7 million bags. Ending stocks are expected to rise 4.9% to 22.8 million bags, but this aggregate figure masks an arabica shortfall.
Trader Volcafe projects a global arabica deficit of 8.5 million bags - the fifth straight year of undersupply - wider than last season’s 5.5 million. Even with record totals, the quality mix and logistical bottlenecks leave roasters short of premium beans.
U.S. roasters face an expensive squeeze
American roasters, relying heavily on Brazilian arabica, are drawing down remaining inventories. Some redirected beans to Canada to avoid tariffs, incurring higher freight costs. Others cancelled shipments outright, paying penalty fees.
Small and mid-sized roasters report margins collapsing as replacement beans from Colombia and Mexico cost 10% more, while Brazilian beans - though cheaper - carry the 50% duty.

The ripple effect reaches consumers: a typical supermarket blend has risen from $ 6–7 to $11 per pack. The U.S. Labor Statistics Bureau links these increases directly to reduced imports and weather-related shortages. Analysts expect inventories to fall to 2.5–3 million bags by December, near critical levels.
Coffee price Market outlook
- Bullish scenario: Continued dryness, strong La Niña, and stalled trade talks push arabica through $425, extending the rally into early 2026.
- Base case: Partial tariff relief and modest rains keep prices range-bound $380–$420.
- Bearish scenario: Rapid trade détente plus Vietnam’s larger harvest could pull arabica back to $350–$370 by mid-2026.
Even in the bearish case, structural deficits and climate risks suggest the long-term floor is moving higher.
Coffee price technical analysis
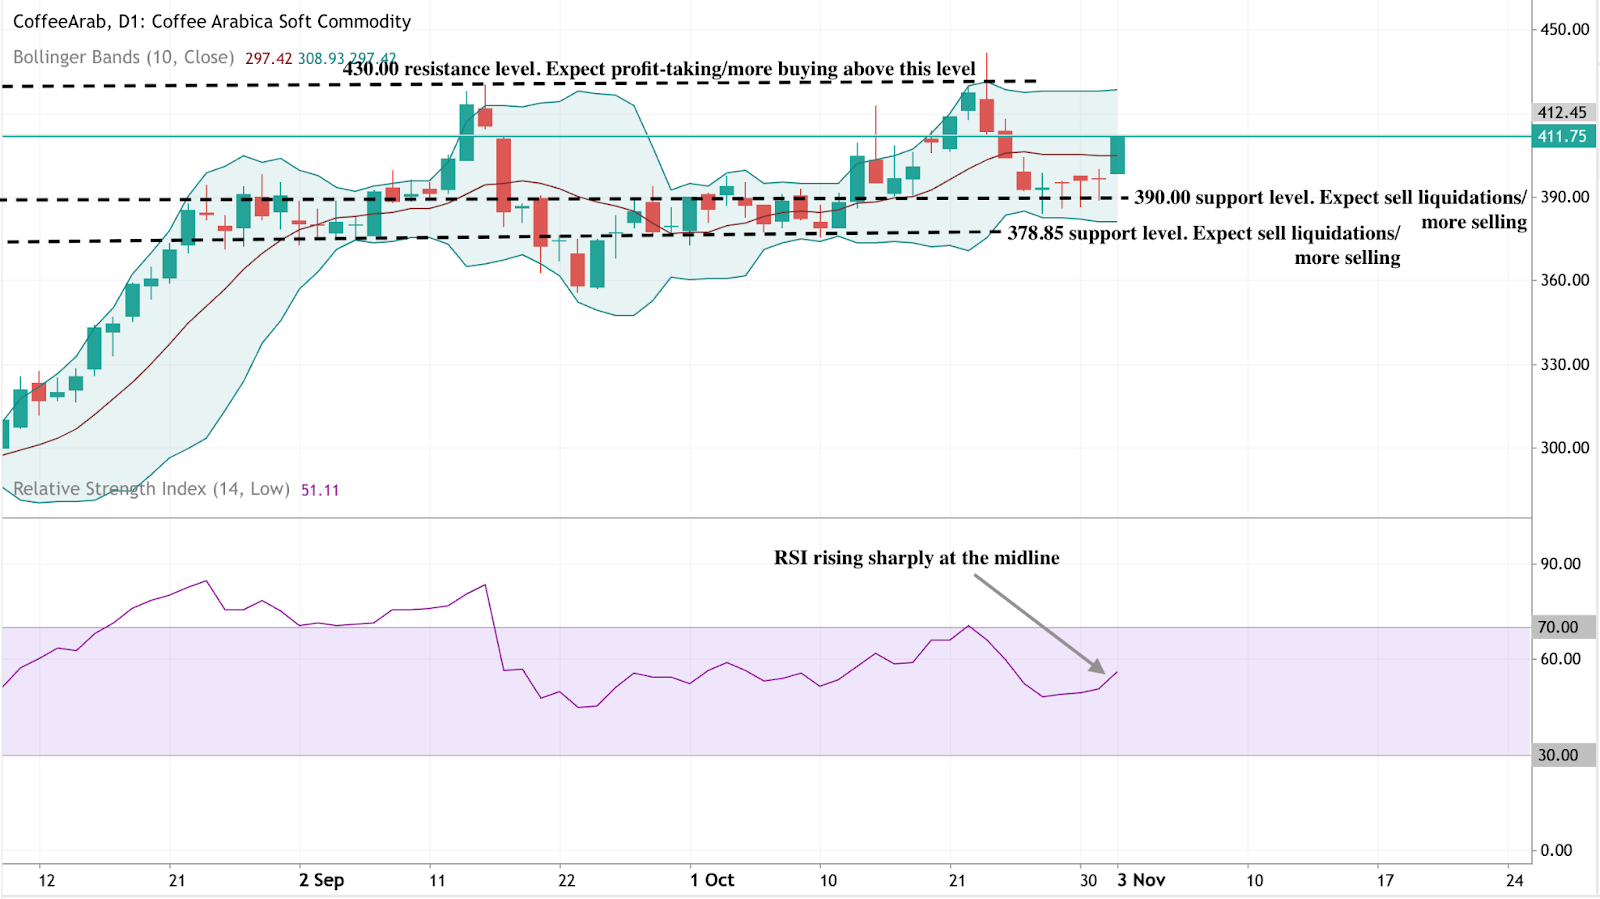
Coffee Arabica prices are consolidating near $411.75, showing a mixed but slightly bullish setup. Bollinger Bands are moderately wide, indicating ongoing volatility. The latest candle is testing the upper mid-band, indicating potential for a short-term push higher if momentum persists.
The key resistance remains at $430.00, where previous rallies faced profit-taking. A decisive break above this could attract fresh buying pressure. On the downside, $390.00 and $378.85 serve as major support zones - a breach below either could trigger liquidation-driven selling.
RSI (14) currently sits around 51, rising sharply from the midline, implying improving bullish momentum but not yet in overbought territory. This reinforces the idea of a cautious recovery phase rather than a breakout trend.
Coffee price investment implications
For traders and investors, the near-term setup points to heightened volatility rather than a sustained correction.
- Short term: Price swings will hinge on U.S.–Brazil trade headlines and rainfall updates; speculative spikes above $425 remain possible.
- Medium-term: Monitor Vietnam’s harvest and La Niña developments, as both could reset the global supply balance.
- Long-term: Structural climate risk keeps the floor higher - arabica below $350 looks unlikely barring a policy breakthrough. Coffee’s current rally may cool, but the underlying heat - political and climatic - shows no sign of dissipating.
For traders seeking exposure, coffee CFDs are available on Deriv MT5, alongside other soft commodities and energy assets, such as gold and oil.
抱歉,我们找不到任何匹配 的结果。
搜索提示:
- 检查拚写并重试
- 尝试其他关键字