Sonuçlar için
Analiz: Altın fiyatları ve ABD hisse senetlerindeki paralel ralliyi ne tetikliyor?
Altın fiyatları ve ABD hisse senetlerindeki paralel ralli biraz alışılmadık, çünkü geleneksel olarak altın "güvenli liman" varlık olarak kabul edilir.
Altın fiyatları ve ABD hisse senetlerindeki paralel ralli biraz alışılmadık, çünkü geleneksel olarak altın, ekonomik belirsizlik dönemlerinde iyi performans gösterme eğiliminde olan bir "güvenli liman" varlık olarak kabul edilirken, hisse senetleri daha çok ekonomik büyüme ve risk iştahıyla ilişkilidir. Analistlere göre, birkaç faktör her iki piyasayı aynı anda yukarı çekiyor.
Tüccarlar, CME’nin FedWatch aracı verilerine göre Aralık ayında 25 baz puanlık bir faiz indirimi olasılığını %63 olarak görüyor. Bu tek anlatı - daha ucuz para - genellikle zıt yönlerde hareket eden varlıkları yükseltiyor: klasik güvenli liman altın ve geleneksel risk oyunu olan hisse senetleri.
Her iki piyasa da ekonomik güçten ziyade politika kaynaklı iyimserlikten besleniyor. Zayıf istihdam verileri, yumuşak tüketici güveni ve mali sıkıntı işaretleri, tüccarları daha yumuşak bir para politikası yoluna hazırlanmaya itiyor ve güvenlik ile spekülasyon arasındaki çizgiyi bulanıklaştıran bir likidite rallisini tetikliyor.
Öne çıkan noktalar
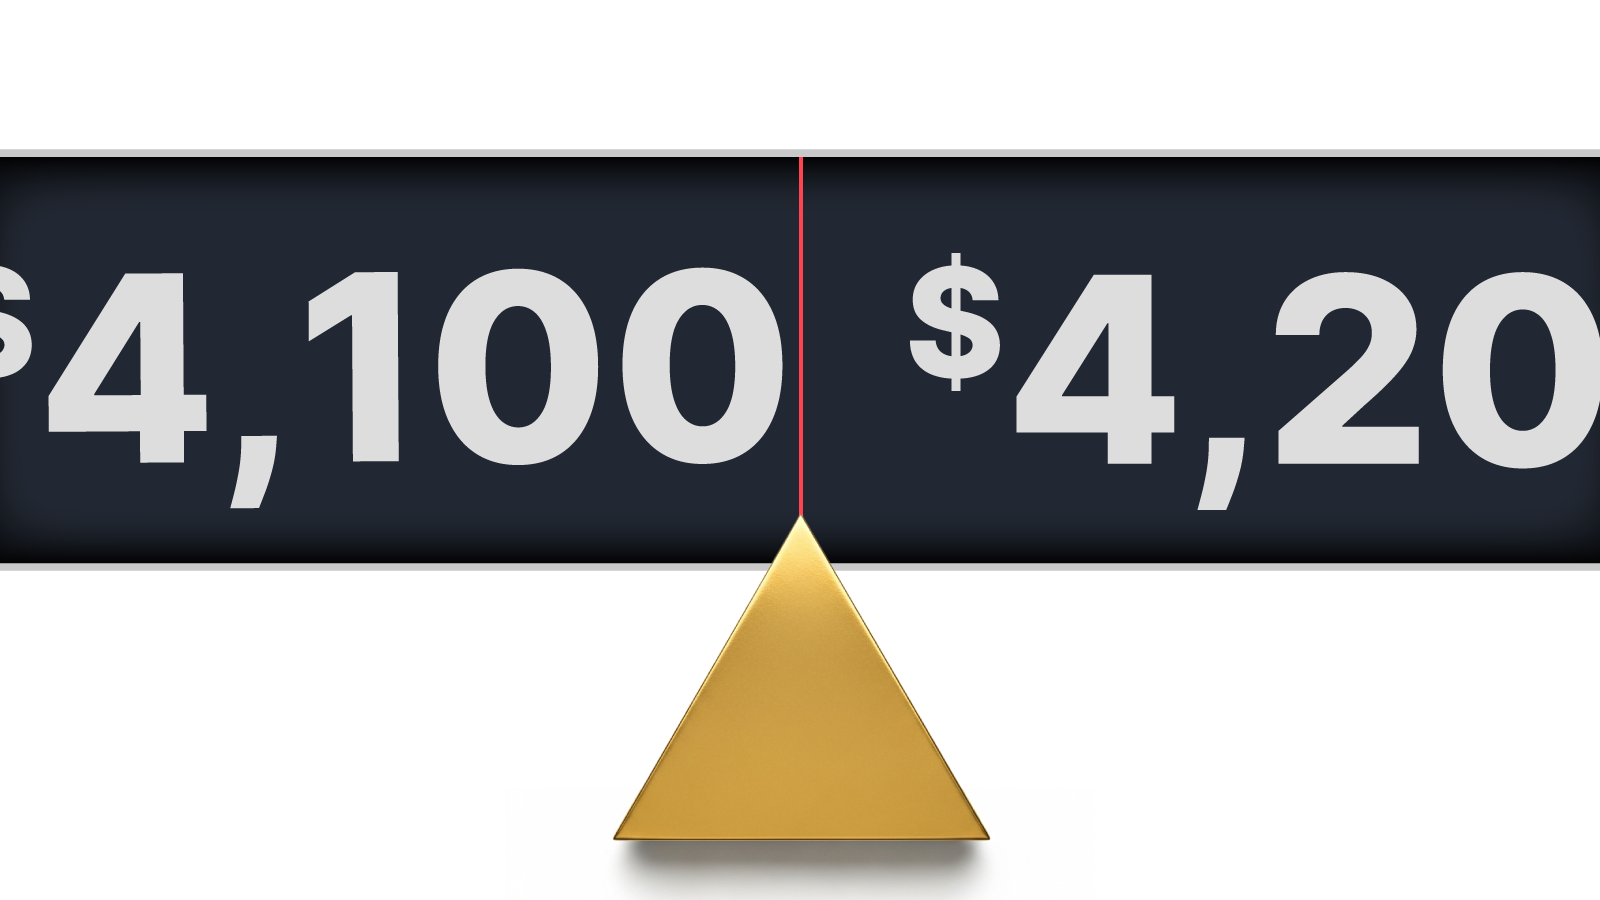
- Altın, Fed’in gevşemesi beklentisiyle iki haftanın en yüksek seviyesi olan ons başına 4.100 doların üzerinde tutunuyor.
- ABD hisse senetleri, daha düşük faiz beklentilerinin gelecekteki kazanç değerlemelerini artırmasıyla yükseliyor.
- Ralli, büyümeden ziyade likidite güvenini yansıtıyor - piyasayı temel göstergeler değil merkez bankaları yönlendiriyor.
- Mali endişeler ve yükselen ABD Hazine getirileri altına ikinci bir destek katmanı sağlıyor.
- Hindistan ve merkez bankalarından gelen güçlü fiziksel talep, spekülatif dalganın altında fiyatları destekliyor.
Fed faiz indirimi çağrıları altın ve ABD hisse senetlerini sürüklüyor
Ortak ralli, net bir makro değişimden kaynaklanıyor. Son ABD ekonomik verileri momentum kaybına işaret etti - özel sektör istihdamı Ekim’de zayıfladı, kamu ve perakende işleri azaldı ve tüketici güveni aylardır en düşük seviyeye geriledi. Piyasalar bunu Fed’in Aralık’ta faiz indirimine döneceğinin teyidi olarak yorumladı.
Düşük faiz oranları piyasaların her iki tarafını aynı anda etkiliyor:
- Hisse senetleri için, borçlanmayı ucuzlatıyor ve şirket kazançlarının bugünkü değerini artırıyor.
- Altın için, getirisi olmayan bir varlığı elde tutmanın fırsat maliyetini azaltıyor.
Sonuç, senkronize bir yükseliş. Yatırımcılar güvenlik ve risk arasında seçim yapmıyor; her ikisini de satın alıyor, tek beklentiyle birleşmiş halde - daha kolay paranın geri dönüşü.
Deriv MT5 üzerinde işlem yapan tüccarlar için, bu çapraz varlık dinamikleri, endeksler, emtialar ve metallerdeki volatilitenin aynı politika nabzına tepki vermesiyle çeşitlendirme için yeni fırsatlar yarattı.
ABD mali politikası gizli bir itici güç olarak yeniden ortaya çıkıyor
ABD hükümet kapanması ve geçici çözümü mali istikrara odaklanmayı artırdı. Senato’nun hükümeti yeniden açmak için yaptığı iki partili uzlaşma - Başkan Donald Trump tarafından desteklendi - kısa vadeli piyasa stresini hafifletti ancak yatırımcılara Amerika’nın uzun vadeli borç sorununu hatırlattı.
Saxo Bank’tan Ole Hansen’in belirttiği gibi, “Mali endişelerden kaynaklanan yükselen getiriler, ekonomik güçten ziyade tarihsel olarak yatırım metallerini desteklemiştir.” Bu bağlamda daha yüksek tahvil getirileri, daha güçlü bir ekonomiden ziyade borç sürdürülebilirliği konusundaki endişeyi yansıtıyor - altını mali belirsizliğe karşı bir koruma olarak tutma gerekçesini güçlendiriyor.
Hükümet kurumlarının yeniden açılması resmi ekonomik verilere erişimi de geri getirecek ve piyasalara daha fazla netlik sağlayacak. Ancak bu verilerin muhtemelen yavaşlayan faaliyetleri teyit etmesiyle, tüccarlar Fed’in harekete geçmesi için daha fazla gerekçe görüyor.
Altın ve hisse senetleri: Piyasalarda nadir görülen bir tandem yükseliş
Altın ve hisse senetleri geleneksel olarak zıt yönlerde hareket eder. Biri korkuyu, diğeri güveni temsil eder. Ancak 2025’in piyasa davranışı her ikisinin de artık likidite beklentilerinin ifadesi olduğunu gösteriyor.
Yatırımcılar parasal gevşeme beklediğinde, ucuz paradan faydalanan her şey - altından büyüme teknoloji hisselerine kadar - yükselir. Bu korelasyon değişikliği, piyasaların işleyişinde yapısal bir değişikliği vurguluyor: politika beklentisi, temel göstergelerin önüne geçti ve ana fiyat belirleyici oldu.
Altının ABD dolarının güçlenmesine rağmen yükselme yeteneği bu değişikliği pekiştiriyor. Döviz dinamikleri, küresel varlık fiyatlamasında merkez bankası politikasının hakimiyeti tarafından gölgede bırakılıyor.
Altın talebi ralliyi derinleştiriyor
Spekülatif anlatının ötesinde, altının yükselişi güçlü gerçek dünya desteğine sahip. Fiziksel talep özellikle Hindistan ve merkez bankalarında sağlam kalıyor:
- Hindistan’ın altın ETF girişleri 2025’in ilk 10 ayında 2,9 milyar dolara ulaştı - bu, 26 ton altına eşdeğer ve 2020-2024 toplamına neredeyse eşit.
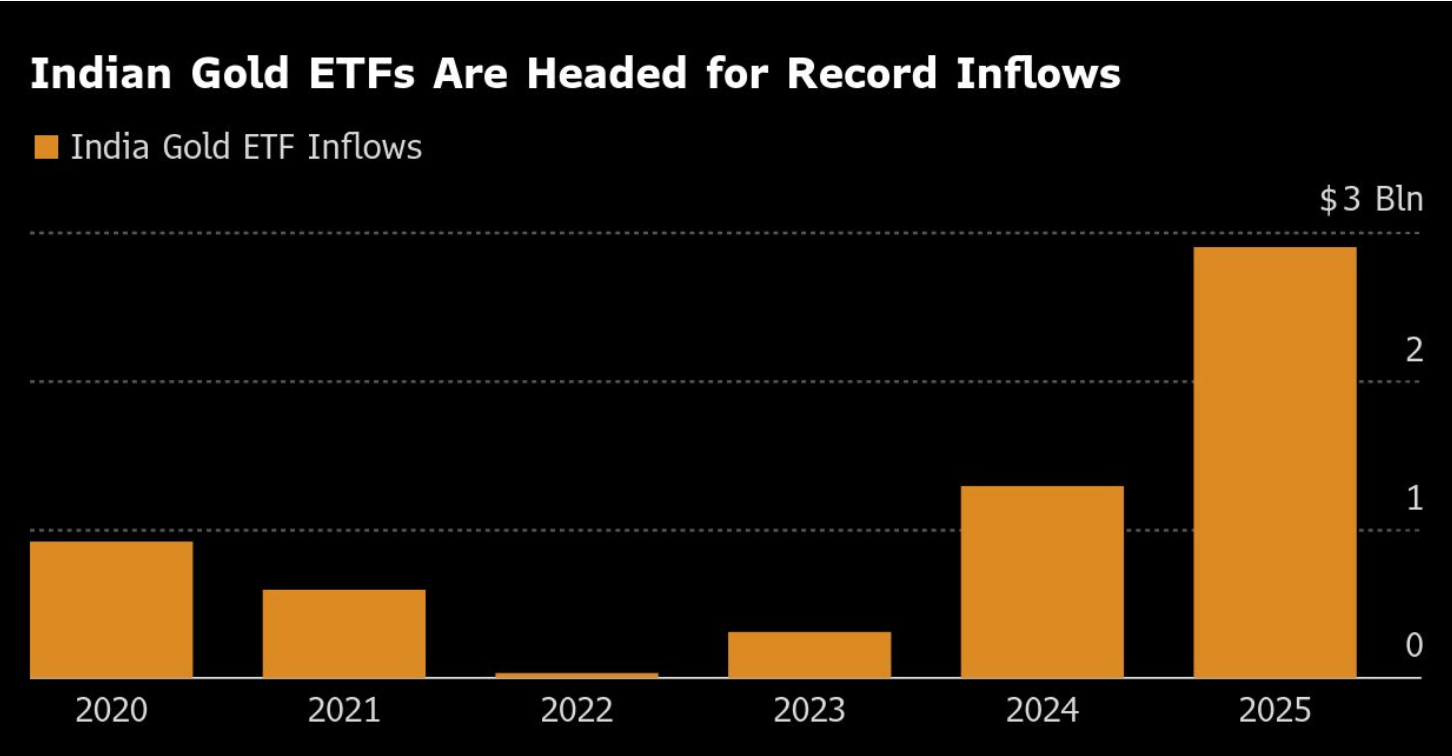
- Sadece Ekim ayında 850 milyon dolarlık yeni giriş oldu, Eylül’deki rekor 942 milyon doları takip ederek.
- Hindistan’ın toplam ETF varlıkları şimdi 83,5 ton ve değeri 11 milyar doların üzerinde.
Bu talep, rallinin tamamen spekülatif olmadığını gösteriyor. Altına yönelik gerçek bir küresel uzun vadeli değer saklama iştahını yansıtıyor - parasal ve mali belirsizliğe karşı bir denge unsuru.
Altın madencileri yatırımcı güvenini yansıtıyor
Altın piyasasının kurumsal tarafı bu hissiyatı yansıtıyor. Dünyanın en büyük üreticilerinden Barrick Gold (ABX.TO), düzeltilmiş kar beklentisini aşmasının ardından üç aylık temettüsünü %25 artırdı ve 500 milyon dolarlık hisse geri alım programını genişletti.
- Ortalama gerçekleşen altın fiyatı: Ons başına 3.457 dolar, bir yıl öncesine göre 2.494 dolardan yükseldi.
- Üretim 943.000’den 829.000 ons’a düştü, ancak tüm maliyetler hafifçe artarak ons başına 1.538 dolara yükseldi.
Operasyonel zorluklara ve Mali madeninin kaybıyla bağlantılı 1 milyar dolarlık değer düşüklüğüne rağmen, Barrick’in Kuzey Amerika üretimine stratejik yönelimi, yüksek altın fiyatlarının devam edeceğine dair güveni gösteriyor.
Ancak, çalışanların gözaltına alınması ve ihracat kısıtlamalarını içeren Mali anlaşmazlığı, küresel altın arzının jeopolitik kırılganlığını vurguluyor; bu sorun çözülmezse piyasaları daha da sıkılaştırabilir.
Piyasa arka planı: borç, getiriler ve politika paradoksu
Altının bu yıl %50’den fazla yükselişi sadece enflasyon korkularının yansıması değil. Bu, mali kırılganlığa ve piyasanın likiditeye bağımlılığına verilen bir tepki.
Yükselen Hazine getirileri ekonomik sağlığın işaretinden çok borç sürdürülebilirliği konusunda bir uyarı niteliğinde. Yatırımcılar bu yapısal risklere karşı koruma olarak altın alırken, aynı zamanda likiditenin akmaya devam edeceği varsayımıyla hisse senetlerini de yukarı çekiyor.
Bu çift yönlü davranış - aynı anda güvenlik ve risk arayışı - 2025 piyasa psikolojisinin belirleyici paradoksu.
Altın ve ABD hisse senedi için önümüzdeki aylara dair senaryolar
- Boğa kırılımı
Fed Aralık’ta faiz indirir ve daha fazla gevşeme sinyali verirse, altın 4.200 doları hızla aşabilir; mali endişeler ve istikrarlı merkez bankası talebi destek sağlar.
- Kısa vadeli konsolidasyon
Tedbirli veya gecikmeli bir Fed duruşu, altının 4.050 ile 4.150 dolar arasında dalgalanmasına neden olabilir; hisse senetleri ise likidite beklentileri azalana kadar kazançlarını koruyabilir.
Her durumda, ana çıkarım şu ki altın ve hisse senetleri artık karşıt duygusal güçler yerine aynı makroekonomik sürücüye - paranın fiyatına - tepki veriyor.
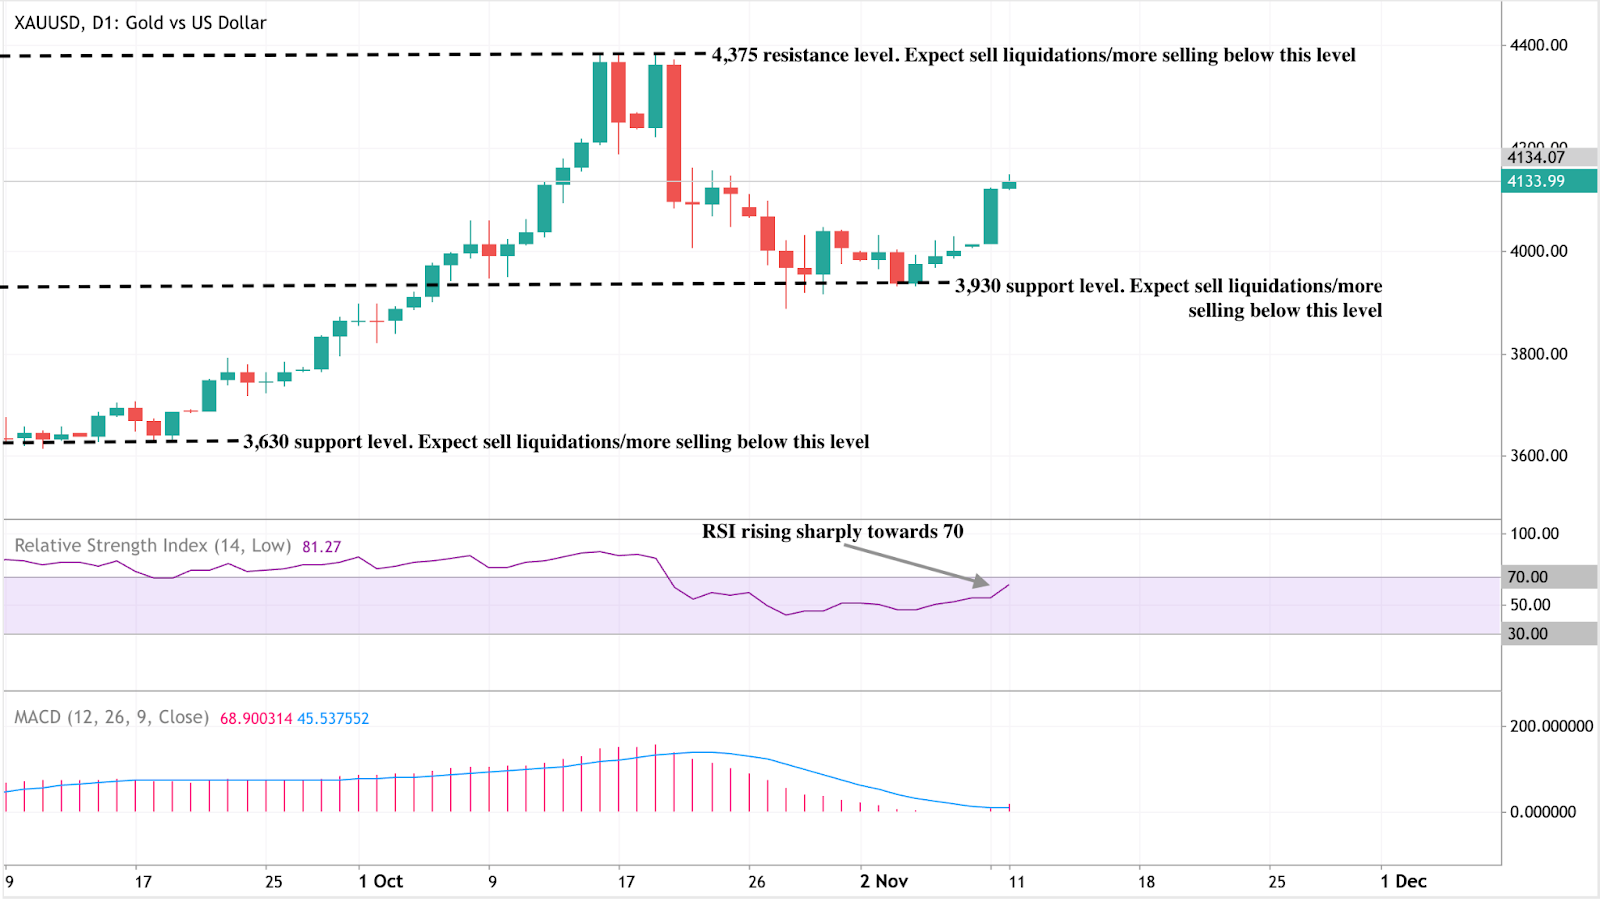
Altın teknik analiz
Altın (XAU/USD) yaklaşık 4.134 dolar seviyesinde işlem görüyor, kritik seviyeler arasında konsolide oluyor - direnç 4.375 dolar, destek 3.930 dolar. 4.375 doların üzerindeki bir kırılım ralliyi uzatabilir, 3.930 doların altına düşüş ise 3.630 dolara doğru yeni satış riskini artırır.
RSI (81) güçlü bir boğa momentumu gösteriyor ancak aşırı alım koşullarını işaret ederek kısa vadeli konsolidasyon veya geri çekilme olasılığını ima ediyor. Bu arada MACD, devam eden alım baskısını doğrulayan boğa kesişiminde kalmaya devam ediyor.
Genel olarak, altının eğilimi 3.930 doların üzerinde pozitif kalıyor, ancak tüccarlar aşırı alım bölgelerine yakın momentumun yavaşlamasına dikkat etmeli. Bu seviyeleri doğrudan Deriv MT5 üzerinde izleyebilir veya Deriv Trading Calculator kullanarak metaller ve endeksler arasında pozisyon planlamak için marjin ve risk ayarlarıyla deney yapabilirsiniz.
Altın yatırım görünümü
- Kısa vadeli tüccarlar: Fed’in Aralık kararı öncesinde 4.100–4.200 dolar aralığı izlenecek ana bant.
- Orta vadeli yatırımcılar: Mali stres, reel getiri volatilitesi ve Hindistan talebi devam eden güç için temel sürücüler.
Portföy yöneticileri: Altının hisse senetleriyle gelişen korelasyonu, artık saf bir koruma değil, politika duyarlı paralel bir varlık olarak hareket ettiğini gösteriyor. Çeşitlendirme stratejileri bu yapısal değişikliği dikkate almalı.

Can a tariff dividend create a new liquidity cycle for Bitcoin in 2025?
Analysts suggest that President Donald Trump’s proposed $2,000 “tariff dividend” has fuelled a wave of market optimism rather than a genuine injection of liquidity.
Yes - but only in sentiment, not in substance. Analysts suggest that President Donald Trump’s proposed $2,000 “tariff dividend” has fuelled a wave of market optimism rather than a genuine injection of liquidity.
The announcement triggered a short-lived crypto rebound, lifting Bitcoin back above $104,000, as traders drew parallels with the 2020 pandemic payments that helped fuel the last major bull run. Yet with limited fiscal backing and political obstacles, many believe this rally may be driven more by sentiment than by substance.
Key takeaways
- Trump’s $2,000 “tariff dividend” prompted a brief rally in Bitcoin and Ethereum, despite serious doubts over its feasibility.
- Funding gap: The proposed payout would cost around $300 billion, but tariff revenues generate only about $90 billion net.
- Institutional demand remains strong, with $2.7 billion in ETF inflows and BlackRock’s IBIT managing close to $100 billion in BTC.
- The Federal Reserve’s 25-basis-point rate cut and improved risk appetite continue to support Bitcoin above the $100K mark.
- Analysts see two paths: A climb towards $120K–$125K if optimism holds, or a slide below $100K once political enthusiasm fades.
- Crypto’s sensitivity to liquidity narratives underscores how sentiment - not policy - often leads market direction.
Trump’s tariff dividend promise and the market reaction
In a Truth Social post, President Trump claimed that the United States was generating “trillions of dollars” from tariffs and could use those funds to both reduce its $38 trillion national debt and finance a “dividend” for most Americans, excluding high earners.
The statement triggered a modest crypto rally as traders priced in the possibility of more household liquidity.
Markets quickly drew comparisons to the pandemic-era stimulus cheques that helped spark a historic bull market. Traders, long conditioned to respond to any hint of fresh money supply, reacted instinctively - even though the policy remains more political talking point than fiscal plan.
Why the maths don’t add up
Despite the excitement, the numbers simply do not work. Fiscal experts note that Trump cannot unilaterally authorise such payments; they require Congressional approval and a new funding bill.
The funding shortfall is also substantial:
- A $2,000 payment for 150 million adults would cost around $300 billion.
- Tariff collections to date total $120 billion, and after factoring in slower economic growth and lower tax receipts, net revenue sits closer to $90 billion.
As Erica York, Vice President of Federal Tax Policy, explained: “Each dollar raised through tariffs offsets about 24 cents in income and payroll tax revenue.” In short, the government lacks both the legal authority and the financial headroom to execute this plan, making any near-term payout highly unlikely.
Stimulus Déjà Vu: Why markets still care
The crypto rally reflects not fiscal reality but liquidity psychology. Even without concrete policy action, the mere suggestion of a “dividend” rekindles traders’ belief in free-flowing money and renewed risk-taking.
This mirrors 2020, when stimulus payments coincided with a surge in Bitcoin and altcoins as retail investors redirected government cheques into digital assets.

Although the scale is smaller this time, the pattern remains: crypto markets respond instantly to liquidity cues - whether real or imagined.
Bitcoin ETF inflows and structural strength
Beyond political headlines, Bitcoin’s structural outlook remains solid. Institutional inflows into U.S. spot Bitcoin ETFs exceeded $2.7 billion in early November, led by BlackRock’s IBIT and Fidelity’s FBTC. IBIT alone now holds $80.47 billion, cementing its position as the fastest-growing ETF in U.S. history.
Macroeconomic conditions are also supportive:
- The Federal Reserve’s 25-basis-point rate cut has lifted risk appetite.
- Trump’s pardon of Binance founder Changpeng Zhao signalled a more conciliatory stance towards crypto.
- Thailand and Malaysia are exploring the inclusion of Bitcoin in national reserves, marking a step towards mainstream adoption.
These developments indicate that even if Trump’s “dividend” proves politically untenable, the underlying liquidity narrative remains alive.
Market impact and price scenarios
If bullish sentiment and ETF inflows persist, Bitcoin could extend towards $120,000, driven by institutional accumulation and looser policy. However, should enthusiasm fade, a pullback below $100,000 remains a possibility as traders reassess the fundamentals.
So far, Bitcoin’s stability above $100,000 reflects confidence from institutional investors - although analysts warn that the rally is driven more by belief than by financial logic.
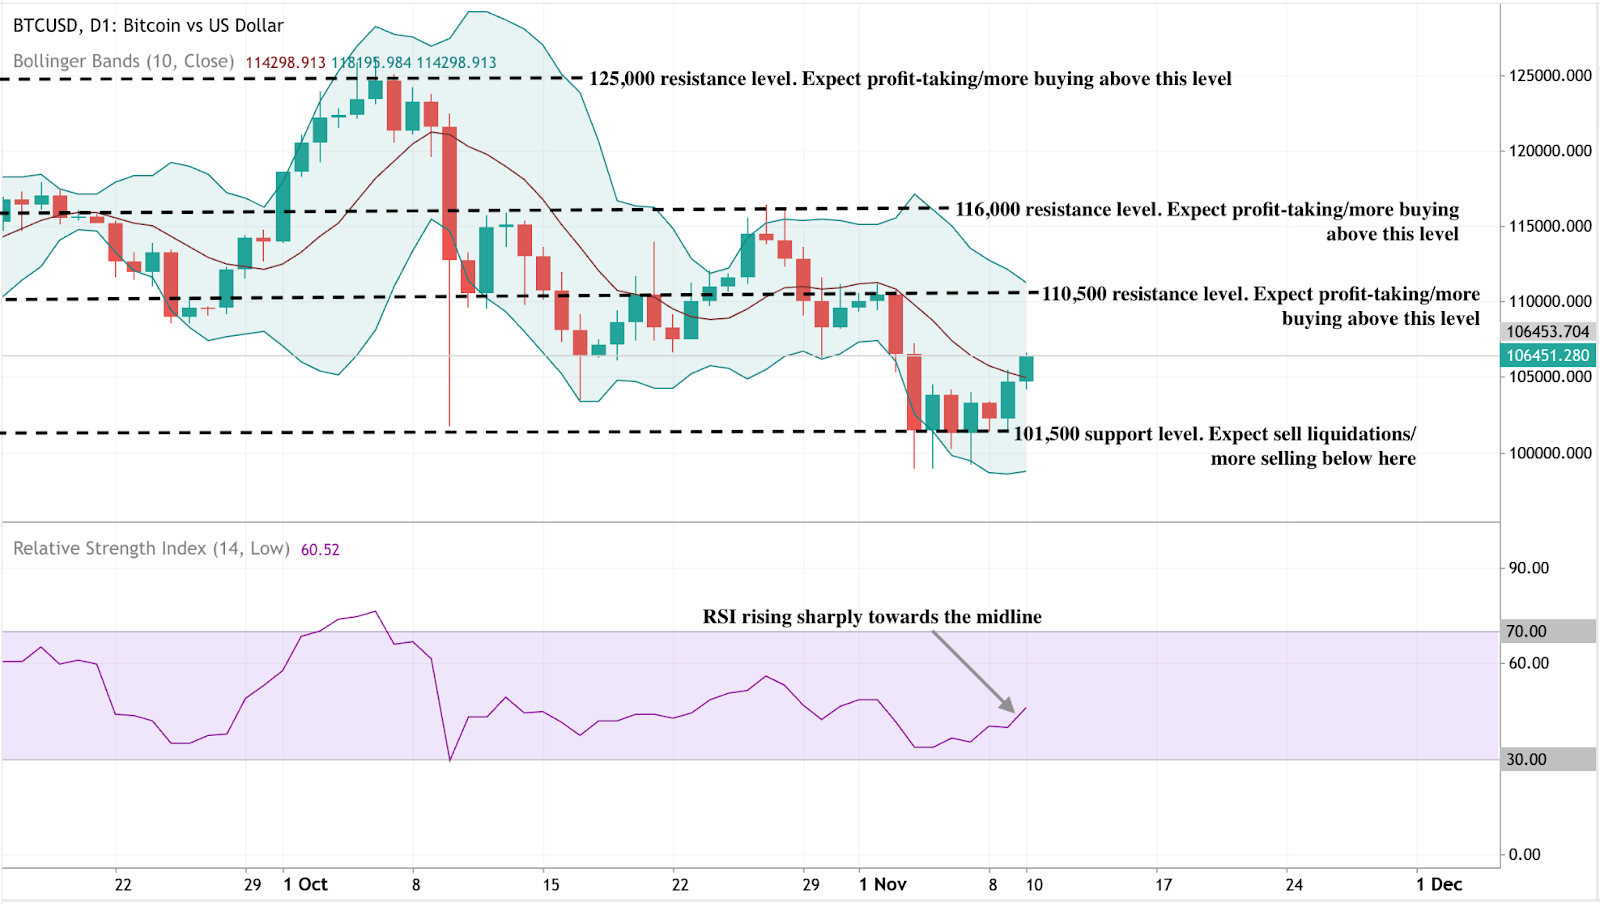
Bitcoin technical insights
Bitcoin’s price action shows early signs of recovery after holding above the key $101,500 support level, where sellers appear to have exhausted their momentum. This level remains crucial - a decisive break below could trigger further liquidations. On the upside, $110,500 serves as the first major resistance, followed by $116,000 and $125,000, where profit-taking is likely to intensify.
The Bollinger Bands are beginning to narrow after a period of strong volatility, suggesting potential consolidation before the next breakout. The price is also attempting to climb back toward the middle band (the 10-day moving average), signalling an improving short-term outlook.
Meanwhile, the RSI (14) has risen sharply to around 60, pointing to strengthening bullish momentum without yet entering overbought territory. If RSI continues upward past 60–70, it would confirm a shift in market sentiment toward renewed buying pressure.
Investment implications
For traders, sentiment remains the main short-term driver. Bitcoin’s $100K level represents the critical dividing line between bullish conviction and renewed caution.
Those trading crypto through Deriv MT5 can access advanced charting tools and cross-market analysis, making it easier to track correlations between Bitcoin, gold, and the U.S. dollar - especially during policy-driven volatility.
Meanwhile, traders can use the Deriv Trading Calculator to estimate potential profits, required margin, and swap rates before entering a position, ensuring tighter risk control in fast-moving conditions.
- Short term: Tactical buying opportunities exist above $102K–$104K if ETF inflows remain robust.
- Medium-term: Expect volatility tied to political announcements and monetary policy signals.
Long-term: Institutional accumulation and steady global adoption continue to underpin a structurally bullish outlook, even if near-term hype cools.

Is Filecoin’s price surge the start of a broader crypto market recovery?
According to experts, Filecoin’s 50% surge could mark the early stages of a broader recovery across the cryptocurrency market, driven by renewed interest in utility-based blockchain assets.
According to experts, Filecoin’s 50% surge could mark the early stages of a broader recovery across the cryptocurrency market, driven by renewed interest in utility-based blockchain assets. The decentralised storage token’s sharp rebound above the $2 level has placed it at the forefront of the DePIN (Decentralised Physical Infrastructure Network) rally - a niche sector that has gained roughly 11% overall in recent days.
Analysts point to rising network activity, strong developer funding, and growing institutional focus on real-world blockchain utilities as reasons why Filecoin’s latest move may represent more than just a speculative bounce. Still, whether the rally extends further will depend on broader market sentiment and sustained adoption within the decentralised storage ecosystem.
Key takeaways
- Filecoin leads crypto recovery: Up over 50% in 24 hours, Filecoin is outperforming most major tokens and driving gains in the DePIN sector.
- DePIN sector strength: Decentralised infrastructure projects have collectively gained 11%, signalling investor interest in tokens with tangible use cases.
- Ecosystem investment expanding: Protocol Labs has launched RetroPGF Round 3, allocating 585,000 FIL to support developer projects from November 2024 to September 2025.
- Market capitalisation: Filecoin’s valuation now stands at $1.52 billion, ranking it among the top 50 public blockchains.
- A short-term focus on maintaining momentum above $2 could pave the way for a move to $3, a key technical resistance level.
- Long-term outlook: Experts see Filecoin as a leading project in the growing Web3 infrastructure and decentralised storage economy.
Filecoin rally leads the market’s structural recovery
Filecoin’s performance is part of a broader market trend where investors are shifting capital towards utility-based projects - tokens that provide real-world functionality. Within this trend, DePIN networks stand out. These projects bridge physical resources such as computing power, energy, and data storage with blockchain incentive mechanisms, creating measurable productivity within decentralised systems.
The DePIN sector’s 11% rise reflects a shift in sentiment from speculative trading towards functional blockchain services. Filecoin’s 50% rally to above $2.00 has cemented its status as the flagship token for decentralised storage and one of the strongest indicators that the market is rediscovering value in blockchain infrastructure.

Filecoin vs traditional cloud storage
Launched in October 2020 by Protocol Labs, Filecoin provides a peer-to-peer marketplace for data storage. It enables users to rent out unused hard drive space, earning FIL tokens in exchange. Unlike traditional storage services such as Google Drive, iCloud, or Dropbox, Filecoin’s system operates without a central authority - meaning that pricing, availability, and access are determined entirely by the network.
The system relies on two unique consensus mechanisms:
- Proof-of-Replication (PoRep): Verifies that storage providers hold exact copies of the data they claim to store.
- Proof-of-Spacetime (PoSt): Confirms that the data remains stored for the entire agreed period.
Together, these mechanisms make Filecoin’s network verifiable, secure, and tamper-resistant, addressing long-standing challenges in data storage trust and transparency.
Decentralised storage: From research to real-world impact
Filecoin’s origins date back to 2014, when Protocol Labs developed the InterPlanetary File System (IPFS) - a decentralised file-sharing protocol designed to replace centralised web servers. Filecoin was later introduced as the economic layer of IPFS, incentivising users to store and maintain data using blockchain rewards.
In August 2017, Filecoin completed one of the largest token offerings in crypto history, raising $257 million in its Initial Coin Offering (ICO). Major investors, including Sequoia Capital, Union Square Ventures, and Digital Currency Group, backed the project.
By the time its mainnet launched in October 2020, Filecoin had become one of the most anticipated blockchain networks globally. Its price soared to an all-time high of $236.97 in 2021 before correcting sharply alongside the broader market downturn. Despite that decline, the network has continued to expand and maintain strong developer interest, positioning it as one of the most credible decentralised storage solutions in the Web3 space.
Filecoin’s ecosystem expansion reinforces fundamentals
While price volatility has dominated headlines, Filecoin’s ecosystem growth has been quietly strengthening. Protocol Labs recently launched RetroPGF Round 3, allocating 585,000 FIL to projects that contributed to the ecosystem between late 2024 and 2025.
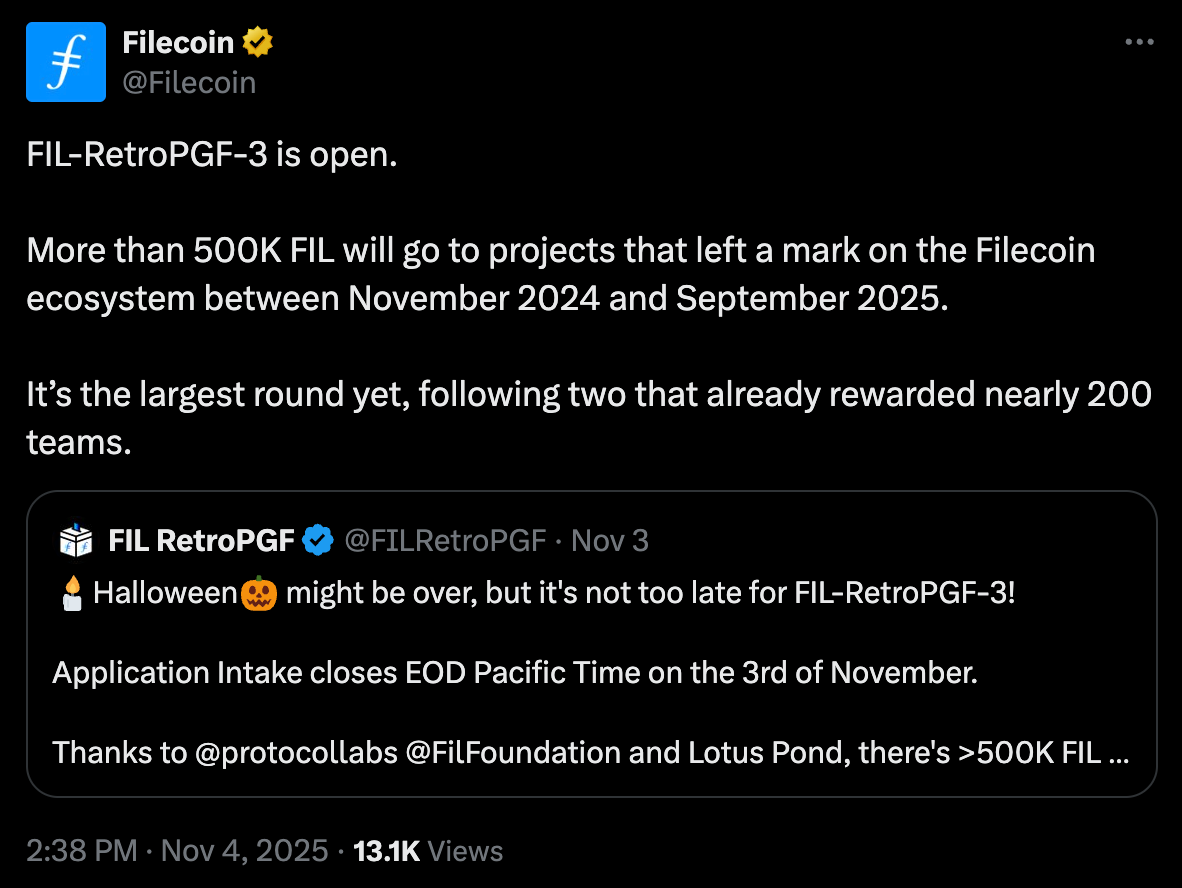
This round follows two earlier programmes that rewarded nearly 200 development teams, supporting innovations in decentralised computing, data retrieval, and dApp integration. The funding initiative underscores Filecoin’s commitment to sustainable growth - a key differentiator in a market often driven by short-term speculation.
Such ecosystem support not only encourages innovation but also signals confidence to institutional investors who are increasingly assessing Web3 infrastructure projects as long-term opportunities.
Market outlook: Can Filecoin sustain momentum?
Breaking past the $2 psychological level marks a pivotal moment for Filecoin. The next major resistance sits near $3, a level last tested in mid-2023. Technical analysts suggest that continued momentum could propel prices toward this mark if trading volumes remain high and the DePIN rally sustains.
However, Filecoin still trades far below its 2021 highs, underscoring both its potential for recovery and its vulnerability to market sentiment. Short-term corrections are possible as traders take profits, but experts say the latest surge is supported by more robust fundamentals than previous speculative rallies.
With a market cap of $1.52 billion and growing integration across decentralised applications, Filecoin is viewed as a key player in Web3’s evolving infrastructure layer. Its combination of utility, decentralisation, and developer support could allow it to benefit from the next major rotation into functional crypto assets.
Filecoin technical analysis
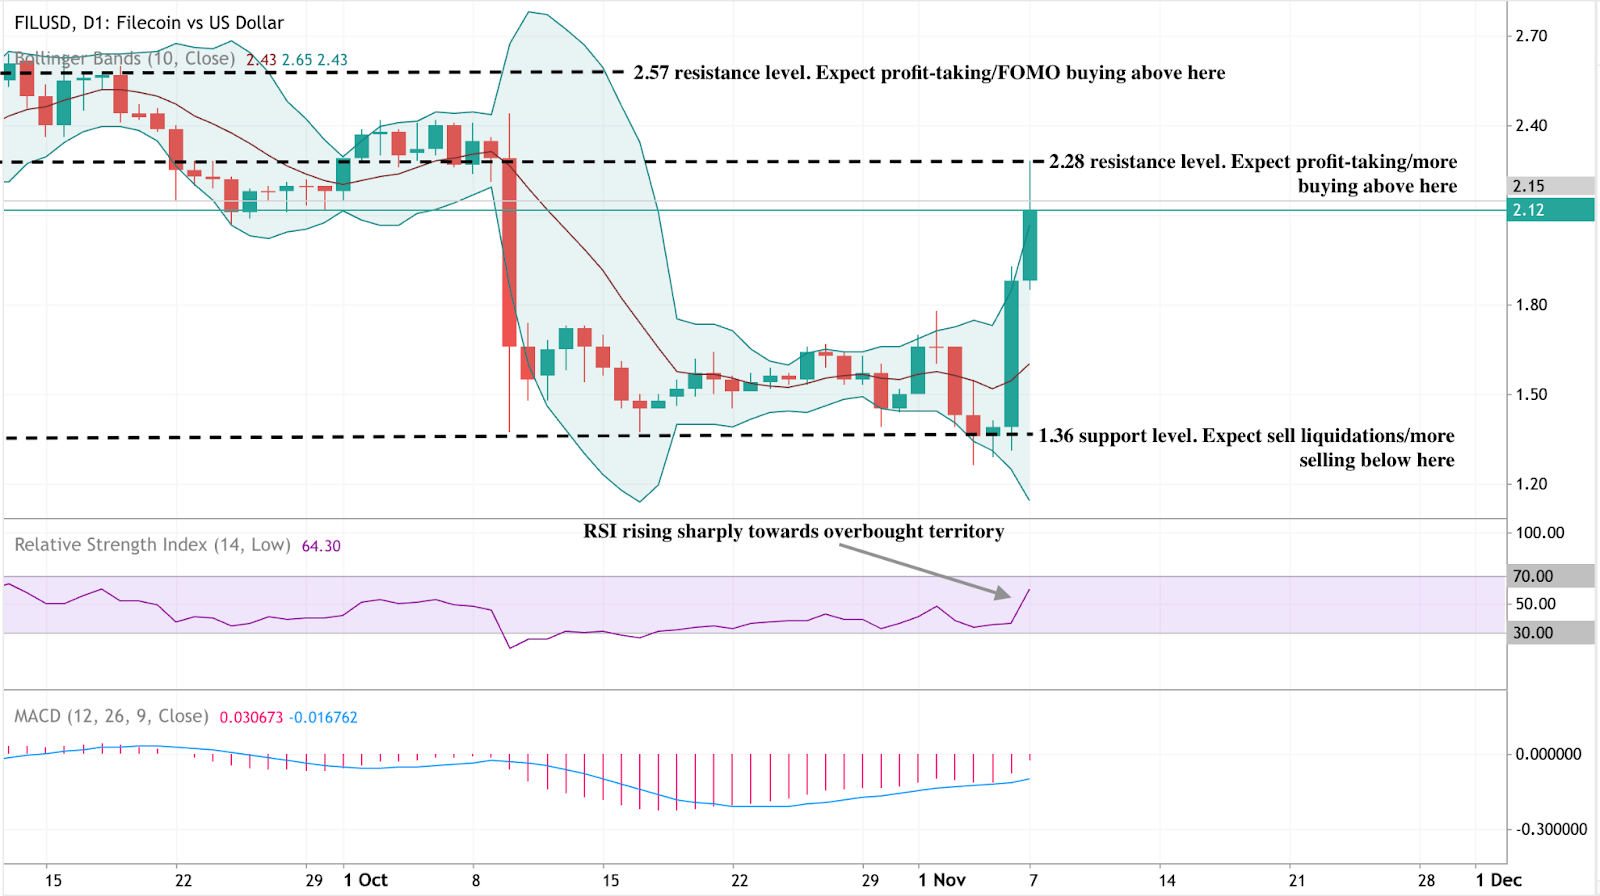
At the time of writing, Filecoin (FIL/USD) is trading around $2.12, extending its rally after rebounding from the $1.36 support level. The Bollinger Bands have expanded, reflecting heightened volatility, with price now testing the upper band - often a sign of short-term exhaustion. The RSI, at 64.3, is rising sharply toward the overbought zone, suggesting momentum remains strong but could soon face a cooling period.
Meanwhile, the MACD has turned positive with a fresh bullish crossover, reinforcing the current uptrend. However, traders should monitor momentum closely as the histogram begins to flatten. The next key resistance levels sit at $2.28 and $2.57, where profit-taking or renewed buying may occur. On the downside, $1.36 remains the critical support level - a break below it could trigger another wave of selling.
To explore and analyse these setups in real-time, traders can track Filecoin price action directly on Deriv MT5, which provides advanced charting tools, indicators, and multi-asset trading access for crypto, forex, and commodities markets.
Filecoin’s short-term outlook is bullish but nearing overbought territory, hinting at a potential cooldown if resistance levels hold.
Filecoin investment implications
For traders, Filecoin’s recent breakout offers short-term momentum opportunities above the $2 level, with upside potential towards $3 if DePIN sector strength continues. Caution remains warranted given crypto market volatility, but the technical setup favours buyers as long as Filecoin holds its newly reclaimed support zone.
For long-term investors, Filecoin stands out as one of the few blockchain networks with clear real-world use cases. Its robust developer base, institutional backing, and role in the decentralised data economy make it an appealing bet on the future of Web3 infrastructure.
Competition from centralised cloud giants and other blockchain storage protocols could cap growth if adoption plateaus. Filecoin’s success will depend on scaling efficiently, maintaining ecosystem incentives, and integrating more deeply into decentralised application frameworks.
Before entering Filecoin positions, traders can use the Deriv trading calculator to estimate potential profit and loss based on position size, leverage, and price movement - an essential tool for managing risk in volatile crypto markets.
Trading Filecoin on Deriv
- Momentum trading: Traders can use RSI and MACD crossovers on Deriv MT5 to capture short bursts of volatility during rallies above key breakout levels.
- Range trading: When Filecoin consolidates between $1.80–$2.50, short-term traders may use Bollinger Band reversals to enter positions at range extremes.
- Breakout strategy: A sustained move above $2.57 could signal a new bullish leg toward $3.00 - traders can confirm signals using MT5’s volume indicators and EMA crossovers.

How Solana’s real-world integrations are redefining crypto in 2025
From institutional ETFs to payment infrastructure and decentralised finance (DeFi) applications, Solana is reshaping what it means for a blockchain to operate at scale in 2025.
Solana’s expanding real-world integrations - ranging from institutional ETFs to payment infrastructure and decentralised finance (DeFi) applications - are redefining what it means for a blockchain to operate at scale in 2025. The network’s steady ETF inflows, validator reforms, and partnership activity show that Solana’s growth story is no longer simply about price volatility; it is about building financial and operational depth across both on-chain and institutional layers.
Key takeaways
- Institutional inflows remain steady: Solana ETFs have recorded six consecutive days of positive inflows, signalling confidence from long-term investors.
- Retail activity returns: Futures open interest has climbed to $7.64 billion, up 2.73% in 24 hours, while funding rates have turned positive - a sign of renewed retail optimism.
- Real-world integration grows: Solana is under evaluation for Western Union’s blockchain-based remittance pilot, positioning it for mainstream financial use.
- Network efficiency improves: Validator count has fallen 64% since early 2023, yet performance has strengthened as outdated operators were removed.
- Liquidity risks persist: Despite Solana total value locked (TVL) rising to $10.2 billion, stablecoin liquidity has declined 8.16% in a week - a warning for on-chain demand.
Solana institutional investment anchors Solana’s 2025 momentum
Institutional interest has become the foundation of Solana’s resilience this year. The Bitwise Solana Staking ETF (BSOL) drew $417 million in its debut week - outpacing even Bitcoin and Ethereum products - while the Grayscale Solana Trust (GSOL) attracted more than $1 million on its first day.
This consistent flow marks Solana’s shift from speculative trade to structured investment vehicle. For the sixth consecutive day, Solana ETFs have reported net inflows totalling $9.7 million mid-week, as professional investors position for long-term exposure despite macroeconomic uncertainty.
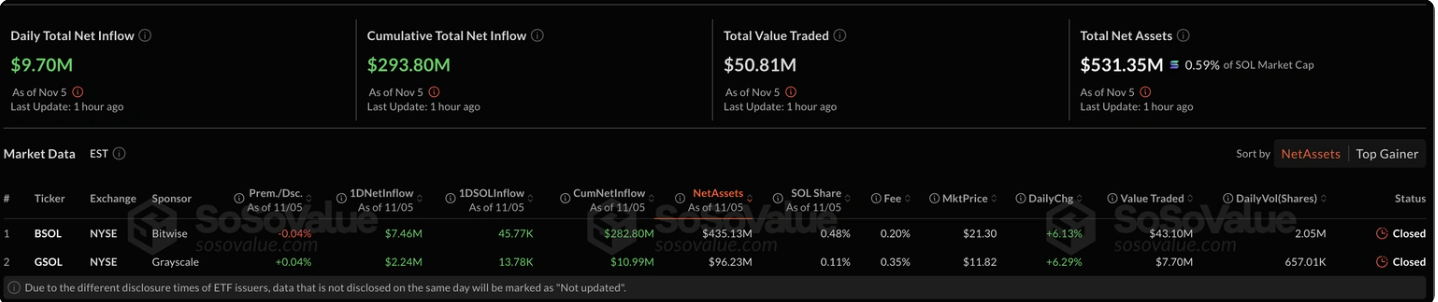
The rise of ETFs also introduces new liquidity and transparency. Each inflow represents a vote of confidence in Solana’s sustainability, particularly significant in a market shaped by cautious institutional allocators following the turbulence of 2022–23.
Solana retail traders re-engage as on-chain data strengthens
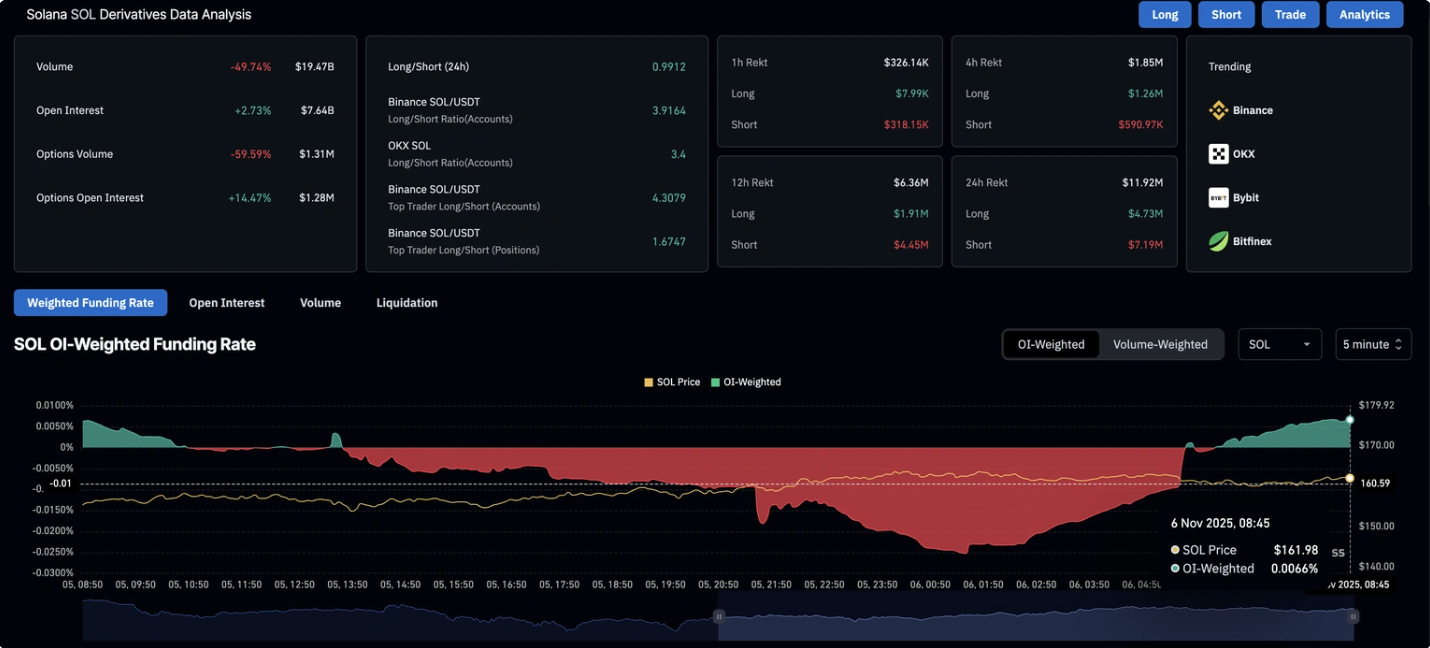
Following a weak start to the week, retail interest in Solana has picked up. According to CoinGlass, open interest in Solana futures increased 2.73% within 24 hours, and funding rates flipped from negative to positive territory. This indicates an expansion in leveraged long positions as traders bet on a continued rebound from the $155 support zone, with potential tests at $174–$177.
Short liquidations totaling $7.19 million exceeded long liquidations of $4.73 million, indicating that bearish positions were squeezed out and adding upward pressure on the price. The long-to-short ratio of 0.9912 indicates a market leaning cautiously bullish, yet still balanced.
Solana validator reforms make the network leaner and faster
Solana’s validator count has declined from around 2,500 to under 900 since 2023 - a 64% reduction - but this contraction reflects strategic consolidation rather than weakness. Many of the removed validators were outdated, slow, or linked to exploitative trading behaviours such as “sandwich” attacks.
The Solana Foundation has restructured its subsidy programme, now removing three subsidised validators for every new one added. The result: lower congestion, smoother transaction flow, and a healthier infrastructure.
As Tomas Eminger, Chief Infrastructure Officer at RockawayX, noted, this shift improves hardware quality and eliminates inefficiencies that previously slowed the network.
Solana real-world adoption: From DeFi to payments
Beyond market speculation, Solana is strengthening its institutional relevance through real-world adoption. Western Union has officially partnered with Solana to develop and test blockchain-powered cross-border transfer systems.
If adopted, the integration could channel significant transactional volume through Solana’s ecosystem, lifting both TVL and stablecoin demand. Simultaneously, developers are expanding Solana’s DeFi and asset-listing infrastructure:
- New perpetual markets are live.
- Launchpads are enabling faster token distribution.
- A revised asset-listing process simplifies onboarding for fintech and DeFi projects.
Together, these improvements suggest that Solana’s next growth phase will be driven less by speculative yield-farming and more by functional adoption - a shift reminiscent of how cloud computing matured from experimentation to enterprise utility.
Solana’s liquidity constraints: The risk beneath the rally
Despite these advances, the network faces liquidity constraints. DeFiLlama data shows Solana’s TVL rose 2.27% in 24 hours to $10.215 billion, but its stablecoin market capitalisation fell 8.16% over the week to $13.816 billion.

Falling stablecoin liquidity often signals shrinking capital reserves for decentralised applications, potentially reducing on-chain activity even as price metrics remain elevated.
If this decline continues, Solana may require stronger external inflows, such as ETF-driven liquidity or new payment-related transactions, to sustain ecosystem growth.
Comparing Solana’s institutional path to gold’s macro role
Solana’s 2025 performance mirrors gold’s cautious yet persistent rally amid uncertainty from the Federal Reserve. Both assets now reflect investor demand for alternatives that combine liquidity with long-term value preservation.
Just as gold ETFs legitimised physical gold as a mainstream portfolio component in the early 2000s, Solana’s regulated ETFs are giving institutions a compliant channel to access crypto exposure.
If the Fed’s December meeting signals prolonged policy tightness, risk assets could falter - yet steady institutional inflows suggest Solana is maturing into a digital asset capable of weathering policy-driven volatility.
Solana trading strategies on Deriv
- Breakout trading: Use Bollinger Bands or trendlines on Deriv MT5 to identify volatility-driven price movements. A confirmed breakout above resistance levels, such as $178 could indicate a bullish momentum continuation.
- Swing trading: Analyse Solana’s RSI and moving averages to time short- to medium-term entries. Combining this with the Deriv Trading Calculator can help manage position sizes and margin efficiently.
- Range trading: During consolidation, consider buying near support and selling near resistance using smaller lot sizes to manage risk effectively.
Deriv provides tight spreads, flexible leverage, and 24/7 access to crypto markets, allowing traders to act swiftly as Solana’s price responds to institutional flows or network developments.
Solana technical insights
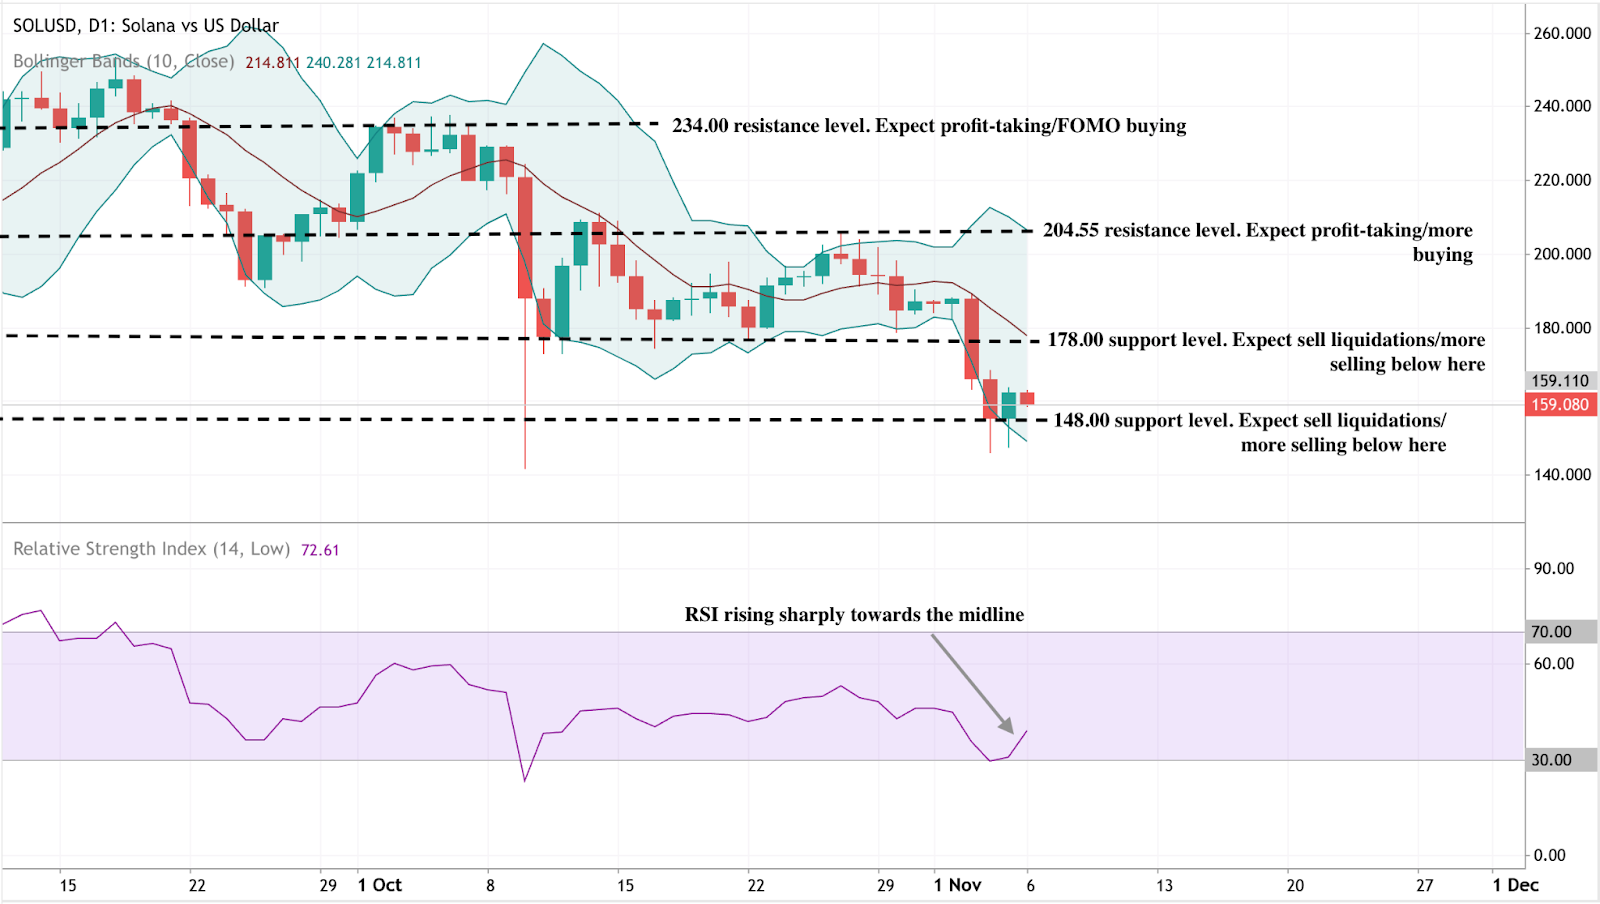
Solana is consolidating around $159 after bouncing from the $148 support, a key level where further sell-offs could accelerate if breached. The RSI at 72.6 is rising sharply towards the midline, signalling improving momentum and the potential for a short-term rebound.
The Bollinger Bands indicate that the price is hugging the lower band, suggesting oversold conditions with room for mean reversion if buying pressure strengthens. Immediate resistance lies at $178, followed by $204.55, where profit-taking is likely. A sustained break above $178 could signal a move towards $200–$210, while a failure to hold $148 risks a slide towards $135.
For traders interested in capitalising on such opportunities, Solana CFDs are available on Deriv MT5.
Solana price prediction and investment outlook
For portfolio managers, Solana’s transformation signals a gradual shift from a speculative token to an institutional-grade digital infrastructure.
- In the short term, price performance may remain tied to macroeconomic sentiment and ETF flows.
- Medium-term: The adoption of payment rails and DeFi applications could deepen liquidity.
- In the long term, continued integration with global finance and efficient network scaling may establish Solana as one of the few crypto assets offering both utility and institutional credibility.
In 2025, the real story is not the daily price chart - it is the quiet institutional infrastructure forming beneath it.

Ethereum price crash: Are we in a crypto winter or just a profit-taking phase?
Ethereum’s sharp fall below $3,500 looks less like the beginning of a crypto winter and more like a large-scale profit-taking reset.
Ethereum’s sharp fall below $3,500 looks less like the beginning of a crypto winter and more like a large-scale profit-taking reset. Data across on-chain, derivatives, and institutional flows suggest the market is undergoing a correction after months of aggressive gains, rather than entering a prolonged bearish cycle.
While retail traders and exchange-traded funds (ETFs) are showing fear, whales and institutional treasuries are using the pullback to accumulate - hinting that the current phase could set the foundation for a late-year recovery.
Key takeaways
- Ethereum trades at around $3,312, down 8.92% over the past month.
- Over $1.1 billion in leveraged positions were liquidated within 24 hours, as 303,000 traders were forced out.
- The Crypto Fear & Greed Index dropped to 20 (“Fear”), down from 59 (“Greed”) a month ago.
- Whale wallets added 1.64 million ETH (~$6.4 billion) in October, despite declining prices.
- The Fusaka hard fork upgrade scheduled for 3 December 2025 introduces PeerDAS, expected to cut Layer-2 fees by up to 95%.
- November has historically been Ethereum’s best-performing month, with an average return of +6.9% over the past eight years.
Crypto Market sentiment turns fearful
The Crypto Fear and Greed Index has plunged to 20, signaling widespread unease among investors.
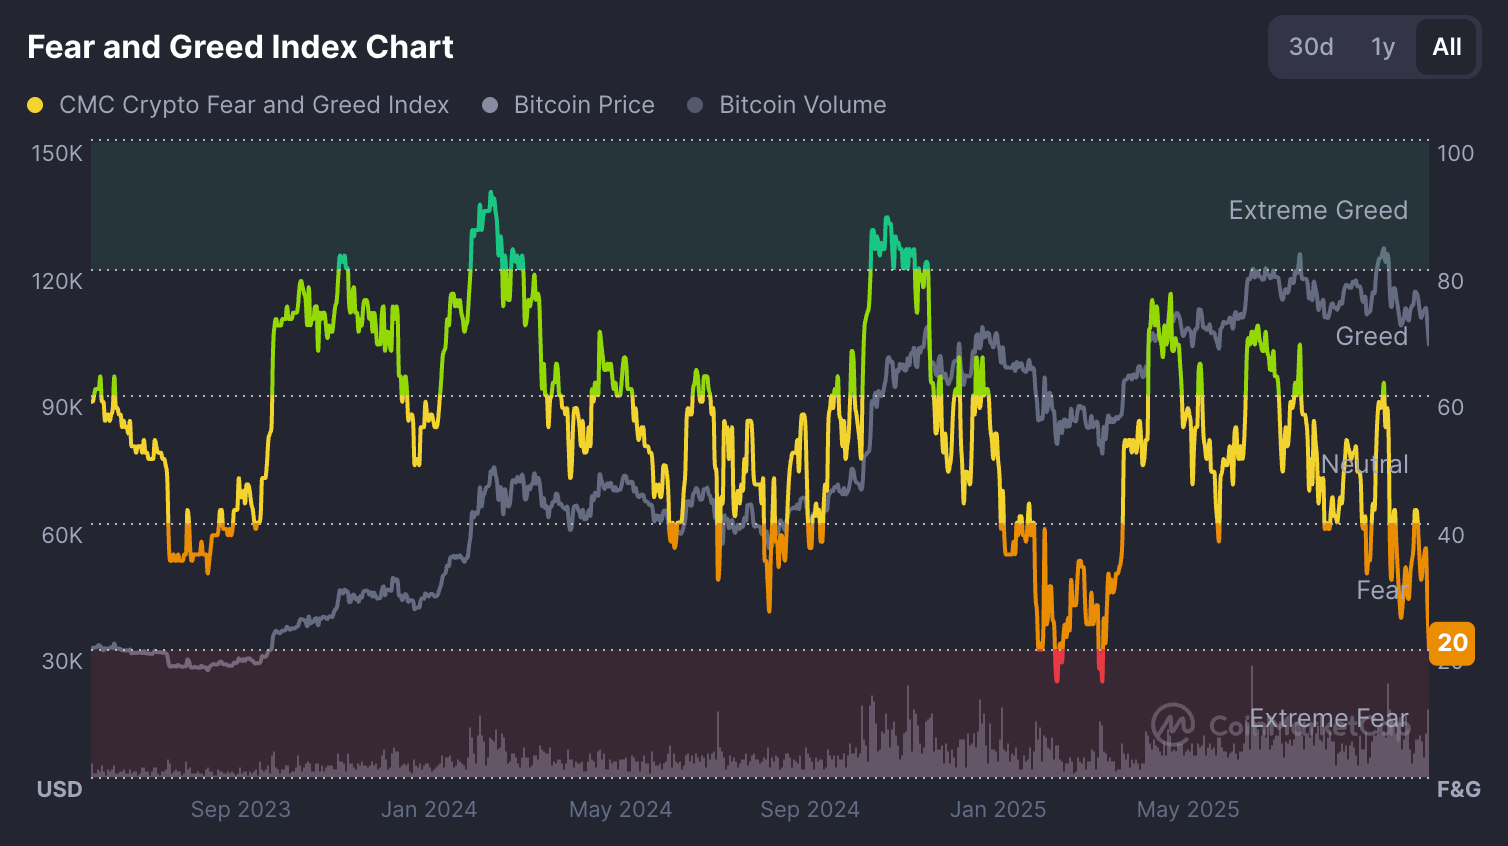
Just a month ago, readings above 50 showed moderate greed. The shift underscores a dramatic shift in sentiment as traders move from optimism to caution.
Across the broader market, nearly every major asset has turned red. Bitcoin fell 2.8% to $104,577, Solana dropped 11%, BNB lost 8.3%, XRP fell 6.7%, and Cardano slid 7.4% in the past 24 hours. The total cryptocurrency market cap has slipped 4% daily, erasing over $140 billion in value.
The macro backdrop compounds the pressure. The Federal Reserve’s uncertain rate outlook and a strengthening U.S. dollar are draining liquidity from risk assets - a dynamic often associated with crypto drawdowns.
ETH Whale accumulation intensifies while retail retreats
While fear dominates headlines, blockchain data reveals that the largest holders are quietly accumulating Ethereum. According to analytics firm Santiment, wallets holding between 1,000 and 100,000 ETH increased their balance from 99.28 million to 100.92 million ETH during the month of October.

This buying occurred even as Ethereum fell around 7% that month - a strong sign that institutional and high-net-worth investors view current prices as attractive entry points.
In contrast, long-term retail accumulation has slowed. Glassnode data show that the Holder Accumulation Ratio has declined from 31.27% to 30.45% since late October.
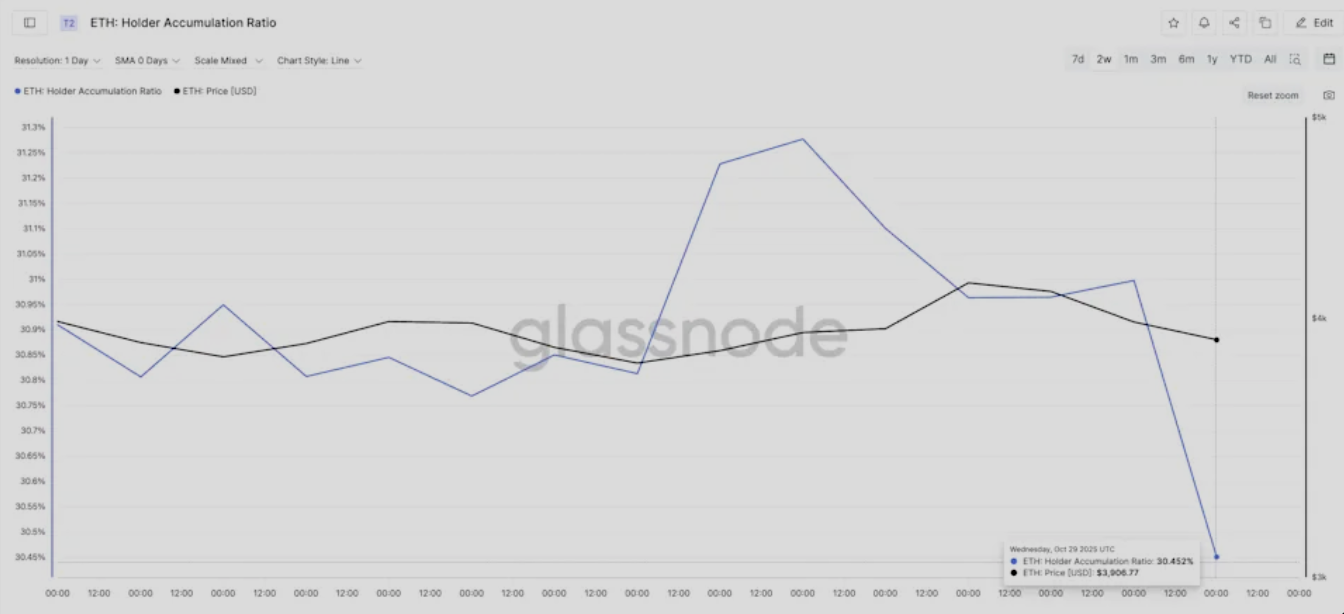
Retail investors are reducing exposure, waiting for clearer signals before re-entering. This divergence between whale buying and retail caution has become the defining feature of the current correction.
Institutional positioning: ETFs and treasuries diverge
Institutional flows paint a mixed picture. On the one hand, U.S. spot Ethereum ETFs experienced $135.76 million in outflows on 3 November.
- BlackRock’s ETHA: −$81.7 million
- Fidelity’s FETH: −$25.1 million
- Grayscale’s ETHE: −$15 million
These redemptions came alongside $186.5 million in Bitcoin ETF outflows, as institutional desks reduced exposure amid heightened volatility.
On the other hand, corporate treasuries are accumulating. Publicly traded BitMine Immersion Technologies (BMNR) added 82,353 ETH last week - worth roughly $294 million - bringing its total holdings to 3.39 million ETH, or 2.8% of Ethereum’s circulating supply. The company’s average purchase price stands around $3,909, suggesting confidence in long-term upside.
BMNR’s chairman, Tom Lee, told CNBC that the market is “consolidating after a reset,” adding that fundamentals such as stablecoin volume and application revenues are at all-time highs. Lee predicts a possible rally toward $7,000 for Ethereum before the end of the year, framing current conditions as a healthy correction rather than a crisis.
Liquidations reveal a market reset
The most dramatic signal of the correction came from the derivatives market. Data from Coinglass shows that over 303,000 traders were liquidated in just 24 hours, resulting in a total of $1.1 billion in forced positions. Within a single hour, more than $300 million was wiped out - $287 million of which were long positions.
This scale of liquidation reveals how over-leveraged bullish bets unraveled once prices broke below key support levels. Ethereum and Bitcoin accounted for the bulk of the wipeout, while high-beta altcoins like Solana and BNB saw even sharper declines.
The outcome is paradoxically constructive: leverage has been purged, funding rates have normalised, and open interest now reflects disciplined accumulation rather than speculative excess. Ethereum’s open interest remains high at $19.9 billion, but funding rates are flat - an equilibrium that often precedes a more stable recovery phase.
Fusaka upgrade offers long-term optimism
While short-term traders react to price volatility, developers are preparing for one of Ethereum’s most ambitious upgrades yet.
The Fusaka hard fork, confirmed for 3 December 2025, introduces Peer Data Availability Sampling (PeerDAS) - a technology that increases block capacity from 6 to 48 per block. This upgrade could reduce Layer-2 transaction fees by up to 95%, significantly improving scalability for DeFi and rollup networks.
Such infrastructure improvements strengthen Ethereum’s long-term competitiveness against alternative Layer-1 chains. With stablecoin transactions on Ethereum hitting $2.8 trillion in October, network fundamentals remain robust despite price turbulence.
Ethereum’s November historical pattern: a bullish bias
Seasonality may soon lend support. Over the past eight years, Ethereum has averaged a monthly return of +6.9 % in November. In 2024, it recorded a remarkable 47.4% rally, marking one of its strongest months ever.
The Net Unrealised Profit/Loss (NUPL) ratio - which measures the percentage of investors in profit - has fallen from 0.43 to 0.39, near the monthly low of 0.38 that last triggered a 13% rebound from $3,750 to $4,240.
This trend suggests selling pressure may be fading as investor incentives to take profits decline.
Macro context: profit-taking, not panic
Ethereum’s downturn mirrors the broader behavior of risk assets. After months of double-digit gains across cryptocurrencies, profit-taking has accelerated amid global liquidity concerns. The U.S. dollar index strengthened sharply, and Fed officials have hinted at slower rate cuts, encouraging investors to rotate out of speculative assets.
Unlike prior bear-market conditions, however, there is no collapse in network activity or developer engagement. DeFi revenue remains strong, stablecoin velocity is high, and whale inflows indicate rotation rather than retreat. The sell-off, therefore, aligns more with profit-locking behavior than the sustained capital flight that characterised the 2022–2023 crypto winter.
Traders on Deriv MT5 can track these shifts across multiple assets, from cryptocurrencies to forex, to gauge broader market sentiment in real-time.
Ethereum technical insights: Stabilisation vs. further weakness

Ethereum is currently trading near $3,313, rebounding after a sharp decline that tested the $3,745 support level. This zone has acted as a key area where sell liquidations intensified, but the recent bounce suggests early signs of buyer interest.
The Bollinger Bands have widened significantly, indicating elevated volatility, while price action remains near the lower band - typically a sign of short-term oversold conditions. A sustained close above the middle band could confirm a recovery in momentum.
Meanwhile, the Relative Strength Index (RSI) has risen sharply from 33, signaling improving bullish momentum after near-oversold readings. A further RSI move above 50 would reinforce a potential short-term reversal.
Resistance levels remain at $4,250 (where profit-taking and more buying may emerge) and $4,700, marking a stronger ceiling for any extended rally. Overall, ETH shows early signs of recovery but still faces strong resistance ahead.
The near-term outlook depends on whether ETF outflows stabilise and whether the whale accumulation trend continues through November. With fear levels elevated, contrarian traders are closely watching for a potential bottoming process similar to past mid-cycle corrections. The Deriv trading calculator can help traders assess potential profit and margin exposure before taking positions in such volatile environments.
Ethereum investment implications
For short-term traders, Ethereum’s setup suggests a high-volatility environment with tactical entry opportunities near the $3,500–$3,700 support range. Upside targets into December sit between $4,400 and $4,600, assuming sentiment stabilises and ETF outflows slow.
For medium-term investors, current levels represent an accumulation window. Whale buying, the Fusaka upgrade, and seasonal patterns point to improving fundamentals beneath the surface fear. Institutional participation is likely to return once macroeconomic uncertainty eases and on-chain stability confirms a bottom.
In essence, Ethereum’s decline is a market normalisation, not a meltdown. As leverage unwinds and fundamentals strengthen, the groundwork for the next leg higher may already be forming.

Coffee price forecast: Can U.S. trade talks cool a weather-fuelled rally?
Arabica coffee futures remain caught between drought in Brazil and tariffs in Washington.
Arabica coffee futures remain caught between drought in Brazil and tariffs in Washington. Until either rainfall normalises or a U.S.–Brazil trade deal removes the 50% import duty, prices are likely to stay near multi-month highs. A continued supply squeeze could lift Arabica above $425, while quick diplomatic progress or heavier rains could drag it back toward $380.
Key takeaways
- Brazil’s Minas Gerais drought has cut rainfall to 75 % of normal, the latest in a string of dry years.
- Vietnam’s crop risk from Typhoons Kalmaegi and Fengshen threatens robusta output in the Central Highlands.
- U.S. tariffs on Brazilian coffee have pushed exchange inventories to their lowest since 2024.
- Vietnam logged a record US$8.4 billion in exports, offsetting part of the global shortfall.
- La Niña probability of 71 % points to further dryness through early 2026.
- Global production ≠ ample supply: Arabica deficits persist despite record total output.
Brazil’s drought deepens the arabica deficit
Weather agency Somar Meteorologia reported Minas Gerais - the heart of Brazil’s arabica belt - received just 33 mm of rain in late October, barely three-quarters of the historical average, following a near-dry week earlier. The soil moisture deficit poses a threat to flowering and bean development for the 2026/27 crop.
NOAA’s September update lifted the probability of a La Niña event to 71%, reinforcing expectations of continued dryness across southern Brazil. Conab cut its 2025 arabica estimate by 4.9 % to 35.2 million bags, and total coffee output to 55.2 million bags. Years of sub-par rainfall have already reduced bean size and yields, creating what traders call a “climate premium” in arabica futures.
Trade barriers tighten U.S. supply
In July 2025, Washington imposed a 50 % tariff on Brazilian beans - part of a wider trade confrontation between Presidents Trump and Lula. Brazil supplies roughly a third of America’s unroasted coffee; the duty instantly disrupted shipments.
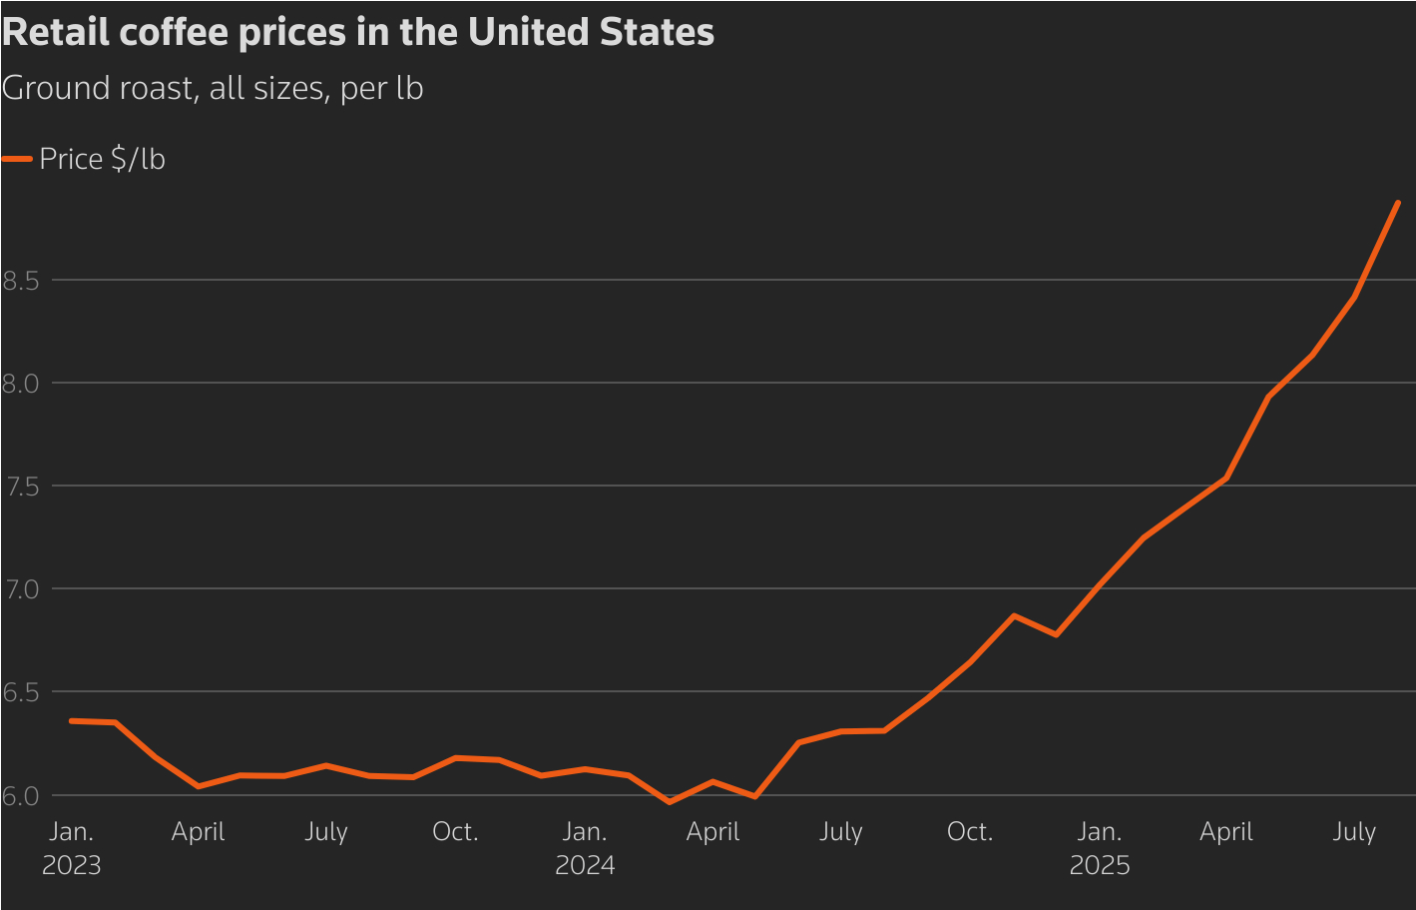
Importers rerouted cargoes to Canada, paid $20–25 per bag cancellation fees, or warehoused beans under bond in Florida to delay tax payment. ICE-monitored arabica stocks have since plummeted to a 1.75-year low of ≈ approximately 431,481 bags, while robusta holdings have declined to ≈ approximately 6,053 lots. Retail coffee prices in U.S. stores rose 41% year-over-year, adding to food inflation.
Both sides now signal progress: Trump described the latest meeting as “positive,” and Lula hinted at a “definitive solution” soon. Any rollback of tariffs would reopen the world’s largest consumer market and relieve U.S. roasters by mid-2026.
Vietnam’s robusta boom - and its limits
Vietnam has been the outlier in 2025’s volatile market. Exports for 2024–25 reached 1.5 million tonnes worth US$8.4 billion, up 55% in value despite minimal volume growth. Average prices jumped 52% to US$5,610 per tonne, reflecting the global supply squeeze.
Europe absorbed 47% of shipments, led by Germany, Italy, and Spain. Farm-gate prices around VND 116,000–118,000 per kg (≈ US$4.6) deliver strong profits, given production costs of VND 35,000–40,000.
However, Typhoons Kalmaegi and Fengshen threaten flooding and landslides in the Central Highlands. Vicofa forecasts a 5–10% increase in 2025/26 output, but warns that persistent storms or fertilizer shortages could reverse those gains. The sector’s new EU “low-risk” status on traceability protects access to European buyers but not against climate volatility.
To explore how traders can capitalise on such volatility, Deriv’s trading calculator help estimate margin and profit scenarios for coffee, gold, and oil positions.
Global production: Record high, but shortages remain
According to the USDA FAS, world coffee production for 2025/26 will reach a record 178.7 million bags (+2.5 %). Yet, arabica output is expected to fall 1.7% to 97 million bags, while robusta rises 7.9% to 81.7 million bags. Ending stocks are expected to rise 4.9% to 22.8 million bags, but this aggregate figure masks an arabica shortfall.
Trader Volcafe projects a global arabica deficit of 8.5 million bags - the fifth straight year of undersupply - wider than last season’s 5.5 million. Even with record totals, the quality mix and logistical bottlenecks leave roasters short of premium beans.
U.S. roasters face an expensive squeeze
American roasters, relying heavily on Brazilian arabica, are drawing down remaining inventories. Some redirected beans to Canada to avoid tariffs, incurring higher freight costs. Others cancelled shipments outright, paying penalty fees.
Small and mid-sized roasters report margins collapsing as replacement beans from Colombia and Mexico cost 10% more, while Brazilian beans - though cheaper - carry the 50% duty.

The ripple effect reaches consumers: a typical supermarket blend has risen from $ 6–7 to $11 per pack. The U.S. Labor Statistics Bureau links these increases directly to reduced imports and weather-related shortages. Analysts expect inventories to fall to 2.5–3 million bags by December, near critical levels.
Coffee price Market outlook
- Bullish scenario: Continued dryness, strong La Niña, and stalled trade talks push arabica through $425, extending the rally into early 2026.
- Base case: Partial tariff relief and modest rains keep prices range-bound $380–$420.
- Bearish scenario: Rapid trade détente plus Vietnam’s larger harvest could pull arabica back to $350–$370 by mid-2026.
Even in the bearish case, structural deficits and climate risks suggest the long-term floor is moving higher.
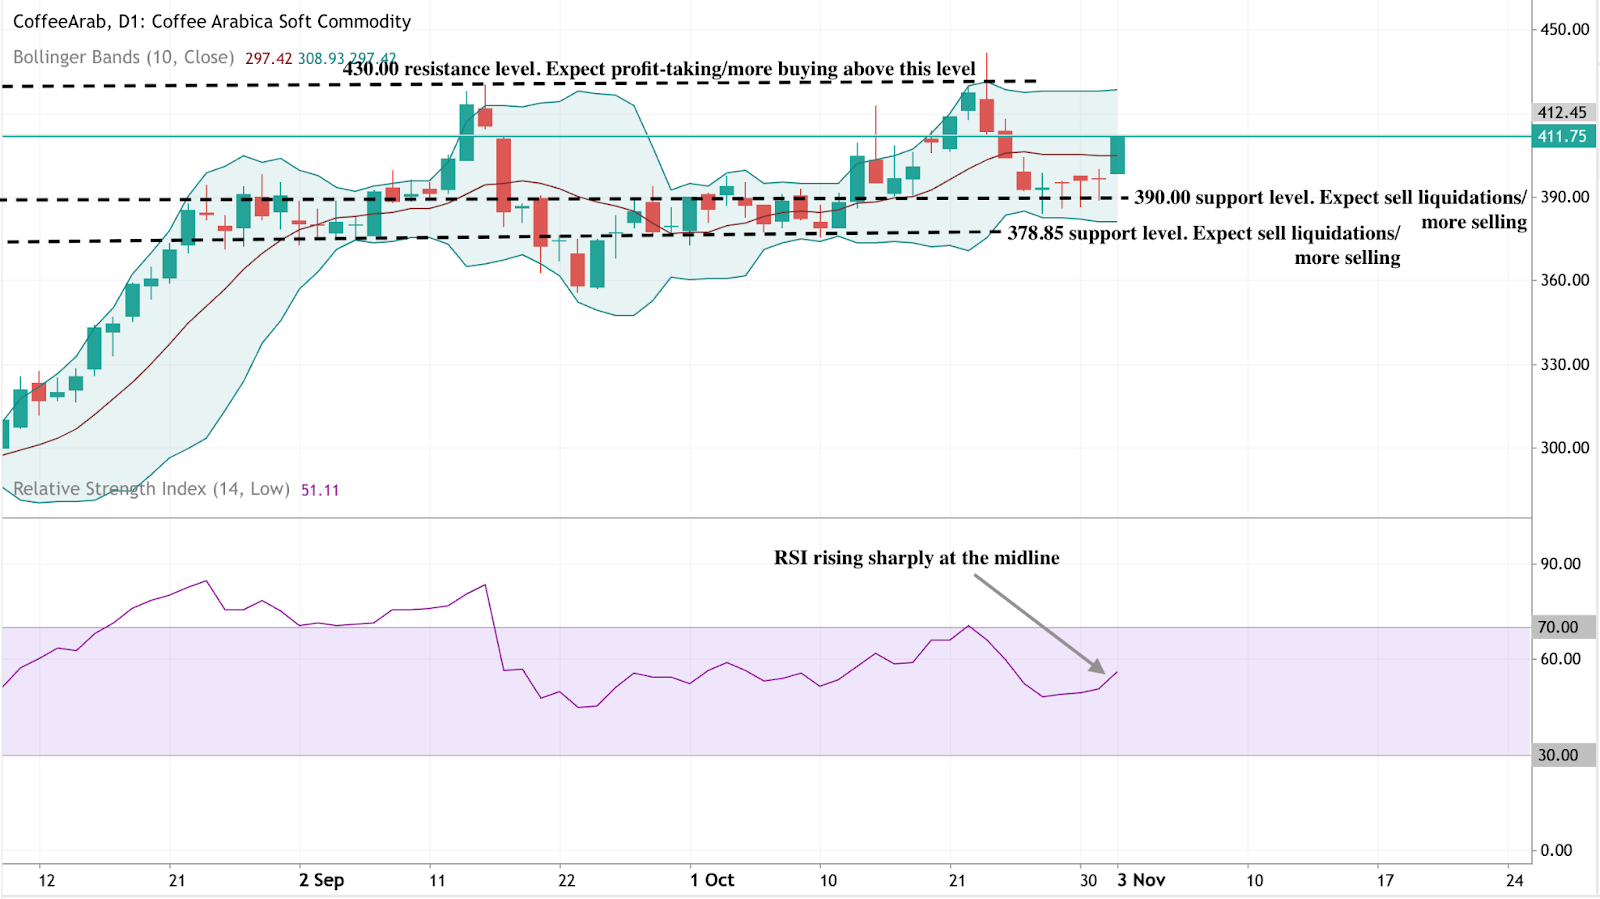
Coffee price technical analysis
Coffee Arabica prices are consolidating near $411.75, showing a mixed but slightly bullish setup. Bollinger Bands are moderately wide, indicating ongoing volatility. The latest candle is testing the upper mid-band, indicating potential for a short-term push higher if momentum persists.
The key resistance remains at $430.00, where previous rallies faced profit-taking. A decisive break above this could attract fresh buying pressure. On the downside, $390.00 and $378.85 serve as major support zones - a breach below either could trigger liquidation-driven selling.
RSI (14) currently sits around 51, rising sharply from the midline, implying improving bullish momentum but not yet in overbought territory. This reinforces the idea of a cautious recovery phase rather than a breakout trend.
Coffee price investment implications
For traders and investors, the near-term setup points to heightened volatility rather than a sustained correction.
- Short term: Price swings will hinge on U.S.–Brazil trade headlines and rainfall updates; speculative spikes above $425 remain possible.
- Medium-term: Monitor Vietnam’s harvest and La Niña developments, as both could reset the global supply balance.
- Long-term: Structural climate risk keeps the floor higher - arabica below $350 looks unlikely barring a policy breakthrough. Coffee’s current rally may cool, but the underlying heat - political and climatic - shows no sign of dissipating.
For traders seeking exposure, coffee CFDs are available on Deriv MT5, alongside other soft commodities and energy assets, such as gold and oil.

USD/JPY forecast: Inside the psychological battlefield driving the yen
The yen’s weakness reflects more than interest-rate differentials - it’s become a test of confidence in Japan’s policy credibility.
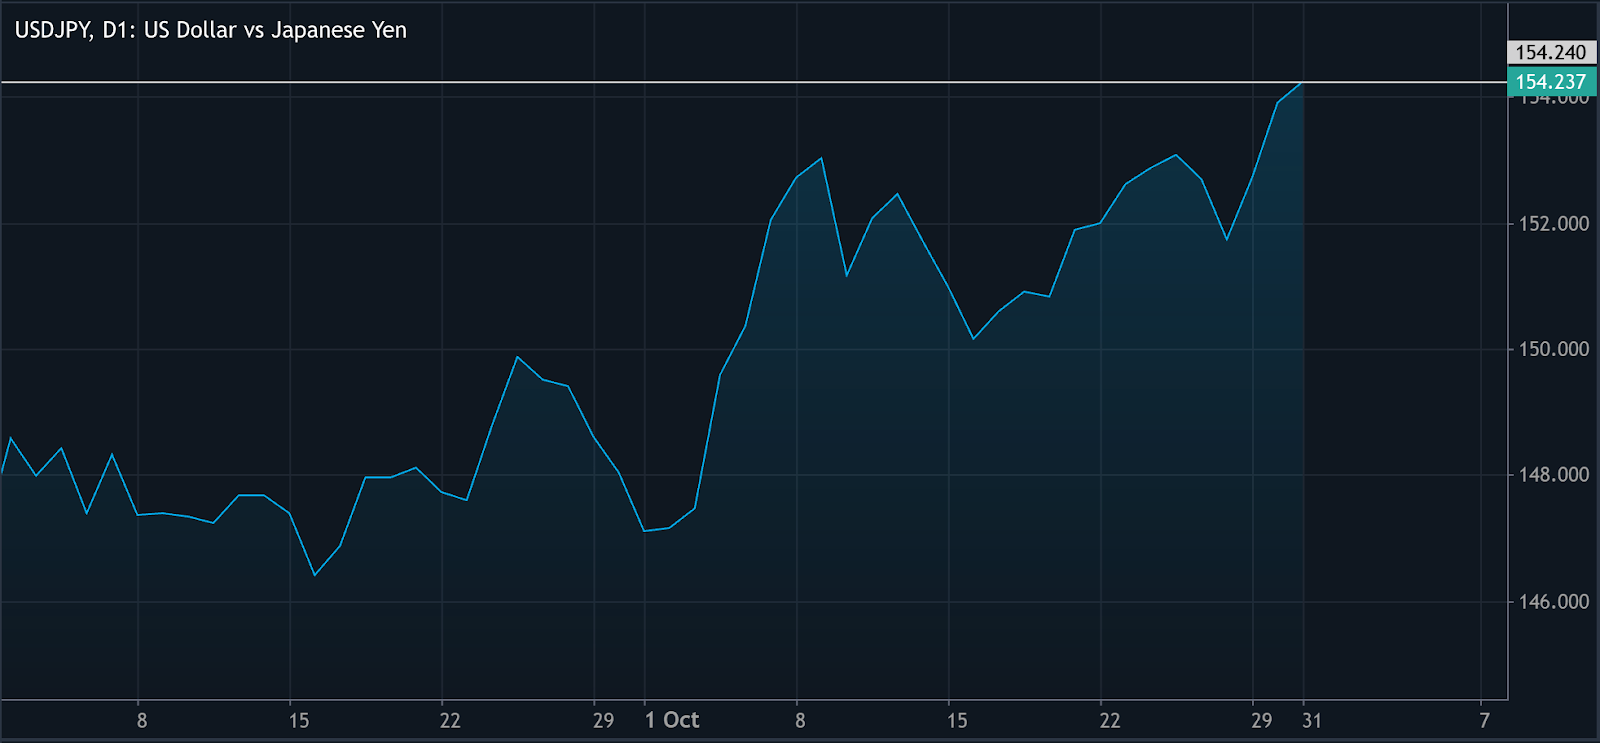
According to reports, USD/JPY’s surge past 154 per dollar underscores the growing divide between Japan’s cautious monetary policy and the U.S. Federal Reserve’s firmer stance. The yen’s weakness reflects more than interest-rate differentials - it’s become a test of confidence in Japan’s policy credibility.
Despite Tokyo’s inflation running above target and rising government concern, traders continue to test how far the Bank of Japan (BOJ) will allow the currency to slide. The central question: does the pair push toward 155, or does a BOJ policy pivot spark a sustained yen recovery?
Key takeaways
- BOJ inaction vs. Fed firmness: The BOJ kept rates steady, while Powell signalled that a December rate cut isn’t guaranteed - widening the yield gap.
- 154 as a market trigger: The level has become a psychological battleground for traders testing Japan’s tolerance for yen weakness.
- Inflation pressure builds: Tokyo CPI accelerated to 2.8% YoY, well above target, yet Ueda remains focused on wage growth before tightening.
- Government warnings lose bite: Finance Minister Katayama’s verbal interventions briefly supported the yen but failed to reverse sentiment.
- Risk of policy credibility erosion: Unless the BOJ takes decisive action, the yen could remain vulnerable to further depreciation and speculative pressure.
BOJ’s hesitation leads to Japanese yen weakness
The BOJ’s decision to keep rates unchanged reinforced market perceptions that Japan will stay behind the curve of global tightening. Governor Kazuo Ueda suggested a rate hike could come as soon as December, but stressed that sustained wage growth remains essential for policy normalisation.
In contrast, Federal Reserve Chair Jerome Powell’s cautious yet firm tone - hinting that another rate cut this year is not guaranteed - strengthened the dollar. This widening policy divergence continues to anchor USD/JPY above 154.
USD JPY at 154: Where psychology meets policy
The 154 level has evolved into a symbolic line between market conviction and policymaker caution, according to analysts. Traders recall previous interventions near similar levels and view 154 as the threshold of Tokyo’s tolerance.
Each government comment is now treated as a sentiment indicator rather than a credible warning. Brief yen recoveries after official remarks fade quickly without matching BOJ policy action. In this sense, the level represents a psychological battleground - one where traders, algorithms, and policymakers test each other’s resolve.
Japan inflation says “move”, policy says “wait”
Tokyo’s October CPI rose to 2.8% YoY, with core and core-core readings also above 2.8% - signalling broad-based inflation that’s been above the BOJ’s 2% target for over three years.

However, Ueda continues to emphasise wage-led inflation as the precondition for any tightening cycle. This cautious stance has created a credibility gap: inflation data suggest urgency, but policy rhetoric suggests patience. The result - investors perceive the BOJ as reluctant to respond decisively, reinforcing speculative yen selling.
Government warnings and the illusion of control
Finance Minister Satsuki Katayama’s recent warning that the government is monitoring FX moves with “a high sense of urgency” briefly lifted the yen to 153.65, before USD/JPY rebounded.
The move highlighted the short shelf-life of verbal interventions. Without direct market action, such warnings appear to acknowledge - rather than prevent - yen weakness. Tokyo’s “soft power” approach has lost influence, as markets now demand policy signals rather than rhetoric.
Traders weigh conviction vs caution in USD/JPY
Market participants see three potential paths ahead:
- Continuation: USD/JPY pushes through 155, forcing Tokyo’s hand on direct intervention.
- Correction: A surprise BOJ hike or coordinated move with U.S. authorities sparks a sharp yen rebound.
- Consolidation: The pair stabilises between 153–154, awaiting wage and inflation data.
Futures positioning shows speculative yen shorts at multi-month highs - meaning a sudden shift in sentiment could cause a fast, disorderly reversal.
Credibility becomes Japan’s real currency
Every move above 154 underscores a deeper issue: trust. The yen’s weakness now reflects investor scepticism about Japan’s willingness to tighten policy, not just interest-rate gaps.
Until the BOJ backs its rhetoric with action, markets will continue to test the limits of its tolerance, according to experts. The next 100 pips - between 154 and 155 - may determine whether Japan’s credibility holds or erodes further.
USD/JPY technical insight
At the time of writing, USD/JPY is trading around 154.28, hovering near its recent highs in what appears to be a price discovery phase. The pair has maintained a strong bullish momentum, riding the upper Bollinger Band - a sign of persistent buying pressure. However, such positioning often precedes short-term pullbacks as traders take profit.
The RSI is rising sharply toward overbought territory (above 70), suggesting that bullish momentum may be overextended. If RSI crosses into that zone, a corrective move could follow as buying enthusiasm cools.
Key downside levels to watch are 150.25 and 147.05, marked as notable support zones. A sustained break below 150.25 could trigger sell liquidations and accelerate downward momentum, while a deeper move under 147.05 would signal a broader shift in market sentiment.

USD/JPY investment implications
For traders, USD/JPY above 154 signals continued short-term bullish momentum for the dollar, underpinned by policy divergence.
- Short-term strategies may favour tactical long positions near support around 153.50–153.80, while monitoring for sudden verbal or direct intervention near 155.
- Medium-term investors should stay cautious. A surprise BOJ policy move or shift in Fed guidance could quickly unwind the trade.
- For portfolio managers, the yen’s volatility presents both carry trade opportunities and macro risk exposure, making Japan’s currency landscape the most psychologically charged market of 2025.
The key is to balance exposure by using Deriv’s trading calculators and position-sizing tools to manage risk in real-time.
Traders seeking to take advantage of the volatility can analyse setups on Deriv MT5 , where comprehensive charting and technical indicators support detailed yen analysis.

How the Fed rate cut affects gold’s outlook heading into December
While lower rates typically support gold by reducing the appeal of yield-bearing assets, Chair Jerome Powell’s cautious tone and the split vote have complicated the picture.
Gold is holding steady near the $4,000 mark after the U.S. Federal Reserve cut interest rates by 25 basis points to the 3.75%–4% range - a widely expected move that revealed deep divisions within the central bank.
While lower rates typically support gold by reducing the appeal of yield-bearing assets, Chair Jerome Powell’s cautious tone and the split vote have complicated the picture.
With Powell warning that another rate cut in December is “not a foregone conclusion,” traders are now caught between two outcomes: a break above $4,100 if economic data softens, or a correction toward $3,900 if the Fed turns hawkish in December.
Key takeaways
- The Fed cut rates by 25 bps to a 3.75%–4% target range - its second cut of 2025, but not unanimously.
- Stephen Miran voted for a 50 bps cut, while Jeffrey Schmid preferred no change, underscoring internal division.
- The statement described moderate growth, slower job gains, and inflation still “somewhat elevated.”
- The Fed will end balance sheet reduction on 1 December, signalling a quiet pivot toward neutral liquidity policy.
- Gold trades between $3,990–$4,010, as Powell’s comments temper expectations for further easing.
The Federal Reserve interest rate divided decision
The latest policy meeting ended with a split 10-2 vote, reflecting an increasingly fractured Federal Open Market Committee (FOMC). Most members supported a 25 bps reduction to cushion a cooling labour market, but dissent came from both directions.
- Governor Stephen Miran argued for a 50 bps cut, warning that slower job growth warranted stronger action.
- Kansas City Fed President Jeffrey Schmid, however, voted to hold rates steady, citing inflation that “remains somewhat elevated.”
The official statement struck a cautious tone, noting that “economic activity has been expanding at a moderate pace” while acknowledging “job gains have slowed this year and the unemployment rate has edged up but remained low.” Inflation, the Fed said, “has moved up since earlier in the year and remains somewhat elevated.”
This rare two-way dissent marks only the third time since 1990 that Fed policymakers disagreed in opposite directions - a sign of deep uncertainty about the economic outlook.
Powell’s message: a cut, not a pivot
At the press conference, Jerome Powell stressed that this was a “solid” move to support a gradually cooling economy - not the start of an aggressive easing cycle. He cautioned that “a further reduction in the policy rate at the December meeting is not a foregone conclusion. Far from it.”
Powell also pointed to the ongoing government shutdown, which has disrupted official data collection, making it harder for policymakers to gauge economic momentum.
“When you’re driving in the fog, you slow down,” he said - a metaphor for the Fed’s new watch-and-wait posture.
Markets, which had priced in another cut for December, were quick to adjust. Fed funds futures trimmed expectations for additional easing, gold pared gains, slipping back from intraday highs near $4,010 and the U.S. dollar index (DXY) rebounded.
The message was clear: policy is not on a preset course. This “pause disguised as a cut” has left gold traders uncertain whether to expect another round of support or a longer holding phase.
The quiet pivot: ending balance sheet reduction
Beyond the rate cut, one key line in the Fed statement went largely unnoticed: the Committee decided to conclude the reduction of its aggregate securities holdings on 1 December. This effectively ends the Fed’s multi-year quantitative tightening (QT) campaign - a significant shift in liquidity management.
The move suggests the central bank aims to stabilise money markets after signs of funding stress and preserve flexibility ahead of a potentially volatile election year.

In practice, ending QT means the Fed will reinvest maturing securities rather than shrinking its balance sheet, keeping liquidity conditions loose. For gold, that’s typically supportive: more liquidity tends to weaken real yields and boost demand for non-yielding assets like bullion. However, because Powell’s tone was measured and cautious, traders see this more as risk management than an outright pivot to stimulus.
Market reaction: volatility replaces certainty
Gold’s intraday performance captured the market’s confusion. The metal briefly rallied after the announcement, but quickly pulled back once Powell began speaking. As of late Wednesday, XAU/USD fluctuated between $3,990 and $4,010, holding steady but showing no conviction.
Meanwhile, the U.S. dollar strengthened as traders trimmed rate-cut bets, while Treasuries extended gains, signalling expectations of slower growth rather than renewed inflation.
Equity markets initially rose, then fell back as investors realised Powell had effectively walked back expectations for a December cut.
“Gold had a logical reaction to Powell trying to walk back expectations for a December cut. That’s dollar positive and gold negative,” said Peter Grant, senior strategist at Zaner Metals.
The muted price response shows that gold is now trading less on rate outcomes and more on policy credibility - how much conviction the Fed can maintain in its cautious easing stance.
Gold price forecast: The road to December
Heading into the final meeting of 2025, the key question is whether the Fed’s caution was justified - or premature.
- If inflation eases and job data soften, the Fed may be able to justify another 25 bps cut, potentially propelling gold above $4,100.
- If growth holds steady and inflation proves sticky, the Fed may pause, sending gold back toward $3,900 as the dollar extends gains.
Powell also noted that internal Fed views are diverging sharply - some members see the current stance as still “modestly restrictive,” while others believe rates are now “near neutral.” This widening policy gap makes December’s meeting potentially decisive for both gold direction and market confidence.
Gold technical insights

Gold prices are currently consolidating near the $3,958 support level, with price action showing fatigue after the recent rally. The Bollinger Bands have started to narrow, signalling that volatility is easing. The price is hovering around the middle band, suggesting indecision among traders - neither a clear bullish continuation nor a confirmed bearish reversal has yet formed.
The RSI, has now flattened near the midline (50). This flattening pattern reflects a balance between buying and selling pressure, implying that momentum is neutral and traders are waiting for a decisive move below or above key levels.
On the downside, a break below the $3,958 support could trigger sell liquidations, with the next potential target around $3,630. Conversely, if bulls regain control and push the price higher, resistance is seen near $4,365 - a zone where profit-taking and renewed selling could emerge.
Traders analysing these levels can use Deriv MT5 for advanced charting tools, technical indicators, and live gold market data. Traders on Deriv platforms can also use multipliers to optimise their exposure to gold’s short-term volatility while managing risk, allowing them to benefit from smaller price movements without committing large capital upfront.
Gold investment implications
For traders, this Fed meeting marks the start of a data-driven phase in gold pricing rather than a one-way rally.
- Short-term outlook: Expect sideways trading between $3,950–$4,100, with spikes driven by employment and inflation reports.
- Medium-term bias: Modestly bullish if liquidity remains abundant after QT ends.
- Long-term view: Gold’s structural support remains intact as global central banks pivot toward looser liquidity management.
Ultimately, Powell’s pause, not the cut itself, defines this moment. The Fed has slowed the pace of easing, but by quietly ending its balance sheet runoff, it has also laid the groundwork for long-term gold resilience - even if short-term rallies face resistance.
Before entering new positions, traders can use Deriv’s trading calculator to estimate margin requirements, contract sizes, and potential profit or loss - a practical tool for planning gold trades around volatile macro events.
.png)
Nvidia vs Microsoft: The 2026 outlook for AI market leadership
Nvidia is positioned to take the lead in market valuation by 2026 - potentially becoming the first company closing in on a $5 trillion market cap.
Based on current momentum, Nvidia is positioned to take the lead in market valuation by 2026 - potentially becoming the first company closing in on a $5 trillion market cap. Its combination of record earnings, aggressive AI infrastructure investments, and vertical expansion across hardware and software ecosystems gives it a clear edge.
However, Microsoft remains its closest rival, leveraging its AI integration across productivity tools, cloud platforms, and gaming ecosystems to sustain stable, earnings-driven growth. The outcome may hinge on how effectively each company converts AI innovation into long-term revenue resilience.
Key takeaways
- Nvidia’s market value surged by $230 billion in one day, taking it within 3% of the $5 trillion mark - a first in market history.
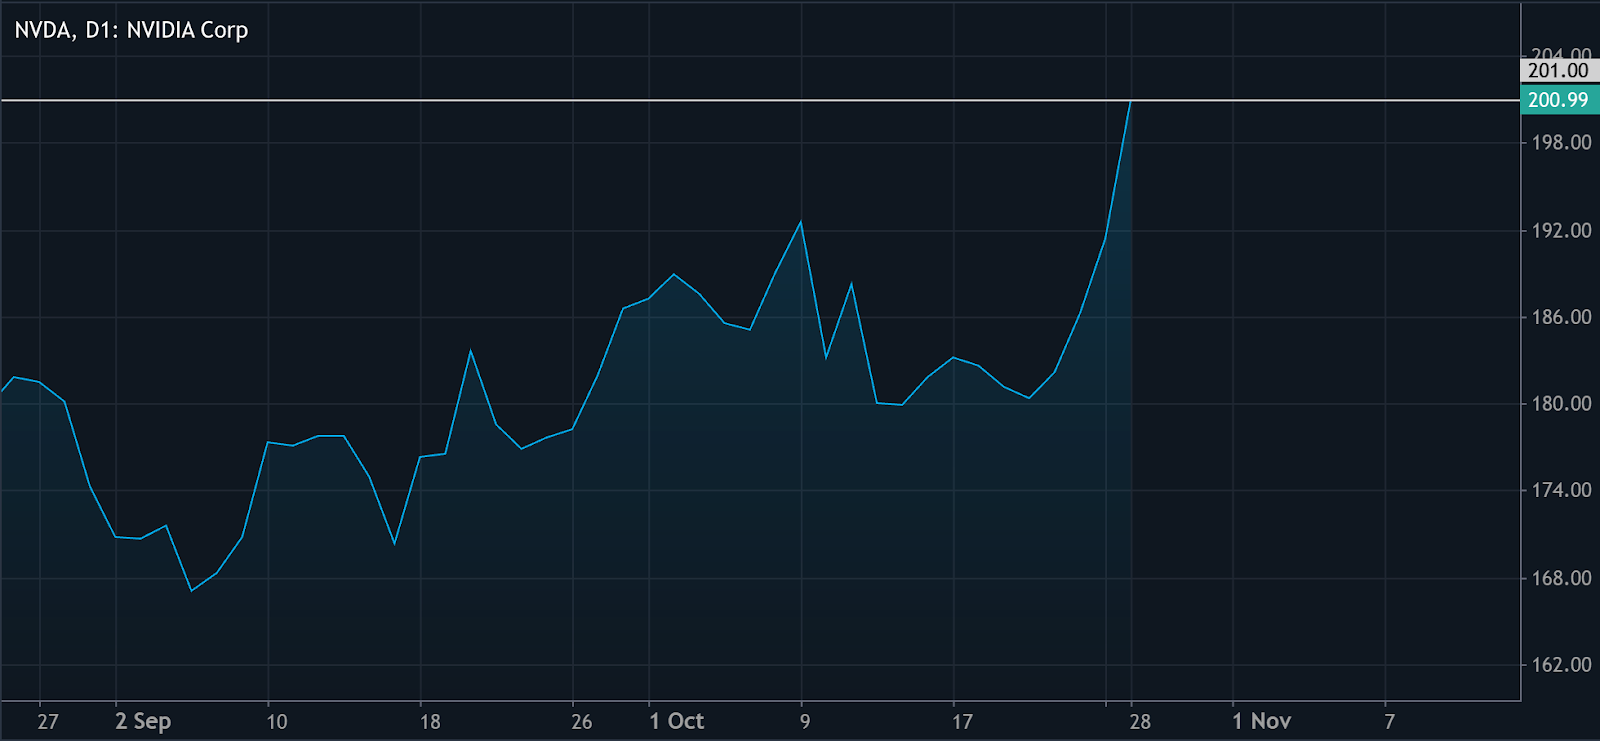
- Nvidia’s share price closed at $201.03, up 5% on the day, and is now testing the $210 resistance as investors price in stronger AI infrastructure growth.
- The company announced a $1 billion partnership with Nokia to build AI-powered 5G and 6G networks, expanding its influence beyond data centres.
- Microsoft continues to build AI leadership through Azure, OpenAI partnerships, and the Activision-Blizzard acquisition, reinforcing its diversified model.
- Analysts expect Nvidia to report $4.51 EPS in 2026 and $6.43 in 2027, implying a P/E ratio near 28.7 - relatively modest for its growth rate.
- Both companies could exceed $5 trillion before 2026, but Nvidia’s pure-play AI exposure makes it more sensitive to the next phase of the AI investment cycle.
Nvidia Nokia partnership: Nvidia’s $230 billion day
Nvidia’s stock rally in late October - adding over $230 billion in market value - marks a new phase in the AI investment cycle.
The surge followed the company’s GTC Washington conference, where it announced multiple partnerships and new AI infrastructure projects. The headline deal was with Nokia, where Nvidia committed $1 billion to integrate its AI-RAN (Radio Access Network) systems into next-generation 5G and 6G infrastructure.
This expansion moves Nvidia beyond its traditional GPU dominance into telecom infrastructure, widening its total addressable market. The firm’s strategy mirrors its approach to data centres - owning both the hardware layer and the software stack that powers AI workloads.
Investors can track Nvidia’s price action and volatility directly through CFDs on Deriv MT5.
Race to $5 Trillion market cap: Nvidia’s vs Microsoft’s stability
The competition between Nvidia and Microsoft represents two distinct approaches to AI market leadership:
- Nvidia’s momentum-driven model: Fueled by exponential demand for GPUs, accelerated computing, and partnerships with every major AI player - including OpenAI, Meta, AWS, and Oracle.
- Microsoft’s diversified model: Built on recurring revenues from Azure, Microsoft 365, and gaming ecosystems like Activision-Blizzard, with AI woven throughout its services.
At current valuations, both companies are within reach of the $5 trillion milestone. Nvidia’s faster earnings trajectory - $86.59 billion in trailing 12-month net income - gives it a near-term advantage. Yet Microsoft’s consistent cash flow and balance sheet strength make it more resilient in the event of an AI market slowdown.
AI expansion through strategic partnerships
Nvidia has positioned itself as a central node in the AI economy by investing directly in its ecosystem.
Recent moves include:
- $100 billion investment plan with OpenAI to deploy at least 10 gigawatts of Nvidia systems for next-generation model training.
- $5 billion equity stake in Intel, focusing on joint AI chip and data centre development.
- $1 billion equity investment in Nokia, supporting AI-native 5G/6G networks.
These investments transform Nvidia from a chip supplier into an AI infrastructure conglomerate - similar to how Microsoft evolved from a software company into a diversified tech leader in the 2010s.
Nvidia & Microsoft Earnings and valuation outlook 2026
Nvidia’s forward-looking metrics suggest its valuation may still be grounded in fundamentals:
- Fiscal 2026 earnings estimates: $4.51 per share.
- Fiscal 2027 projections: $6.43 per share.
- Forward P/E ratio around 28–30, assuming price stability near $200.
For Microsoft, consensus expects steady double-digit earnings growth, supported by Azure expansion and monetisation of AI tools across Office, GitHub, and LinkedIn.
If both companies meet current projections, Nvidia could exceed $5 trillion in market cap before mid-2026, while Microsoft may reach that milestone through consistent compound growth over a longer horizon.
Market drivers and risks ahead
The AI market is entering a capital-intensive phase where hyperscalers are increasing infrastructure spending, driving Nvidia’s top-line expansion.
However, potential risks include:
- A slowdown in corporate AI investment if macroeconomic conditions tighten.
- Competitive advances from AMD or custom silicon by hyperscalers.
- Regulatory pressures on AI model deployment that could affect demand.
For Microsoft, the key risk lies in monetisation speed - whether Copilot, Azure AI, and AI-integrated products deliver enough incremental revenue to justify its valuation expansion.
Use Deriv’s trading calculator to estimate price risk exposure to highly volatile AI tech stocks like Nvidia and Microsoft.
Nvidia technical insights
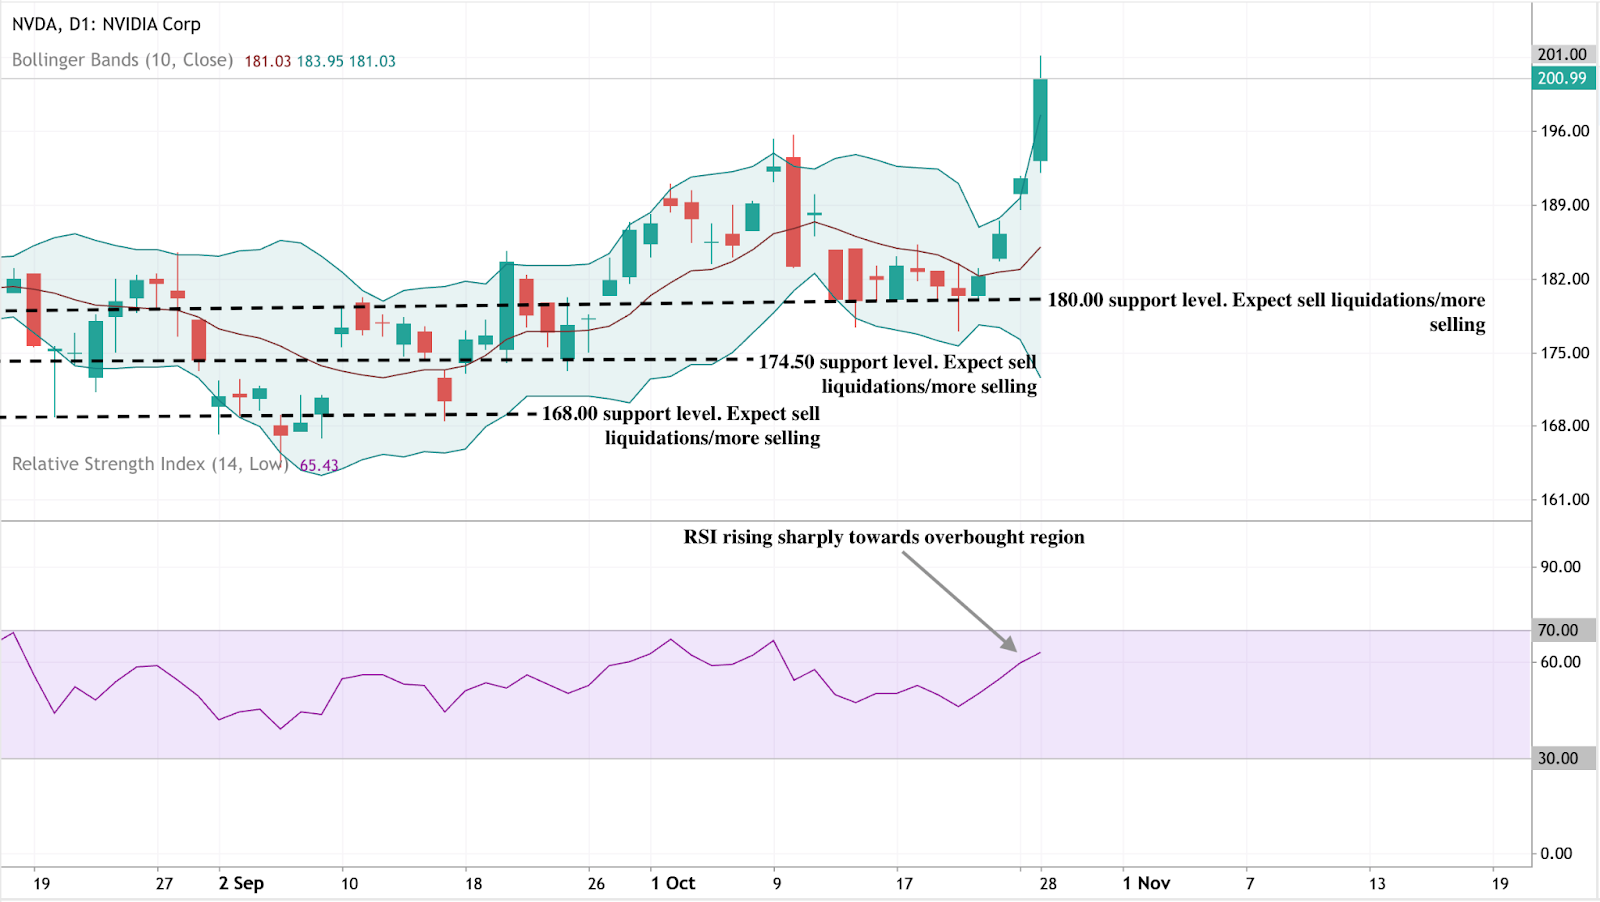
At the time of writing, Nvidia’s stock is trading around the $201 mark, breaking decisively above the upper band of the Bollinger Bands - a sign of strong bullish momentum. However, such a sharp move beyond the upper band often indicates overextension, suggesting the stock could be due for a short-term pullback or consolidation.
The Relative Strength Index (RSI) is rising sharply, currently hovering around 65, and heading towards the overbought region (above 70). This momentum implies that bullish sentiment remains strong, but traders should watch for potential profit-taking once the RSI crosses into overbought territory.
In terms of support levels, Nvidia has established key zones at $180, $174.50, and $168. A break below these levels could trigger sell liquidations and increased downside pressure. Conversely, as long as the stock holds above $180, the current trend remains bullishly intact, though volatility is expected to stay elevated.
Nvidia & Microsoft investment implications
The AI market’s next two years will likely be defined by how fast companies can convert hype into sustained profit growth. Nvidia’s $230 billion single-day gain underscores its dominance in the current cycle, but maintaining that pace requires continuous innovation and client investment.
Microsoft’s diversified model gives it a defensive edge - less volatility, more predictable cash flow - making it a potential co-leader in the long-term AI economy.
For investors, 2026 may mark the first true test of AI’s market maturity: whether hardware-driven earnings (Nvidia) or ecosystem-based monetisation (Microsoft) delivers the stronger foundation for the next decade of growth.
Üzgünüz, ile eşleşen herhangi bir sonuç bulamadık.
Arama ipuçları:
- Yazımınızı kontrol edin ve tekrar deneyin
- Başka bir anahtar kelime deneyin