Ethereum price crash: Are we in a crypto winter or just a profit-taking phase?

Ethereum’s sharp fall below $3,500 looks less like the beginning of a crypto winter and more like a large-scale profit-taking reset. Data across on-chain, derivatives, and institutional flows suggest the market is undergoing a correction after months of aggressive gains, rather than entering a prolonged bearish cycle.
While retail traders and exchange-traded funds (ETFs) are showing fear, whales and institutional treasuries are using the pullback to accumulate - hinting that the current phase could set the foundation for a late-year recovery.
Key takeaways
- Ethereum trades at around $3,312, down 8.92% over the past month.
- Over $1.1 billion in leveraged positions were liquidated within 24 hours, as 303,000 traders were forced out.
- The Crypto Fear & Greed Index dropped to 20 (“Fear”), down from 59 (“Greed”) a month ago.
- Whale wallets added 1.64 million ETH (~$6.4 billion) in October, despite declining prices.
- The Fusaka hard fork upgrade scheduled for 3 December 2025 introduces PeerDAS, expected to cut Layer-2 fees by up to 95%.
- November has historically been Ethereum’s best-performing month, with an average return of +6.9% over the past eight years.
Crypto Market sentiment turns fearful
The Crypto Fear and Greed Index has plunged to 20, signaling widespread unease among investors.
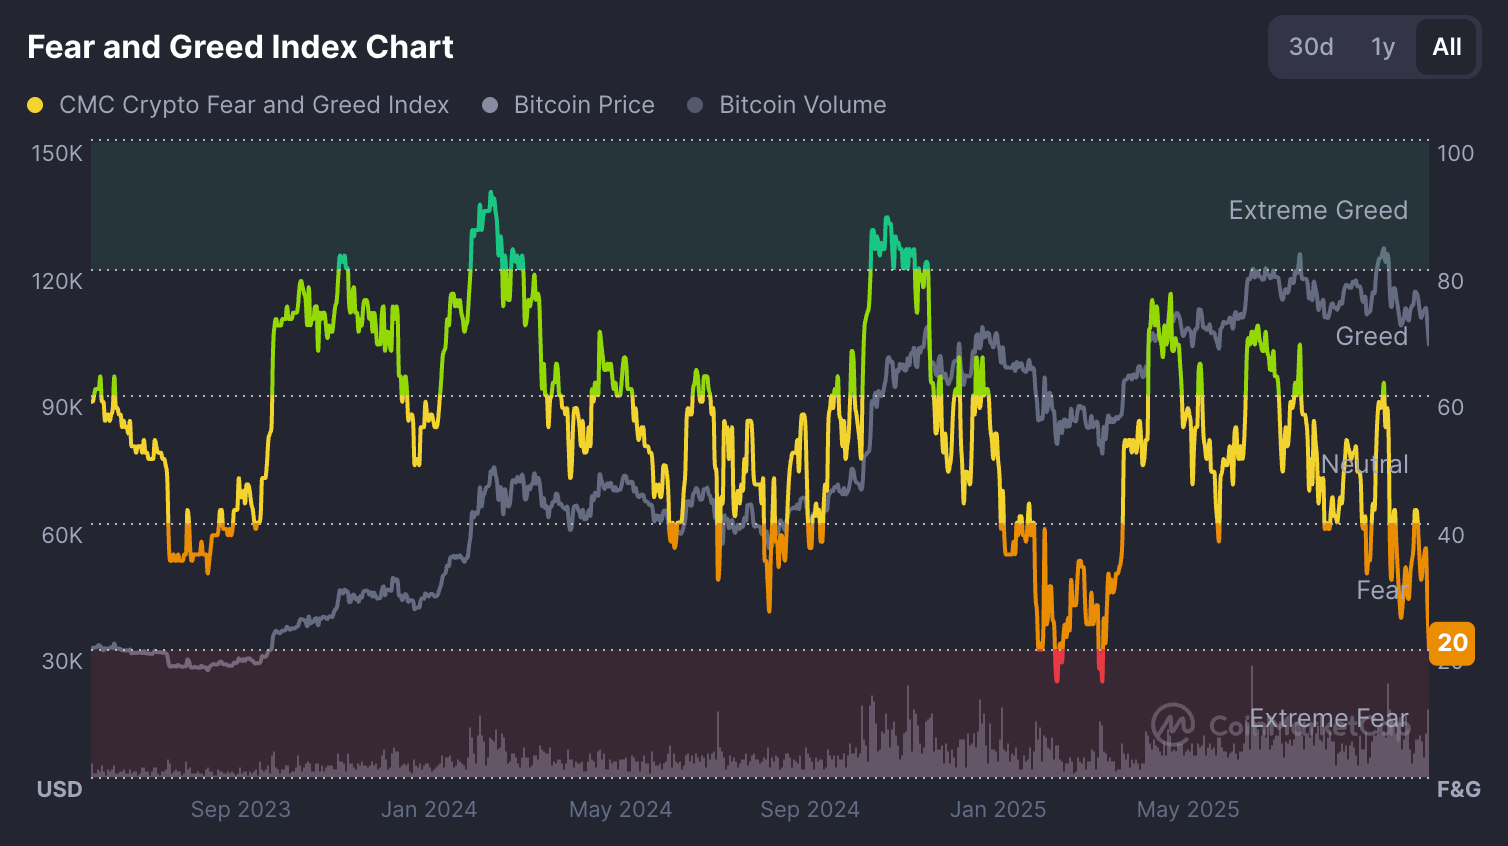
Just a month ago, readings above 50 showed moderate greed. The shift underscores a dramatic shift in sentiment as traders move from optimism to caution.
Across the broader market, nearly every major asset has turned red. Bitcoin fell 2.8% to $104,577, Solana dropped 11%, BNB lost 8.3%, XRP fell 6.7%, and Cardano slid 7.4% in the past 24 hours. The total cryptocurrency market cap has slipped 4% daily, erasing over $140 billion in value.
The macro backdrop compounds the pressure. The Federal Reserve’s uncertain rate outlook and a strengthening U.S. dollar are draining liquidity from risk assets - a dynamic often associated with crypto drawdowns.
ETH Whale accumulation intensifies while retail retreats
While fear dominates headlines, blockchain data reveals that the largest holders are quietly accumulating Ethereum. According to analytics firm Santiment, wallets holding between 1,000 and 100,000 ETH increased their balance from 99.28 million to 100.92 million ETH during the month of October.

This buying occurred even as Ethereum fell around 7% that month - a strong sign that institutional and high-net-worth investors view current prices as attractive entry points.
In contrast, long-term retail accumulation has slowed. Glassnode data show that the Holder Accumulation Ratio has declined from 31.27% to 30.45% since late October.
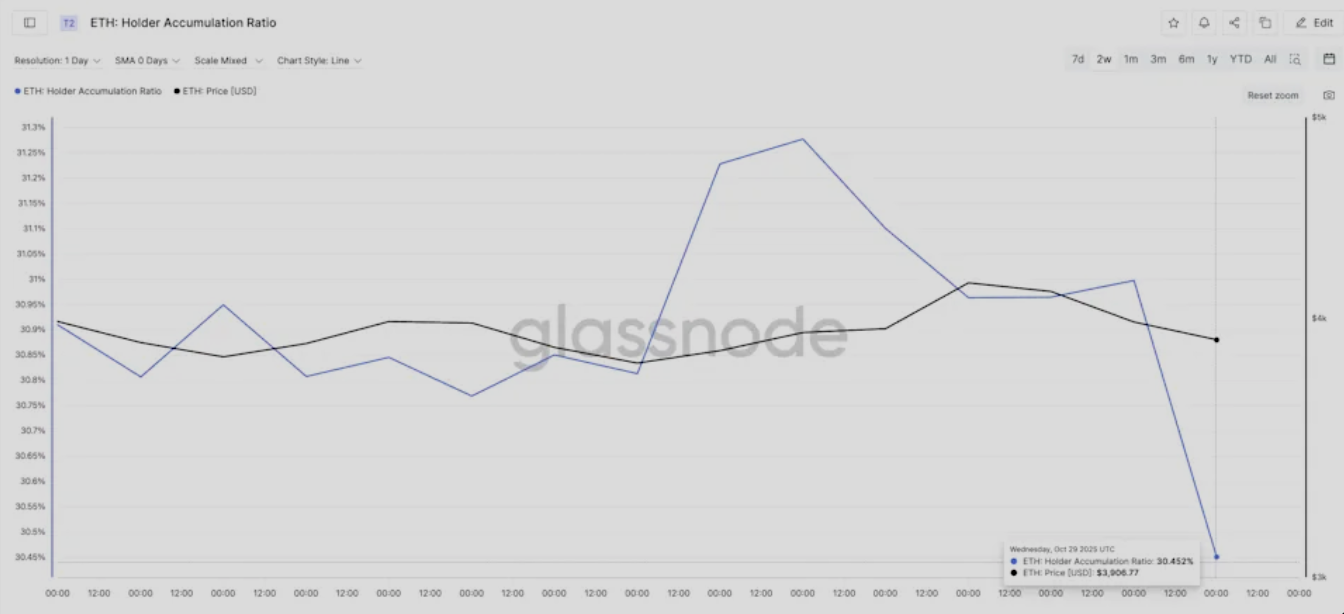
Retail investors are reducing exposure, waiting for clearer signals before re-entering. This divergence between whale buying and retail caution has become the defining feature of the current correction.
Institutional positioning: ETFs and treasuries diverge
Institutional flows paint a mixed picture. On the one hand, U.S. spot Ethereum ETFs experienced $135.76 million in outflows on 3 November.
- BlackRock’s ETHA: −$81.7 million
- Fidelity’s FETH: −$25.1 million
- Grayscale’s ETHE: −$15 million
These redemptions came alongside $186.5 million in Bitcoin ETF outflows, as institutional desks reduced exposure amid heightened volatility.
On the other hand, corporate treasuries are accumulating. Publicly traded BitMine Immersion Technologies (BMNR) added 82,353 ETH last week - worth roughly $294 million - bringing its total holdings to 3.39 million ETH, or 2.8% of Ethereum’s circulating supply. The company’s average purchase price stands around $3,909, suggesting confidence in long-term upside.
BMNR’s chairman, Tom Lee, told CNBC that the market is “consolidating after a reset,” adding that fundamentals such as stablecoin volume and application revenues are at all-time highs. Lee predicts a possible rally toward $7,000 for Ethereum before the end of the year, framing current conditions as a healthy correction rather than a crisis.
Liquidations reveal a market reset
The most dramatic signal of the correction came from the derivatives market. Data from Coinglass shows that over 303,000 traders were liquidated in just 24 hours, resulting in a total of $1.1 billion in forced positions. Within a single hour, more than $300 million was wiped out - $287 million of which were long positions.
This scale of liquidation reveals how over-leveraged bullish bets unraveled once prices broke below key support levels. Ethereum and Bitcoin accounted for the bulk of the wipeout, while high-beta altcoins like Solana and BNB saw even sharper declines.
The outcome is paradoxically constructive: leverage has been purged, funding rates have normalised, and open interest now reflects disciplined accumulation rather than speculative excess. Ethereum’s open interest remains high at $19.9 billion, but funding rates are flat - an equilibrium that often precedes a more stable recovery phase.
Fusaka upgrade offers long-term optimism
While short-term traders react to price volatility, developers are preparing for one of Ethereum’s most ambitious upgrades yet.
The Fusaka hard fork, confirmed for 3 December 2025, introduces Peer Data Availability Sampling (PeerDAS) - a technology that increases block capacity from 6 to 48 per block. This upgrade could reduce Layer-2 transaction fees by up to 95%, significantly improving scalability for DeFi and rollup networks.
Such infrastructure improvements strengthen Ethereum’s long-term competitiveness against alternative Layer-1 chains. With stablecoin transactions on Ethereum hitting $2.8 trillion in October, network fundamentals remain robust despite price turbulence.
Ethereum’s November historical pattern: a bullish bias
Seasonality may soon lend support. Over the past eight years, Ethereum has averaged a monthly return of +6.9 % in November. In 2024, it recorded a remarkable 47.4% rally, marking one of its strongest months ever.
The Net Unrealised Profit/Loss (NUPL) ratio - which measures the percentage of investors in profit - has fallen from 0.43 to 0.39, near the monthly low of 0.38 that last triggered a 13% rebound from $3,750 to $4,240.
This trend suggests selling pressure may be fading as investor incentives to take profits decline.
Macro context: profit-taking, not panic
Ethereum’s downturn mirrors the broader behavior of risk assets. After months of double-digit gains across cryptocurrencies, profit-taking has accelerated amid global liquidity concerns. The U.S. dollar index strengthened sharply, and Fed officials have hinted at slower rate cuts, encouraging investors to rotate out of speculative assets.
Unlike prior bear-market conditions, however, there is no collapse in network activity or developer engagement. DeFi revenue remains strong, stablecoin velocity is high, and whale inflows indicate rotation rather than retreat. The sell-off, therefore, aligns more with profit-locking behavior than the sustained capital flight that characterised the 2022–2023 crypto winter.
Traders on Deriv MT5 can track these shifts across multiple assets, from cryptocurrencies to forex, to gauge broader market sentiment in real-time.
Ethereum technical insights: Stabilisation vs. further weakness

Ethereum is currently trading near $3,313, rebounding after a sharp decline that tested the $3,745 support level. This zone has acted as a key area where sell liquidations intensified, but the recent bounce suggests early signs of buyer interest.
The Bollinger Bands have widened significantly, indicating elevated volatility, while price action remains near the lower band - typically a sign of short-term oversold conditions. A sustained close above the middle band could confirm a recovery in momentum.
Meanwhile, the Relative Strength Index (RSI) has risen sharply from 33, signaling improving bullish momentum after near-oversold readings. A further RSI move above 50 would reinforce a potential short-term reversal.
Resistance levels remain at $4,250 (where profit-taking and more buying may emerge) and $4,700, marking a stronger ceiling for any extended rally. Overall, ETH shows early signs of recovery but still faces strong resistance ahead.
The near-term outlook depends on whether ETF outflows stabilise and whether the whale accumulation trend continues through November. With fear levels elevated, contrarian traders are closely watching for a potential bottoming process similar to past mid-cycle corrections. The Deriv trading calculator can help traders assess potential profit and margin exposure before taking positions in such volatile environments.
Ethereum investment implications
For short-term traders, Ethereum’s setup suggests a high-volatility environment with tactical entry opportunities near the $3,500–$3,700 support range. Upside targets into December sit between $4,400 and $4,600, assuming sentiment stabilises and ETF outflows slow.
For medium-term investors, current levels represent an accumulation window. Whale buying, the Fusaka upgrade, and seasonal patterns point to improving fundamentals beneath the surface fear. Institutional participation is likely to return once macroeconomic uncertainty eases and on-chain stability confirms a bottom.
In essence, Ethereum’s decline is a market normalisation, not a meltdown. As leverage unwinds and fundamentals strengthen, the groundwork for the next leg higher may already be forming.
The performance figures quoted are not a guarantee of future performance.


