Results for

Will the Fed cut rates faster in 2026 than the market expects?
According to analysts, the growing divide inside the Fed suggests that the outcome cannot be ruled out.
Will the Federal Reserve cut interest rates faster in 2026 than markets expect? According to analysts, the growing divide inside the Fed suggests that the outcome cannot be ruled out. While official projections still signal a cautious path, some policymakers argue that inflation has cooled enough to justify deeper and faster easing.
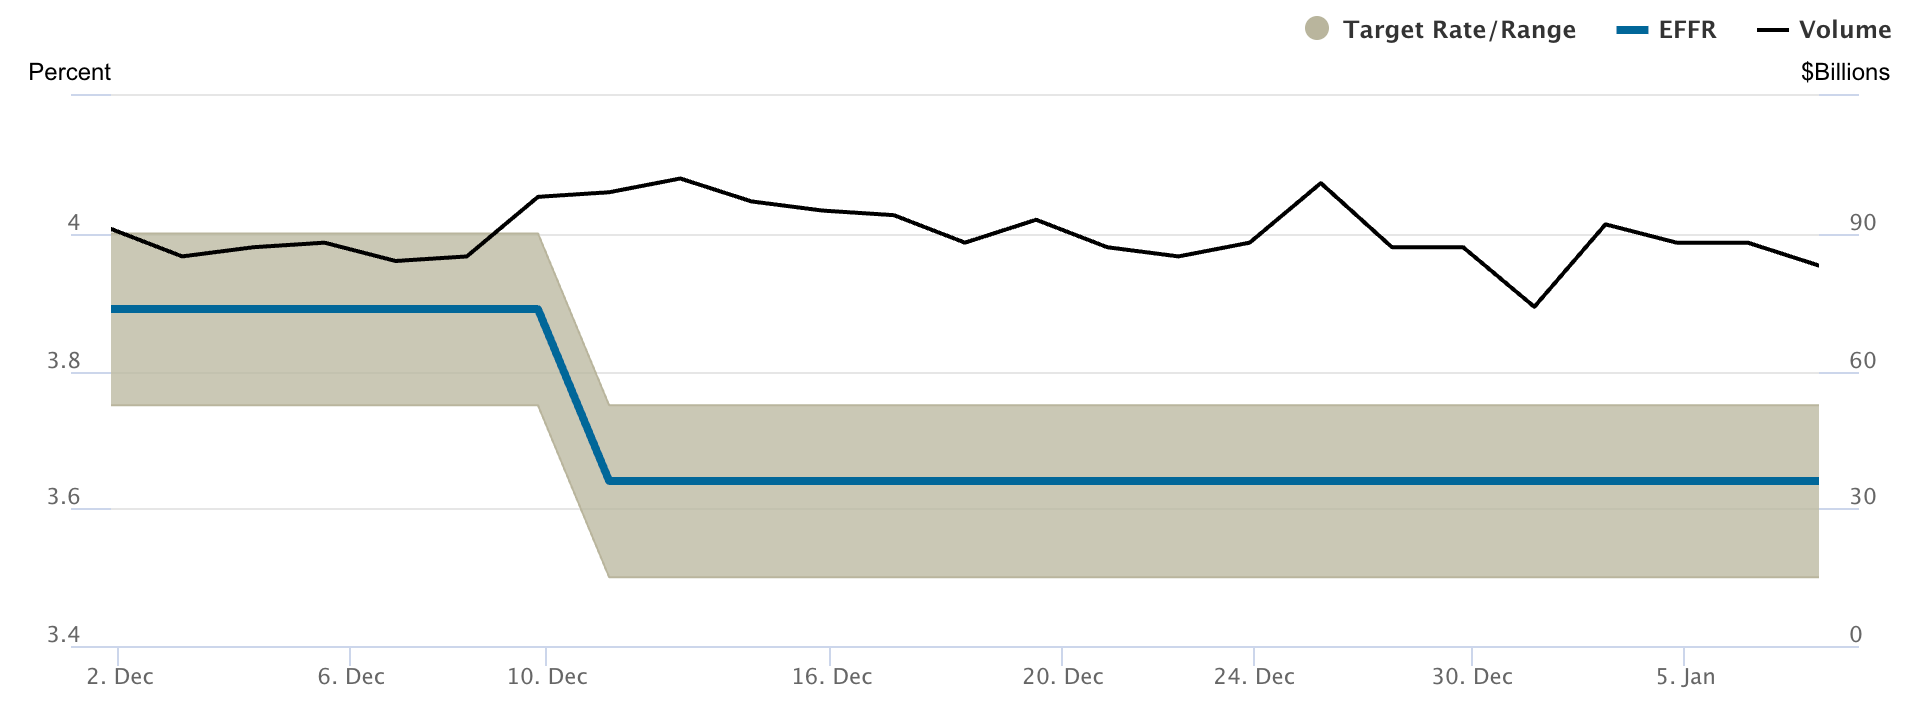
With the Federal Funds Rate currently sitting between 3.50% and 3.75%, the debate now centres on whether monetary policy is still unnecessarily restrictive.
That question has taken on greater urgency after Fed Governor Stephen Miran publicly called for up to 150 basis points of rate cuts this year. His stance contrasts sharply with market pricing and with other officials advocating patience. As labour market data softens and inflation drifts closer to target, investors are watching closely for signs that the Fed may ultimately move faster than it currently signals.
What’s driving the Fed’s rate cut debate?
The core of the disagreement lies in how Fed officials interpret progress on inflation and labour market slack. Miran argues that underlying inflation is already running near 2.3%, close enough to the Fed’s 2% target to allow meaningful rate cuts without risking a resurgence in prices. From his perspective, keeping rates elevated is suppressing hiring rather than containing inflation.
Other policymakers are less convinced. Several regional Federal Reserve bank presidents favour holding rates steady until more post-shutdown data clarifies the true state of employment and price pressures. They warn that inflation has a history of re-accelerating when policy eases too early, especially if demand proves more resilient than expected.
Politics has added another layer to the debate. Miran, appointed temporarily to the Board of Governors by President Donald Trump, has echoed concerns from the White House about recession and stagflation risks. While the Fed operates independently, the renewed political scrutiny underscores how sensitive rate policy has become as growth slows.
Why it matters
This split matters because markets trade expectations, not just outcomes. Even subtle shifts in Fed rhetoric can reprice bonds, equities, and currencies within minutes. When policymakers openly disagree, volatility tends to rise as investors reassess whether official guidance still reflects the likely policy path.
Economists also warn that the cost of waiting may be higher than the Fed assumes. Bloomberg Economics notes that restrictive monetary policy affects employment with a lag, meaning current job losses may reflect decisions made months earlier. If the Fed delays easing until unemployment rises more sharply, it may be forced into larger cuts later, potentially destabilising markets.
Impact on markets and consumers
For consumers, the pace of rate cuts directly affects borrowing costs. Credit cards, auto loans, and home-equity lines remain closely tied to short-term rates, keeping household finances under strain even as inflation eases. Faster cuts would gradually lower monthly payments and improve disposable income, particularly for borrowers on variable rates.
Analysts noted that the markets are already reacting to the uncertainty. Bond yields have become increasingly sensitive to labour data, while equity valuations now hinge on whether growth can stabilise without further policy support. A faster-than-expected easing cycle would likely weaken the US dollar, support risk assets, and steepen the yield curve, signalling confidence in a soft landing.
If the more hawkish faction prevails, tighter conditions may persist for a longer period. That outcome would favour defensive equities and keep volatility elevated as investors adjust to a slower-moving Fed.
Expert outlook
Based on reports, official Federal Reserve projections currently indicate only one rate cut in 2026, highlighting the gap between internal forecasts and Miran’s calls for aggressive easing. The new Federal Open Market Committee voting rotation also leans more hawkish, reducing the likelihood of rapid policy shifts in the near term.
However, analysts stress that data will ultimately drive decisions. Employment indicators such as jobless claims, wage growth, and participation rates will carry more weight than headline inflation alone. If labour market cooling accelerates without a rebound in prices, pressure for faster cuts will intensify.
For now, the Fed’s division reflects uncertainty rather than dysfunction. Policymakers are grappling with how a post-pandemic economy responds to prolonged restraint - and that uncertainty may shape monetary policy throughout 2026.
Key takeaway
The Federal Reserve enters 2026 divided between caution and urgency. While official forecasts still favour limited easing, calls for deeper cuts reflect growing concern about labour market weakness. If jobs data continues to soften without reigniting inflation, the Fed may ultimately cut rates faster than markets expect. Investors should closely monitor employment indicators, as they may influence the pace of policy shifts.

Why Alphabet just surpassed Apple in the AI race
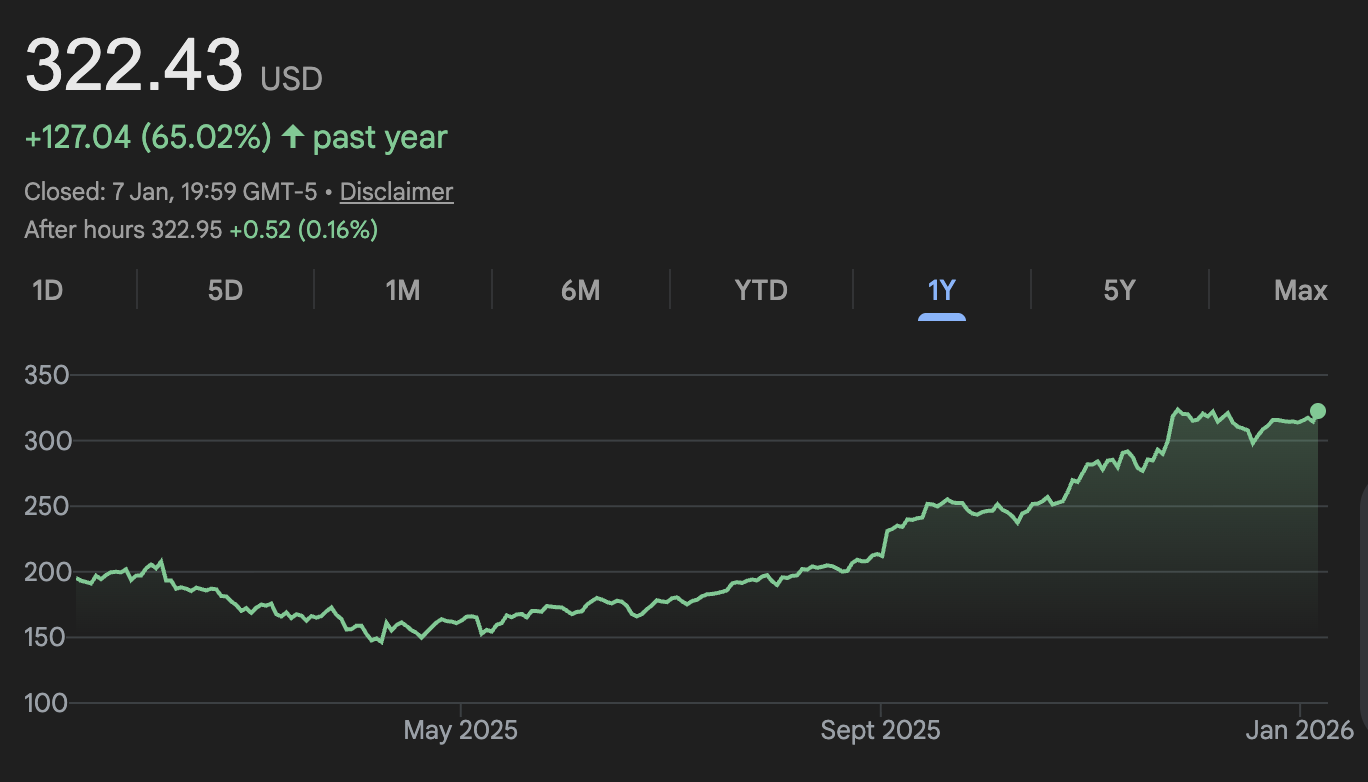
Alphabet has overtaken Apple in market capitalisation for the first time since 2019, closing Wednesday at $3.88 trillion compared with Apple’s $3.84 trillion.
Alphabet has overtaken Apple in market capitalisation for the first time since 2019, closing Wednesday at $3.88 trillion compared with Apple’s $3.84 trillion. The reversal follows a sharp divergence in how investors are pricing artificial intelligence execution across Big Tech.
This is not a short-term market fluctuation. It reflects a deeper reassessment of which companies are turning AI investment into revenue, infrastructure, and long-term dominance. As the AI cycle matures, markets are becoming less patient with promises and more focused on delivery - a shift that now favours Alphabet.

What’s driving Alphabet’s breakout?
Alphabet’s resurgence has been powered by a decisive shift from defensive AI positioning to full-scale execution. The company ended 2025 up 65%, its strongest annual rally since 2009, after restoring confidence in its ability to compete at the infrastructure level of AI.
Investors responded positively to Alphabet’s willingness to challenge Nvidia’s dominance rather than rely solely on third-party solutions.
That momentum accelerated in November with the unveiling of Ironwood, Alphabet’s seventh-generation tensor processing unit. The chip has been positioned as a cost-efficient alternative for hyperscale AI workloads, particularly within Google Cloud.
In December, Google followed up with Gemini 3, earning strong early reviews for improved reasoning and multimodal performance. Alphabet shares climbed more than 2% on Wednesday alone, closing at $322.03, as confidence returned.
Why it matters
This market cap shift highlights how AI leadership is now being judged. Alphabet controls a vertically integrated AI stack - custom chips, proprietary models, cloud infrastructure, and global distribution - giving it a strategic advantage as AI demand scales. That integration allows Alphabet to capture value across multiple layers rather than compete on features alone.
Analysts have taken note. Raymond James described Alphabet’s AI strategy as “commercially aligned with enterprise demand,” pointing to clear monetisation pathways rather than speculative use cases. Apple, by contrast, is being penalised for delayed execution at a time when speed has become a competitive necessity.
Impact on the tech market
Alphabet’s surpassing of Apple is influencing capital allocation across the tech sector. Investors are shifting their focus toward companies that demonstrate AI-driven revenue visibility, particularly in enterprise cloud services.
On Alphabet’s October earnings call, CEO Sundar Pichai revealed that Google Cloud signed more $1 billion-plus deals in 2025 through Q3 than in the previous two years combined, underscoring institutional adoption.
Apple’s position looks more fragile. Shares have fallen more than 4% over the past five days, reflecting concerns about execution risk. The delayed rollout of Apple’s next-generation Siri - now promised for 2026 - has left the company exposed as AI shifts from optional innovation to baseline expectation.
Expert outlook
Looking ahead, analysts expect Alphabet’s valuation to hinge on cloud growth rates and AI chip adoption through 2026. While competition from Microsoft and Nvidia remains intense, Alphabet’s ability to deploy proprietary hardware internally provides margin control that few rivals can match. A UBS strategist noted that Alphabet is now “setting the cost curve for enterprise AI rather than reacting to it”.
Apple faces a narrower window. Raymond James downgraded the stock this week, warning that gains may be limited in 2026 unless Apple delivers a step-change in AI capability rather than incremental upgrades. Markets will be watching whether Apple’s long-awaited AI push can restore confidence or confirm Alphabet’s structural lead.
Key takeaway
Alphabet’s leap past Apple signals a market that now rewards AI execution over brand legacy. By aligning chips, models, and cloud infrastructure, Alphabet has positioned itself as a full-stack AI leader. Apple’s delay highlights how costly hesitation has become in this cycle. The next test will be whether AI revenues can scale faster than the capital required to sustain them.
Alphabet technical outlook
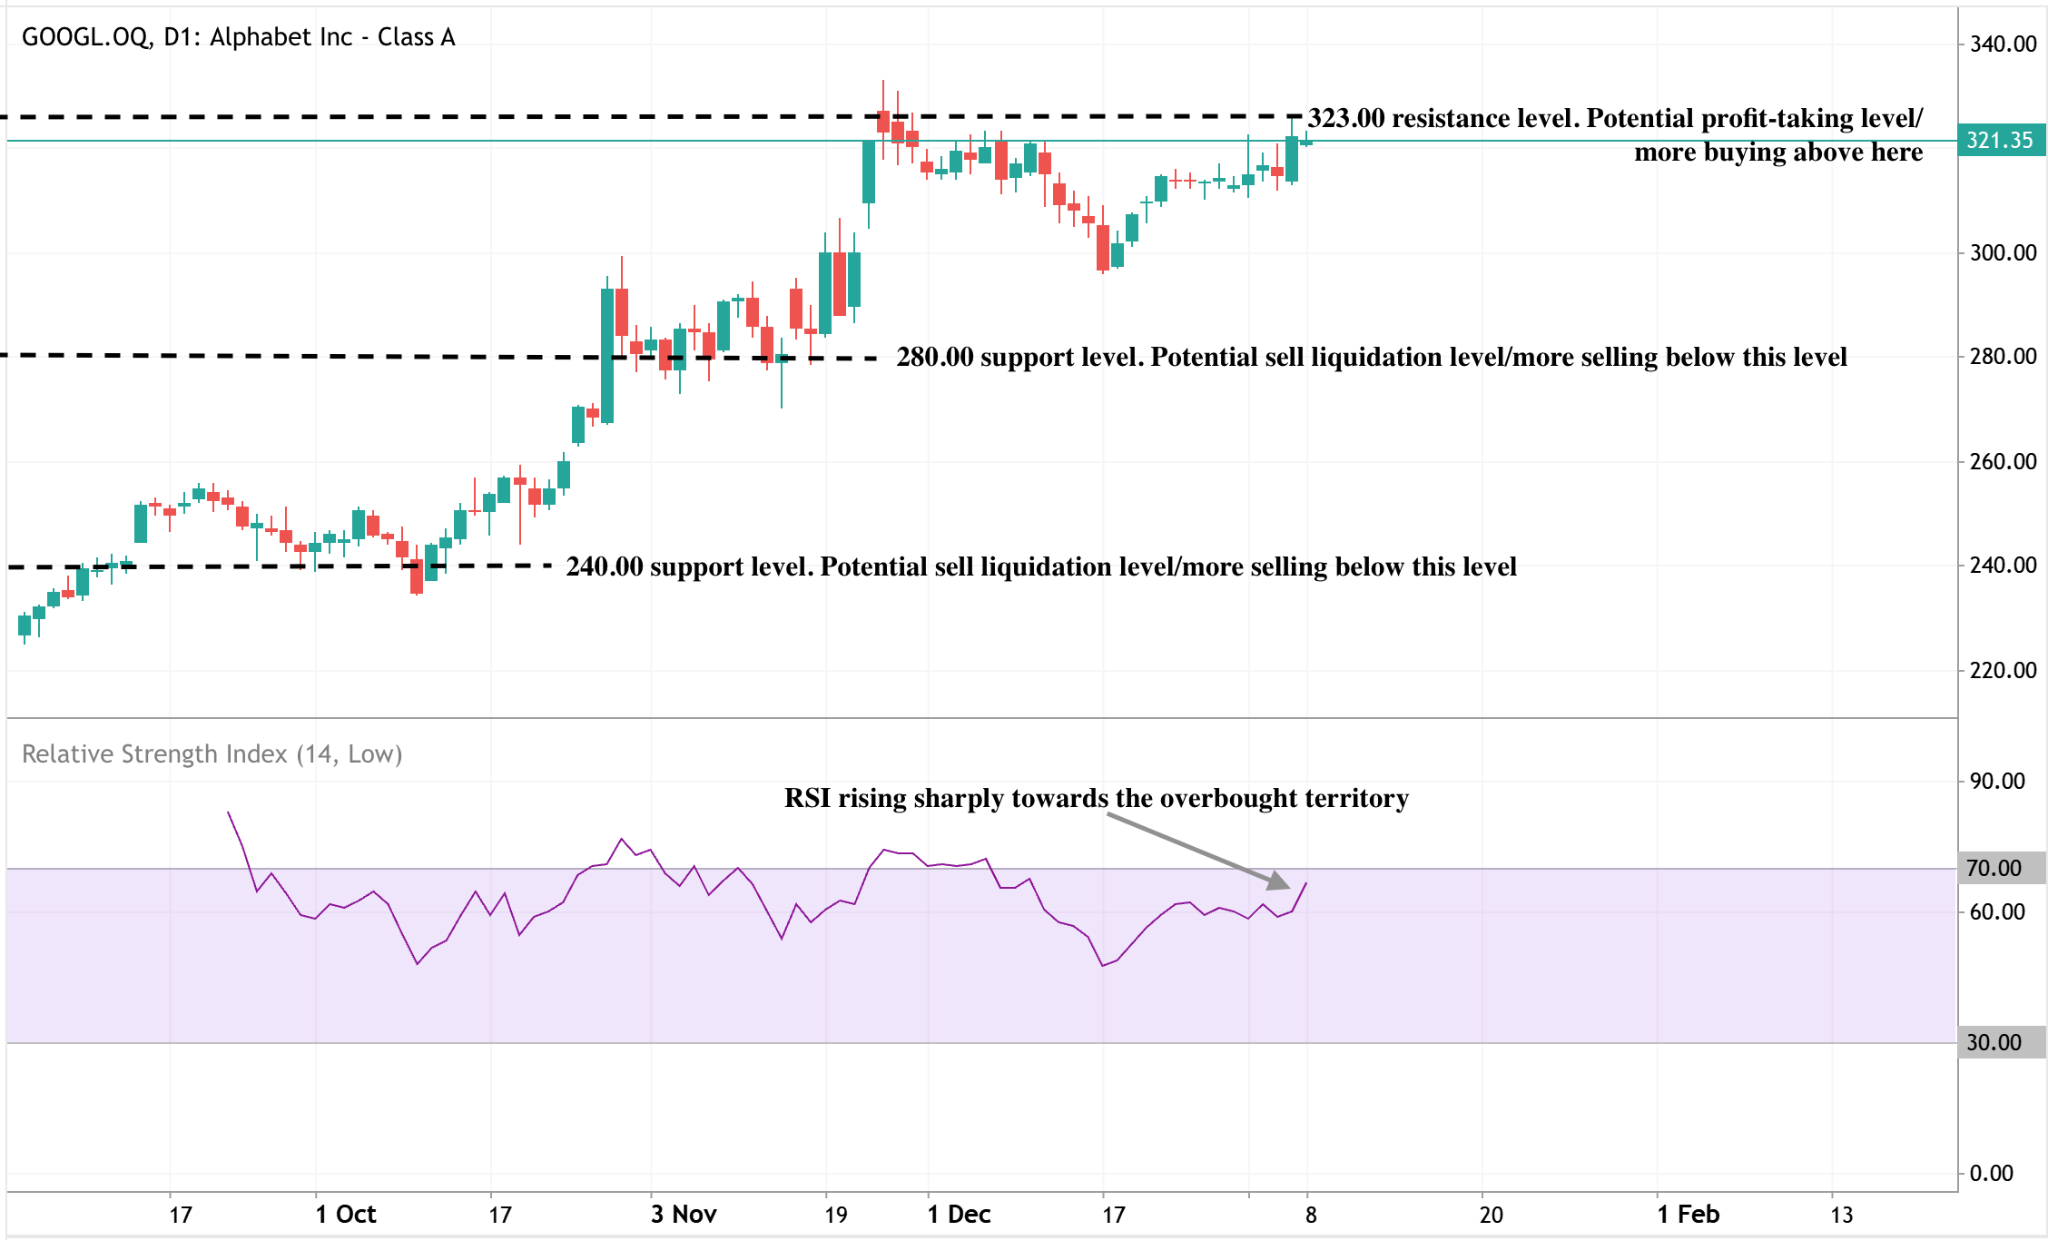
Alphabet is pressing back toward the $323 resistance level after a strong multi-month rally, with price consolidating just below a key supply zone that has previously attracted profit-taking.
The broader structure remains firmly bullish, with higher highs and higher lows intact, while the recent pullback has been absorbed without damaging trend support. Momentum indicators suggest a stretched yet constructive setup: the RSI is rising sharply toward overbought territory, indicating strong upside momentum, but also increasing the likelihood of near-term consolidation.
On the downside, the $280 level remains a key support zone, with a deeper correction only coming into view below $240. A sustained break above $323 would likely confirm a bullish continuation, while a failure to clear the resistance could see the price pause to digest gains rather than signal a trend reversal.

Why silver is rising as geopolitics choke physical supply
Silver prices have surged to historic highs as geopolitical shocks collide with a market already strained by years of physical shortages.
Silver prices have surged to historic highs as geopolitical shocks collide with a market already strained by years of physical shortages. Spot silver has surpassed $80 per ounce, extending gains of more than 140% in 2025, despite US Treasury yields remaining elevated and the dollar holding firm.
This rally is not being driven solely by speculative excess. The combination of escalating geopolitical risk, tightening control over physical supply, and relentless industrial demand has altered the structure of the silver market itself. As paper prices struggle to reflect physical scarcity, investors are being forced to rethink what silver is worth - and why.
What’s driving silver’s rise?
Geopolitics has returned as a central force in commodity pricing, and silver has emerged as an unexpected focal point. According to sources, the US military’s capture of Venezuelan president Nicolás Maduro has unsettled global markets, reigniting fears of wider intervention across Latin America.
President Donald Trump’s pledge that the US would “run” Venezuela, combined with threats directed at Mexico, Cuba, Colombia, and even Greenland, has injected persistent uncertainty into risk assets, according to analysts.
Historically, such episodes pushed investors toward gold. This time, silver has moved faster. Morgan Stanley strategist Amy Gower warned that geopolitical events “bring upside risks to precious metals,” reaffirming a constructive outlook for metals into 2026.
The difference now lies in market tightness. Silver entered this geopolitical shock with little spare capacity, leaving prices highly sensitive to disruption.
Why it matters
Silver’s current rally challenges long-held assumptions about how precious metals behave in times of stress. Past spikes, including the Hunt brothers’ corner in 1980 and the quantitative easing surge in 2011, were ultimately undone by available inventories and leverage-driven excess. When pressure mounted, supply emerged, and prices collapsed.
Today’s setup looks fundamentally different. For several consecutive years, global silver demand has exceeded mine production and recycling. Industrial consumption - led by solar panels, electric vehicles, and electronics - has expanded rapidly, while above-ground inventories have steadily drained.
Jefferies strategist Mohit Kumar noted that diversification away from the US dollar should gain momentum, with gold as the main beneficiary, but silver’s hybrid role gives it a distinct edge.
Impact on markets and industry
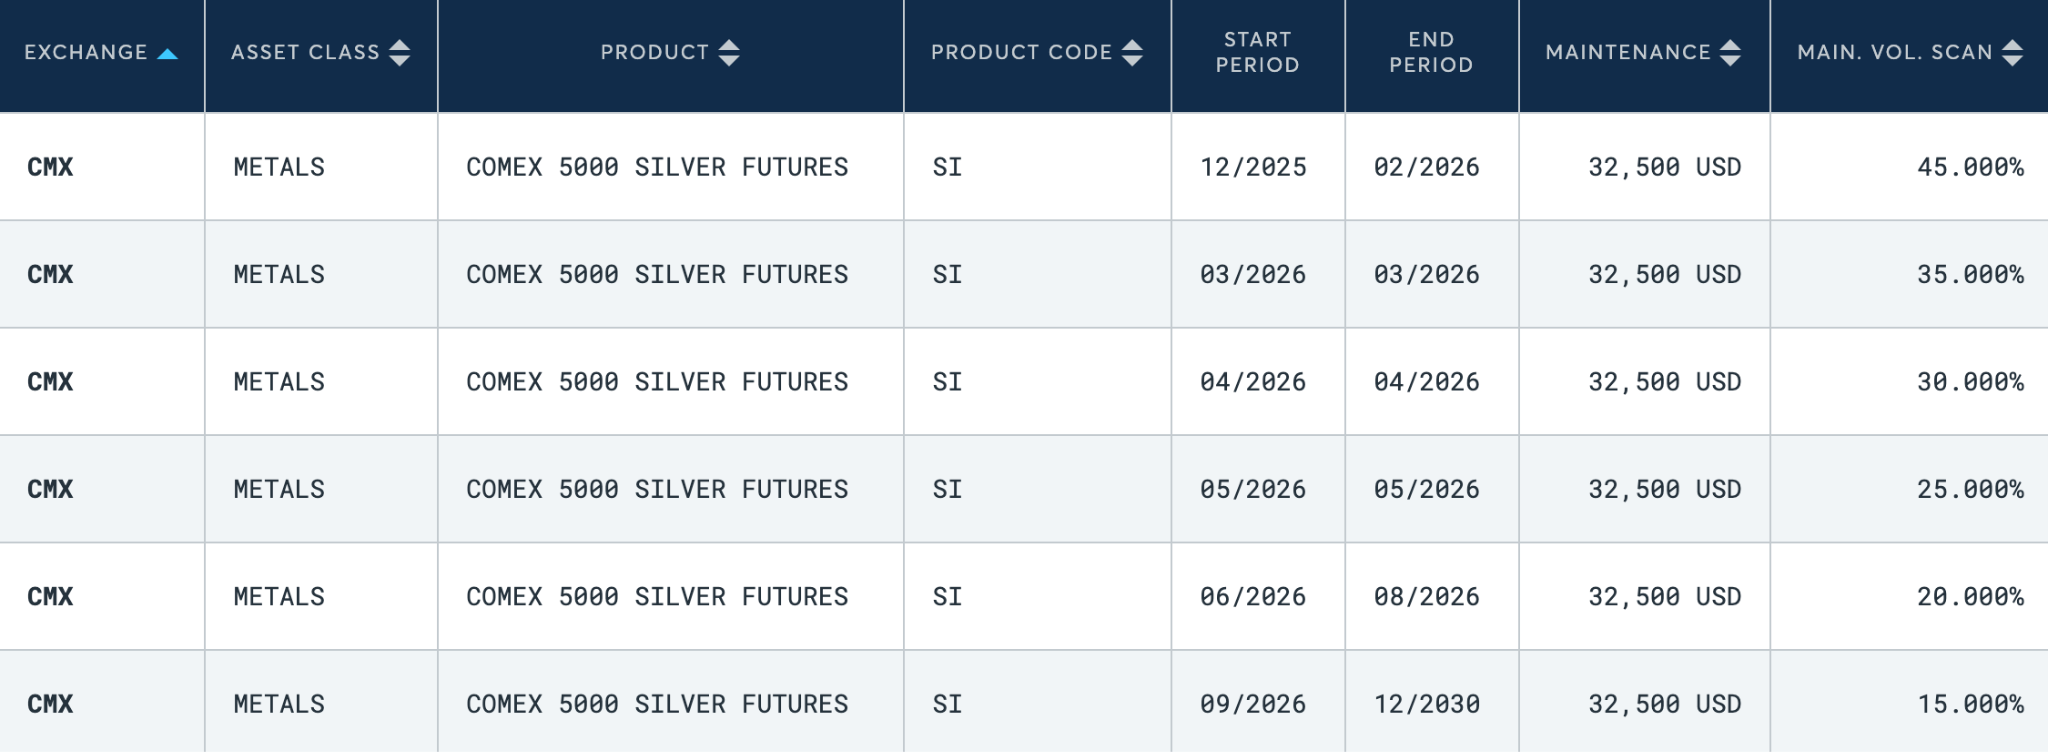
The silver market is now grappling with a growing disconnect between paper contracts and physical metal. Futures prices continue to be driven by liquidity and margin dynamics, but physical buyers are paying a significantly different price. While the heavily traded COMEX March 2026 contract closed near $72 per ounce, one-ounce silver coins in Dubai are trading close to $100, a spread that far exceeds normal fabrication premiums.
This divergence reflects stress rather than speculation. Industrial users cannot substitute paper silver for physical metal. Solar manufacturers, electronics firms, and EV producers require real supply, and geopolitical constraints are tightening access. China’s decision to classify silver as a strategic commodity has further restricted exports, turning each outbound shipment into a political decision rather than a simple response to price signals.
Expert outlook
Attempts to cool the rally have had limited success. CME Group recently raised margin requirements on silver futures by more than 60%, forcing leveraged traders to reduce exposure and increasing short-term volatility.
Veteran trader Francis Hunt argues that such measures “shake out weak hands” but do nothing to solve the underlying shortage. In a structurally tight market, higher margins cannot create new ounces.
Looking ahead, analysts see volatility as inevitable but not necessarily bearish. As long as industrial demand continues to rise and geopolitical risk constrains supply, pullbacks are likely to attract buyers rather than signal exhaustion. The silver market is increasingly behaving less like a speculative trade and more like a strategic resource.
Key takeaway
Silver’s rise is not simply a reaction to geopolitical fear. It reflects a market shaped by years of under-supply, rising industrial demand, and tightening political control over physical flows. Margin hikes and volatility may slow the pace, but they cannot reverse the structural imbalance. The next signals to watch are industrial demand trends, Chinese export policy, and whether physical premiums continue to widen.
Silver technical outlook
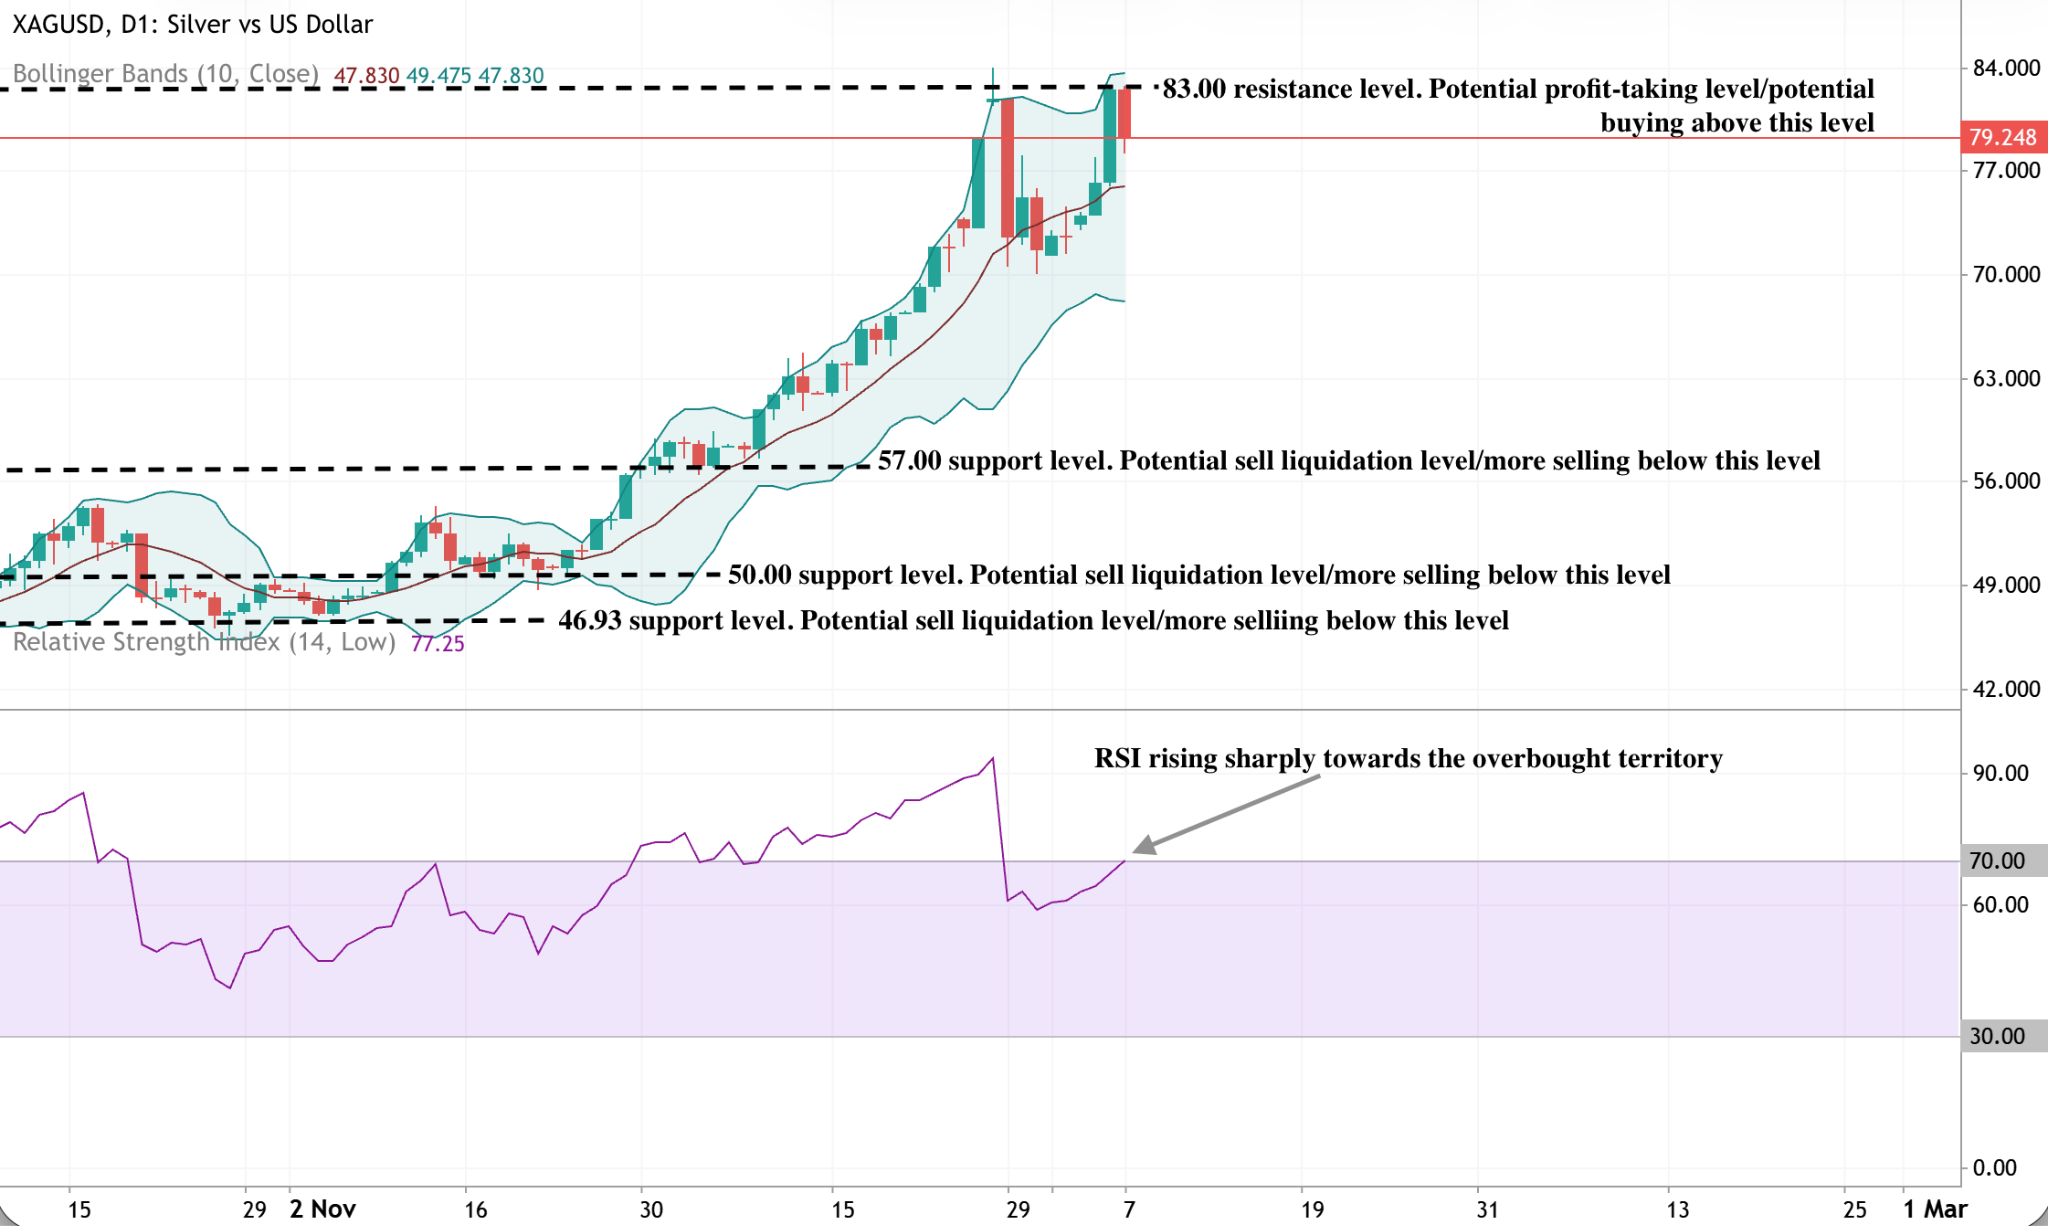
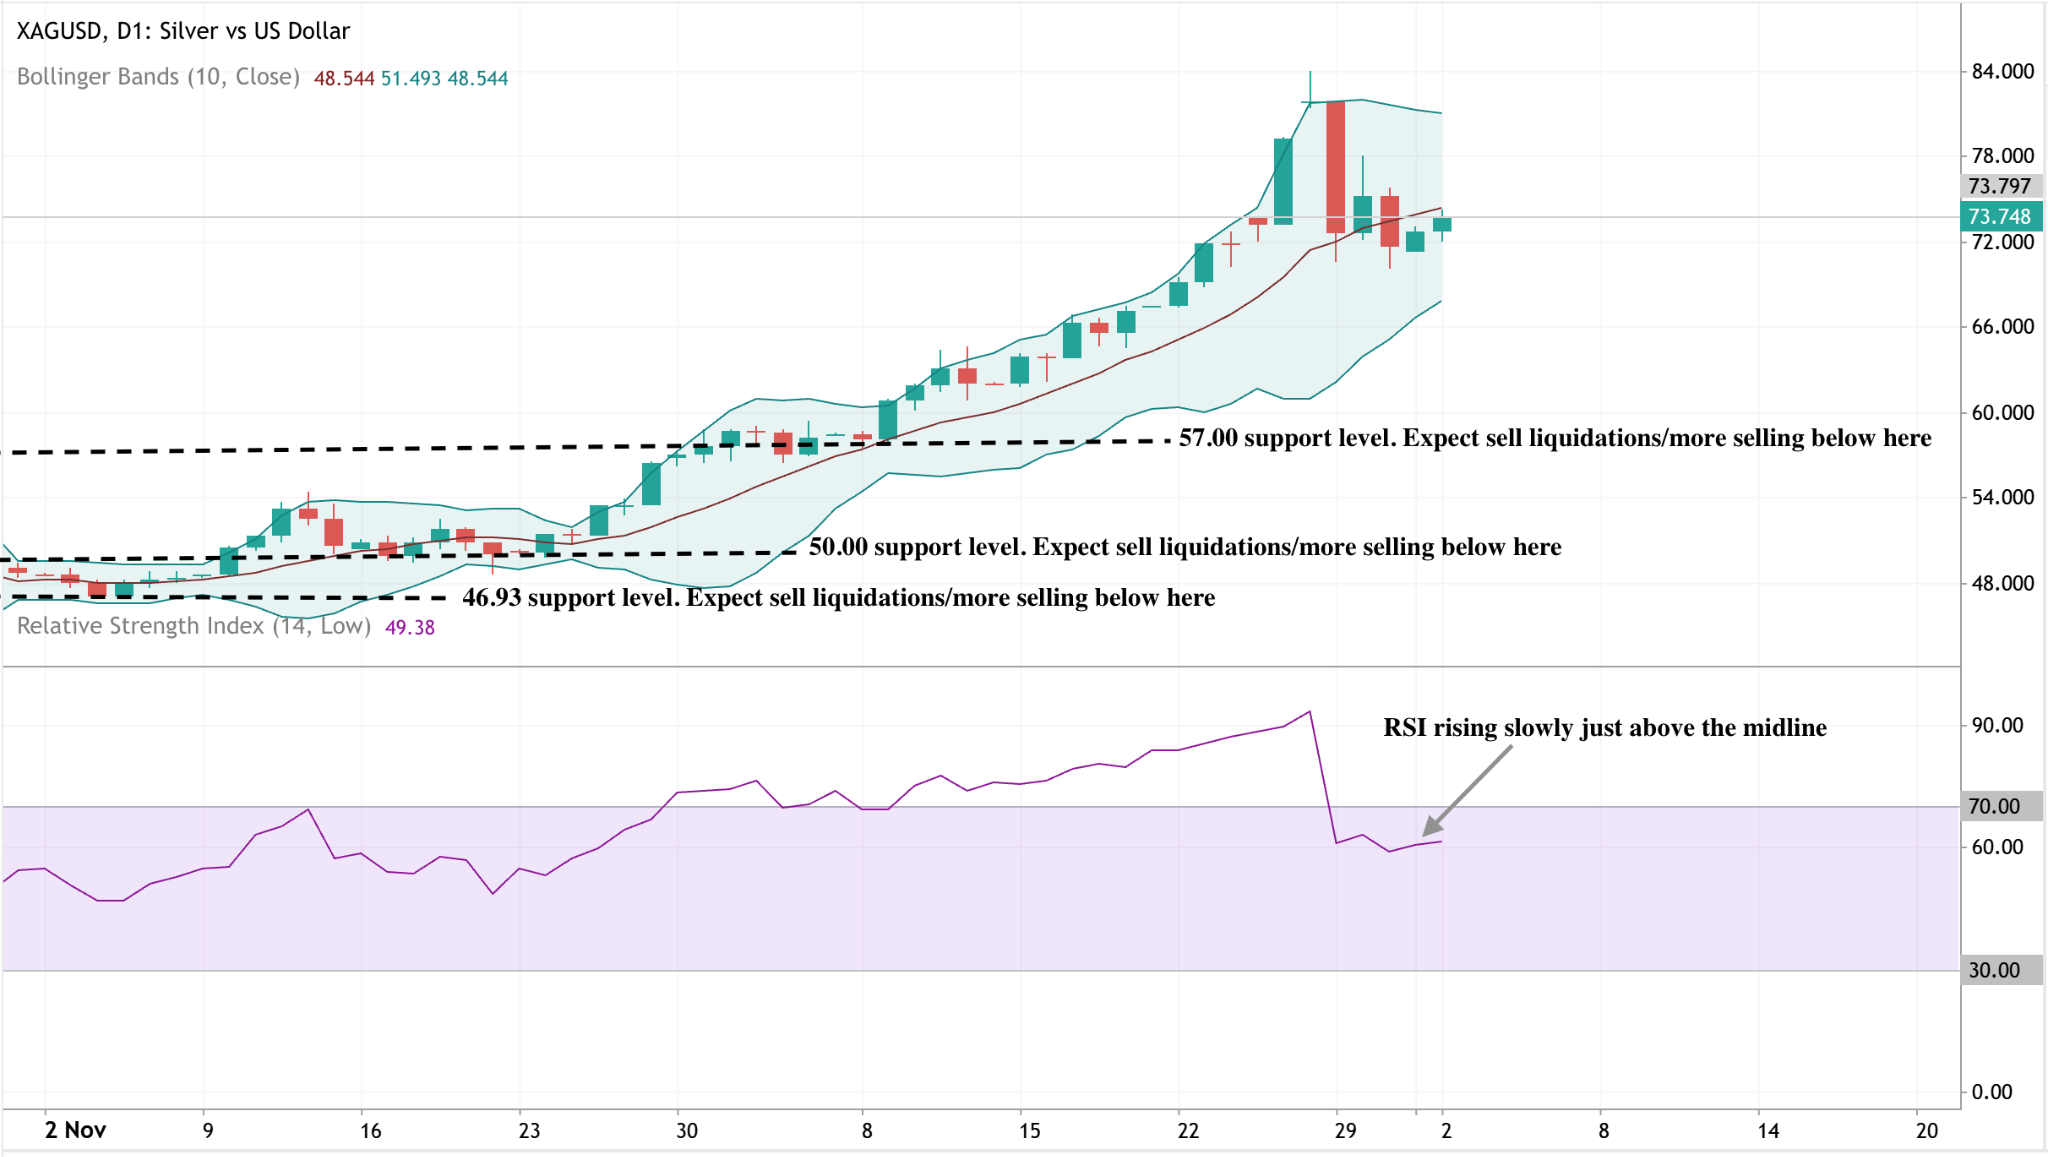
Silver is extending its strong bullish advance but is now stalling just below the $83 resistance zone, an area that has historically attracted profit-taking. The rally has been fuelled by expanding Bollinger Bands, signalling elevated volatility and aggressive upside momentum.
However, momentum indicators suggest the move is becoming stretched: the RSI is rising sharply toward overbought territory, increasing the risk of near-term consolidation rather than signalling an immediate reversal.
Structurally, the trend remains firmly constructive as long as price holds above the $57 support, with deeper downside protection at $50 and $46.93. A sustained break above $83 would likely reopen the upside, while failure to clear resistance could see silver pause to digest gains before the next directional move.

Crypto enters 2026 on a strong footing, but liquidity is the real test
Crypto markets have started 2026 with renewed momentum after a sluggish end to last year, supported by fresh institutional inflows and fading year-end selling pressure.
Crypto markets have started 2026 with renewed momentum after a sluggish end to last year, supported by fresh institutional inflows and fading year-end selling pressure. Bitcoin is up more than 7% since 1 January, Ether has gained around 9%, and several large-cap altcoins have posted double-digit weekly advances, indicating a broad-based recovery rather than a single-asset bounce.
Yet beneath the surface, the rally is unfolding in an environment of unusually thin liquidity. With spot volumes near multi-year lows and price sensitivity elevated, early-year strength is being tested by a familiar question for crypto markets: is this the start of a durable trend, or a fragile rebound vulnerable to sharp reversals?
What’s driving the early-2026 crypto rally?
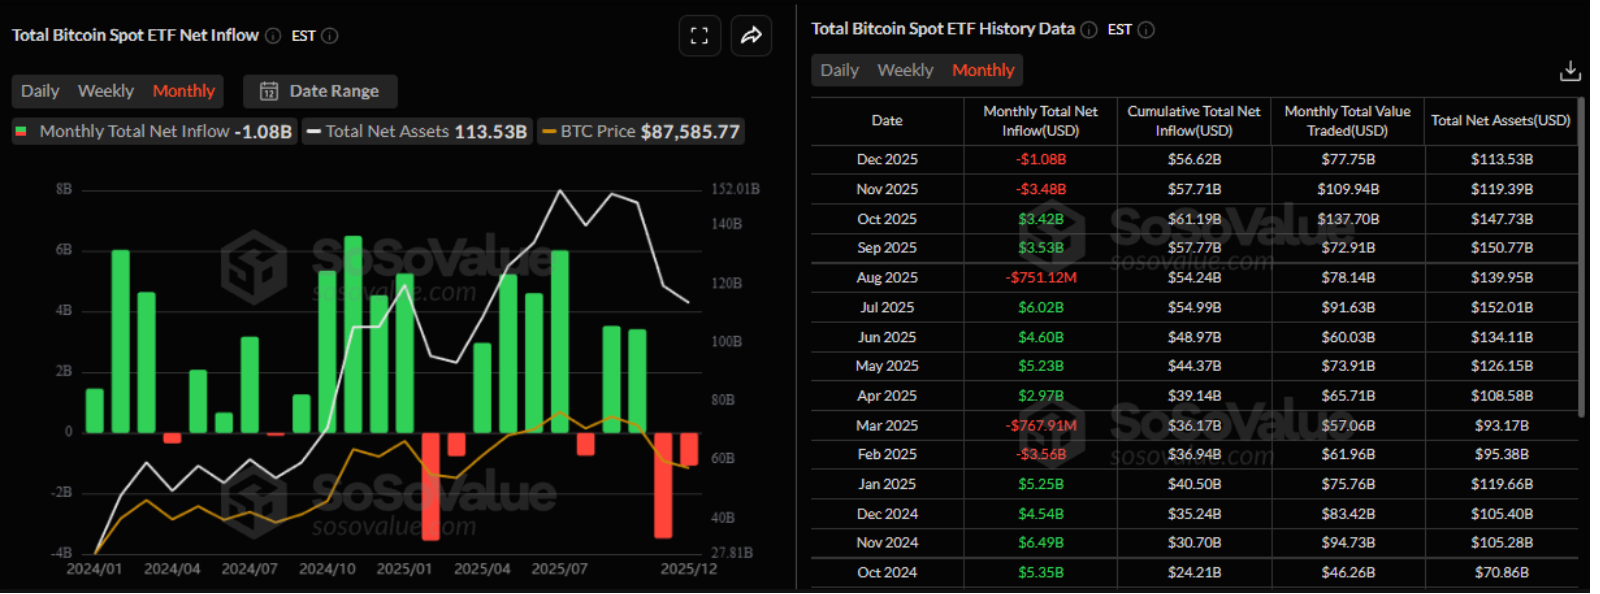
The most important shift has been the return of institutional demand through U.S.-listed spot crypto ETFs. After nearly two months of sustained outflows in late 2025, the 11 approved funds recorded more than $1 billion in net inflows over the first two trading days of 2026, signalling an abrupt end to the recent de-risking phase.
These flows have helped stabilise prices during a period of low liquidity, particularly for Bitcoin and Ether.
Seasonality has reinforced the move. The pressure from tax-loss harvesting, which capped upside through December, has faded, allowing risk appetite to re-emerge as fresh annual allocations come into play. QCP Capital described the shift as a potential regime change, with crypto once again aligning with broader risk assets as policy optionality and macro positioning regain focus.
Geopolitical developments have added a defensive dimension to the rally. The U.S. military strike on Venezuela triggered a haven bid across hard assets, including gold and Bitcoin, while speculation around increased Venezuelan oil supply under U.S. guidance introduced a disinflationary narrative. Lower oil prices would ease inflation pressure and strengthen the case for faster rate cuts - a macro backdrop that tends to favour both technology stocks and crypto assets.
Why it matters
This early-year strength is significant because it suggests that crypto markets may be emerging from a prolonged corrective phase rather than staging a short-lived relief rally. Price action across large-cap tokens supports that view. XRP surged nearly 29% on the week, Solana gained more than 20%, and Dogecoin rallied sharply, reflecting renewed appetite for higher-beta exposure alongside Bitcoin.
However, confidence remains uneven. Jeff Anderson, head of Asia at STS Digital, noted that the rally reflects a mix of fresh risk budgets, asset rotation, and flows into hard assets driven by geopolitical headlines. That blend of motives makes the recovery more complex - and potentially more fragile - than a pure risk-on surge.
For investors, the message is nuanced. Momentum has improved, but participation is still selective. Without broader conviction across spot markets, price gains remain highly sensitive to incremental flows rather than deep structural demand.
Impact on crypto market structure
One of the clearest consequences of thin liquidity has been amplified price movement. Spot volumes across major exchanges remain at their lowest levels since late 2023, leaving order books shallow and vulnerable to large trades. In such conditions, relatively modest inflows can push prices sharply higher - but the same dynamic applies in reverse.
Vikram Subburaj, CEO of Giottus exchange, warned that while short-term structure has flipped from weakness to strength, weak volume increases the risk of sharp extensions or abrupt pullbacks. According to Subburaj, the current setup is constructive, but conviction is not yet broad-based.
Derivatives markets are reflecting cautious optimism rather than outright euphoria. Options data from Deribit shows traders accumulating call options around the $98,000–$100,000 range for Bitcoin, alongside bullish positioning in Ether between $3,200 and $3,400. While positioning is directional, volumes remain modest, suggesting traders are hedging upside exposure rather than aggressively chasing it.
Expert outlook
From a technical perspective, the broader crypto market is showing early signs of structural improvement, led by Bitcoin’s breakout above its prior descending channel. That move signals a shift away from persistent sell-side control, but the lack of strong follow-through keeps the rally on probation rather than confirmation.
Key resistance zones - particularly Bitcoin’s $94,000–$96,000 area - will act as a litmus test for broader market strength. Sustained acceptance above these levels, supported by expanding volatility and rising spot participation, would strengthen the case for a more durable uptrend across crypto assets.
Analysts at Bitfinex emphasise that upcoming ETF flow data will be critical. Persistent inflows could anchor prices during low-liquidity conditions, while any slowdown risks exposing the market’s fragile depth. For now, crypto enters 2026 with momentum — but not yet with full conviction.
Key takeaway
Crypto markets have entered 2026 with renewed momentum, driven by institutional inflows, fading seasonal pressure, and supportive macro narratives. However, thin liquidity remains the defining risk, amplifying both upside and downside moves. Whether this rally evolves into a durable trend will depend on sustained participation and improving market depth. Until then, strength should be respected - but not mistaken for certainty.
BTC technical outlook
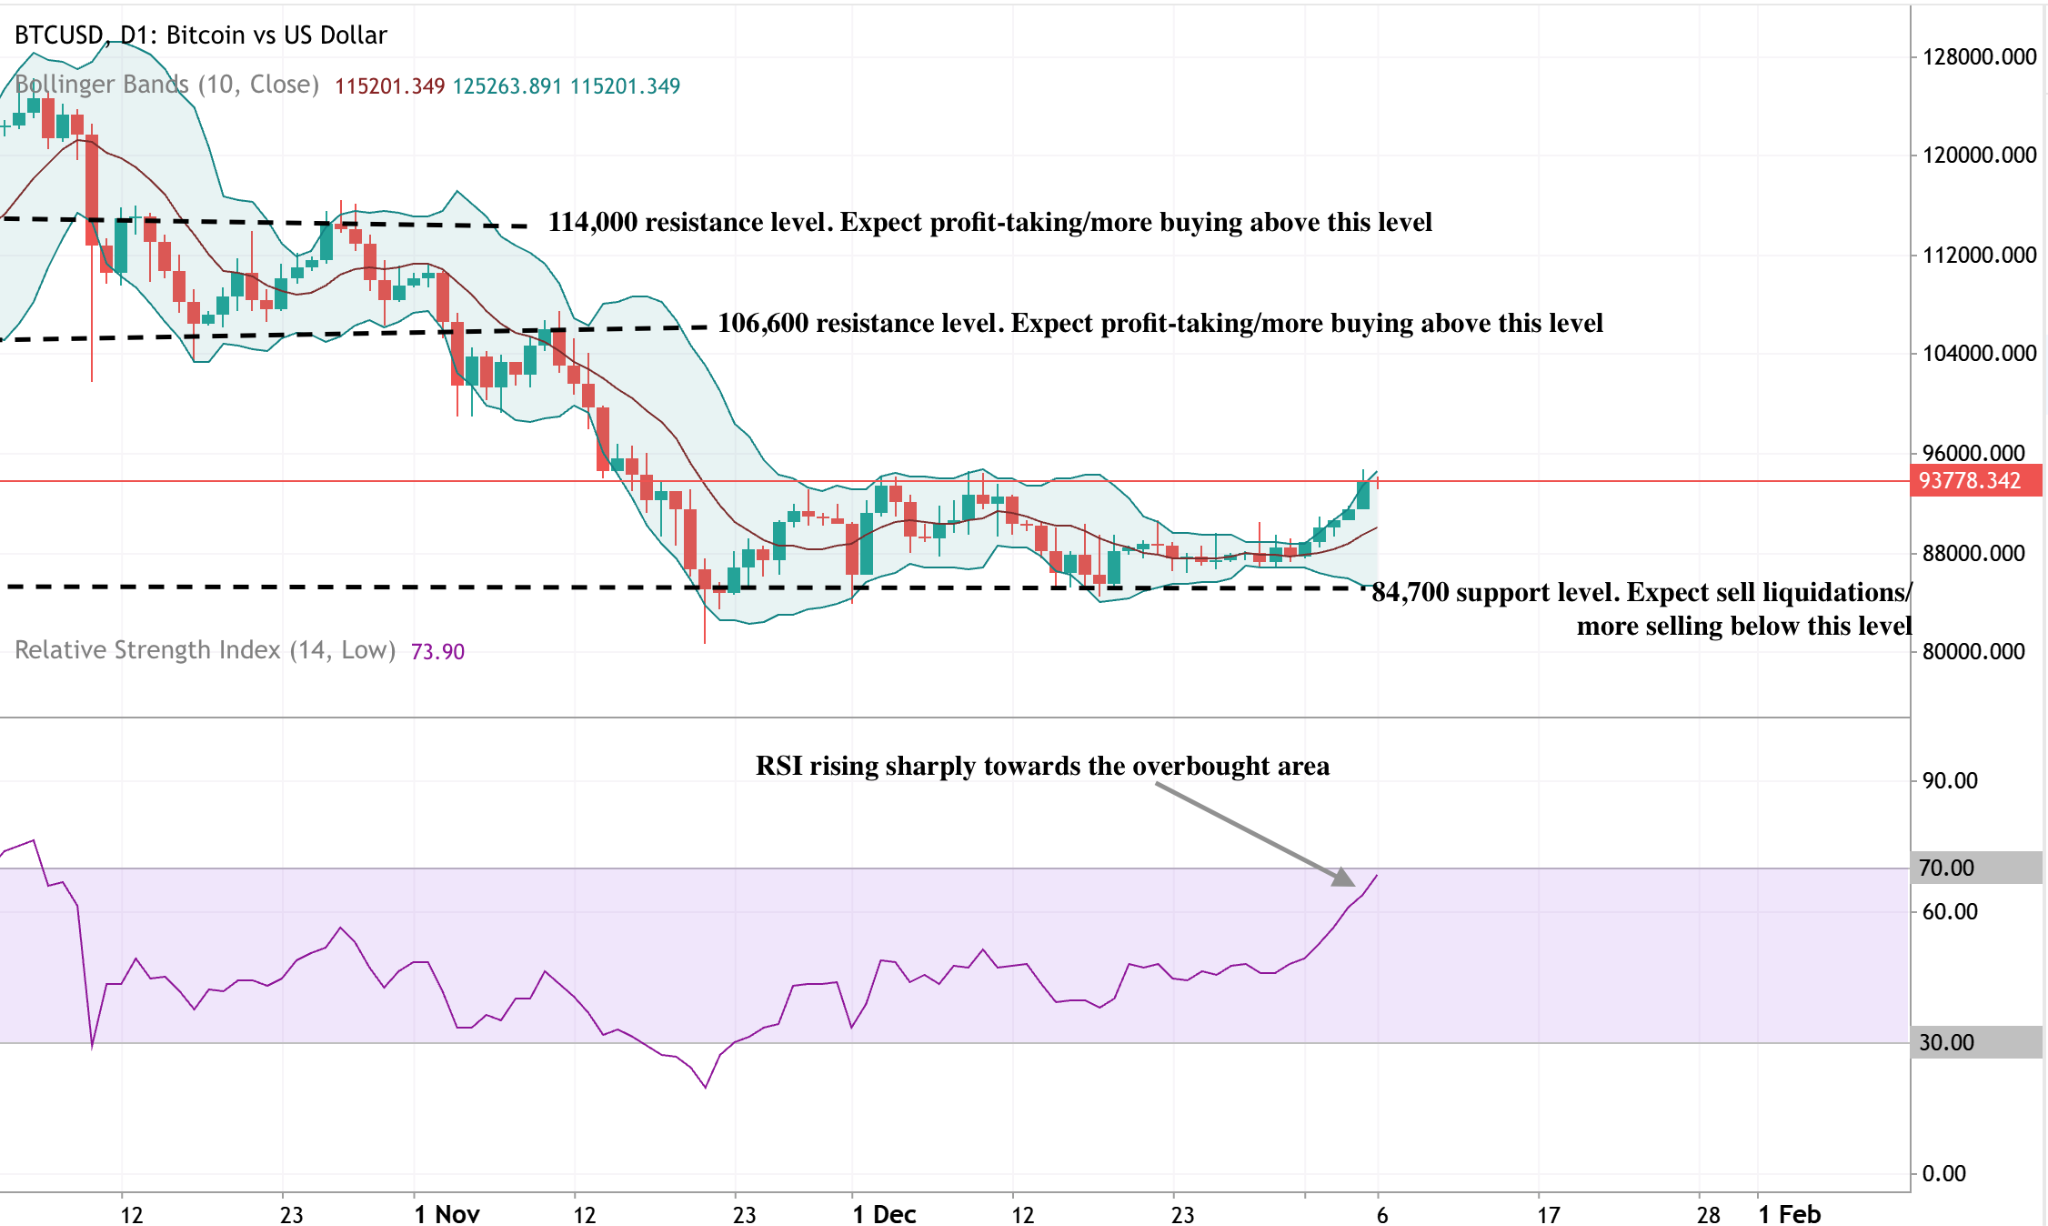
Bitcoin is attempting a bullish recovery after defending the $84,700 support zone, with price pushing back toward the $94,000 area and reclaiming the upper half of its recent range. The rebound has been accompanied by expanding Bollinger Bands, signalling a pickup in volatility as buyers step back in.
Momentum indicators, however, suggest that the move may be entering a more tactical phase: the RSI is rising sharply toward overbought territory, indicating strong short-term momentum but also increasing the risk of near-term profit-taking.
Structurally, upside remains capped by resistance at $96,000, followed by $106,600 and $114,000, where previous rallies stalled. As long as BTC holds above $84,700, the broader structure remains constructive, but sustained upside will likely require consolidation to absorb overbought conditions before a more durable advance can unfold.

AMD vs Nvidia at CES 2026: Two different AI chip moves
At CES 2026, AMD is bringing AI to PCs and the edge, while Nvidia focuses on scaling AI supercomputers for hyperscalers.
AMD and Nvidia used CES 2026 to redraw the AI-chip battlefield. While AMD is pushing AI everywhere, from PCs to embedded edge, Nvidia is doubling down on full-stack AI supercomputers for hyperscalers.
Nvidia (NVDA) is trading near the top of its 52‑week range in the high‑$180s to low‑$190s, after a 2025 run powered by data-centre GPU demand and hyperscaler AI capex. AMD (AMD) has logged ~70% 1‑year gains, but still trades at a discount to NVDA on price‑to‑sales despite investors increasingly treating it as “AI beta with catch‑up potential.”
AMD: “AI everywhere” from PC to accelerator
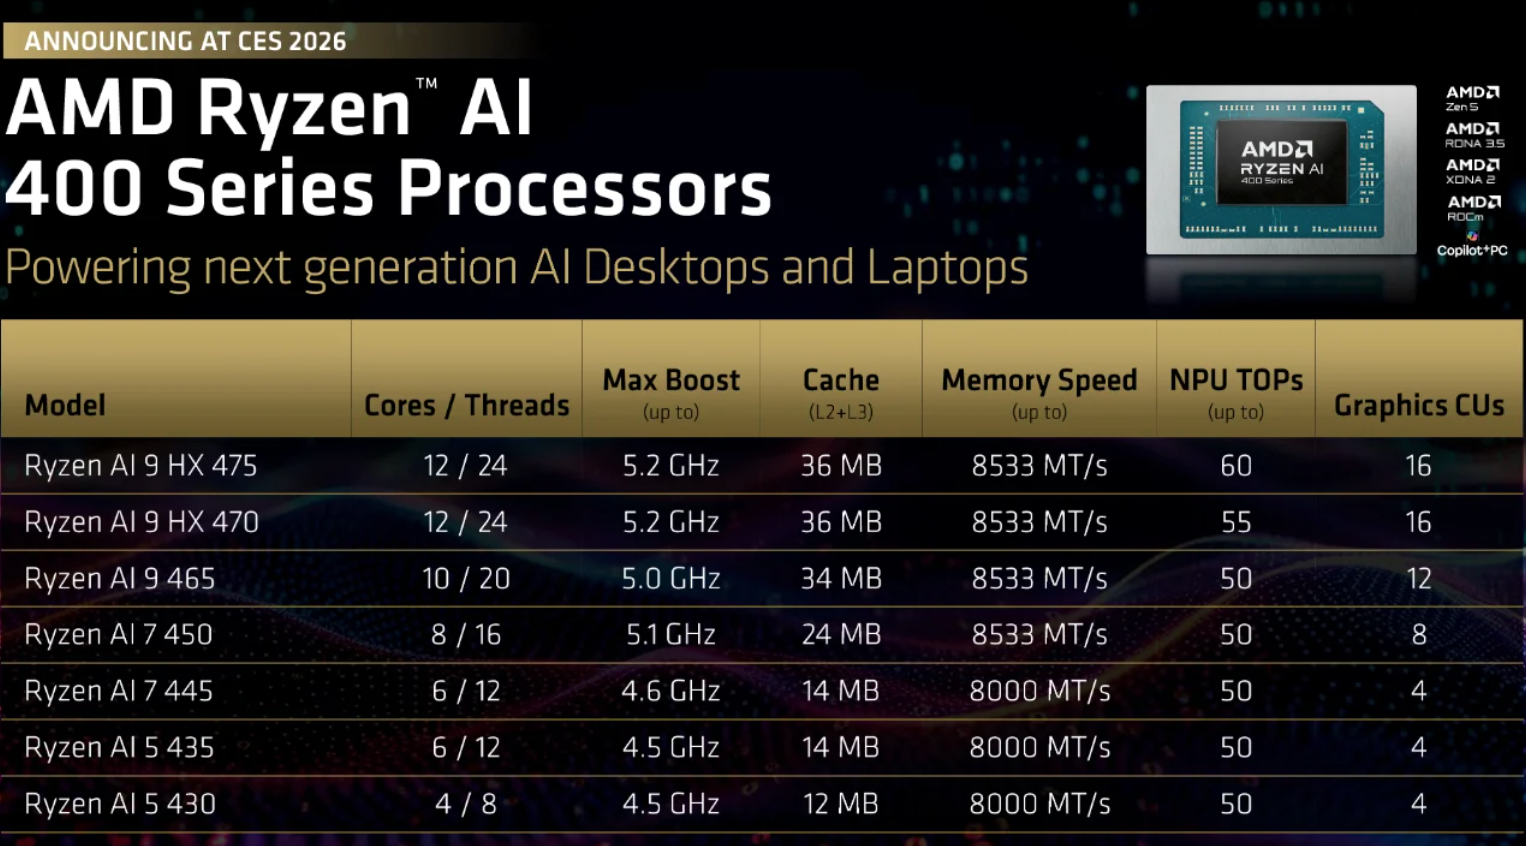
At CES, AMD expanded its Ryzen AI portfolio with new Ryzen AI 400 / AI Max+ laptop chips, as well as a fresh Ryzen AI Embedded line built on Zen 5, targeting automotive, industrial, and “physical AI” deployments. Management is explicitly pitching the PC install base as a distributed AI edge, with OEM designs expected to ramp through 2026.
On the data-centre side, AMD is extending its MI300/MI455 accelerator roadmap, positioning these GPUs as lower-cost, more open alternatives to Nvidia for training and inference at scale, with coverage flagging OpenAI-type customers as realistic adopters. For trading desks, AMD screens as a classic “share‑gain story”: smaller installed base, but significant operating leverage if ROCm, MI‑series wins, and Ryzen AI attach rates come through.
Nvidia: doubling down on AI supercomputers
Nvidia answered with the Rubin platform - six new chips, including Rubin GPUs, Vera CPUs and updated NVLink 6 / Spectrum‑X networking, sold as a turnkey AI supercomputer stack.

Rubin is explicitly aimed at “AI factories” for advanced models and agentic workloads, with first systems due in the second half of 2026.
Crucially, Rubin is being rolled out with all four major hyperscalers (AWS, Azure, Google Cloud, Oracle Cloud) and specialist GPU clouds, reinforcing Nvidia’s role at the centre of AI infrastructure spend. From a trading perspective, NVDA remains the de facto AI index: richly valued, but underpinned by multi‑year cloud capex; any visible shift toward custom ASICs or slower AI budgets is the key risk to the current multiple
Why it matters
CES 2026 underlined that the AI trade is entering a more demanding phase. The easy narrative - “AI equals GPUs equals upside” - is fading. What matters now is where AI workloads actually land, how durable capital spending proves to be, and which vendors retain pricing power as inference, efficiency and deployment take centre stage.
Nvidia’s strategy reinforces its position at the core of hyperscaler AI budgets, but that concentration cuts both ways. As training matures and inference scales, margins are likely to compress and competition - from AMD, custom silicon, and cloud-native alternatives - will intensify. Execution risk is rising just as valuations remain elevated.
AMD, by contrast, is leaning into breadth rather than dominance. Its “AI everywhere” approach positions it to benefit if AI adoption spreads beyond mega-scale data centres into PCs, industrial systems and embedded use cases. For markets, that makes AMD less about outright leadership and more about incremental share capture across a widening AI surface area.
In short, CES confirmed that AI is no longer a single-trade story. The next leg will be shaped by deployment economics, not just compute ambition.
Strategic read‑through for the AI‑chips trade
CES 2026 confirms that neither vendor is selling bare chips anymore; both are shipping platforms - silicon, plus interconnect, plus software ecosystems (CUDA vs. ROCm) and reference systems.
For investors, the core questions are now: who wins incremental hyperscaler workloads, how much pricing power survives as AMD, custom silicon and regulatory pressure ramp, and how durable AI capex is through the next macro slowdown.
Within that framework, Nvidia remains the high-conviction core AI infrastructure exposure, while AMD offers higher-beta upside if its “AI everywhere” strategy delivers real share gains in accelerators and PC/edge AI over the next 12– 24 months.
Key takeaway
CES 2026 highlighted a clear strategic divergence. According to analysts, Nvidia is a high-conviction, system-level bet on hyperscaler AI infrastructure, but with rising sensitivity to inference economics, pricing pressure and macro conditions. AMD offers higher-beta upside through its push to embed AI across PCs, edge devices and alternative accelerator stacks - a riskier path, but one with meaningful leverage if adoption broadens over the next 12–24 months.
For investors and traders, the AI-chip trade is evolving from a momentum story into a selectivity trade, where platform stickiness, cost efficiency and workload mix matter as much as raw performance.
AMD and Nvidia technical outlook
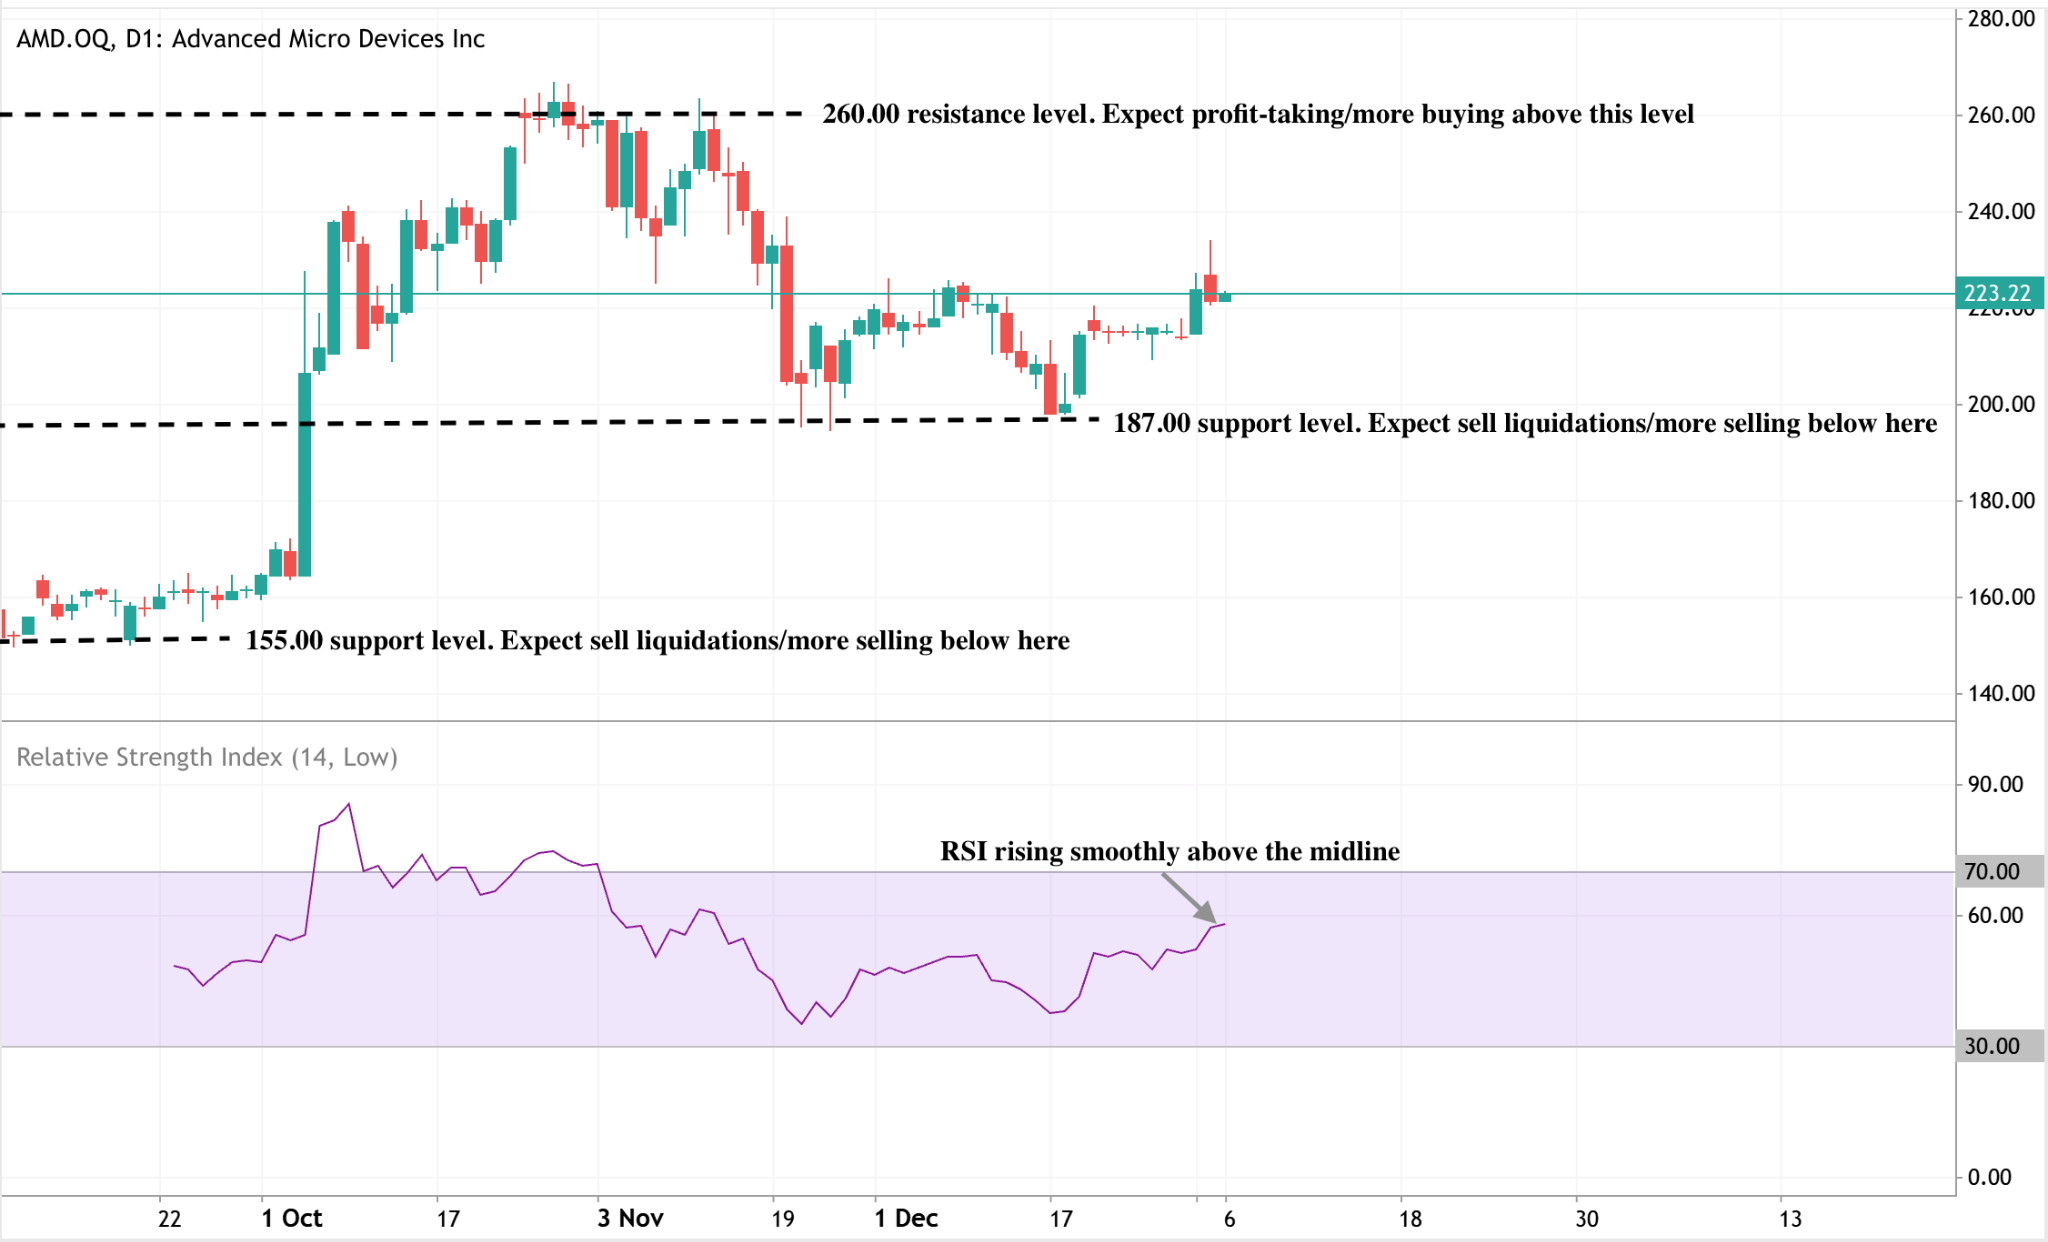
AMD is stabilising after a volatile pullback from the $260 highs, with price consolidating around the $223 area as buyers cautiously step back in. While the broader structure remains range-bound, momentum is improving: the RSI is rising smoothly above the midline, signalling a gradual rebuild in bullish conviction rather than a sharp risk-on surge.
From a structural perspective, the $187 support remains a key downside level, with a break below likely to trigger liquidation-driven selling, while the deeper $155 zone marks longer-term trend support.
On the upside, the $260 resistance continues to cap the recovery, meaning AMD will need sustained buying pressure to confirm a renewed trend higher. For now, price action suggests consolidation with a mild bullish bias, rather than a decisive breakout.
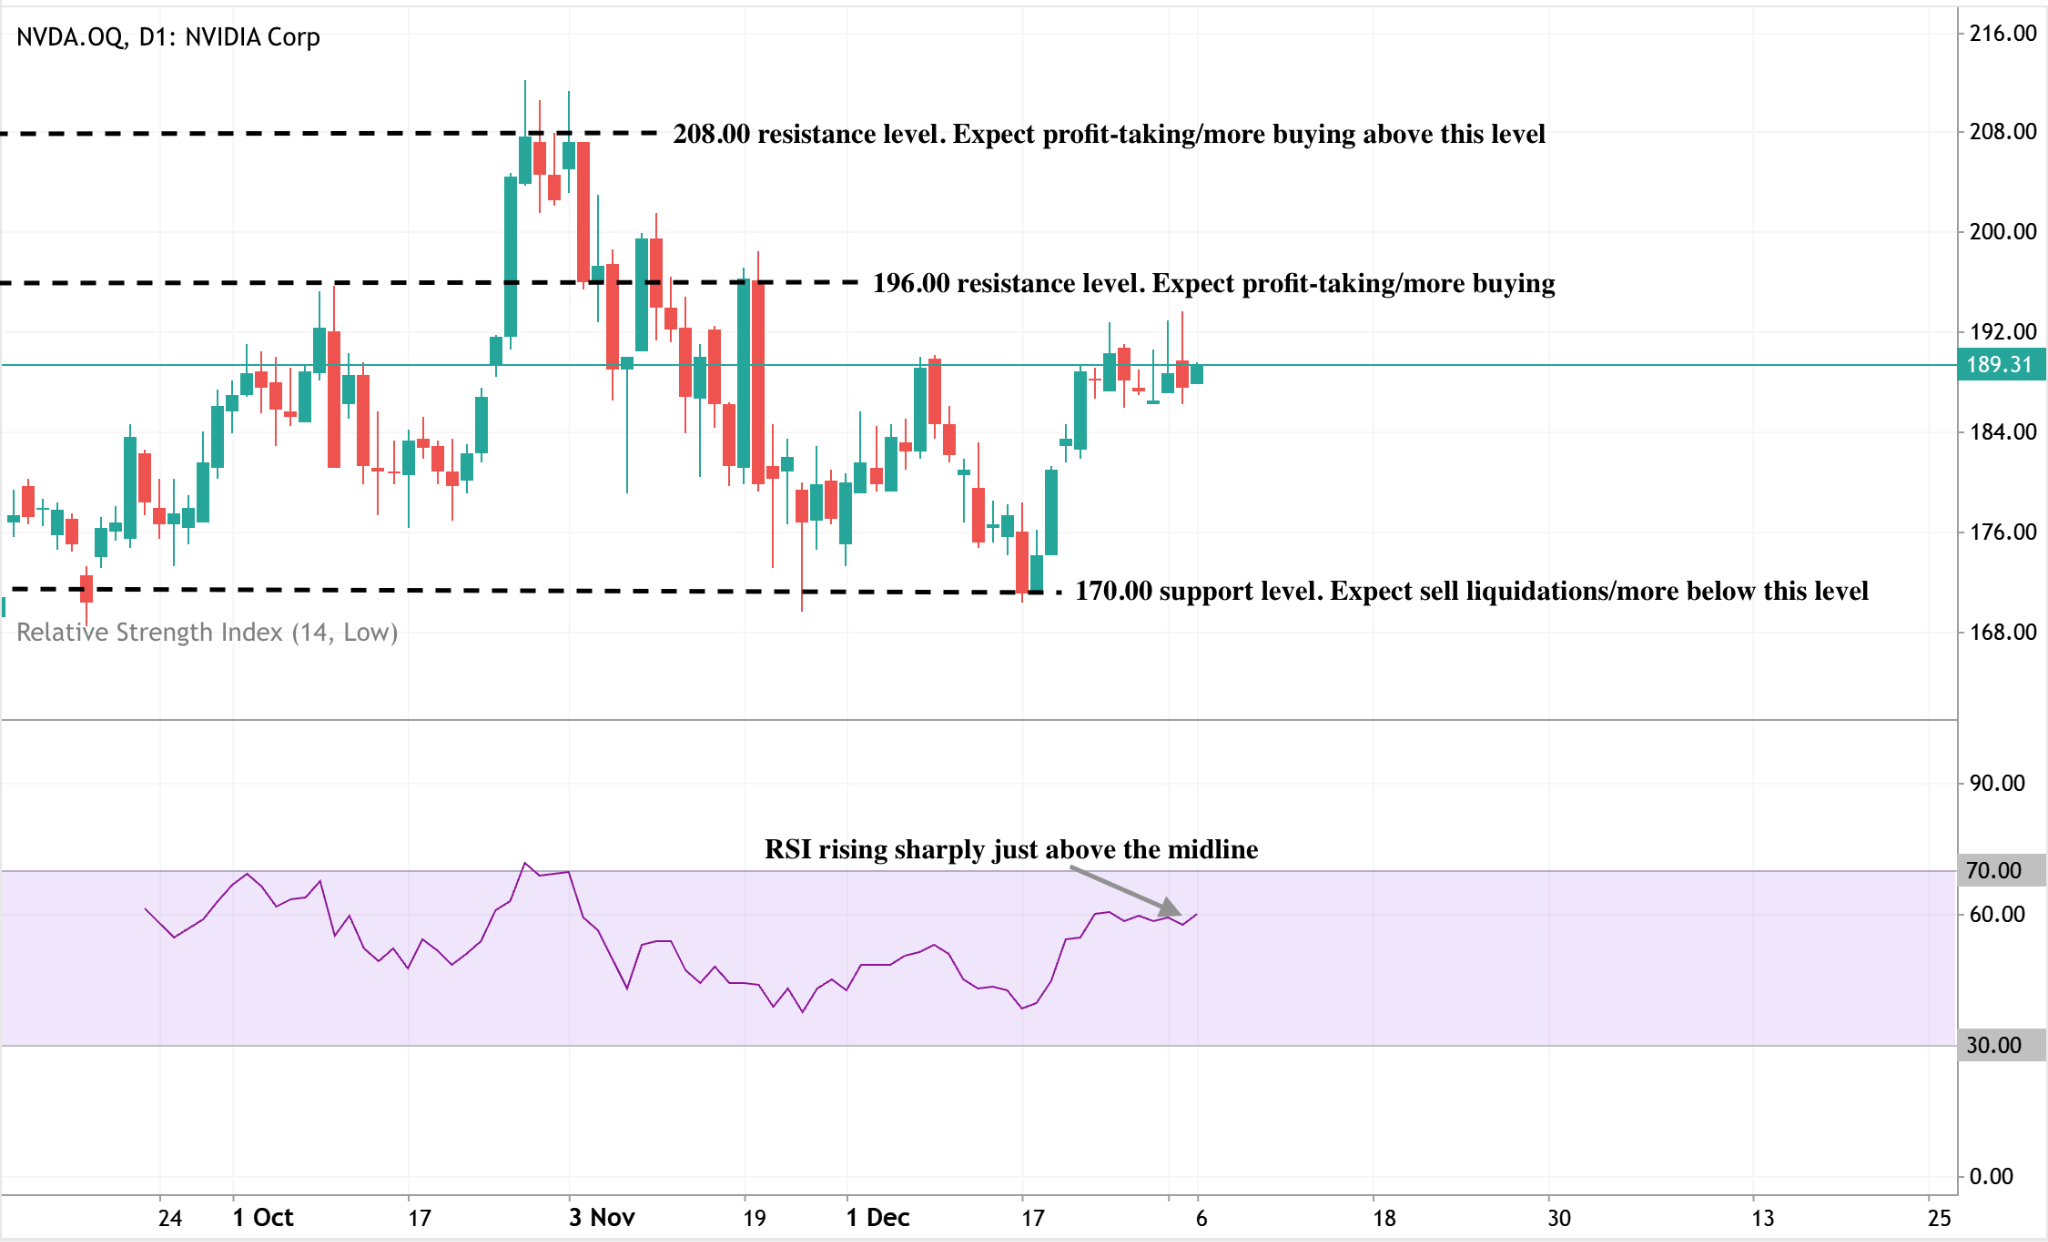
NVIDIA is attempting to stabilise after its recent pullback, with price reclaiming the $189 area and moving back toward the middle of its broader range. The rebound from the $170 support zone has improved short-term structure, while momentum is beginning to turn constructive: the RSI is rising sharply just above the midline, signalling strengthening buying interest rather than a purely technical bounce.
That said, upside progress remains capped by resistance at $196 and the key $208 level, where previous rallies have triggered profit-taking. As long as NVDA holds above $170, the broader structure remains intact, but a sustained break above $196 would be needed to confirm a more durable bullish continuation.
%20(1)%20(1)%20(1)%20(1).png)
Nvidia’s 2026 test: Can AI inference drive the next leg higher?
Nvidia's 2026 growth hinges on AI inference. Wall Street sees this 'real-time' stage as the key battleground for its next profit engine.
According to analysts, Nvidia’s next leg higher in 2026 will hinge on its ability to turn AI inference into a durable profit engine. While the company remains the backbone of AI training infrastructure, Wall Street increasingly views inference - the stage where trained models generate real-time outputs - as the defining battleground for the next phase of growth.
That view comes as semiconductor stocks opened 2026 with force, with the Philadelphia Semiconductor Index jumping 4% in the first session of the year, significantly outperforming the S&P 500’s 0.19% rise.
The shift matters because inference is where efficiency, pricing power, and competition collide. Analysts warn that Nvidia now faces a more execution-driven market, where elevated valuations leave little margin for disappointment. With CES keynotes, a critical U.S. jobs report, and key product launches approaching, the coming weeks may shape how investors price Nvidia’s 2026 prospects.
What’s driving Nvidia in 2026?
The macro backdrop remains a powerful force. Semiconductor stocks are highly sensitive to interest-rate expectations because a significant portion of their value is tied to future earnings. As a result, even modest changes in Treasury yields can trigger sharp sector moves.
Investors enter 2026 still debating whether the Federal Reserve can ease policy later in the year without reigniting inflation, a balance that directly influences appetite for long-duration growth stocks like Nvidia.
At the company level, Nvidia’s growth narrative is evolving. The AI boom is no longer just about training massive models but about deploying them at scale. Inference workloads are rising rapidly as enterprises integrate AI into everyday operations, from search to customer support. Nvidia’s strategy reflects that shift, focusing on performance-per-watt, total cost of ownership, and ecosystem lock-in rather than raw computing power alone.
Why it matters
For investors, Nvidia’s transition comes with heightened expectations, according to analysts. The stock ended the latest session near $189, following a broader semiconductor rally that left valuations stretched. Market participants describe the prevailing mood as tactical rather than long-term, with Charles Schwab strategist Joe Mazzola noting that “buy the dip, sell the rip” remains the dominant mindset.
Analysts broadly agree that Nvidia’s leadership remains intact, but they are paying closer attention to competitive dynamics. Bank of America analyst Vivek Arya reiterated a buy rating and a $275 price target even while calling Nvidia’s late-2025 deal with Groq “surprising” and raising questions about exclusivity and pricing pressure. The message is clear: confidence remains, but scrutiny is rising.
Impact on the semiconductor market
Nvidia’s strategic decisions ripple far beyond its own balance sheet. Chipmakers operate within tightly linked supply chains, meaning changes in Nvidia’s product mix or pricing can affect foundries, memory suppliers, and rival designers. That interdependence is why appearances by Nvidia Chief Executive Jensen Huang and AMD Chief Executive Lisa Su at CES are viewed as sector-wide signals rather than company-specific events.
The broader market impact also runs through interest rates. Semiconductor stocks are among the most yield-sensitive equities, benefiting when bond yields fall and struggling when they rise. A stronger-than-expected U.S. jobs report could reignite concerns about sticky inflation, pushing yields higher and pressuring chip valuations. In that sense, Nvidia often trades as a proxy for both AI optimism and macro confidence.
Expert outlook
Looking ahead, analysts say Nvidia’s 2026 story is less about expansion and more about execution. The company’s non-exclusive licensing and talent agreement with Groq underscored that shift. Early reports framed the deal as a $20 billion acquisition, but the reality was a strategic partnership that gives Nvidia access to inference-focused expertise without full ownership.
Attention now turns to Nvidia’s Vera Rubin chip launch, expected to be a cornerstone of its inference strategy. Analysts will closely monitor signals for performance gains, energy efficiency, and customer adoption. At the same time, traders are monitoring whether Nvidia can hold the psychologically important $190 level. A sustained break lower would suggest recent gains were driven by positioning rather than new fundamentals, particularly if macro data turns unfavourable.
Key takeaway
According to analysts, Nvidia’s ability to drive its next leg higher in 2026 depends on execution in AI inference rather than headline-grabbing growth alone. The company still dominates AI infrastructure, but competition and macro sensitivity are rising. Elevated valuations leave little room for disappointment. Investors will be watching macro data, product timelines, and pricing power closely as Nvidia’s 2026 story unfolds.
Nvidia technical outlook
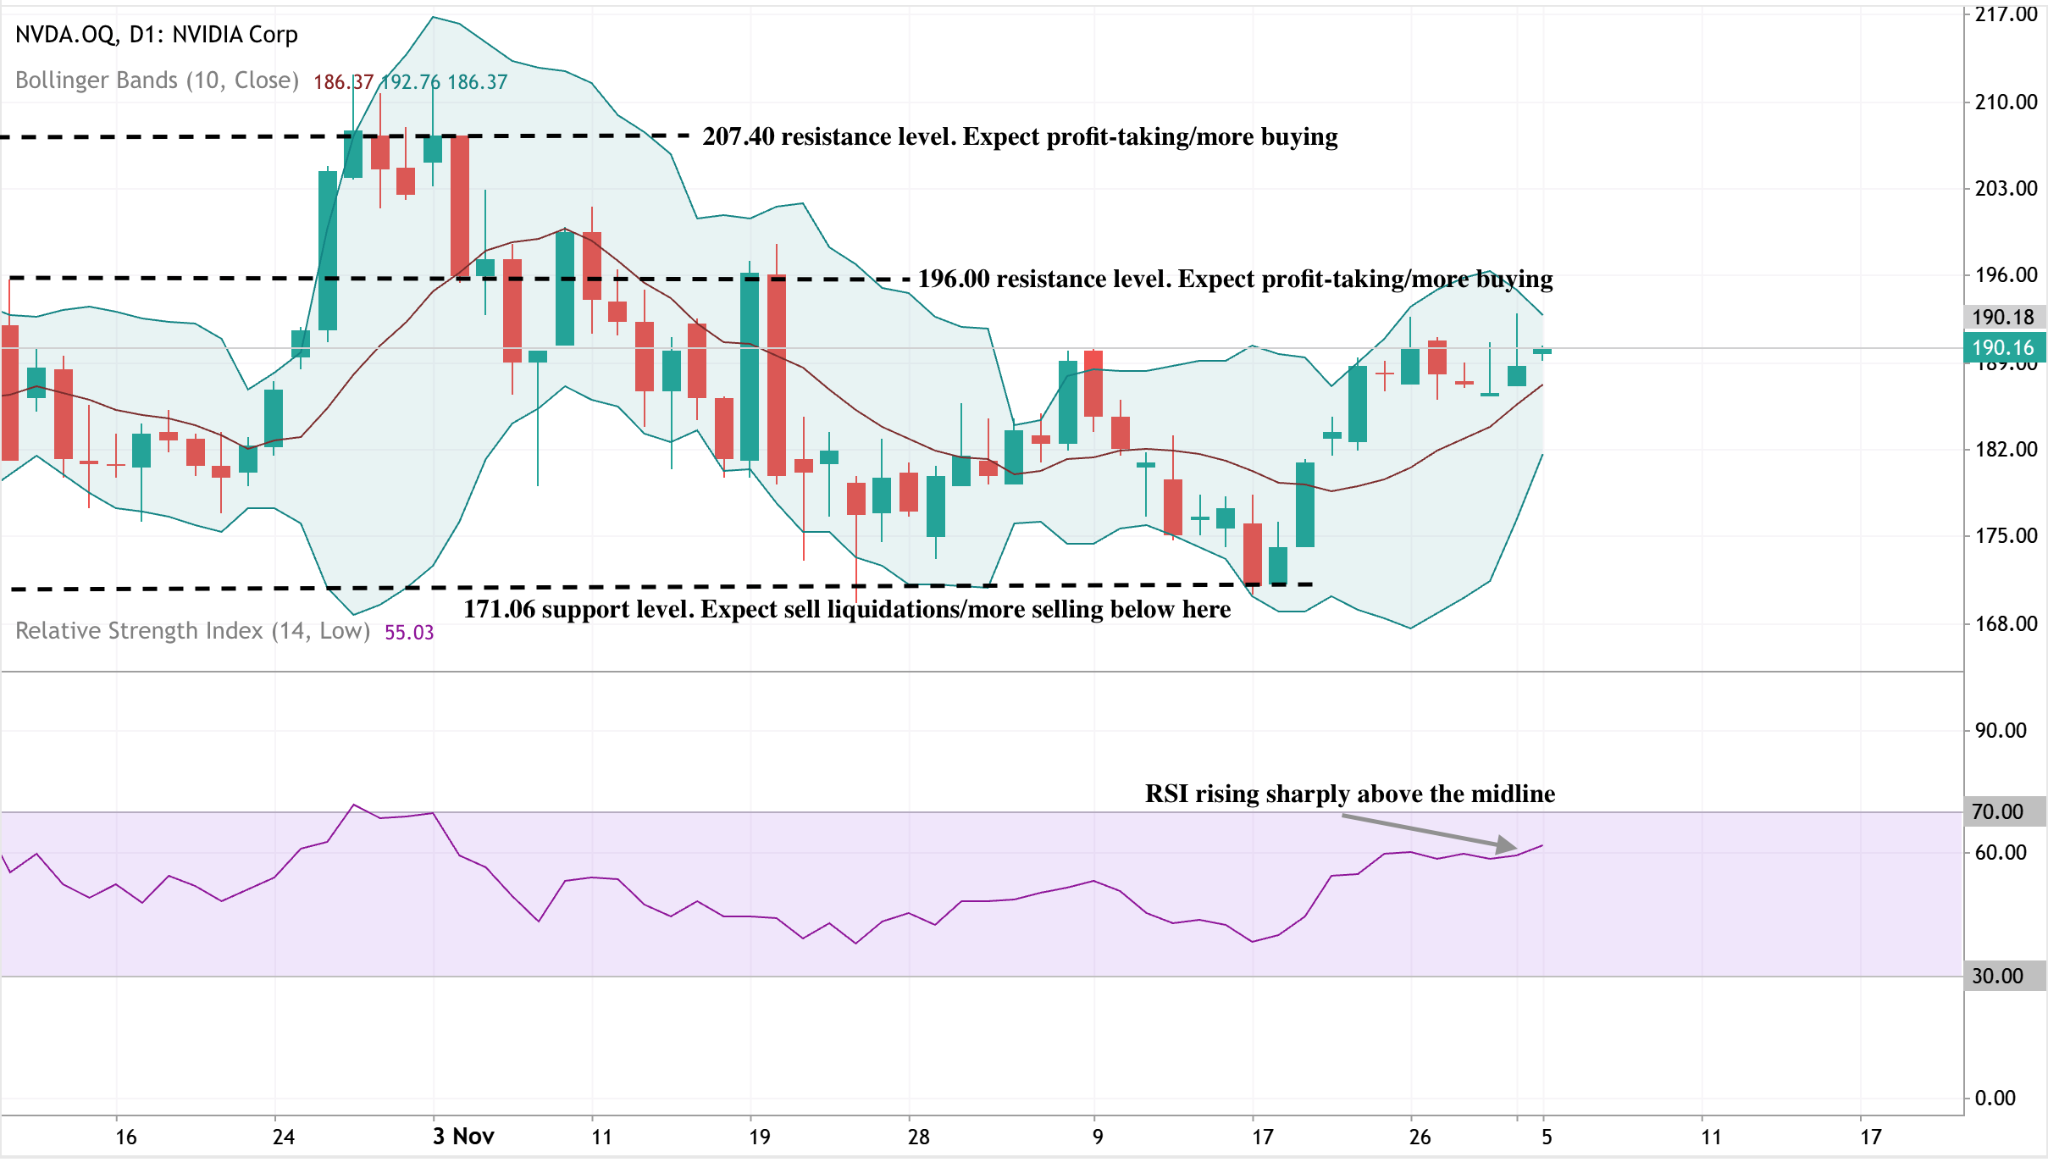
NVIDIA is rebounding from the $171 support zone, with price pushing back above the US$190 area and regaining the middle of its recent range. The recovery is being accompanied by improving momentum signals: the RSI is rising sharply above the midline, indicating strengthening bullish participation rather than a purely technical bounce.
Bollinger Bands are beginning to widen again after a period of compression, suggesting volatility is returning as buyers step back in. That said, upside progress remains capped by resistance at $196 and the key $207 level, where previous rallies have attracted profit-taking.
As long as NVDA holds above $171, the broader structure remains constructive, but a decisive break above $196 would be needed to confirm a more sustained bullish continuation.
.png)
Oil outlook: Why geopolitics isn’t enough to lift crude
The oil playbook is broken. Geopolitical shocks like Maduro's exit failed to rally crude, with prices stuck near 5-year lows.
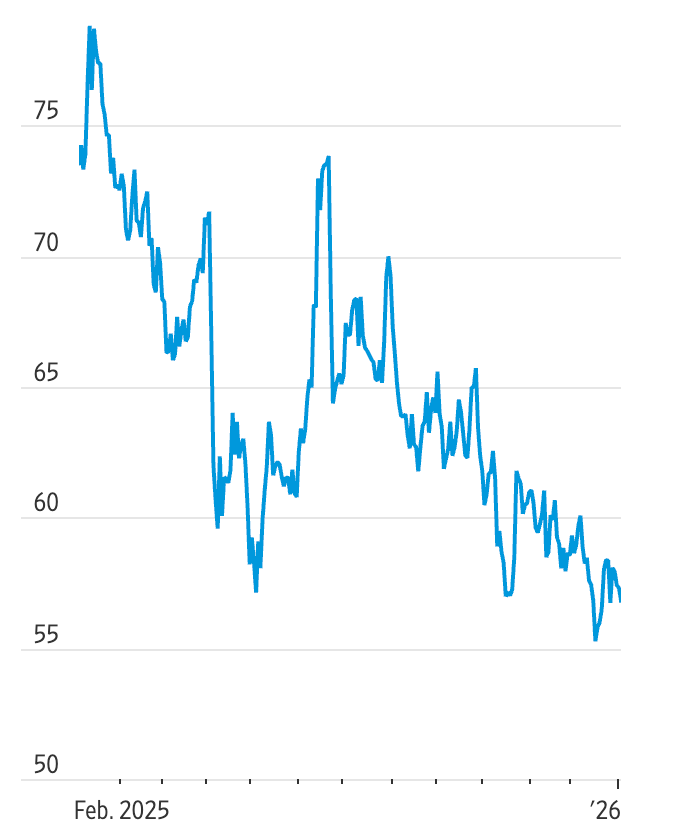
Geopolitical shocks once sent oil prices sharply higher, but analysts say that playbook no longer works on its own. Despite the dramatic removal of Venezuela’s President Nicolás Maduro and President Donald Trump’s pledge to send US oil majors back into the country, crude prices barely reacted. US benchmark oil hovered near $57 a barrel, while Brent traded just above $60, levels close to five-year lows.
According to analysts, the explanation lies in market structure rather than politics. Global supply remains abundant, demand growth is subdued, and spare capacity elsewhere can absorb disruptions. Until that balance changes, geopolitical events may generate headlines, but they struggle to generate sustained upside for crude.
What’s driving oil prices?
The dominant force shaping the outlook for oil is oversupply. The global market is already dealing with excess barrels as OPEC+ holds output steady and non-OPEC producers, led by the United States, continue pumping at or near record levels. US crude prices fell by around 20% last year, underscoring the resilience of supply in the face of softer consumption trends.
Venezuela’s political shift adds uncertainty, but not immediate scarcity. The country currently produces roughly 800,000 to 1.1 million barrels per day, down from more than 3.5 million barrels per day at its peak in the late 1990s. Even optimistic scenarios assume a slow recovery, requiring years of investment and stable governance before meaningful volumes return to global markets.
Why it matters
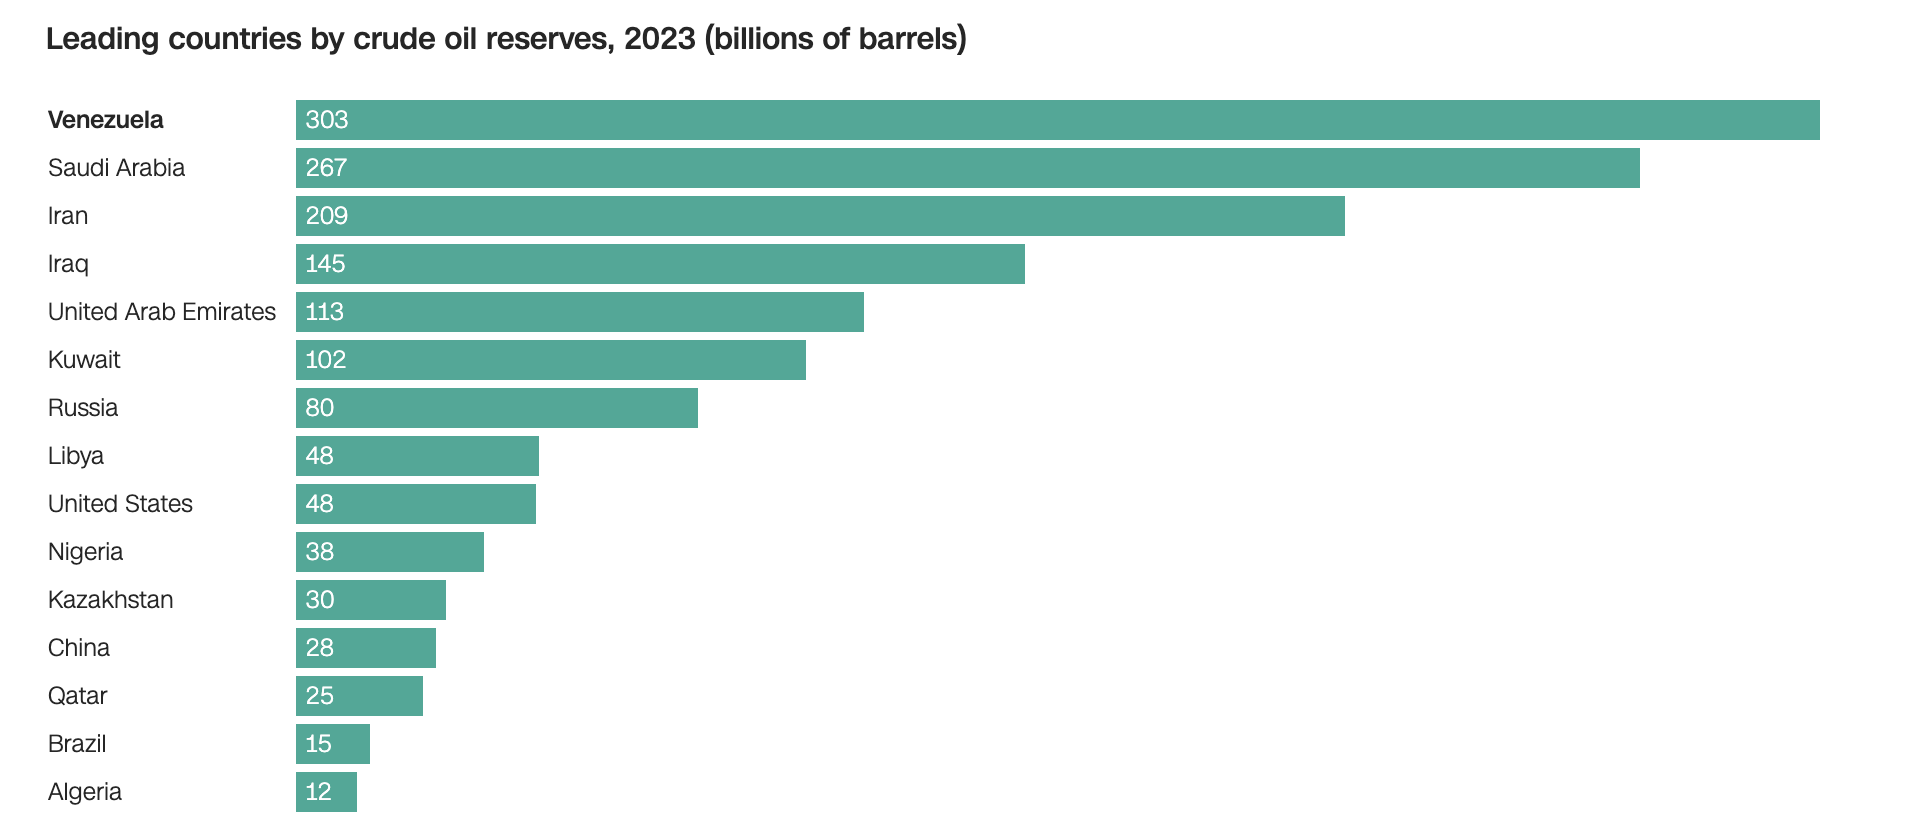
For traders and policymakers alike, timing is critical. Oil markets price what can be delivered now, not what might be produced in five years. While Venezuela holds the world’s largest proven crude reserves at 303 billion barrels, those reserves remain constrained by deteriorated infrastructure, sanctions, and political risk.
Goldman Sachs’ head of oil research, Daan Struyven, has described the impact of Maduro’s removal as ambiguous in the near term. Sanctions relief could eventually lead to increased output, but short-term disruptions remain possible, and any recovery is likely to be gradual. In the meantime, surplus conditions continue to dominate the price formation process.
Impact on the Oil market
The practical implication is a ceiling on prices rather than a floor. Analysts estimate that even full sanctions relief could bring back only several hundred thousand barrels per day over the first year, assuming an orderly transition of power. That increase would be easily offset by marginal supply growth elsewhere.
This dynamic explains why Brent briefly dipped below $61 before stabilising and why volatility has remained contained. As Capital Economics noted, any Venezuelan disruption can be absorbed by spare capacity, particularly since OPEC+ is unlikely to tighten supply aggressively while demand growth remains uncertain.
Expert outlook
Looking ahead, analysts largely expect oil to remain range-bound with downside risks. Capital Economics forecasts that crude prices will drift towards $50 a barrel over the next year as global supply growth continues to outpace demand. A successful Venezuelan recovery would reinforce that trajectory rather than reverse it.
The key uncertainty is execution. Industry executives estimate it would cost around $10 billion a year to rehabilitate Venezuela’s oil sector, and only a stable political environment would unlock that capital. Until investors see credible reforms and lasting sanctions relief, Venezuelan oil remains a long-term story in a market focused on near-term balances.
Key takeaway
Geopolitical drama no longer guarantees higher oil prices. With global supply abundant and Venezuelan output years away from a meaningful recovery, fundamentals continue to cap crude’s upside. Until demand strengthens or producers cut supply more aggressively, analysts expect oil to remain under pressure. Traders should watch sanctions policy, OPEC discipline, and US production data for the next decisive signal.
Oil technical outlook
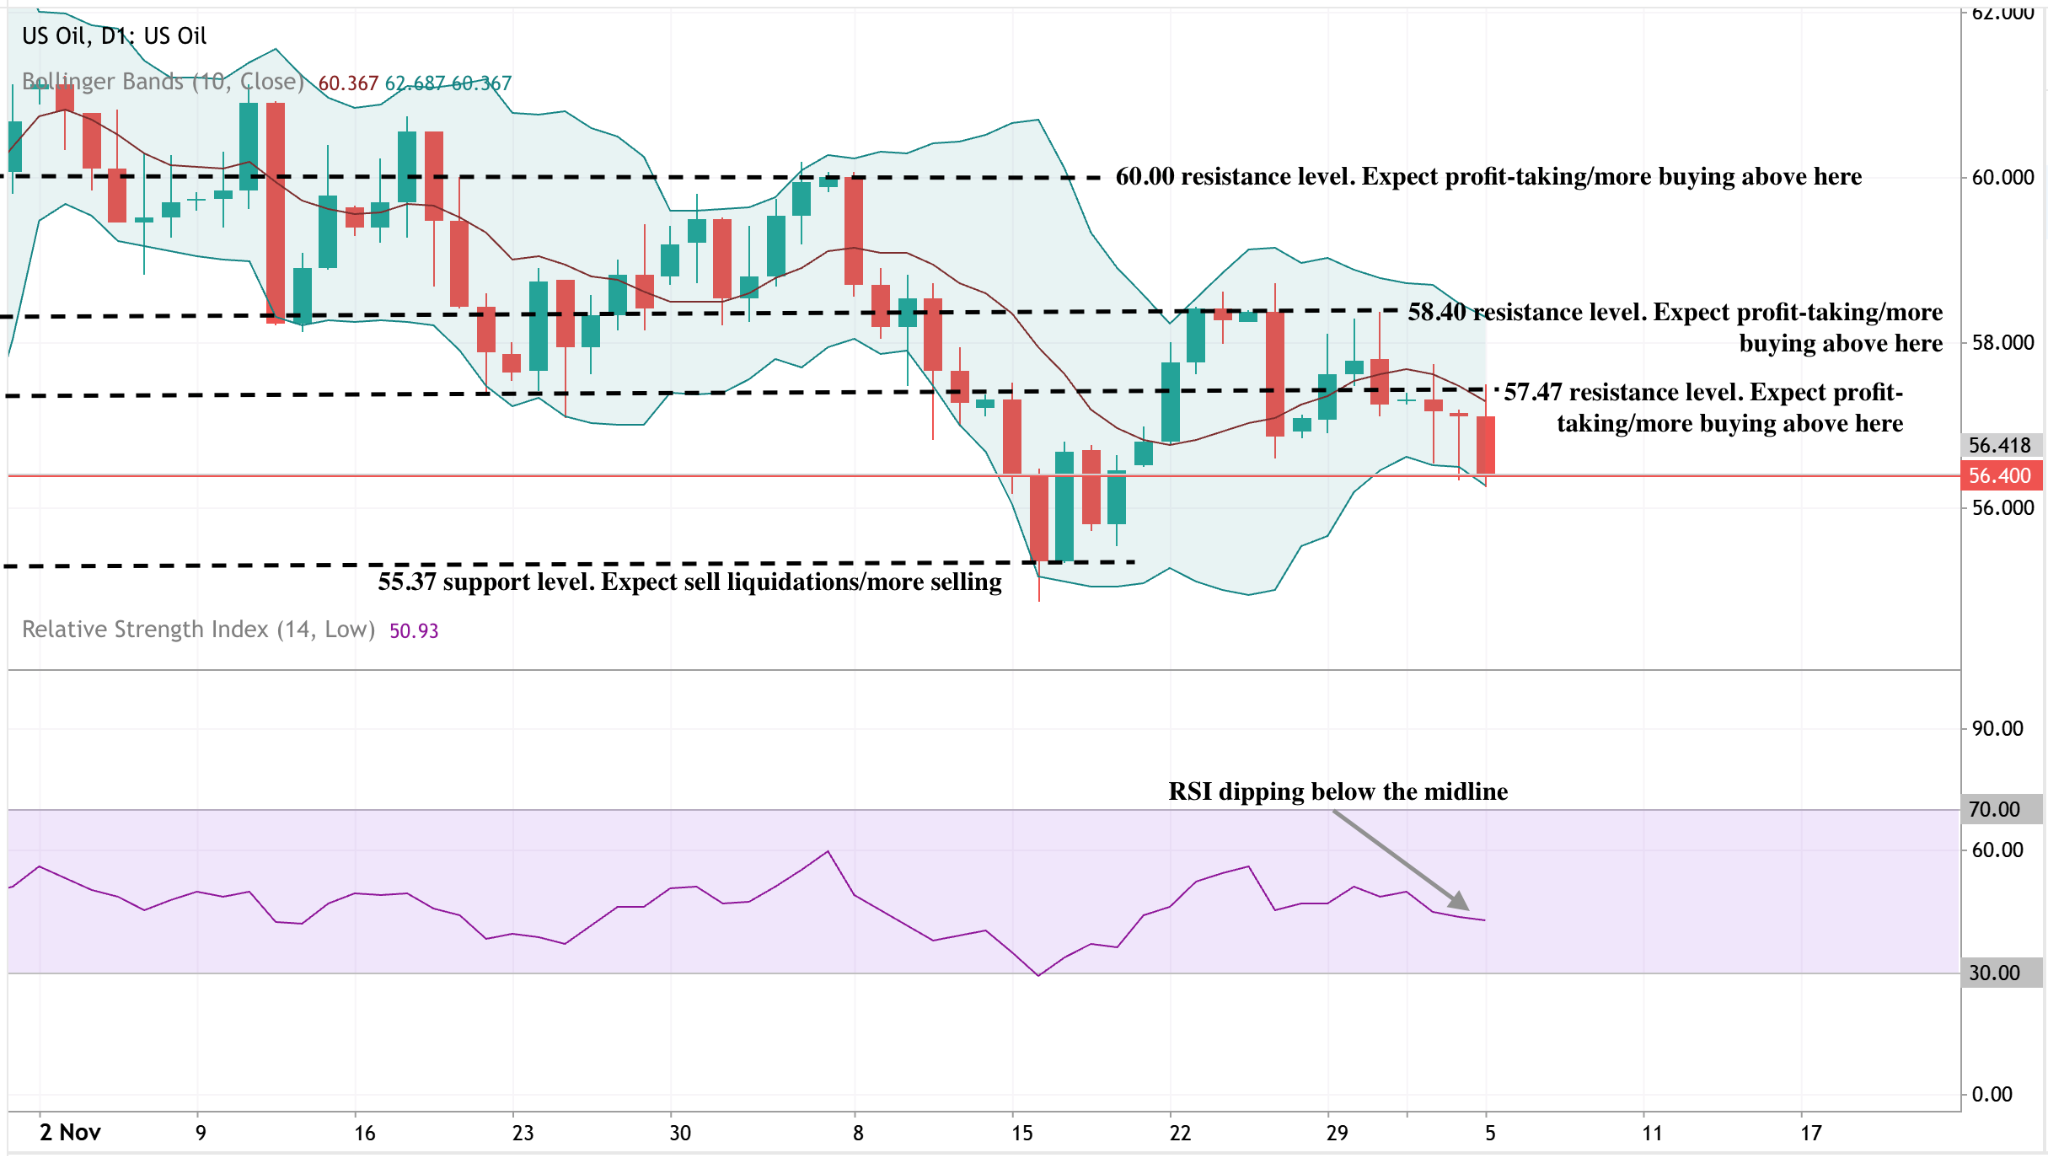
US oil remains under near-term pressure as price struggles to regain traction above the 57.47–58.40 resistance zone, keeping the broader structure tilted to the downside. Recent attempts to stabilise have been met with renewed selling, and price is now hovering just above the 56.40 area, with the 55.37 support acting as a key downside pivot.
Momentum indicators reinforce this cautious outlook: the RSI has dipped below the midline, signalling weakening bullish momentum, while price continues to trade below the key resistance cluster. Bollinger Bands suggest volatility remains elevated, but without clear directional conviction.
A sustained break below 55.37 could open the door to deeper liquidation-driven selling, while any recovery would need a decisive move back above 58.40 to shift the short-term bias.

From wallets to markets: A practical guide to cryptocurrency trading on Deriv
Crypto mechanics drive market moves. Understanding fees, speed, and volatility is key to trading CFDs and Multipliers on Deriv.
Cryptocurrency operates on decentralised networks where every transaction is verified and recorded on a blockchain rather than stored in traditional banking systems. As adoption grows through clearer regulations, exchange‑traded products, and global payment integrations, traders increasingly face market conditions shaped by blockchain activity. Understanding how modern crypto works is essential for making informed decisions. This guide explains how crypto mechanics influence funding, timing, volatility, and execution when trading crypto CFDs on Deriv MT5 and Multipliers on Deriv Trader.
Quick summary
- Crypto functions as digital, peer‑to‑peer money secured through cryptography and decentralised verification.
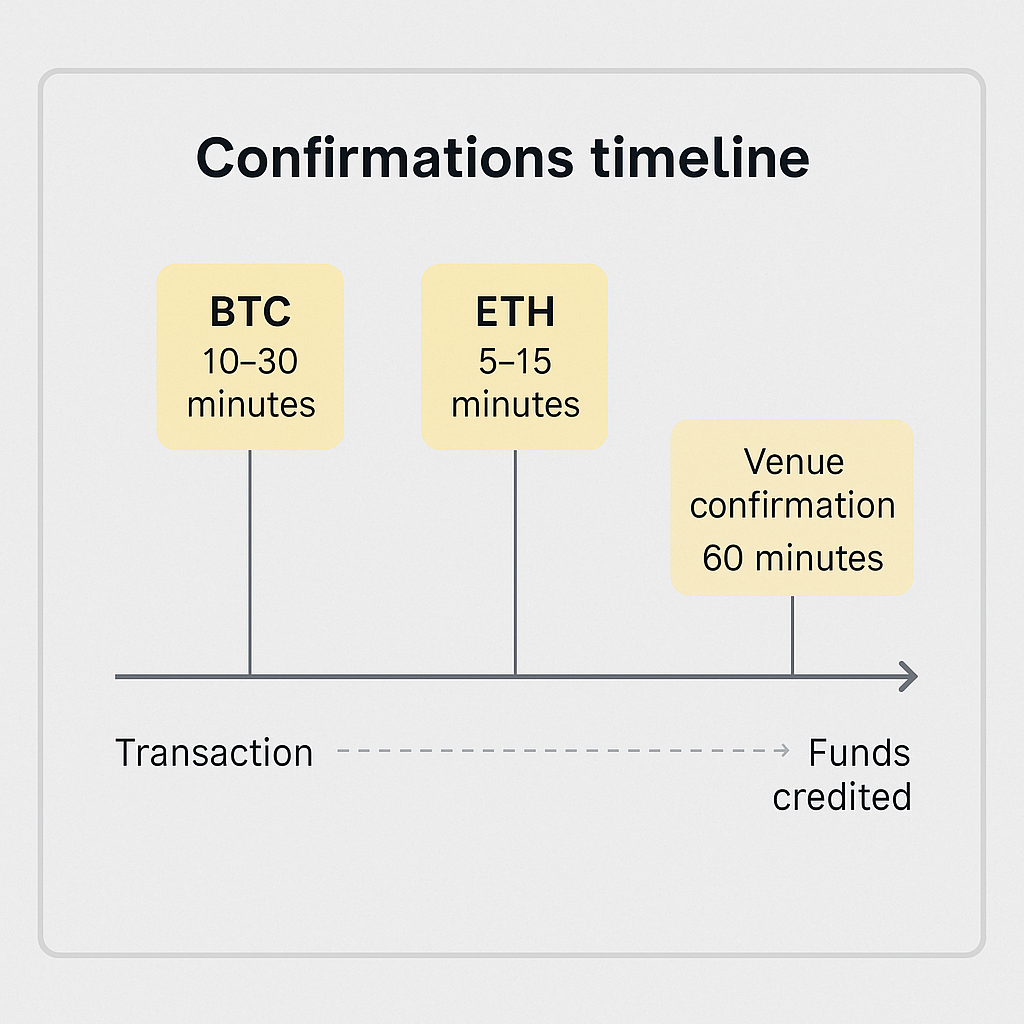
- Confirmations are irreversible once finalised on the blockchain, making security and accuracy essential.
- Network events such as Bitcoin’s halving and Ethereum upgrades affect fees, settlement speed, and market behaviour.
- Liquidity, volatility, and regulation continue to shape crypto access and execution across trading platforms.
- These concepts support decision‑making, but cryptocurrency trading remains high‑risk and requires disciplined planning.
How modern crypto mechanics shape trader decisions?
Crypto networks process transactions independently of financial institutions, and the timing and cost of each transfer depend on network conditions. Block production speed, fee markets, congestion, and validator behaviour all affect how quickly funds move between wallets and platforms. For traders, these variables influence when margin becomes available or when entries can be executed. A clear grasp of how crypto settles under different conditions helps traders set realistic expectations for timing and prepare for periods when networks slow or fees rise.
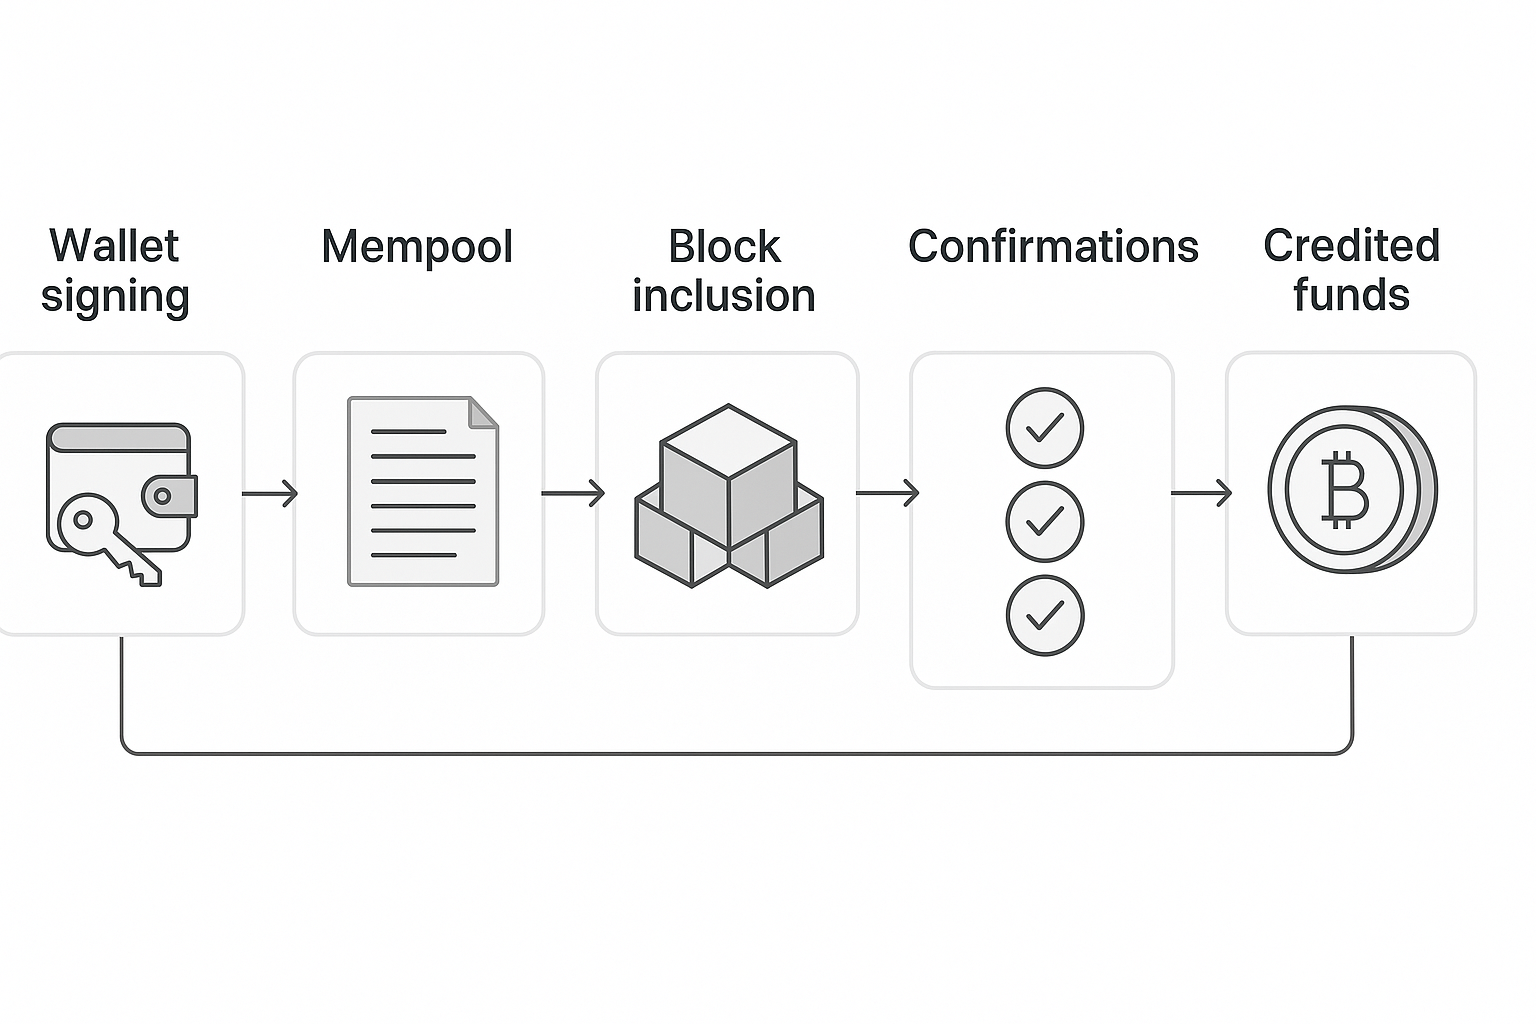
How wallets, confirmations, and fees influence trading behaviour?
Every funding action in crypto begins with a wallet. Whether custodial or self‑custody, a wallet determines how quickly traders can access or move capital. Confirmation times vary across networks, which can delay deposits during heavy traffic or upgrades. Fees fluctuate based on demand, sometimes rising sharply around major market events. Traders who understand these operational realities can plan earlier funding, reduce rushed decisions, and avoid avoidable delays that might cause them to miss opportunities during high‑volatility moments.
According to Deriv’s trading education team, recognising how confirmation delays occur helps traders anticipate funding windows more accurately and avoid mistimed entries.
How network events alter volatility and liquidity?
Changes within blockchain networks ripple quickly through market behaviour. Bitcoin’s halving adjusts miner incentives and can tighten fee markets, affecting settlement predictability during peak activity. Ethereum’s upgrades can reduce transaction costs, improving network throughput and shaping activity on related markets. These structural developments influence how liquidity forms on exchanges and how prices respond to news. Traders who track such events can better understand shifts in volatility or spreads during key periods.
How crypto CFDs on Deriv reflect market structure?
Crypto CFDs on Deriv mirror underlying market movements without requiring traders to manage crypto custody. When network congestion affects broader market liquidity, CFDs may reflect these conditions through wider spreads or sharper intraday swings. Because CFDs allow flexible entries and exits, traders can adjust their approach based on volatility, depth, and sentiment. Understanding how underlying market structure influences CFD behaviour helps traders prepare for varying execution conditions.
Deriv’s market strategy team notes that volatility should be managed thoughtfully. While defined‑risk features exist on some instruments, market conditions still require careful decision‑making and consistent risk control.
How crypto Multipliers fit into volatile market conditions?
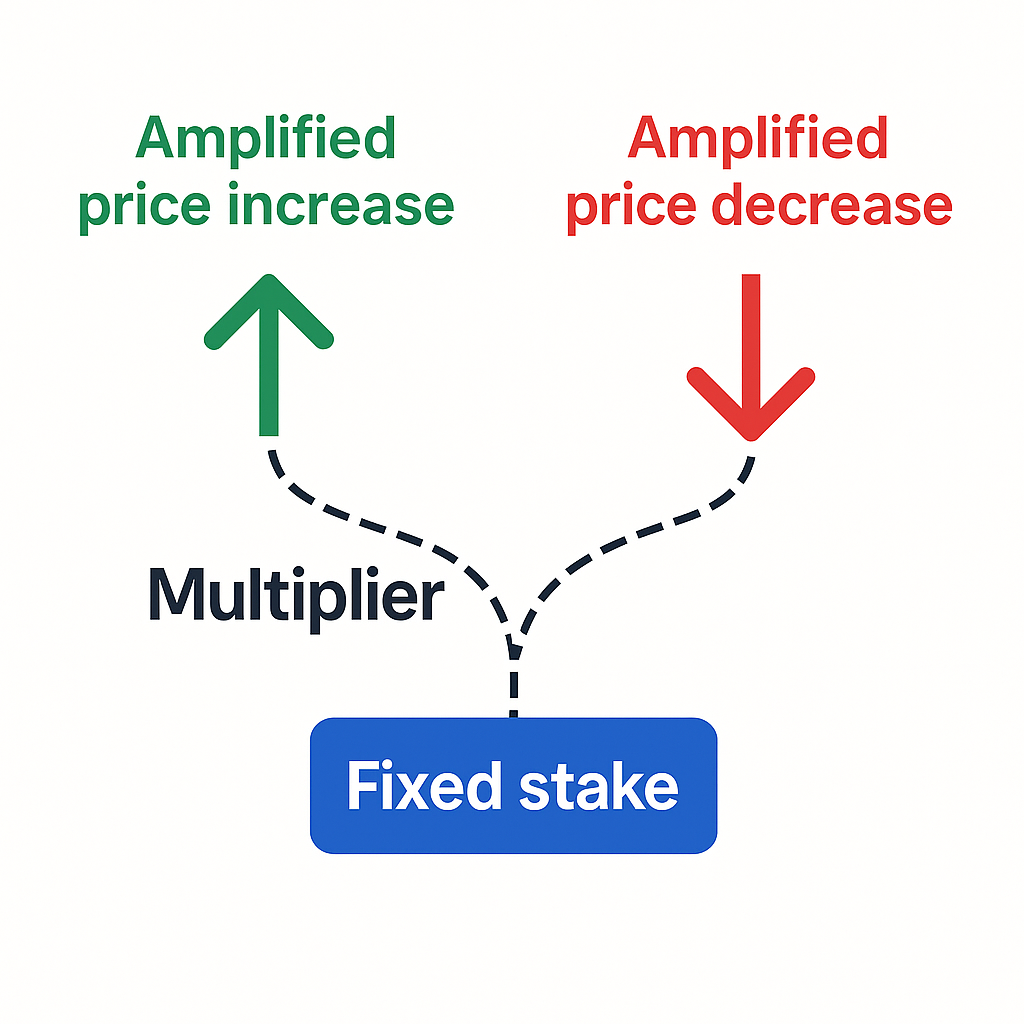
Multipliers allow traders to amplify price movements using a fixed stake, which defines the maximum potential loss per position. In fast‑moving markets, this structure can help traders participate in short bursts of volatility while keeping risk boundaries visible. However, because price changes are magnified, multipliers require strict attention to timing, session activity, and exit planning. When used carefully, they complement CFDs by offering traders an additional way to engage with crypto movements.
How owning vs trading cryptocurrency changes decision‑making?
Owning cryptocurrency directly involves handling private keys, managing backups, navigating fees, and ensuring secure storage. This approach suits those seeking long‑term exposure or utility. Trading crypto price movements on Deriv removes custody responsibilities and network transfer steps but requires an understanding of market depth, volatility, and strategy. CFDs and Multipliers cater to traders focused on short‑term opportunities, while ownership appeals to those with longer‑horizon goals. Aligning strategy with risk tolerance helps clarify which method fits a trader’s objectives.
How traders adapt their risk management to crypto’s market structure?
Crypto trades nonstop, and liquidity varies across global sessions. Sudden news, regulatory announcements, or network slowdowns can trigger instant price swings. Traders often adjust position size during high‑volatility windows, review stop placements proactively, and monitor stablecoin flows for early clues about sentiment shifts. Routine preparation—such as checking for network maintenance notices or exchange funding delays—helps traders avoid reactive decisions and maintain structured risk habits.
How funding strategies adapt to blockchain conditions?
Funding a trading account is not only a logistical step but also a strategic one. Because blockchain networks vary in speed, cost, and reliability depending on demand, traders often plan their deposits around expected congestion. High-fee environments—common during major market announcements or network surges—can delay confirmations and affect the timing of positions. Choosing the appropriate network for stablecoin transfers, such as using lower-cost chains when available, can help traders minimise delays and maintain flexibility. Traders also routinely pre‑fund accounts before anticipated volatility so their capital is accessible without waiting for confirmations.
Deriv Market Analyst team mentions:
“Funding choices can influence how effectively traders respond to fast-moving markets. Recognising when networks slow down or fees spike helps traders prepare their capital in advance rather than reacting under pressure.”
What are advanced risk-management behaviours in crypto markets?
Crypto volatility is not random; it often clusters around key events, liquidity shifts, and market opens across global regions. Traders adapt by scaling position sizes according to volatility levels, widening stops during unstable periods, or reducing leverage during unpredictable cycles. Because markets operate continuously, exits may coincide with thin liquidity or sudden sentiment changes, so monitoring on‑chain flows, stablecoin activity, and network conditions helps traders refine timing. Structured routines—such as reviewing stop placements before major events or adjusting exposure ahead of weekend liquidity drops—support disciplined decision‑making.
How does global session behaviour shape execution?
Crypto markets operate continuously, but liquidity and volatility shift across global sessions. Asian trading hours often feature steady activity driven by regional exchanges and early news cycles, while European hours introduce higher participation from institutional desks, influencing spreads and directional momentum. The U.S. session typically brings the sharpest reactions, as major economic releases, corporate announcements, and regulatory updates occur during this window. These cycles shape how quickly markets move and how reliably orders fill. Traders who pay attention to these rhythms can better anticipate when slippage may increase, spreads may widen, or volatility may spike unexpectedly.
Deriv Market Strategy team elaborates:
“Session behaviour affects more than volatility. It also shapes execution quality. Traders who understand when liquidity strengthens or thins out are better equipped to plan their actions without relying on assumptions about market stability.”
Global session dynamics also interact with network activity. For example, periods of intense blockchain usage in one region may coincide with thin‑liquidity windows elsewhere, amplifying price swings. As a result, traders often review session overlap periods, such as Europe into the US, where liquidity typically peaks. Understanding these differences helps traders set expectations for execution quality, especially when using tools like CFDs that reflect underlying market depth.
How do regulatory developments influence trading conditions?
Regulatory announcements can significantly influence crypto market behaviour, especially when they relate to taxation, exchange governance, stablecoin classifications, or restrictions on service providers. Markets often react sharply to news involving major jurisdictions, as these changes may affect liquidity access, institutional participation, or perceived long‑term viability of specific assets. Traders who monitor regulatory calendars and public consultations gain early awareness of potential disruptions. Even when regulations are not directly implemented, the anticipation of change alone can contribute to volatility as market participants reassess risk.
In some cases, regulatory clarity improves market structure by defining operational requirements for exchanges, custody providers, or brokers. This can encourage greater participation from financial institutions, indirectly supporting liquidity conditions. However, sudden announcements—such as enforcement actions or new compliance directives—may cause short‑term uncertainty. Understanding how these shifts influence sentiment helps traders prepare for periods where spreads widen, volumes fluctuate, or execution speed varies.
%20(1).png)
Precious metals 2026 outlook: After a historic rally, can prices hold?
After a strong 2025, the question for metals isn't support, but sustainability amid volatility and shifting macro signals.
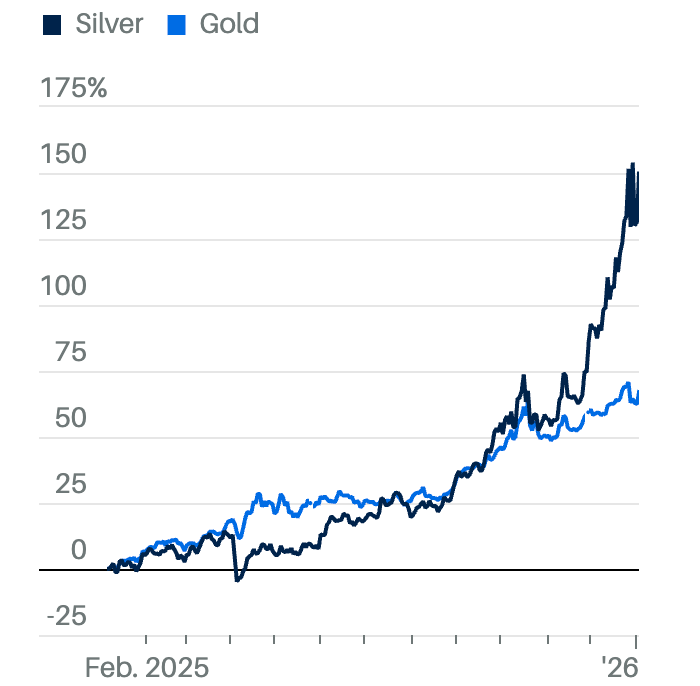
Precious metals closed 2025 at levels that forced markets to reassess long-held assumptions. Data showed that silver surged more than 150% over the year, its strongest performance since 1979, briefly breaking above $80 an ounce. Gold climbed roughly 65%, also marking its best annual gain in decades, while platinum pushed to a 17-year high after an abrupt re-pricing of supply and demand dynamics.
Such moves rarely fade quietly. As 2026 begins, investors are no longer asking whether precious metals are supported, but whether prices can remain elevated once volatility, tighter trading conditions, and shifting macro signals settle in. The outlook now hinges on rates, real-world demand, and how much excess the market has already burned off.
What could drive precious metals in 2026?
The most important force shaping the 2026 outlook is monetary policy, according to analysts. Expectations for further US interest rate cuts have lowered the opportunity cost of holding non-yielding assets, providing a powerful tailwind for gold and silver.
The Federal Reserve cut rates by 25 basis points in December, bringing the target range to 3.50%–3.75%.
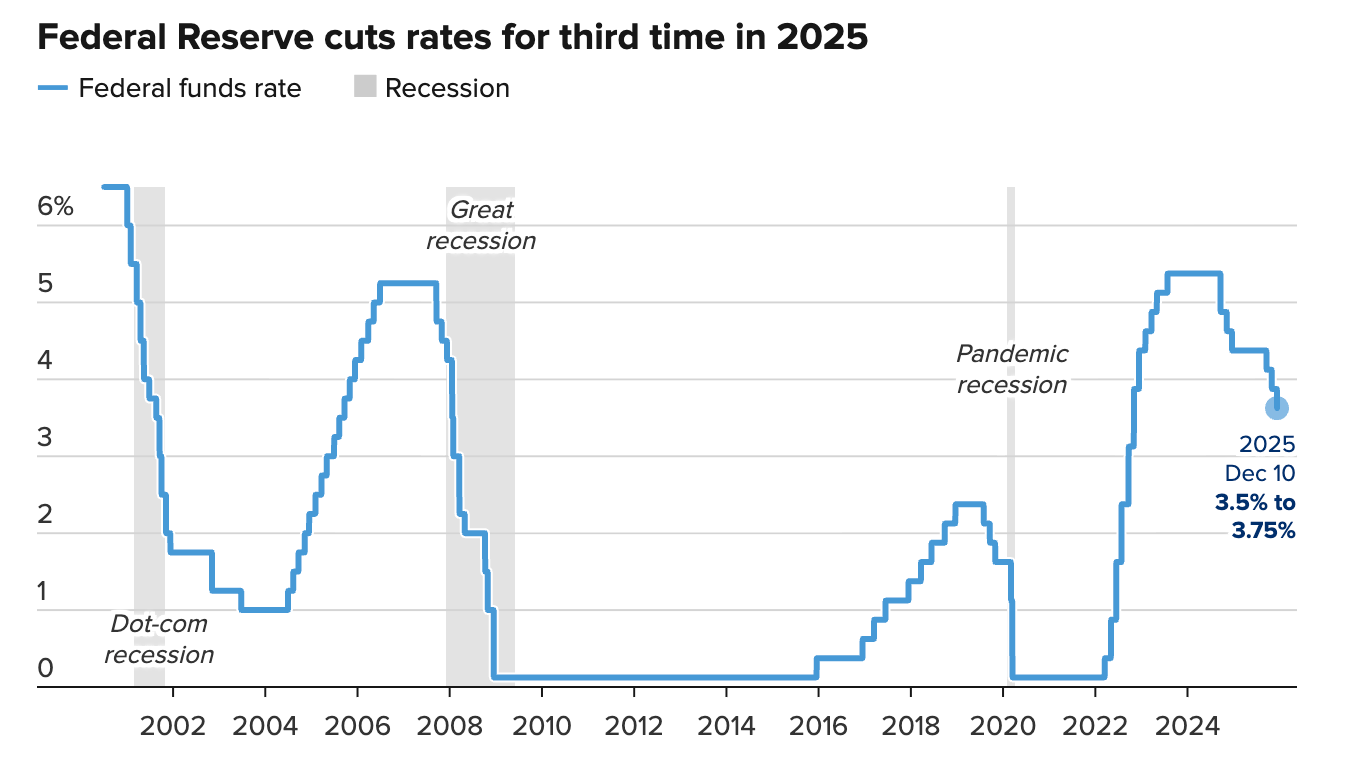
Meeting minutes showed that most officials remain open to additional easing if inflation continues to cool.
Market watchers noted that silver has responded with outsized volatility because it sits at the intersection of finance and industry. Alongside safe-haven flows, demand from solar manufacturing, electronics, and electric vehicles has tightened an already constrained market. Years of supply deficits and shrinking inventories have made silver unusually sensitive to shifts in investment positioning, helping explain why its rally became both explosive and unstable as liquidity thinned toward year-end.
Why it matters
The stakes extend beyond price charts. Silver’s role as both a financial hedge and an industrial input means sharp swings ripple into manufacturing costs, investment strategies, and inflation expectations. Bank of America raised its 2026 silver forecast to $65 an ounce, citing persistent supply shortfalls even as it warned that high prices could cool demand at the margin.
Gold’s influence is broader but steadier. Its rally has been reinforced by geopolitical stress, including ongoing tensions in the Middle East and uncertainty surrounding US foreign policy. Analysts note that gold’s appeal in late 2025 was less about speculative excess and more about capital preservation in an environment where policy clarity remains elusive.
Impact on markets, industry and investors
Volatility has already reshaped behaviour. CME Group’s decision to raise margin requirements for precious metals futures triggered forced deleveraging, particularly in silver, which fell sharply from near $86 to the low-$70s in a matter of days. These moves acted as a mechanical reset rather than a signal of collapsing fundamentals, reducing leverage in a market that had become heavily crowded.
Investment flows remain robust despite the turbulence. Silver exchange-traded funds recorded exceptional inflows in 2025, outperforming gold ETFs and many equity benchmarks. Platinum has followed a similar path, with UBS lifting price projections after tighter supply conditions collided with renewed investment interest, amplified by reduced output from South Africa’s mining sector.
Expert outlook
Forecasts for 2026 highlight the uncertainty ahead. A Reuters poll of 39 analysts projects silver averaging around $50 an ounce next year, while Bank of America’s $65 target reflects confidence that structural deficits will continue to support prices. Both sit well below the highs reached during the 2025 rally, underscoring how difficult it is for fundamentals to justify momentum-driven peaks.
Platinum and palladium face a more nuanced path. UBS warns that if platinum remains significantly more expensive, demand from autocatalysts could shift back towards palladium, particularly as the adoption of electric vehicles progresses more slowly than initially expected. Across the precious metals complex, interest rates, physical availability, and policy decisions will determine whether 2025 marks a climax or a higher base.
Key takeaway
Precious metals enter 2026 after one of the strongest rallies in decades, driven by falling rate expectations, constrained supply, and geopolitical risk. Silver’s surge has raised both opportunities and risks, while gold remains the market’s anchor, and platinum reflects changing industrial realities. Whether prices can hold will depend on how quickly rate cuts materialise, how industrial demand evolves, and whether supply tightness persists once speculative excess has fully unwound.
Silver technical insights
Silver remains in a broader bullish structure but is currently consolidating after a sharp rally, with price pulling back modestly from recent highs. The move has eased pressure from momentum indicators rather than signalling a trend reversal.
RSI has cooled and is now sitting just above the midline, suggesting momentum has reset into a more neutral zone while underlying demand remains intact. Bollinger Bands, which expanded aggressively during the rally, are beginning to stabilise, pointing to a pause in volatility rather than renewed downside pressure.
As long as silver holds above the US$57 support level, the uptrend remains structurally sound. A break below this zone would expose deeper downside towards US$50 and US$46.93, while renewed upside momentum would likely emerge if buyers regain control above recent highs.
Sorry, we couldn’t find any results matching .
Search tips:
- Check your spelling and try again
- Try another keyword