Results for

Bitcoin supply shortage fuels breakout to $125K in 2025
Bitcoin’s climb above $125,000 marks the intersection of multiple bullish forces.
Bitcoin’s climb above $125,000 marks the intersection of multiple bullish forces - a tightening supply, growing institutional inflows, and renewed investor confidence amid global economic uncertainty. With the number of coins on exchanges now at a six-year low and the macro “debasement trade” gaining momentum, Bitcoin’s latest rally reflects both structural scarcity and shifting capital flows into digital assets. Still, questions remain over whether the move extends straight to $150K or pauses for consolidation first.
Key takeaways
- Bitcoin hit a new all-time high near $125,700 during Sunday’s 5 October Asia session - lifting its market cap to $2.5 trillion - above Amazon and closing in on silver.
- Exchange balances have fallen to 2.83 million BTC, the lowest in six years, signalling long-term investor accumulation.
- Institutional inflows into crypto ETFs and treasury holdings are supporting sustained demand.
- Analysts highlight the “debasement trade” - rising demand for Bitcoin as investors hedge against debt, inflation, and dollar weakness.
- Rising volumes and reduced sell pressure indicate structural strength, not froth.
- $120K remains a key price level for sustaining medium-term momentum.
Bitcoin supply shortage helps drive record highs
Bitcoin’s climb to a new all-time high around $125,400 marks a key moment in its 17-year history. Unlike past rallies, this surge isn’t driven primarily by leverage or speculative mania. Exchange data from CoinGlass and Swissblock shows that the BTC supply available to trade has dropped to just 2.83 million coins, the lowest since 2019.
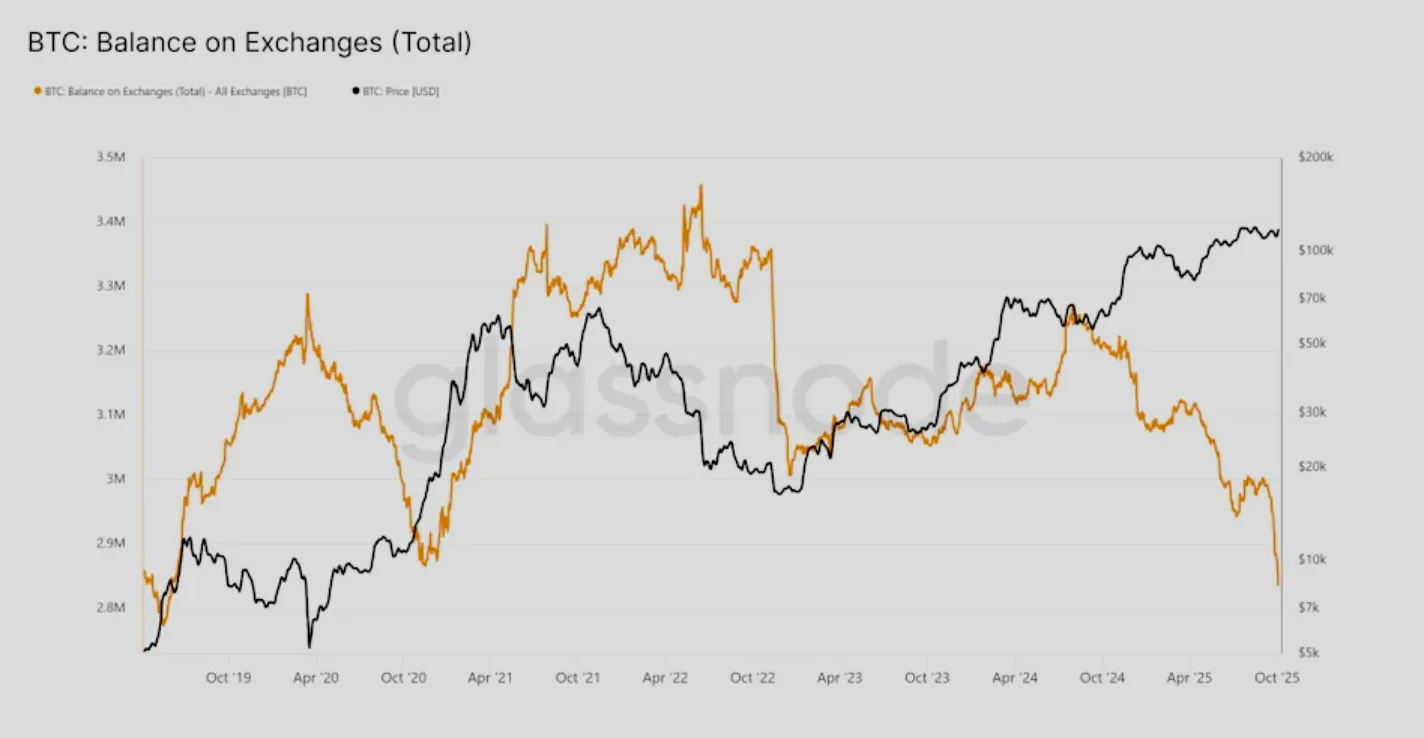
This contraction means fewer coins are available for sale even as demand rises - creating a classic setup for price appreciation. Accumulation by long-term holders and institutional funds has steadily absorbed market supply since September, helping Bitcoin recover from its earlier dips below $110K.
For traders looking to capitalise on these shifts, trading Bitcoin on Deriv offers opportunities to speculate on price movements without owning the underlying asset - available across Deriv MT5 and Deriv Trader platforms.
Demand absorption and real investor conviction
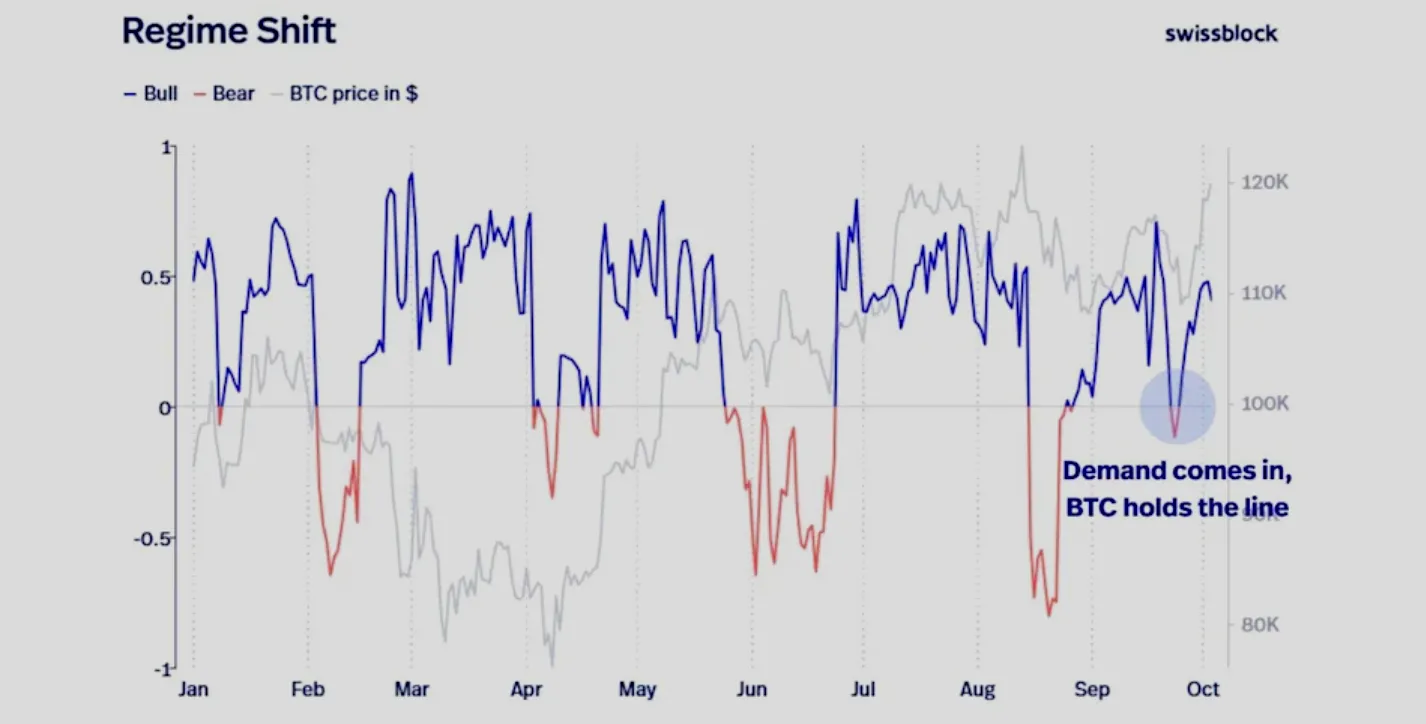
According to Swissblock’s Bull Bear Indicator, Bitcoin’s rally is underpinned by genuine demand, not short-term speculation. Even during pullbacks, buying pressure has consistently outpaced selling. The firm’s Structure Shift metric - a gauge of trend conviction - remained upward during corrections, highlighting a market driven by accumulation, not hype.
Institutional activity has been another catalyst. Since mid-year, inflows into crypto ETFs and treasury allocations have expanded significantly, with large asset managers increasing exposure amid a friendlier regulatory stance in the U.S.
The Bitcoin debasement trade takes centre stage
JPMorgan analysts describe the current environment as a “debasement trade,” where both retail and institutional investors hedge against currency risk and fiscal imbalances through assets like gold and Bitcoin.
The narrative is supported by:
- Rising government debt and fiscal stress in the U.S. and Europe.
- A weaker U.S. dollar amplifies Bitcoin’s relative strength.
- Heightened geopolitical uncertainty, from global elections to policy volatility.
Combined, these factors have boosted Bitcoin’s appeal as a store of value alternative - or, as analysts frame it, “digital gold.”
For context, similar dynamics have been driving gold’s recent breakout and renewed interest in oil market reversals - both reflecting investor demand for real assets in a high-debt environment.
Bitcoin ETF inflows from institutions are also a driver
The shift in U.S. policy under the Trump administration - including the passage of three pro-crypto bills in mid-2025 - has spurred confidence across financial markets. Institutional investors have responded with record inflows into newly launched crypto ETFs, while corporate treasuries have begun treating Bitcoin as a long-term reserve asset.
This change in structure has reduced the market’s speculative character. Unlike in 2021, today’s buyers are largely longer-term participants, resulting in a steadier demand base and lower volatility per unit of volume.
Bitcoin technical resistance and support levels
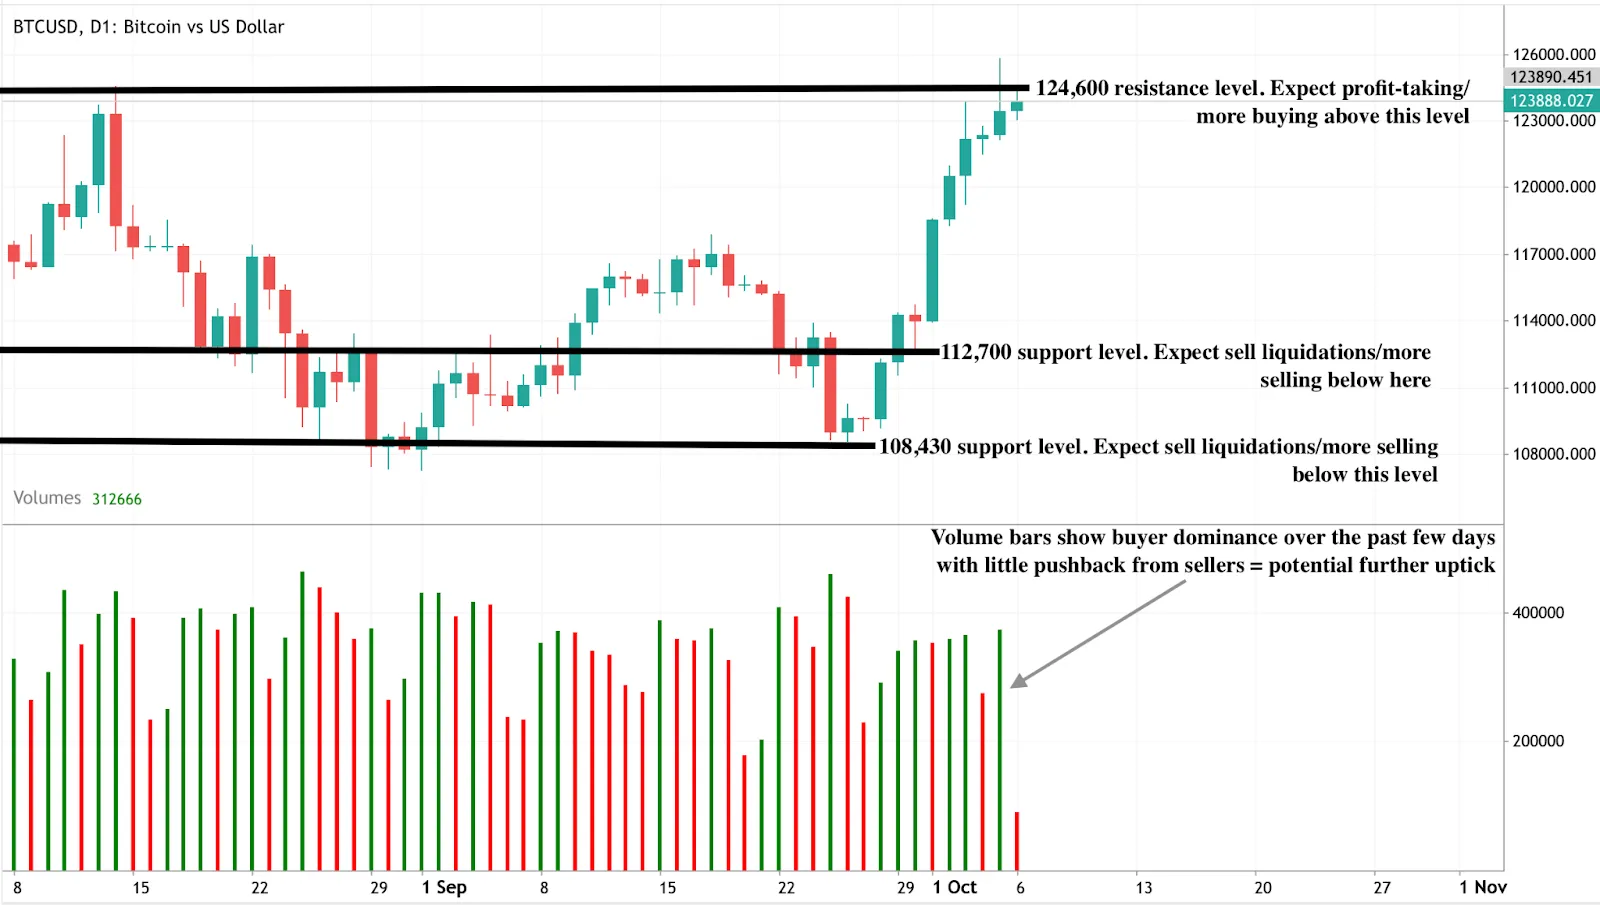
At the time of writing, the BTC price is bouncing off the $124,600 resistance level, hinting at a potential price reversal. However, volume bars show strong buy pressure with little seller pushback, suggesting the possibility of a further uptick.
Should the slowdown at resistance lead to a pullback, Bitcoin could find support near $112,700 and $108,430 - levels that align with prior consolidation zones and institutional buying interest.
For traders monitoring these technical levels, Deriv’s trading calculator can help estimate potential profit, margin, and pip values across different account types.
Market outlook and price scenarios
If exchange balances remain tight and ETF inflows continue, Bitcoin could test $150K over the medium term. However, a near-term cool-off is likely as traders digest gains and re-evaluate positioning.
- Bullish case: Continued institutional inflows, stable macro environment, and low exchange supply could push BTC towards $150K by year-end.
- Neutral case: A period of consolidation between $120K–$130K, reflecting market digestion after rapid appreciation.
- Bearish case: A break below $120K would signal waning momentum, though strong structural demand limits deeper downside.
Investment implications
For traders, the near-term setup favours cautious optimism.
- Short-term: If momentum holds, a consolidation between $120K and $130K would provide attractive entry zones.
- Medium-term: Sustained ETF inflows and low supply could trigger a move toward $140K–$150K within months.
- Risk factors: A sharp rebound in the U.S. dollar or a drop in institutional participation could slow momentum.
Long-term investors should note that Bitcoin’s six-year exchange supply low points to a fundamentally tightening market - a structure that historically precedes major price expansion phases.
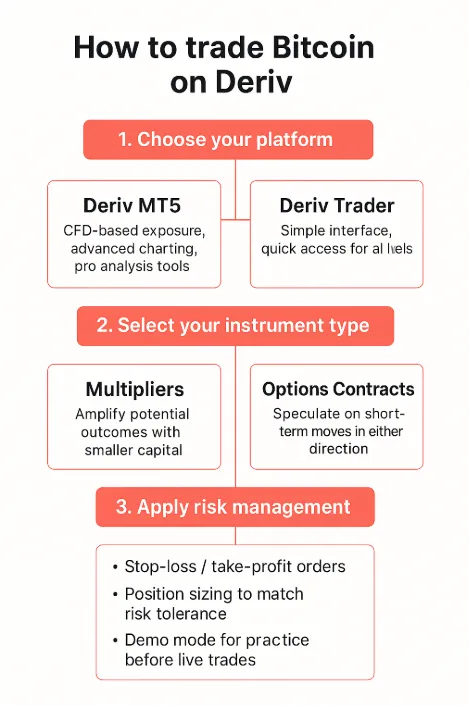
Trading Bitcoin scarcity on Deriv platforms
Traders looking to capitalise on Bitcoin’s supply squeeze can use Deriv’s suite of tools designed for flexibility, speed, and precision across multiple market conditions.
- Trade Bitcoin CFDs on Deriv MT5, or Deriv Trader to speculate on both rising and falling prices without owning the underlying asset.
- Use Multipliers to amplify short-term price movements while keeping the downside limited. This is ideal for intraday trading during high-volatility phases.
- Apply technical indicators like RSI, MACD, and moving averages on Deriv MT5 to confirm momentum trends around key resistance and support levels (e.g., $124,600 and $112,700).
- Combine Deriv’s trading calculator with live crypto charts to assess margin, pip value, and potential profit for each trade setup.
These tools allow traders to navigate Bitcoin’s tightening supply and capitalise on volatility, whether positioning for a continuation to $150K or a near-term correction.

Intel stock price surges 55%: Can political backing fuel a breakout above $40?
Without evidence that Intel can close the gap with AMD and TSMC or turn its foundry profitable, the rally risks pausing once the optimism fades.
Intel’s rally has momentum behind it, but whether it can sustain above $40 depends on execution rather than politics. The surge to $37 - a 55% rebound in just six weeks - has been fuelled by U.S. government backing, multi-billion-dollar investments from Nvidia and SoftBank, and speculation about new partnerships, including talks with AMD. These drivers make a test of $40 likely in the short term. But without evidence that Intel can close the gap with AMD and TSMC or turn its foundry profitable, the rally risks pausing once the optimism fades.
Key takeaways
- Intel stock up 55% since early September, its sharpest rally in 18 months, closing at $37.30 on Thursday.
- Trump’s 6-week-old investment up 80%, while the U.S. government’s 10% stake has grown from $8.9 billion to $16 billion.
- Nvidia ($5B), SoftBank, and Apple interest add institutional weight behind the recovery story.
- AMD talks raise the possibility of Intel producing chips for its longtime rival - a major shift in the semiconductor landscape.
- CEO Lip Bu-Tan took over after Intel’s worst year in history (-60% in 2024) and sweeping layoffs.
- Analysts remain divided: Citi calls Intel a “sell,” arguing the foundry business is a drag, even as investors believe in a turnaround.
Intel government investment boosts confidence
Intel’s rally is tied directly to political and industrial support. In August, the Trump administration negotiated a 10% equity stake in Intel, acquiring 433.3 million shares at $20.47 each for $8.9 billion. At $37, that stake is now valued at nearly $16 billion.
The government equity purchase was funded by CHIPS and Science Act grants originally allocated under Biden, underscoring bipartisan recognition that semiconductors are a matter of national security. Intel has already received $2.2 billion from CHIPS grants, with $5.7 billion more coming, plus $3.2 billion from a separate program.
For Washington, Intel’s survival and resurgence are not just market issues - they’re about reshoring production and reducing reliance on Taiwan’s TSMC amid escalating U.S. - China tensions. That political dimension gives Intel a safety net most companies lack.
Intel-Nvidia deal and other private-sector endorsements add fuel
The surge is also being driven by heavyweight private investors:
- Nvidia invested $5 billion in September, tying Intel CPUs with Nvidia GPUs in future data centres and PCs. The move bolsters Intel’s relevance in AI and computing infrastructure.
- SoftBank became an equity investor earlier in 2025, providing capital diversification and balance sheet strength.
- Apple is reportedly considering partnerships, with speculation that future product ecosystems could involve Intel manufacturing.
These developments have helped restore optimism in a company that, just a year ago, had been written off after years of falling behind AMD and TSMC, mass layoffs, and consideration of selling off its foundry arm.
Still, some analysts have downplayed Nvidia’s investment. With $67 billion in cash, the $5 billion commitment is small for Nvidia, and it doesn’t necessarily solve Intel’s performance gap in processors or AI chips.
Intel-AMD partnership: Potential impact
One of the most intriguing catalysts for Intel’s rally has been reports that Intel and AMD are in preliminary talks to make AMD a foundry client.
Such a deal would be historic - two arch-rivals cooperating. For Intel, it could validate its foundry model, helping to monetise a long-unprofitable division. For AMD, it would diversify production away from TSMC, whose dominance in advanced node manufacturing has left the industry exposed to geopolitical risks in Taiwan.
Yet, these talks are at an early stage. Questions remain over how much of AMD’s production could shift, and whether AMD would invest directly into Intel as part of the deal. For now, the story is more sentiment driver than earnings catalyst.
A leadership reset after Intel’s worst year
Intel’s turnaround effort is unfolding under new leadership. Lip Bu-Tan became CEO in December after Pat Gelsinger's departure. His appointment followed Intel’s worst fiscal year on record in 2024, when shares lost 60% of their value amid supply chain disruptions, stiff competition, and strategic missteps.
The company has experienced major layoffs, asset reviews, and internal restructuring. That painful reset, combined with government and institutional capital, has positioned Intel for a potential rebound - but it also sets a high bar for execution.
Sceptics highlight ongoing risks
Despite the rally, sceptics caution that Intel’s fundamentals haven’t yet caught up with its price:
- Citi analyst Christopher Danely downgraded Intel to “sell.” He argued Nvidia’s $5 billion “is no big deal” and won’t materially shift Intel’s competitive position.
- Intel remains behind AMD in CPUs and behind Nvidia in AI chips.
- Intel's foundry business is still losing money, and continuing down that path could keep it stuck in a cycle of underperformance.
- Some analysts suggest Intel could unlock more value by exiting foundry operations altogether.
This bear case underscores the tension: Intel is today valued based on hope, politics, and partnerships rather than proven execution.
Market impact and price scenarios
Momentum suggests Intel could push through $40.00 in the near term. Government backing, institutional investment, and the AMD narrative provide strong fuel for short-term traders.
But sustainability depends on Intel’s ability to:
- Demonstrate progress in AI and data centre products.
- Translate government and private support into profitability.
- Close the performance gap with AMD and TSMC in advanced chip manufacturing.
Without this, the rally risks stalling or reversing once optimism fades.
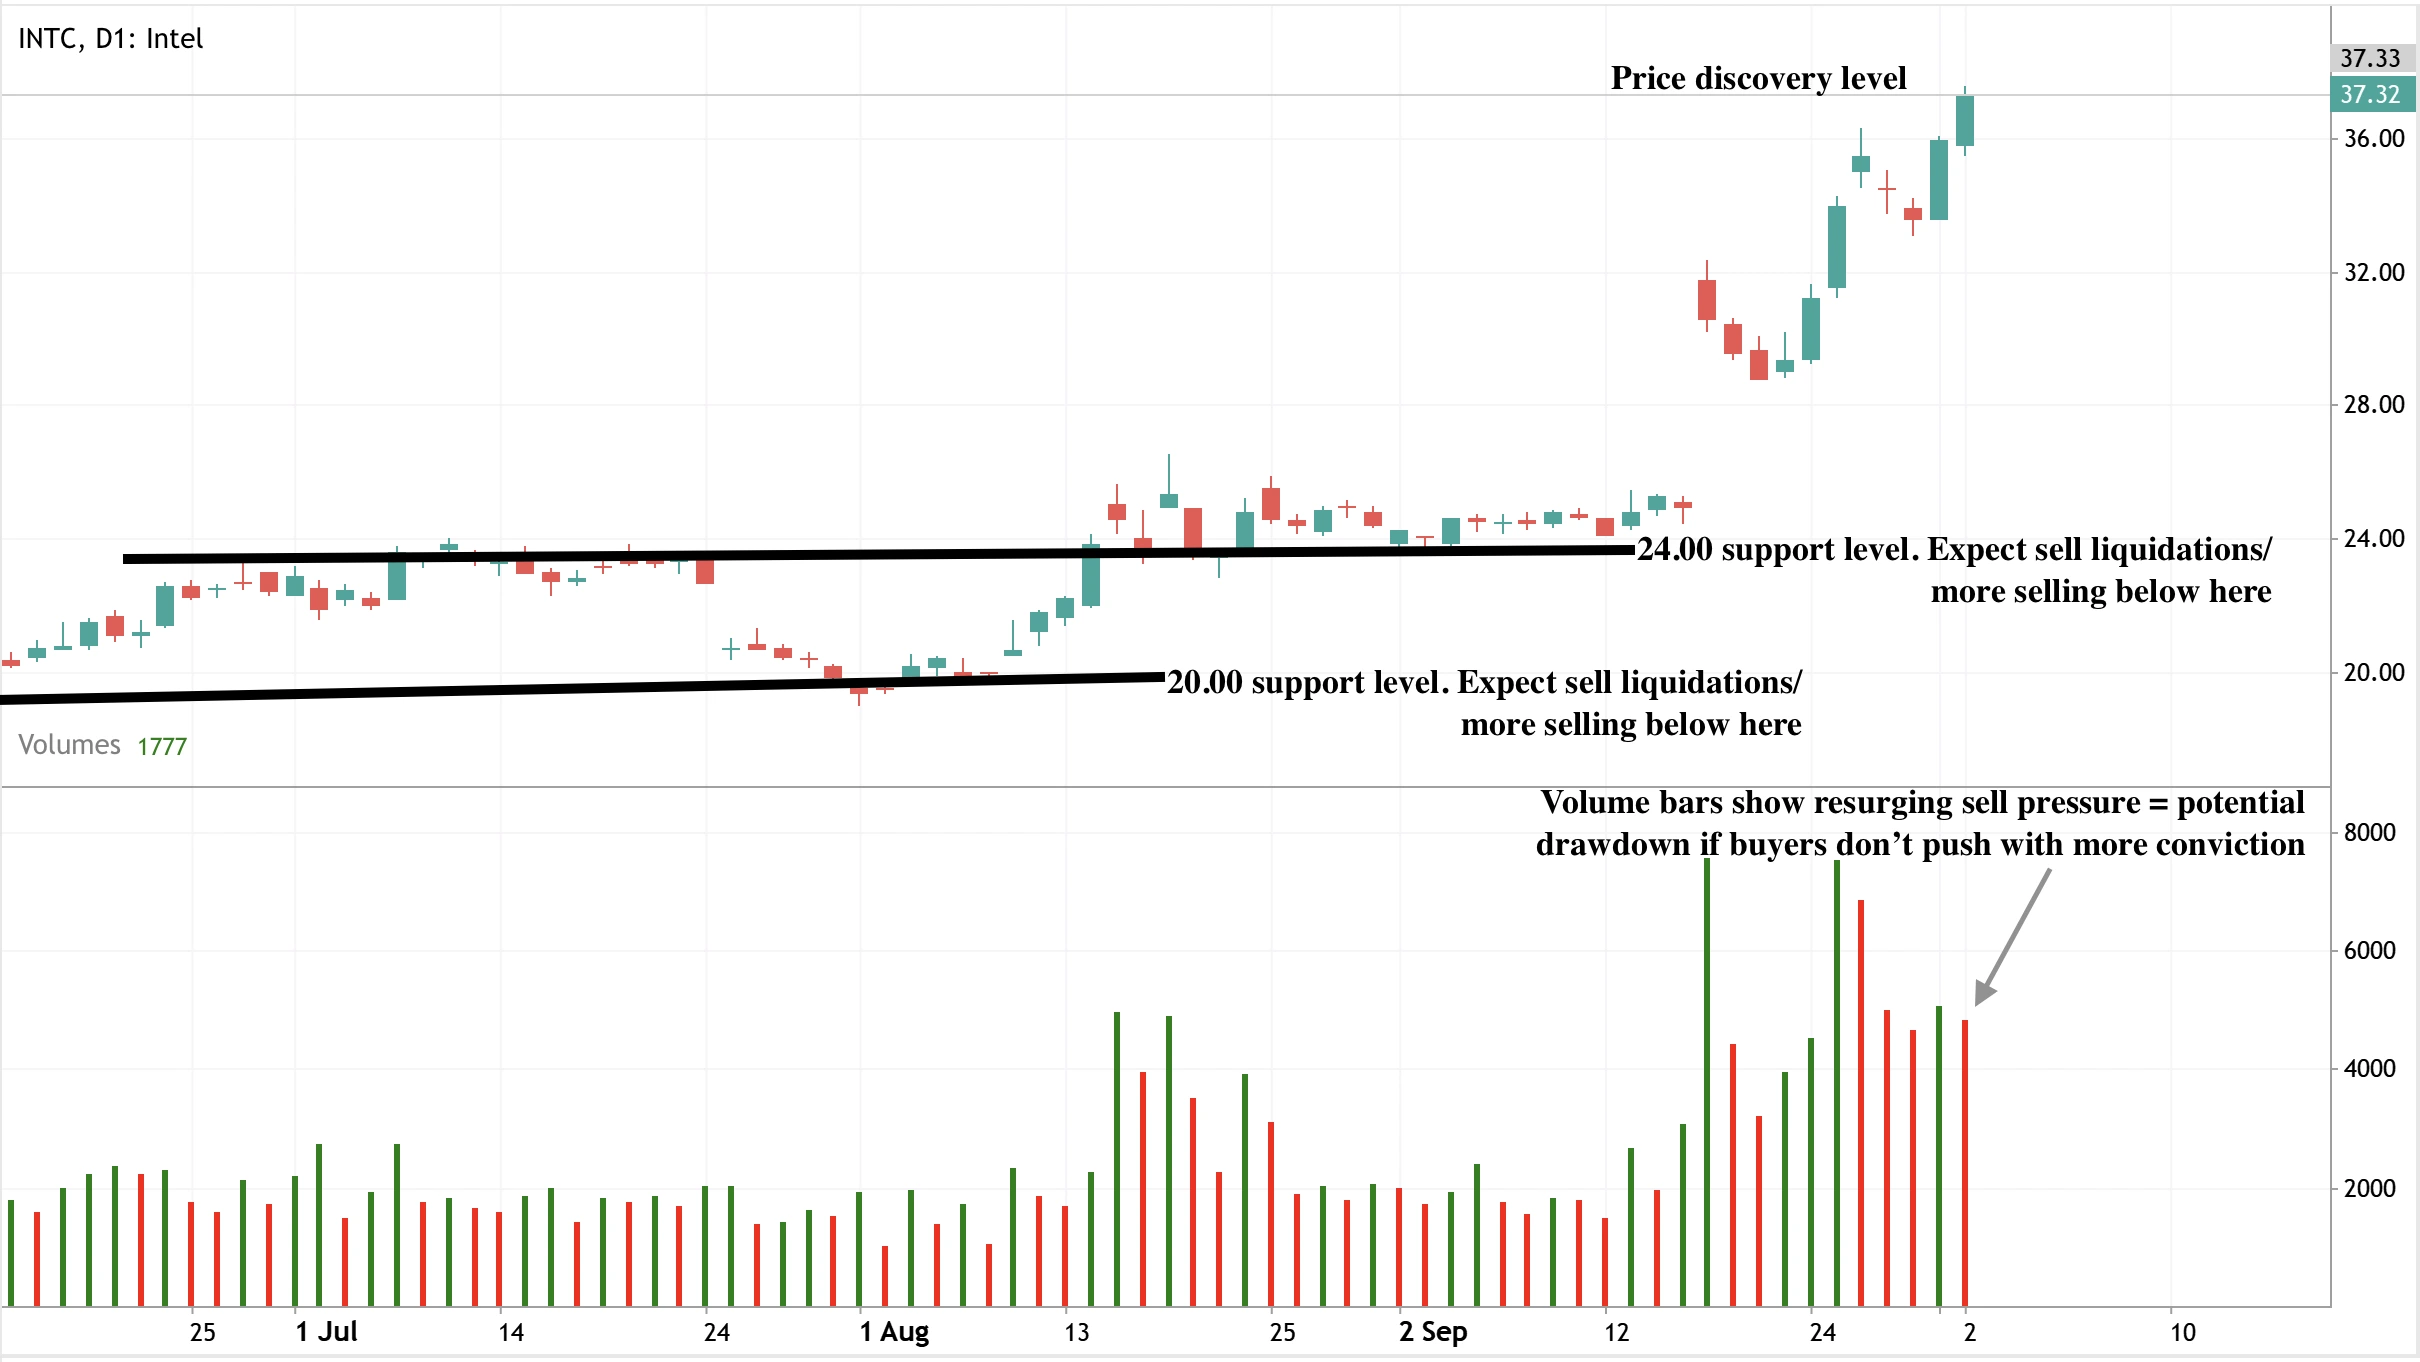
Intel stock forecast insights
At the time of writing, the daily chart shows a clear bullish bias, hinting at a potential further uptick. However, the volume bars reveal a resurgence in selling pressure, suggesting that upside momentum could be capped. If sellers dominate, prices could tumble toward the $24.00 support level, with deeper support seen at the $20.00 price level.
Traders looking to analyse these setups in real time can use Deriv MT5, which offers advanced charting and indicators for momentum-driven markets like Intel.
Trading Intel’s momentum on Deriv platforms
For traders, Intel’s current volatility presents opportunities across Deriv platforms:
- Deriv MT5 CFDs: Speculate on Intel’s short-term price moves with leverage, enabling both long (bullish continuation above $40.00) and short (reversal from resistance) strategies. Tight stop-loss placement is key given the stock’s sharp swings.
- Multipliers: Intel’s momentum makes multipliers attractive for those looking to capture quick moves around breakout levels without committing to full CFD exposure. A breakout above $40.00 could be a natural entry trigger for short-term multiplier trades.
- Risk management: Given Intel’s political ties and speculation-driven rally, volatility spikes are likely. Using Deriv’s built-in risk tools - such as stop-loss and take-profit settings - is essential for disciplined positioning. Traders can also calculate position sizes and risk/reward ratios with Deriv’s trading calculator to manage exposure effectively.
Investment implications
Intel represents a momentum-driven turnaround. The political and institutional support is unmatched in the semiconductor industry, giving it short-term resilience. A breakout above $40.00 looks possible, especially if AMD talks advance or further partnerships are announced.
However, the risks are elevated in the medium term. Intel must deliver on its promises in AI and foundry manufacturing or risk slipping back behind AMD and TSMC. For investors, this is a high-risk, high-reward trade: bullish in the short run but dependent on execution for lasting gains.
Related reading: explore our recent analysis on Gold’s breakout potential and Oil price volatility for more insights into trading commodities and tech-driven momentum markets.

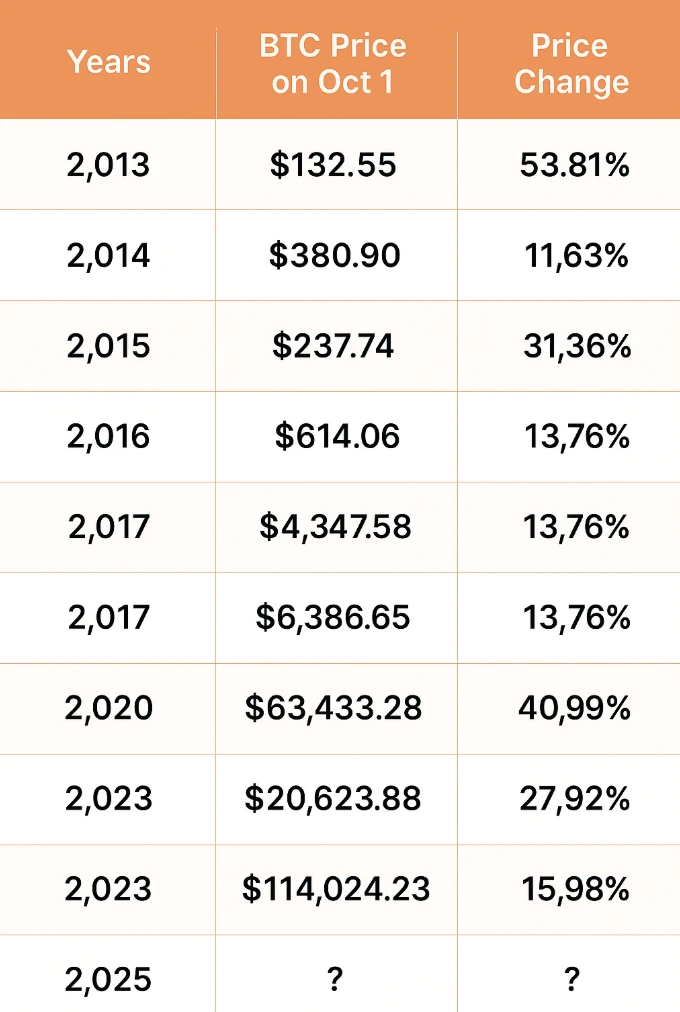
Bitcoin price prediction 2025: Will Uptober’s rally push BTC to $150K?
On-chain data reveals Bitcoin demand is surging as October 2025 begins, with monthly spot demand growing by 62,000 BTC since July and whale wallets expanding positions at an annual rate of 331,000 BTC.
On-chain data reveals Bitcoin demand is surging as October 2025 begins, with monthly spot demand growing by 62,000 BTC since July and whale wallets expanding positions at an annual rate of 331,000 BTC. This accumulation has pushed Bitcoin past $118,000, reinforcing the historical 'Uptober' pattern of strong Q4 rallies.
As Bitcoin enters Q4 2025, analysts are revising their Bitcoin price predictions for 2025 upward, with projections ranging from $150K to $200K by year-end. ETF inflows are also accelerating, with U.S.-listed funds adding over 200,000 BTC in Q4 2024 and expected to show similar strength this quarter.
Key takeaways
- Bitcoin surged past $118,000 at the start of October, confirming Uptober’s bullish reputation.
- Spot demand is rising steadily, supported by ETF inflows and whale accumulation.
- The U.S. government shutdown delays economic data and could reshape Fed policy expectations.
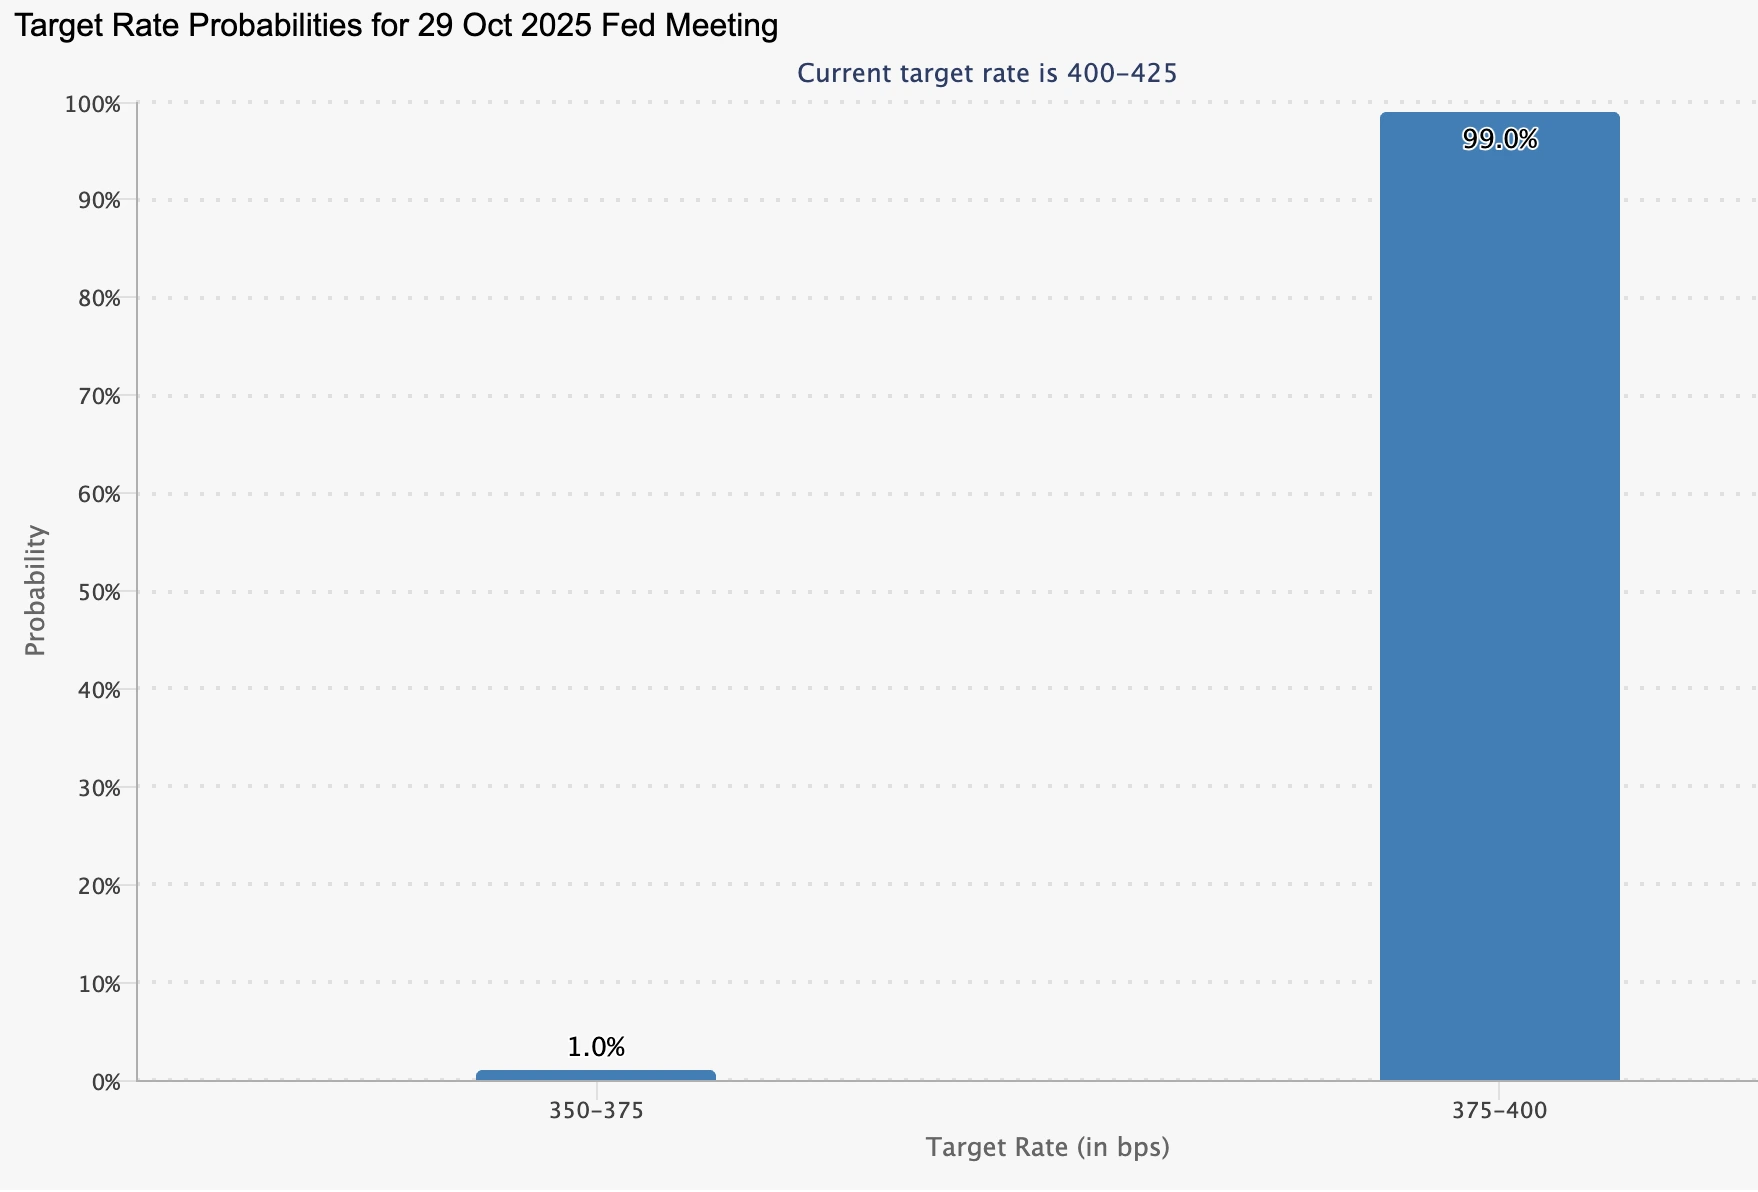
- Rate cut odds for October stand at ~95%, fuelling demand for risk assets.
- Analysts project resistance at $122K and $138K, with upside potential to $150K–$200K by year-end.
Bitcoin Q4 outlook: October surge backed by historical strength
Bitcoin has long shown a seasonal tendency to perform best in Q4, with October frequently marking the start of major bull phases.
Traders call this “Uptober,” a month when Bitcoin historically delivers above-average returns. In 2025, that narrative is reinforced by a strong September close (+5.35%), which on-chain analysts point out often precedes a bullish October.
The rally is also occurring alongside a broader move into safe-haven assets. Gold has reached fresh all-time highs above $3,900, while the Nasdaq and other U.S. indices show resilience. Bitcoin’s correlation to gold - historically with a 40-day lag - appears to be tightening, strengthening its case as “digital gold” during uncertain times.
Macro backdrop: Shutdown and the Fed’s next move
The U.S. government entered a shutdown on 30 September after Congress failed to pass a funding bill, leaving large parts of the federal apparatus shuttered. Immediate impacts include suspended federal pay, delayed Social Security services, and disruption to economic statistics.
The Bitcoin government shutdown impact has been notable: while equities came under pressure, Bitcoin surged past $118,000 as traders positioned it as a hedge against political dysfunction, similar to gold. Jobless claims, the September payrolls report, and October inflation data may all be postponed.
This blackout of government statistics forces the Federal Reserve to make policy decisions with less visibility. Economists warn that each week of shutdown could trim 0.1–0.2 percentage points off GDP, with a quarter-long closure shaving as much as 2.4 points from Q4 growth.
Amid this backdrop, markets are turning heavily on a dovish pivot. Polymarket data assigns an 88% chance of a 25 bps cut this month, while CME’s FedWatch tool puts the likelihood closer to 99%.
A cut would lower borrowing costs and typically increase appetite for risk assets, placing Bitcoin in a favourable position as liquidity conditions improve.
On-chain momentum: Bitcoin whale accumulation signals strong institutional demand
On-chain analytics confirm that Uptober’s rally is not solely sentiment-driven. Since July, monthly spot demand for Bitcoin has grown by more than 62,000 BTC, a pace that matches or exceeds levels seen before past Q4 rallies in 2020, 2021, and 2024.
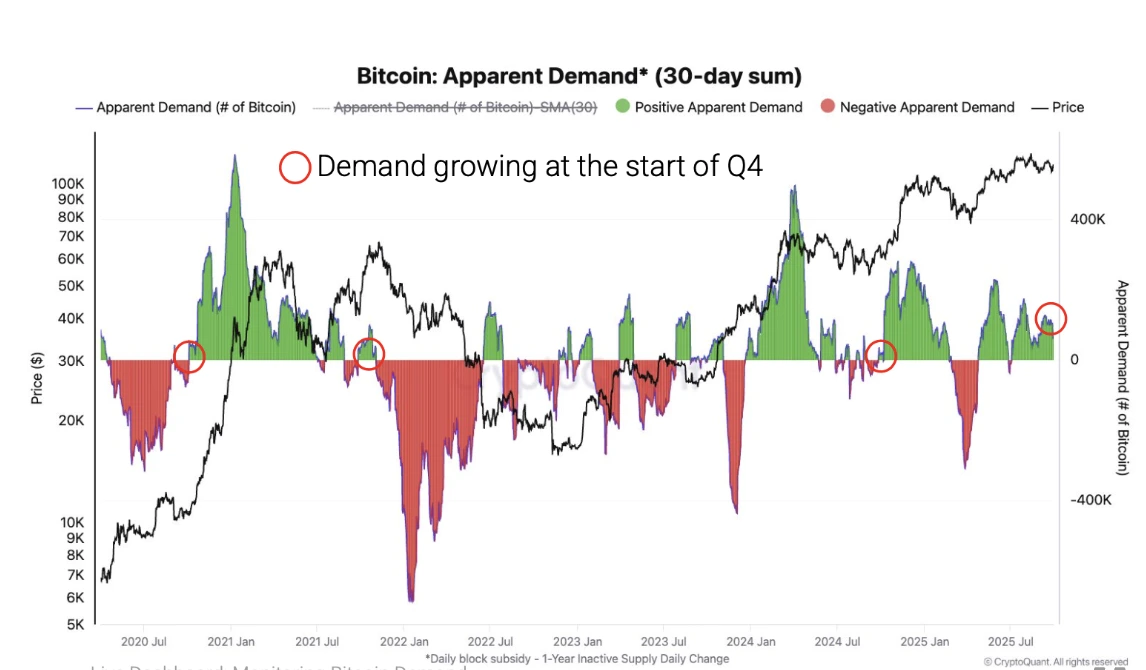
Whale wallets - large holders often seen as market movers - are expanding their positions at an annual rate of 331,000 BTC. This compares with 255,000 BTC in Q4 2024 and just 238,000 at the start of Q4 2020. The presence of strong whale accumulation contrasts with 2021, when whales were net sellers.
Institutional flows via ETFs - investment products that allow traditional investors to gain exposure to Bitcoin without directly holding it - are equally significant. U.S.-listed funds purchased 213,000 BTC in Q4 2024, a 71% quarter-on-quarter increase, and early indications suggest similar inflows this quarter. Analysts argue this institutional call underpins Uptober’s rally, making it structurally different from past cycles dominated by retail traders.
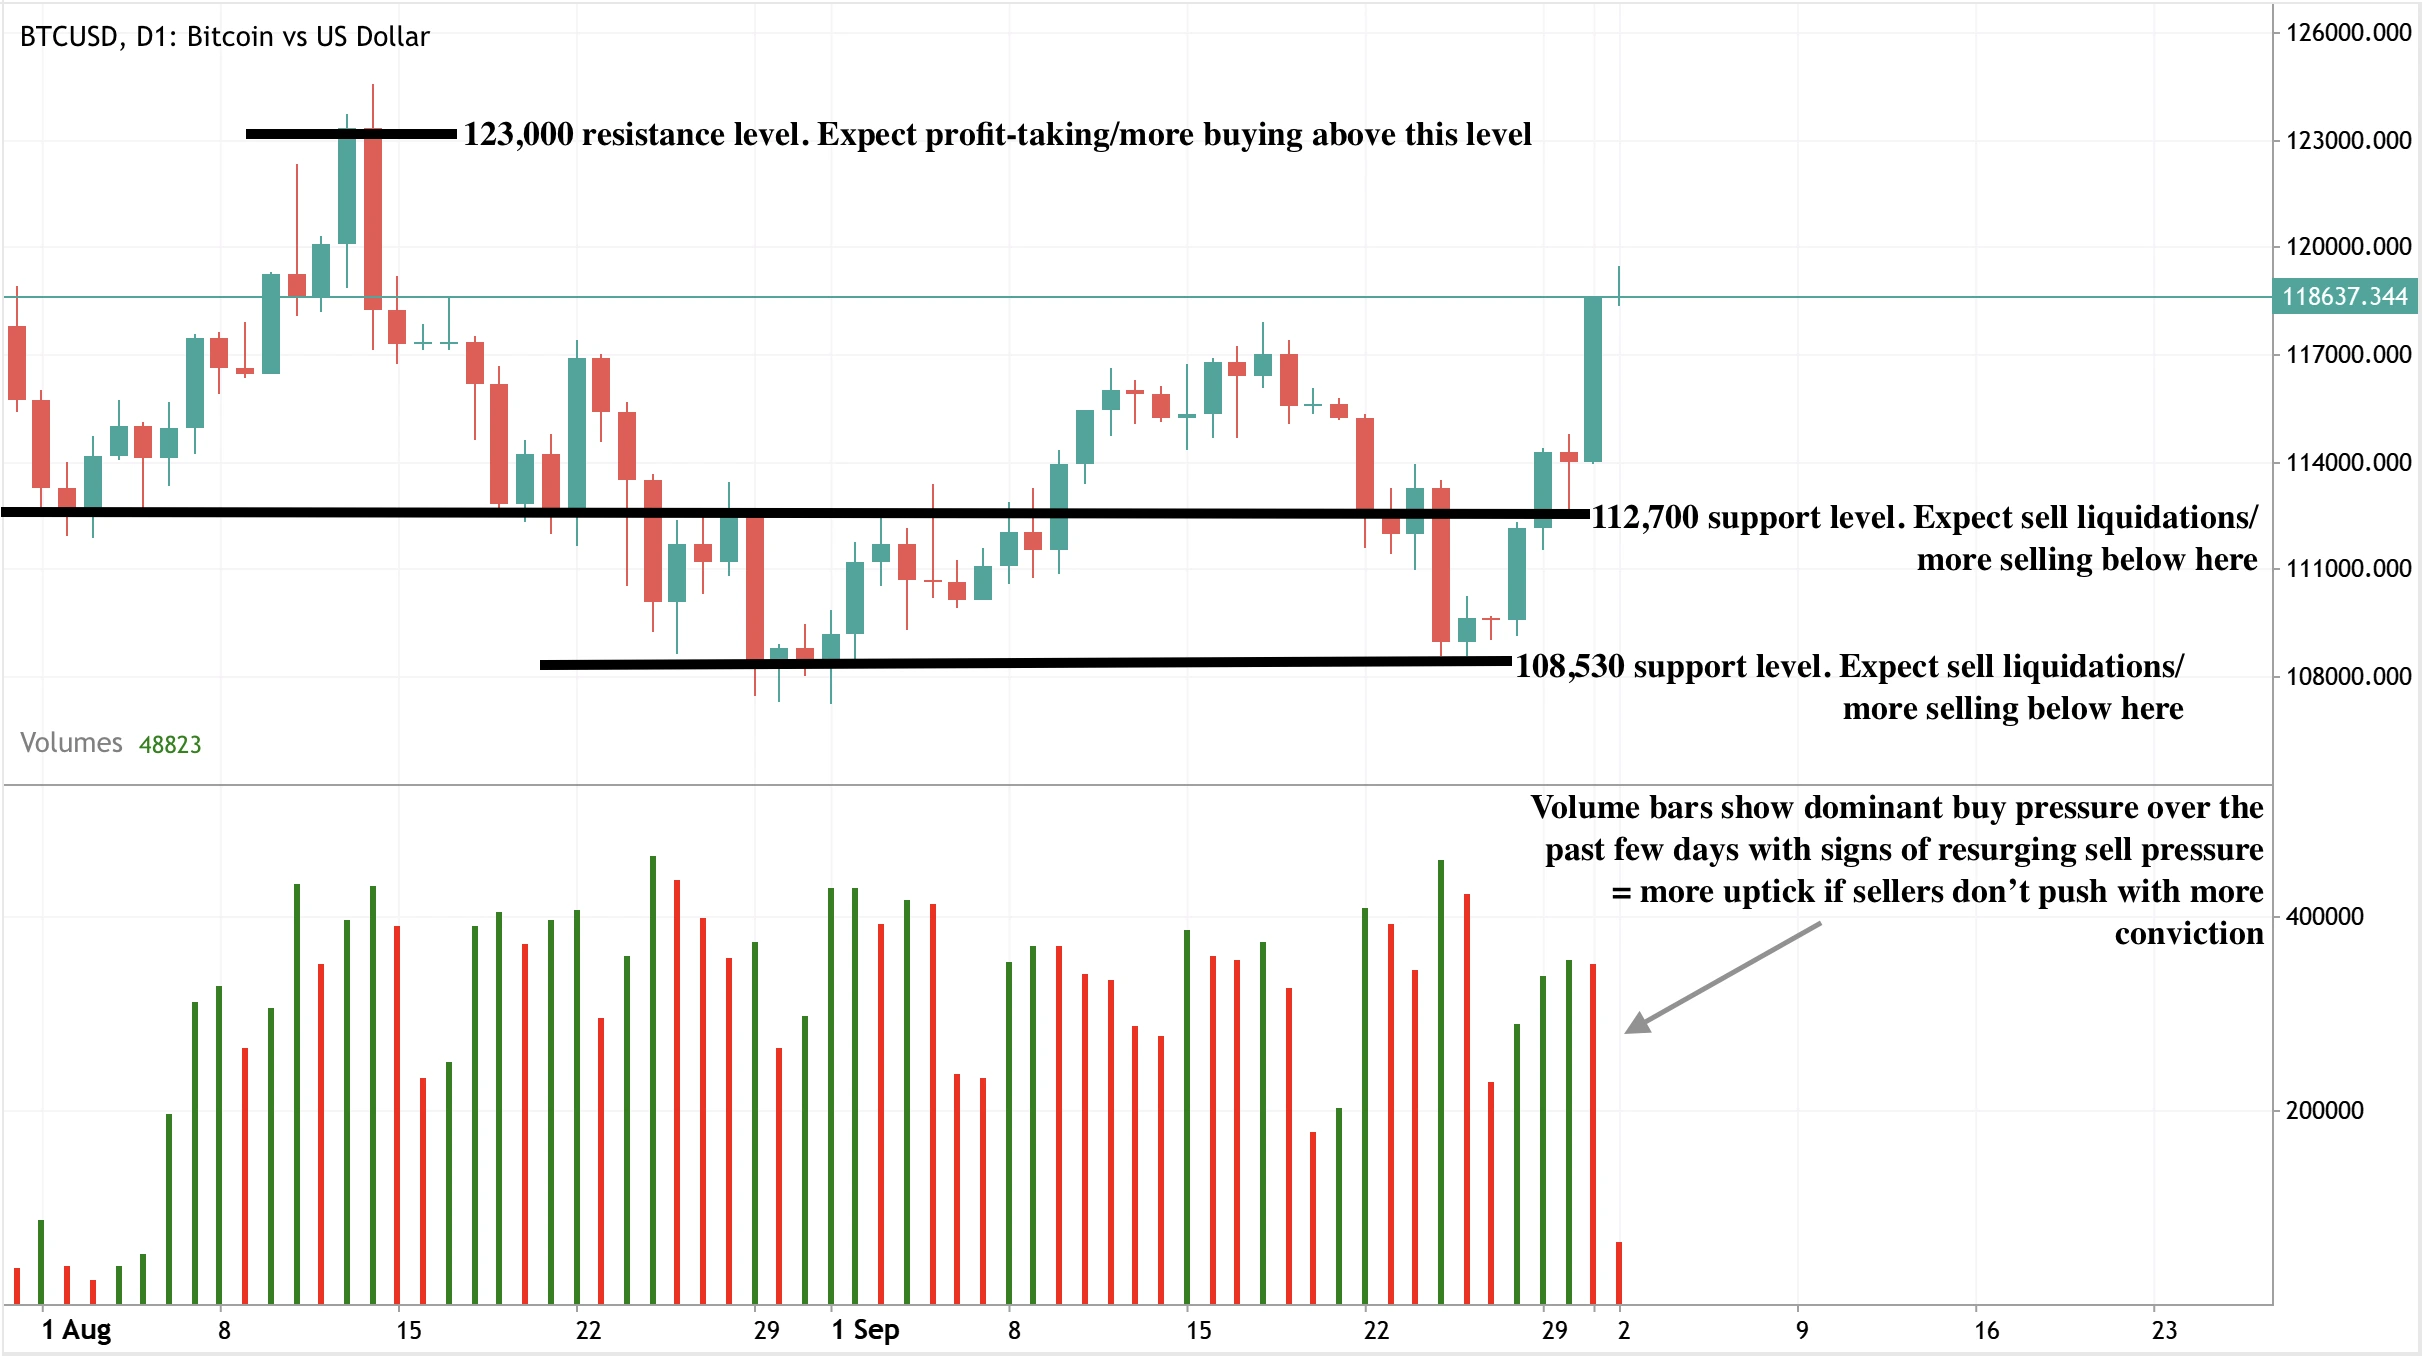
Bitcoin technical resistance levels: Buyers test control
At the time of writing, strong buy pressure is evident on the daily chart, hinting at further upside potential. On Deriv, you can explore these levels directly using advanced charting tools on Deriv MT5. However, volume bars show some sell-side resurgence, suggesting that sellers are not entirely out of the picture.
If buying momentum holds, Bitcoin could face resistance at the $123,000 level. Conversely, a sharper sell-off could drag prices toward the $112,700 support, with deeper support at $108,530. These levels frame the short-term battleground as Uptober progresses.
Regulatory and policy developments
Beyond on-chain data, the policy backdrop is shifting in crypto’s favour. President Trump’s administration has resolved the Corporate Alternative Minimum Tax (CAMT) issue, removing uncertainty around unrealised gains on Bitcoin and easing tax concerns for investors. Officials say this will strengthen the U.S. as a hub for Bitcoin innovation.
In the UK, Bank of England Governor Andrew Bailey has called for stablecoins to be regulated like money, suggesting they should have depositor protection and access to central bank reserves. This marks a significant change from Bailey’s earlier scepticism and highlights a gradual move towards regulatory integration of digital assets.
Bitcoin price prediction 2025
Analysts are increasingly optimistic about Uptober’s trajectory:
- CryptoQuant projects a range of $160K–$200K by year-end if demand persists.
- Standard Chartered forecasts Bitcoin could reach $500K by 2028, citing declining volatility and broadening investor access.
- Fundstrat’s Tom Lee and Bitwise also see $200K as achievable in 2025.
Still, near-term risks remain. A prolonged U.S. government shutdown could weigh on sentiment, and equities are showing weakness in premarket trading (S&P 500 futures –0.58%, Dow –0.52%, Nasdaq –0.67%).
Investment implications
For traders, Uptober’s breakout highlights a bullish setup supported by both macro and on-chain fundamentals. Short-term strategies should track the $122K–$123K resistance zone and supports at $112,700 and $108,530 for tactical entries.
For medium-term investors, ETF inflows, whale accumulation, and a friendlier policy environment point to stronger structural demand heading into year-end. The Bitcoin Q4 outlook remains strong as Uptober 2025 demonstrates robust fundamentals.
On-chain demand, whale accumulation, and accelerating ETF inflows all point to sustained momentum. While resistance levels at $122K and $138K may trigger consolidation, analysts increasingly expect Bitcoin to test the $150K–$200K range before year-end.
How to trade Bitcoin’s October rally 2025 on Deriv
Bitcoin’s Uptober momentum is creating higher volatility, which can mean more trading opportunities. The recent Bitcoin government shutdown impact shows how quickly political events can shift sentiment and create trading setups. If you’re looking to engage with this market on Deriv’s platform, here are structured steps to get started:
You can also identify entry and exit levels
- Watch the $123K resistance zones highlighted in this analysis.
- Monitor support levels at $112,700 and $108,530 as potential price floors.
- Use Deriv’s charting tools to set alerts for breakouts or retracements, and track pip value to measure the impact of price changes on your positions.
When applying risk management:
- Use stop-loss orders to limit downside if price moves against you.
- Set take-profit levels to secure gains in fast-moving markets.
- Trade with position sizes that align with your personal risk tolerance and monitor your margin requirements carefully to avoid forced liquidations. To calculate these precisely, try Deriv’s trading calculator.
Utilise Deriv's platform features by:
- Access real-time market data and customisable charts to track Uptober price action, and review the spread - the difference between buy and sell prices - to understand trading costs on Deriv.
- Try demo trading on Deriv MT5 to practise strategies before committing real funds.
- Use mobile and web platforms to monitor trades around the clock.
Reminder: Trading cryptocurrencies like Bitcoin involves risk due to high volatility.

Silver price prediction 2025: Analysts see $50 in play but will it hold?
Yes, silver - one of the world’s most actively traded commodities - has a credible chance of breaking its 1980 and 2011 records as it approaches $50 in 2025, according to experts.
Yes, silver - one of the world’s most actively traded commodities - has a credible chance of breaking its 1980 and 2011 records as it approaches $50 in 2025, according to experts. The metal has already surged 55% this year, climbing from $29 in January to nearly $47 in September, its highest quarterly close on record. The rally is underpinned by safe-haven demand amid political uncertainty, Federal Reserve rate cuts, persistent supply deficits, and record industrial use in sectors like solar and electric vehicles.
With demand projected to outstrip supply by more than 100 million ounces in 2025 and investor inflows into silver ETFs close to historic highs, analysts see $50 as a realistic near-term target. The main question is whether silver clears this level in the next leg higher or pauses for a correction before breaking through.
Key takeaways
- Silver is up 55% YTD in 2025, outperforming gold in percentage terms.
- Fed rate cuts and dollar weakness reduce the cost of holding non-yielding assets.
- Industrial demand above 700 Moz is driven by solar, EVs, and electronics.
- Supply shortfall: global output (~844 Moz) trails demand, creating a 100 Moz+ deficit for a fifth straight year.
- Investor flows: Silver ETP holdings rose 95 Moz in H1 2025 to 1.13 billion ounces.
- Volatility hedges surged: net dealer long VIX positions at 87,000 contracts, $VXX assets up 312% YoY.
- Risks: retail speculation in equities diverts flows, and profit-taking can spark pullbacks.
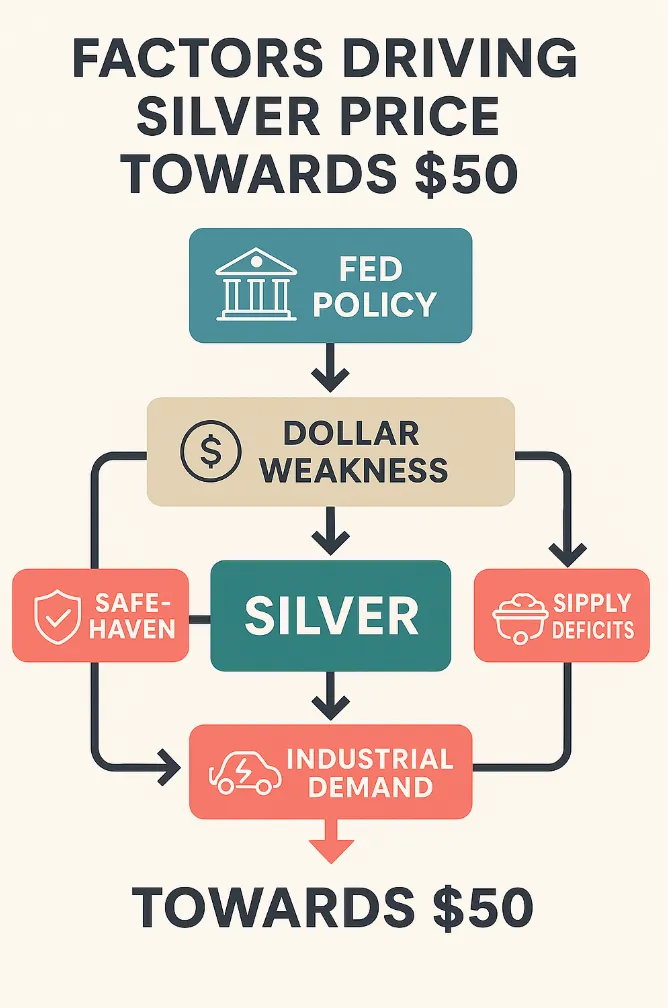
Silver safe-haven demand: Political risk insight
Silver’s surge has been reinforced by safe-haven flows tied to U.S. political uncertainty. Ahead of midnight on 30 September, fears of a government shutdown saw investors shift into gold and silver. Analysts agree the risk alone - even without an actual shutdown - heightened demand as markets priced in disruption to government services and data releases.
At the same time, geopolitical tensions, from renewed fighting in Ukraine to conflict risks in the Middle East, add to silver’s safe-haven appeal alongside gold.
Federal Reserve policy and the dollar backdrop
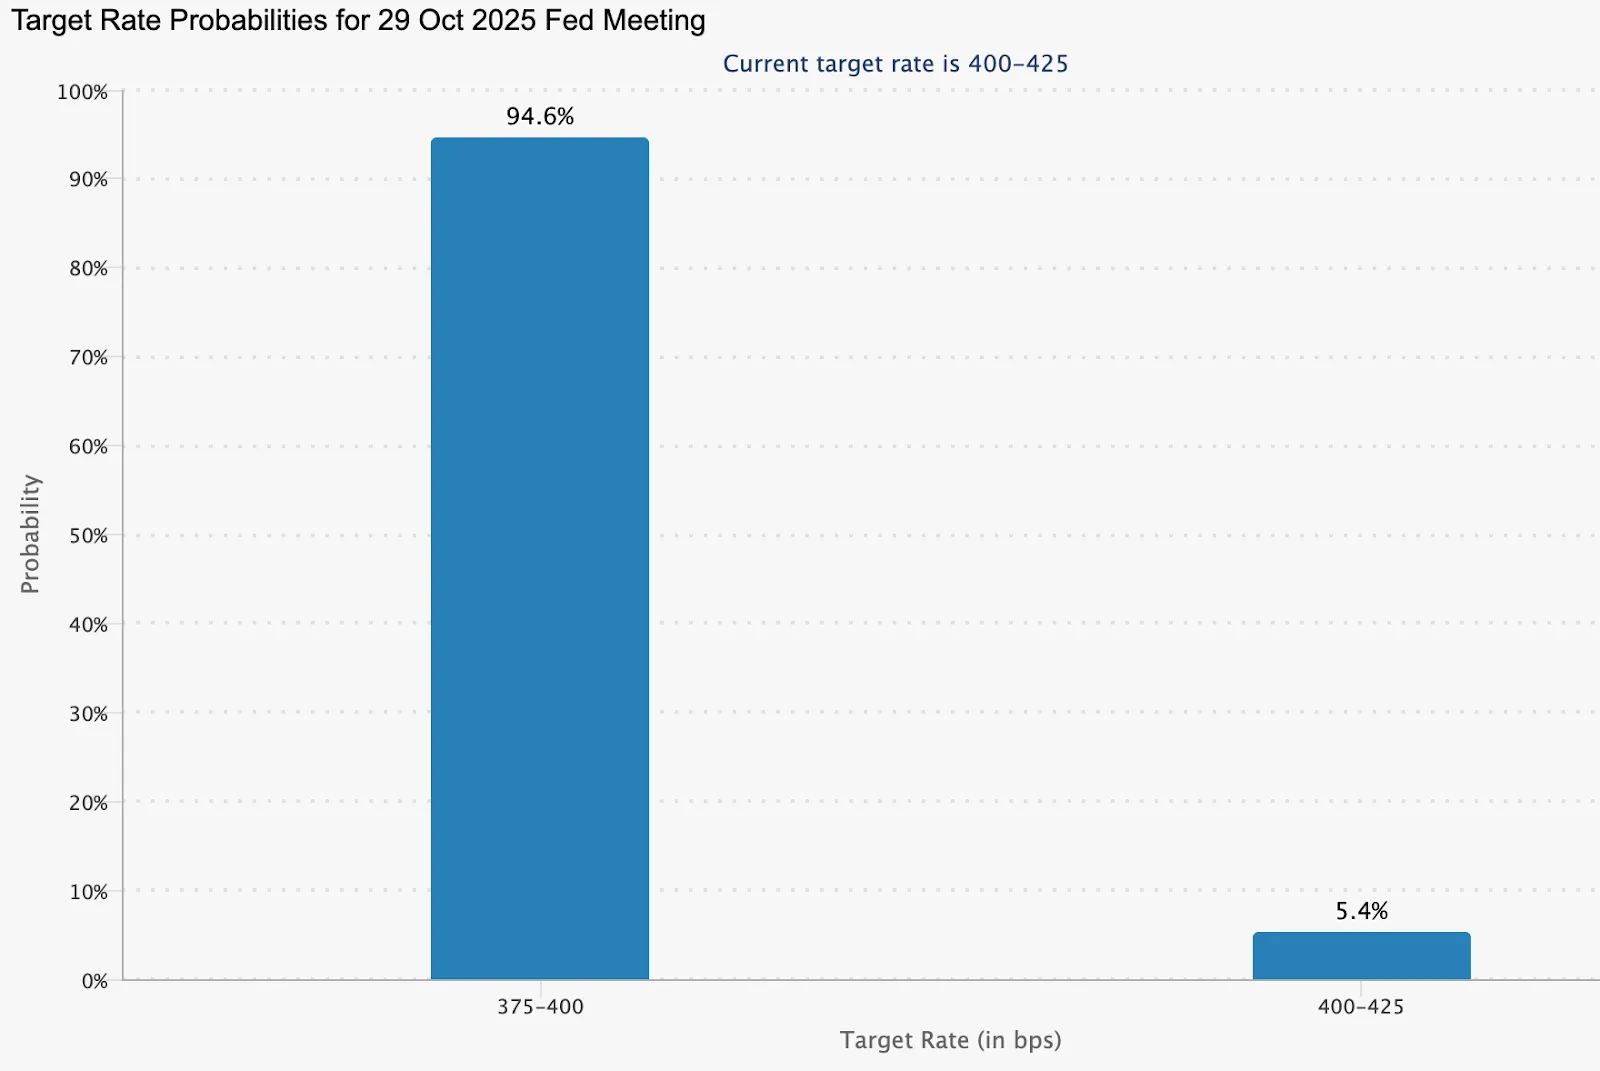
The U.S. Federal Reserve has turned from tightening to a fed rate cut. A 25-basis-point cut in September -its first in years - set expectations for another in October, with markets pricing an 94.6% chance of a follow-up cut.
Inflation data (PCE) confirmed inflation staying above the Fed’s target rate, reinforcing the narrative of a follow-up cut. Lower rates reduce the opportunity cost of holding bullion, while dollar weakness makes silver cheaper for overseas buyers. This monetary backdrop is seen as one of the strongest drivers behind silver’s 2025 rally.
Industrial demand is driving structural growth
Silver’s demand story extends well beyond safe-haven flows. The silver industrial demand forecast shows consumption staying above 700 Moz in 2025, supported by three major sectors:
- Solar energy: Silver’s conductivity is critical for photovoltaic cells.
- EVs: Electric vehicles require far more silver than traditional cars, from batteries to charging infrastructure.
- Electronics: Global consumer and industrial electronics continue to underpin usage.
These drivers consumed record volumes in 2024 and are set to accelerate further in 2025. Analysts see this clean-energy shift as a structural support for silver prices regardless of short-term macro volatility.
Silver supply deficit: Silver investment outlook 2025
Global silver production is expected to be near 844 Moz in 2025, insufficient to meet demand. With roughly 70% of silver mined as a byproduct of base metals, supply does not rise in response to higher silver prices.
Structural challenges - falling ore grades, regulatory hurdles, and investment delays - add further limits. The Silver Institute forecasts a fifth consecutive annual deficit in 2025, with demand surpassing supply by more than 100 Moz. This imbalance supports a longer-term bullish outlook.
Investor flows and market sentiment
Investment demand has amplified the rally. Silver-backed ETP holdings increased by 95 Moz in H1 2025, bringing global totals to 1.13 billion ounces - close to historic peaks. Within this broader category, silver ETF holdings 2025 have been a key driver of momentum, reflecting strong investor appetite for exposure through funds.
Silver ETFs have delivered gains of 54% YTD, attracting momentum-driven investors. Regionally, India’s retail demand rose 7% YoY, while Europe’s market is recovering.
At the same time, volatility hedges have surged:
- Net dealer long positions in $VIX reached 87,000 contracts, the highest in four years.
- The largest VIX ETN, $VXX, saw assets jump 312% YoY to nearly $1 billion.
- Leveraged product $UVIX recorded 215% inflows.
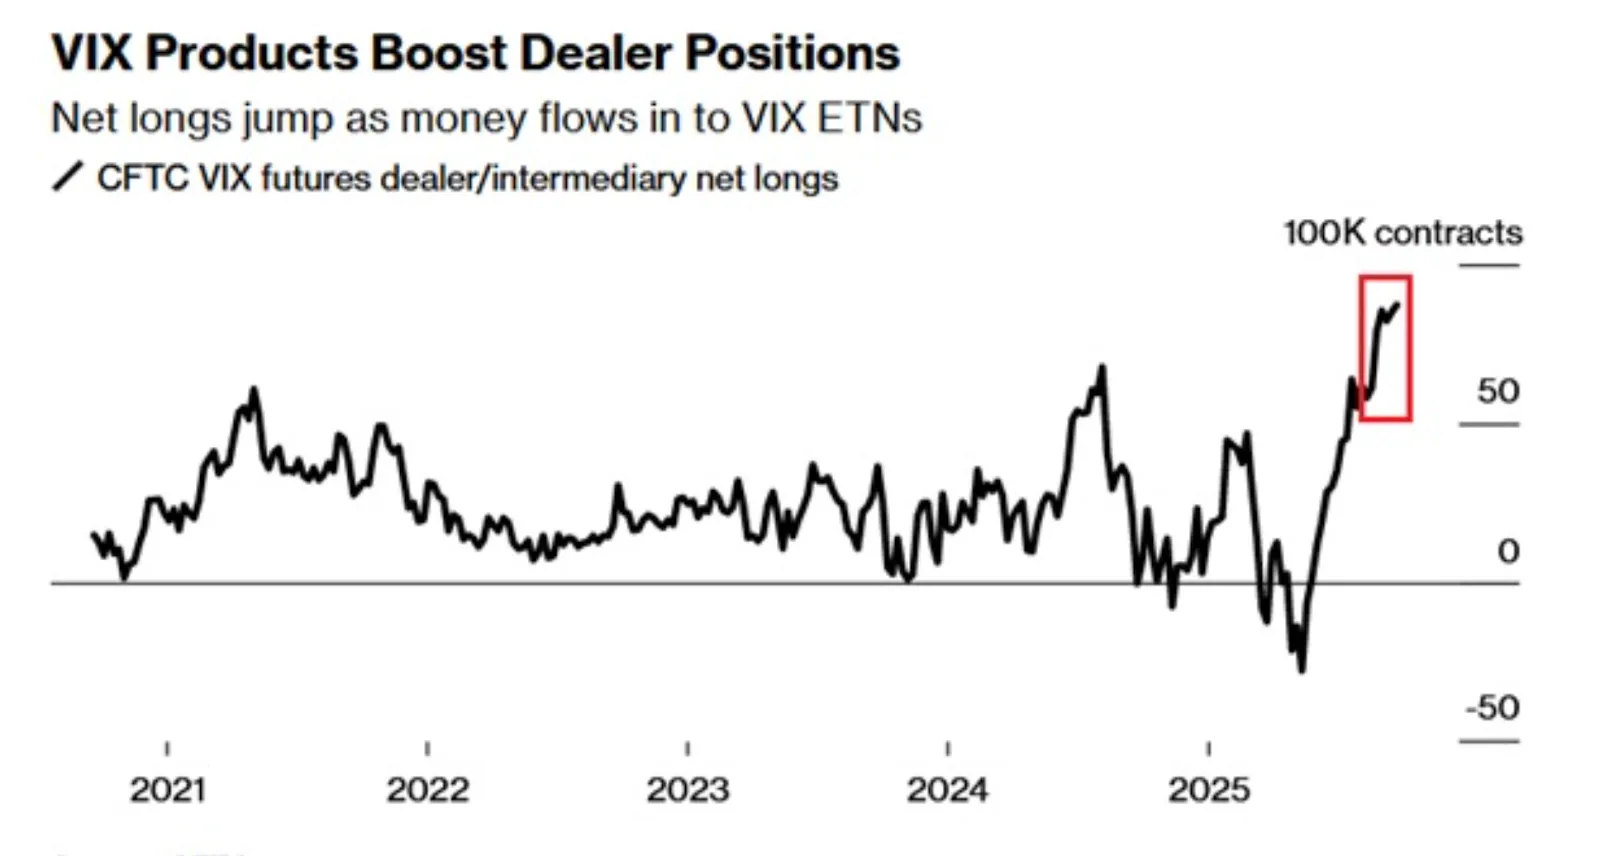
This reflects broad caution in markets - a factor that typically benefits safe-haven metals.
Short-term risks: Retail frenzy and corrections
Despite strong fundamentals, risks remain. U.S. retail traders have driven call-option volumes to a record 9 million contracts (5-day avg) - nearly double puts and triple 2020 levels - signalling aggressive risk-on positioning. This speculation in equities can divert flows away from safe-haven metals.

Analysts also note that dips in silver reflect technical profit-taking rather than a reversal of trend. In other words, while silver may pause before $50, the medium-term drivers remain intact.
Silver technical insight
At the time of writing, Silver is in price discovery mode, testing levels it last hit back in 2011 - hinting at a potential further uptick. However, the volume bars show significant seller pushback, which could put pressure on prices and lead to a consolidation if buyers don’t push with more conviction. With enough seller pushback, we could see prices retreat towards the $44.00 support level, with further support levels at $40.73 and $37.45.

Investment implications
For investors, silver’s setup in 2025 is defined by tight supply and dual demand.
- Short-term: We could see volatility around the $50 level. Corrections are likely, but dips may offer buying opportunities if Fed cuts and volatility fears persist.
- Medium-term: Persistent deficits and structural demand growth suggest silver could break through $50 and sustain higher levels.
- Market positioning: Silver miners stand to benefit from strong prices, while industrial users may face cost pressures. Traders should prepare for volatility, with a bias toward upside as long as macro and industrial trends remain supportive.
Trading Silver’s approach to $50
As silver edges closer to the $50 mark, traders are watching for opportunities. The way you might trade this move depends on your style and time horizon. Below are common approaches used in the markets, explained for educational purposes.
1. Short-term traders: Riding the volatility
- How they trade: Short-term traders often look for quick price swings around key levels such as $47–$48. Breakouts and pullbacks can be entry points, but they usually keep positions smaller to avoid being caught by sudden reversals.
- Risk practices: Protective tools like stop-loss or trailing stops are commonly used to manage exposure.
- On Deriv: Silver can be traded as XAGUSD CFDs on Deriv MT5, offering flexible contract sizes and leverage.
2. Medium-term traders: Following the trend
- How they trade: Medium-term participants tend to focus on trend continuation signals - for example, watching whether silver forms higher lows or holds above support.
- Risk practices: Scaling into positions over time rather than committing all capital at once helps spread risk.
3. Long-term investors: Building exposure gradually
- How they trade: Investors may prefer gradual accumulation, treating dips as opportunities to add exposure rather than aiming to time the perfect entry.
- Risk practices: Balancing silver with other commodities or assets can help avoid overconcentration.
- On Deriv: Silver is available via commodities and ETF-inspired products on Deriv Trader. A demo account allows you to explore strategies before committing funds.
4. Universal step: Practise first
Regardless of style, many traders test strategies in a demo environment before trading live. Silver is known for sharp moves, so simulated trading can help you see how it reacts at different levels without real risk.

Gold price prediction 2025 points to a potential supercycle
Yes - gold’s surge toward $4,000 an ounce shows signs of a structural uptrend rather than a short-lived spike, according to analysts.
Yes - gold’s surge toward $4,000 an ounce shows signs of a structural uptrend rather than a short-lived spike, according to analysts. With 39 record highs in 2025 and futures now within 1% of $3,900/oz, the conditions point to the early stages of a potential supercycle: a dovish Federal Reserve pivot, weakening US dollar, and strong safe-haven inflows.
Gold, a precious commodity prized for its scarcity, durability, and historic role as a store of wealth, has always attracted investors in times of uncertainty. Yet the speed of the rally and speculative fervour around events like Zinjin Gold’s blockbuster IPO raise the possibility that markets are chasing momentum rather than fundamentals. The evidence suggests gold is moving toward supercycle territory, but whether $4,000 marks the beginning of that trend or the peak of mania will depend on what unfolds in the months ahead.
Key takeaways
- Gold has risen to nearly $3,900/oz in 2025, logging 39 all-time highs and putting $4,000 in sight.
- Federal Reserve rate cuts and dovish commentary are a major tailwind for non-yielding assets like gold.
- The US dollar is losing its appeal as a safe store of value amid debt concerns and broad devaluation.
- Safe-haven flows are strong, but investor enthusiasm also risks tipping into speculative excess.
- Zinjin Gold’s IPO surge (+60%) underscores investor demand spilling into gold-linked equities.
Gold’s record-breaking run
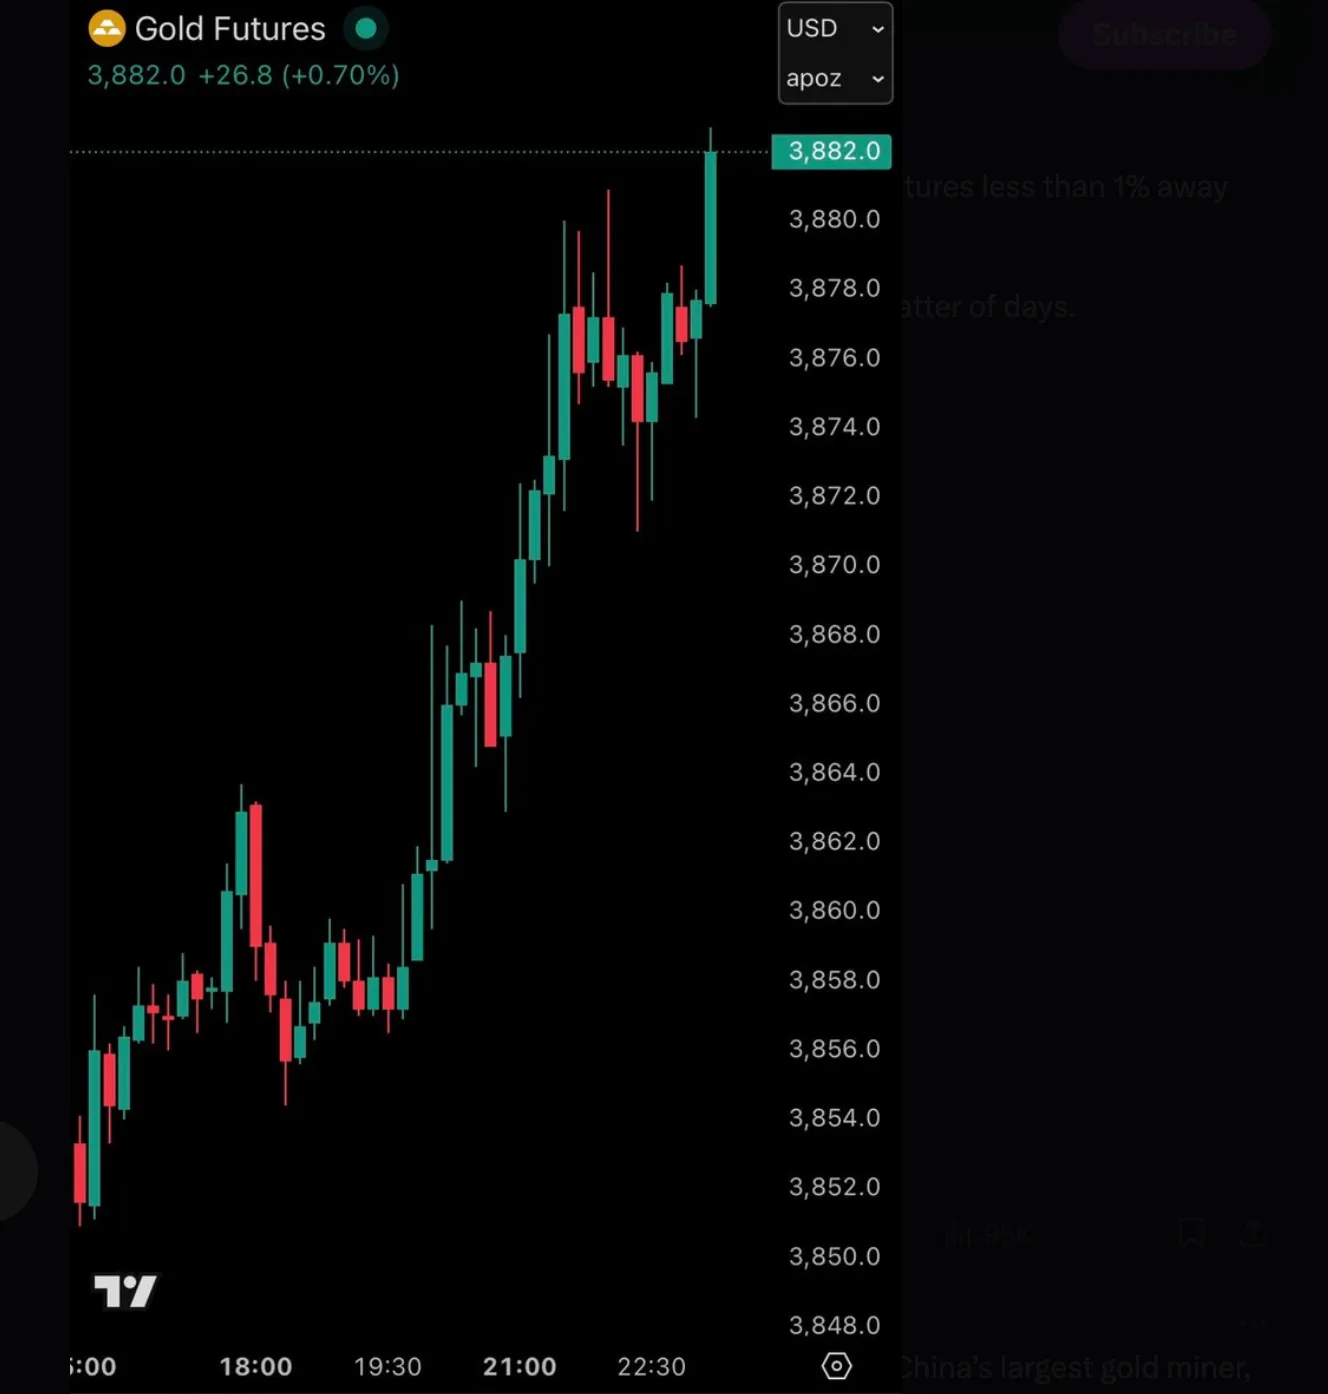
As Gold prices made history, futures rose to less than 1% away from $3,900/oz per ounce.
This performance makes 2025 one of the strongest years for precious metals in decades, with both gold and silver delivering standout returns. While equities remain resilient, gold’s momentum has outpaced most asset classes, leaving traders to debate whether the $4,000 mark is inevitable before year-end. For traders, commodity CFDs offer a way to capture these moves without owning the physical asset.
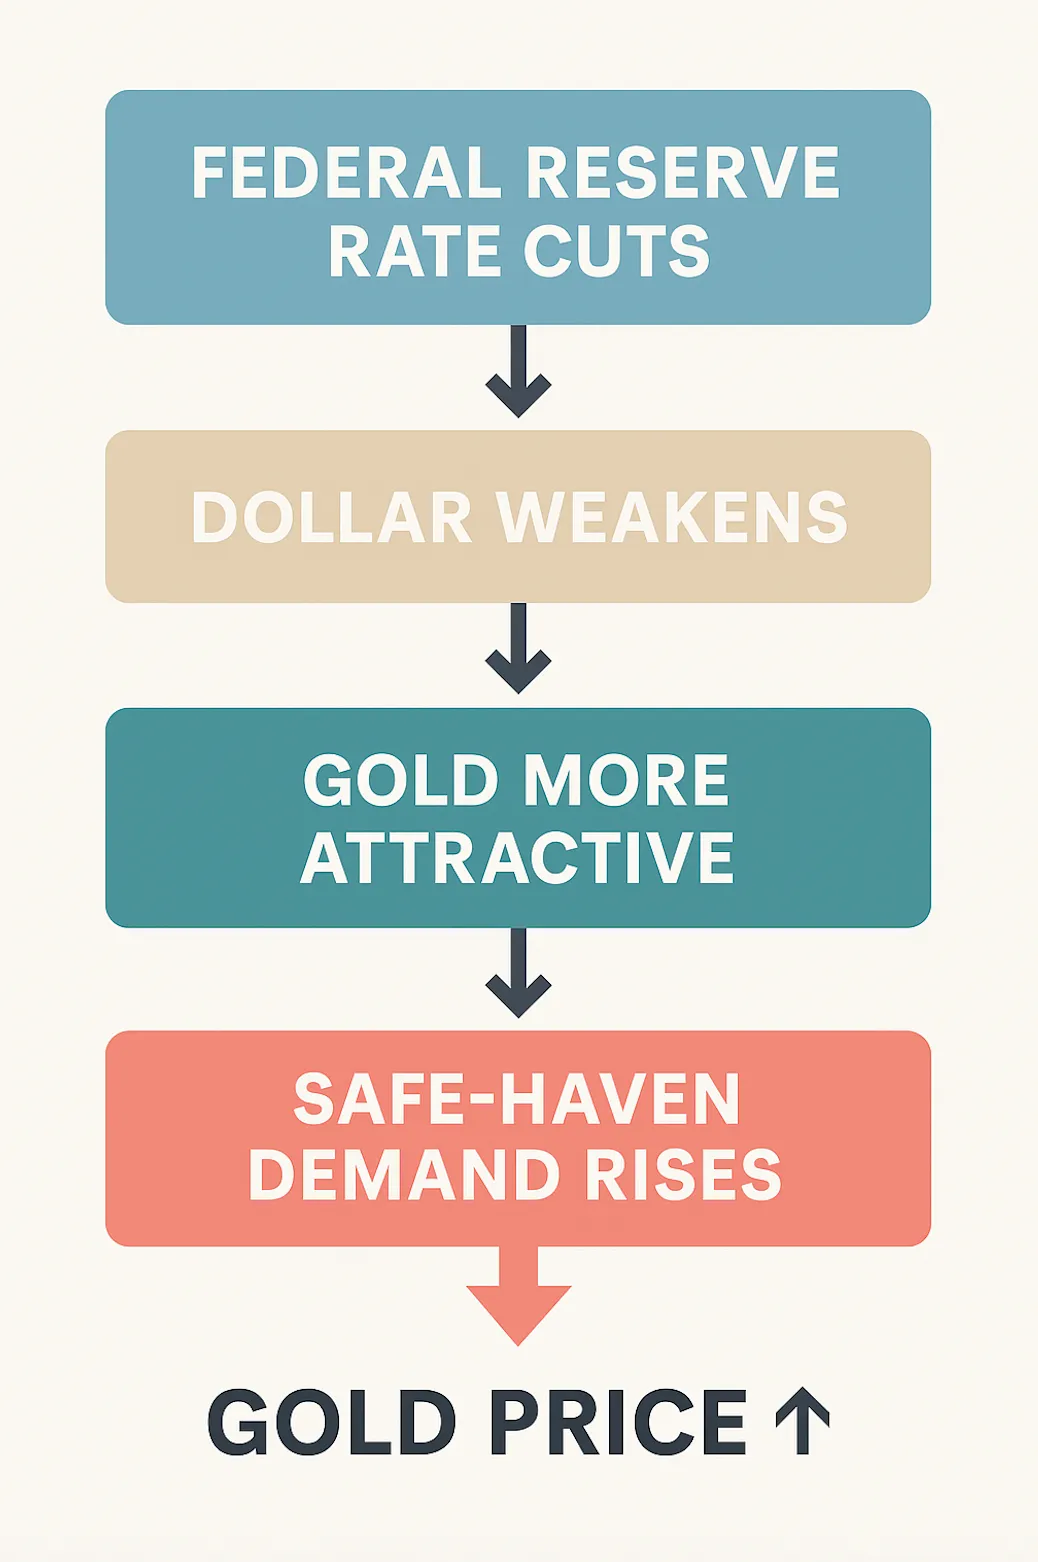
Federal Reserve impact on Gold prices
The Federal Reserve’s pivot towards a more dovish stance has provided strong support for gold. Despite hawkish positioning earlier in 2025, policymakers have now reduced the funds rate and signalled that further cuts are possible in the two remaining meetings of the year.
Lower rates reduce the opportunity cost of holding non-yielding assets, making gold more attractive and reinforcing the case for a potential gold supercycle. Markets are increasingly pricing in a sustained easing cycle that could underpin gold demand well into 2026.
The dollar devaluation effect
Gold’s rally is closely tied to a weakening US dollar. The Dollar Index (DXY) has slipped to around 97.87, down roughly 0.08% today.

But beyond exchange rate movements, investor concern over US sovereign debt has eroded trust in the dollar as a long-term store of value. This shift is significant: while gold has always had an inverse correlation with USD, the scale of devaluation in 2025 is pushing capital into gold more aggressively than in previous cycles - one of the key dynamics underpinning talk of a gold supercycle.
How key forces interact with gold prices
Gold safe-haven investment in 2025
Investor demand for safe-haven assets has intensified. While the S&P 500, Dow Jones, and Nasdaq have posted gains, political uncertainty - particularly around the threat of a US government shutdown - has strengthened gold’s appeal.
The potential delay of employment data from the Bureau of Labor Statistics adds another layer of risk, given the Fed’s reliance on data for policy decisions. In contrast, traditional safe havens such as the dollar and yen are underperforming, leaving gold, silver, and the Swiss franc as strong alternatives.
Mania or Gold supercycle?
The combination of record prices, investor enthusiasm, and blockbuster events like Zinjin Gold’s IPO (+60% on debut) suggests a market driven not only by fundamentals but also by momentum.

For some analysts, this is a hallmark of a gold supercycle - a prolonged structural uptrend in precious metals, underpinned by macroeconomic shifts. For others, the speed of gold’s ascent raises concerns about speculative excess. Whether $4,000 marks a stepping stone to a multi-year bull market or a near-term peak will depend on the Fed’s trajectory, global confidence in fiat currencies, and the durability of safe-haven demand.
Gold price forecast: Technical insight
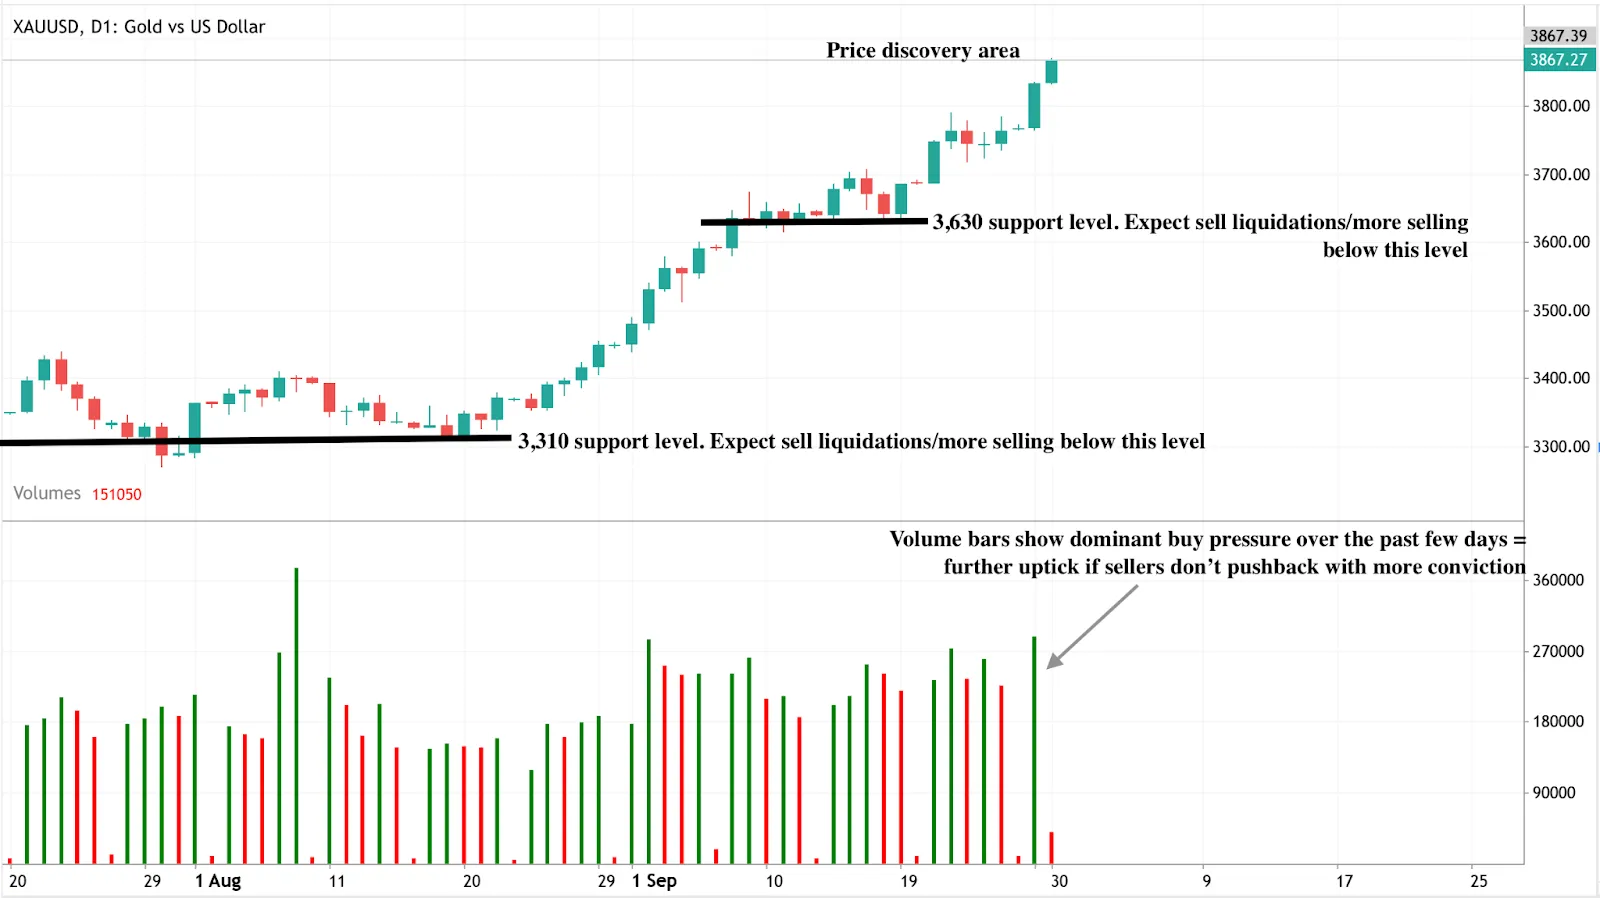
At the time of writing, Gold’s momentum is showing no signs of slowing. Volume bars support this bullish sentiment, with sellers not pushing back with enough conviction. If bulls keep pushing, prices could breach a historic $4,000. Conversely, if sellers regain momentum, we could see a significant retreat towards the $3,630 support level. A price crash will likely be held at the $3,310 support level.
Investment implications
For traders and investors, gold’s rally presents both opportunity and risk. Short-term strategies may benefit from momentum trading towards the $4,000 level, particularly in times of heightened political tension. Medium-term positions should consider the risk of overextension: if gold fails to break $4,000 convincingly, consolidation or correction is likely. Longer-term allocation hinges on whether the supercycle thesis proves correct. In that case, gold could remain one of the top-performing assets well into the second half of the decade.
How to trade Gold on Deriv: Step-by-step
Gold’s rally is full of opportunity - but turning analysis into action requires structure. Here’s how traders can approach gold on Deriv platforms:
1. Set up gold trading on Deriv MT5
- Log in to your Deriv account and select Deriv MT5 (DMT5).
- Open a CFD account (Synthetic, Financial, or Financial STP, depending on your trading preference).
- Search for XAUUSD (Gold vs US Dollar) in the market watch list and add it to your symbols.
- Start analysing the live chart with built-in technical tools.
2. Strategy ideas for different price scenarios
- Breakout trade: If gold convincingly breaches $4,000, momentum trading techniques can ride the move higher, with tight stop-loss orders to protect against reversals.
- Range trading: If gold stalls between $3,630 (support) and current levels, using oscillators (RSI, Stochastics) can be beneficial for entering trades near support and exiting near resistance.
- Pullback entry: If prices retreat toward $3,310, this could be a potential entry point for longer-term bullish positions, provided fundamentals (Fed cuts, weak dollar) remain intact.
3. Risk management for volatile gold markets
- Stop-loss orders below support levels (e.g., $3,630 or $3,310) can help manage downside risk.
- Use position sizing: Traders commonly expose only 1–2% of their account per trade to account for gold’s volatility.
- Diversify: Balancing gold with other assets like indices, forex, or silver CFDs on Deriv MT5 can help manage overall portfolio risk.
- Track news flow: Fed announcements, U.S. debt news, and political risk events can influence gold prices, making it useful to monitor these developments.
4. Next steps
Ready to trade? Explore gold CFDs on Deriv and put these strategies into practice with a demo account before committing real capital.

Oil price forecast: Can WTI crude Oil price sustain above $65?
Can WTI hold the momentum or will returning supplies from Iraq and Kurdistan, alongside U.S. shale’s rising costs, stall the rally?
Oil prices represent the global market value of crude petroleum, serving as a critical economic indicator that affects inflation, energy costs, global trade, and investment strategies. When oil prices move sharply, traders, investors, and policymakers all take notice.
This week, West Texas Intermediate (WTI) crude settled just above $65, marking its highest level since early August. The move was driven by a mix of tighter supplies, renewed geopolitical risks, and surprising U.S. inventory data. But the key question for traders is whether WTI has the momentum to hold above $65 and push toward $70 - or whether returning supplies from Iraq and Kurdistan, alongside U.S. shale’s rising costs, could stall the rally.
Quick summary
- U.S. inventory drawdown → bullish sentiment → WTI crude pushed above $65
- Ukrainian drone strikes → Russian export bans → tighter global supply
- Rising U.S. shale breakeven costs → reduced flexibility to offset shocks → higher price floors
- Resumption of Iraqi/Kurdistan exports → increased supply → potential cap on gains
- Stronger U.S. GDP growth → robust oil demand but cautious Fed → mixed outlook for global consumption
Price action: Brent and WTI at multi-month highs
- Brent crude, the international benchmark for over two-thirds of global oil, rose 2.48% to $69.31.
- WTI crude, the U.S. benchmark, gained 2.49% to $65.00.
These gains mark the strongest closes since early August, strengthening the bullish momentum in crude markets.
US crude oil inventory data surprises the market
The Energy Information Administration (EIA) - the statistical arm of the U.S. Department of Energy - reported a 607,000-barrel draw in U.S. crude stocks, defying expectations for a 235,000-barrel build.
This broad-based decline across crude, gasoline, and distillates surprised traders and lifted sentiment. Although smaller than the American Petroleum Institute’s 3.8 million-barrel estimate, it was still enough to drive prices higher.
Russia’s oil export ban and geopolitical risks
Russian Deputy Prime Minister Alexander Novak announced an extension of the gasoline export ban and a partial diesel export ban until year-end.
- The move came after Ukrainian drone strikes damaged refineries and pumping stations, cutting Russian refinery runs.
- Russia’s Novorossiisk port declared a state of emergency, highlighting the fragility of export infrastructure under conflict.
With Moscow already constrained by sanctions, every fresh supply disruption amplifies global concerns.
Turkey, Trump, and energy politics
Adding another layer of geopolitical complexity, former U.S. President Donald Trump urged Turkey to halt Russian oil imports in exchange for reconsidering Ankara’s participation in the F-35 fighter jet programme.
While no deal was reached, the message underscores how energy flows remain deeply entangled with foreign policy and defence negotiations. For traders, this introduces additional volatility risk.
Shale’s new era of higher costs
U.S. shale once served as the market’s “shock absorber.” Now, rising costs are eroding that role:
- Enverus Intelligence Research projects breakeven costs rising from ~$70/bbl today to as high as $95 by the mid-2030s.
- Companies like Diamondback Energy are cutting budgets, signalling output growth may have peaked.
- The Dallas Fed energy survey highlighted delays in investments and growing concerns about a “new era of higher costs.”
This structural shift means shale can no longer quickly flood markets to suppress rallies — making supply shocks more influential.
Iraq and Kurdistan exports return
The Kurdistan Regional Government announced exports will resume within 48 hours following an agreement with Iraq’s federal government and oil companies.
If supplies return smoothly, this could soften bullish momentum and bring the narrative of oversupply back into play, especially if OPEC+ maintains strong production levels.
Macro backdrop: Growth vs. Rates
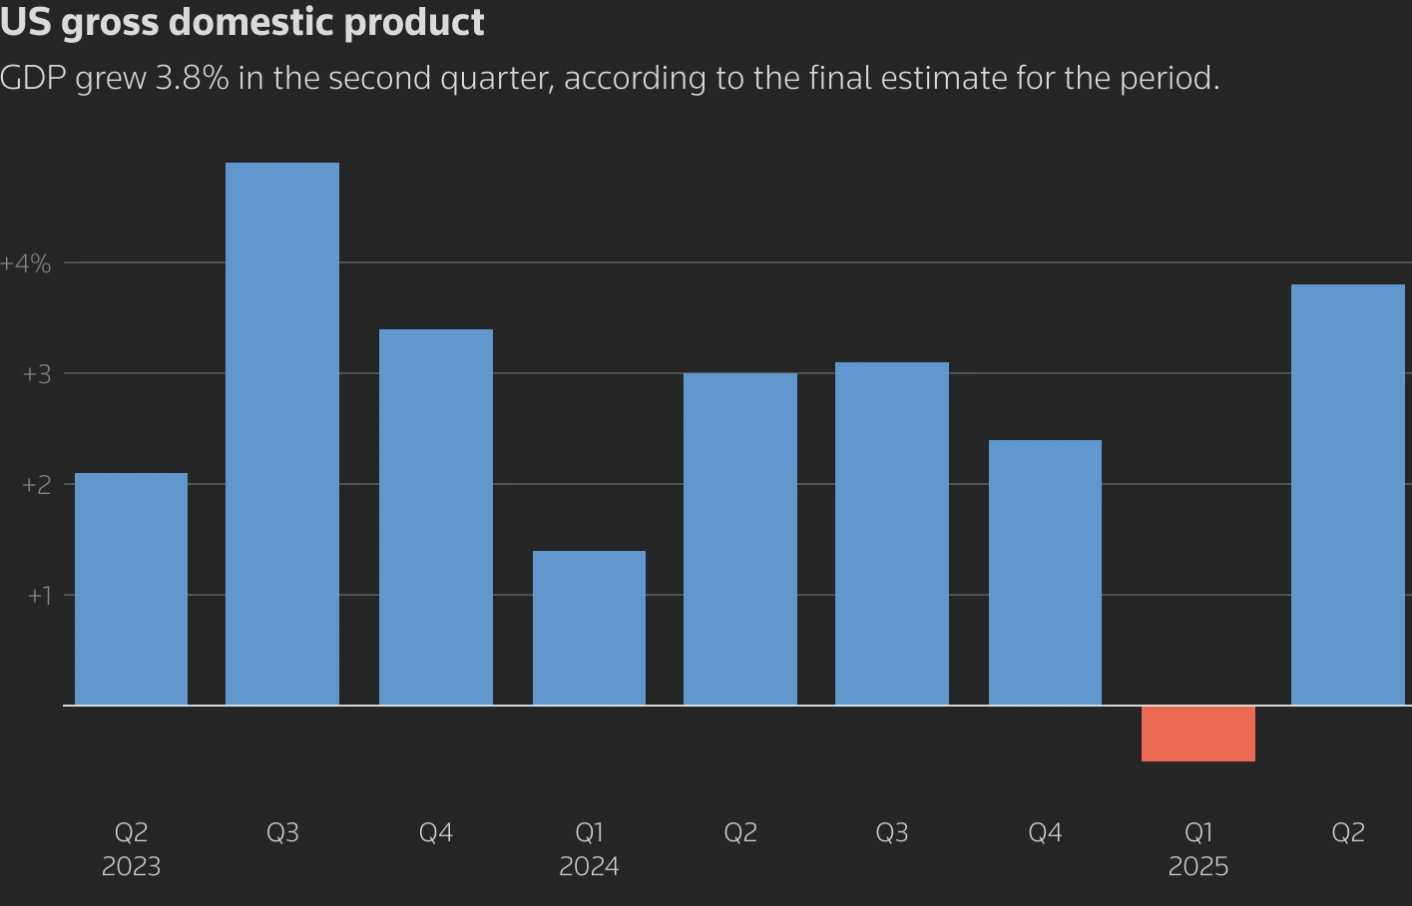
The U.S. economy grew at an annualised 3.8% pace, exceeding expectations.
- Stronger growth → supports oil demand.
- But higher growth → reduces pressure on the Fed to cut rates, tightening financial conditions.
This mixed backdrop suggests resilient consumption, but with a risk that higher borrowing costs could curb global demand.
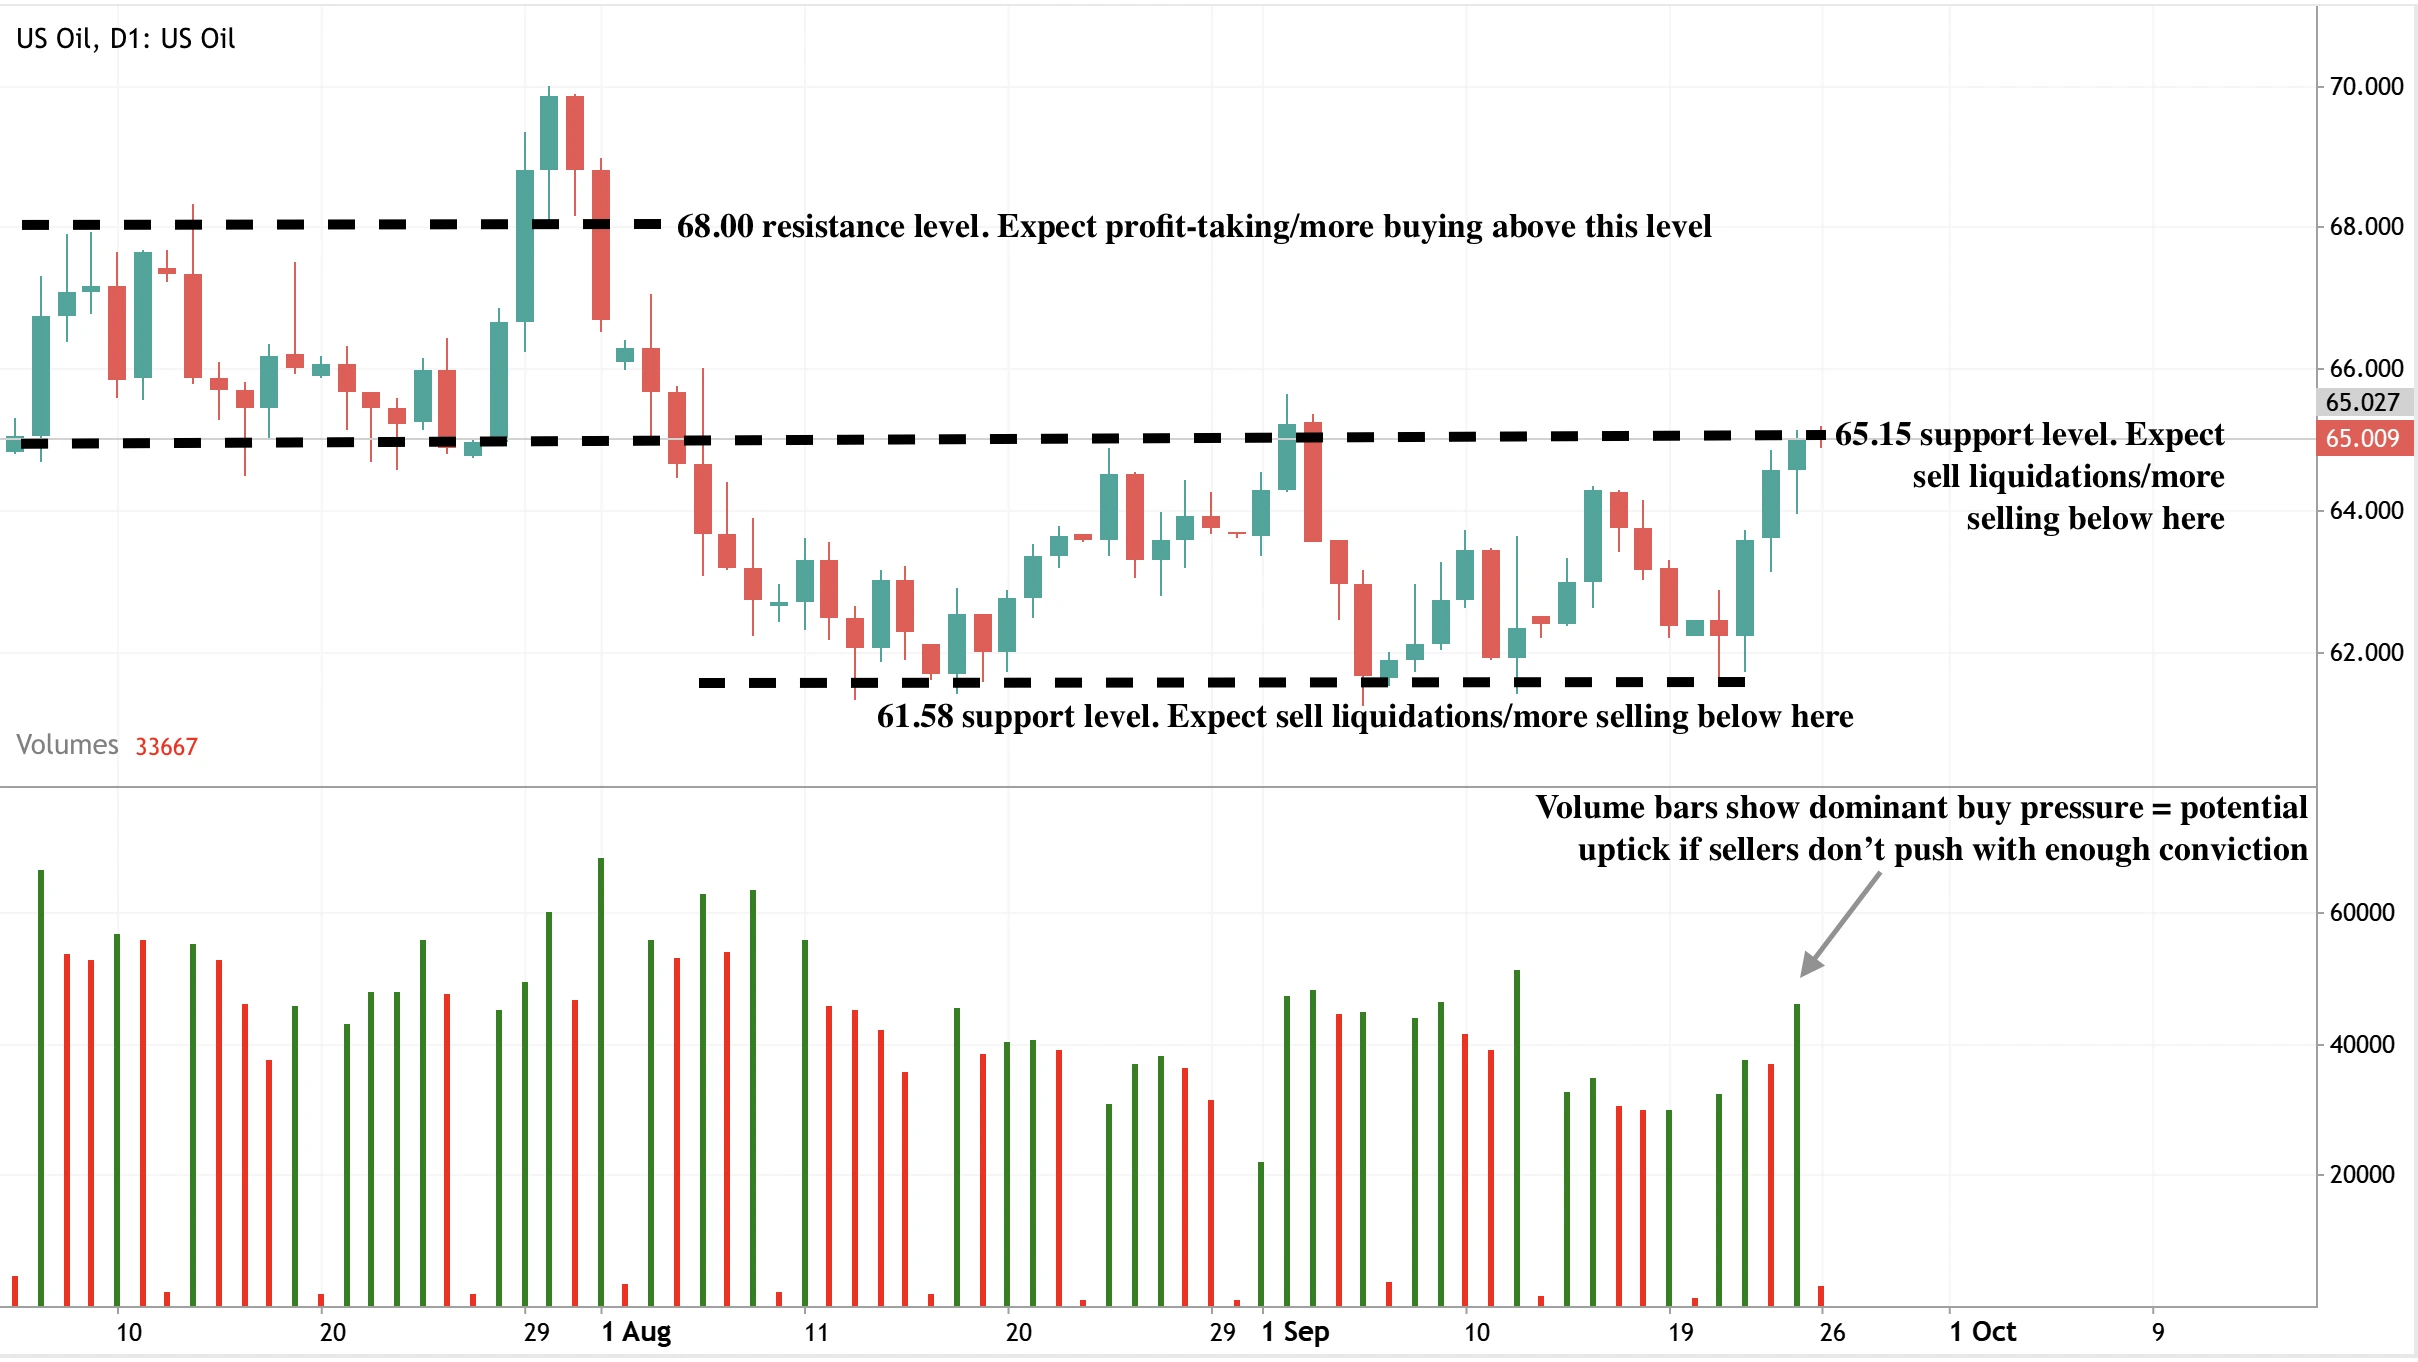
WTI crude oil price technical analysis
Support and resistance levels on Deriv’s MT5 platform:
- Resistance levels: $65.15 and $68.00
- Support levels: $61.58
If WTI breaks decisively above $68.00, $70 becomes the next key target. Conversely, a retest of $61.58 could be on the cards if bearish momentum builds.
How to trade oil in the current market
- Set up oil trading on Deriv MT5.
- Watch technical indicators – RSI, moving averages, and volume- to confirm momentum.
- Support near the $61.58 price level, with resistance at $68.00.
- Apply risk management – set stop-loss orders just below support or above resistance.
- Factor in fundamentals – monitor EIA data, OPEC+ updates, and geopolitical headlines.
Oil price investment implications
- Short-term traders: Opportunities around technical levels ($61.58–$68.00).
- Medium-term outlook: Higher floors due to shale’s costs, but capped upside from Iraqi/OPEC+ supply.
- Equities: Refiners and low-cost producers may benefit most, while high-cost projects face margin pressure.
Follow the oil price trajectory with a Deriv MT5 account.

Ethereum price prediction 2025: Analysts project $12,000 target despite headwinds
Ethereum price prediction 2025 has become a key market focus as the token holds near the $4,000 support level.
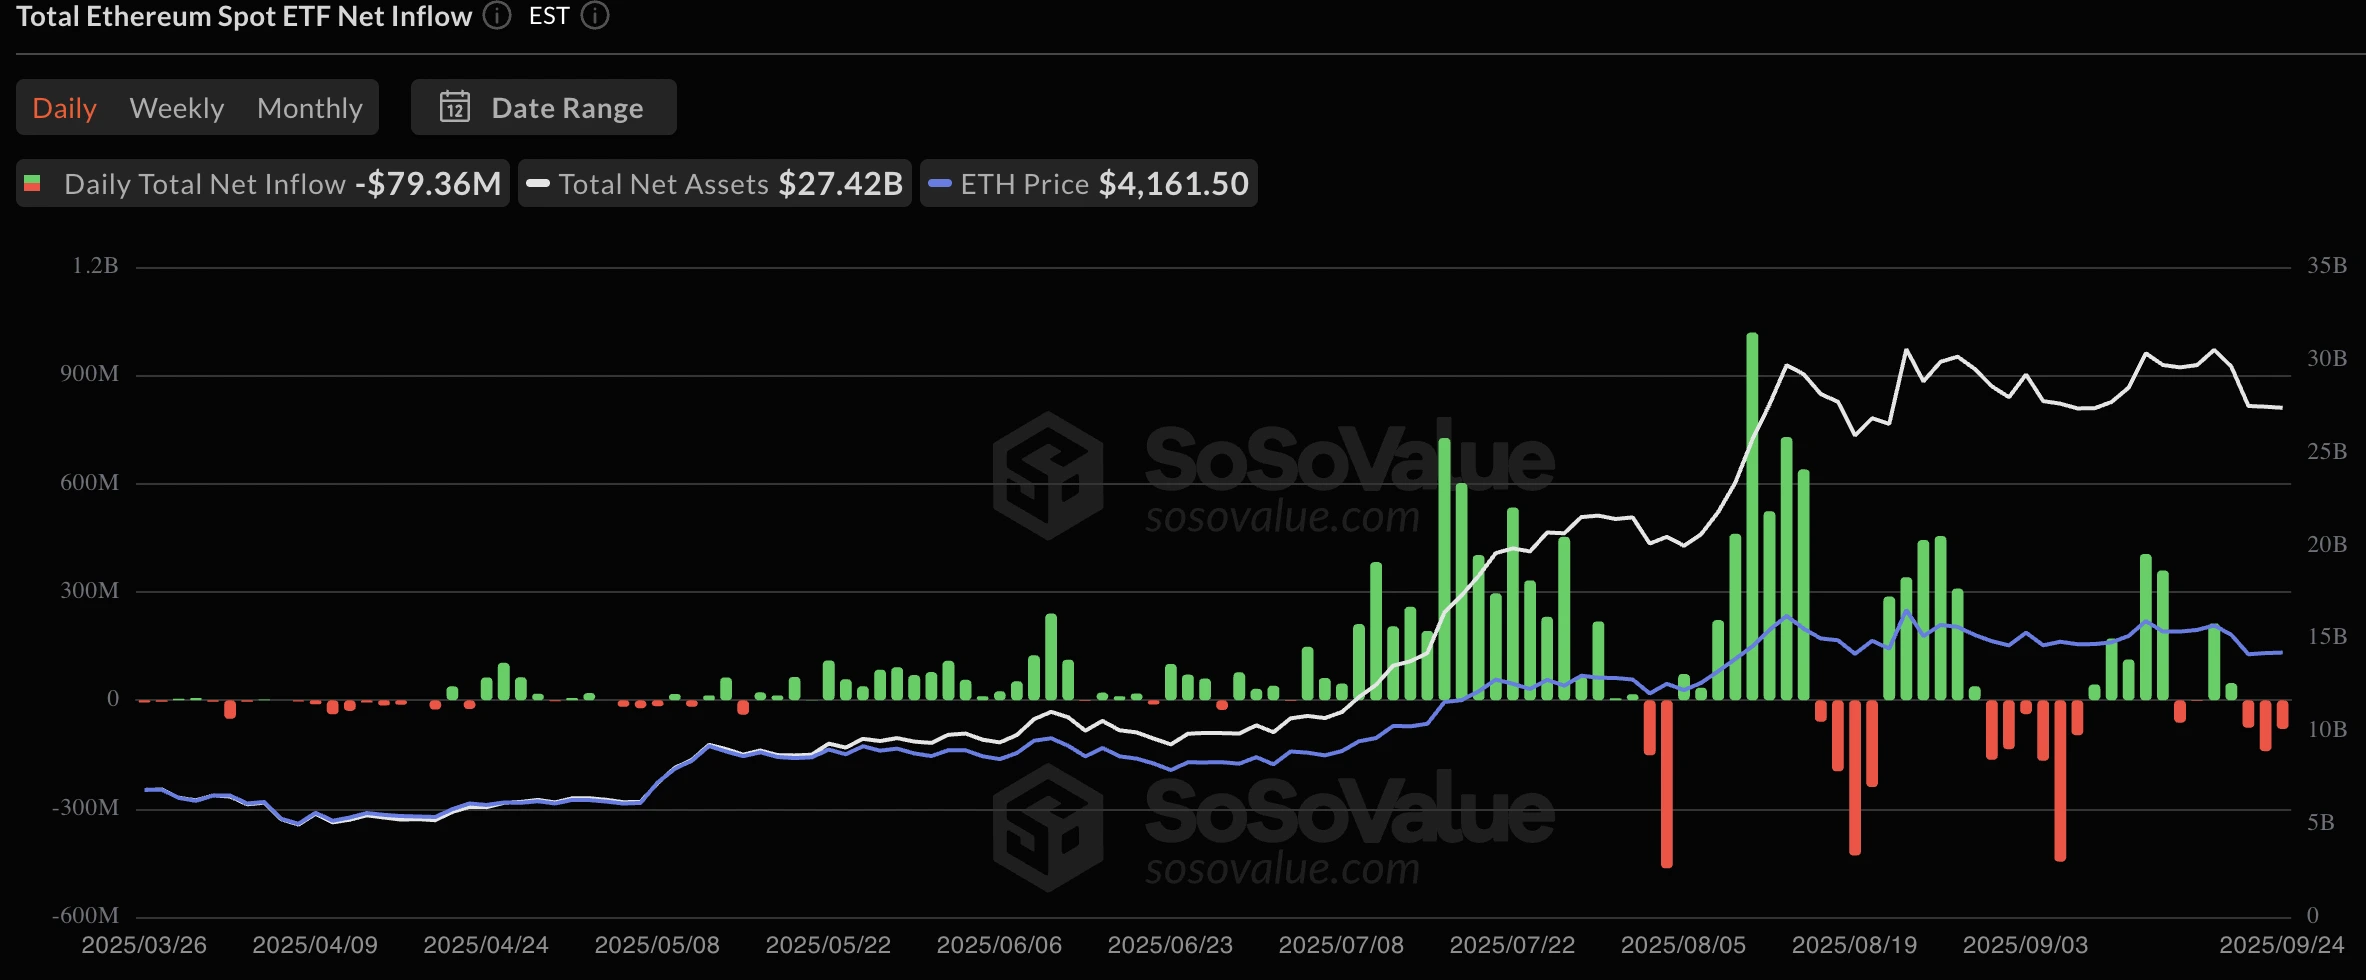
Ethereum price prediction 2025 has become a key market focus as the token holds near the $4,000 support level. ETH faces immediate headwinds from a negative shift in the Ethereum funding rate and $79.36 million in ETF outflows. Despite these pressures, analysts led by Tom Lee of Fundstrat and BitMine argue that Ethereum remains on track for a rally toward $12,000–$15,000 in 2025 as institutional adoption and BitMine Ethereum holdings strengthen its long-term case.
Key takeaways
- Ethereum price steadies near the $4,000 support level
- Funding rates flipped negative twice this week, pointing to rising short positions.
- Ethereum ETF outflows reached $79.36 million in the past 24 hours.
- BitMine Ethereum holdings expanded with 264,000 ETH added last week, bringing total to 2.15 million.
- Tom Lee projects ETH at $10,000–$12,000 by year-end 2025, with potential upside to $15,000.
Ethereum funding rates go negative
Ethereum funding rates dropped to -0.0013 this week, marking the second negative reading in five days.

An Ethereum funding rate negative reading occurs when perpetual futures trade below spot, with short traders paying long traders to hold positions. This underscores a bearish tilt in the derivatives market, where traders are positioning for further declines.
Ethereum ETF flows raise caution
The short-term pressure is reinforced by flows in institutional investment vehicles. According to SoSoValue, Ethereum ETF outflows totalled $79.36 million in just 24 hours. This highlights reduced institutional risk appetite and suggests that funds are trimming exposure after months of inflows. While ETF flows can fluctuate, they remain an important gauge of institutional sentiment toward ETH.
BitMine Ethereum holdings and institutional adoption
Despite near-term headwinds, BitMine Ethereum holdings are reshaping Ethereum’s institutional narrative. BitMine Immersion Technologies has rapidly accumulated 2.4 million ETH, making it the world’s largest Ethereum treasury. The company’s market cap has surged from $37.6 million in June to $9.45 billion by September 2025.
Tom Lee, BitMine’s co-founder and Fundstrat Chairman, describes Ethereum as a “neutral chain” that appeals to Wall Street and Washington. He argues that Ethereum’s decentralisation makes it the natural infrastructure for tokenisation, financial systems, and digital identity.
Beyond corporates, the trend is spreading. Singapore’s DBS Bank recently launched tokenised structured notes on Ethereum, while policymakers in the US under the Trump administration have begun referencing Ethereum as part of broader digital economy strategies.
The case for a super cycle
Lee forecasts Ethereum will climb to $10,000–$12,000 by the end of 2025, with potential upside to $15,000 if adoption accelerates. He places this within a broader 10–15 year Ethereum super cycle driven by:
- Institutional adoption through ETFs and treasuries.
- Governmental alignment with pro-crypto policies.
- AI and automation use cases, with Ethereum as the infrastructure layer.
- Correlation with Bitcoin’s projected $200,000–$250,000 surge.
This long-term view contrasts with short-term pessimism reflected in ETF outflows and negative funding rates, suggesting that volatility may simply be part of Ethereum’s transition into a financial infrastructure asset.
ETH price forecast and technical analysis
At the time of writing, Ethereum is hovering around the $4,000 support level. The ETH price forecast points to two scenarios:
- Bearish: If sellers maintain dominance, ETH could retest support at $4,000, with further drawdown toward $3,730.
- Bullish: A significant bounce could push ETH higher, with resistance at $4,800.
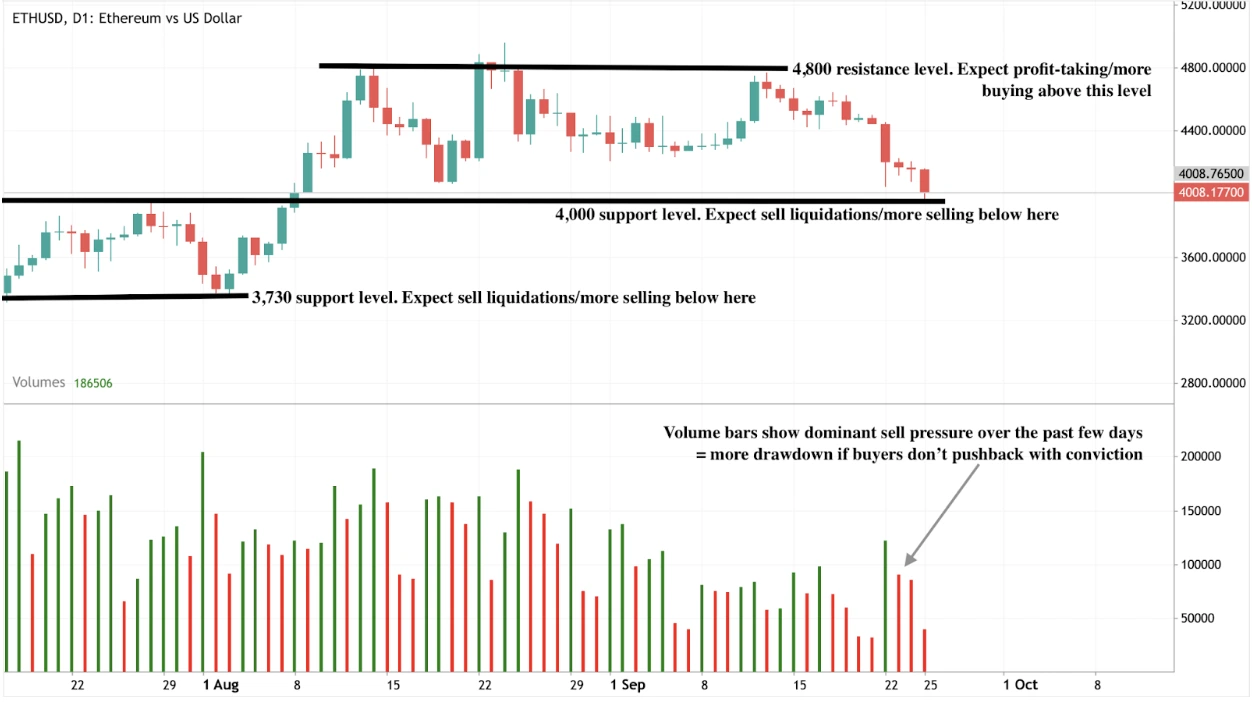
Volume indicators show sellers remain dominant for now, but buyers defending $4,000 could set the stage for a rebound.
Ethereum future price predictions comparison

ETH price forecast: Investment outlook
Ethereum faces a split between bearish short-term signals and bullish long-term drivers. Negative funding and ETF outflows create caution for traders, while institutional treasuries, adoption trends, and Ethereum’s neutrality narrative underpin its longer-term potential.
For traders, the $4,000 support is the key level to watch. For long-term investors, Ethereum’s role in treasuries, tokenisation, and financial infrastructure suggests that it is building toward a super cycle with targets above $10,000 in 2025.
Trade the next movements of ETH with a Deriv MT5 account today.

Will Bitcoin price overcome liquidation fears with 401 (k) adoption on the horizon?
Yes, according to analysts, while Bitcoin price in 2025 faces immediate risks from $12.5 billion in potential liquidations, the push to open $9.3 trillion in 401 (k) retirement assets to crypto provides a powerful long-term adoption driver.
Yes, according to analysts, while Bitcoin price in 2025 faces immediate risks from $12.5 billion in potential liquidations, the push to open $9.3 trillion in 401 (k) retirement assets to crypto provides a powerful long-term adoption driver. The short-term outlook is volatile and could see sharp corrections, but the structural forces of retirement flows, institutional accumulation, and supportive macro trends suggest Bitcoin is positioned to overcome liquidation fears and potentially move toward higher price targets, including $200,000.
Key takeaways
- $12.5 billion in leveraged Bitcoin positions could trigger cascading liquidations if the price falls just 5%.
- A US Executive Order and congressional pressure could soon allow $9.3 trillion in 401 (k) assets to access crypto.
- Even a 1% allocation from 401 (k) accounts would represent a potential $122 billion in inflows, a scale that could push Bitcoin toward $200,000.
- Institutions like MicroStrategy, Metaplanet, and Strive are accumulating Bitcoin during periods of market weakness.
- The Federal Reserve’s September 2025 rate cut, despite 2.9% inflation, supports Bitcoin and gold as hedges against monetary instability.
$12.5B in Bitcoin liquidation risk hangs over the market
Data from CoinGlass highlights that $12.5 billion worth of leveraged positions are at risk across major exchanges.

Roughly $4.8 billion is concentrated on Binance, $2.7 billion on Bybit, and several billion more on OKX. The concern is that even a modest 5% pullback in Bitcoin’s price - currently trading around $112,000 - could set off a wave of forced liquidations.
The mechanics are straightforward: when leveraged traders cannot meet margin requirements, exchanges automatically sell their positions. This creates downward pressure on prices, which can trigger further liquidations in a cascading loop. The crypto market has seen this before.
In May 2021, Bitcoin plunged 12% in hours, wiping out nearly $10 billion in leveraged positions. Research published in the Journal of Risk and Financial Management found that leverage can amplify swings by 30–40%, turning normal volatility into market-shaking moves. In other words, the market structure remains fragile in the near term.
401(k) crypto adoption could dwarf short-term risks
While liquidations dominate the short-term narrative, the long-term story is far more consequential. In August 2025, President Trump signed an Executive Order calling for the “democratisation of access to alternative assets,” effectively opening the door for crypto exposure in 401(k) retirement plans. Earlier this month, US lawmakers sent a letter urging the SEC to implement the directive swiftly.
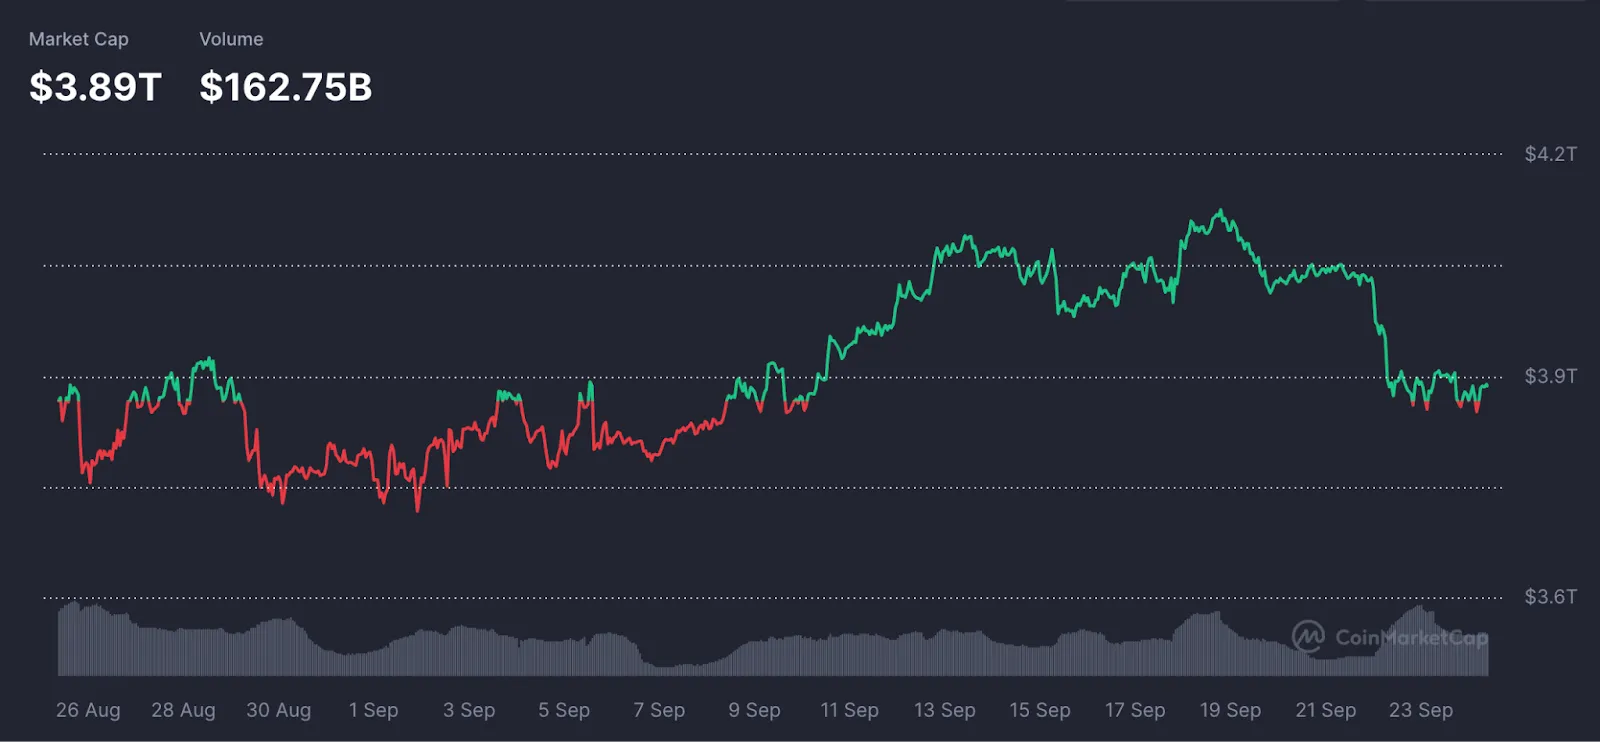
The numbers are staggering. U.S. 401(k) accounts manage around $9.3 trillion, compared with a global crypto market cap of about $3.89 trillion. Even a small allocation of 1% from retirement assets into crypto would represent $122 billion in inflows - roughly half of Bitcoin’s current yearly trading volume. Analysts argue such flows could push Bitcoin well beyond $200,000.
Retirement access marks a structural shift. Up until now, 401(k) accounts could only buy crypto ETFs or equity proxies such as Coinbase stock. Direct access to Bitcoin would democratise adoption at scale, embedding the asset class into mainstream savings for the first time.
Institutions continue to buy the dip
Institutional actors are already positioning for long-term adoption, regardless of short-term risks. MicroStrategy, under Michael Saylor, recently purchased $99.7 million worth of Bitcoin, adding to its already massive holdings. Japanese firm Metaplanet made headlines with a $632 million buy, taking its total stash to 25,555 BTC worth nearly $3 billion. Strive, following its merger with Semler Scientific, allocated $675 million into Bitcoin, building a treasury of over 10,900 BTC.
These purchases are not tactical trades but strategic balance sheet moves. They show confidence that Bitcoin is becoming a reserve asset for corporations. Institutions see market weakness and liquidation-driven dips not as reasons to exit, but as opportunities to accumulate.
Macro conditions add fuel to adoption
The Federal Reserve cut interest rates in September 2025 despite inflation still running at 2.9% - the first such move in more than 30 years.

This signals that policymakers are prioritising growth and labour markets over inflation risks. For investors, this raises doubts about fiat stability and the effectiveness of traditional policy tools.
Bitcoin and gold have already responded, rising on the prospect of loose policy in a high-inflation environment. For many institutional and retail investors alike, Bitcoin is not just a speculative call, but a hedge against monetary instability. When combined with 401(k) adoption, this macro backdrop creates fertile ground for long-term Bitcoin demand.
Bitcoin market impact and price scenarios
- Short-term risks: Bitcoin could face sudden drawdowns if liquidation thresholds are breached. A 5–10% drop could trigger multi-billion-dollar forced selling, echoing past crashes. Near-term volatility remains high.
- Medium-term drivers: Institutional accumulation and rising retirement account balances suggest growing demand. As of 30 June, 401(k) millionaires reached 595,000, up 16% from Q1, according to Fidelity.
- Long-term outlook: If retirement flows materialise, analysts believe Bitcoin could move toward $200,000. Even if only a fraction of the $9.3 trillion 401(k) pool enters the market, the effect would outweigh liquidation shocks.
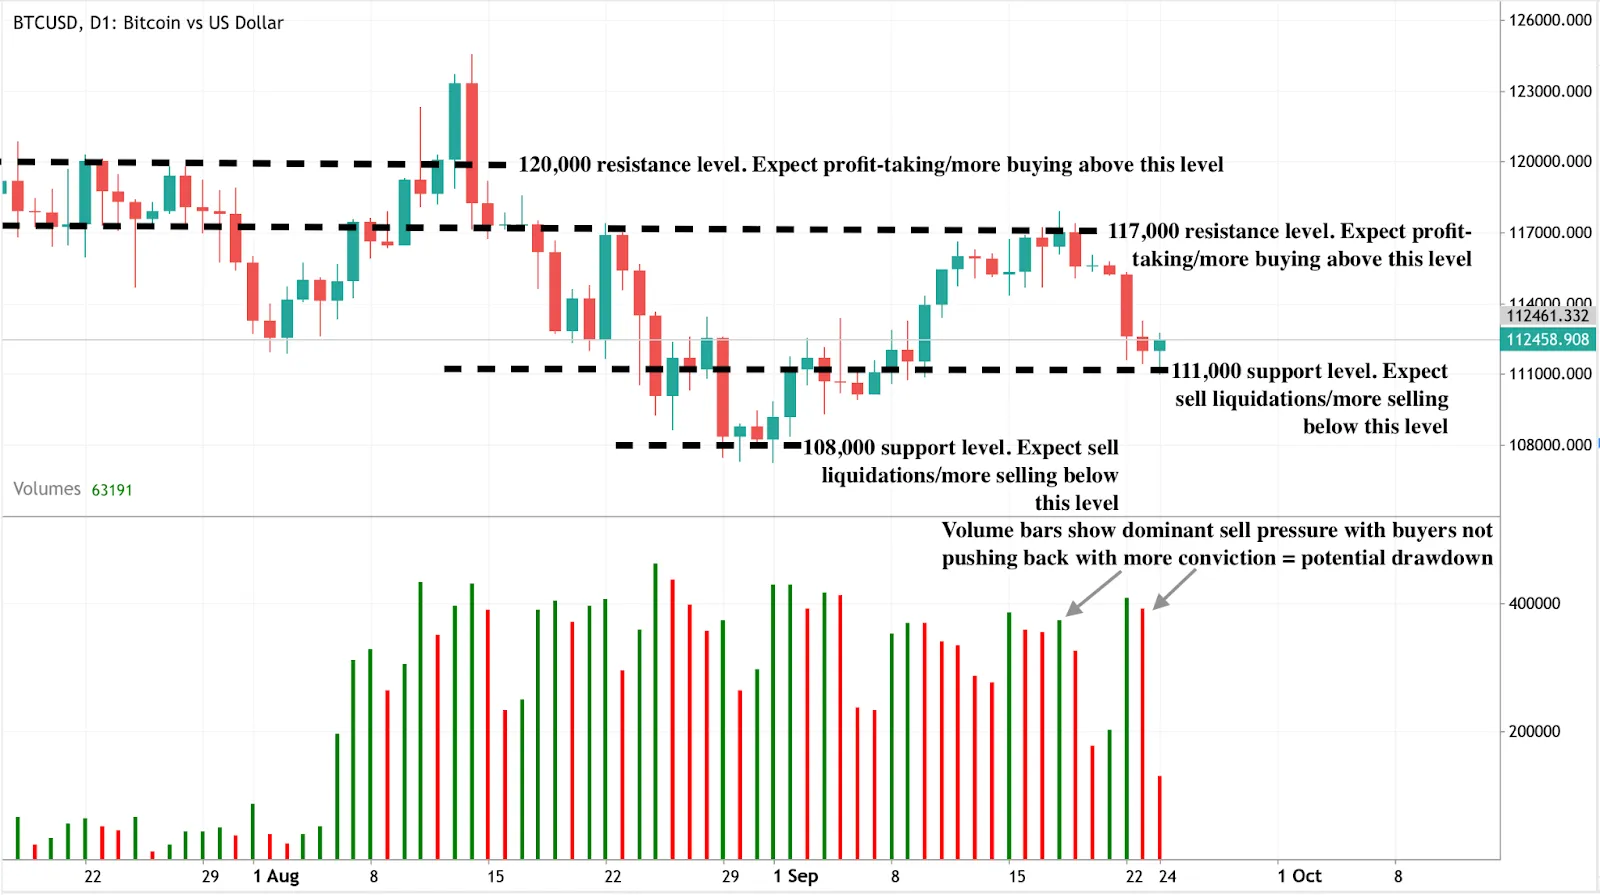
Bitcoin technical insight
At the time of writing, Bitcoin prices are holding at around the $112458 mark, close to the $110,000 support level. This hints at a potential bounce from the support level. However, volume bars show that buyers are pushing with enough conviction, which could hinder a potential bounce. If sellers continue to push, they test the $110,000 support level - with a further drawdown finding support at the $108,000 support level. Conversely, if we see a bounce, prices could reach resistance at the $117,000 and $120,000 resistance levels.
Bitcoin Investment Implications
The current setup points to heightened volatility risk in the short term for traders. Leveraged liquidation clusters mean that even a modest 5% pullback could spark outsized moves, so risk management is critical. Stop-losses and position sizing will matter more than usual until the leverage overhang clears.
The institutional accumulation trend provides a counterweight for medium-term investors. The fact that treasuries and corporations are buying aggressively during periods of weakness suggests that dips may present entry opportunities for those with longer horizons.
For long-term investors, the 401(k) adoption story is the game-changer. If regulatory changes open retirement flows into crypto, it could mark a structural shift that dwarfs short-term risks. This makes Bitcoin increasingly suitable as part of a diversified portfolio allocation, especially for those treating it as a hedge against monetary instability rather than a speculative trade.
Overall, the balance of risks suggests caution for traders in the short run, but optimism for investors who can withstand volatility and focus on the structural forces of adoption.
%20(1).webp)
Will the 100B OpenAI deal ignite the next Nvidia stock supercycle?
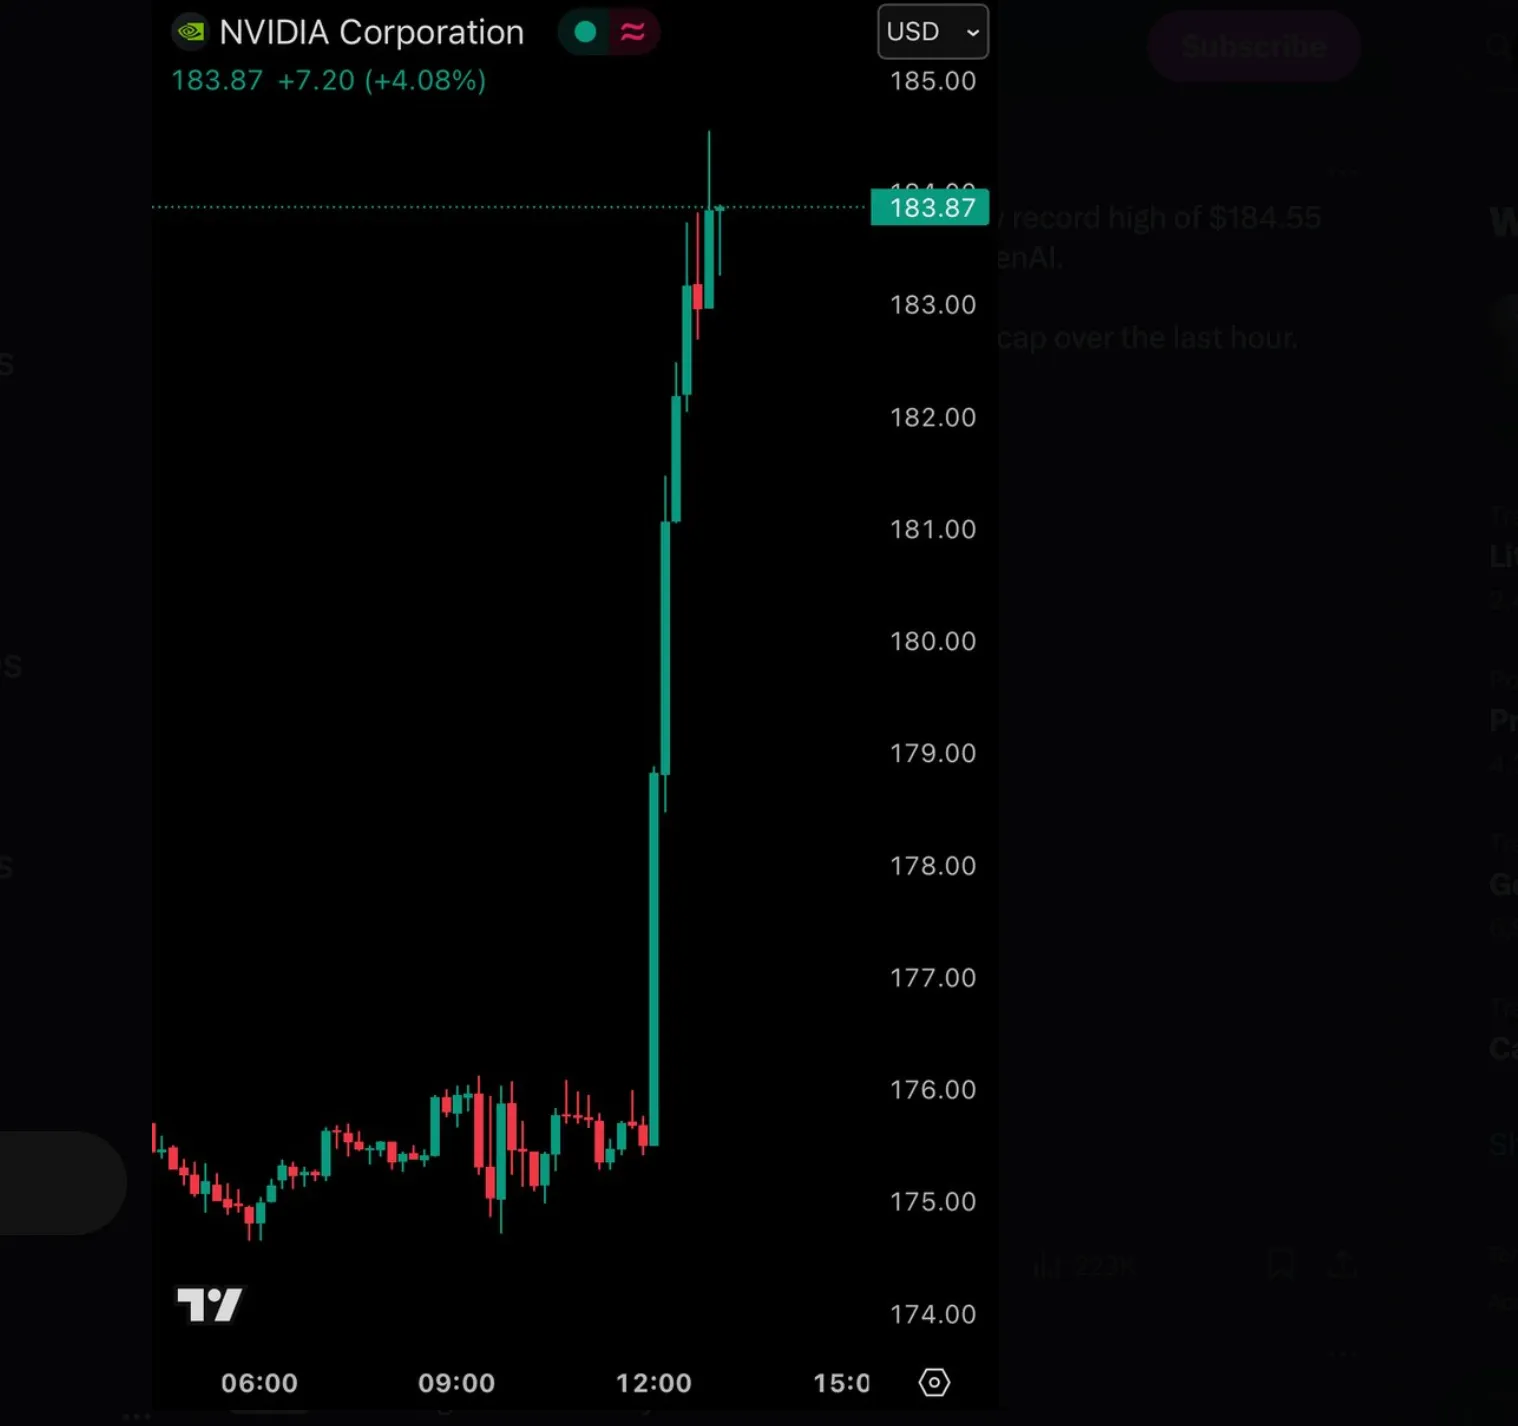
Nvidia’s $100 billion partnership with OpenAI lifted its stock to a record $183.68 this week.
Nvidia’s $100 billion partnership with OpenAI lifted its stock to a record $183.68 this week. Many say the deal positions Nvidia at the centre of the artificial intelligence revolution, but it also raises questions of sustainability. On one hand, the agreement secures Nvidia’s role as the supplier of compute power that OpenAI needs to pursue superintelligence. On the other hand, stretched valuations, regulatory risks, and long delivery timelines may limit the upside.
Key takeaways
- NVIDIA's stock closed at a record $183.68 after announcing a $100B partnership with OpenAI.
- The deal is structured as two transactions: OpenAI will pay Nvidia in cash for chips, while Nvidia will invest back into OpenAI for non-controlling shares.
- The first $10 billion tranche will be triggered once OpenAI signs a definitive chip purchase agreement.
- OpenAI plans to deploy at least 10 gigawatts of Nvidia systems by 2026, starting with 1GW on the Vera Rubin platform.
- Nvidia has already been part of a $6.6B investment in OpenAI (Oct 2024) and pledged $5B to Intel days before this announcement.
- Microsoft retains rights to 49% of OpenAI’s profits from its earlier $13B investment.
- The Magnificent 7 now make up 35% of the S&P 500, while the top 10 stocks account for 41% of the total market cap.
- The DOJ and FTC are preparing potential antitrust probes into Microsoft, OpenAI, and Nvidia.
Nvidia OpenAI partnership
The partnership is among the largest in AI’s history. According to people close to the matter, Nvidia will begin delivering data centre chips to OpenAI in late 2026 and also take a non-controlling equity stake in the company.
The two companies have signed a letter of intent for at least 10GW of Nvidia hardware to support OpenAI’s infrastructure. The initial $10B phase is dependent on OpenAI finalising chip purchases. The project’s scale is enormous - it rivals some national power grids - and underscores how compute capacity has become the most valuable currency in AI.
OpenAI is still restructuring into a for-profit company, a process complicated by Microsoft’s existing profit-sharing arrangement and ongoing legal challenges. Nvidia’s entry adds further weight to the governance and strategic direction of one of the world’s most valuable AI companies.
Why the rally could continue
After Nvidia’s $100 billion partnership with OpenAI lifted its stock to a record high this week, the strongest case for Nvidia’s rally continuing lies in its unrivalled position in AI infrastructure.
Sam Altman has emphasised that “everything starts with compute,” and OpenAI’s ambition to move toward superintelligence will require hardware on a scale never seen before. Nvidia is currently the only company with the proven technology and production capacity to deliver this level of compute.
AI infrastructure buildout
Beyond the OpenAI deal, Nvidia has embedded itself across the wider AI ecosystem. It is a central partner in the $500 billion Stargate data centre project alongside Microsoft, Oracle, and SoftBank, and days before the OpenAI announcement, it pledged $5 billion to support Intel. These moves highlight a deliberate strategy to ensure Nvidia’s hardware is present in every significant AI buildout.
Investor momentum also strengthens the bullish case. Following the announcement, shares of AMD rose 3%, TSMC climbed 4%, and Oracle gained nearly 5%, reflecting the market’s conviction that the deal validates Nvidia’s dominance. With OpenAI valued at $500 billion, Nvidia’s commitment signals to investors that capital will continue to flow into AI despite earlier concerns that spending might slow.
Why a pullback could loom
Despite the optimism, there are compelling reasons why the rally may not be sustainable. According to analysts, the first is timing. Nvidia’s deliveries under the OpenAI deal are not scheduled until late 2026, meaning much of the financial impact lies years ahead. Markets, however, are already pricing in that future growth, leaving little margin for error.
Market concentration is another risk. The top 10 US stocks now account for 41% of the S&P 500’s market cap, a sharp increase from 20% just two years ago.

Nvidia’s rise has contributed heavily to this imbalance, making the market more vulnerable to sharp corrections if sentiment turns. Regulatory scrutiny also looms large. In June 2024, the DOJ and FTC agreed to coordinate on oversight of the biggest AI players, with Nvidia, Microsoft, and OpenAI clearly in focus. Their combined dominance across hardware, software, and cloud computing could trigger antitrust action, particularly if political winds shift.
Valuation concerns are equally pressing. Nvidia’s $100 billion commitment is larger than the GDP of many countries. With its market cap already at historic highs, the company is priced for near-perfect execution. Any delay in adoption, weaker-than-expected profitability, or competitive pressures could weigh heavily on its stock.
Finally, geopolitics remains an unpredictable factor. As US–China competition in semiconductors intensifies, new export restrictions or tariffs could disrupt Nvidia’s supply chain. Even a company with Nvidia’s scale cannot escape policy risks tied to the global chip war.
Market impact
The announcement had an immediate impact on financial markets. Nvidia’s shares jumped 4.4% on the day, Oracle gained nearly 5%, and the Nasdaq Composite added almost 1%. The S&P 500 rose 0.5% to a new record high, driven largely by Nvidia’s surge. With the Magnificent 7 now controlling more than a third of the index, Nvidia’s moves are no longer just stock-specific - they ripple through the entire market.
Nvidia technical analysis
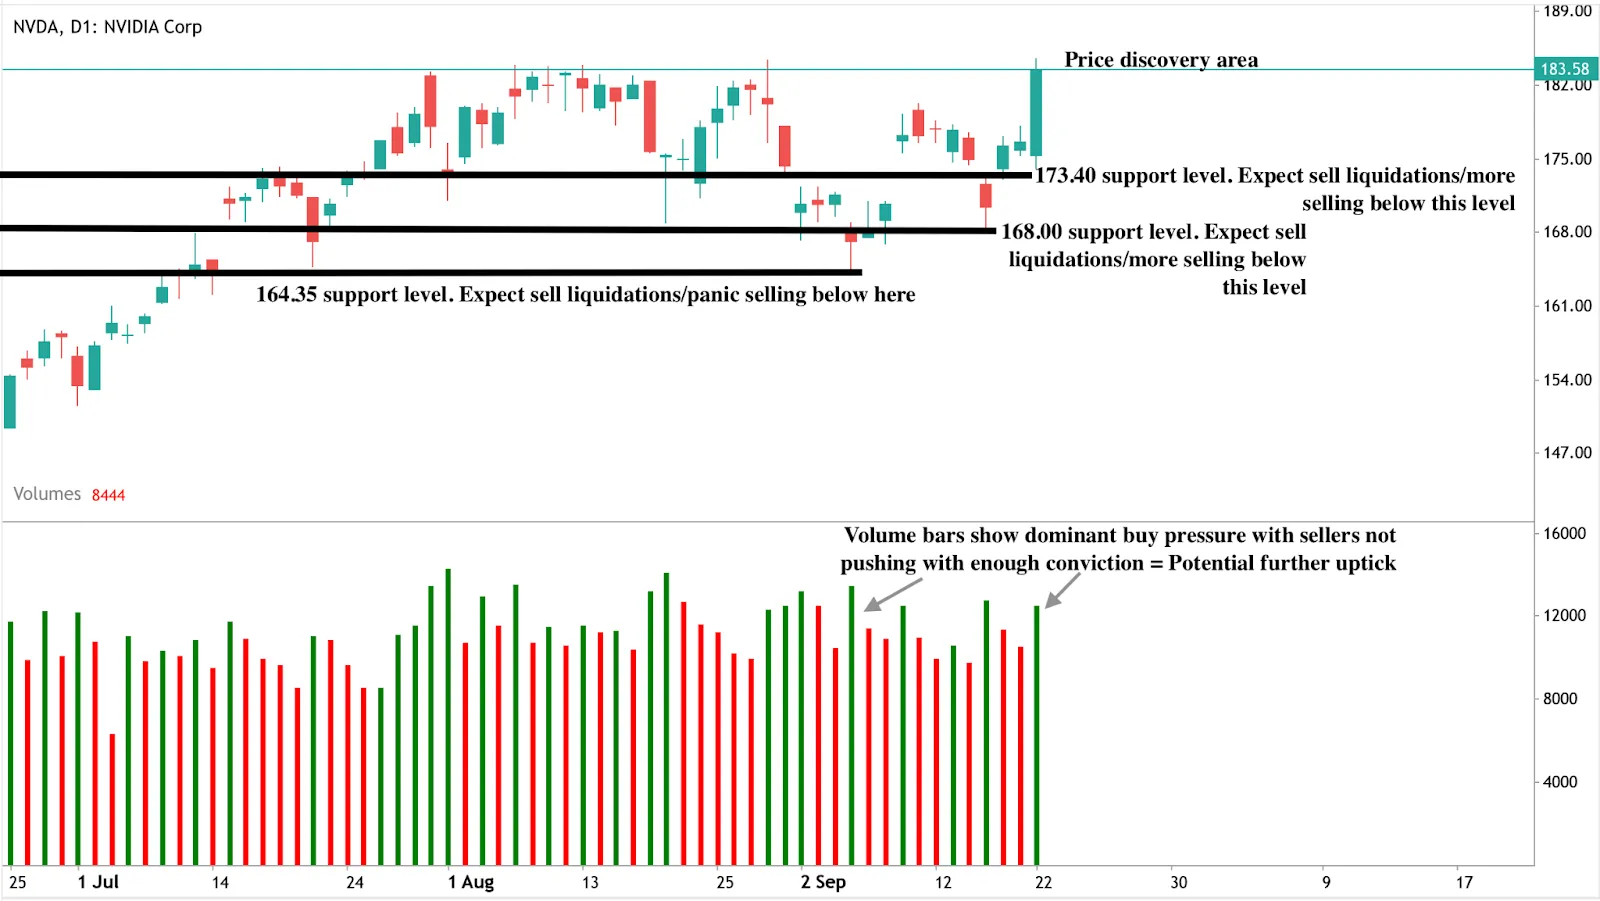
At the time of writing, Nvidia is in price discovery mode, with volume bars painting a narrative of undecided sellers - making the case for a potential further uptick. If higher highs don’t materialise thanks to stronger sell pressure, we could see prices tumble towards the $173.40 support level. A further crash could be held at the $168.00 and $164.35 support floors.
NVIDIA’s stock investment implications
For traders and portfolio managers, the Nvidia-OpenAI partnership is both an opportunity and a warning. In the short term, momentum remains firmly on Nvidia’s side, and AI-related equities are likely to continue benefiting from investor enthusiasm. Over the medium term, however, valuation pressures, regulatory uncertainty, and delivery delays could cap gains.
In the long run, if AI adoption accelerates as OpenAI and Nvidia expect, the company could indeed enter a supercycle that reshapes global markets. Yet the same dominance that makes Nvidia attractive also makes it a target for regulators and competitors alike.
Sorry, we couldn’t find any results matching .
Search tips:
- Check your spelling and try again
- Try another keyword