Results for

USD/JPY forecast: Can a strong economy survive prolonged dovishness?
Analysts say Japan’s economy can sustain its current momentum under prolonged dovish policy - but not indefinitely.
Analysts say Japan’s economy can sustain its current momentum under prolonged dovish policy - but not indefinitely. Growth remains steady, inflation has stayed above the Bank of Japan’s 2% target for more than three years, and exports are finally recovering.
Yet, the BoJ’s slow path toward tightening and a new government’s focus on fiscal stimulus are testing how much patience markets can bear. With the USD/JPY pair holding near 152, traders are weighing whether Japan’s strong fundamentals can coexist with a weak currency, or if policy divergence with the U.S. will soon push the pair toward 160.
Key takeaways
- Japan’s trade deficit narrowed slightly to ¥234.6 billion in September from ¥242.8 billion in August, suggesting export momentum but missing forecasts for a surplus.
- Exports rose 4.2% YoY, the first increase since April, while imports surged 3.3%, their first gain in three months.
- A Reuters poll found 96% of economists expect BoJ rates to reach 0.75% by March 2026, with 60% predicting a 25 bps hike this quarter.
- Sanae Takaichi’s election as Japan’s first female Prime Minister spurred equity gains and Yen weakness as markets priced in more fiscal stimulus and delayed BoJ tightening.
- The USD/JPY pair hovers near 152, supported by Fed rate-cut expectations and broad uncertainty over Japan’s policy direction.
Japan fiscal stimulus optimism vs. fiscal constraints
The election of Sanae Takaichi marks a historic milestone - Japan’s first female Prime Minister - and a clear policy inflection point. Takaichi’s platform emphasises economic revitalisation, defence investment, and stronger U.S. relations, signalling a government ready to spend.
Her coalition, formed with the Japan Innovation Party, promised fiscal stimulus to drive growth - echoing elements of Abenomics.
The Japan 225 has rallied nearly 13% since early October, briefly nearing the 50,000 level before profit-taking set in.
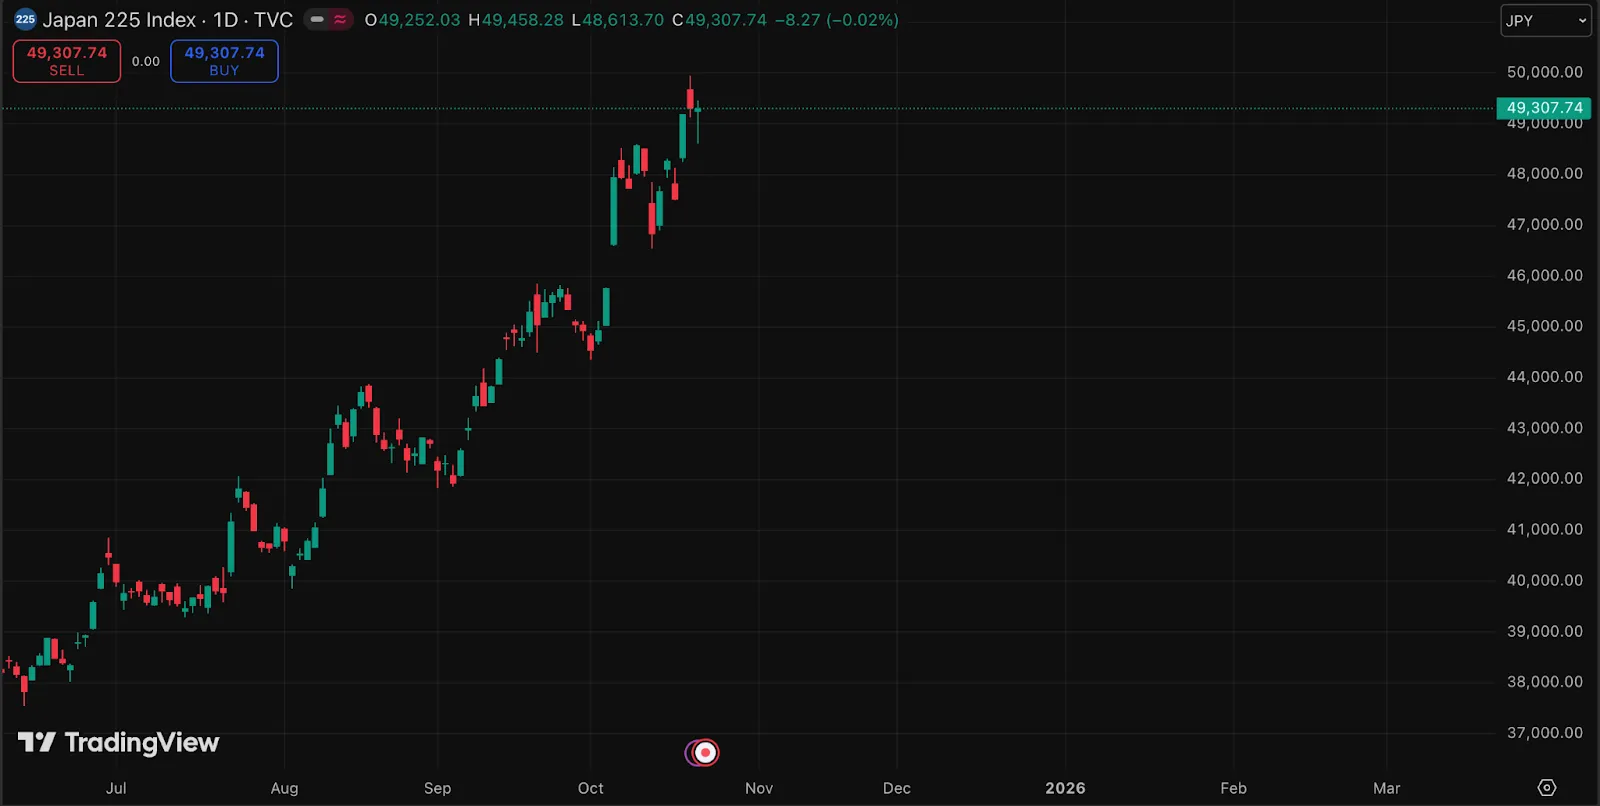
Yet, optimism about stimulus-led growth has simultaneously pressured the Yen, with traders anticipating a delay in BoJ normalisation. Still, Takaichi’s administration faces constraints.
The coalition’s 231 seats in the lower house fall short of the 233 needed for a majority, forcing her to rely on opposition support to pass legislation. This weak parliamentary position limits the scale of fiscal expansion and injects political uncertainty into Japan’s economic outlook.
Bank of Japan interest rates: Resilience defies policy inertia
Japan’s macro picture has turned unexpectedly robust.
- The trade deficit narrowed for a second month, driven by improved export performance and moderating import costs.
- Exports rose 4.2% year-on-year, marking their first increase since April, supported by demand from Asia and Europe.
- Imports jumped 3.3%, their strongest gain in eight months, reflecting solid domestic consumption and higher energy costs.
Meanwhile, Japan’s GDP has expanded for five straight quarters, confirming a durable recovery from 2023’s stagnation.

Inflation remains above 2%, supported by rising wages and service-sector demand. These conditions would trigger tightening in any other major economy.

Yet, despite these fundamentals, the BoJ remains the only major central bank still below 1% policy rates. Deputy Governor Shinichi Uchida has reaffirmed that future hikes will depend on “sustainable inflation trends,” while Board Member Hajime Takata stated that Japan has “roughly achieved” its price target - signalling cautious optimism but not urgency.
This mismatch between strong economic data and hesitant policy is keeping the Yen under pressure, as investors look elsewhere for yield.
BoJ’s policy rate: The slow road to 0.75%
The market expects change - just not quickly. According to a Reuters survey, 64 of 67 economists (96%) forecast the BoJ’s policy rate will reach 0.75% by March 2026, with 45 of 75 respondents (60%) expecting a 25 bps rate hike this quarter.
That timeline underscores just how gradual BoJ normalisation will be. The BoJ’s strategy hinges on ensuring wage gains are durable and not merely the result of cost-push inflation. But the risk is that patience turns into policy inertia, leaving the Yen vulnerable to capital outflows if other central banks ease faster.
Across the Pacific: Fed cuts, fiscal chaos, and Dollar fatigue
The U.S. Dollar Index (DXY) trades near 98.96, sliding after a brief recovery. A looming U.S. government shutdown, now in its fourth week, has frozen key data releases and clouded Fed visibility. The Senate has failed 11 times to pass a funding bill, making it the third-longest shutdown in U.S. history.
The CME FedWatch Tool now prices in a 96.7% chance of a rate cut in October and a 96.5% chance of another in December.

Fed officials are leaning dovish:
- Christopher Waller supports another immediate cut,
- Stephen Miran argues for a more aggressive 2025 easing path, and
- Jerome Powell confirmed the Fed is “on track” for another quarter-point reduction.
With the U.S. economy slowing, the rate differential between Japan and the U.S. is narrowing, making the Dollar less dominant. A faster Fed pivot could therefore cap USD/JPY upside, even without BoJ intervention.
USD JPY technical insight: Between fiscal hope and policy drag
The appointment of Finance Minister Satsuki Katayama - known for favouring a stronger Yen and calling 120–130 per USD “fundamentally justified” - has introduced a more balanced tone. However, broader market positioning still leans toward Yen weakness.
Analysts at Commerzbank note that the new government’s business-friendly orientation is unlikely to support long-term depreciation, projecting sideways USD/JPY movement as Japan’s fiscal push and BoJ patience offset one another.
After three consecutive sessions of losses, the Yen strengthened slightly midweek following the trade data release. The USD/JPY pair pulled back modestly but remains near 151.84. A bullish move is likely to meet resistance at the 153.05 price level, with RSI showing strengthening buy momentum. Conversely, if sellers prevail, they are likely to find support at the 150.25 and 146.70 price levels.

Traders can track these levels in real time using Deriv MT5 and may consider placing stop-loss orders near the 150.25 support zone to manage risk in this volatile pair. Using Deriv’s economic calendar helps anticipate BoJ or Fed announcements that typically move the Yen.
Market impact and trading implications
For traders, USD/JPY presents a rare balance of risk and reward.
- Upside case: If BoJ delays tightening while the Fed stays cautious, USD/JPY could retest 158–160, testing market tolerance for Yen weakness.
- Downside case: If the Fed cuts twice and BoJ delivers even a modest hike, the pair could retrace to 145–147, unwinding part of 2024’s rally.
The carry trade remains a major driver of Yen sentiment. As global investors continue borrowing in Yen to fund higher-yield positions in other currencies, Japan’s low interest rates sustain the JPY’s role as a global funding currency. Any shift in BoJ policy or sudden increase in market volatility could force carry-trade unwinding, triggering rapid Yen appreciation.
The near-term tone remains range-bound, but volatility risk is high as politics and policy pull in opposite directions. Equity traders may find support in Japan’s stimulus agenda, while currency traders should prepare for potential BoJ recalibration before mid-2026.
Ultimately, Japan’s strong economy is proving resilient - but its currency may not stay patient forever. The question for 2025 is no longer whether Japan can grow, but how much dovishness its strength can bear before markets force the BoJ’s hand.

Is Apple stock’s record high the start of an AI-fuelled renaissance?
Analysts say Apple stock’s record high marks the beginning of a new AI-driven growth cycle rather than the end of one.
Analysts say Apple stock’s record high marks the beginning of a new AI-driven growth cycle rather than the end of one. With shares up 55% since April and $1.4 trillion added in market value, Apple’s resurgence is underpinned by solid fundamentals: accelerating iPhone 17 demand, a robust multi-year upgrade cycle, and steady progress in integrating artificial intelligence into its product ecosystem.
The evidence suggests this rally isn’t mere euphoria but part of a structural revaluation of Apple’s role in the emerging AI economy - though short-term technical indicators hint at a cooling period before the next leg higher.
Key takeaways
- $1.4 trillion rebound since April, fuelled by AI optimism and iPhone 17 sales.
- Loop Capital upgrade to Buy with a street-high $315 target (+25% upside).
- RSI nearing overbought territory, signalling potential near-term consolidation.
- AI-linked crypto assets such as FET, and AGIX, show correlated volume spikes with Apple’s rally.
- Institutional rotation into AI-focused equities and digital assets underscores a broader risk-on shift.
Apple’s market cap: The $1.4 trillion rally
Apple’s 2025 surge has been exceptional. Since April, the company has added $1.4 trillion in market value, reaching a fresh all-time high and reclaiming its position as one of the world’s most influential stocks. The latest leg up followed Loop Capital’s upgrade from Hold to Buy, with analysts lifting their price target from $226 to $315 - the highest on Wall Street.
Loop cited strong iPhone 17 sales, with 56.5 million shipments in Q3 2025, exceeding expectations. The firm also projects three consecutive record iPhone shipment years from 2025 to 2027, reinforcing the idea that Apple is at the front end of a long-anticipated upgrade and adoption cycle powered by AI-enhanced design and performance.
Apple’s AI technology as a catalyst
Apple’s rally aligns with a wider surge in AI-driven market confidence. Analysts view Apple’s ecosystem as a critical bridge between consumers and AI-powered devices - from its upcoming “AI Phone” to new on-device machine learning tools integrated into iOS.
The company’s market cap has now climbed to $3.89 trillion, overtaking Microsoft to become the second-most valuable firm globally, behind Nvidia. Institutional investors see Apple’s expansion into AI as a signal that the technology is moving from hype to mainstream adoption - especially in hardware and consumer interfaces.

Apple stock technical analysis
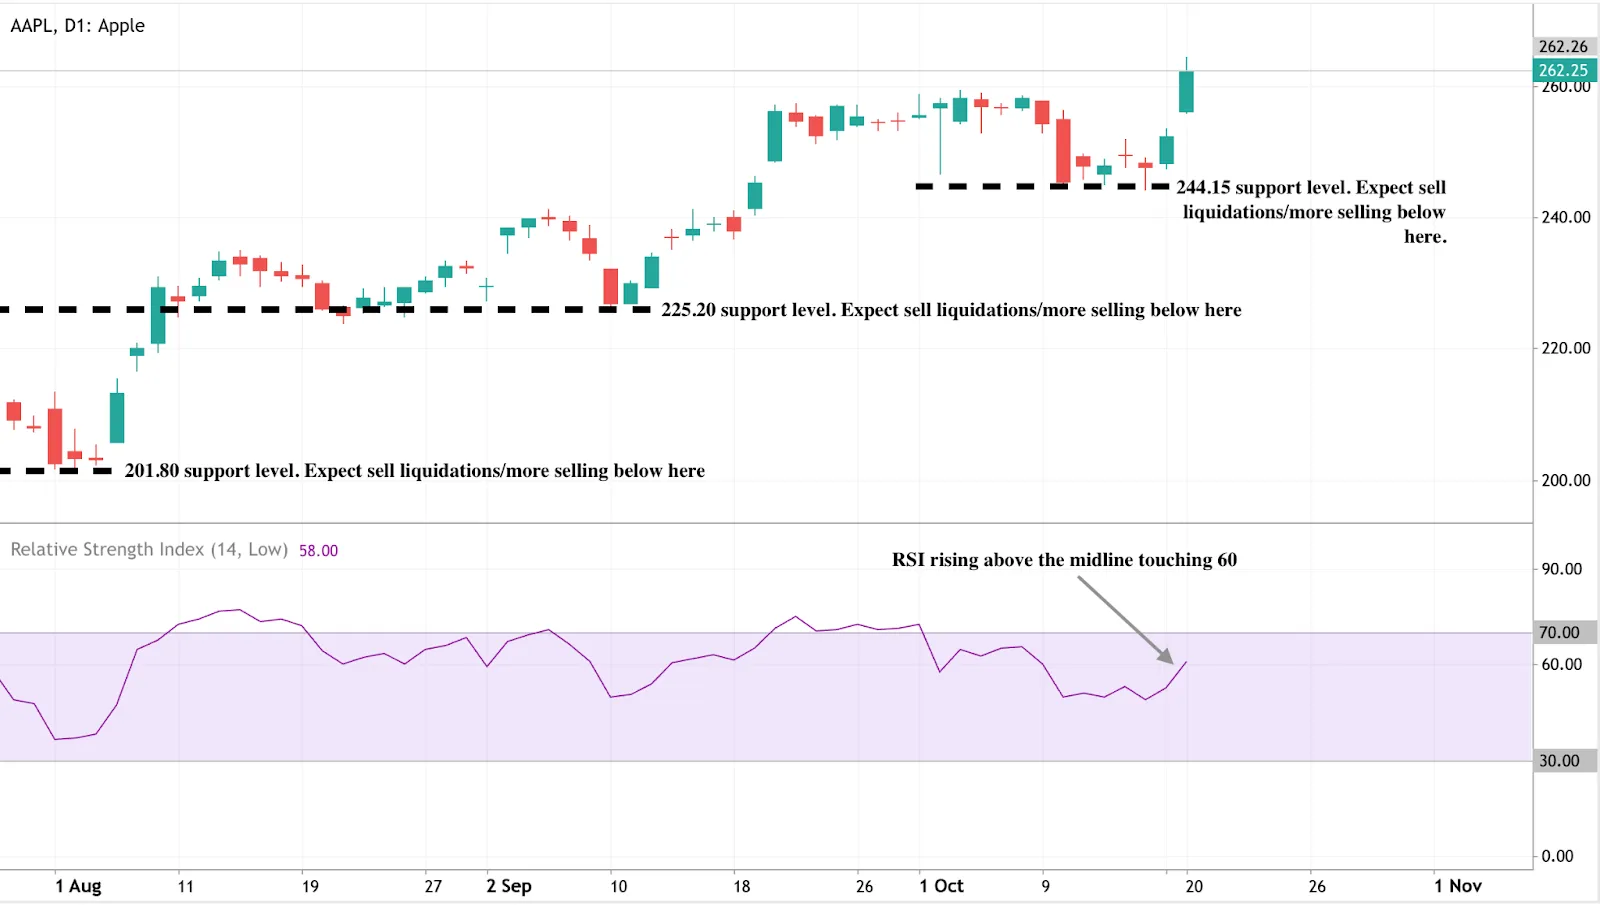
Technically, Apple’s RSI is approaching overbought levels, suggesting the possibility of short-term consolidation. Support remains firm near the April low, while resistance sits around the $315 price target.
At the time of writing, Apple stock is in price discovery mode with bullish momentum evident on the daily chart. The bullish narrative is also supported by RSI towering above the midline near 60. However, a wick is forming at the top of the latest candle, suggesting some sell pressure is emerging. If sellers assert themselves further, prices could find support levels near $244.15, with additional support around $225.20 and $201.80.
Traders using Deriv Trader can monitor such levels with built-in tools for technical analysis or cross-check potential profit and loss outcomes using Deriv’s trading calculators.
Trading Apple’s AI Momentum on Deriv Platforms
For traders looking to capitalise on Apple’s AI momentum, Deriv’s MT5 platform provides flexible access to both short-term and long-term strategies.
- Momentum trading: The MACD and RSI indicators on Deriv MT5 help confirm bullish continuation patterns. When RSI holds above 50 and price remains above the 20-day EMA, traders can consider long entries with stop-loss levels below key supports.
- Range trading: If Apple consolidates between $244 and $315, short-term traders can look for price bounces off support zones. Deriv Trader offers simplified contract types that allow traders to benefit from both rising and falling prices within defined ranges.
- Position management: Deriv’s trading calculators evaluate margin requirements, potential profits, and pip value before executing trades.
Cross-market ripple: stocks and crypto
Apple’s AI surge could influence other markets. Traders have observed rising activity in AI-related crypto pairs such as FET/USDT, which often track similar AI sentiment patterns.
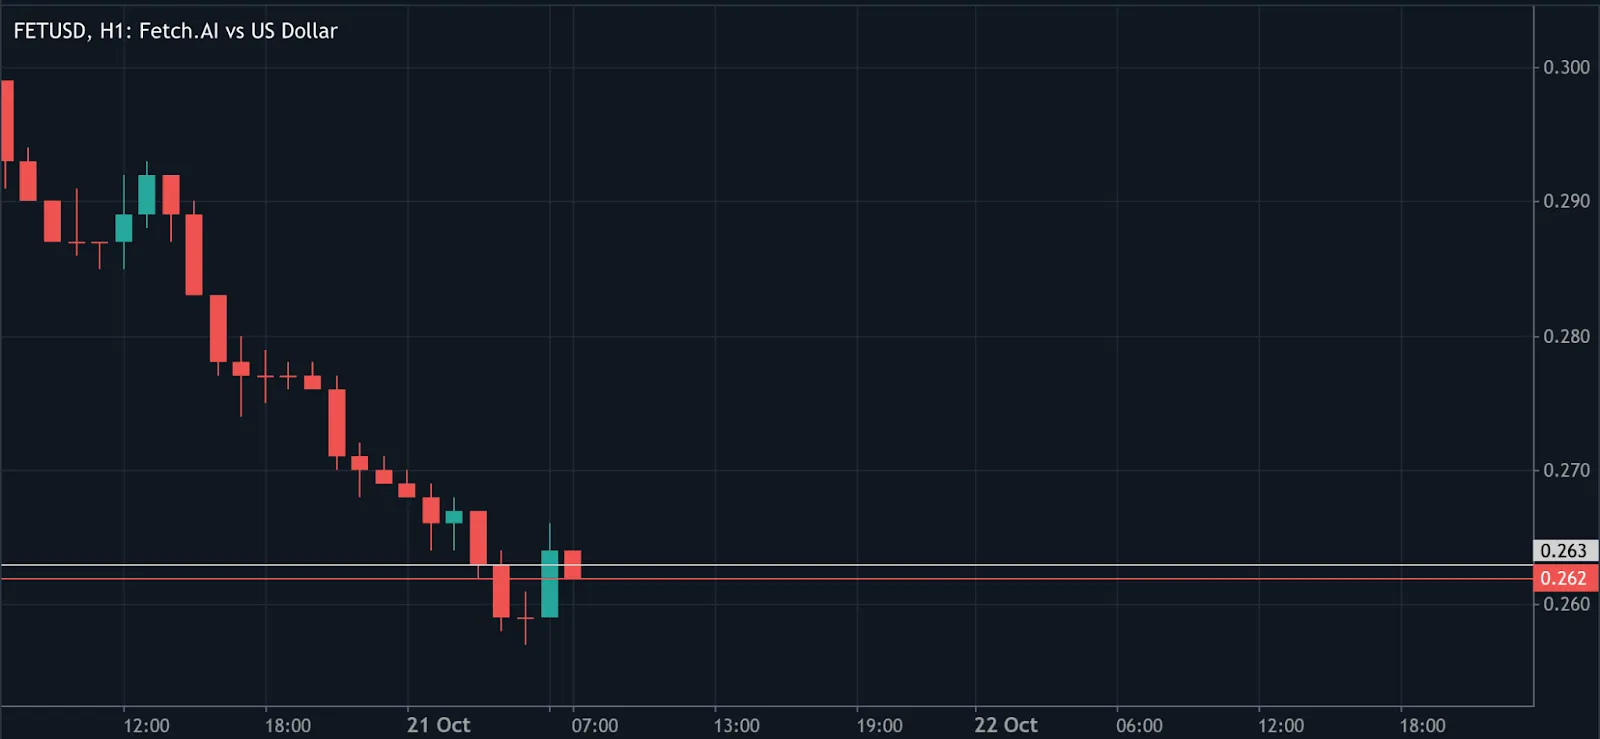
This growing correlation suggests Apple’s performance is becoming a barometer for the broader AI trade. Volume spikes in AAPL and AI tokens often occur in tandem, reflecting cross-market optimism around the AI theme. For active traders, Apple’s RSI cycles may even serve as an early signal for moves in decentralised AI assets.
Institutional confidence and capital rotation
Apple’s $1.4 trillion rebound is more than a valuation story - it’s a symbol of institutional conviction in AI’s long-term profitability. Fund managers are reallocating capital from defensive sectors into high-growth AI opportunities, both in equities and digital assets.
That momentum extends to crypto ETFs and large-cap tokens like Bitcoin and Ethereum, according to analysts, where inflows often mirror shifts in tech equity sentiment. The result is a cross-asset “risk-on” trend - with Apple’s performance acting as the trigger for renewed optimism in both traditional and decentralised markets.
Investment implications
For investors, Apple’s record high reinforces its role as a cornerstone of the AI economy. Equity traders may seek entry points near consolidation zones, while crypto participants can use Apple’s price action as a sentiment indicator for AI-linked digital assets.
Whether Apple breaks through $315 or pauses for a reset, its rally symbolises the market’s growing conviction in AI as the next structural growth engine - uniting Wall Street and Web3 under one accelerating trend: the race to own the future of intelligence.

Oil price prediction 2026: Rebound toward $65 or slide on weak demand?
Oil prices have fallen to their lowest levels in five months, and the balance of data as well as analysts suggest that a meaningful rebound toward $65.00 per barrel is unlikely unless global demand recovers.
Oil prices have fallen to their lowest levels in five months, and the balance of data as well as analysts, suggest that a meaningful rebound toward $65.00 per barrel is unlikely unless global demand recovers. Despite renewed political efforts to restrict Russian crude flows and strengthen sanctions, oversupply and soft consumption are driving a supply-heavy market. WTI crude currently trades near $58.00, while Brent sits around $62.00 - both struggling to find upward momentum as inventories swell and traders brace for weaker growth.
Key takeaways
- WTI trades near $58.00–$59.00 and Brent at $62.00, both at five-month lows.
- India’s pledge to halt Russian crude imports and U.S. pressure on China may tighten supply marginally.
- The U.K. sanctions new Russian oil assets and tankers, adding friction to global trade.
- OPEC+ output is rising as members unwind cuts, while U.S. shale continues record production.
- IEA forecasts a 3 million bpd surplus by 2026, the largest since 2020.
- Bank of America sees Brent averaging $64.00 in Q4 2025 and $56.00 in 2026, implying limited recovery potential.
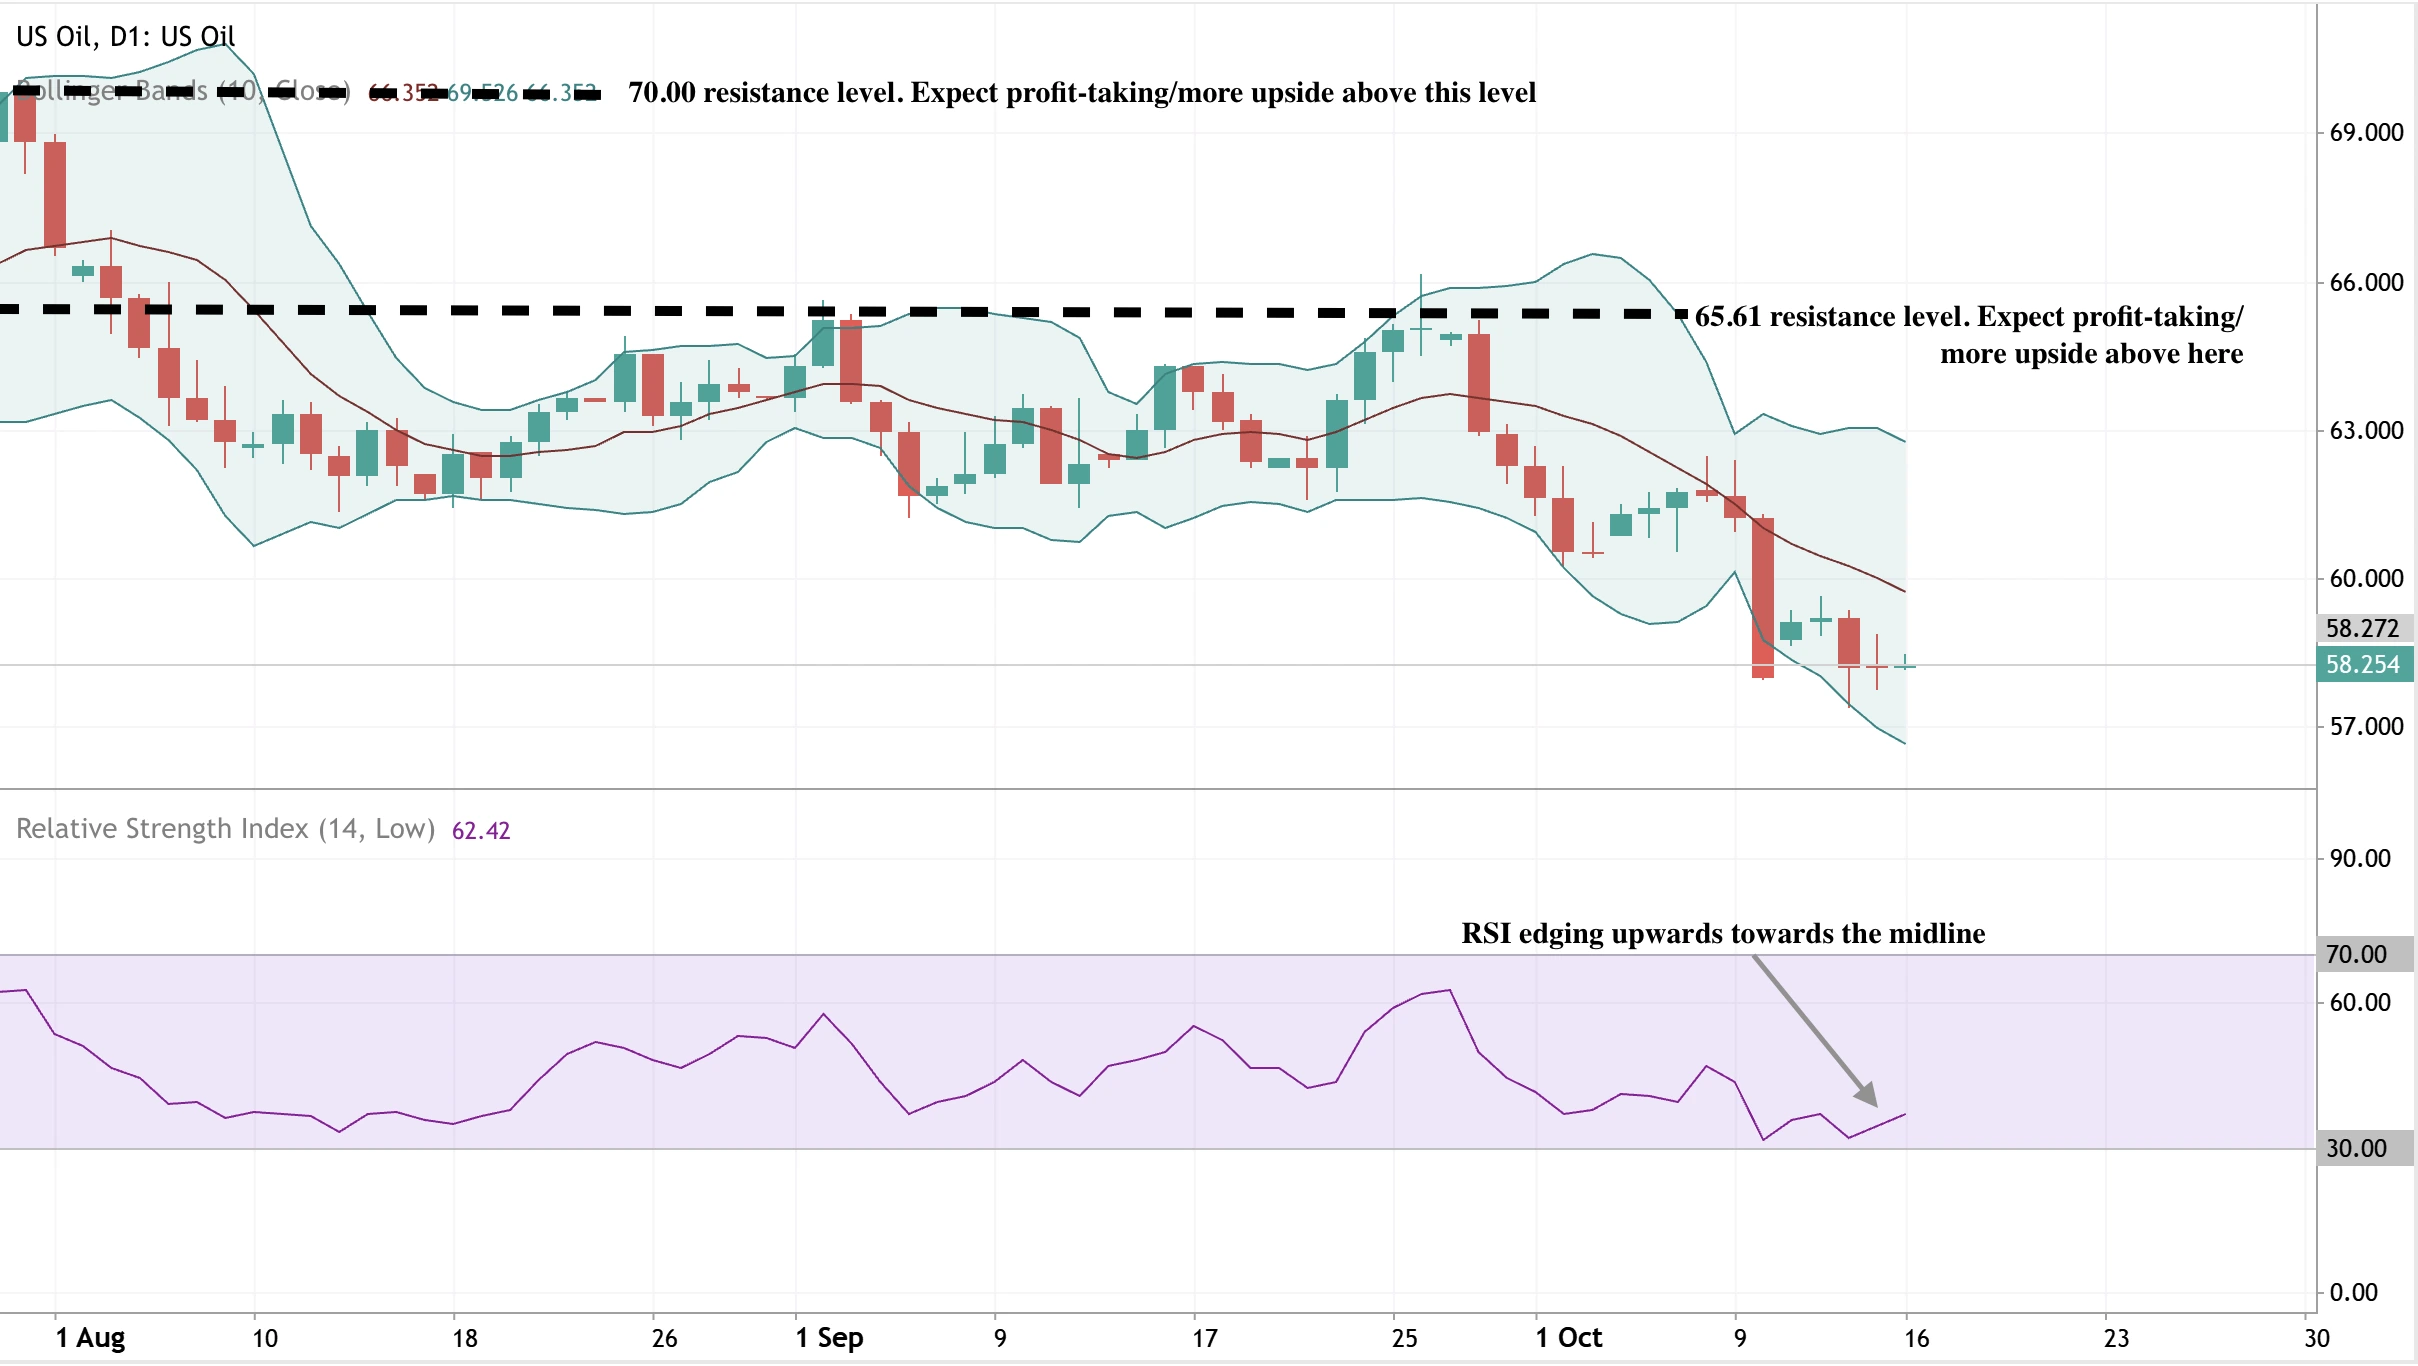
- Technical support for WTI lies near $58.25, with resistance at $65.61–$70.00
Political pressure meets market inertia
After weeks of steady declines, oil prices saw a short-lived rebound in early Asian trading, supported by fresh geopolitical headlines. U.S. President Donald Trump announced that Indian Prime Minister Narendra Modi had agreed to halt Russian oil imports, marking a symbolic win in Washington’s campaign to curb Moscow’s energy revenues. Trump added that he would next seek to pressure China to reduce its imports - a move that, if successful, could restrict the flow of discounted Russian crude that has cushioned global supply.
Meanwhile, the U.K. unveiled new sanctions on Russia’s two largest oil firms, Lukoil and Rosneft, and 44 “shadow fleet” tankers suspected of helping Moscow evade G7 price caps. The measures include asset freezes, director bans, and restrictions on British services, making it more difficult for Russia to move crude via alternative shipping networks.
Despite these political developments, the market reaction has been modest. Traders remain sceptical that diplomacy alone can offset the mounting evidence of a supply glut. According to API data, U.S. inventories rose by 7.36 million barrels in the week ending 10 October, while gasoline inventories increased by nearly 3 million barrels. Distillate inventories, including diesel, fell by 4.79 million barrels, hinting at steady consumption in transport fuels but not enough to shift the broader trend.
OPEC+ production increases are overwhelming the market
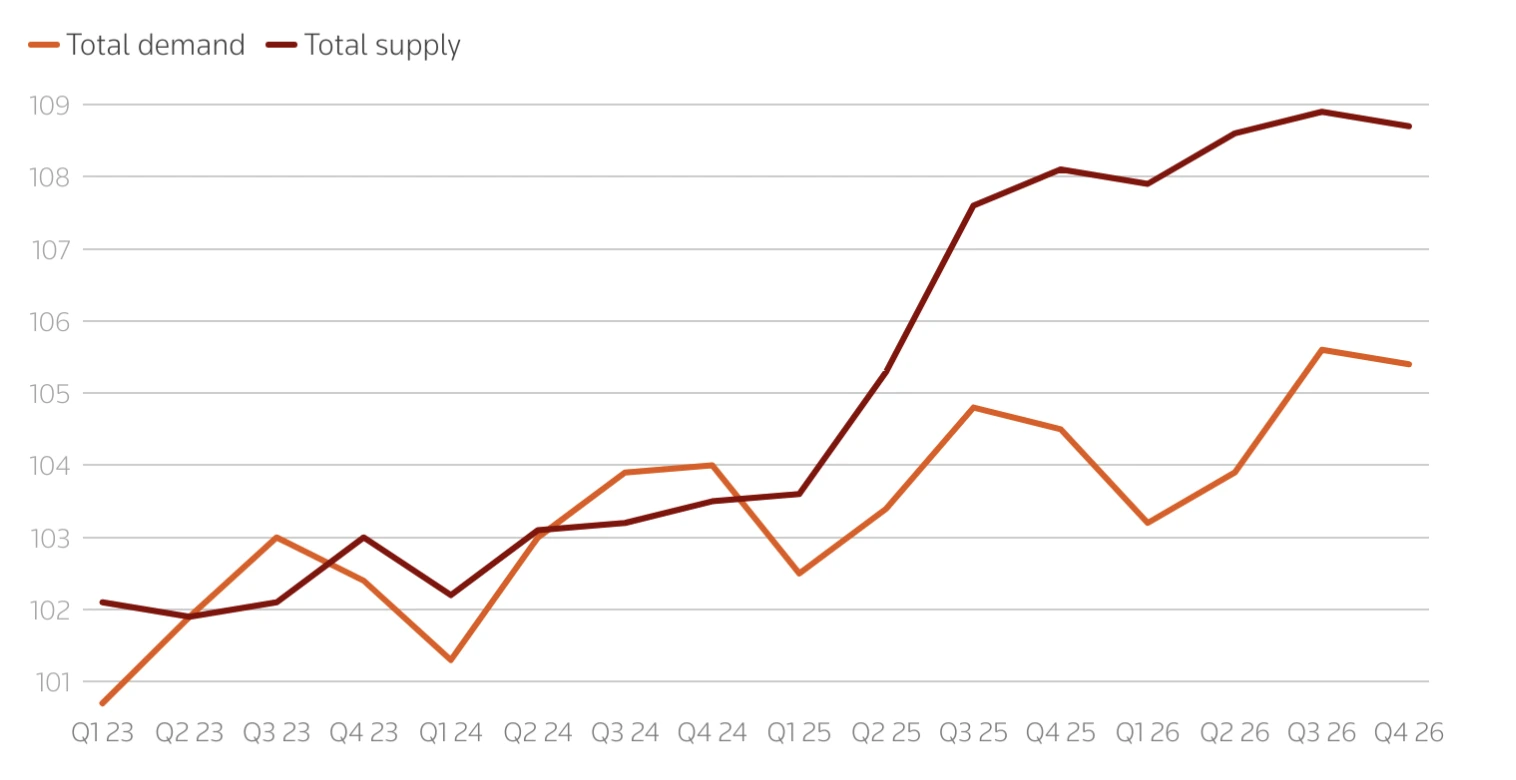
The International Energy Agency (IEA) revised its 2025 and 2026 oil supply forecasts higher, reflecting a faster unwinding of OPEC+ production cuts and robust growth from non-OPEC producers. Global supply is now expected to grow by 3 million bpd in 2025 and 2.4 million bpd in 2026, driven by two key forces:
- OPEC+ expansion: Saudi Arabia, Iraq, and the UAE have boosted output, collectively adding close to 400,000 barrels per day since September as they unwind earlier cuts.
- Non-OPEC surge: The United States, Brazil, Canada, and Guyana continue to scale production, with U.S. output at a record 13.58 million bpd. This record level has been achieved despite a significant reduction in active rigs, thanks to shale efficiency gains, longer laterals, and the completion of drilled-but-uncompleted (DUC) wells.
This aggressive production pace is pushing the market toward what the IEA calls a “persistent surplus.” Global inventories climbed to 7.9 billion barrels in August - the highest since 2021 - and the volume of “oil on water” surged by 102 million barrels in September as exports from the Middle East and the Americas grew.
The IEA says global oil demand growth is slowing
On the demand side, the IEA expects a much slower recovery. It forecasts oil demand growth of just 680,000 bpd in 2025 and 700,000 bpd in 2026, both about 20,000 bpd lower than its previous outlook. That’s less than half the growth rate projected by OPEC, which expects +1.29 million bpd next year.
The weakness is concentrated in major economies, where consumer confidence remains low, inflation has eroded spending power, and industrial output is softening. In China, deflationary pressures and a protracted property market slump continue to weigh on energy consumption. The renewed U.S.–China trade tensions, including higher tariffs and port fees, risk further depressing manufacturing activity and freight demand.
The IEA’s conservative stance contrasts sharply with OPEC’s optimism. While OPEC sees emerging markets sustaining transport fuel demand, the IEA expects the shift toward renewables and efficiency improvements to slow overall consumption. As a result, the agency’s models now project a significant surplus by mid-decade unless supply curbs intensify.
OPEC oil production forecast: The 2026 glut warning
The IEA’s October Oil Market Report warned that global oil supply could exceed demand by almost 4 million bpd in 2026 - a glut larger than the pandemic-era oversupply that sent prices below $40.00 in 2020. That scenario is underpinned by continued OPEC+ expansion, strong non-OPEC output, and sluggish industrial recovery in key markets.
Brent’s recent drop below $66.00 and WTI’s slide to $58.00 reflect investor concern that the market may not absorb the rising supply even with record refining runs. Refineries are processing around 85.6 million bpd, but most analysts agree that this level of throughput is unsustainable if global inventories continue to rise.
If the projected surplus materialises, Brent could test the $50.00–$55.00 range, while WTI may stabilise around $55–$60 unless production slows or demand surprises on the upside.
Geopolitical factors could slow the fall
Political risk remains a key variable that could temporarily support prices. Sanctions on Russia and Iran continue to constrain output from two of the world’s largest exporters. China’s strategic stockpiling of crude for energy security has also absorbed surplus barrels earlier this year, softening the downside momentum. Additionally, the Trump administration’s diplomatic campaign to pressure India, China, and Japan to reduce Russian imports could, over time, tighten the market if those commitments translate into actual trade restrictions.
However, the market has seen similar announcements before, and traders are waiting for tangible evidence of supply tightening. Bank of America expects short-term volatility around these developments but maintains a base case for Brent at sub $50 if Chinese demand continues to soften or if Washington escalates its tariffs on Beijing.
Oil price technical insight
From a technical standpoint, WTI crude is testing a significant support level around $58.25. A sustained move below this threshold could open the path toward $55.00–$57.00, while a rebound could target $65.61 and then $70.00, provided that buy-side momentum returns. Current trading volumes suggest that sellers still dominate, but if geopolitical headlines trigger renewed buying, short-term recoveries remain possible.
The potential rebound narrative is supported by prices touching the lower Bollinger band - hinting at oversold conditions. RSI pointing up towards the midline also suggests building buy momentum.
Trading oil price volatility with Deriv
Oil price swings create opportunities for traders seeking to capture short-term volatility or hedge longer-term exposure. On Deriv MT5, you can trade WTI and Brent CFDs with access to advanced charting tools, flexible leverage, and custom indicators to track price momentum and support/resistance levels.
During periods of heightened uncertainty - such as rising OPEC+ supply or U.S. inventory surges - traders can manage exposure with stop-loss and take-profit features available on Deriv MT5. To plan positions more precisely, use Deriv’s trading calculator to estimate margin, pip value, and potential returns before entering the market.
For more insights on commodities like oil, explore our commodity trading guide.
Investment implications
The market suggests heightened downside risk over the medium term for investors. If political headlines or new sanctions trigger brief rallies, short-term tactical buying near $61.00- $62.00 support may offer opportunities. However, the broader outlook remains bearish, with prices likely capped below $70.00–$75.00
Low-cost producers and U.S. shale operators are positioned to withstand lower prices thanks to efficiency gains, while offshore and high-cost projects may face margin compression. Refining companies could remain relatively insulated, benefiting from cheaper feedstock and strong throughput volumes, even in a lower price environment.

Gold price breaches USD 4,100: Is the surge peaking or just getting started?
Gold’s record-breaking climb past $4,100 an ounce suggests that safe-haven demand isn’t done yet.
Gold’s record-breaking climb past $4,100 an ounce suggests that safe-haven demand isn’t done yet - but momentum may soon face its first real test. After a relentless rally driven by trade tensions, political shocks, and a flood of central bank buying, the question now is whether gold’s rally toward $4,500 represents the next phase of a structural bull market or the exhaustion point of a trend that’s run too far, too fast.
Key takeaways
- Gold has surged nearly 60% in 2025, breaking $4,200/oz for the first time ever amid renewed U.S.–China trade tensions and global risk aversion.
- The rally has coincided with strong equity performance, signalling a shift from fear-driven to liquidity-driven momentum.
- Central bank demand remains a cornerstone of the rally, alongside ETF inflows and investor hedging against inflation and currency debasement.
- Deutsche Bank warns that gold’s rally has “peaked in trendiness”, suggesting a possible consolidation phase.
- Despite stretched valuations, Goldman Sachs, Société Générale, and JPMorgan all forecast further upside - with targets as high as $5,000/oz.
- Easing geopolitical tensions or rising real yields could trigger short-term pullbacks, but long-term fundamentals remain supportive.
Gold’s record-breaking run and safe-haven surge
Gold’s climb through $4,100 marks a watershed moment for the precious metal, cementing its position as one of 2025’s best-performing assets. The latest leg higher was fuelled by renewed tensions between the U.S. and China, after both countries announced new port fees on shipping cargo - a move that shattered expectations of a trade thaw.
The news reignited memories of previous trade-war flare-ups and spurred a rush into traditional hedges like gold. The metal, which had reversed from an earlier all-time high near $4,180, quickly regained its footing around $4,090 before pushing back toward $4,125 during the European session. Futures even briefly topped $4,200, marking a historic milestone for bullion markets.
Gold keeps surging as geopolitical risk indexes slip
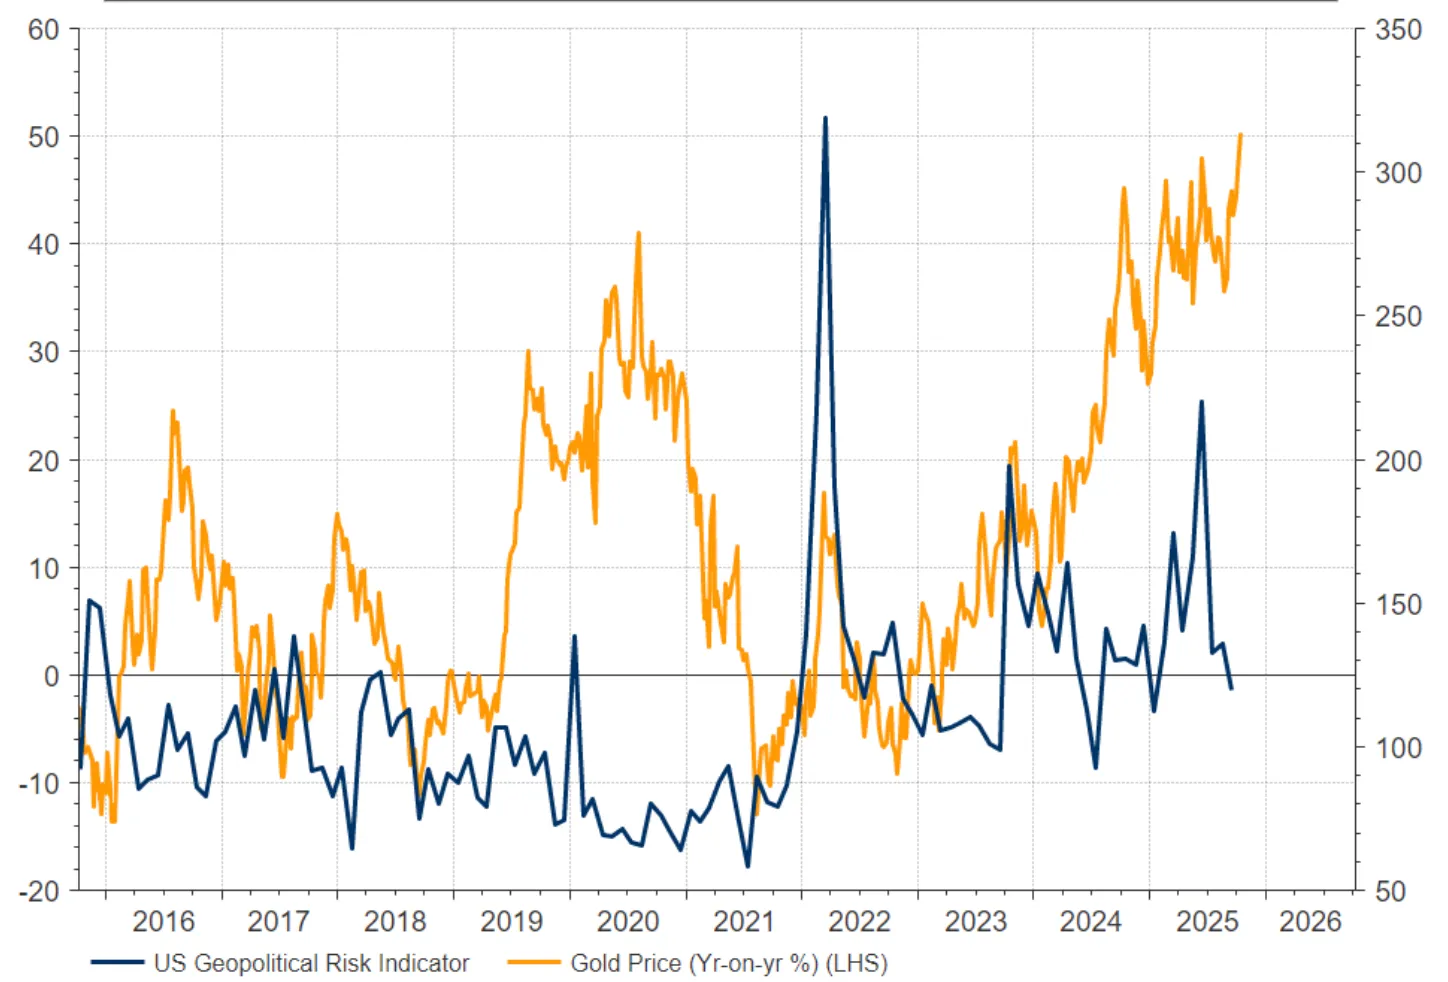
Beyond trade fears, the rally has been underpinned by political instability across key economies. France lost its prime minister just a day after his cabinet was appointed, the U.S. government entered an extended shutdown, and Japan moved to appoint a pro-stimulus prime minister calling for lower interest rates. Each event reinforced gold’s appeal as a global risk hedge - even as equities continued to rise, an anomaly that hints at something deeper than simple risk aversion.
Gold keeps rising as uncertainty EBBs
Gold-equity correlation: Why are both markets rising together
What makes this gold surge unusual is its parallel rise with global stocks. Normally, gold thrives when investors are fearful and equities are tumbling. But in 2025, both have risen together - a sign that liquidity and monetary policy, not panic, are driving flows.
The Federal Reserve’s renewed easing cycle has been central to this shift. Following a similar move in September, markets expect another 25 basis-point rate cut later this month.
Fed Chair Jerome Powell’s upcoming speech at the National Association for Business Economics is expected to acknowledge the challenge of limited data due to the ongoing government shutdown, but investors are already pricing in looser conditions ahead.
This lower-rate environment makes gold - a non-yielding asset - comparatively more attractive, particularly as real yields trend lower and inflation expectations edge higher. The combination of falling borrowing costs and political instability across multiple regions has amplified demand for physical gold, ETFs, and other gold-linked assets.
Safe-haven sentiment: Is this a new era or peak euphoria?
Major investment banks are split between conviction and caution.
- Goldman Sachs projects another 20% upside by the end of 2026, driven by enduring inflation and persistent geopolitical friction.
- Société Générale calls a rise to $5,000/oz “increasingly inevitable,” citing structural central bank demand.
- JPMorgan maintains gold as one of its “strongest conviction cross-asset views.”
However, this near-universal bullishness may itself be a warning. Deutsche Bank argues the rally may have “peaked in trendiness.” Their analysis shows that gold’s current trending phase has already lasted 29 days - far longer than the median 19-day uptrend seen in recent years. The bank doesn’t foresee an immediate correction but notes that investors are slowing purchases, signalling fatigue.
Meanwhile, HSBC cautions that if political or military tensions ease in 2026, gold prices could lose their upward momentum. This doesn’t necessarily imply a sharp reversal, but it does raise the prospect of a neutral or sideways phase as bullish sentiment cools.
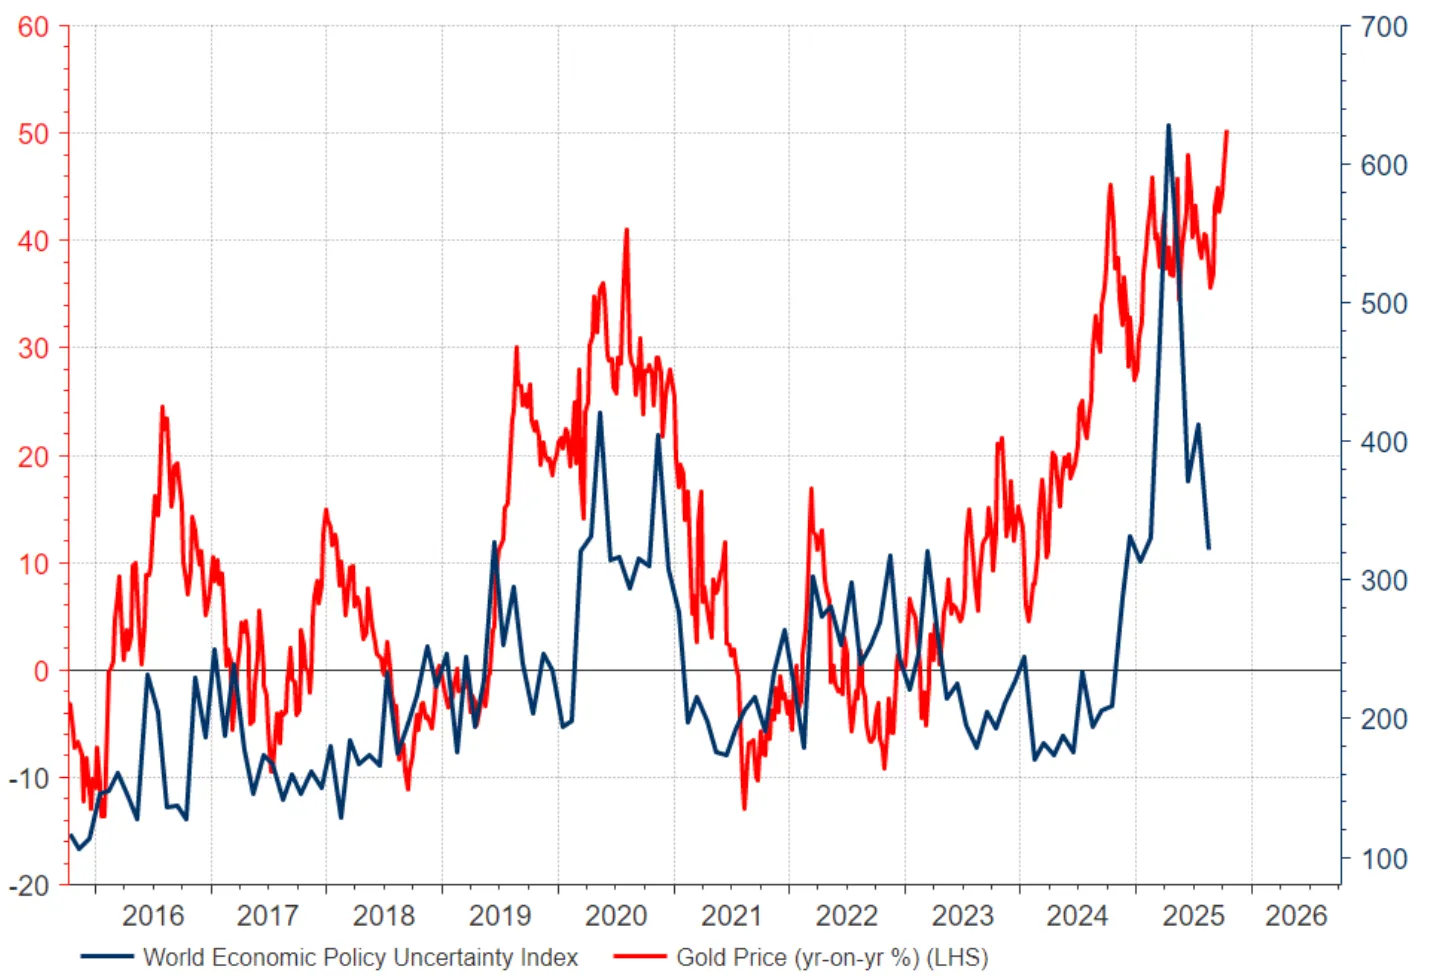
Central bank gold buying: Disconnect from fundamentals
Gold’s acceleration has begun to outpace traditional drivers. Historically, falling real interest rates and rising geopolitical risk explain most of gold’s strength. But even as uncertainty indices have declined and the U.S. dollar has firmed, gold has refused to retrace.
JPMorgan attributes this to physical demand - especially from central banks and exchange-traded funds (ETFs). The ongoing de-dollarisation trend has prompted central banks, particularly in emerging markets, to diversify their reserves into gold. This “structural demand” creates a steady bid even when speculative interest wavers.
Still, this detachment raises a valid question: when gold rallies independent of risk and rates, does it still serve as a diversifier, or has it become part of the speculative mainstream?
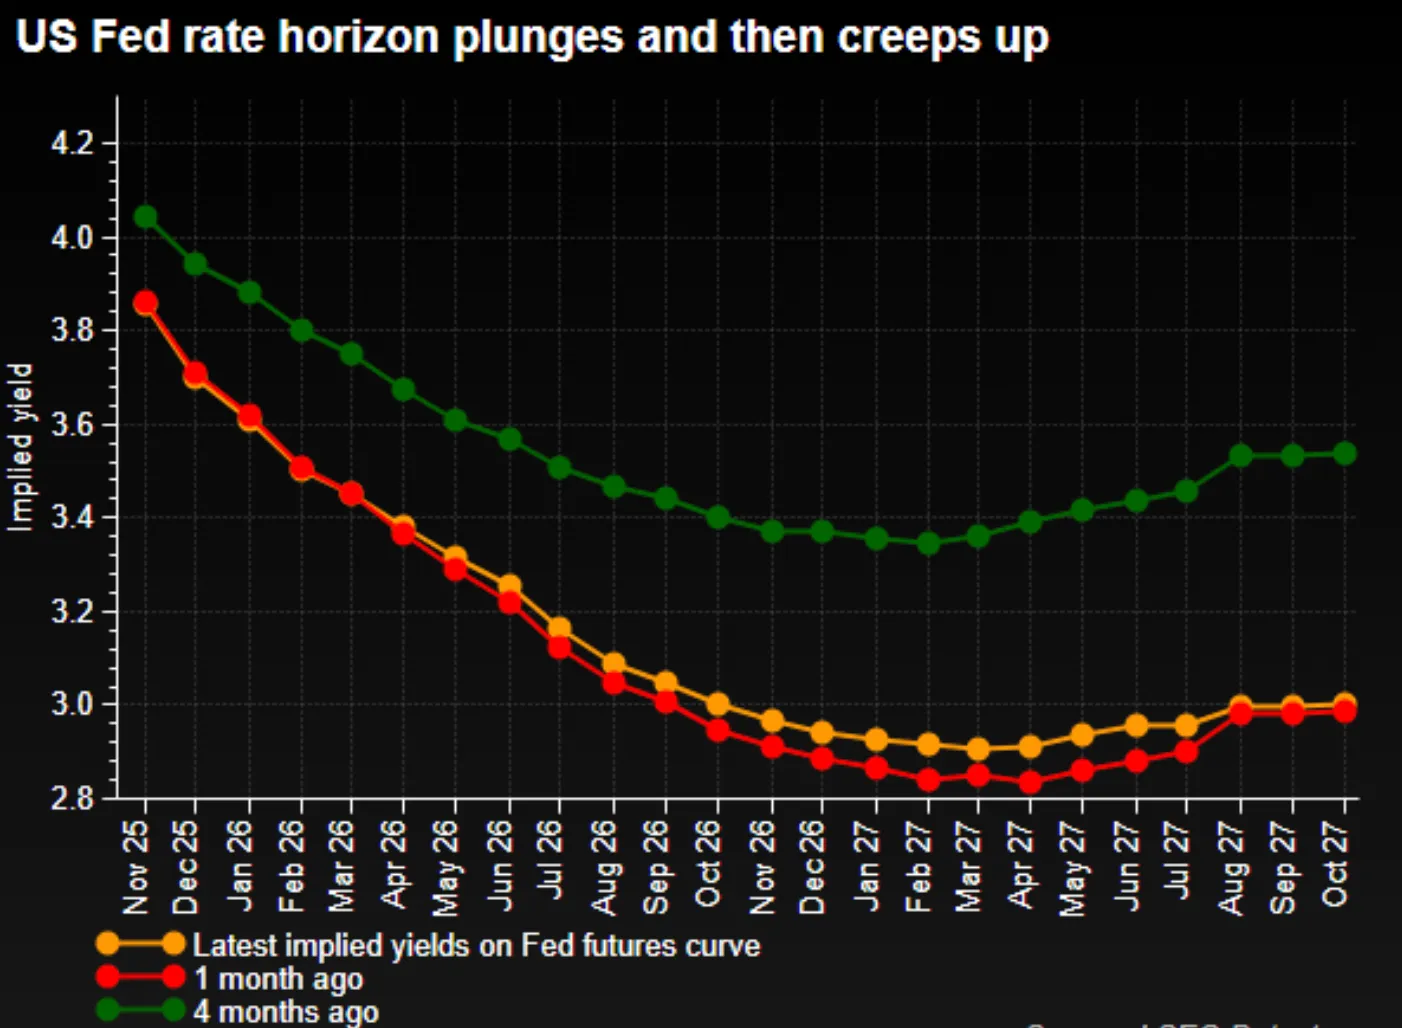
Gold price prediction 2025: Policy signals and the next move
Recent market data suggests traders are growing sensitive to every shift in interest-rate expectations. As the market’s implied Fed terminal rate dropped to below 2.9% earlier this quarter, gold surged in response. But that terminal rate has ticked higher in recent weeks, supporting the dollar and hinting at potential short-term resistance for bullion.
Simultaneously, Trump’s renewed tariff threats, China’s export curbs, and European political rifts continue to feed safe-haven demand. However, if those headlines fade, gold may pause before its next move higher.
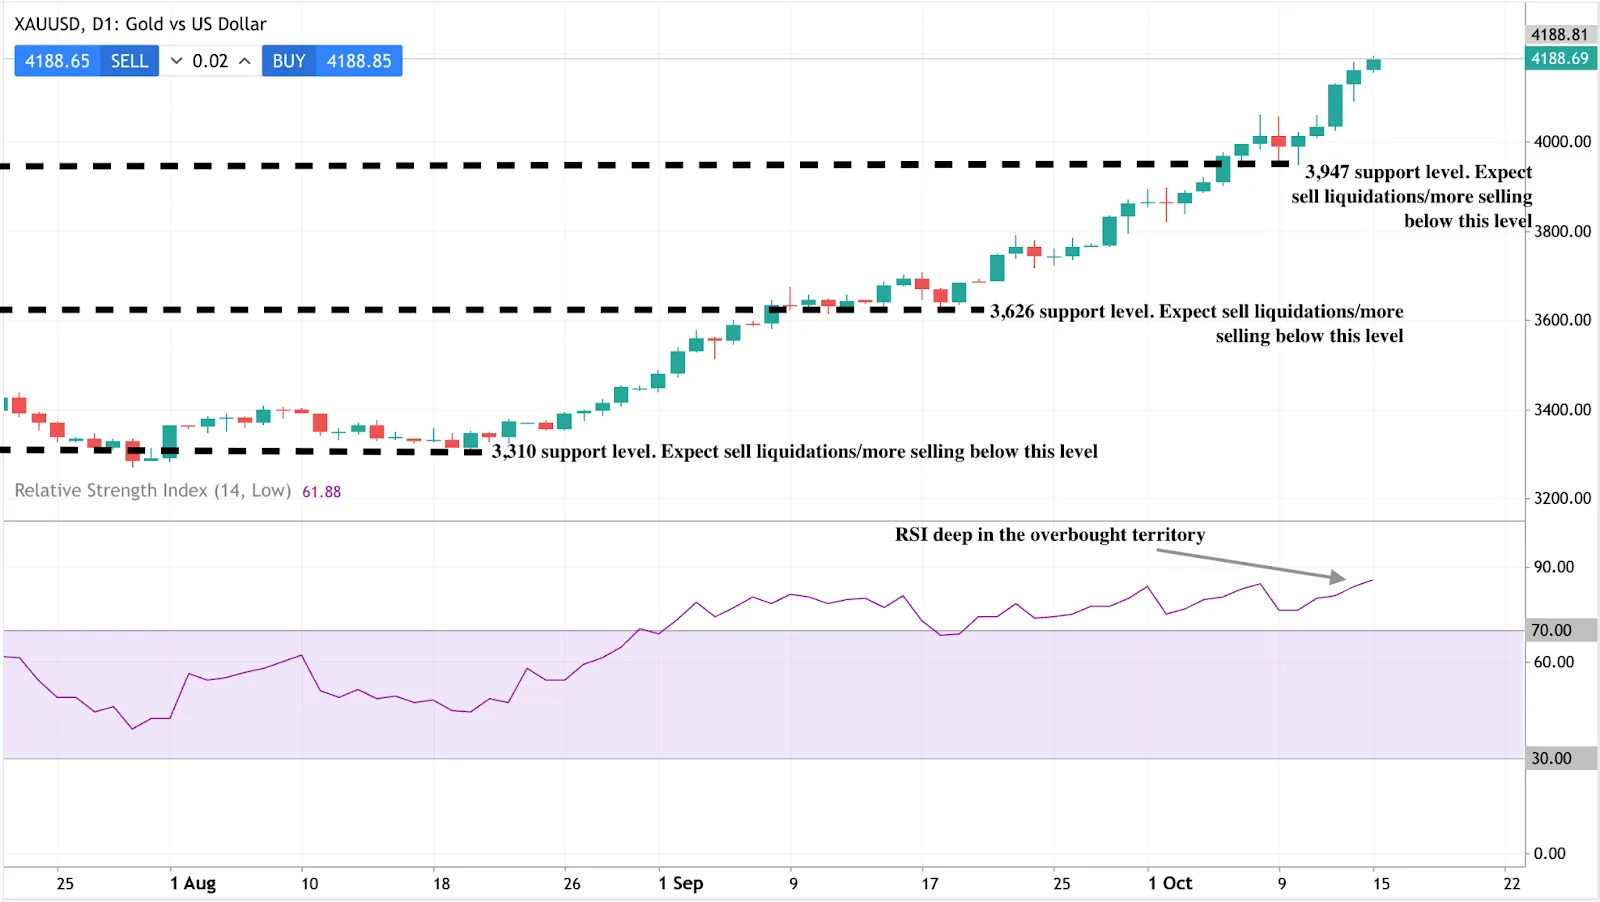
Gold price technical analysis
Gold is currently trading just above $4,100, holding steady above key short-term support at $3,947. If prices maintain this base, bulls could attempt another run toward $4,250 and then $4,300. Failure to hold the $3,947 support could trigger a short-term pullback toward $3,626 and $3,310, levels that may attract renewed buying from central banks and long-term investors.
For traders monitoring price action, gold’s short-term volatility can be analysed through advanced charting tools on Deriv Trader, which offer dynamic indicators and depth-of-market views.
Trading gold on Deriv platforms
Gold has dominated global headlines and trading activity on Deriv’s platforms. During the recent price surge, trading volumes in gold CFDs on Deriv MT5 seem to have increased, reflecting heightened trader engagement.
Deriv MT5 remains the go-to platform for traders seeking precision and flexibility. It allows access to gold and other major commodities with advanced charting, multi-asset analysis, and fast execution speeds - critical features for navigating fast-moving markets.
Popular Deriv trader strategies
- Range trading: Exploiting gold’s intraday swings between $4,090 and $4,250 using disciplined stop levels and dynamic position sizing.
- Breakout trading: Entering around key resistance zones at $4,300 and $4,500 to capture potential post-news surges.
- Cross-asset hedging: Combining gold positions with currency pairs like USD/JPY or equity indices to manage risk across correlated markets.
Gold investment outlook
The 2025 gold rally represents both a defensive play and a confidence trade. It is defensive because it reflects fear of inflation, debt, and geopolitical fractures. It is also confident because investors are anticipating that policymakers will continue to err on the side of easy money.
If gold consolidates near current levels, that stability may attract new institutional inflows. Should political or policy shocks re-emerge, prices could accelerate toward $4,500 - validating the bullish forecasts. However, if global stability improves and yields rise, prices could drift lower into a $3,600–$3,900 trading range without undermining gold’s long-term appeal.
For now, the data suggests a pause, not a peak - a breather in what may be the early stages of a longer, more structural shift toward hard assets in a world of soft policy.
For readers tracking the broader commodities outlook, check out Deriv’s latest market pieces on oil’s $50 price floor scenario and crypto market trends - both relevant for understanding cross-asset sentiment shifts. You can also use Deriv’s trading calculator to model potential returns and risk exposure across multiple markets before taking a position.

Was the $19 billion Bitcoin price wipeout a fakeout before a late 2025 moonshot?
Analysts say Bitcoin’s $19 billion October sell-off was likely a fakeout rather than the start of a new bear cycle.
Analysts say Bitcoin’s $19 billion October sell-off was likely a fakeout rather than the start of a new bear cycle. The cryptocurrency’s rapid rebound from $107,000 to $116,000, combined with stabilising macro conditions and renewed institutional inflows, points to a temporary shakeout before a potential year-end rally. Still, whether Bitcoin can reclaim $125K and push toward $150K next will depend on how the market responds to fading leverage, shifting sentiment, and lingering geopolitical uncertainty.
Key takeaways
- $19 billion in crypto liquidations followed Donald Trump’s 100% tariff threat on China.
- Bitcoin rebounded 8% within days as U.S.–China tensions eased.
- Analyst Ash Crypto’s forecast—a drop to $106K followed by a surge to $150K - remains on track.
- Institutional sentiment continues to strengthen, while retail traders stay cautious.
- Volatility resets could set the stage for a new Q4 rally if momentum holds above $115K.
Bitcoin market crash 2025: The $19B liquidation and recovery
Bitcoin’s October sell-off was one of the most severe since early 2024. Triggered by President Trump’s 100% tariff announcement on Chinese imports, it sent shockwaves through risk assets and wiped out billions in leveraged positions. Bitcoin plunged to $107K, while Ethereum dropped below $3,500, prompting the liquidation of more than $19 billion in crypto holdings.
The panic briefly rippled into stablecoins. USDe, one of the largest by market cap, momentarily depegged to $0.65 on Binance before quickly recovering to parity. Once Trump softened his tone and U.S. Treasury Secretary Scott Bessent confirmed that trade talks had “substantially de-escalated,” investor sentiment improved. Bitcoin recovered to $116K, showing that institutional demand remained resilient despite the turbulence.
Bitcoin price prediction 2025: Ash Crypto’s prediction
At the start of October, research analyst Ash Crypto predicted that Bitcoin would correct toward $106K and Ethereum to around $3,800 before resuming their upward trend. Both targets were met during the sell-off, validating the first half of his forecast.
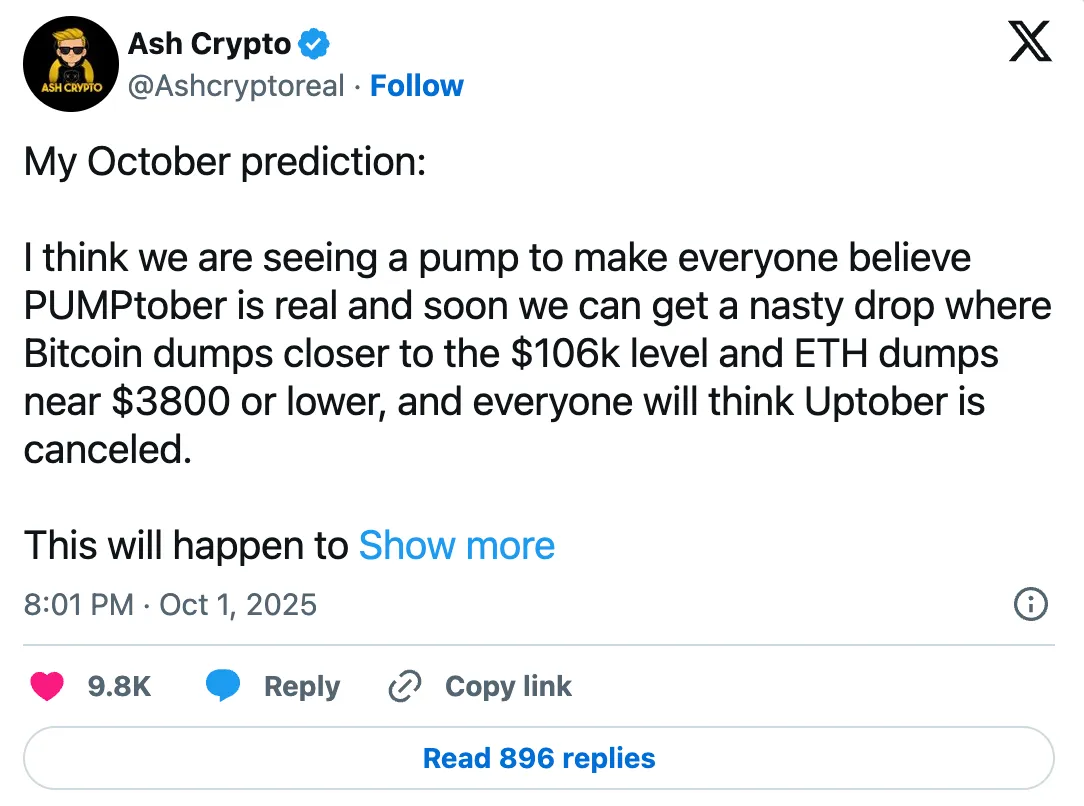
He maintains that the correction represents a “fakeout before the breakout”, projecting that Bitcoin could reach $150K by year-end, triggering a renewed altcoin season in Q4 2025.
Ash revealed that he is currently 85% invested in the market to capture near-term upside, while keeping 15% in cash to “buy the dip” should another correction occur. He expects a reversal to start in the final 10 days of October, to continue the uptober trend, as market pessimism peaks and leverage resets.
Bitcoin institutional investment offsets retail fear
Institutional participation remains a defining feature of this cycle. While retail traders continue to trade reactively, large financial firms are expanding their exposure:
- Morgan Stanley is preparing to extend crypto trading through its E-Trade platform.
- JPMorgan is advancing plans for a stablecoin initiative, despite CEO Jamie Dimon’s long-held skepticism.
- Invesco’s Chris Mellor describes Bitcoin as “digital gold,” citing its low correlation with traditional assets.
- Nigel Green, CEO of DeVere Group, argues that Bitcoin’s volatility has become “productive,” signalling a more mature market.
Meanwhile, Hargreaves Lansdowne, the U.K.’s largest retail investment platform, maintains a cautious view, stating that Bitcoin should not form part of long-term portfolios due to its high volatility and lack of intrinsic value. This divergence between institutional optimism and retail caution underscores a market in transition - maturing but still fragile.
The fakeout pattern and market psychology
Analysts argue that Bitcoin’s price action fits a classic fakeout pattern, where sharp declines flush out leveraged positions before a reversal. Similar events in past cycles lend credibility to the theory:
- In 2020, a 20% correction preceded Bitcoin’s rally to $60K.
- In 2023, a 22% pullback led to record highs within three months.
Ash Crypto and others believe the latest decline follows this script - a phase of forced liquidation followed by strategic accumulation. When pessimism reaches its peak, they say, the market often stages its strongest rallies.
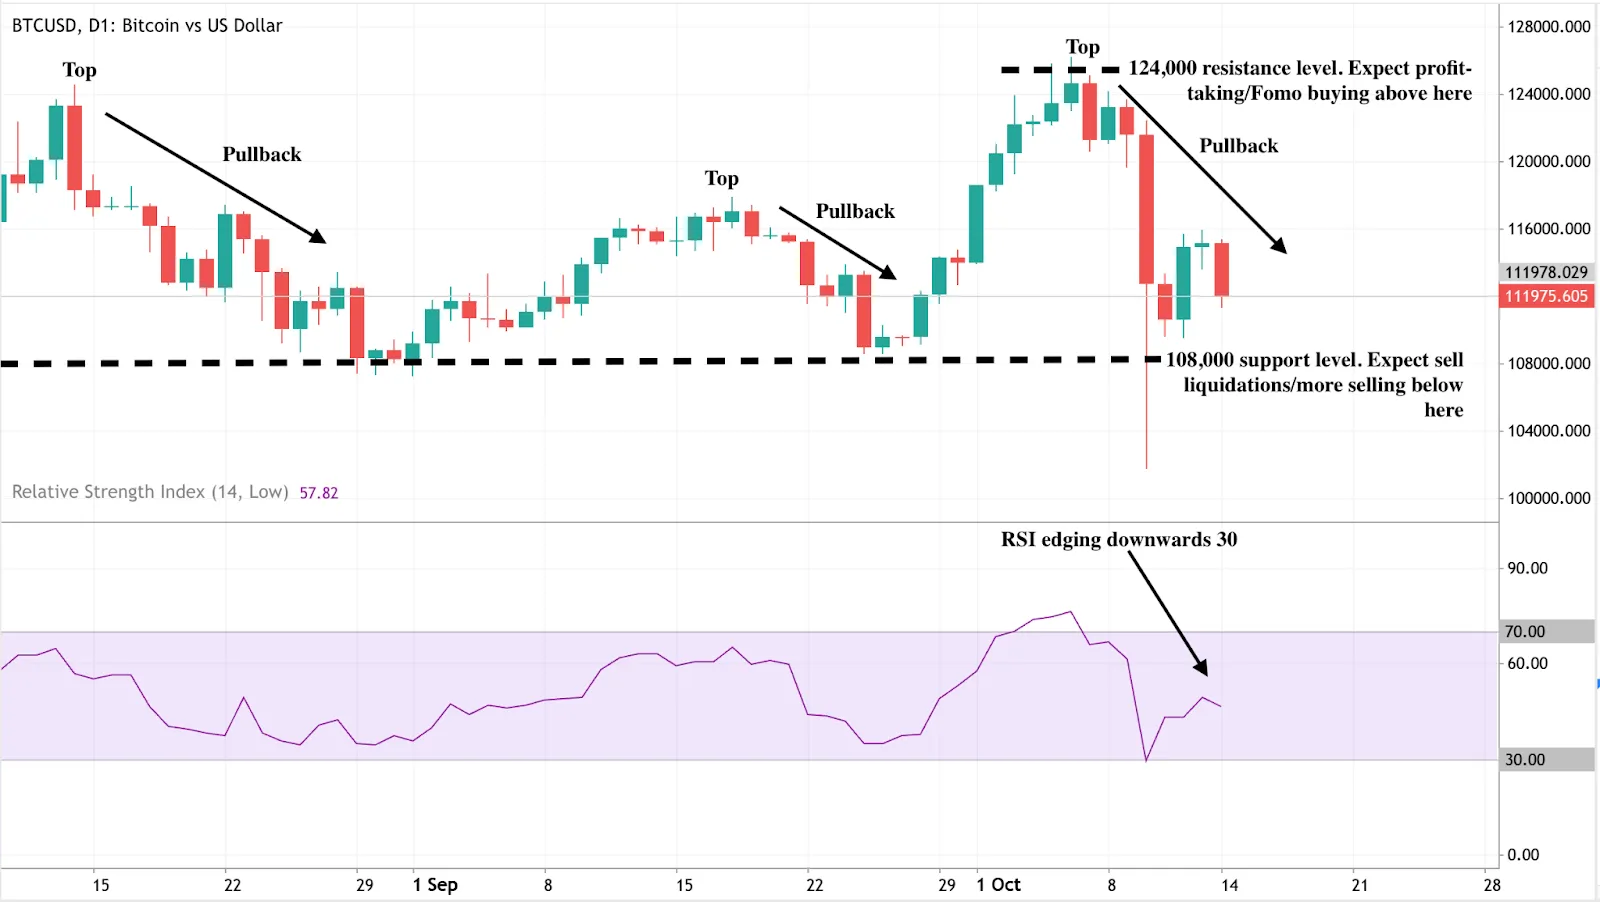
Bitcoin technical analysis 2025
At the time of writing, sellers appear to be in control on the daily chart despite Bitcoin’s recent rebound from $107K. The chart is forming what looks like a potential triple-top pattern, a traditionally bearish signal that often precedes trend reversals.
This narrative is reinforced by the Relative Strength Index (RSI), which is trending lower toward 30, suggesting increasing sell pressure and weakening bullish momentum.
If prices inch lower and breach the $108,000 support level, it could confirm the triple-top formation and trigger another wave of selling, potentially pushing prices toward deeper correction zones. Conversely, if buyers regain control and a fakeout is confirmed, a sharp uptick could face resistance near the recent highs of $124,000, which remains the key barrier before a move toward the $125K—$150K range can resume.
How to trade Bitcoin’s volatility on Deriv platforms
Bitcoin’s price swings offer trading opportunities across multiple Deriv platforms. Traders can take advantage of high volatility using Deriv MT5 (DMT5)’s advanced order types and customisable charting tools.
- On Deriv MT5, traders can use stop-loss and take-profit orders to manage exposure efficiently during sharp moves. The platform’s multi-asset interface also allows traders to monitor correlated assets like Ethereum or Gold for intermarket insights.
- For traders seeking lower-risk exposure, Derived Indices - synthetic markets that mirror crypto volatility without external news risk - can be used to practice similar strategies.
- You can also explore our trading calculators to estimate margin and profit potential before placing positions.
Whether you prefer manual setups or automated systems, Deriv’s platforms give traders the precision and flexibility needed to trade Bitcoin’s volatility with confidence.
Bitcoin investment implications
For traders, the current setup suggests a market reset, not a reversal.
- Short-term opportunities may lie in buying near $110K–$112K support levels while watching for confirmation above $125K.
- Medium-term investors may benefit from gradual accumulation, as institutional participation signals deeper market maturity.
If current forecasts hold, the October fakeout could mark the start of Bitcoin’s next major leg higher, positioning Q4 2025 as a potential launchpad for its long-awaited moonshot.

Why silver prices broke $50 for the first time since 1980
Recent reports show that Silver prices broke $50 per ounce in 2025 because of an intense short squeeze.
Recent reports show that Silver prices broke $50 per ounce in 2025 because of an intense short squeeze, collapsing inventories, and a wave of safe-haven investment inflows triggered by expectations of Federal Reserve rate cuts. The move was fuelled by tightening supply in London’s bullion market, where liquidity dried up and traders were forced to cover massive short positions.
At the same time, investors poured record sums into silver-backed exchange-traded funds (ETFs) as inflation worries and tariff tensions pushed demand for hard assets higher. The result: the strongest silver rally in over four decades, though analysts warn its smaller, less liquid market leaves it vulnerable to violent swings.
Key takeaways
- A record short squeeze in London sent silver above $50, its highest level since 1980.
- Inventories in London are down 75% since 2019, tightening supply as demand outpaces mine output.
- ETF inflows into silver are at their highest level since 2020, reflecting rising investor appetite for hard assets.
- Goldman Sachs expects silver to rise further in the medium term but warns of short-term volatility and risk of sharp pullbacks.
- Industrial demand from solar and electronics remains supportive, but substitution with copper is limiting upside potential.
- Silver’s smaller, less liquid market - roughly one-ninth the size of gold’s - amplifies every investor move.
Drivers behind the breakout: Silver short squeeze explained
According to Goldman Sachs, silver’s price rally has been fuelled primarily by private investment flows, the same dynamics boosting gold as markets prepare for an era of lower U.S. interest rates. According to the bank’s modeling, every 1,000 metric tonnes of new silver bought adds roughly 1.6% to prices. But this time, the move has been supercharged by structural supply tightness and a massive short squeeze.
Liquidity in London’s bullion market has collapsed, forcing traders to pay record borrowing costs to roll short positions.
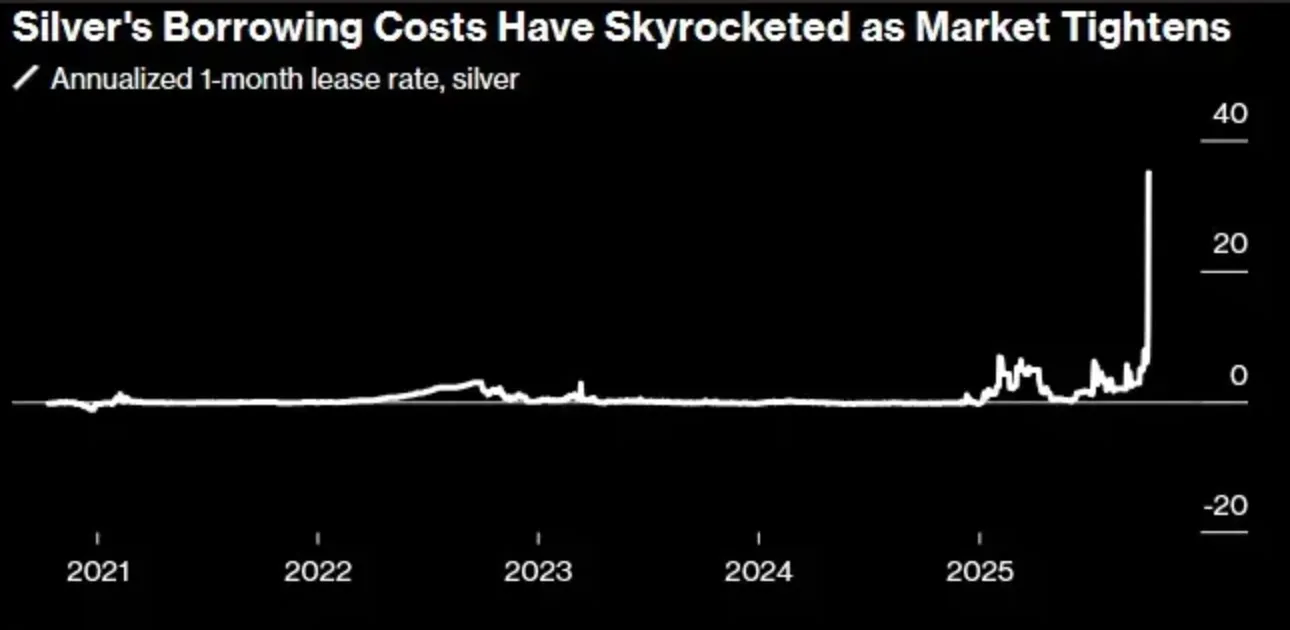
At one point, London spot silver traded at a $3 premium to U.S. futures - a spread unseen even during past crises. Some traders reportedly flew silver bars by air cargo from the U.S. to the U.K. to take advantage of the price gap - a rare phenomenon for silver and more common in the gold market.
London silver inventories have dropped by 75% since 2019, with freely available stock (“free float”) down to around 200 million ounces.
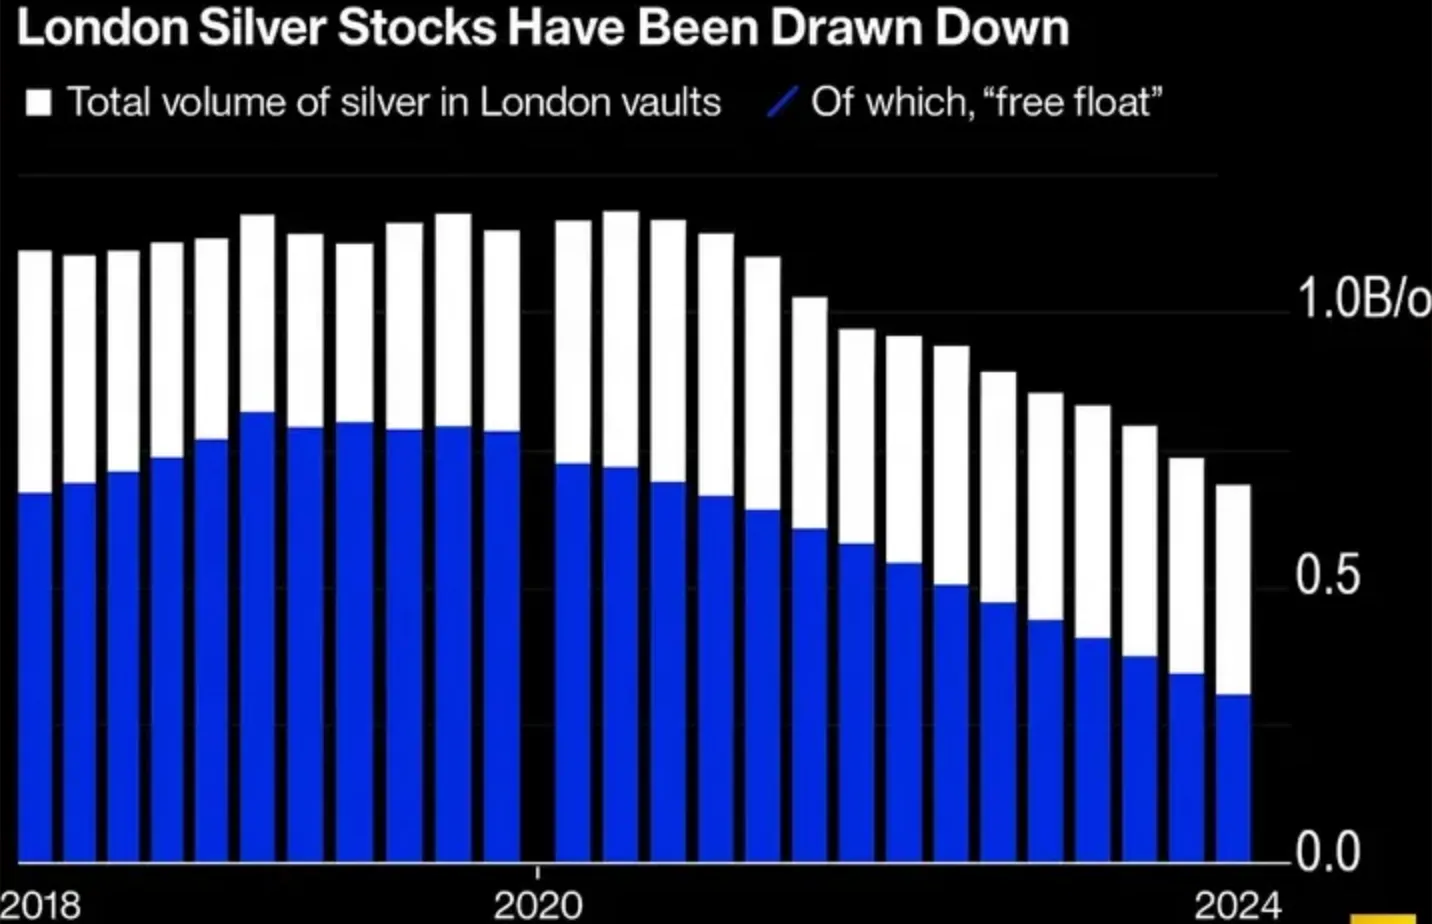
Strong Indian imports, fears of U.S. tariffs on critical minerals, and safe-haven flows amid U.S. fiscal and geopolitical tensions have compounded the squeeze.
Silver ETF inflows add to the volatility
The gold market is valued at about $450 billion, while silver’s market is only around $50 billion - making it nine times smaller and far more sensitive to capital flows. This means even moderate inflows or outflows can create violent price swings.
Gold’s price stability is partly supported by central bank demand, which silver lacks. Central banks have been net buyers of gold for 15 consecutive quarters, giving the yellow metal structural support even when investor sentiment cools. Silver, in contrast, relies almost entirely on private and speculative investment demand, making it prone to sharper corrections.
Goldman Sachs expects silver’s medium-term trajectory to remain positive but warns that short-term volatility could exceed gold’s by a wide margin. The bank identifies two key risks that could trigger a temporary correction:
- ETF inflows are slowing after a rapid growth during Fed easing cycles.
- Delayed restocking of London inventories if traders postpone shipments due to tariff investigations in the U.S.
Silver Industrial demand: a mixed picture
While silver’s industrial use in solar panels, electronics, and data centres provides a base of demand, analysts caution that the story isn’t entirely bullish.
Solar expansion is slowing, and manufacturers are increasingly replacing silver with cheaper copper to reduce costs. Goldman Sachs notes that while industrial use remains important, it is no longer the main long-term growth driver for prices.
However, silver’s dual role as both an industrial metal and a safe-haven asset has amplified its momentum. As Ewa Manthey, commodities strategist at ING, explains:
“Its dual role has amplified the rally, making 2025 a historic year for silver.”
Silver price forecast: Powell, inflation, and the path to $55
Traders are watching Fed Chair Jerome Powell’s speeches on October 14 and 16, along with U.S. PPI, retail sales, and unemployment data. If Powell signals that rate cuts are imminent, silver could extend its parabolic run beyond $55.
Conversely, a hawkish tone or stronger economic data could trigger a pullback as momentum traders unwind positions. In essence, silver’s path forward now depends less on mine output and more on global liquidity, Fed communication, and investor psychology.
Silver Investment implications
For traders and portfolio managers, the 2025 silver market represents both opportunity and risk.
- Short-term: Watch for volatility around key macro events like Fed speeches and U.S. inflation data. Rapid rallies could be followed by swift corrections.
- Medium-term: The underlying supply deficit and investor appetite suggest a positive trajectory, but position sizing and timing remain critical.
- Long-term: Structural tightness, slower mine output, and the dual industrial–investment appeal may support higher average prices through 2026.
Silver’s breakout above $50 has placed it back at the centre of the global commodities story. Whether it stabilises above that level or retraces in the months ahead will depend less on mining and more on how much confidence - or caution - investors bring to the table next.
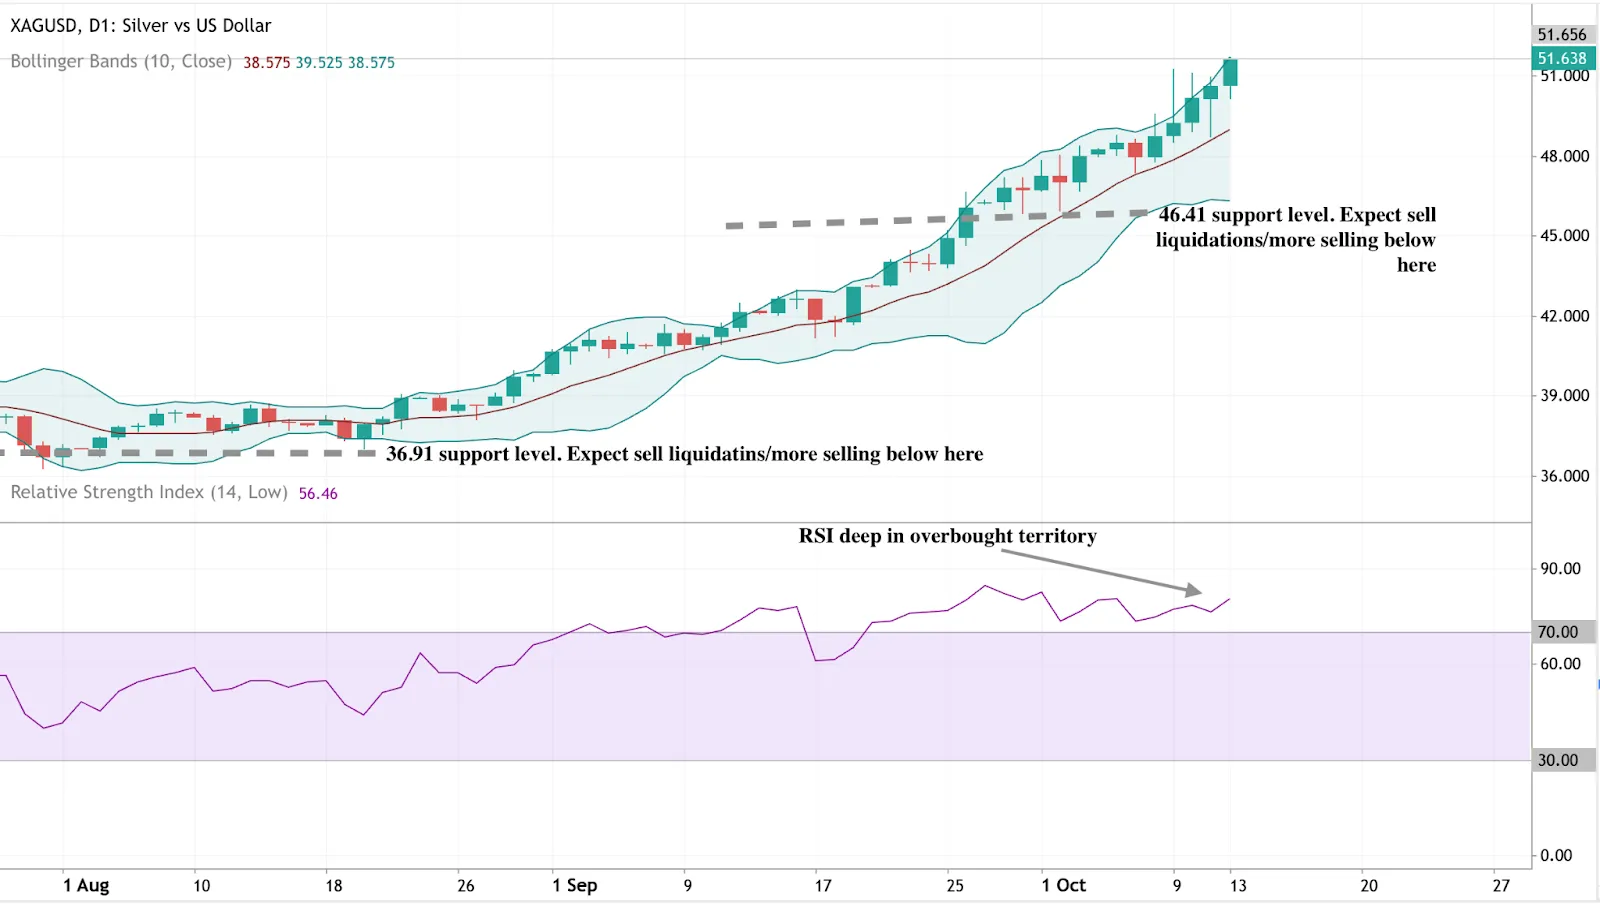
Silver price technical insights
At the time of writing, Silver is going parabolic with bullish pressure evident on the daily chart - hinting at a potential higher highs. However, prices are touching the upper boundary of the Bollinger band, hinting at a potential price reversal. The price reversal narrative is also supported by the RSI rising deep into overbought territory. If we see silver price exhaustion and subsequent drawdown, prices could find support at the $46.41 and $36.91 price levels.
Deriv traders: capturing opportunity in silver’s volatility
Silver’s explosive return to $50 has opened fresh opportunities for Deriv traders seeking to trade short-term volatility or long-term momentum.
On Deriv MT5, traders can access silver (XAG/USD) with tight spreads and leveraged exposure, allowing for flexible strategies across spot and CFD positions.
- Scalpers and intraday traders can explore short-term swings using MT5’s advanced charting and automated trading tools.
- Swing and position traders can use derivatives to capture directional momentum as the market tests the $47–$55 range.
In addition, Deriv Trader offers an intuitive platform for those preferring simplified contracts - such as Up/Down trades on silver price movements - with clear potential outcomes and defined risk.
For those tracking correlations, silver’s behaviour has increasingly mirrored gold and Bitcoin, offering hedging opportunities and cross-market diversification for multi-asset portfolios within the Deriv ecosystem.
Using Deriv’s trading calculator can help traders manage risk effectively during silver’s heightened volatility, especially when trading leveraged instruments.

Gold vs Treasury yields in 2025: Has the classic hedge stopped working?
Gold’s long-standing inverse relationship with U.S. Treasury yields has effectively broken down in 2025.
Gold’s long-standing inverse relationship with U.S. Treasury yields has effectively broken down in 2025. The precious metal has surged beyond $4,000 per ounce, even as Treasury yields have stabilised and the U.S. dollar has weakened. This divergence signals a deeper shift in global risk sentiment: investors are no longer treating U.S. government bonds as a reliable hedge. Instead, gold has become the preferred safe-haven asset in a market rattled by debt concerns, inflation risk, and fiscal uncertainty.
Key takeaways
- Around $9.2 trillion in U.S. marketable debt matures in 2025, forcing the Treasury to refinance record amounts of bonds amid weak demand.
- The federal deficit is projected to reach $1.9 trillion, fuelling fears of unsustainable debt and fiscal complacency.
- Persistent inflation and tariff-related shocks have raised the term premium on long-term bonds, making Treasuries behave more like risk assets.
- The U.S. dollar has declined even as yields stayed high, reflecting eroding faith in the government’s fiscal position.
- Gold has risen 52% year-to-date, breaking above $4,000 as central banks and investors shift from bonds to hard assets.
Treasury yields market under pressure
The U.S. Treasury market has endured one of its toughest years in decades. A wave of maturing debt - roughly $9.2 trillion, much of it concentrated in the first half of the year - forced the government to issue new securities at a rapid pace. Investor appetite couldn’t keep up, leading to a broad-based sell-off and rising yields, particularly on longer-dated maturities.
At the same time, the fiscal deficit ballooned to $1.9 trillion, fuelling fears that rising government spending would worsen long-term debt sustainability. Investors demanded higher yields to hold U.S. debt, effectively repricing Treasuries as riskier assets rather than defensive ones.
The situation was worsened by technical and policy shocks - including shifts in U.S. trade policy and tariff changes - that distorted pricing and raised the term premium. This combination of oversupply, inflation anxiety, and fiscal concern made Treasuries more volatile than at any point since 2020.
Gold as a safe-haven fills the vacuum
Normally, a sell-off in Treasuries would strengthen the U.S. dollar and weigh on gold. But 2025 has upended that playbook. The dollar declined alongside bonds, exposing a crisis of confidence in U.S. fiscal credibility. That opened the door for gold to assume the defensive role once held by Treasuries.
Investors, fund managers, and central banks accelerated purchases of physical gold and ETFs, viewing the metal as a more reliable store of value in an environment where government-backed debt looked fragile.

The result was a historic rally past $4,000 per ounce, marking gold’s best performance in nearly five decades.
Gold vs U.S. Treasury Yields - 2025 Performance Comparison
Sources: World Gold Council (Mid-Year 2025 Outlook), Reuters (8 October 2025), YCharts U.S. 10-Year Treasury Rate Series.
The data underscores how gold and yields are now moving in tandem. Gold’s 42% rally alongside steady yields around 4.1% confirms that the traditional inverse correlation - where gold rises as yields fall - has collapsed. Instead, both assets are now responding to fiscal uncertainty and investor mistrust in policy stability.
Consequences of the gold–Treasury correlation breakdown
The breakdown of the gold–Treasury hedge has made markets more volatile and less predictable. Yields have stayed elevated, while equities have struggled to find stability amid cross-asset correlations that used to offset each other. The dollar’s weakness has amplified inflation concerns, creating a feedback loop that further supports gold demand.
Some analysts, however, see potential for a reversal later in 2025. If the economy slows and the Federal Reserve cuts interest rates, yields could fall and partially restore the old inverse relationship. But for now, gold and Treasuries are moving together - a sign that the structural foundation of the classic hedge has cracked.
Gold price forecast 2025–2026
Analysts remain divided on what comes next. Goldman Sachs projects that gold could hold near record levels if fiscal risks persist, while some strategists believe lower yields from a potential recession might ease pressure on bonds later in the year.
However, the underlying issue - high debt issuance, persistent inflation, and waning trust in U.S. fiscal management - points to a long-term rebalancing. Treasuries are no longer viewed as a pure safe-haven asset; they’re part of the risk environment. Gold, meanwhile, has become the anchor for stability in uncertain times.
Gold price technical insights
At the time of writing, strong buy pressure is evident on the daily chart. However, prices going within touching distance of the upper ascending channel could hint at a potential pullback towards the lower limit of the channel at $3,850. This pullback narrative is supported by the RSI being deep in overbought territory. On the flipside, MACD shows strong bullish momentum. A decisive move beyond current levels could give buyers the green light to target $4,100.

Gold investment implications
For traders and asset managers, the 2025 landscape signals a new hedging reality.
In the short term, gold is likely to consolidate above $4,000, supported by sustained central bank demand and safe-haven flows. If a recession triggers rate cuts, bond prices could recover - but gold will likely retain its strategic appeal as protection against policy and credit risk.
Medium-term positioning should favour diversified exposure to gold on Deriv MT5 , where traders can use multipliers to manage leverage in volatile conditions. Meanwhile, using tools like Deriv’s trading calculator can help maintain disciplined risk management as gold’s volatility increases.
Trading strategies for gold on Deriv platforms
Traders on Deriv can access the gold market through a range of platforms designed to suit different trading styles and objectives.
Our platforms offer access to spot gold (XAU/USD) with competitive spreads starting from 0.3 pips, deep liquidity, and leverage options of up to 1:1000, depending on the account type and jurisdiction. The platform supports multiple order types, advanced charting tools, and integrated indicators for technical analysis.
Traders looking for exposure to gold price movements with controlled risk can use Deriv Multipliers, which allow leveraged participation with a fixed maximum loss. This product enables clients to engage with short-term gold volatility without traditional margin requirements.
To assist with trade preparation and position monitoring, Deriv’s trading calculators help users determine contract size, margin requirements, and pip value for gold and other instruments. Additional tools available on all platforms include stop-loss and take-profit functions, allowing precise order management and capital allocation.

Is Japan’s new stimulus era fuelling the next global carry trade boom?
Japan’s expansionary fiscal stance and ultra-low interest rates could revive the global carry trade.
Yes - Japan’s expansionary fiscal stance and ultra-low interest rates could revive the global carry trade, according to analysts. With the yen falling to seven-month lows and USD/JPY with breakout above 151, traders are once again borrowing yen to chase higher-yielding assets. Tokyo now faces growing pressure to defend its currency as markets eye 155 as the next milestone. Unless the Bank of Japan (BoJ) pivots to a tighter policy or intervenes directly, yen-funded trades could keep powering global risk appetite through 2025.
Key takeaways
- USD/JPY hits a seven-month high above 151.00 amid renewed yen weakness and global risk-on sentiment.
- Sanae Takaichi’s pro-stimulus policies raise expectations of large-scale fiscal spending, delaying BoJ tightening.
- Carry trade activity resurges, as investors borrow yen cheaply to invest in higher-yield assets abroad.
- Tokyo warns of excessive volatility, but markets continue testing Japan’s intervention threshold.
- USD/JPY could test 155, barring a sharp BoJ shift or coordinated government intervention.
Japan fiscal stimulus 2025 and the yen’s slide
Japan’s political shift is driving fresh downward pressure on the yen. Following Sanae Takaichi’s election as the new leader of the Liberal Democratic Party (LDP), investors expect her government to boost public spending to support growth.
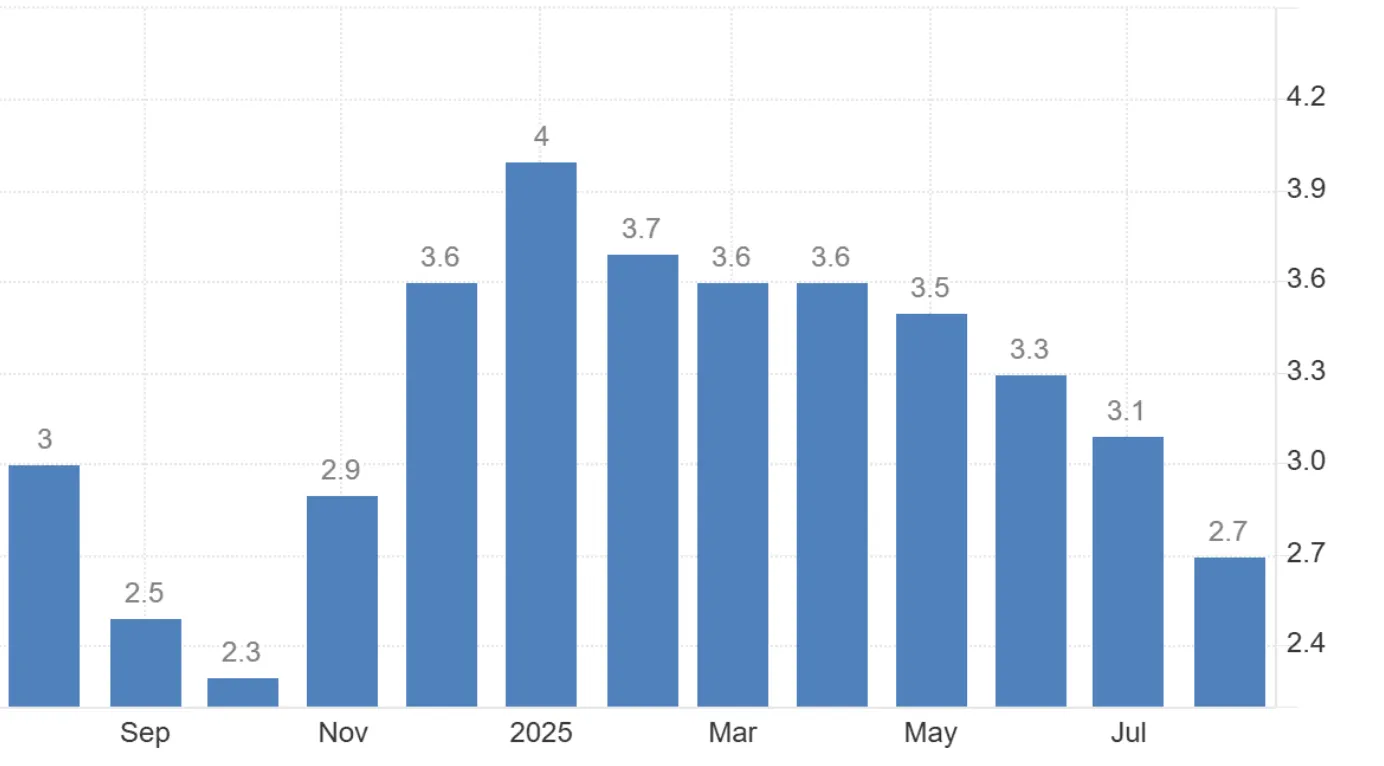
While this strategy could stimulate the economy, it raises fiscal sustainability concerns and complicates the BoJ’s inflation-control efforts. Japan’s inflation stood at 2.7% in August, still above the 2% target, suggesting policy should stay tight.
Japan’s Inflation rate
Yet, expectations are moving in the opposite direction: markets now see only a 26% chance of a BoJ rate hike by 30 October, down from 60% before Takaichi’s win.
Bank of Japan interest rates

This shift in outlook has made yen-denominated investments less appealing and fuelled capital outflows into higher-yielding markets, accelerating the currency’s decline.
The Japanese yen carry trade infocus as Takaichi Jolts Markets
The carry trade is back at the centre of market attention. With Japan’s rates anchored near zero, traders are borrowing yen to buy assets in economies with higher yields - such as the U.S. or Australia.
This strategy flourishes when global risk appetite is high, and 2025’s rally in equities has provided the perfect backdrop. The Nasdaq, S&P 500, and Japan’s Nikkei 225 all reached fresh record highs recently, reflecting broad investor confidence. That same optimism has eroded the yen’s safe-haven demand, reinforcing its role as the world’s go-to funding currency.
The dynamic mirrors the mid-2000s carry trade boom, when yen weakness fuelled speculative investment worldwide - until a sudden BoJ policy shift reversed the trend. For now, however, Japan’s dovish monetary stance and fiscal expansion are keeping the strategy alive.
Trading insight: Carry trades are profitable when volatility is low and interest-rate spreads are wide - but they can unwind violently when sentiment shifts. Learn more about trading in turbulent markets in our guide to market volatility.
Tokyo’s dilemma: intervene or tolerate the slide
Japan’s Ministry of Finance is caught in a familiar bind. With USD/JPY now above 151, traders are watching for signs of government intervention - historically triggered when the pair approaches 150–152.
Finance Minister Katsunobu Kato has reiterated Japan’s readiness to counter “excessive volatility,” but the market remains sceptical. Interventions are costly and short-lived unless backed by monetary policy alignment. With Takaichi’s administration leaning toward fiscal expansion, verbal warnings alone are unlikely to stop yen selling.
That leaves Tokyo with two options: intervene directly, risking limited success, or wait and hope the market stabilises - a risky call as speculative positioning tilts heavily toward USD/JPY longs.
The U.S. factor: a resilient dollar despite headwinds
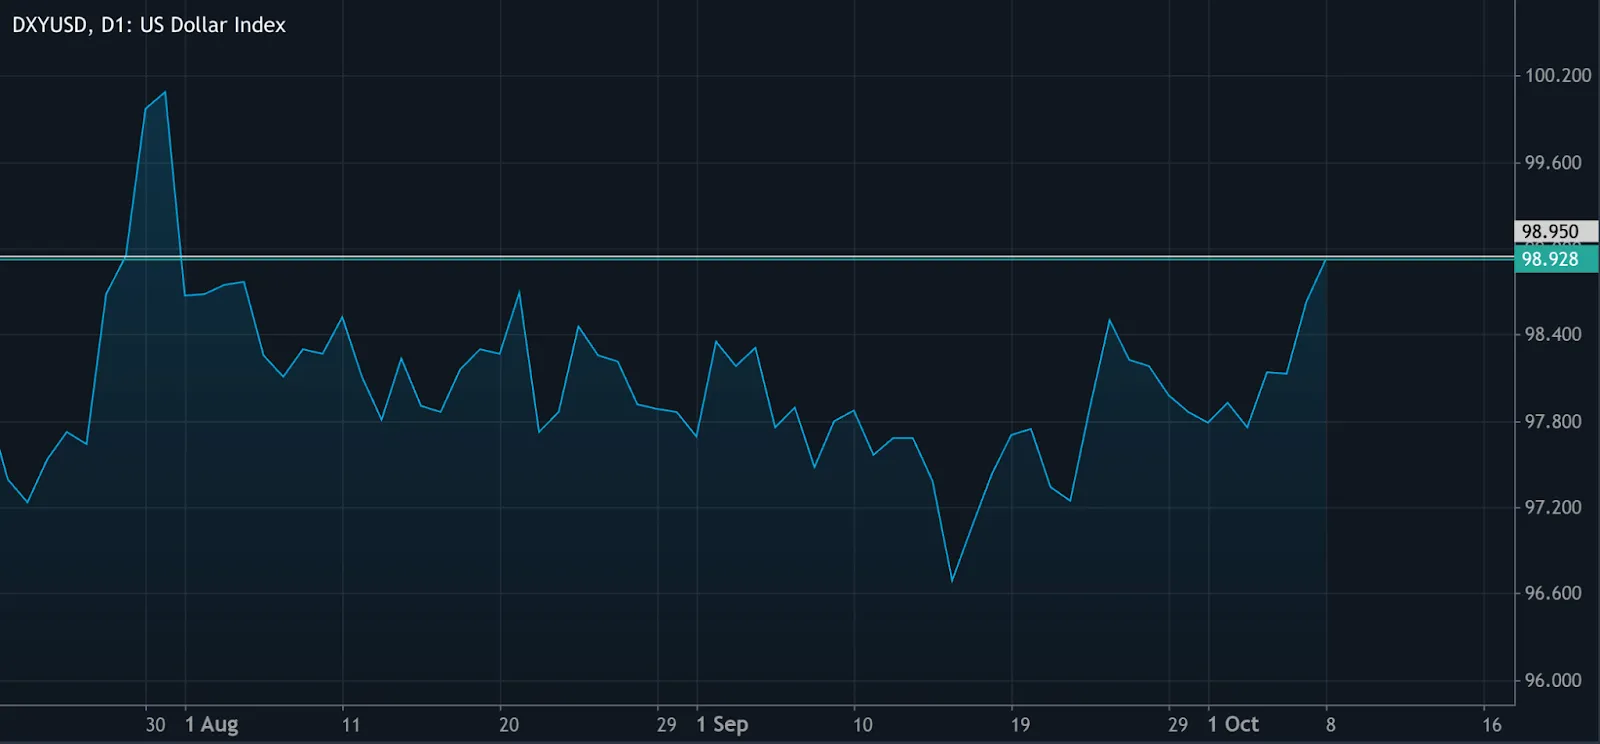
The U.S. dollar remains firm even amid domestic challenges. Despite the ongoing government shutdown and expectations of Federal Reserve rate cuts - with markets pricing a 95% probability of a 25 bps cut in October and 84% in December - the dollar continues to benefit from safe-haven demand.
The DXY Index is holding above 98, reflecting the market’s view that U.S. assets remain more stable than Japan’s.
The result: even a softening dollar appears strong relative to the yen, keeping USD/JPY well supported.
Until the Fed accelerates easing or the BoJ tightens, the yield gap between the two economies will continue to anchor yen weakness.
What could change the trend?
Several triggers could reverse or slow the yen’s decline:
- BoJ policy pivot: A hawkish statement or surprise rate hike could shock markets and lift the yen.
- Coordinated intervention: Joint action by the Ministry of Finance and the BoJ could produce a sharper, more lasting rebound.
- Global risk-off event: A major equity correction or geopolitical flare-up could restore safe-haven demand.
- Faster U.S. rate cuts: A dovish Fed could narrow yield differentials and curb USD/JPY momentum.
Without one of these catalysts, however, the yen’s weakness looks set to continue.
USD JPY technical insights: USD/JPY eyes 155
At the time of writing, buy pressure is evident on the daily chart, with the pair in price discovery mode around 152.36. Volume data shows buyer dominance, and sellers have not yet shown enough conviction to challenge the trend.
If selling pressure builds, a yen comeback could trigger a pullback toward the 147.10 and 146.24 support levels. However, if bullish momentum persists, USD/JPY could extend its rally toward 155, marking a potential new high for 2025.
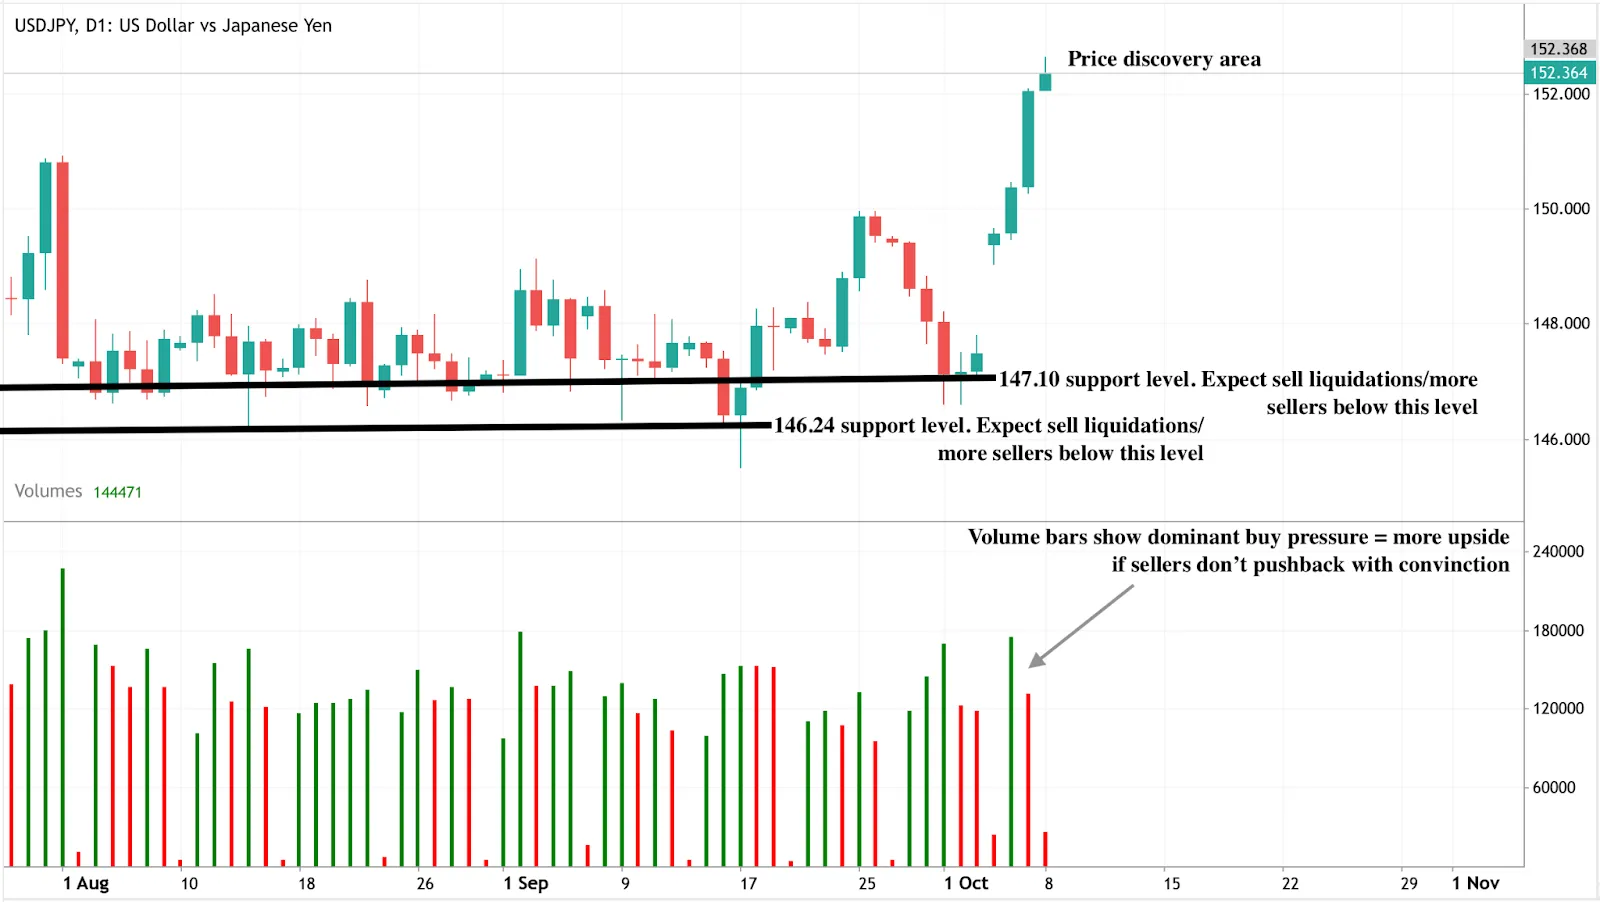
Technical takeaway: The trend remains bullish, but heightened volatility near intervention levels means traders should manage position size, margin usage, and leverage exposure carefully.
Traders can monitor these USD/JPY levels using Deriv MT5’s advanced charting tools for precise entry and exit timing.
Yen Investment implications
For traders, policy divergence remains the key theme driving USD/JPY.
- Short-term strategies: Buying on dips may remain favourable as long as 151 holds as support, but traders should monitor Tokyo’s rhetoric closely.
- Medium-term positioning: Maintaining flexibility may be favourable - intervention or policy surprises could trigger sharp reversals.
- Cross-market impact: The return of the carry trade extends beyond FX, potentially boosting global equity and bond flows funded by cheap yen borrowing.
Our forex trading calculator can help determine optimal position sizing, margin requirements, and potential returns for carry-trade strategies.
Unless Japan tightens policy soon, 2025 could mark the full return of the global carry trade - and a prolonged period of yen weakness.

Gold price forecast 2025: Will gold break $4,000 and redefine trust in money?
With central-bank buying, ETF inflows, and a clear de-dollarisation push, gold has become the ultimate “trust hedge” in 2025.
Gold is closing in on the $4,000 mark, trading around $3,970 per ounce - its highest level in history. The rally, up more than 50% year-to-date, reflects a deeper global trend: investors are moving away from paper money and toward tangible value. With central-bank buying, ETF inflows, and a clear de-dollarisation push, gold has become the ultimate “trust hedge” in 2025.
Key takeaways
- Gold has surged 50% YTD, testing $3,970 USD/oz, its strongest finish ever.
- Central-bank purchases: ~80 tonnes per month (World Gold Council, 2025).
- ETF inflows: +200 tonnes in H1 2025 (Bloomberg Financial LP).
- Fed rate-cut probability: 94.6 % (CME FedWatch Tool).
- UBS target: $4,200; Goldman Sachs: $4,900 by 2026.
- Macro theme: De-dollarisation and declining trust in fiat money.
Gold’s record rally - what’s driving it
Gold’s 2025 rally began in March, when prices broke the $3,000 mark, then $3,500 in April, and $3,800 by September. Each breakout has been supported by consistent ETF inflows and central-bank demand, which together are creating structural buying pressure.
Bloomberg data shows gold-backed ETFs expanded by 200 tonnes in the first half of 2025 — the biggest jump since 2020. Traders also increased bullish exposure to the SPDR Gold Shares ETF, reinforcing institutional momentum.
Meanwhile, lower interest rates have made gold more attractive relative to yield-bearing assets. The U.S. Federal Reserve’s 25-bps cut in September, and expectations of another in October, continue to weaken the dollar and fuel demand for safe-haven assets.
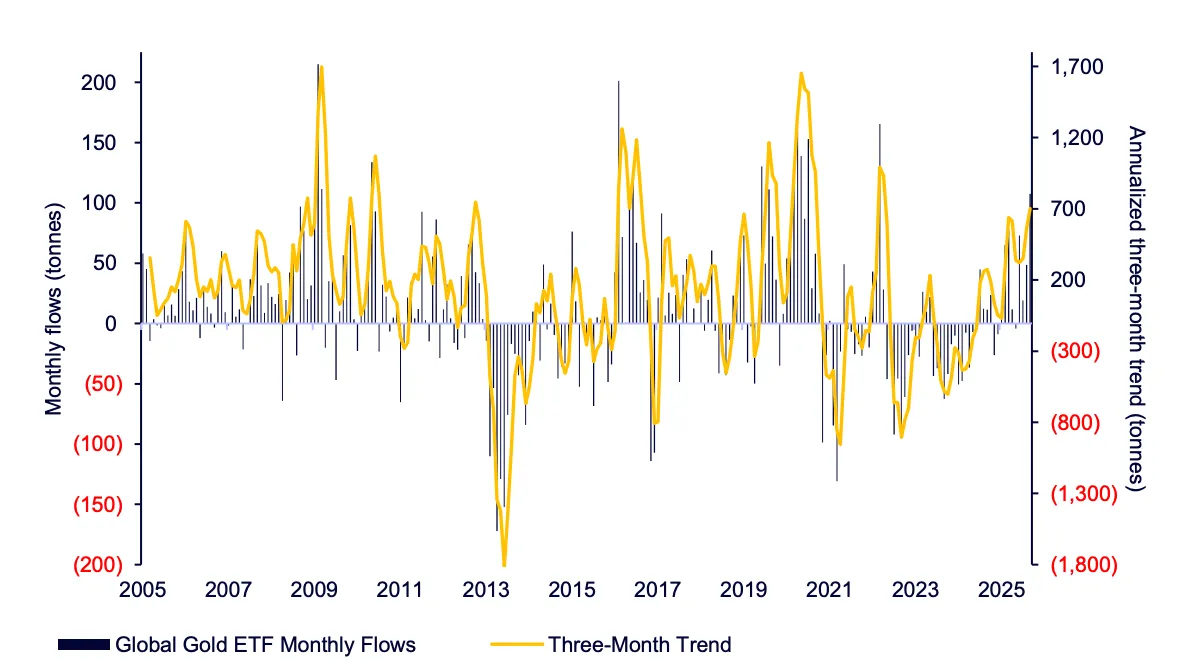
Central bank gold buying: De-dollarisation impact on gold
World Gold Council (WGC) data shows central banks across Asia, the Middle East, and Latin America are buying gold at a record pace — averaging 80 tonnes per month this year.
Goldman Sachs forecasts 70–80 tonnes/month of central-bank demand to continue into 2026, signalling a long-term rebalancing of reserves away from the U.S. dollar.
Gold as a percentage of total reserve holdings across select central banks
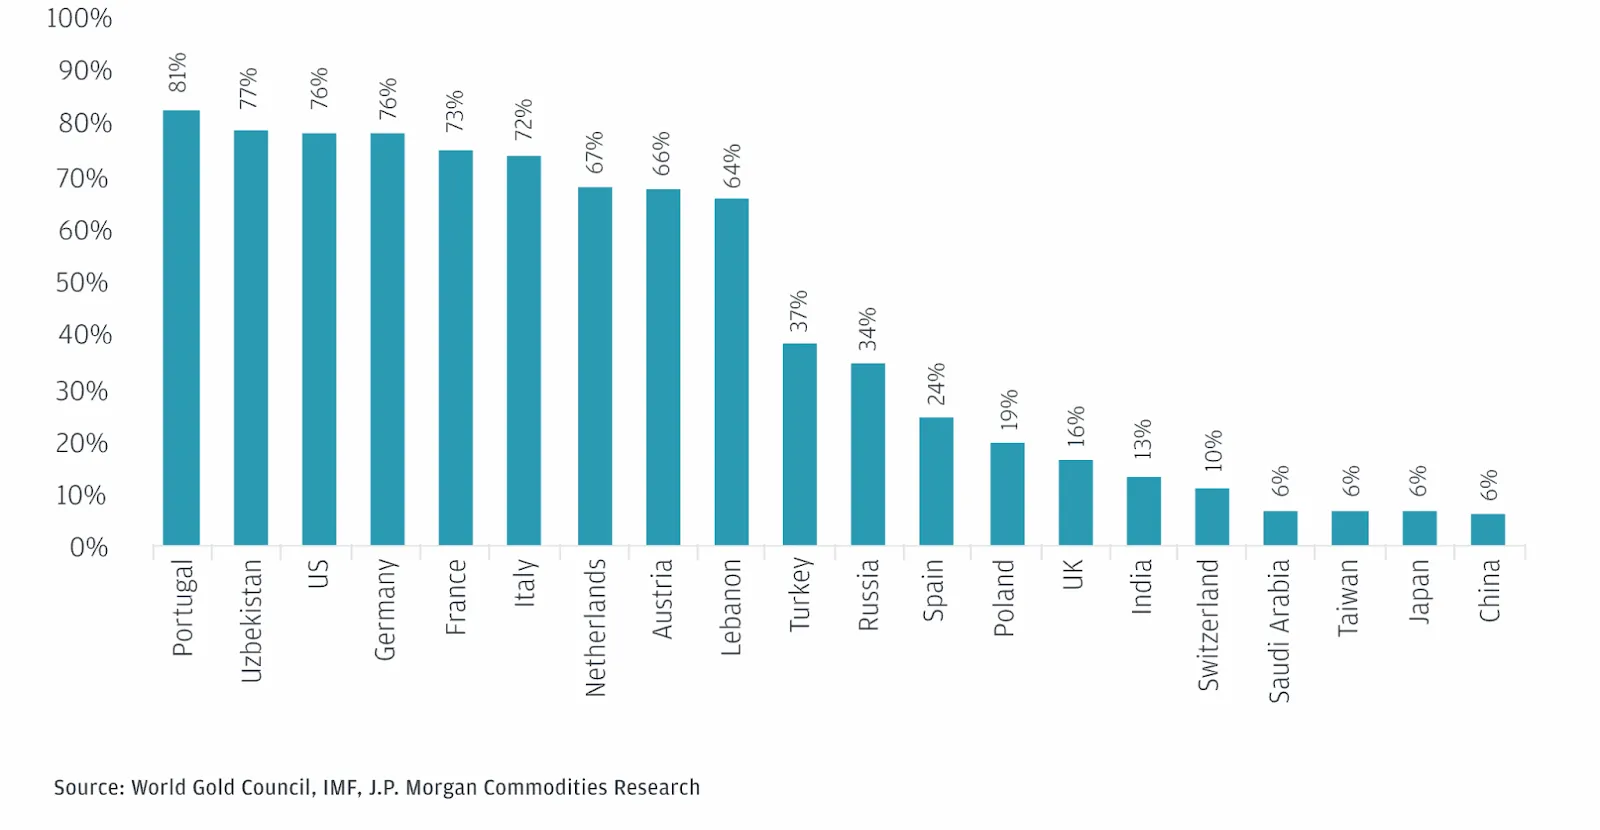
This shift forms part of a broader de-dollarisation trend, as emerging economies hedge against fiscal volatility and geopolitical shocks. Western institutional investors are following suit, using gold as a stability anchor amid global uncertainty.
JP Morgan notes that CBs haven’t been the only ones increasing their relative share of gold holdings over the last couple of years. In the financial gold markets, investors’ futures positioning remains long, with an expectation that the price will rise in value in the future. Non-commercial futures and option long positions in COMEX gold - the primary futures and options market for trading metals - reached a new high in 2024 in real terms.
The macro backdrop: trust under pressure
The U.S. government shutdown in September halted official economic data, forcing markets to rely on private estimates. ABC News reports that this disruption could shave up to 2.4 percentage points off Q4 GDP if prolonged.
Amid data blackouts, the Federal Reserve faces higher uncertainty, driving markets to favour stable assets like gold.
In Europe and Asia, higher bond yields, fiscal strain, and political volatility have further strengthened the narrative that gold is not just an inflation hedge — it’s a trust hedge.
Is $4,000 a ceiling or just a checkpoint?
Analysts are divided.
- UBS forecasts $4,200 by year-end.
- Goldman Sachs raised its 2026 target to $4,900.
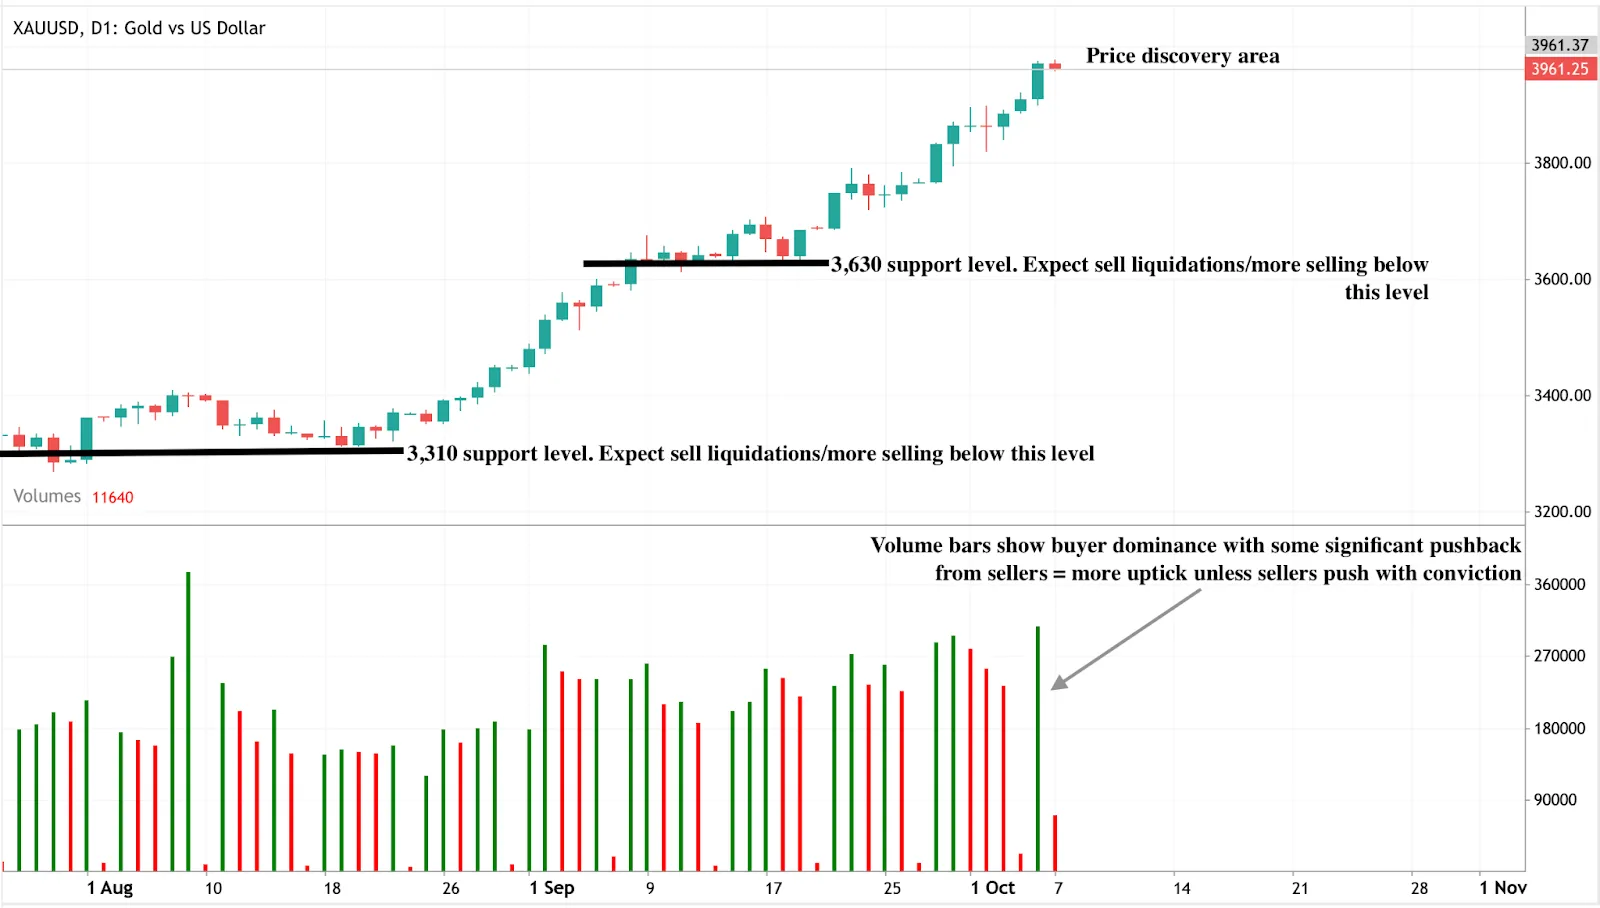
Technical data from Deriv MT5 shows strong buying volume, though near-term consolidation around $3,970–$4,000 is possible. If buyers hold this zone, a breakout could push gold toward $4,200+. Support levels remain firm at $3,630 and $3,310.
Gold technical levels (Deriv MT5 daily chart)
From fear trade to faith trade
Gold’s 2025 surge is not a reaction to panic - it’s a re-pricing of faith. As one strategist put it: “This isn’t a crisis move. It’s the market admitting that paper promises have limits.”
Persistent inflation, growing deficits, and geopolitical instability have weakened confidence in fiat systems. Gold has become the new benchmark for financial credibility, serving as both a safe haven and a strategic reserve asset.
How to trade gold on Deriv
Step 1: Choose your platform
Select the Deriv platform that fits your trading style:
- Deriv MT5 – for CFD-based exposure with advanced charting and professional analysis tools.
- Deriv Trader – for fixed-time trades with a simplified, intuitive interface.
- Deriv cTrader – for deep liquidity, high-speed execution, and professional-grade order management.
Step 2: Select your instrument type
Pick the product that matches your trading goals:
- CFDs (Contracts for Difference) – trade rising or falling gold prices with leverage.
- Multipliers – control larger positions with smaller capital, while limiting downside.
- Fixed-time contracts – speculate on short-term price moves with predefined payouts.
Step 3: Apply risk management
Protect your capital before entering a trade:
- Set stop-loss and take-profit orders.
- Calculate position size based on your risk tolerance using Deriv’s trading calculator.
- Practise strategies in demo mode before going live.
Step 4: Execute your trade
Once prepared, place your gold trade on your chosen Deriv platform. Monitor open positions, review margin usage, and adjust orders as price action unfolds.
Gold technical insights: Where is gold headed?
Goldman Sachs projects that gold could reach $4,000 per ounce by mid-2026 and $4,900 by December 2026.
J.P. Morgan, on the other hand, expects gold to average $3,675 per ounce in Q4 2025, to approach $4,000 by Q2 2026, driven largely by central bank purchases and persistent market uncertainty. Notably, bullish analysts forecast possible prices as high as $10,000 per ounce by 2030 if current trends continue, though this scenario depends on ongoing global economic fragility and geopolitical instability.
Some technical indicators suggest gold is in "extremely overbought" territory, making short-term price corrections possible before further gains. Key support levels are now above $3,800, with resistance at around $3,900 and $4,000, and downside risk if central bank demand slows or geopolitical tensions ease.
Sorry, we couldn’t find any results matching .
Search tips:
- Check your spelling and try again
- Try another keyword