結果

美國失業救濟申請激增,黃金下滑:訊號還是雜音?
美國失業救濟申請激增至231,000,創近兩個月新高,較預期多出近20,000人,導致黃金價格走軟。
美國失業救濟申請激增至231,000,創近兩個月新高,較預期多出近20,000人,導致黃金價格走軟。表面上看,較弱的勞動數據本應提升黃金的避險吸引力,但現貨價格當日卻下跌超過2%,突顯經濟壓力訊號與市場布局之間日益擴大的脫節。
這種背離之所以重要,是因為勞動數據仍是Federal Reserve最敏感的政策依據。隨著職缺降至五年新低,招聘依然低迷,交易員開始質疑黃金究竟是在盤整,還是錯判了下一個宏觀轉折。
是什麼推動黃金與美國失業救濟申請?
初領失業救濟申請的增幅雖大,但並不單純。單週申請人數激增22,000人,為去年12月初以來最大增幅,遠高於經濟學家預期的212,000人。
嚴重的冬季風暴扭曲了地區就業數據,導致賓夕法尼亞州、紐約州、新澤西州及中西部地區的申請人數大幅增加。年末招聘週期的季節性調整問題進一步增加了雜音。
然而,整體勞動市場在波動之下確實出現實質走弱。12月職缺降至654萬,為2020年9月以來最低,11月數據也被大幅下修。
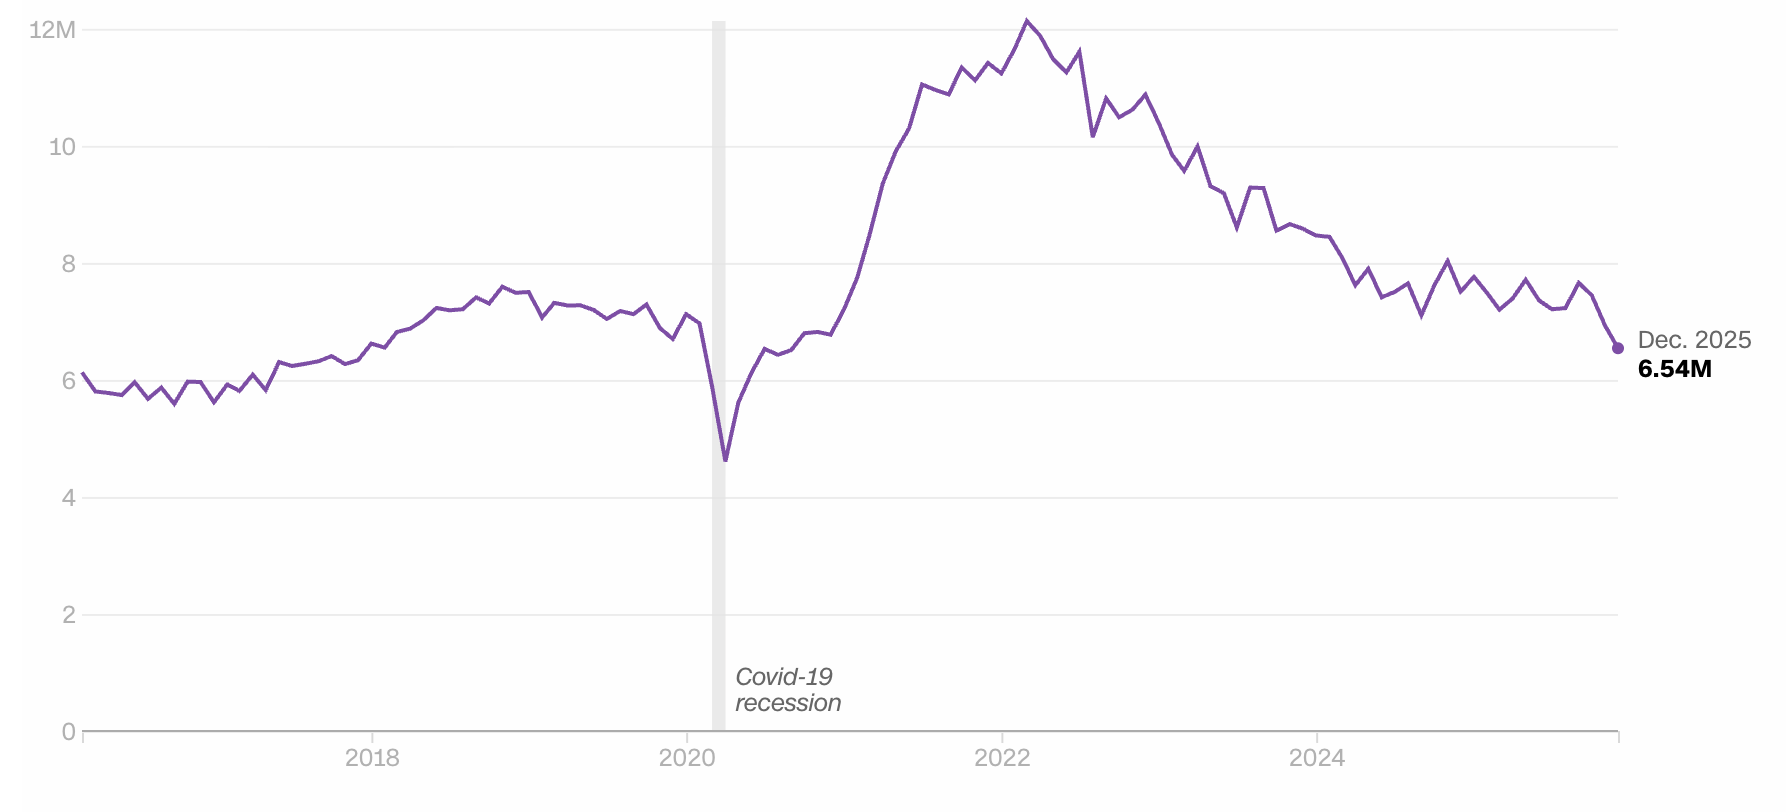
招聘略有改善,但仍處於歷史低位,印證經濟學家所說的「低聘、低裁」勞動市場。這種組合意味著動能降溫,而非徹底衰退——這一細微差異正是黃金交易員仍在消化的重點。
為什麼這很重要
勞動市場趨勢直接影響利率預期,這也解釋了黃金反應平淡的原因。雖然失業救濟申請意外上升,但持續申請人數仍處於歷史低位,四週均值也顯示穩定而非壓力。
正如High Frequency Economics的Carl Weinberg所言:「目前還沒有出現我們預期在經濟衰退初期會看到的大規模裁員跡象。」
對Federal Reserve而言,這些數據不足以迫使其立即調整政策。Oxford Economics的Bernard Yaros指出,天氣干擾和數據不連貫性限制了單一申請報告的訊號價值,並補充目前尚無任何因素改變Fed近期的決策。若利率預期未明顯轉向,黃金就缺乏其通常依賴的宏觀催化劑。
對黃金市場的影響
市場觀察人士指出,黃金在申請數據公布後下跌,反映的是市場布局而非基本面。數據公布後,現貨價格在每盎司4,860美元附近徘徊,儘管勞動數據弱於預期。這一反應顯示,交易員更重視美元韌性與利率穩定,而非經濟疲弱的表面現象。
同時,職缺下滑與薪資數據延遲也帶來不確定性,這是黃金市場難以長期忽視的。如果接下來的就業報告證實經濟放緩——而非僅是天氣雜音——黃金本輪回調或許只是暫時。歷史上,黃金對趨勢確認的反應遠大於對單一衝擊,尤其當貨幣政策信譽受到考驗時。
專家展望
多數經濟學家預計,隨著利率壓力減輕帶動需求,勞動市場狀況將於2026年前逐步改善,近期減稅措施也提供支撐。這一展望限制了黃金的短線上行空間,因為這意味著近期不會有激進的Fed寬鬆政策。
不過,風險仍然不對稱。職缺下滑速度快於失業率上升,這種模式往往預示更廣泛的勞動市場疲軟。由於一月非農就業報告因政府關門而延遲,黃金交易員面臨數據真空,一旦訊息明朗,波動性可能加劇。下一份明確的就業動能報告或將成為關鍵。
重點摘要
美國失業救濟申請大幅上升,但訊號仍受天氣與季節性因素干擾。黃金回調反映的是市場謹慎,而非對其避險屬性的否定。隨著職缺下滑與薪資數據延遲,下一份勞動數據將格外重要。交易員應等待確認,而非僅憑標題判斷黃金下一步走勢。
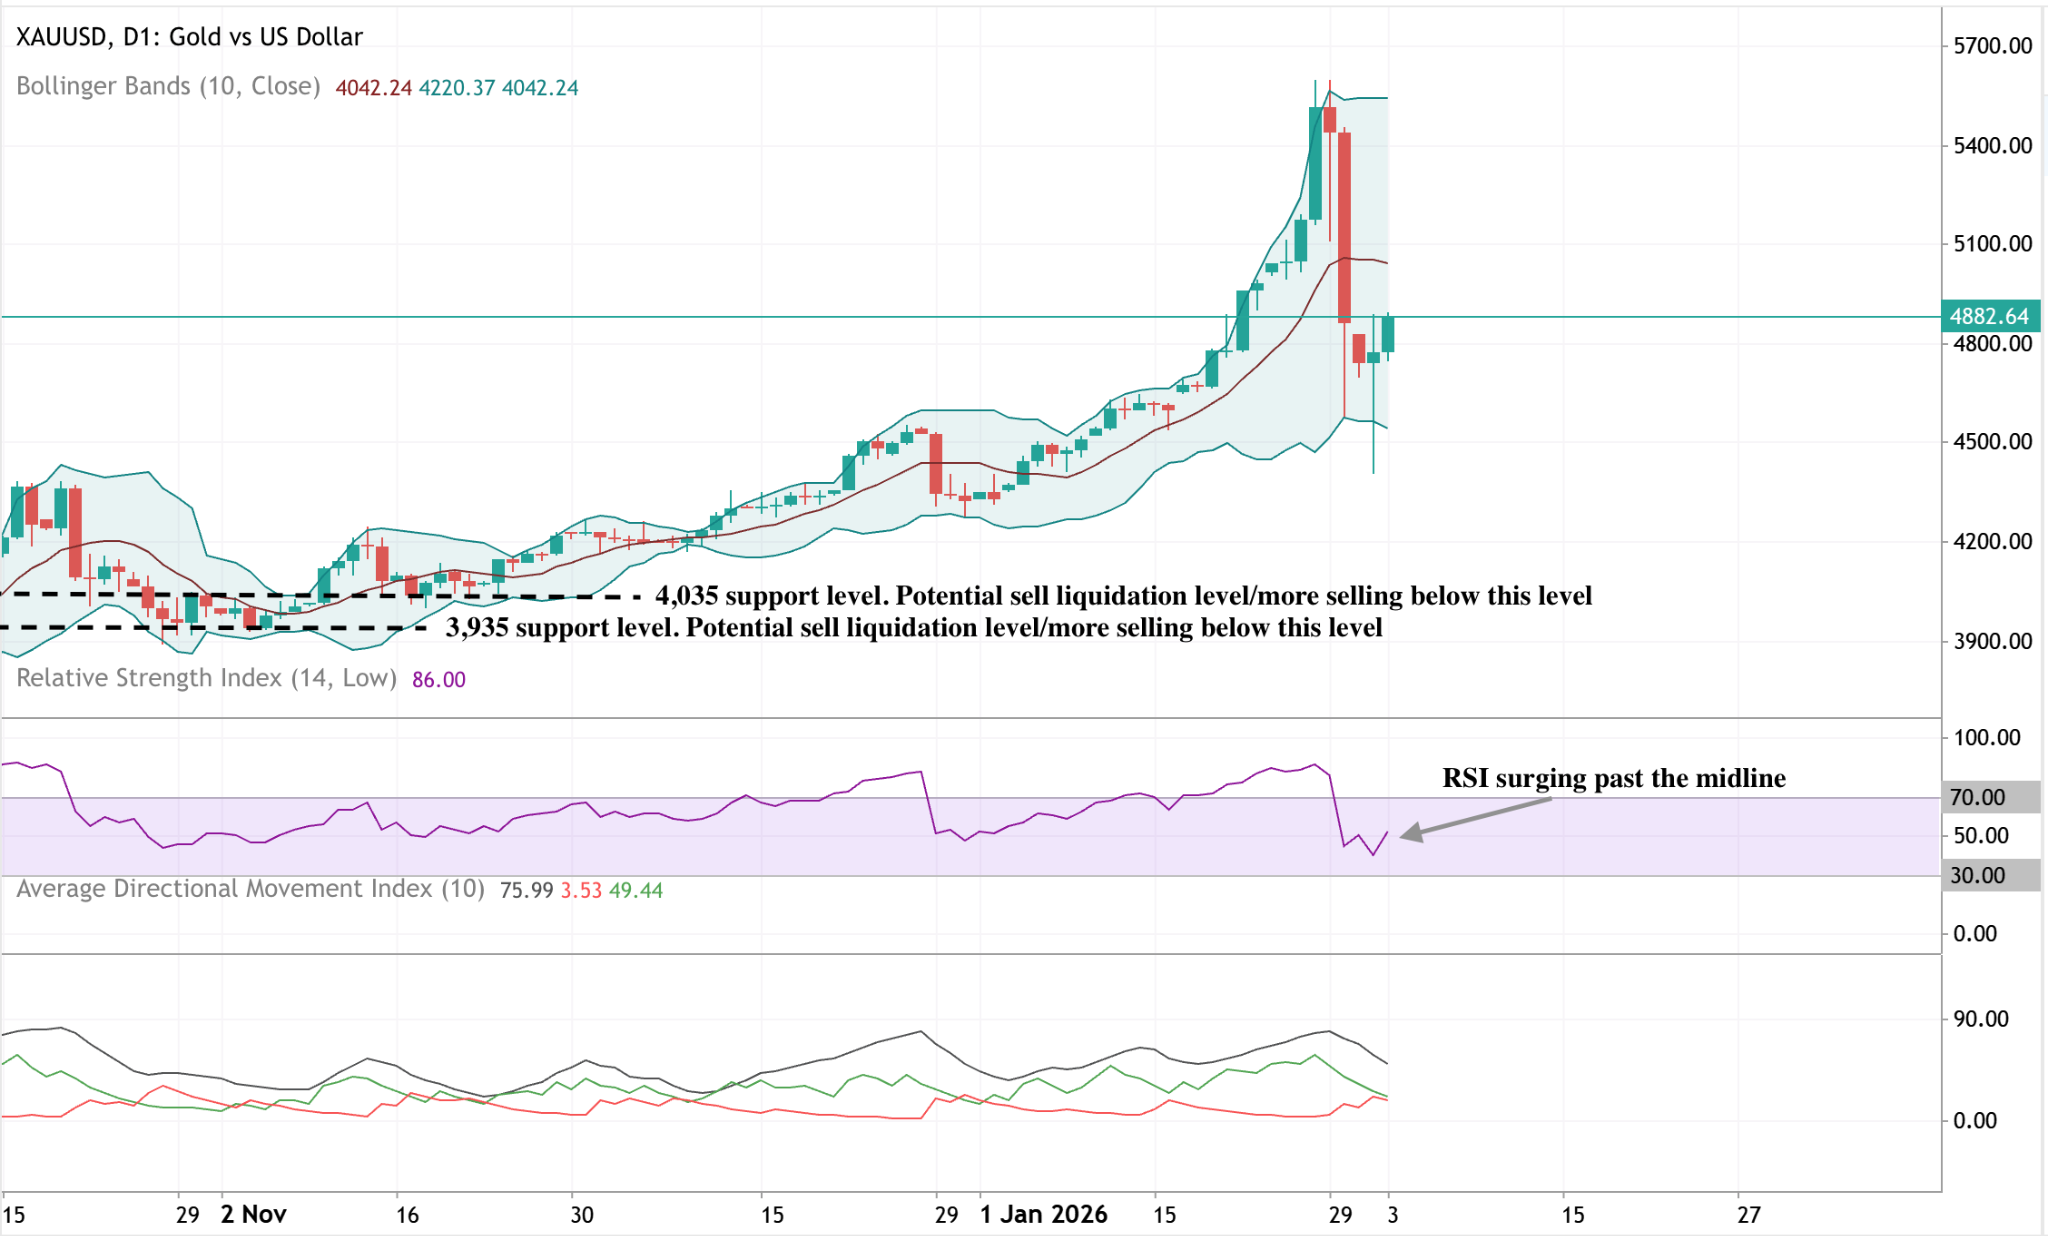
黃金技術展望
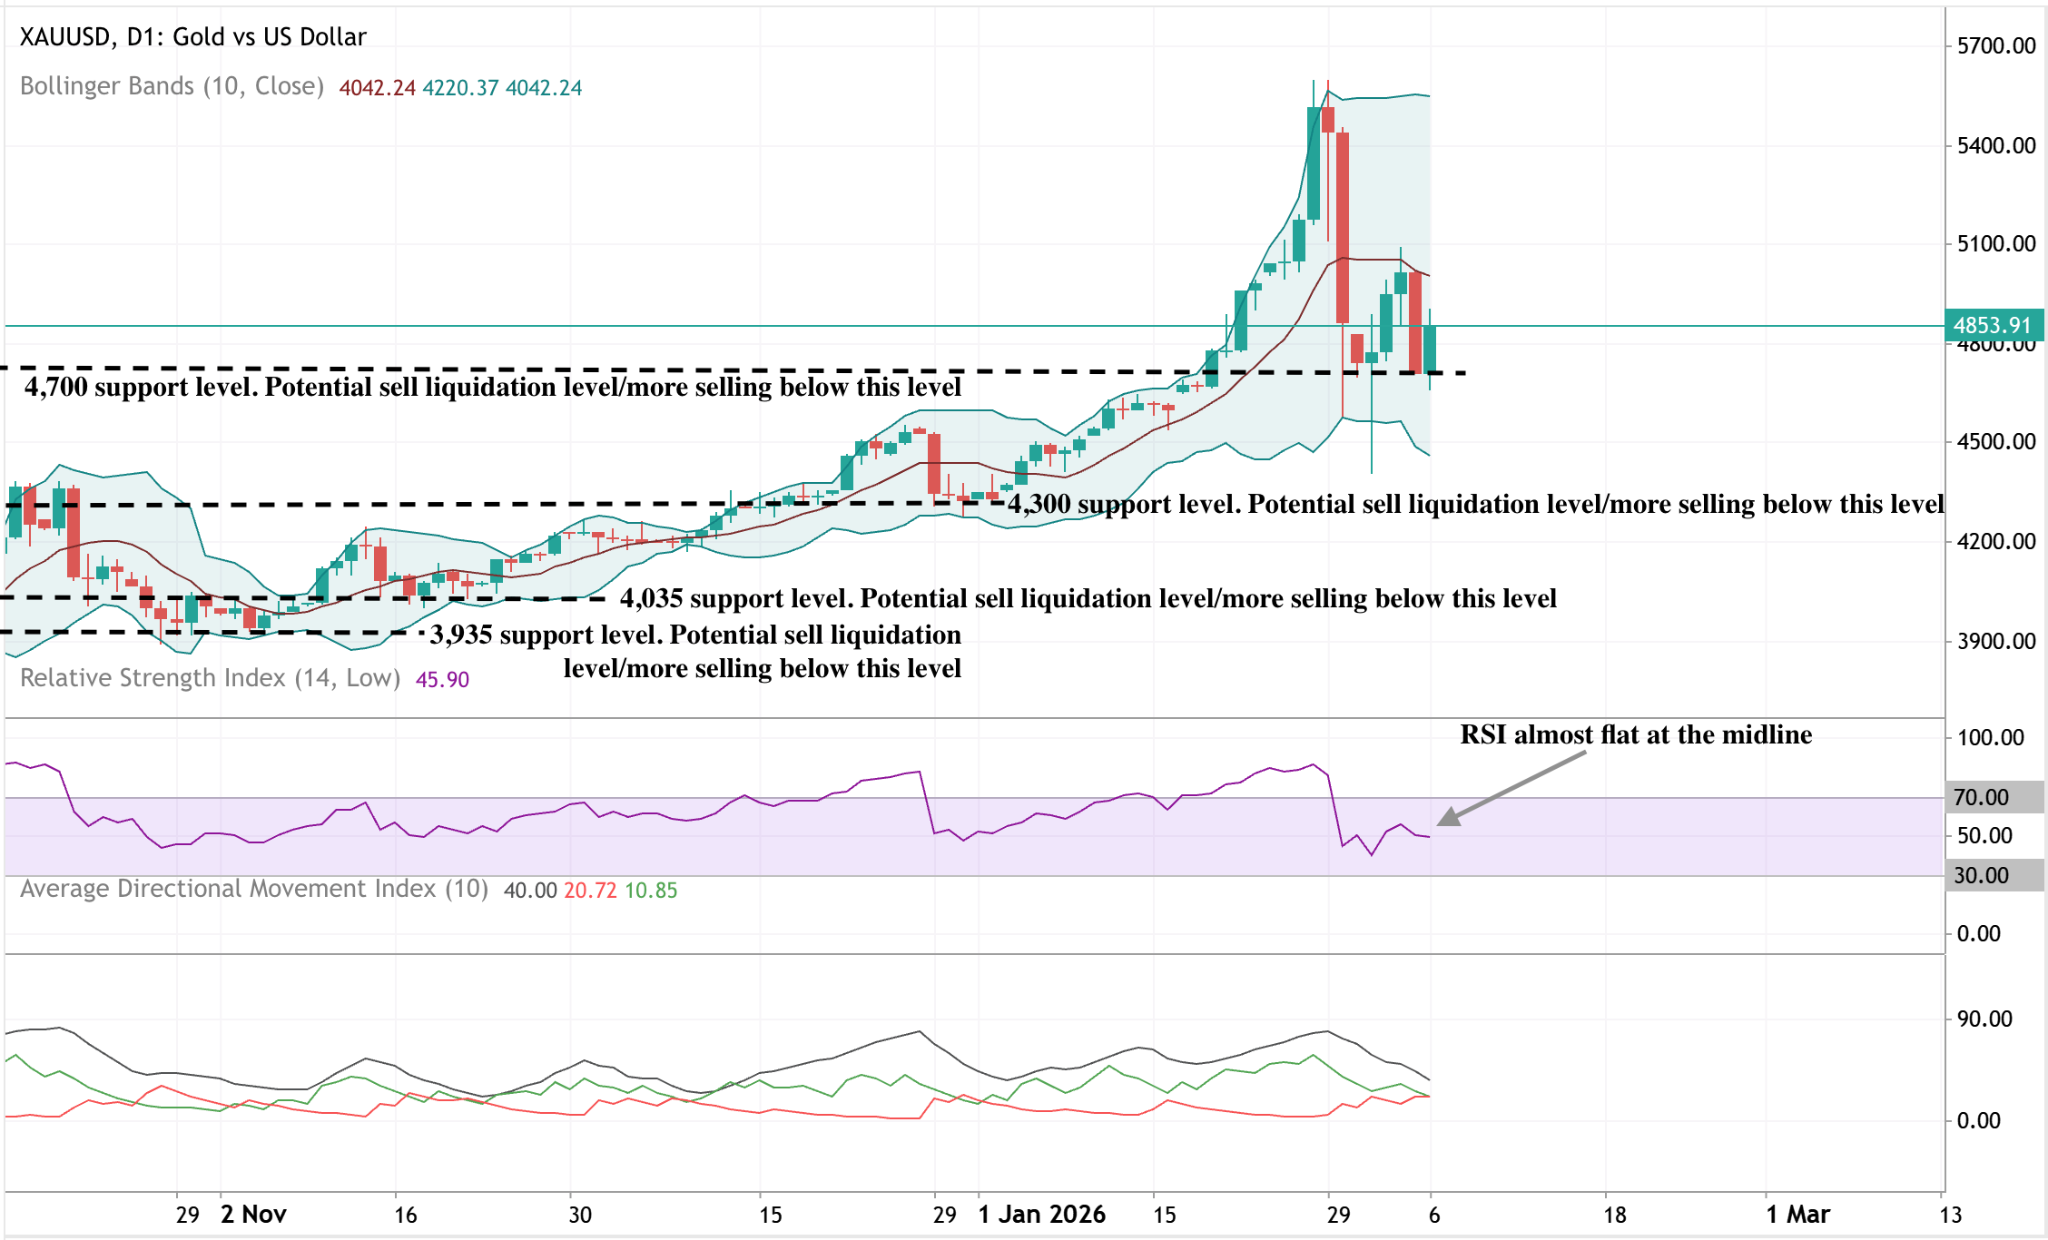
黃金在大幅上漲創新高後進入盤整,目前價格在4,850美元區間震盪,經歷劇烈回調後波動加劇。Bollinger Bands依然大幅擴張,顯示儘管近期價格波動有所緩和,整體波動性仍高。
動能指標呈現中性:RSI在觸及超買後回落至中線附近,反映多空動能趨於平衡。趨勢強度自極端水準回落,ADX讀數低於加速階段,顯示市場正由強勢單邊轉向盤整。
結構上,價格仍遠高於先前的盤整區間4,300、4,035及3,935美元,凸顯前波漲勢的規模。

比特幣下跌40%:為何分析師質疑會有80%的崩盤
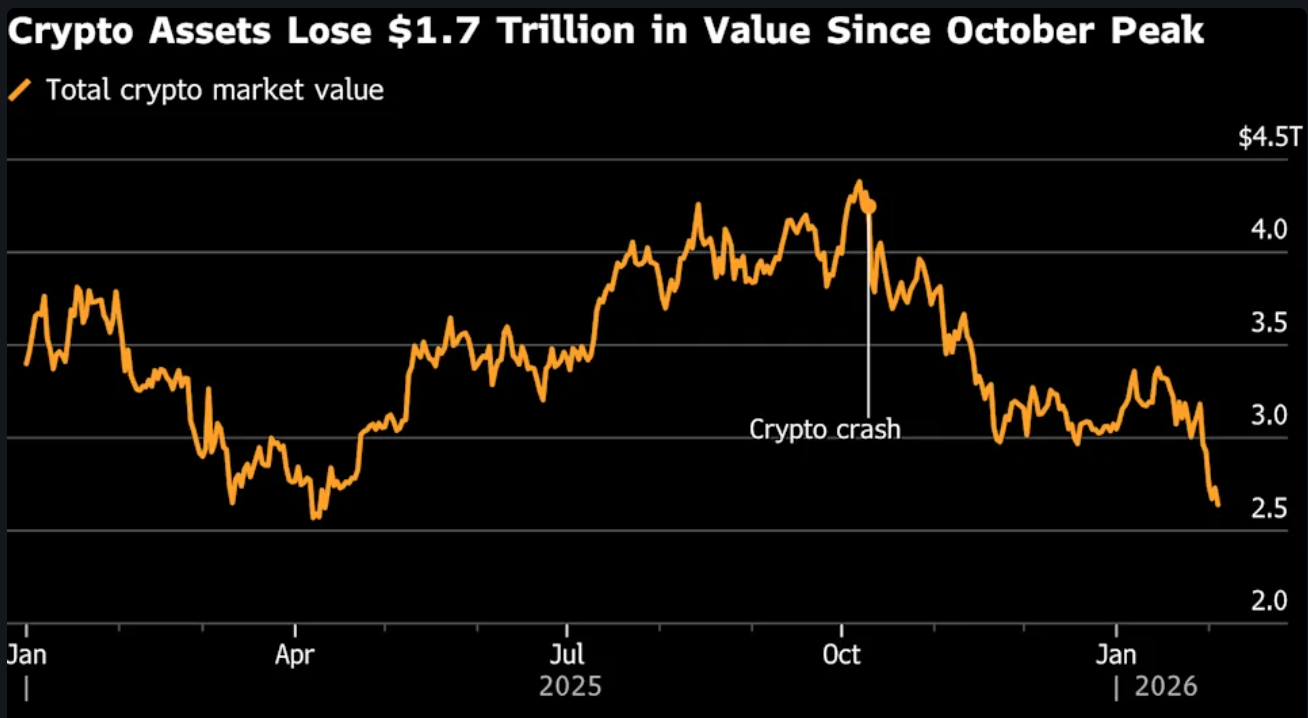
比特幣價格自十月高點下跌約40%,動搖了市場,並重新引發對另一場嚴酷加密寒冬的擔憂。
比特幣價格自十月高點下跌約40%,動搖了市場,並重新引發對另一場嚴酷加密寒冬的擔憂。最新一波下跌包括一週內下挫11%,隨著全球市場轉為避險,數位資產與波動劇烈的美國股票一同下跌。對許多投資者來說,這一走勢讓人感到不安地熟悉。
市場關注的焦點在於比特幣的四年週期,過去的下行階段曾出現高達80%的崩跌。然而,K33的分析師認為,這次的拋售缺乏以往崩盤時的結構性壓力。由於強制平倉已大致出清,機構買家現已深度參與,問題已不再是比特幣是否下跌,而是這次的下跌是重置,還是更嚴重情況的開始。
是什麼推動了比特幣近期的拋售?
比特幣的下跌伴隨著全球風險偏好轉變。股市再度波動,科技股領跌,投資者重新評估成長預期與估值風險。加密貨幣與美國股票的聯動性日益增強,資金轉向避險資產時,加密市場也走上同一路徑。
槓桿效應加劇了這波走勢。僅數日內,加密市場超過17億美元的槓桿多頭部位被強制平倉。
資金費率急劇轉為負值,顯示交易者急於退出多頭部位。歷史上,這種情況常出現在市場壓力時期,但也往往在過度樂觀已被市場消化後出現。
為什麼這很重要
對新進投資者而言,劇烈回檔常引發恐慌性拋售。比特幣過去週期的崩盤讓市場習慣於一旦動能破裂就會出現災難性下跌。這種行為記憶本身就可能加深拋售,即使基本面條件已經不同。
K33的分析師認為,這一週期缺乏2018年和2022年那種被迫賣出的情況。當時的熊市由連鎖失敗引發——從Terra-Luna到FTX——導致保證金追繳與無差別平倉。「導致80%崩盤的結構如今並不存在,」該公司在最新報告中指出。
對加密市場與股票的影響
這波拋售已遠超比特幣本身。加密相關股票遭遇重挫,投資者重新評估整個生態系統的曝險。持有比特幣最多的上市公司Strategy單日下跌超過5%,六個月來累計跌幅近70%。
礦業股跌幅更甚。轉型至高效能運算與AI基礎設施的公司也未能倖免。HUT 8下跌8%,Core Scientific近9%,IREN重挫17%。正如Nansen的Aurelie Barthere所言:「加密貨幣與美國股票的相關性再次轉為正向,兩者同步下跌,」強化了比特幣對宏觀波動的敏感度。
專家展望
K33將74,000美元視為關鍵支撐區。若明確跌破,可能會回測2021年高點約69,000美元,甚至是長期均價約58,000美元。儘管這些價位看似嚇人,分析師指出比特幣已經承受了大量平倉壓力,卻未出現系統性風險。
現貨比特幣ETF的出現悄然改變了市場動態。養老基金與長線配置者如今佔據越來越多的需求份額,減緩了過去週期中常見的反射性拋售。短期內走勢或仍波動,但分析師越來越多地將這次回檔視為結構性修正,而非週期終結式崩盤。
重點摘要
比特幣40%的跌幅讓人回想起過去週期的崩盤,但市場結構已發生重大變化。被迫賣家大多已不復存在,槓桿已經出清,機構需求則透過ETF深植市場。波動性或將持續,但分析師越來越傾向將這次回檔視為重置而非崩潰。接下來需關注ETF資金流、股市穩定性,以及關鍵支撐區是否守住。
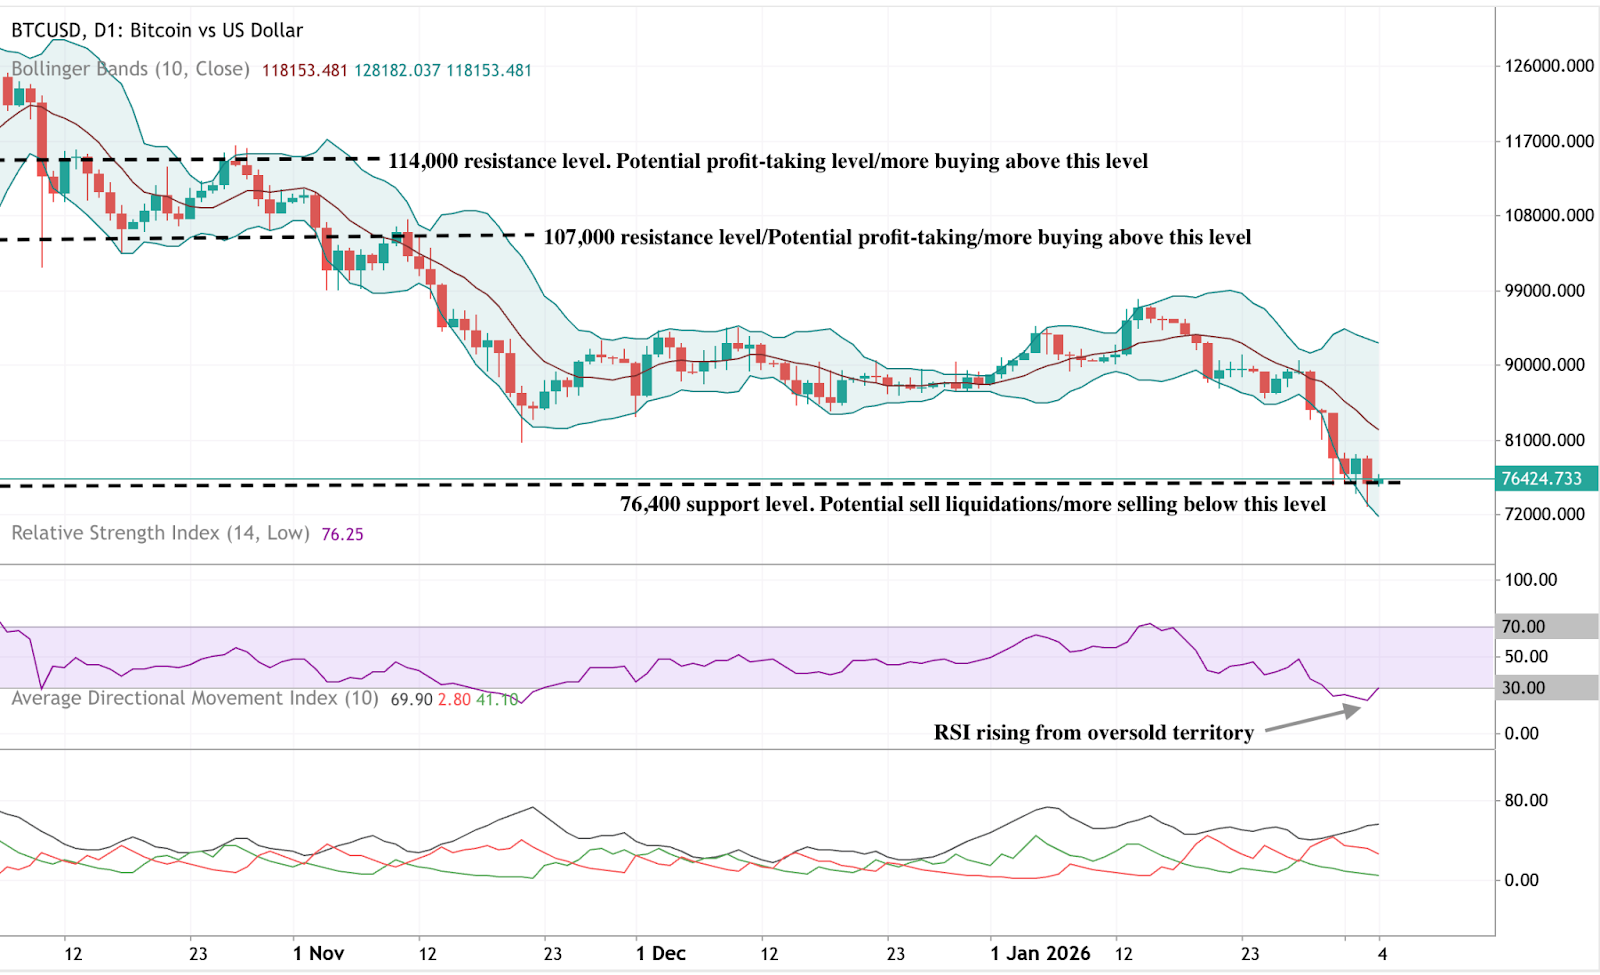
比特幣技術面展望
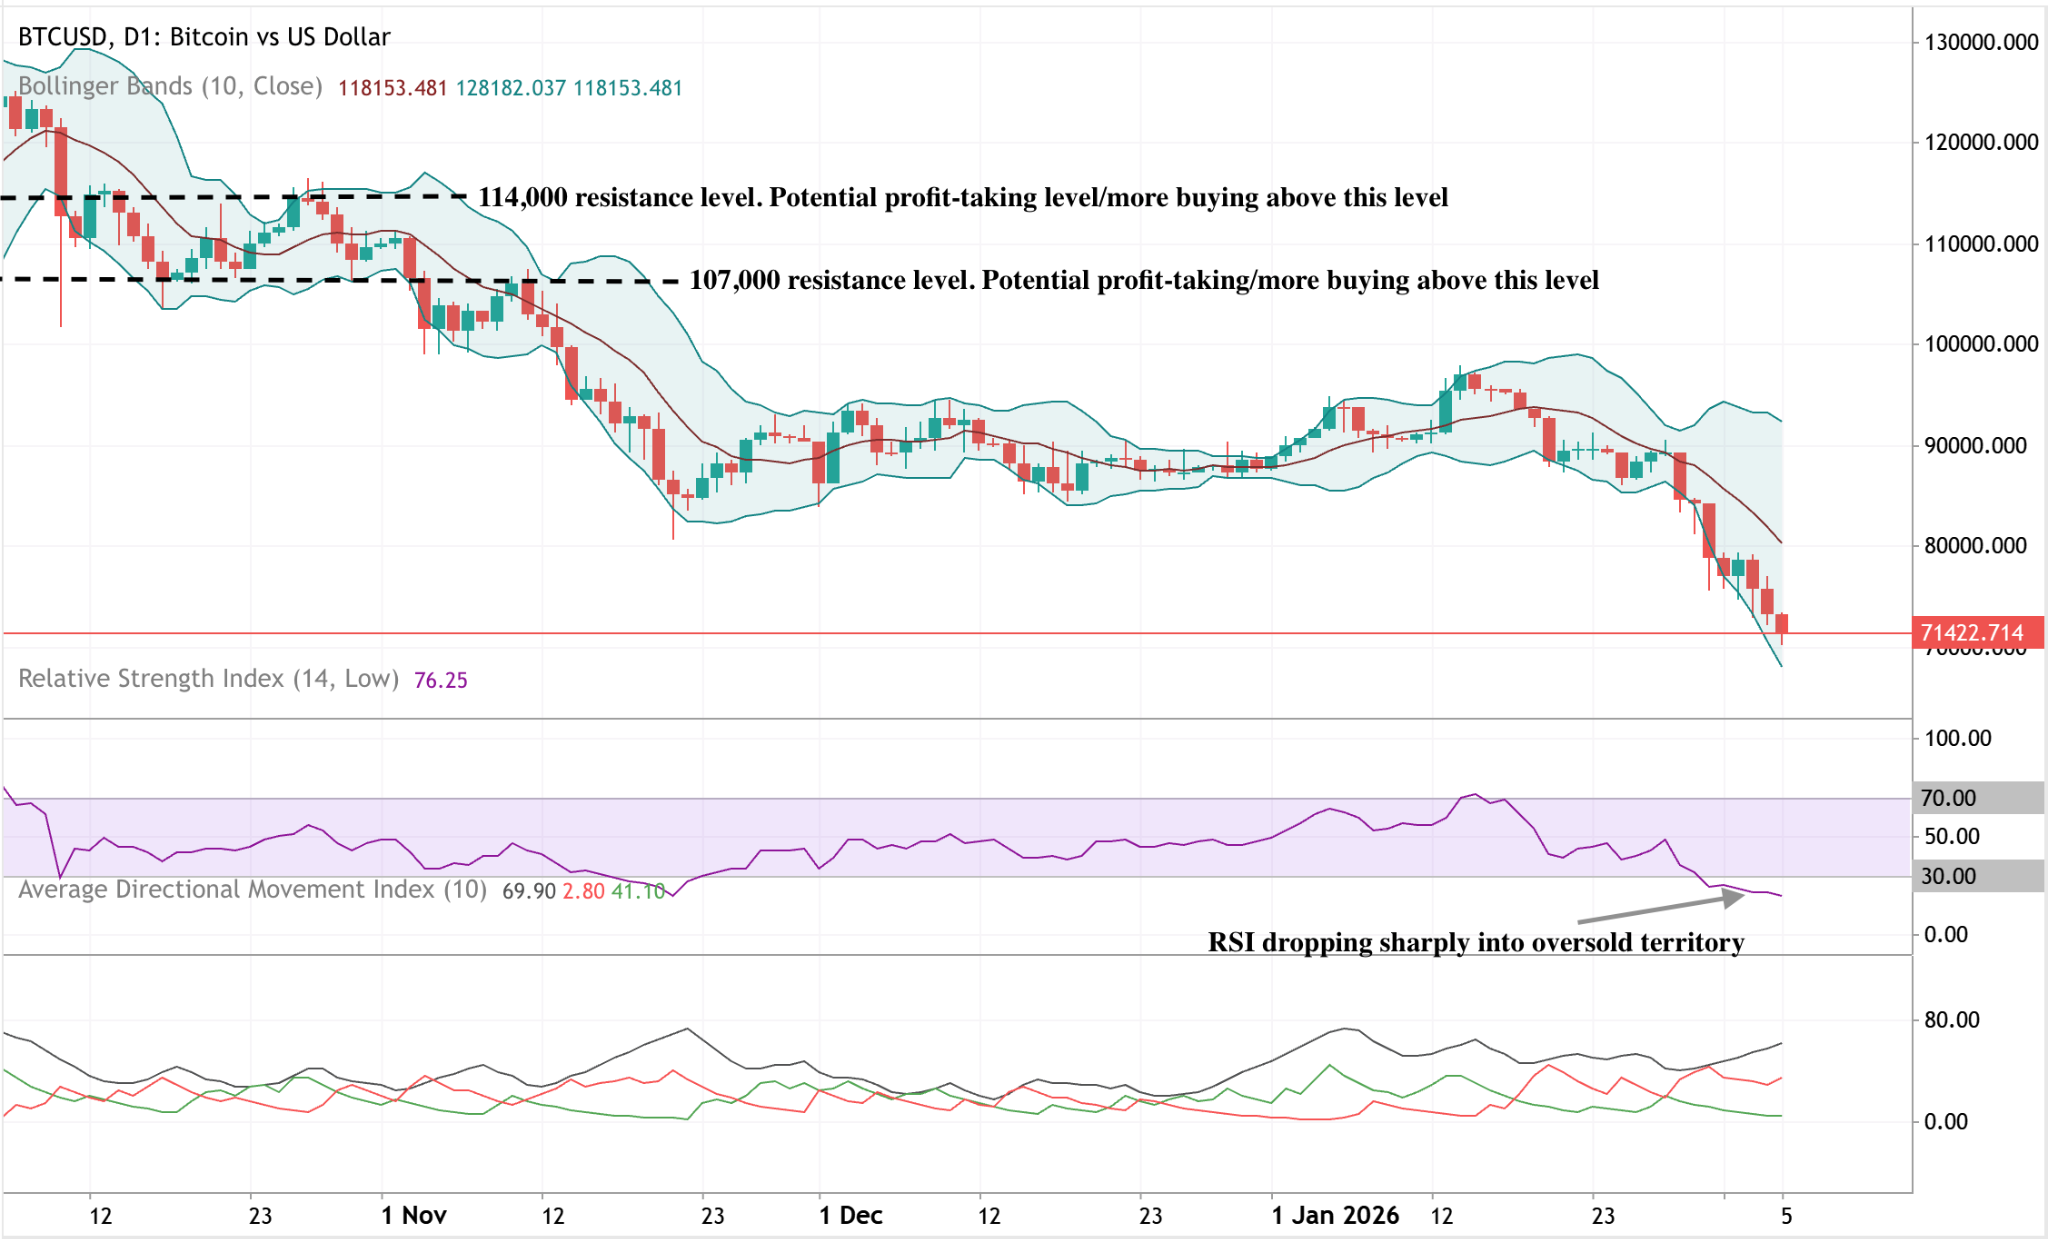
比特幣跌勢延續,突破長期盤整後進一步逼近近期價格區間下緣。價格目前低於下方布林帶,且布林帶持續大幅擴張,反映近期加速下跌後的高波動與強烈趨勢壓力。動能指標顯示極端狀態,RSI 急劇跌入超賣區,顯示短線動能迅速惡化,而非逐步減弱。
趨勢強度依然高企,ADX讀數顯示即使方向轉變,市場仍處於活躍且成熟的趨勢環境。結構上,價格現已遠低於先前約90,000美元的盤整區,早前的阻力區107,000美元與114,000美元則遠高於現價。

S&P 500 展望:市場能否承受緊縮流動性?
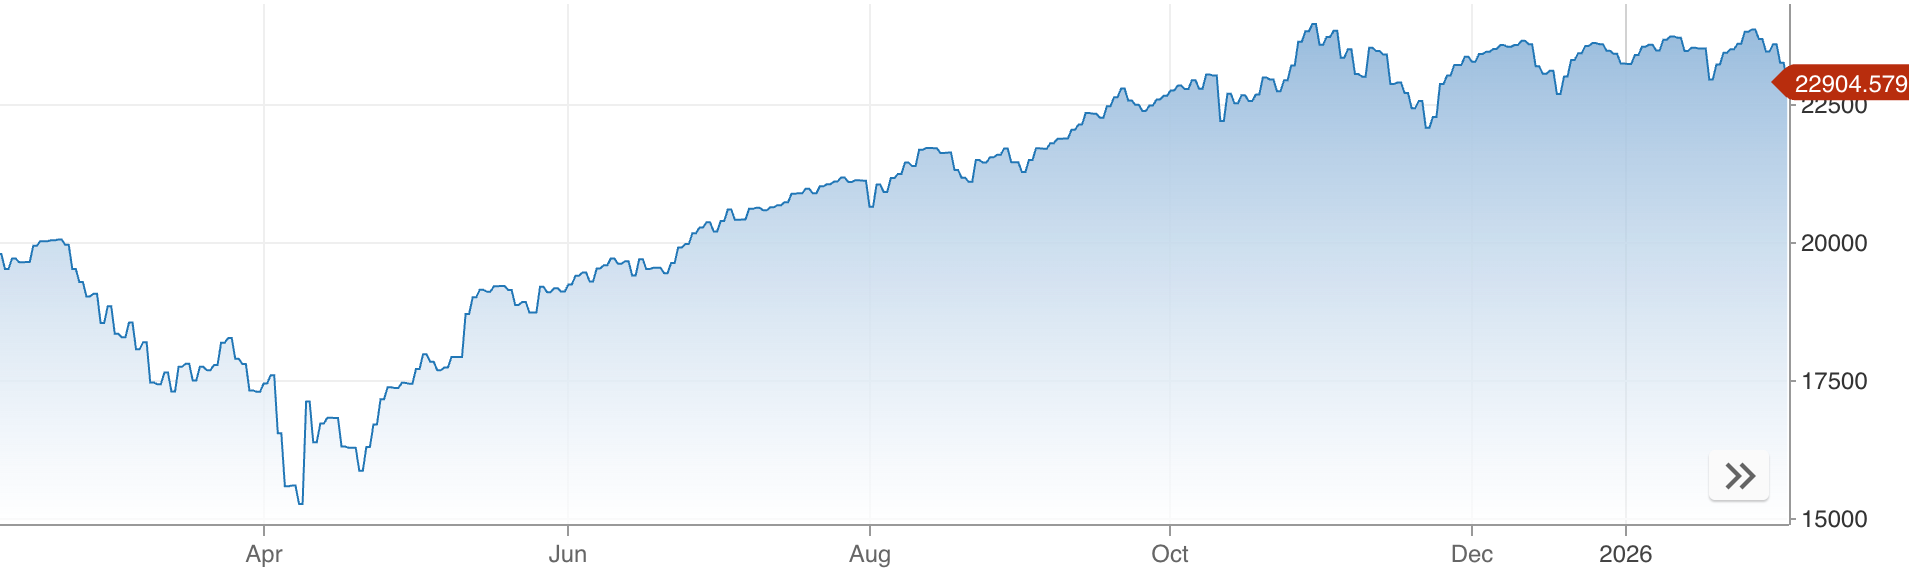
簡短的答案是可以——但並非毫無壓力。S&P 500 仍然維持在接近歷史高點的水準,但在表面之下,市場流動性正以歷史上讓股市漲勢難以持續的方式收緊。
簡短的答案是可以——但並非毫無壓力。S&P 500 仍然維持在接近歷史高點的水準,但在表面之下,市場流動性正以歷史上讓股市漲勢難以持續的方式收緊。
僅在週三,基準指數下跌了 0.5%,而等權重 S&P 500 則上漲了近 0.9%,這種分歧使市場分散度接近其歷史區間的高端。
這一點很重要,因為現在設定市場基調的越來越是流動性,而非企業盈餘。隨著財報季逐漸結束,長天期債券殖利率徘徊在壓力位附近,美國財政部準備從系統中抽走現金,市場能否承受更緊的金融環境,將決定 S&P 500 下一階段的走勢。
S&P 500 展望的驅動因素是什麼?
近期的價格走勢顯示,市場正同時受到兩股力量的拉扯。超大型科技股壓低了 S&P 500 指數,而規模較小的成分股和防禦型板塊則悄悄上漲。
其結果是分散度大幅上升,分散度指數攀升至約 37.6,這一水準通常與盈餘波動高峰期相關,而非財報季結束時。
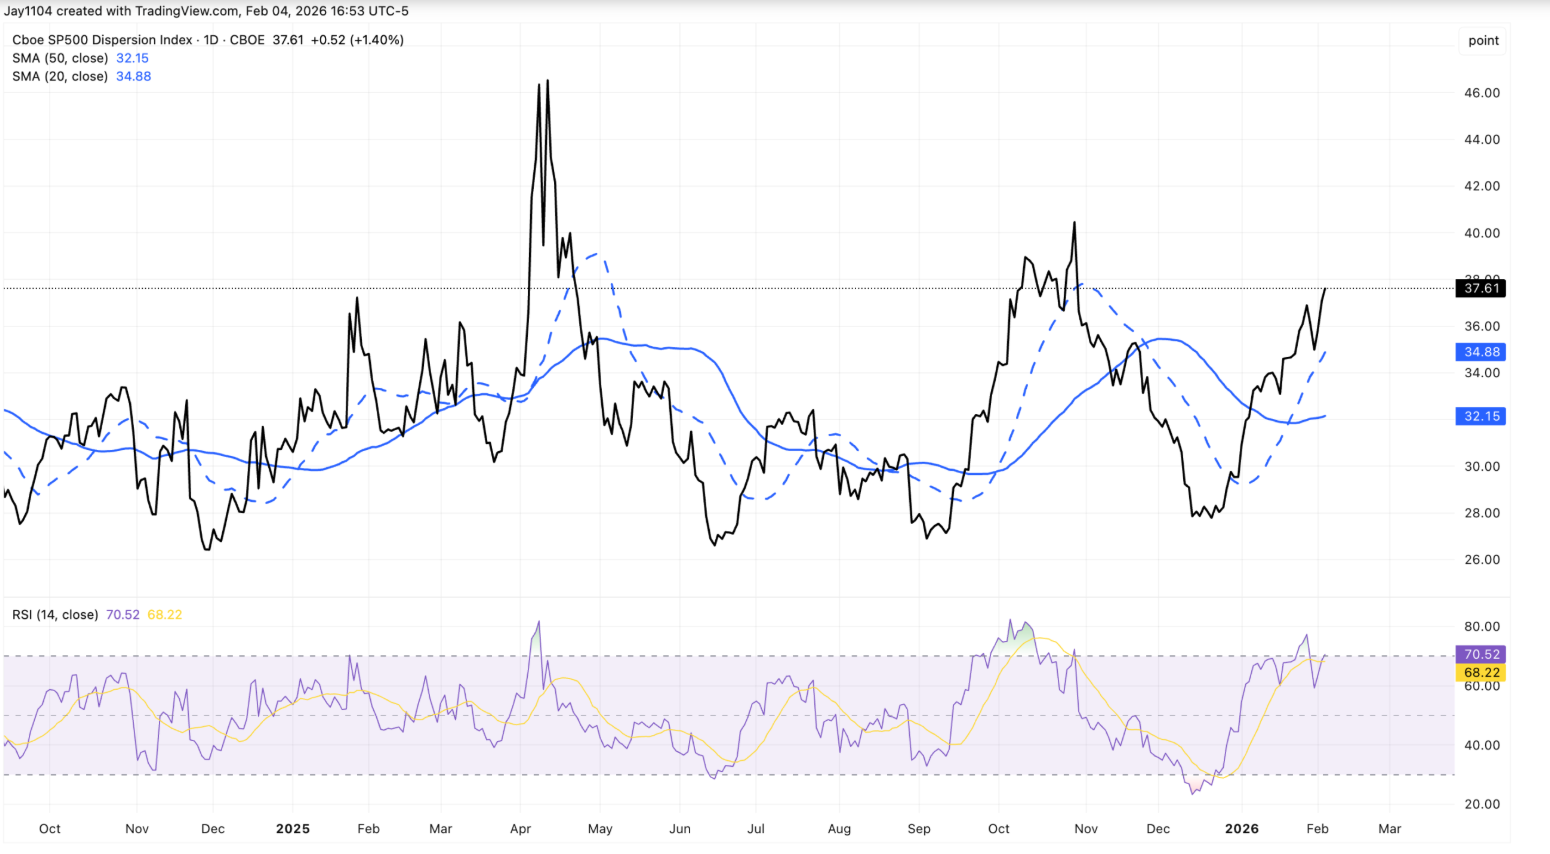
其中一個解釋在於部位配置而非信心。隱含波動率比過去幾季上升得更為激烈,促使交易者偏好如民生消費品等穩定盈餘的標的。Walmart 持續走強,儘管要到二月中旬才公布財報,正反映了這種行為。這與其說是明確的板塊輪動,不如說更像是在大型科技財報前主導市場的分散交易。
債券市場也加劇了這種不安的氛圍。美國 30 年期 Treasury 殖利率回升至 4.9% 附近,再次測試數週以來的上限。
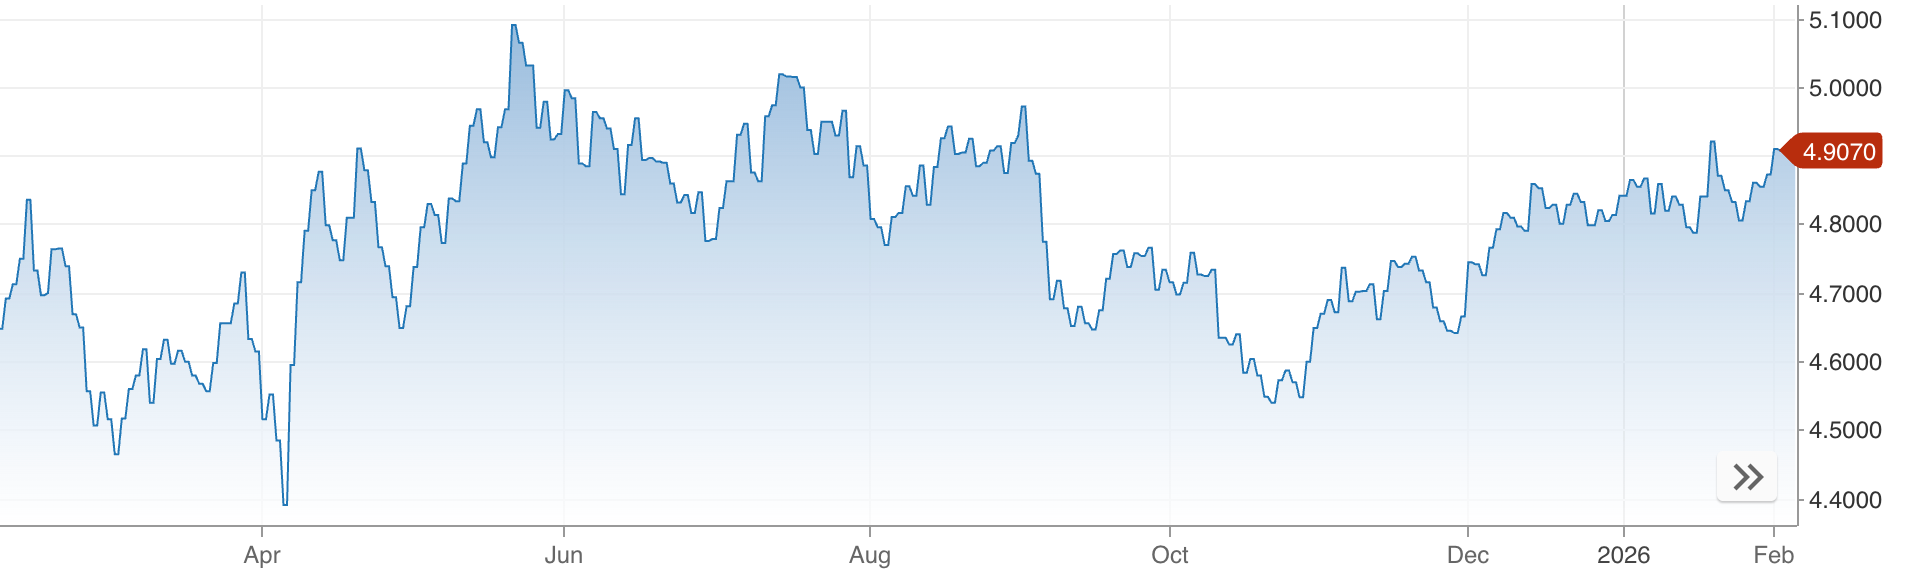
在正常情況下,大量發債、持續赤字和強勁成長應該會讓殖利率明顯走高。但目前利率似乎被凍結,顯示市場被流動性約束——而非樂觀情緒——所錨定。
為什麼這很重要
對投資人而言,這種分歧是一個警訊。當 S&P 500 表面穩定卻掩蓋內部壓力時,市場更容易出現突如其來的重新定價。等權重強勢與市值加權弱勢並存,顯示投資人選擇性降低風險,而非對未來成長普遍有信心。
流動性動態進一步放大了這種風險。美國財政部已表示,Treasury General Account 在報稅季可能超過 1 兆美元,這意味著約 1,500 億美元的額外現金將被抽離市場。
雖然增加 Treasury bill 發行可能會緩和影響,但分析師普遍認為這無法完全抵消資金流失。正如 iCapital 的 Sonali Basak 所說,市場並未反映出衝擊,但「流動性已不再像去年那樣提供支撐」。
對市場與投資人的影響
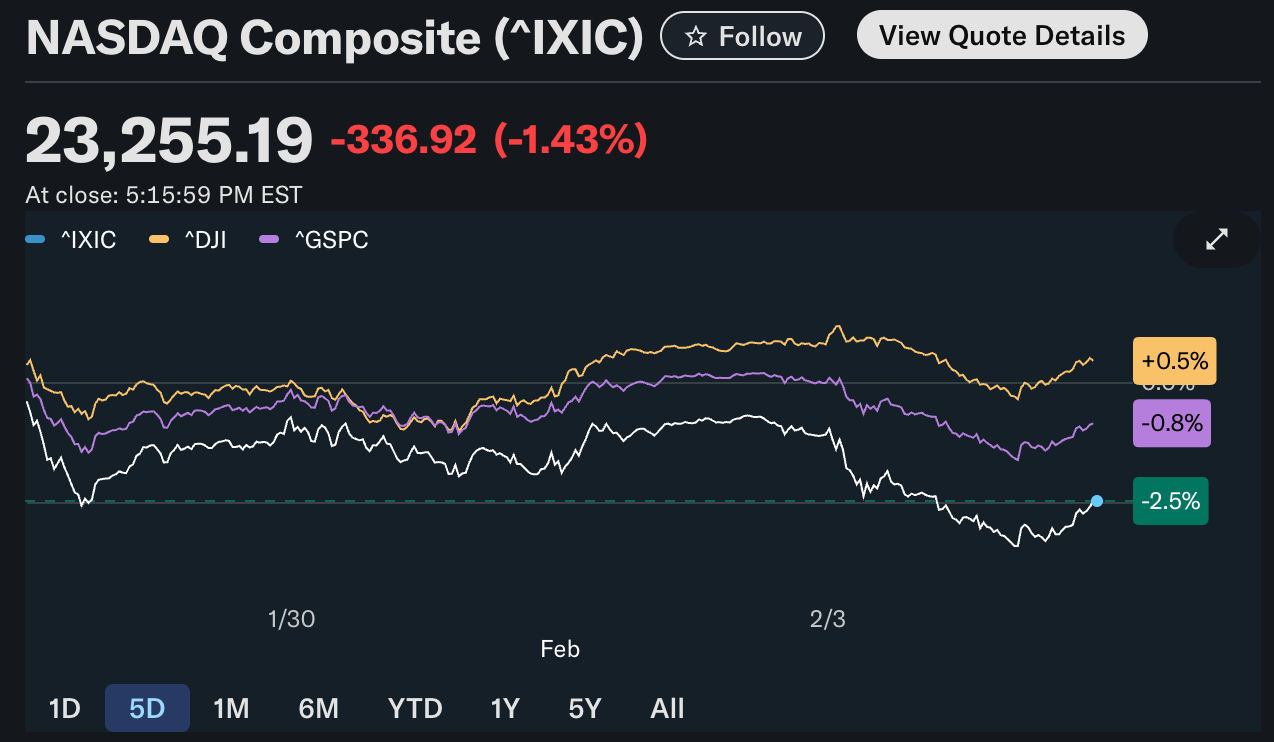
最直接的影響是激烈的板塊輪動。科技股,特別是軟體類股,在週三的拋售中首當其衝,因為 AI 顛覆與高估值的擔憂促使投資人減碼。Nasdaq 綜合指數下跌 1.5%,而道瓊工業指數則上漲 0.5%,凸顯領漲板塊的分歧。
同時,長線 AI 故事依然完整。Alphabet 財報強調計劃到 2026 年將資本支出提升至 1,850 億美元,這推動了 Nvidia 和 Broadcom,即使 Alphabet 股價下滑。市場反應顯示,投資人正在重新評估短線定價,而非完全放棄 AI 主題。
對長線投資人而言,風險在於自滿。如果流動性持續收緊,而利率又維持在壓力位附近,一旦相關性上升、分散交易解除,波動性可能會突然回歸。
專家展望
展望未來,許多策略師預期,隨著財報季結束、戰術性部位解除,市場分散度將會收斂。歷史上,當盈餘不確定性消退,相關性會上升,板塊表現也會重新趨於一致。即使沒有宏觀衝擊,這一過程本身也可能帶來波動。
更大的未知數在於流動性。每週初領失業金人數、Amazon 財報,以及 Treasury 融資動態都將受到密切關注。30 年期殖利率若持續突破 5%,很可能壓抑股市估值;而利率持續停滯則可能反映融資市場的更深層壓力。目前,S&P 500 仍能承受更緊的流動性——但前提是信心尚存。
重點結論
S&P 500 目前仍能承受更緊的流動性,但安全邊際正在縮小。指數內部分歧、頑強的債券殖利率和即將到來的現金抽離,意味著表面穩定可能具有誤導性。隨著盈餘逐漸淡出焦點,流動性將成為主角。下一個關鍵轉折,很可能來自資金狀況,而非獲利表現。

為什麼白銀暴跌30%動搖全球市場
白銀暴跌30%動搖了全球市場,因為這暴露了近期貴金屬漲勢的脆弱性。
白銀暴跌30%動搖了全球市場,因為這暴露了近期貴金屬漲勢的脆弱性。專家指出,看似結構性推動的漲勢,實際上主要由投機性部位、槓桿操作和流動性不足所支撐。當價格反轉時,被迫拋售的浪潮蔓延至金屬、貨幣及風險資產,引發市場穩定性的更廣泛重新評估。
這波行情的規模令人震驚。現貨白銀在短暫突破每盎司90美元後,單日暴跌高達17%,隨後崩跌至約77美元。
黃金也隨之下跌,跌幅超過3.5%,創下自2013年以來最大單日跌幅。這一事件成為投資人在不確定政策環境下操作動能市場時的警示。
是什麼導致白銀暴跌?
白銀崩跌的核心在於投機性部位的激進累積與迅速平倉。在價格見頂前的數週,投資人湧入槓桿型交易所買賣產品和買權選擇權,將價格推升至遠高於實體需求所能支撐的水準。當漲勢於上週末停滯時,這些部位從順風變成負擔,迅速引發保證金追繳與停損賣壓。
流動性狀況使情勢更加惡化。白銀市場規模遠小於黃金,流動性也較差,尤其是在倫敦場外市場。高盛表示,做市商對沖行為從追漲買入突然轉為跌勢賣出,導致損失在系統內層層擴大。部分最劇烈的波動發生在中國期貨市場休市期間,顯示西方資金流動主導了這波漲跌。
為什麼這很重要
白銀暴跌之所以重要,是因為其影響並未被侷限。據報導,這場突如其來的反轉打擊了整體金屬市場的信心,銅價跌破每噸13,000美元,廣泛商品價格也承壓。當一種同時具備避險與工業屬性的金屬劇烈崩跌,往往反映市場對風險的更深層不安。
分析師也警告,部位風險尚未完全解除。Lighthouse Canton董事總經理Sunil Garg表示,儘管出現大幅修正,投機過剩「尚未完全出清」。雖然白銀長期工業需求依然強勁,但短期價格走勢仍受金融資金流動主導,而非最終用途消費。
對市場與投資人的影響
對交易者而言,這次事件帶來了立即且高昂的代價。包括CME Group在內的金屬交易所於拋售後提高了保證金要求,增加了持有槓桿部位的成本,並迫使進一步去槓桿化。這種動態通常壓抑快速反彈並延長波動期,特別是在近期吸引動能交易者的資產上。
這一事件也引發了與迷因股行為的不安聯想。市場參與者越來越多地形容白銀近期的漲勢脫離了可持續估值,更多是由動能而非基本面推動。Interactive Brokers的Steve Sosnick表示,白銀經歷了「甚至超越其他投機資產的動能交易」,一旦市場情緒轉變,價格就變得極為脆弱。
專家展望
展望未來,波動性可能持續。渣打銀行分析師表示,在美國貨幣政策前景,特別是降息步調更明朗前,貴金屬仍將不穩。Federal Reserve官員的鷹派言論推升了美元,進一步壓力落在以美元計價的金屬如白銀。
政治不確定性使局勢更加複雜。市場正評估Kevin Warsh被提名為Federal Reserve主席的影響,同時川普總統仍堅稱降息機率高。對白銀而言,交易者正密切關注70美元關卡。若持續跌破,可能加深各類資產的風險厭惡;若守穩,則有助於投機過剩逐步出清。
重點摘要
白銀暴跌30%動搖全球市場,因為這揭示了動能行情在壓力下能多快瓦解。這波拋售暴露了流動性缺口、過度槓桿與脆弱的市場信心。儘管結構性需求仍具支撐,白銀未來走勢取決於投機過剩能否完全出清。交易者未來幾天將密切關注70美元關卡及美國政策訊號。
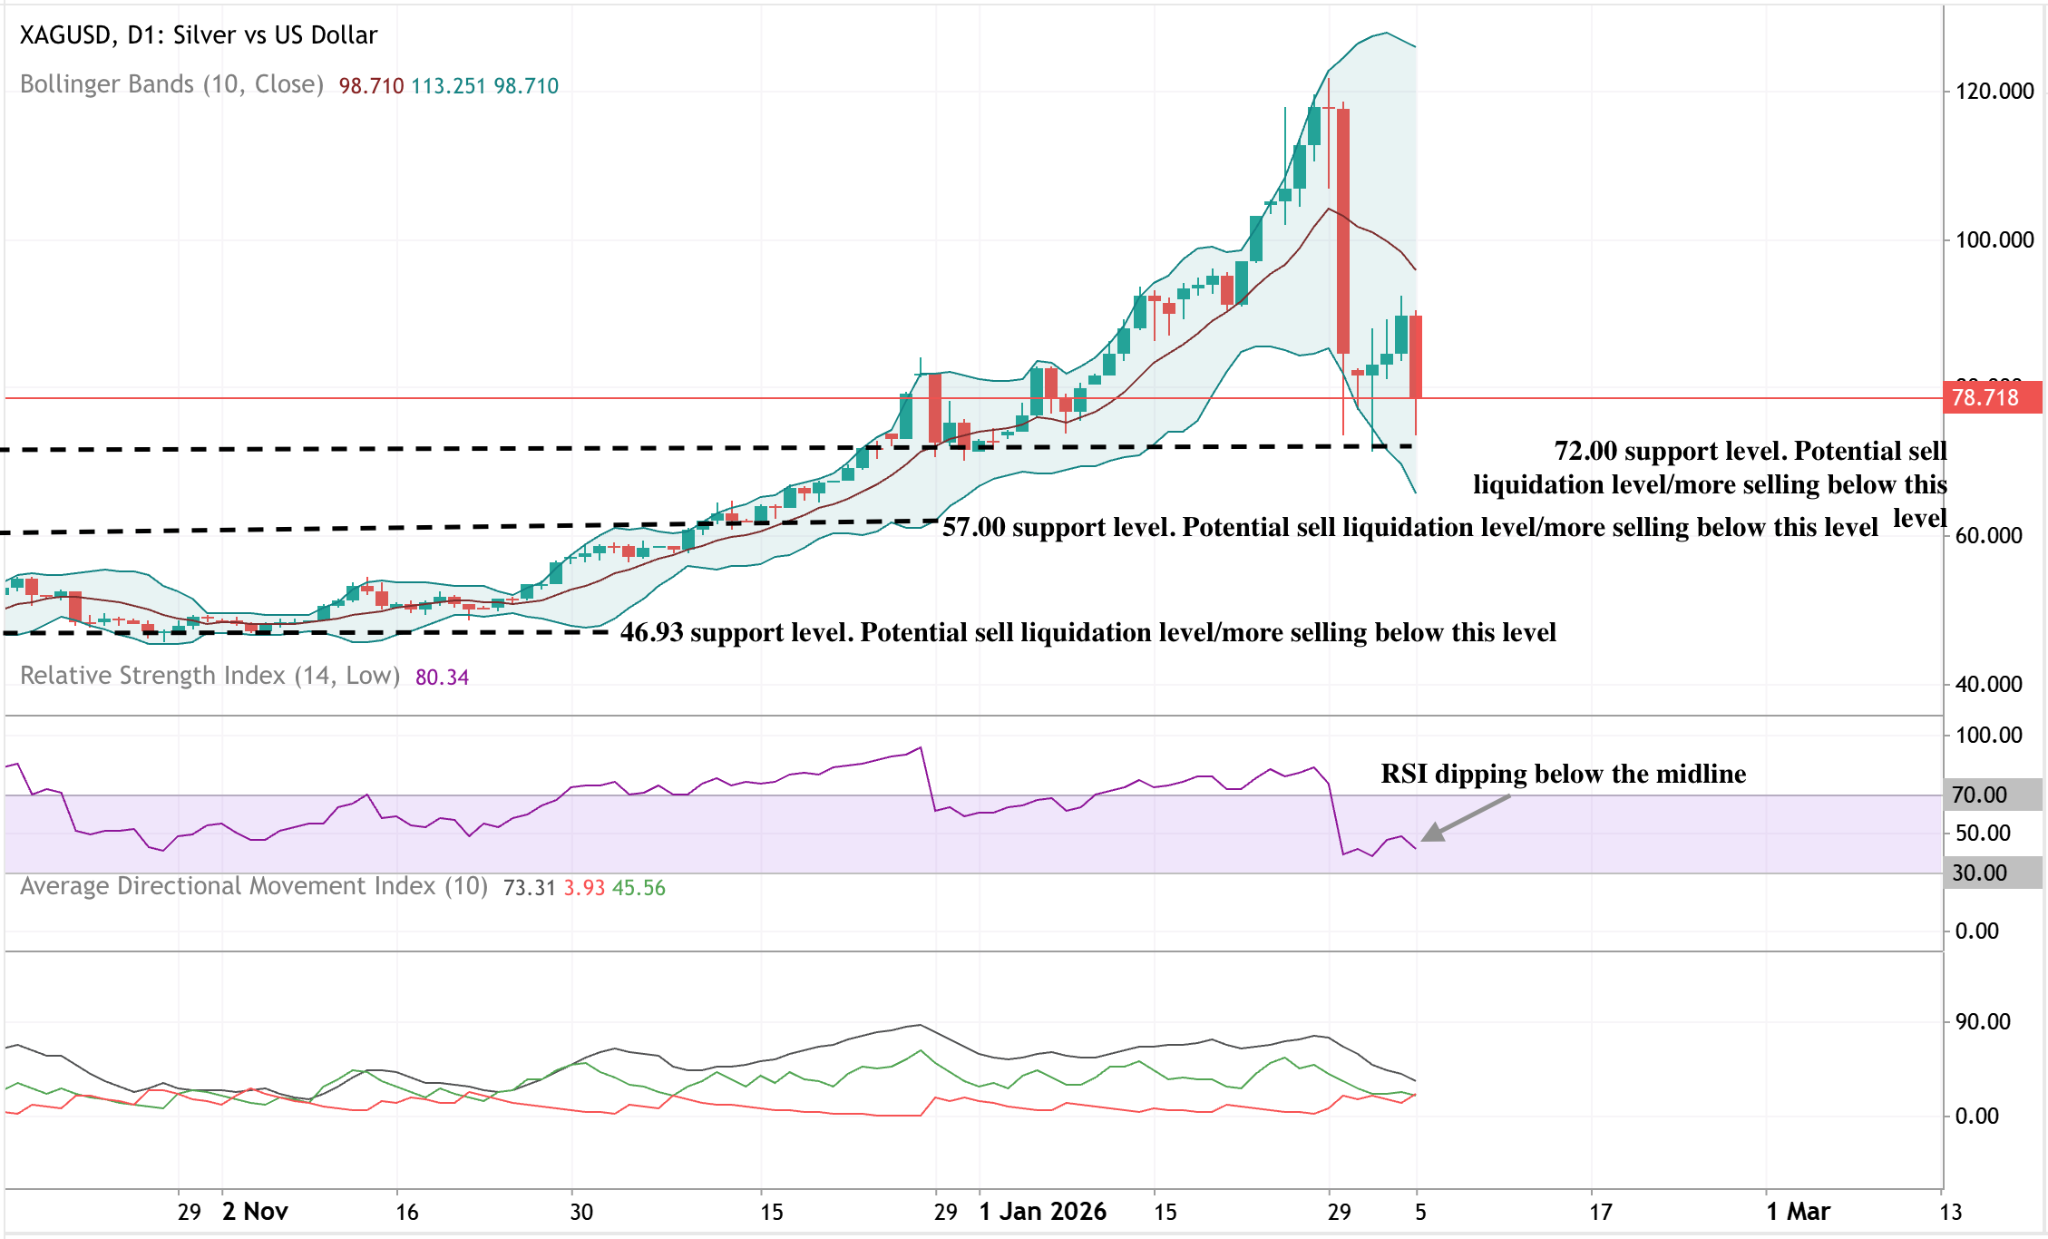
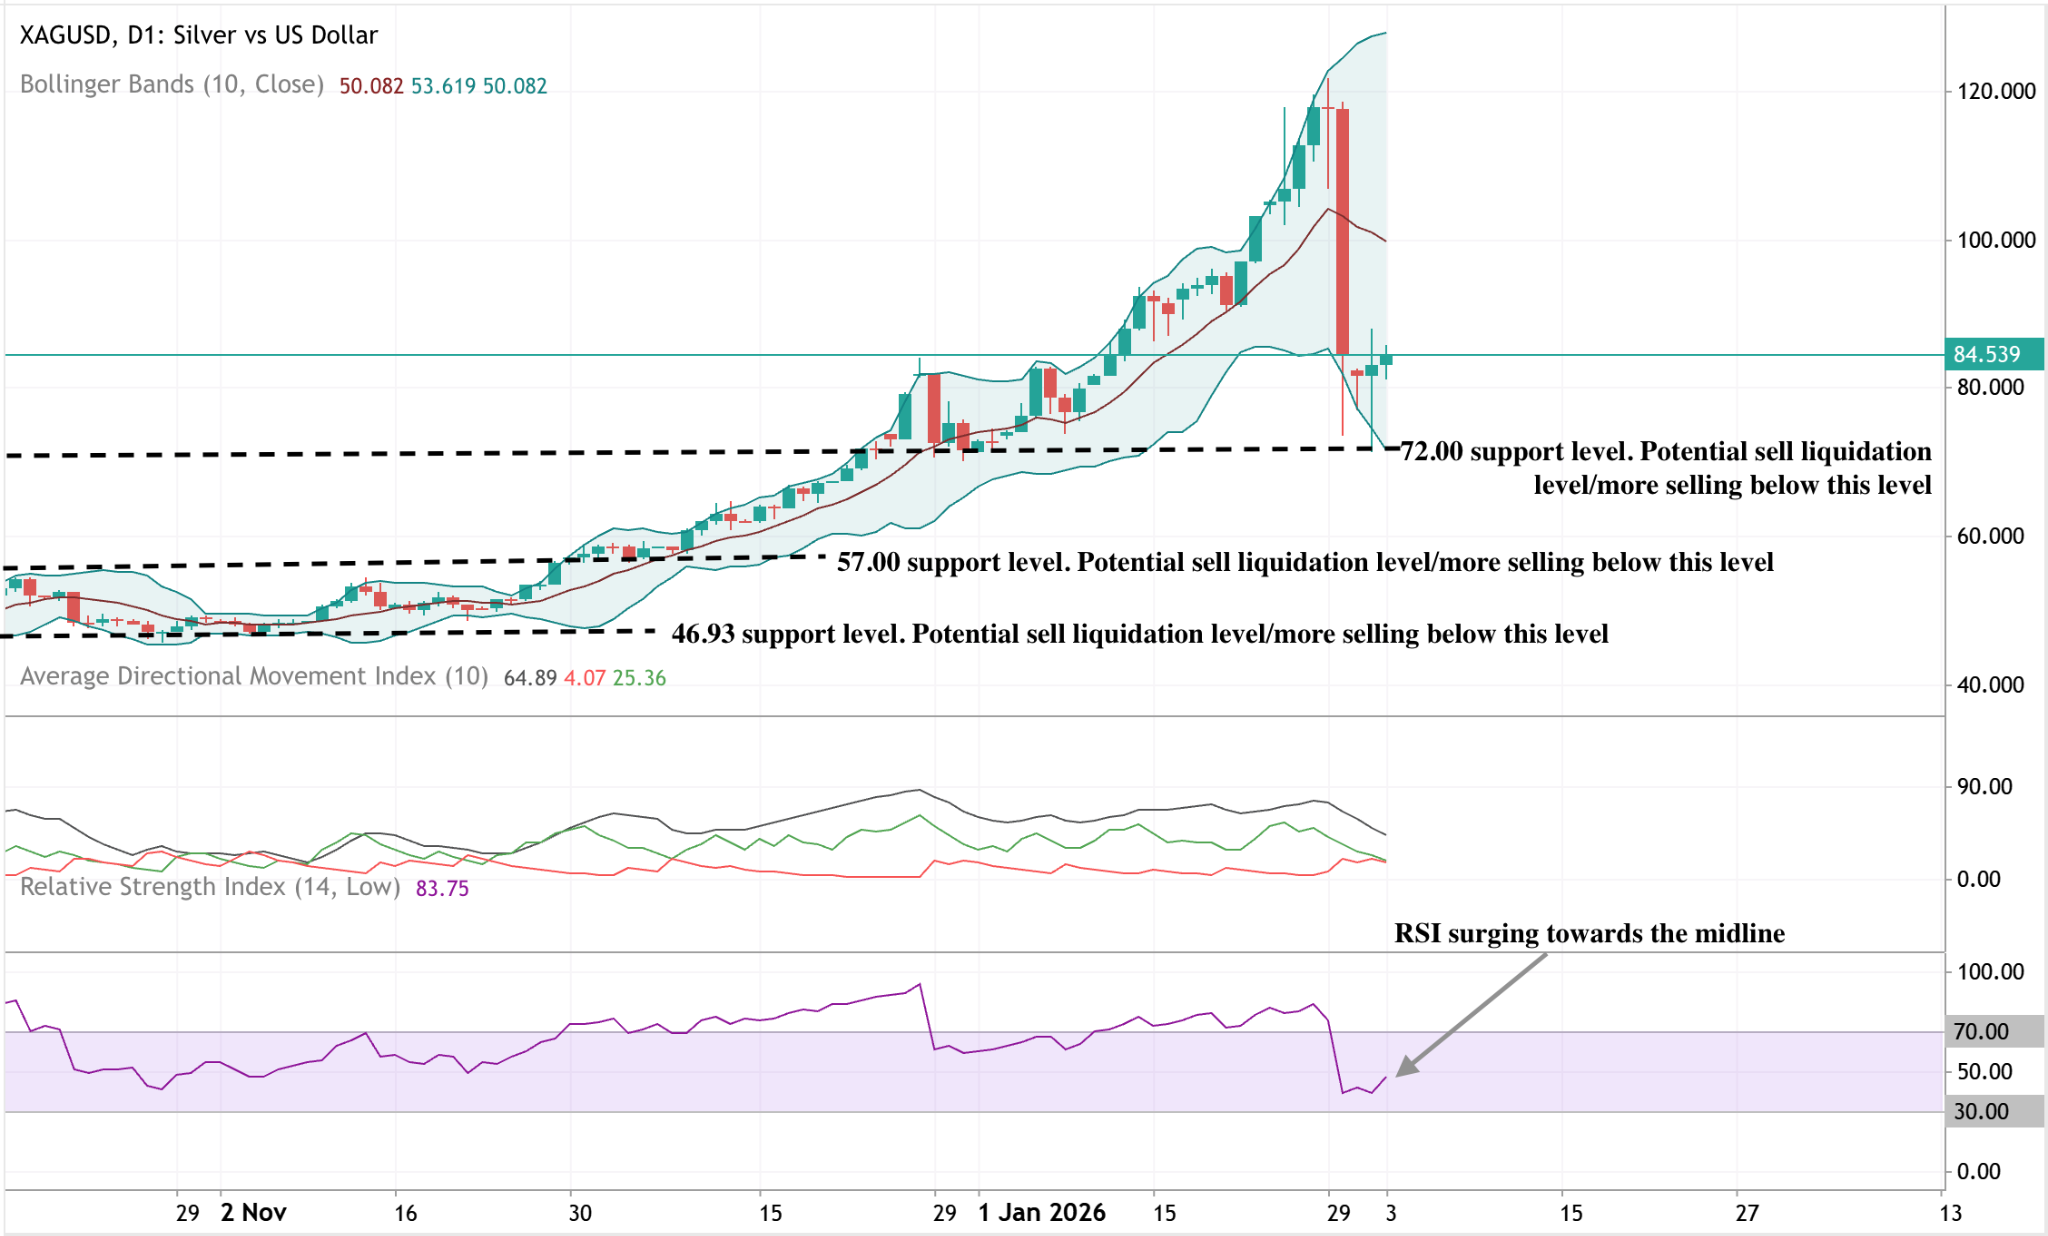
白銀技術展望
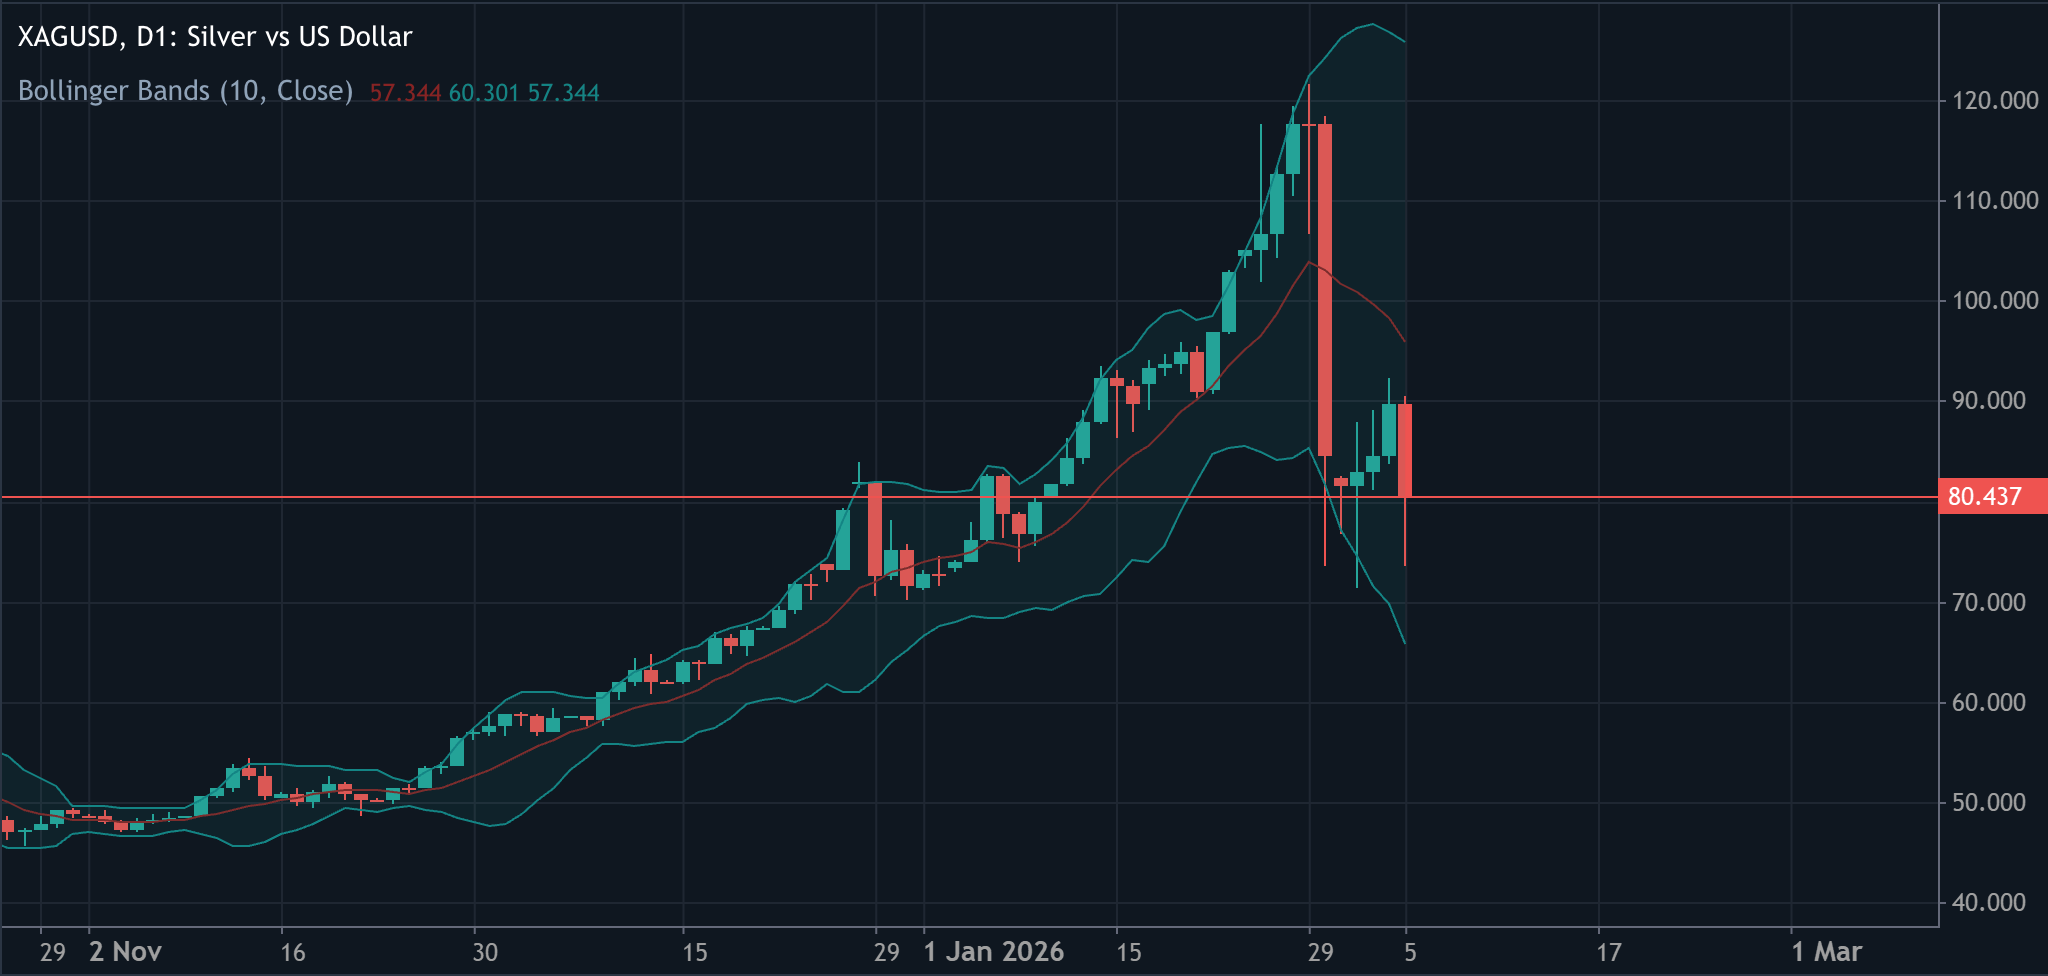
白銀在經歷一波延伸漲勢後,價格自近期高點大幅回落,重新回到布林通道內,先前一度突破上軌。儘管回檔,通道仍大幅擴張,顯示波動性相較於先前階段依然偏高。
動能指標顯示極端狀態明顯轉變:RSI自超買區回落,目前位於中線下方,反映動能大幅降溫。
趨勢強度依然高企,從高檔ADX讀數可見,顯示整體趨勢環境仍強,即使短線動能已轉弱。結構上,價格仍遠高於先前盤整區域約72、57及46.93美元,凸顯前波漲勢的規模。

科技股拋售對美國指數下一步走勢的意義
最新一輪由科技股主導的拋售顯示,美國股市指數正進入一個更為脆弱的階段,市場領導地位已不再理所當然。
最新一輪由科技股主導的拋售顯示,美國股市指數正進入一個更為脆弱的階段,市場領導地位已不再理所當然。週二,Nasdaq Composite 下跌 1.4%,拖累 S&P 500 下跌 0.8%,投資者開始質疑由 AI 推動的漲勢是否仍能支撐當前的估值。
這一走勢並非意味著趨勢完全逆轉,而是顯示市場正在重新調整預期。隨著企業盈利壓力加大,波動性蔓延至其他資產,美國指數的下一步走勢將取決於大型科技股能否重建信心,或投資者是否繼續撤離擁擠的成長型交易。
是什麼推動了科技股拋售?
直接導火線是對 AI 支出可持續性的再度擔憂。雖然 Palantir 積極的財報強化了長期 AI 故事,但未能消除市場對資本密集度和行業邊際回報遞減的廣泛擔憂。Nvidia 近 3% 的跌幅尤為關鍵,因有報導稱其與 OpenAI 關係降溫,市場對 Nvidia 最新 AI 晶片的表現產生疑慮。
這種焦慮迅速蔓延至軟體和雲端領域。Amazon 和 Microsoft 擴大了近期跌幅,投資者持續減碼高本益比個股。AI 公司 Anthropic 推出法律生產力工具,進一步加大壓力,加深了市場對創新加速可能加劇競爭、而非保護利潤率的擔憂。在這種環境下,市場不再無差別獎勵 AI 概念,而是要求獲利能力的證明。
這對美國指數有何重要性
美國指數對少數超大型科技股的波動越來越敏感。最大型的科技公司如今佔 S&P 500 總市值超過 30%,當市場情緒轉向該板塊時,基準指數的風險暴露也隨之增加。當領頭羊失靈,指數層面的韌性會迅速削弱。
一位美國股票策略師表示:「問題不在於是否相信 AI,而在於這些股票的盈利增長能否跟上市場預期。」這一區別解釋了為何即使在強勁的財報下,市場仍可能出現拋售。對指數而言,風險不在於崩盤,而在於長期表現不均的階段。
對市場與投資者的影響
這波拋售已經引發了持倉明顯轉變。隨著股票下跌,投資者轉向防禦性資產,推動黃金單日上漲超過 6%——創下自 2008 年以來最大單日漲幅——而就在數天前,黃金才經歷了 40 多年來最大單日跌幅。白銀也隨之強勁反彈 9%,主因是積極的逢低買盤。
這種分歧顯示,投資者是在減少動能交易的曝險,而非完全放棄風險。股票疲弱與貴金屬走強並存,反映的是避險行為,而非恐慌。對交易者而言,這意味著市場正為更具雙向波動的行情做準備,反彈可能更快遇阻,回調則吸引選擇性買盤。
專家展望
美國指數的下一步方向將由 AMD、Amazon 和 Alphabet 即將公布的財報所主導,這些財報預計將為 AI 相關支出、利潤率和需求能見度提供更明確的指引。尤其是 AMD 的業績,被視為 AI 晶片競爭能否推動整體行業成長、而非稀釋回報的試金石。
策略師們依然保持謹慎,但並未完全看空。大多數人預期,隨著市場從敘事驅動的樂觀轉向盈利驅動的審視,波動性將升高。如果大型科技股能展現營運紀律並持續成長,指數有望穩定。否則,美股可能進入更廣泛的盤整期,特徵是輪動而非持續上漲。
重點結論
科技股拋售反映的是市場對成長定價方式的轉變,而非對成長本身的否定。美國指數仍有支撐,但領導地位正因投資者對盈利紀律的要求而承壓。黃金的急升凸顯了表面之下的謹慎情緒。下一階段將由盈利的可信度所主導——以及大型科技股能否證明其對市場的巨大影響力是合理的。

比特幣最新下跌顯示市場主導權轉移
比特幣近期的下跌不僅僅是價格下滑——它反映出市場主導權的明顯變化。
比特幣近期的下跌不僅僅是價格下滑——它反映出市場主導權的明顯變化。數據顯示,這個全球最大加密貨幣自去年十月高點(超過126,000美元)以來已下跌超過40%,本週一度跌破73,000美元,創下自2024年11月以來新低。
關鍵在於,根據分析師說法,比特幣目前已跌破其「True Market Mean Price」(真實市場均價),這是一個歷來用來區分多頭主導與空頭主導市場的估值門檻。
這一跌破發生在全球投資者因AI驅動的股市拋售和地緣政治緊張局勢升溫而撤離風險資產之際。隨著黃金單日飆升近7%,各類資產波動性上升,比特幣的表現顯示市場主導權正從買方轉向賣方——這一轉變可能將影響未來數月的價格走勢。
是什麼推動了比特幣的最新下跌?
比特幣的下跌與金融市場整體的避險情緒同步展開。美國股市因人工智慧題材信心減弱而下挫,Nasdaq下跌1.4%,主要科技股大幅拋售。
Microsoft雲端業務成長令人失望,加上AI投資成本上升,再度引發市場對科技板塊估值過高、難以支撐長期獲利的擔憂。
隨著股市下跌,投機性資產也同步走弱。比特幣與高Beta科技股同步波動,而非作為避險工具,進一步凸顯其對流動性狀況的敏感性。當投資者降低風險曝險時,比特幣往往承受更大跌幅,尤其是在加密衍生品市場槓桿水位仍高的時期。
地緣政治事件加劇了壓力。美國擊落一架伊朗無人機(靠近美國航空母艦)的消息,使VIX波動率指數一度升破20,這一水準通常與市場壓力升高相關。
資金迅速流向傳統避險資產,黃金與白銀本週雙雙錄得兩位數漲幅,使比特幣在防禦性布局中處於不利位置。
為什麼重要:跌破真實市場均價
這波走勢最重要的訊號,是比特幣跌破目前估算約80,000美元的「True Market Mean Price」。
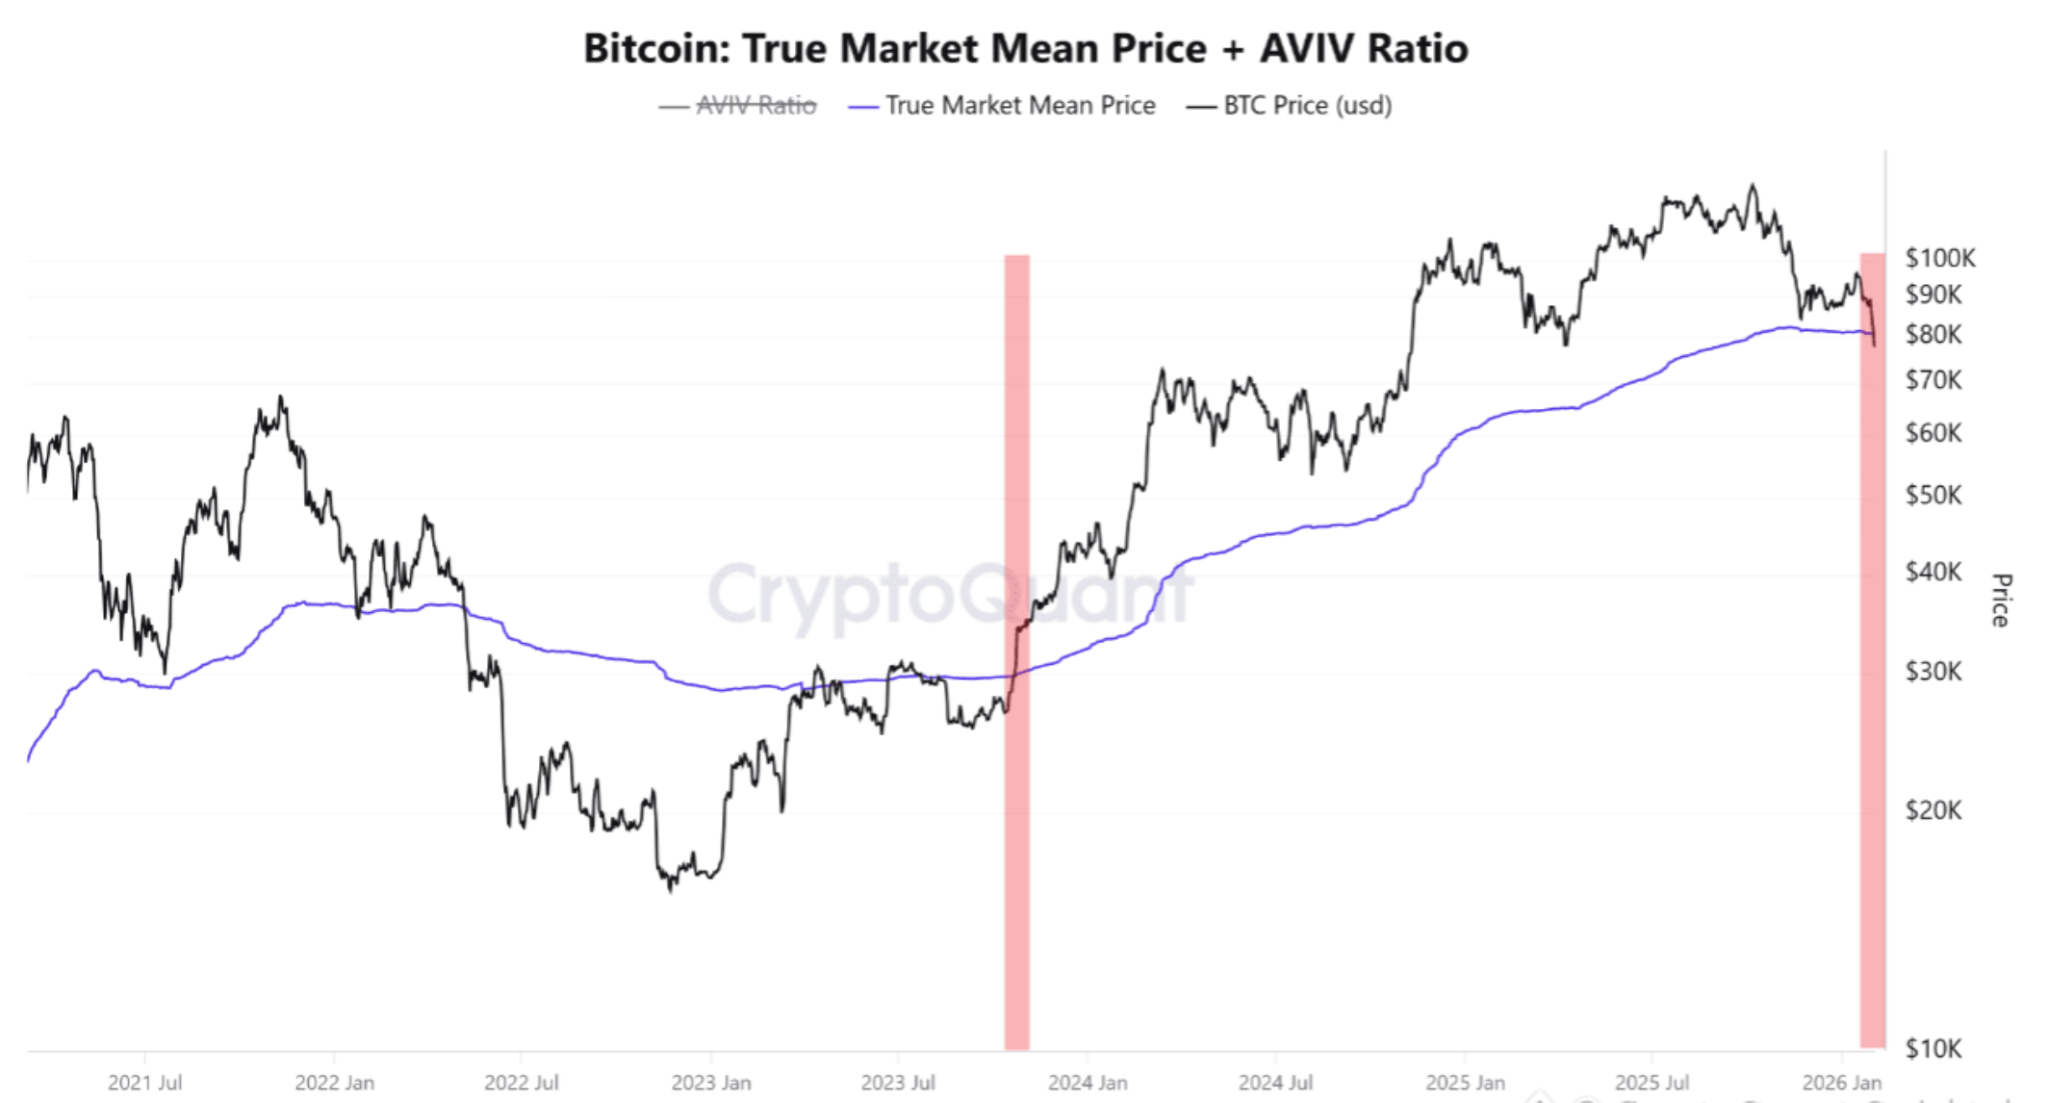
這個指標反映所有比特幣持有者的歷史平均成本,廣泛用於評估大多數投資人是處於獲利還是虧損狀態。當價格維持在此水準之上時,買方通常掌控主導權;當價格跌破時,賣壓往往加劇。
在過去的週期中,這種轉變標誌著市場格局的變化。2022年下跌期間,比特幣週線收盤跌破同一指標後,隨即展開長達七個月、超過55%的跌幅。雖然當前情勢有所不同,但行為反應相似:被套牢的持有者更傾向於逢高賣出,限制了上漲動能。
Hashdex全球市場洞察主管Gerry O’Shea指出,比特幣與黃金的走勢分歧,反映出投資人當前對風險的看法。過去五年,黃金表現已超越比特幣,顯示在宏觀不確定時期,市場仍偏好成熟的價值儲存工具。這種偏好轉變對於判斷誰擁有定價權至關重要。
對加密市場與投資人的影響
這一變化的直接影響已在加密市場顯現。比特幣日內急跌引發槓桿部位連環平倉,加速下行並拖累主要山寨幣走低。當市場主導權轉向賣方時,流動性稀薄會放大價格波動,導致波動性上升。
對散戶投資人而言,影響更具結構性。許多參與者是在2024年底的漲勢中進場,意味著越來越多持有者目前處於未實現虧損。歷史上,這會降低風險偏好並延遲復甦,因為信心重建需要時間。機構資金也變得更為謹慎,當前環境下更偏好商品與防禦性資產,而非數位貨幣。
專家展望:接下來會發生什麼?
展望未來,分析師預期比特幣將持續波動,市場尋找新平衡點。監管不確定性、宏觀經濟不穩與金融環境收緊,都降低了快速反彈的可能性。O’Shea認為,短期動盪將持續,儘管長期採用趨勢不變,加密貨幣仍在逐步融入主流金融基礎設施。
歷史經驗顯示,跌破關鍵估值指標後,市場很少能迅速修復。相反,市場往往進入長期盤整或緩步下跌階段,弱勢持有者退出、強勢持有者累積部位。未來三到六個月,比特幣能否重返80,000美元水準,將成為觀察買方能否重新掌控主導權,或是賣方仍佔上風的重要指標。
重點摘要
比特幣最新下跌不僅僅是短期疲弱——它顯示市場主導權正從買方轉向賣方。隨著全球市場風險偏好降溫,加密貨幣的表現越來越像投機資產,而非避險工具。接下來幾個月將決定這波走勢是長期重置還是築底反彈。當下,耐心與風險意識仍是關鍵。
比特幣技術面展望
比特幣在其大結構內持續走低,價格一度跌破下軌布林通道,隨後在76,400美元附近企穩。布林通道仍大幅擴張,顯示近期下跌加速後,波動性依然高企。
動能指標顯示初步企穩跡象:RSI自超賣區域回升,反映急跌後下行動能有所緩和。趨勢強度依然高企,ADX讀數維持在高位,顯示儘管近期方向性動能減弱,市場仍處於活躍且成熟的趨勢環境。
結構上,價格目前遠低於先前的阻力區(約90,000、107,000與114,000美元),突顯前波走勢的幅度。
.jpeg)
目前黃金與白銀的反彈是否可持續?
黃金與白銀價格在經歷數十年來最劇烈的拋售之一後強勢反彈,迫使投資者重新評估上週的崩跌究竟是轉折點還是暫時性的錯位。
黃金與白銀價格在經歷數十年來最劇烈的拋售之一後強勢反彈,迫使投資者重新評估上週的崩跌究竟是轉折點還是暫時性的錯位。
現貨黃金週二一度大漲4%,至每盎司約4,820美元,而白銀則在上週單日暴跌近30%(為1980年以來最嚴重的一天跌幅)後,強勁反彈近8%,至85美元。
復甦的速度改變了市場敘事。最初看似避險需求崩潰,如今被重新解讀為由持倉調整、槓桿與短期宏觀衝擊所驅動的劇烈重置。市場面臨的問題是,這波反彈反映的是信心重燃,還僅僅是強制拋售的消失。
是什麼推動了黃金與白銀的反彈?
這次反彈更多是由極端壓力的解除所推動,而非新的多頭催化劑。上週的崩跌因保證金調升與波動性飆升下的強制平倉而加劇,特別是在白銀市場。隨著保證金壓力緩解,賣壓消退,價格得以穩定並反彈。
投資者也開始質疑這波拋售是否已超越基本面。年初在地緣政治不確定性、央行買盤及對長期財政紀律的擔憂下,黃金與白銀曾創下歷史新高。在這波下跌期間,這些驅動因素並未實質惡化,顯示價格下跌速度快於基本需求的減弱。
匯率動態也帶來支撐。當Donald Trump提名Kevin Warsh為下一任Federal Reserve主席時,美元最初走強,但隨著市場預期貨幣政策將延續而非出現劇變,漲勢失去動能。這一停頓減輕了美元計價商品的壓力,有助於貴金屬重新站穩腳步。
為什麼這很重要
這波反彈之所以重要,是因為它挑戰了黃金與白銀已進入持續下跌趨勢的觀點。Deutsche Bank策略師表示,近期的崩跌更像是持倉重置,而非結構性轉變,並指出官方、機構與散戶投資者的意向不太可能惡化。
黃金作為戰略資產的角色依然穩固。各國央行持續分散儲備,地緣政治風險依舊存在,長期通脹憂慮並未消失。雖然投機過度明顯加劇了拋售,但分析師認為,核心需求驅動因素在波動性表象之下仍具支撐力。
白銀的反彈則帶來不同啟示。其市場規模較小、槓桿較高且散戶參與度更大,使其對情緒波動更為敏感。其復甦速度凸顯出,一旦強制性資金流消退,即使波動性仍高,價格也能迅速反彈。
對市場與投資者的影響
黃金與白銀的穩定有助於緩解與大宗商品相關資產的壓力。礦業股在拋售期間遭受重創,隨著價格回升而企穩。更廣泛的股市也保持韌性,主要指數在大宗商品劇烈波動下仍接近歷史高位。
對投資者而言,這一事件再次強調了擁擠交易中槓桿帶來的風險。上週的拋售中,保證金調升發揮了決定性作用,特別是在白銀市場。隨著交易環境趨於平靜,價格走勢將更敏感於宏觀訊號,而非機械性平倉。
白銀的長期產業故事仍是關鍵支撐。與太陽能、數據中心及AI基礎設施相關的需求持續上升。一份一月的研究預計,到2030年全球白銀需求每年可達54,000噸,而供應增長則大幅落後。
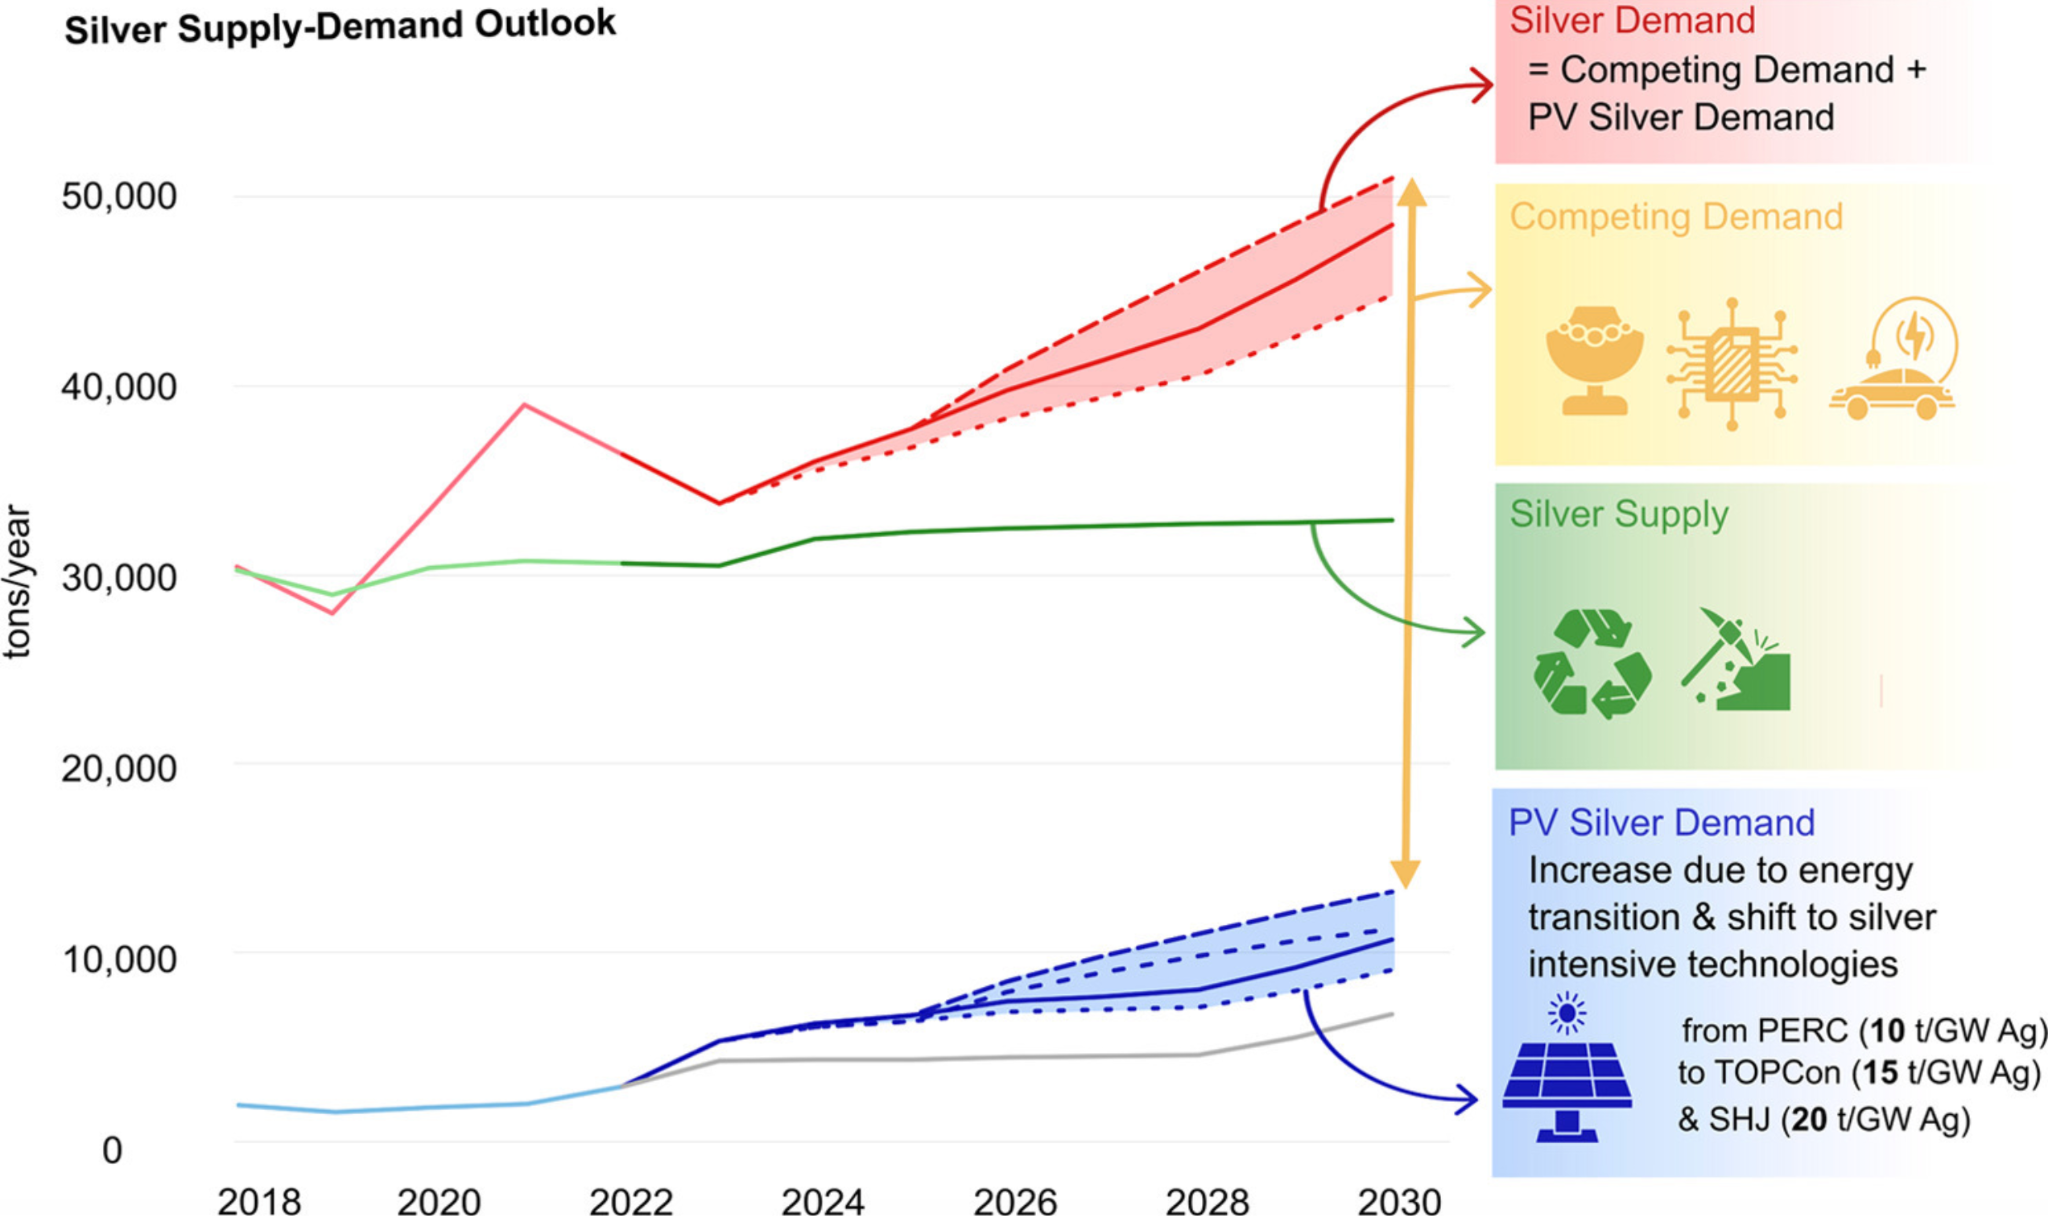
這種失衡顯示,波動性並未否定更廣泛的投資論點。
專家展望
分析師普遍認為,這波反彈並不保證價格將一路上行。Barclays指出,在政策與地緣政治不確定性下,黃金的整體“買盤”仍具韌性,但也警告過熱的技術面可能需要一段整固期。
白銀的前景則更為波動。eToro分析師Zavier Wong表示,投機性持倉放大了崩跌與反彈,但也提醒不要忽視白銀的基本需求。他認為,白銀在強勢周期中歷來會先於基本面大幅上漲,隨後才由基本面重新主導。
這波反彈的可持續性將取決於外部條件。美元或實質收益率若再度上升,可能考驗這波復甦;而資金環境穩定與宏觀訊號平靜,則有助於價格更為溫和地重建。
重點結論
黃金與白銀在歷史性拋售後大幅反彈,顯示上週的崩跌更多是由強制性持倉調整所致,而非基本面惡化。儘管波動性仍高,支撐貴金屬需求的結構性驅動因素依然存在。這波反彈是否可持續,將取決於宏觀穩定、匯率走勢與投資者自律。下一階段更可能是整固而非再度崩跌。
黃金與白銀技術展望
黃金在近期大漲後仍處高位,價格在自上方布林帶急劇回落後已趨於穩定。雖然價格已回到布林帶內,但帶寬仍大幅擴張,顯示波動性相較過去仍然偏高。
動能指標顯示為調整而非反轉:RSI在短暫下探後已回升至中線上方,反映快速波動後動能趨於穩定。趨勢強度依然高企,從ADX指標的高位可見,顯示目前仍處於強勁、明確的趨勢環境。
從結構面來看,價格仍遠高於先前的整固區域(約4,035與3,935美元),凸顯前一波漲勢的規模。
白銀在長時間上漲後出現急劇回落,價格自近期高點回撤,並回到較大區間的中段。布林帶仍大幅擴張,顯示在先前加速後波動性依然高企,即使價格已回到帶內。
動能指標顯示明顯重置:RSI自超買區大幅下滑,現正回升至中線,反映極端階段後動能有所緩和。
趨勢強度依然高企,從ADX指標的高位可見,突顯即使近期回調,整體趨勢環境仍然強勁。結構上,價格仍遠高於先前的整固區域(約72、57與46.93美元),凸顯前一波漲勢的規模。

更低成本。更高槓桿。更佳交易條件。
無論您是交易短線波動還是擴展長線策略,這些改進都旨在幫助您以更具競爭力的條件進行交易。
我們已對金屬、加密貨幣及美國指數的交易條件進行了重大升級——為您帶來更低的交易成本、更高的槓桿,以及在全球最活躍市場中更靈活的操作。
無論您是交易短線波動還是擴展長線策略,這些改進都旨在幫助您以更具競爭力的條件進行交易。
以下是各項產品的具體變化。
金屬交易
Deriv 已升級白銀與黃金的交易條件,透過微型合約擴大了可及性,並推出了全新金屬市場——銅。
改進內容
| 交易條件 | 白銀 | 黃金 |
|---|---|---|
| MT5 標準帳戶點差 | 減少 50% (60 → 30 點) |
減少 30% (23 → 16 點) |
| MT5 免掉期帳戶點差 | - | 減少 27% (49 → 36 點) |
| MT5 零點差帳戶調整 | 減少 30% (0.05% → 0.035%) |
- |
| 槓桿 | 提升至 1:800 | - |
| 交易量上限 | 提升 50% (10 → 15 手) |
- |
| 部位大小 | 提供 XAGUSD 微型合約 | 提供 XAUUSD 微型合約 |
新產品上市:銅 (XCUUSD)
將您的金屬交易擴展至黃金與白銀以外,槓桿最高可達 1:500。交易與全球經濟成長及工業需求密切相關的銅,讓您在黃金與白銀之外,擁有更多元化金屬策略的選擇。
加密貨幣交易
主要加密貨幣的交易條件已大幅提升,讓您能更高效地交易波動快速的市場。
改進內容
| 交易條件 | Bitcoin (BTC) | Ethereum (ETH) | Ripple (XRP) |
|---|---|---|---|
| MT5 標準帳戶點差 | - | 減少 34% ($2.41 → $1.58) |
減少 39% ($0.0018 → $0.0011) |
| MT5 免掉期帳戶點差 | 減少 48% ($100.14 → $52.42) |
減少 22% ($2.79 → $2.18) |
減少 19% ($0.0021 → $0.0017) |
| MT5 零點差帳戶調整 | 減少 20% (0.025% → 0.02%) |
減少 40% (0.05% → 0.03%) |
減少 40% (0.05% → 0.03%) |
| 槓桿 | 提升 (1:700 → 1:800) |
提升 (1:600 → 1:800) |
提升 (1:400 → 1:500) |
| 交易量上限 | 提升 150% (20 → 50 手) |
提升 150% (300 → 750 手) |
提升 19% (420,000 → 500,000 手) |
美國指數
美國指數現已大幅升級槓桿、點差及調整,讓短線與中線交易者享有更具競爭力的條件。
改進內容
| 交易條件 | S&P 500 | Nasdaq 100 | Dow Jones |
|---|---|---|---|
| 點差 | 減少 46% ($0.67 → $0.36) |
減少 64% ($2.50 → $0.90) |
減少 55% ($3.99 → $1.80) |
| MT5 零點差帳戶調整 | 減少 50% (0.007% → 0.0035%) |
減少 50% (0.007% → 0.0035%) |
減少 50% (0.007% → 0.0035%) |
| 槓桿 | 提升 2 倍 (1:200 → 1:400) |
提升 2 倍 (1:200 → 1:400) |
提升 2 倍 (1:200 → 1:400) |
| 交易量上限 | 提升 50% (500 → 750 手) |
提升 100% (100 → 200 手) |
提升 50% (100 → 150 手) |
倍數交易
偏好定義風險的交易方式嗎?倍數產品同樣升級,調整更低,倍數等級更高。
| 交易條件 | 黃金與白銀 | 加密貨幣 (BTC, ETH, XRP) |
|---|---|---|
| 調整 | 減少 33% (0.0179% → 0.012%) |
- |
| 倍數等級 | 最高 800 倍 (原為最高 500 倍) |
最高 800 倍 (原為最高 500 倍) |
立即在 Deriv 以更佳條件交易
更低的交易成本將直接影響您的最終收益。無論您是日內多單操作的交易者,還是持有長線觀點的波段交易者,點差降低與更佳的交易條件都意味著更多潛在利潤將留在您的帳戶中。與往常一樣,更高的槓桿帶來更大的市場曝險與靈活性,但同時也增加風險,因此請務必根據您的策略與風險承受度進行交易。

美國指數上漲,科技財報成為焦點
美國股市指數以嶄新動能迎接新的一個月,華爾街擺脫了大宗商品、加密貨幣及人工智慧類股的波動。
美國股市指數以嶄新動能迎接新的一個月,華爾街擺脫了大宗商品、加密貨幣及人工智慧類股的波動。報導顯示,道瓊工業指數週一上漲超過500點,而S&P 500上漲約0.5%,收盤僅略低於創新高。那斯達克綜合指數同樣上揚,顯示即使重量級科技股再度承壓,市場依然展現韌性。
本週將有超過100家S&P 500成分公司公布財報,市場焦點正從宏觀新聞轉向企業基本面。隨著投資人尋求成長預期能否維持的確認,許多人認為指數走向如今取決於財報能否證明漲勢合理並支撐進一步上行。
是什麼推動美國指數?
美國指數月初的強勢反映出經濟訊號改善與廣泛財報樂觀的結合。週一公布的製造業數據顯示,活動量近一年來首次擴張,無論是Institute for Supply Management還是S&P Global,1月的生產數據都優於預期。
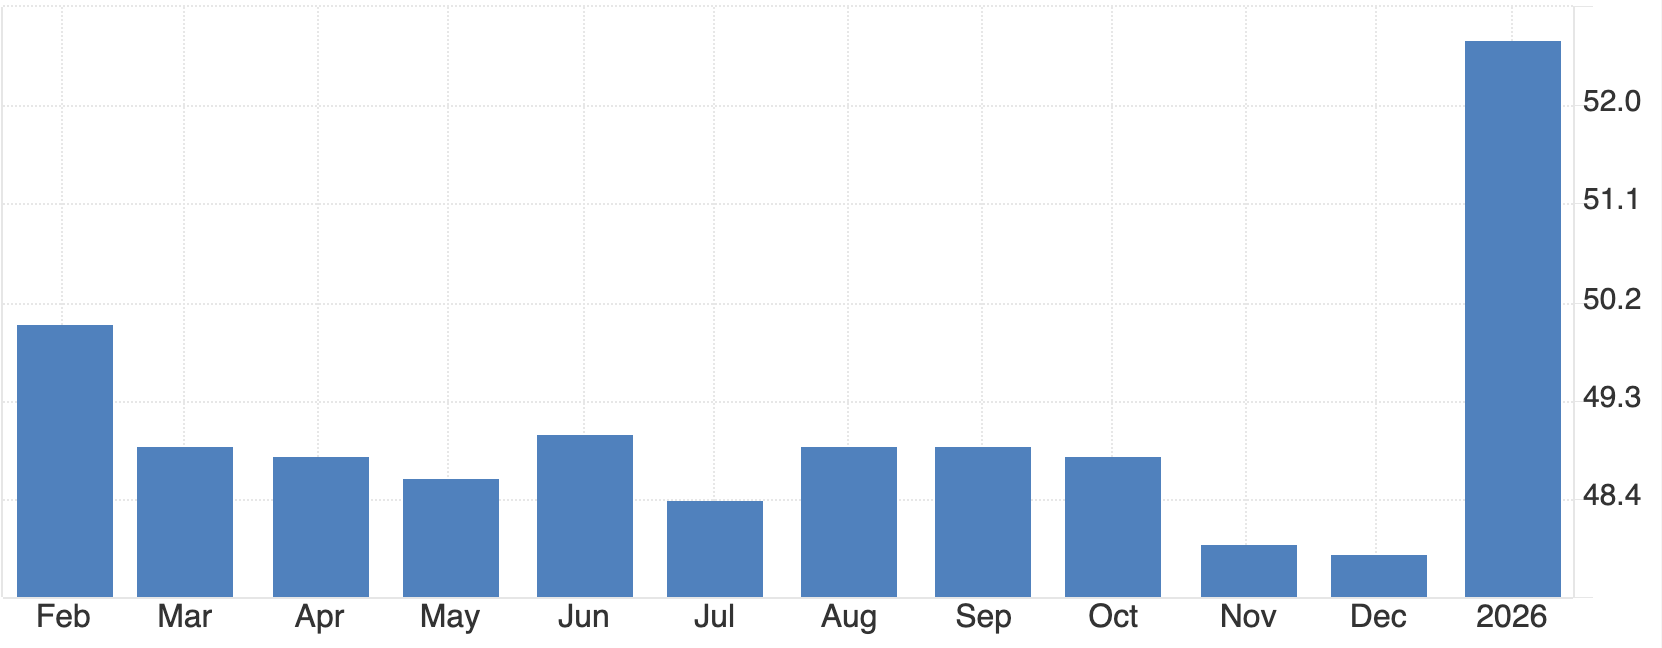
這些數據有助於抵消在美國總統Donald Trump提名Kevin Warsh為下一任Federal Reserve主席後,貨幣政策不確定性所帶來的影響。
財報動能也轉向有利於指數穩定。漲幅不僅限於超大型科技股,也擴及工業、消費類股及半導體。Sandisk大漲15%,領漲S&P 500,而Caterpillar與Walmart則推動道瓊走高。產業參與度提升,正值指數似乎較不受單一科技股波動影響的時期。
重要意義
對投資人而言,指數能在科技表現分歧下仍然上漲,是一個值得注意的訊號。Nvidia股價在有報導稱OpenAI重新考慮一項1,000億美元投資計畫,並對現有晶片基礎設施感到不滿後,下跌近3%。然而那斯達克仍持續上揚,顯示AI相關的不確定性正趨向個別公司,而非系統性風險。
根據Morgan Stanley分析師的說法,市場正「從敘事驅動的熱情轉向財報驗證」。這種轉變對指數前景至關重要。當基準指數在負面新聞下仍能穩住,往往反映出對整體盈餘成長的信心,而非投機性布局。
對市場與投資人的影響
股票與其他資產類別的分歧日益明顯。美國指數上漲之際,貴金屬則持續大幅回落。黃金在上週突破每盎司5,600美元後,跌破4,700美元,白銀則在創下單日最大跌幅後依然波動。比特幣也在短暫跌至4月以來新低後,於78,000美元附近企穩。
對以指數為主的投資人而言,這種分歧強化了股票的吸引力,因資本正自擁擠交易中流出。儘管美元走強、10年期Treasury殖利率升至4.3%附近,股市估值依然獲得支撐。
這種韌性顯示,市場正優先考量盈餘可見度,而非短期利率或匯率壓力。
專家展望
市場目光現已聚焦於Big Tech財報。Amazon、Alphabet與Advanced Micro Devices的業績預計將決定指數漲勢能否延續至月初反彈之後。Palantir優於預期的指引已提振市場情緒,而Microsoft上週較為平淡的反應則提高了同業的門檻。
風險依然存在。由於部分政府關門,週五美國就業報告延後發布,這使得利率預期的一項關鍵依據缺席。勞動市場數據的缺乏可能導致波動加劇,因指數將對個別財報驚喜做出反應,卻缺乏明確的宏觀經濟背景。未來走勢將更著重於確認,而非單純動能。
重點摘要
本月初的交易時段出現漲勢,然而市場走向仍對即將公布的經濟數據與財報驚喜高度敏感。關鍵在於,漲勢已不再依賴單一科技敘事,這有助於分散近期指數波動的驅動因素。大宗商品與加密貨幣的波動性反映的是資金輪動,而非避險情緒。隨著Big Tech財報與勞動數據即將出爐,接下來的交易時段將決定指數能否將穩定轉化為持續上行。
抱歉,無法找到符合 的結果。
搜尋提示:
- 檢查拚寫並重試
- 嘗試其他關鍵字