結果

Yen carry trade in reverse: Japan’s yield shift and its impact on USD/JPY
As domestic yields rise, Japanese investors are increasingly repatriating funds from abroad, strengthening the yen and unsettling one of the world’s longest-standing funding trades.
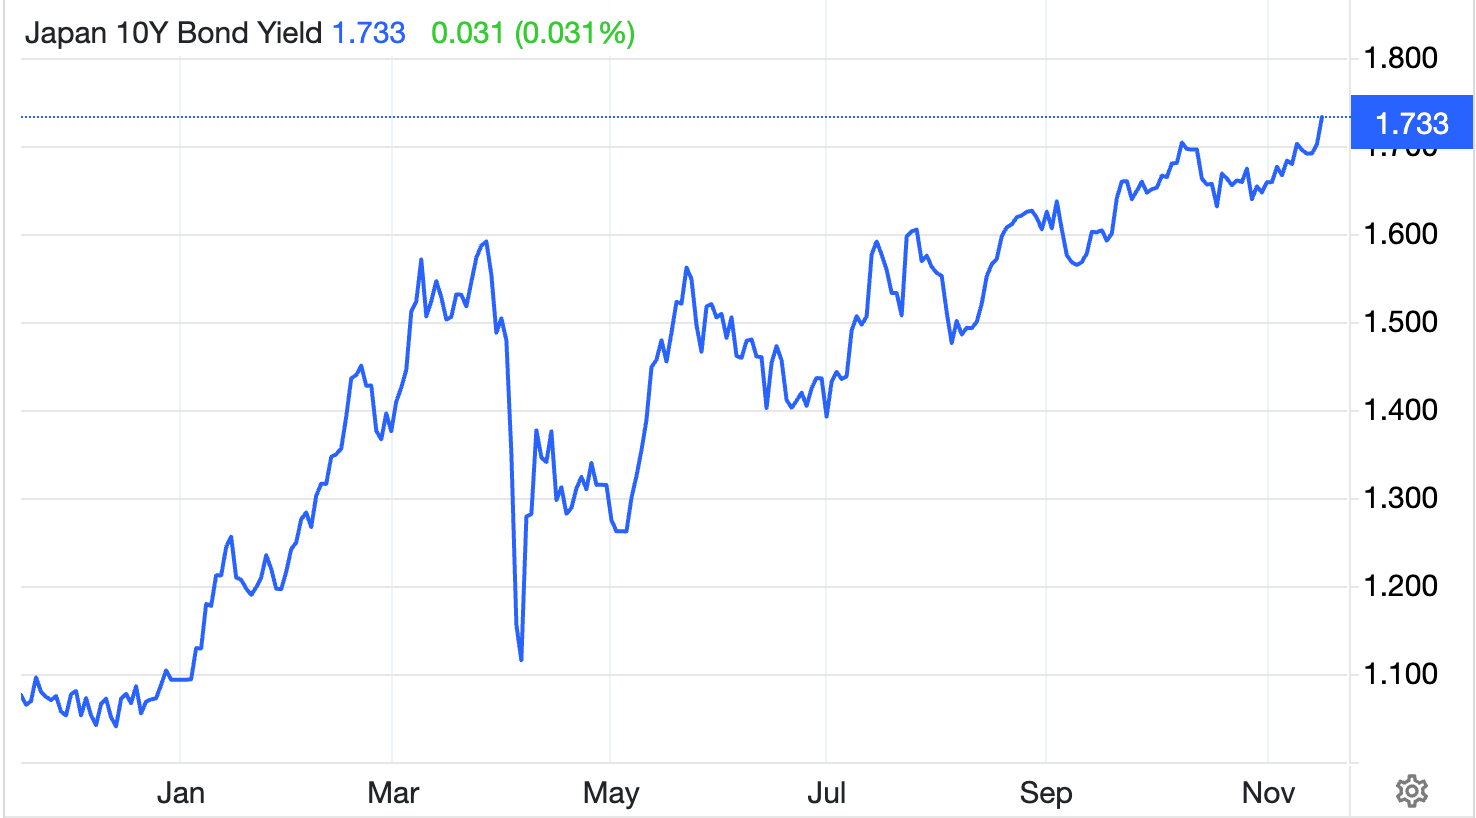
Japan’s bond market is rewriting the rules of the global foreign exchange market. The country’s 10-year government bond (JGB) yield has surged to 1.73% - its highest level since June 2008 - as markets brace for a ¥17 trillion (£88 billion / $110 billion) fiscal stimulus and a further reduction in Bank of Japan (BoJ) bond purchases. The move signals the beginning of a new phase: the yen carry trade in reverse.
As domestic yields rise, Japanese investors are increasingly repatriating funds from abroad, strengthening the yen and unsettling one of the world’s longest-standing funding trades.
The question now dominating markets is clear - will this shift pull USD/JPY back from its multi-decade highs near 156, or force the BoJ and Ministry of Finance (MoF) to intervene once again to stabilise the currency?
Key takeaways
- Japan’s 10-year bond yield has reached 1.73%, the highest since 2008, as markets price in rising inflation, fiscal stimulus, and reduced BoJ support.
- The BoJ’s gradual normalisation - with short-term rates now at 0.5% - is driving a global reassessment of the yen’s funding role.
- A planned ¥17 trillion stimulus aims to offset Japan’s 0.4% GDP contraction in Q3 but risks adding inflationary pressure.
- Rising yields are drawing capital back into Japan, prompting a partial unwinding of the yen carry trade.
- USD/JPY faces key resistance near 155–156, a zone where past interventions have been triggered.
Japan bond yields go up to breach the 1.7 mark
After nearly two decades of near-zero yields, Japan’s bond market is finally moving under its own weight.
The 10-year JGB yield, which stayed below 1% for years due to the BoJ’s Yield Curve Control (YCC), has now broken decisively higher - a sign that investors expect sustained inflation, more fiscal spending, and a lighter BoJ hand in the market.
Several forces have converged:
- The BoJ is tapering bond purchases, reducing artificial demand for JGBs.
- Short-term policy rates have been raised to 0.5%, marking the end of an era of negative rates.
- A massive stimulus plan under Prime Minister Sanae Takaichi is expected to inject over ¥17 trillion into the economy through tax cuts, infrastructure spending, and household support.
Together, these dynamics have pushed bond yields to levels unseen since the global financial crisis, marking what analysts describe as the end of Japan’s “zero-cost money” era.
Higher yields despite Japan’s fragile economy
Despite higher yields, Japan’s economy remains fragile. Data from the Cabinet Office show that GDP contracted by 0.4% in Q3, its first decline in six quarters. Weak residential investment and subdued consumer demand dragged growth lower, even as exports rebounded slightly in September.
BNP Paribas economist Ryutaro Kono noted that while the contraction is not “particularly serious”, it highlights uneven recovery momentum. Still, the forthcoming stimulus package - expected to be approved soon - aims to restore confidence and support households facing rising living costs.
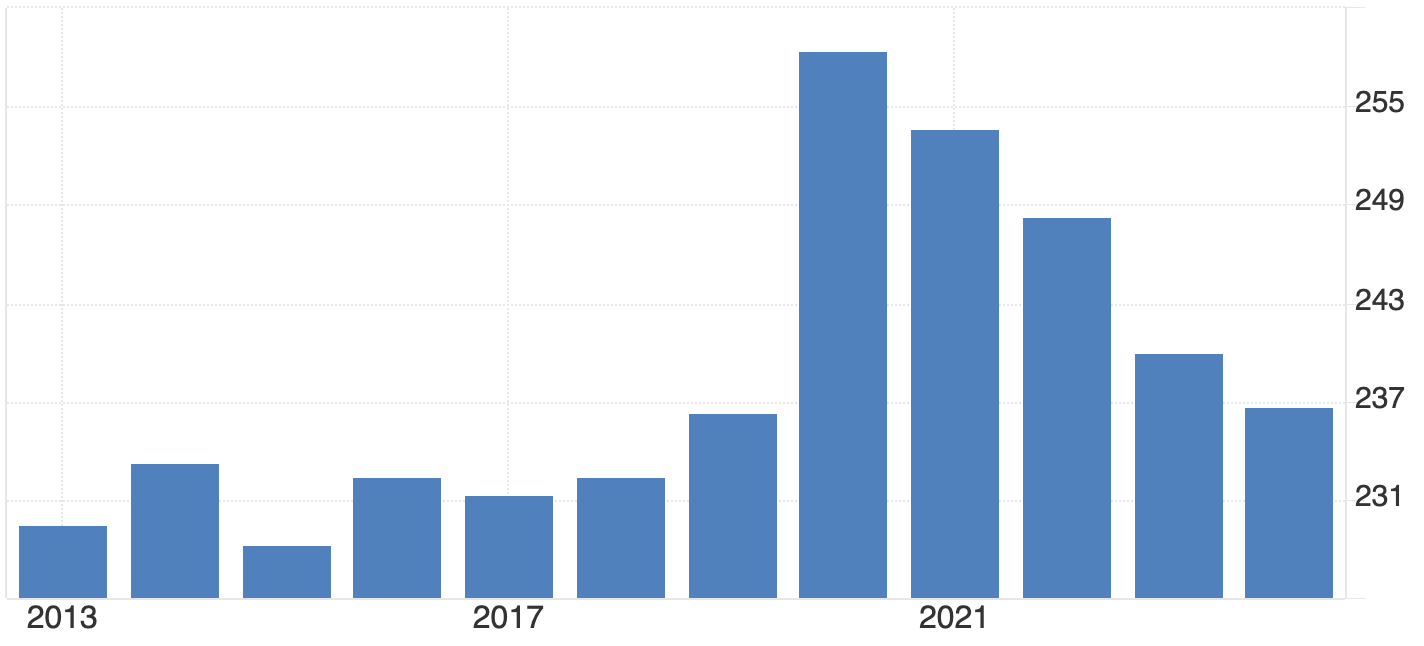
Yet the market reaction suggests scepticism. Investors view fiscal expansion as inflationary and debt-heavy. With Japan’s public debt exceeding 230% of GDP, every new round of spending increases pressure on the bond market - and by extension, the yen.
The mechanics: Why higher yields strengthen the yen
The surge in Japanese yields has immediate foreign exchange implications, particularly for the USD/JPY exchange rate.
1. Repatriation of capital
Japan’s institutional investors - who collectively hold trillions of dollars in foreign bonds - are now finding better returns at home. As domestic yields climb, they begin selling U.S. Treasuries, European debt, and emerging market assets to reinvest in JGBs. This process increases demand for yen, supporting its value against major currencies.
2. Unwinding the carry trade
The yen carry trade - borrowing in low-yielding yen to buy higher-yielding assets abroad - has been a cornerstone of global markets for years. With Japanese rates rising, this trade becomes less profitable. Traders must buy yen to repay loans, triggering powerful short-term rallies.
3. Yield Differentials and Global Comparison
Even with U.S. 10-year yields near 4–5%, Japan’s rapid shift from near-zero to 1.7% is significant. For Japanese investors who once earned nothing on domestic bonds, the new yield environment is competitive enough to slow outflows and boost inflows, tilting currency dynamics in favour of the yen.
Yen policy trade-offs: Growth, debt, and stability
For the BoJ, this shift poses a major challenge. Governor Kazuo Ueda must balance a weak economy, rising inflation, and market volatility. The ¥17 trillion fiscal push could revive domestic demand, but it also risks fueling inflation expectations and adding strain to already high debt levels.
If yields rise too high, the BoJ may need to intervene in bond markets again or issue verbal guidance to temper speculation. Finance Minister Satsuki Katayama has already warned she is “watching FX moves with a sense of urgency”. Historically, such language has preceded yen-supportive interventions, particularly when USD/JPY nears 155–156 - a zone Credit Agricole analysts flag as Tokyo’s soft intervention threshold.
Geopolitics: China tensions and trade headwinds
External risks compound Japan’s policy dilemma. Relations with China have deteriorated following Takaichi’s remarks on Taiwan, prompting mutual travel warnings and raising fears of trade retaliation.
Economists such as Marcel Thieliant at Capital Economics warn that restrictions on rare earth exports or Japanese goods could escalate into a broader trade dispute - one that hurts exporters already under pressure from Chinese electric vehicle competition.
These tensions could trigger safe-haven inflows into the yen, but they also risk weakening Japan’s export engine - another reason why policymakers may resist further currency volatility.
USD/JPY forecast: Scenarios for late 2025
In the near term, a test of 145–148 remains plausible as capital returns home. But if the U.S. Federal Reserve delays rate cuts - keeping U.S. yields high - USD/JPY could stay anchored closer to 150–153.
Either way, the BoJ’s tolerance threshold around 156 is becoming a critical line for traders to watch. Traders can monitor these levels directly on Deriv MT5, which offers live market depth and advanced charting to track yen volatility in real time.
USD/JPY technical analysis

At the time of writing, USD/JPY is trading around 154.72, holding just below a fresh price discovery zone. The RSI sits flat just below the overbought threshold, signalling that bullish momentum remains strong but may be nearing exhaustion if no further upside breakout occurs.
Meanwhile, Bollinger Bands are expanding, indicating an increase in volatility. The price is hugging the upper band, reflecting sustained buying pressure - though such positioning often precedes short-term pullbacks or consolidation phases.
On the downside, immediate support lies at 153.00, with further key levels at 150.00 and 146.45. A break below these levels could trigger sell liquidations or panic selling, especially if sentiment turns against the dollar.
Overall, momentum currently favours the bulls, but with the RSI nearing overbought territory and price extended along the upper Bollinger Band, traders should watch for possible short-term corrections before any continuation higher.
Global ripple effects of yen
Japan’s yield shift is not an isolated story. As the world’s largest creditor nation, any repatriation of Japanese funds can affect global bond markets:
- U.S. Treasuries: Selling pressure from Japanese investors could lift U.S. yields.
- Europe and Australia: Investors may rebalance towards JGBs, driving global yield convergence.
- Emerging markets: Funding costs could rise as yen liquidity tightens.
The implications are profound - the end of Japan’s zero-yield era may gradually unwind two decades of global risk-taking built on cheap yen funding.
Investment and trading implications of yen
For traders, Japan’s bond market is now the most important variable in the yen equation.
- Short-term outlook: Higher JGB yields and repatriation flows could push USD/JPY lower towards 145–148, especially if U.S. yields stabilise.
- Medium-term: Fiscal stimulus and persistent inflation may keep yields elevated but volatile, anchoring USD/JPY near 150–153.
Intervention watch: If the pair nears 156, expect stronger verbal warnings and possible BoJ/MoF coordination.

美國通膨數據與勞動數據公布前的EUR/USD展望
隨著市場等待延遲的美國通膨數據明朗,EUR/USD維持區間震盪。
隨著市場等待延遲的美國通膨數據明朗,EUR/USD維持區間震盪。該貨幣對在1.156至1.166之間交易,交易者在消費者物價指數(CPI)數據揭示聯邦儲備是否將維持鴿派立場或暫停進一步寬鬆之前,持謹慎態度。
數據缺失降低了波動性,使歐元對走軟的美元保持穩定,市場在權衡經濟增長放緩、利率預期轉變及全球風險情緒改善。
主要重點
- EUR/USD在1.1642附近保持穩定,於1.156–1.166狹窄區間內交易,交易者等待CPI數據公布。
- 美國政府關門後數據延遲,凍結市場方向並削弱美元動能。
- 政策分歧縮小,聯邦儲備傾向降息,而歐洲央行保持穩定。
- 歐元區穩定與情緒改善與美國不確定性形成對比,支持歐元韌性。
- 波動性壓縮暗示通膨數據公布後可能出現突破。
美國通膨與勞動數據延遲持續,市場停滯
美國通膨與勞動數據延遲公布,導致市場缺乏方向。勞工統計局(BLS)仍在處理近期政府關門造成的干擾,部分十月數據可能永遠不會公布。
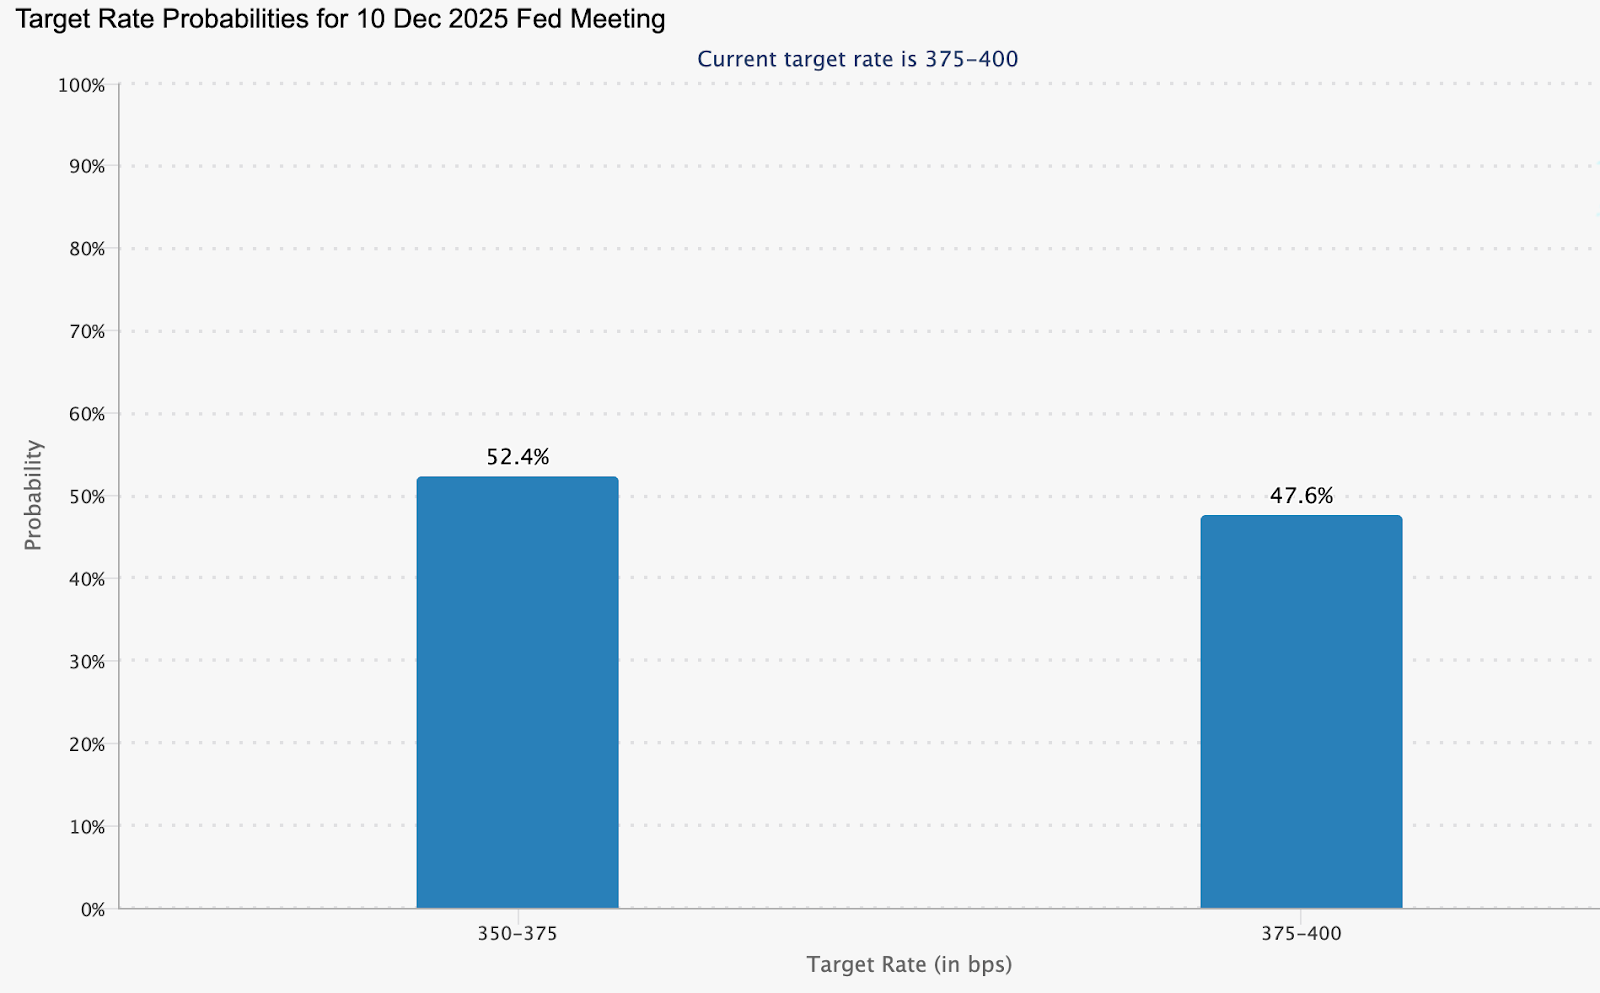
這種不透明使交易者和政策制定者陷入癱瘓。缺乏CPI或非農就業數據,聯邦儲備的決策只能靠推測。根據CME FedWatch工具,市場目前預計12月降息25個基點的機率為52.4%,但信心迅速減弱。
同時,風險偏好正在改善,歐洲指數保持穩定——這種組合通常會削弱美元。隨著風險偏好擴散,歐元從改善的資本流動和對避險資產需求減少中獲得被動支持。
隨著ECB與Fed政策差距及增長分歧縮小,歐元走強
除了目前的數據黑暗期,更廣泛的基本面正傾向支持歐元。國際貨幣基金組織(IMF)預測美國GDP增長將從2.8%放緩至2025年的2.0%,而歐元區增長率預計將從0.9%上升至1.2%。這種增長差距縮小削弱了美元的傳統優勢之一。
貨幣政策也在趨同。歐洲央行(ECB)可能已結束寬鬆階段,而Federal Reserve 隨著美國動能降溫,似乎更接近降息。收益率差距縮小對EUR/USD歷史上是利多。
同時,歐元區穩定成為資產。能源風險減退,政治波動緩和,消費者信心顯示微弱復甦跡象。結構性風險減少且貨幣政策穩定,歐元不再需要靠樂觀情緒推升,只需保持穩定,因美元掙扎尋找方向。
CPI數據影響:市場最大盲點
通膨仍是關鍵點。若美國CPI意外上升,市場可能重新定價聯邦儲備暫停政策的預期,推低EUR/USD。反之,較弱的數據將驗證鴿派前景,增強歐元優勢。
目前,通膨數據缺失本身已成為催化劑。沒有新數據,交易者越來越依賴情緒和技術信號而非基本面。這壓縮了波動性並降低信心,但持續時間越長,最終突破可能越強烈。
EUR/USD投資啟示:動能遇阻
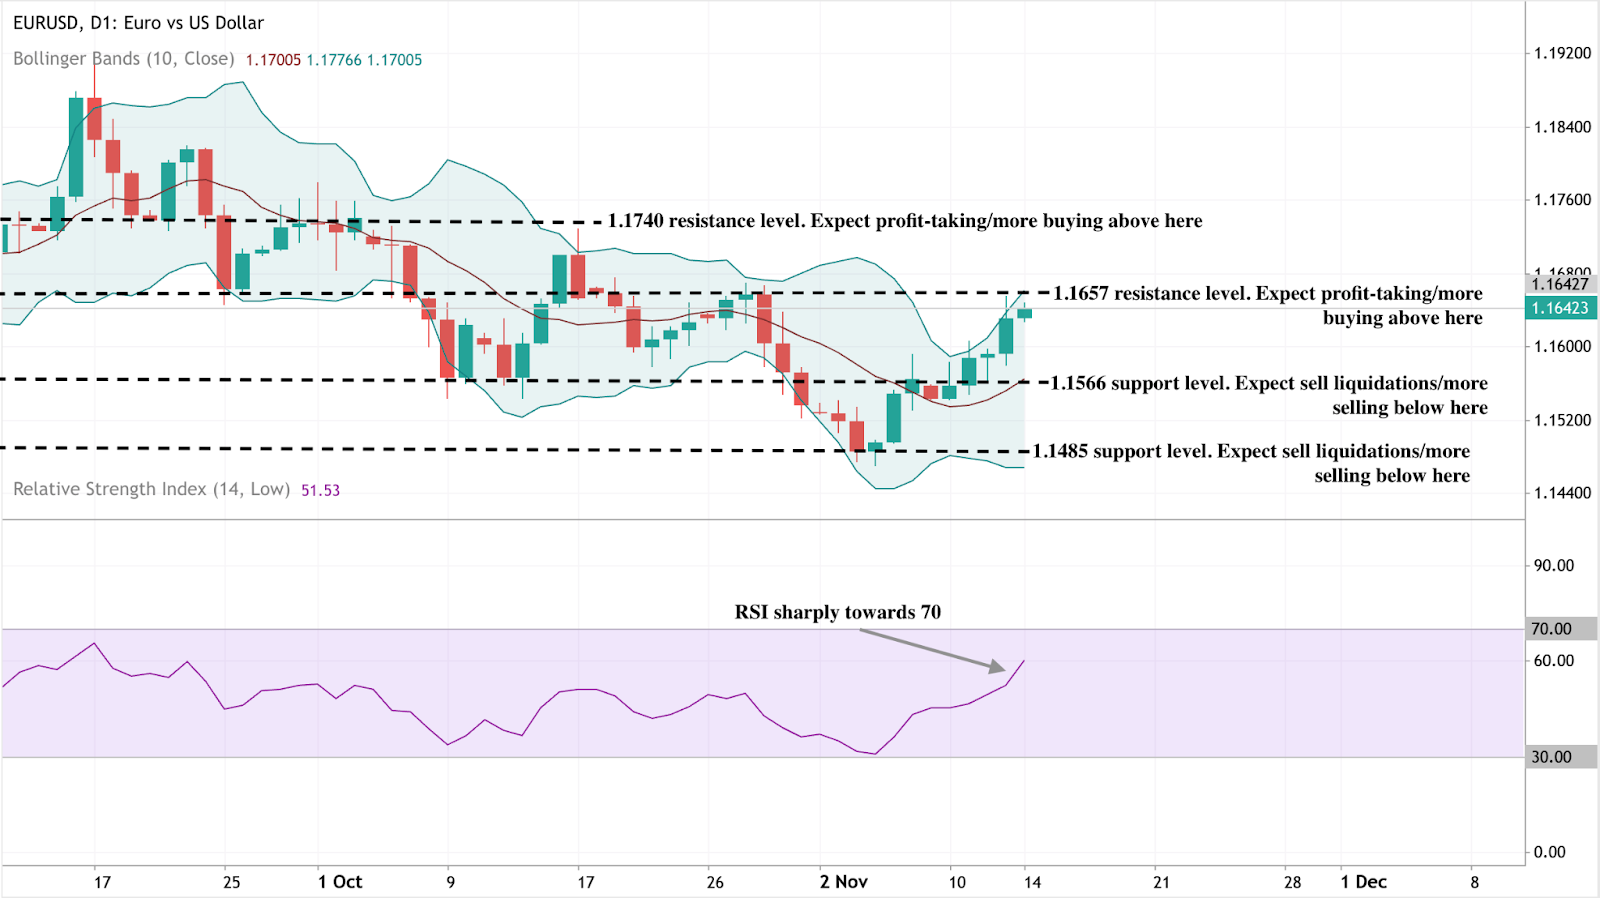
撰寫時,EUR/USD在1.1642附近交易,動能偏多但面臨關鍵阻力區。
布林帶顯示價格正壓迫上軌,暗示波動性升高及強勁買盤壓力。然而,當匯價接近1.1657時,交易者可能預期獲利了結或短期盤整,然後才有進一步上漲。
若能明確突破1.1740,將強化多頭情緒並吸引更多買盤。下方即時支撐位於1.1566,較深支撐約在1.1485。跌破這些水平可能引發拋售清算及新一波下行壓力。
同時,RSI接近70,顯示該貨幣對接近超買區,暗示趨勢恢復上行前可能出現短期修正。
EUR/USD投資啟示
對交易者而言,這是一個以耐心而非激進為特徵的市場。圍繞1.156–1.166的區間交易仍具可行性,但鑑於數據驅動突破的風險,嚴格止損至關重要。
中期投資者應注意,歐元的基本穩定性、增長差距縮小及歐元區風險降低,若美元持續走弱至2026年初,可能支撐歐元逐步上行至1.18–1.20。
隨著波動性壓縮,風險管理變得關鍵。利用Deriv交易計算器,交易者可在下單前估算點值、保證金需求及潛在盈虧。此精確度有助於管理關鍵水平(如1.156支撐或1.174阻力)附近的風險,這在低波動市場中尤為重要。
隨著EUR/USD徘徊於關鍵技術水平,交易者可在Deriv MT5追蹤即時價格走勢,並利用Deriv交易計算器規劃數據驅動的入場點。CPI報告公布時,這兩項工具將是識別突破動能及實時管理風險的關鍵。

白銀價格預測:為何這次金屬的漲勢更具實力
分析師指出,過去五天白銀的漲勢並非虛假曙光,而是建立在基本面而非恐慌之上的走勢。
分析師指出,過去五天白銀的漲勢並非虛假曙光,而是建立在基本面而非恐慌之上的走勢。與過去的投機性飆升不同,這波漲勢反映了貨幣寬鬆預期、供應緊張狀況以及來自再生能源和半導體製造的工業需求激增的匯聚。
隨著美元承壓且交易者預期十二月降息,白銀近期的強勢顯示這是由基本面驅動的階段開始,而非另一波短暫的樂觀情緒爆發。
主要重點
- 白銀交易價格接近54.40美元,延續自十月以來最強勁的漲勢。
- 聯準會降息機率升至68%,促使投資者轉向無收益資產,如白銀。
- 自2016年以來,礦產供應下降了7%,工業需求超越生產。
- 再生能源與電動車需求現已占白銀總消費量超過一半。
白銀政策轉變與數據疲弱推動買盤
白銀最新的漲勢是由利率預期的急劇轉變引發。近期美國數據顯示經濟動能減弱——根據ADP,私營部門每週新增就業人數至十月底約減少11,000人。這種放緩增強了市場對聯準會十二月降息的信心,降息機率從62%攀升至68%,由CME FedWatch工具追蹤。
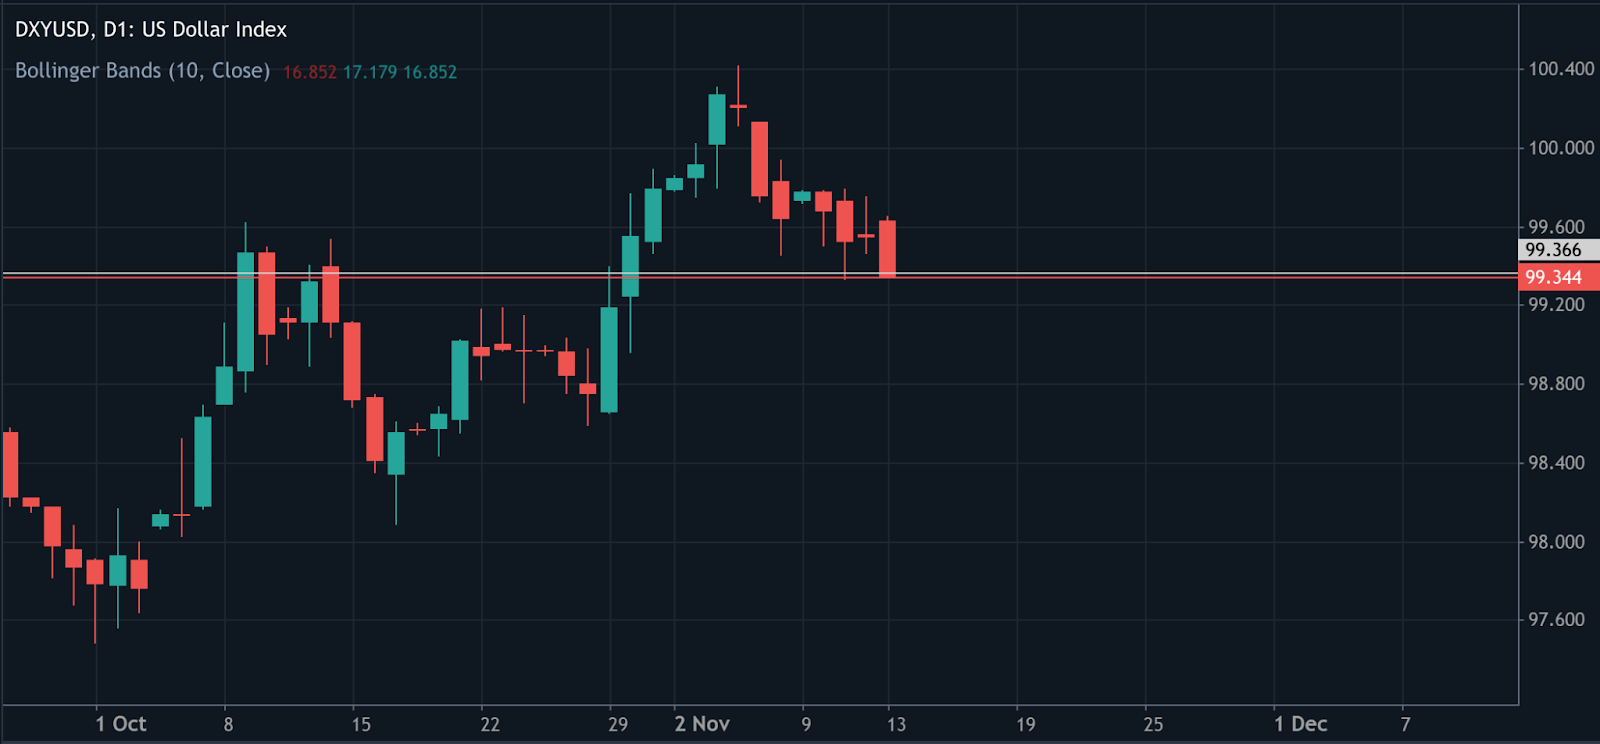
較低利率通常會削弱美元並提升對無收益避險資產的需求。美元指數(DXY)已下滑至約99.60,隨著投資者尋求低收益現金的替代品,黃金與白銀的漲幅被放大。
通常,美國政府關門的進展會抑制避險需求,但這次政策預期超越了政治因素。市場反應的是更廣泛的故事:經濟成長放緩與聯準會被迫寬鬆。
從恐懼到基本面:白銀的供應赤字與需求故事
這波漲勢標誌著與過去由投機交易驅動的情況不同。根據Sprott資產管理公司,白銀的強勢現今根植於結構性供應赤字與工業擴張,而非炒作。自2016年以來,礦產總產量下降了7%,而來自再生能源、電動車(EV)及電子產品的需求持續穩定上升。
白銀工業需求持續超越供應增長
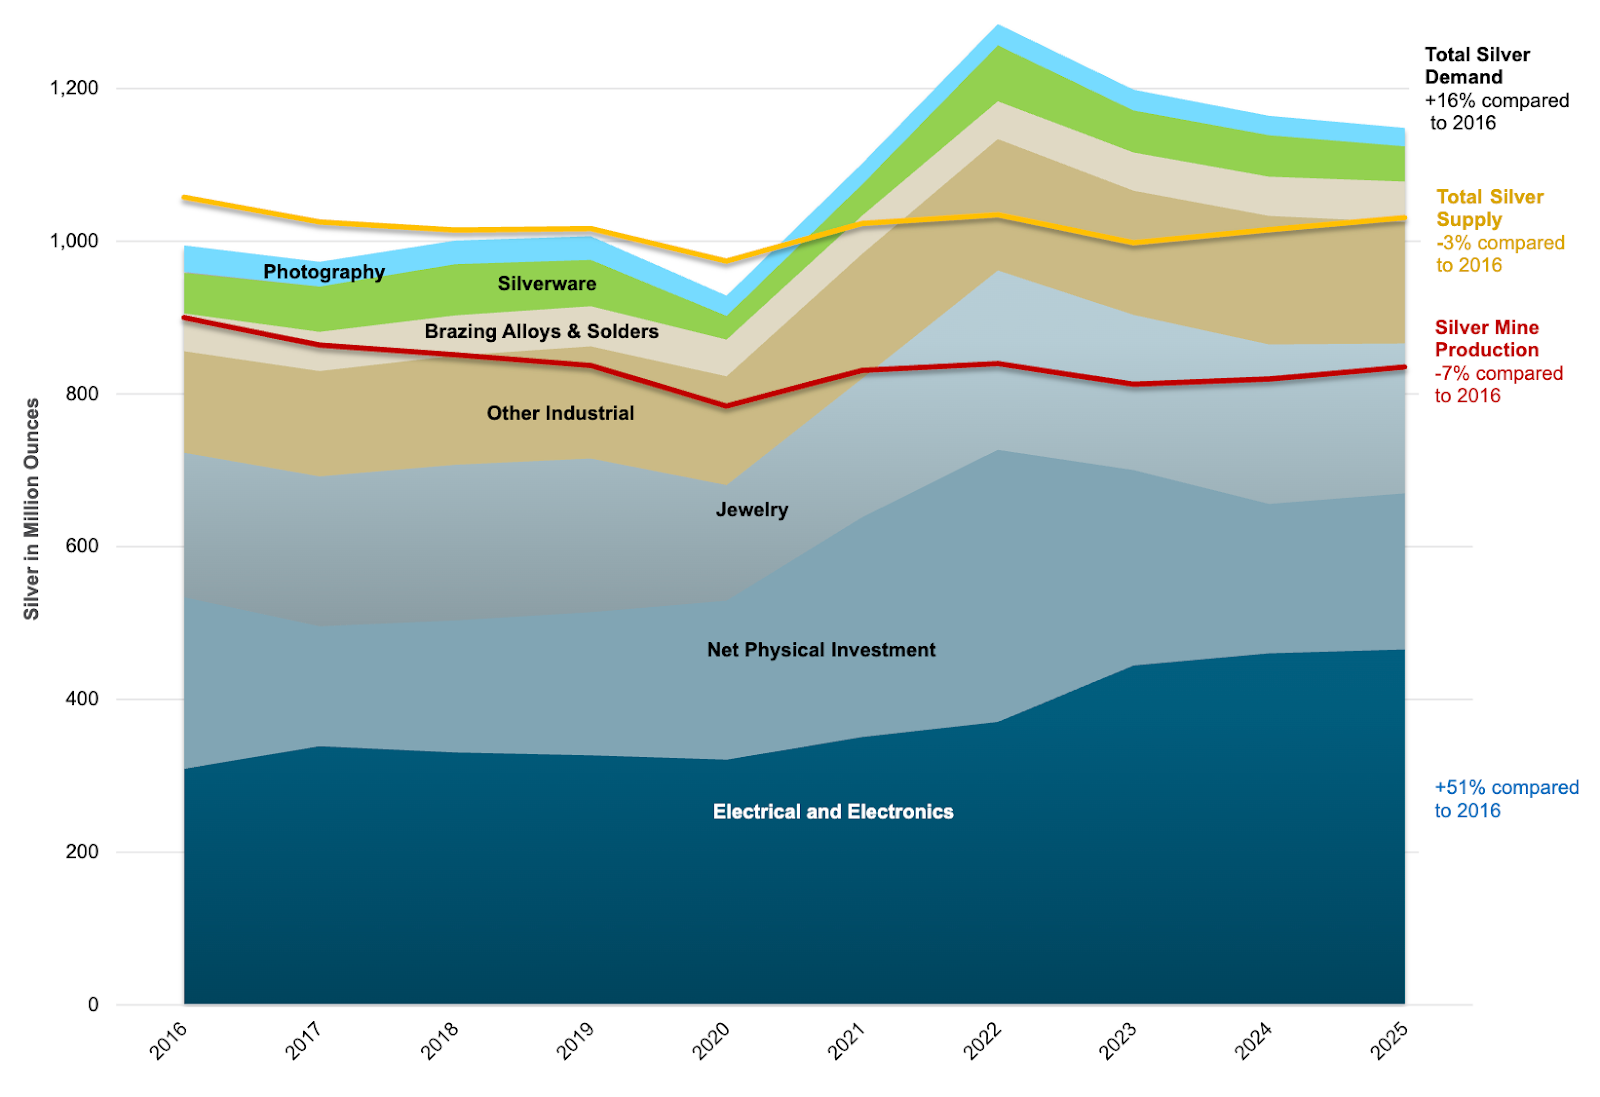
超過一半的白銀總需求來自工業應用——主要是太陽能板製造、半導體及電動車零組件。然而供應未能跟上腳步。回收量僅有適度成長,新礦投資仍有限,導致市場日益緊張。
正如一位分析師所言,「這是多年來首度由工廠需求而非恐懼驅動的白銀漲勢。」
若您計劃進場交易,Deriv 交易計算器可協助您估算保證金、隔夜利息及在Deriv平台(如Deriv MT5)上的潛在利潤。
宏觀背景:美元疲弱與鴿派政策
整體環境強化了白銀的強勢。美元走弱、殖利率下跌及經濟指標疲軟的組合,為貴金屬創造了理想條件。密西根大學消費者信心指數降至2022年以來最低,零售活動放緩,顯示聯準會的緊縮週期已達極限。
美國消費者信心


黃金也助長了該產業的動能,十月曾短暫突破每盎司4,300美元。白銀傳統上波動較大,受惠於投資者為預期長期貨幣寬鬆而在金屬間分散投資的溢出效應。
同時,銅的供應緊縮也支持整個金屬族群正進入供應主導的重新估值階段的論點。銅所面臨的結構性短缺現象如今也出現在白銀,凸顯一個共同敘事:關鍵商品的需求增長超越生產。
工業實力:白銀週期的新驅動力
白銀兼具避險金屬與工業金屬的雙重角色,使其在商品中獨樹一幟。
黃金主要依賴投資者與央行需求,白銀則受益於其在清潔能源與科技供應鏈中的角色。預計2025年太陽能裝置將達到歷史新高,電動車採用率持續加速。
分析師估計,再生能源與電子產品的需求在未來至少兩年將增長速度快於礦產產出,預計2025年價格將上漲34%,2026年上漲8%。即使是消費的適度增加,也會因持續赤字而引發價格的過度反應。
白銀技術面洞察
撰寫本文時,白銀(XAG/USD)正測試54.30美元阻力位,該區域是強勁多頭漲勢後可能出現獲利了結的關鍵區域。相對強弱指標(RSI)徘徊於69附近,接近超買區,顯示買盤動能可能耗盡,短期內可能出現盤整或回調。
布林帶顯示價格緊貼上軌,表明強勁多頭壓力,但也存在短期過度延伸的風險。若能果斷突破54.30美元,可能吸引更多買盤,目標創新高。
然而,若未能突破此位,可能引發回落至47.00美元支撐位,屆時買方可能重新出現。再往下,下一關鍵支撐位為41.28美元,標誌著與早期累積相關的較深支撐區。

白銀的風險與潛在反轉
儘管前景強勁,仍存在一些風險:
- 若美國數據強勁,美元反彈可能暫時限制漲幅。
- 工業復甦放緩或再生能源推廣減少,可能削弱需求增長。
- 短期獲利了結可能引發50至52美元區間的波動。
不過,這些很可能只是暫時修正,而非趨勢反轉。供應緊張狀況與穩健的工業基本面為市場提供了堅實的支撐。
白銀展望:由實質支撐的漲勢
白銀的上升不僅是投機,更是結構性變化。隨著貨幣政策轉向寬鬆及工業需求加速,市場正從反應性交易轉向長期重新估值。
分析師預期2025年白銀將維持在每盎司50美元以上,若降息成真且工業活動穩定,可能重測十月54美元高點。宏觀經濟寬鬆、綠能擴張與供應赤字的結合,為這波漲勢提供了十多年來最可信的基礎。
簡言之,恐懼或許點燃了漲勢,但現在是基本面在推動它。

人工智慧、電動車與能源需求攀升,銅會成為下一個石油嗎?
銅在全球經濟中的角色正從工業原料轉變為支撐能源與科技轉型的戰略資源。
是的——數據越來越支持這一觀點。銅在全球經濟中的角色正從工業原料轉變為支撐能源與科技轉型的戰略資源。倫敦金屬交易所(LME)銅價接近每噸11,000美元,自2025年1月以來上漲約27%,因人工智慧數據中心、電動車(EV)和可再生能源基礎設施的需求激增。
由於全球供應難以跟上步伐,分析師認為銅很快可能成為現代增長中與20世紀石油同等重要的資源——為從高壓電網到數位時代的人工智慧伺服器提供動力。
主要重點
- 銅價維持在接近歷史高點,受到人工智慧數據中心、電動車及可再生能源項目需求的支撐。
- 智利與秘魯的供應中斷,加上礦石品位下降與項目延遲,正使全球產量趨緊。
- 退休金與主權財富基金等機構資金流入,已將銅轉變為戰略投資資產。
- 摩根大通預計銅價將於2026年初達到每噸12,000美元,摩根士丹利則預測供應缺口將持續擴大至2029年。
- 貿易政策不確定性與聯準會(Fed)謹慎態度可能造成短期波動,但結構性基本面仍極為看多。
銅供應短缺遇上需求激增
與以往商品繁榮不同,銅的漲勢並非投機所致,而是對深層結構性失衡的反應。全球產量持續吃緊,目前約有6%的供應因南美洲的勞工罷工、天氣干擾及基礎設施瓶頸而中斷。
智利與秘魯合計約占全球銅產量40%,正面臨嚴重的營運壓力。受損的物流網絡、維護計劃延遲及運輸能力有限,限制了礦石運輸,而老舊的冶煉廠產能也低於正常水平。
地質條件更是雪上加霜。新銅礦床礦石品位較低——通常銅含量為0.3%至0.8%,而過去數十年則為2%至5%。這意味著礦工必須處理更多岩石才能產出相同金屬量,從而增加成本與環境負擔。
同時,礦山開發週期已延長至七至十八年,限制了新供應對需求上升的快速反應能力。摩根士丹利預測2026年全球將出現59萬噸的供應缺口,預計到2029年將擴大至110萬噸,為二十多年來最大缺口。

銅需求革命:人工智慧、電動車與潔淨能源
未來十年的銅需求將不再來自建築或傳統製造業,而是來自推動全球能源與數據轉型的技術。
人工智慧數據中心已成為銅需求的重要新來源。根據美國能源部及勞倫斯伯克利國家實驗室的研究,數據中心到2028年可能消耗美國總電力的6.7%至12%,高於2023年的4.4%。每個新設施都需要大量銅用於電纜、變壓器和電力分配。
電動車(EV)是另一個主要成長動力。每輛電動車約含40至50公斤銅,約為汽油車的四倍。隨著電動車產量在全球擴大,銅在汽車製造中的角色迅速增長。
同時,可再生能源領域,尤其是風能與太陽能,持續吸收前所未有的銅用量。單一2至3兆瓦的海上風力發電機,其發電機線圈、配線及控制系統就使用5至7噸銅。電網現代化與電池儲能投資更進一步增加銅的需求強度。
這些力量共同推動了許多分析師所稱的「一代人難得一見的需求轉型」,使銅成為電氣化、數位化與去碳化之間的關鍵連結。
銅的動能:從工業金屬到戰略資產
銅不再只是工業金屬,而是金融與戰略資產。倫敦金屬交易所仍是全球定價的主要基準,但2025年銅期貨與ETF的交易量大幅攀升。
包括退休金基金與主權財富基金在內的機構投資者,增加了對銅的配置,作為對全球能源轉型的避險。這種機構需求加劇了現有的供應壓力,形成價格上漲吸引更多資金流入的反饋循環。
商品策略師指出,這一循環正變得自我強化:「只要缺口持續存在,投資者就會持續購買短缺的資源。」一位分析師如是說。
在Deriv MT5平台上,交易者可透過先進的圖表與技術指標直接監控銅價(XCU/USD)走勢,使用專業交易環境中的機構級分析工具。
銅關稅、政策與聯準會謹慎態度
儘管基本面強勁,銅的短期表現仍受貿易與貨幣政策影響。
今年早些時候,川普政府對精煉銅的關稅政策變動,造成芝加哥商品交易所(CME)與倫敦金屬交易所(LME)基準價差波動。關稅初次提出時,美國銅價飆升,因進口商急於確保供應。當精煉銅獲得豁免後,價格回落,但這一差距凸顯了政治風險對金屬市場的影響。
2026年的關稅審查仍是重要風險事件,若豁免被取消,交易者預期將出現更多市場錯位。BCA Research的Roukaya Ibrahim分析師認為,「精煉銅關稅的持續可能性將繼續影響市場」,使美國價格保持溢價。
同時,聯準會對降息的謹慎態度暫時減緩了商品的投機性資金流入。但對長期投資者而言,銅供應的結構性緊縮掩蓋了短期政策噪音。
銅投資展望:邁向12,000美元及更高
摩根大通預測銅價可能於2026年初達到每噸12,000美元,較現價上漲約11%。其看多展望基於:
- 可再生能源、電動車與人工智慧基礎設施投資擴大。
- 主要生產商短期內供應反應有限。
- 冶礦開發週期長,延緩新產量釋出。
- 機構對商品配置的持續需求。
同樣地,摩根士丹利預計市場將進入22年來最嚴重的供應缺口,高盛則稱銅為「工業金屬複合體中最具吸引力的長期機會」。
若這些預測成真,銅價即使面臨暫時的宏觀經濟放緩,也可能維持在每噸10,000美元以上的新價格底部。
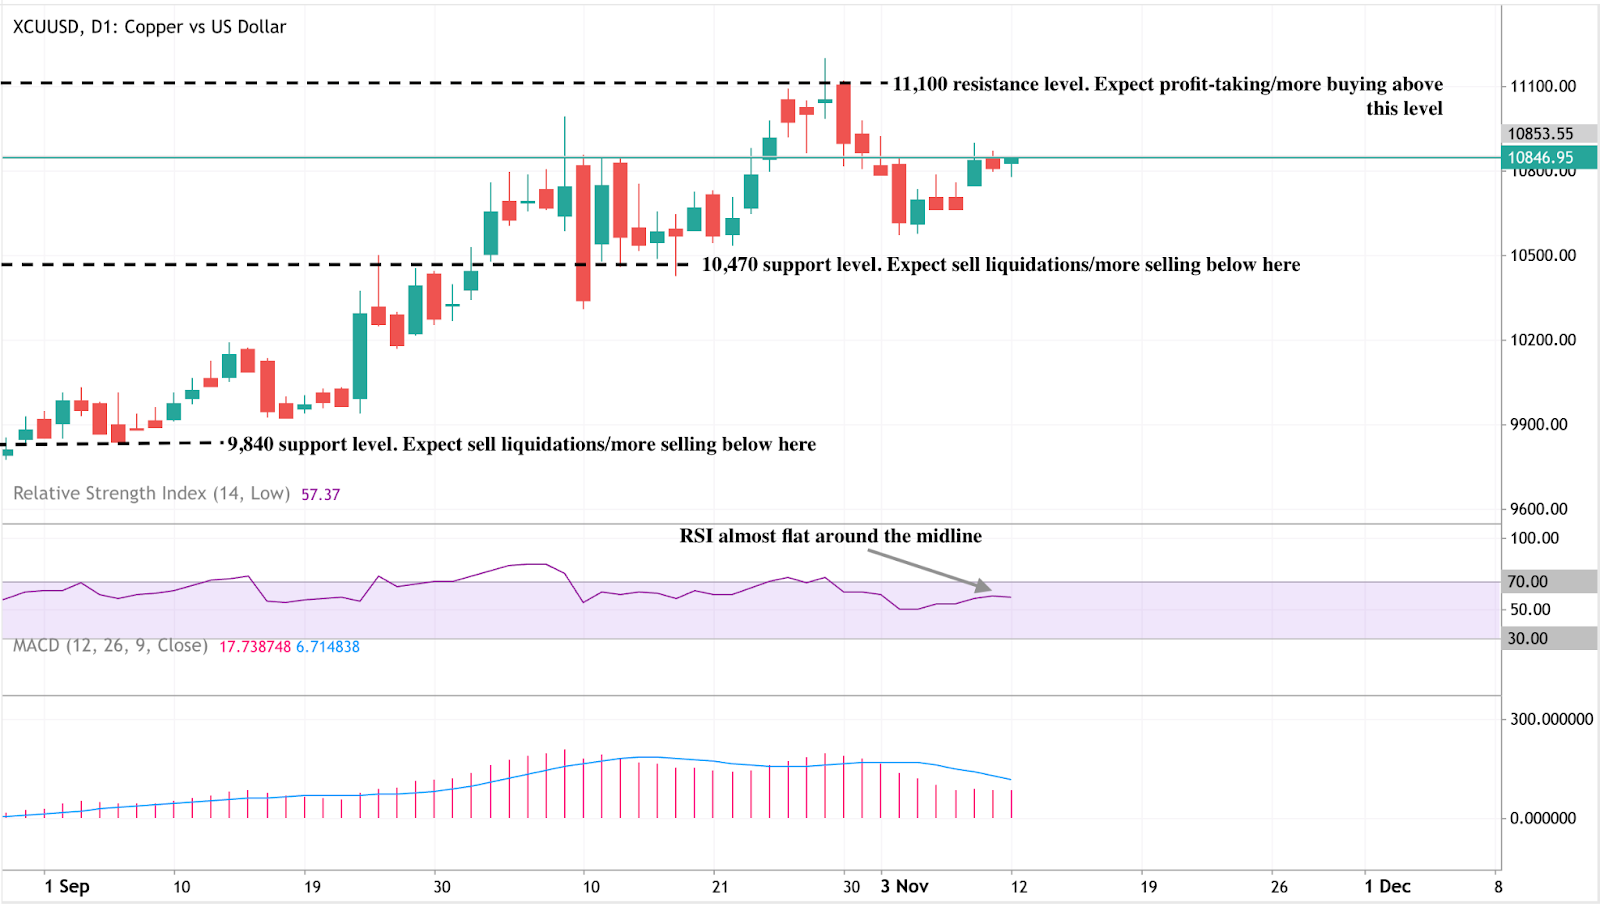
銅技術分析
撰寫本文時,銅(XCU/USD)價格約在10,850美元附近盤整,介於10,470美元的關鍵支撐區與11,100美元的阻力位之間。若突破11,100美元,可能引發新一波多頭動能;若跌破10,470美元,則可能帶來新的賣壓。下一個較低支撐約在9,840美元,若市場情緒轉向風險偏好降低,可能出現進一步拋售。
相對強弱指標(RSI)約在57附近,接近中線,顯示中性偏向——既非明顯超買,也非超賣。這表明市場處於觀望狀態,動能缺乏明確方向。
同時,MACD線略高於訊號線,但動能減弱,反映多頭動力減弱。若MACD跌破訊號線,可能確認短期看跌情緒。
交易者可使用Deriv 交易計算機估算交易銅及其他金屬時的保證金需求與利潤潛力。欲深入了解商品交易策略,請參考Deriv詳盡的商品交易指南,適合新手及進階交易者。
銅的短期波動與長期信心
儘管長期趨勢看多,短期仍存在阻力。中國房地產市場放緩持續影響工業金屬情緒,而金融條件收緊可能延緩投機性資金流入。
然而,分析師普遍認為任何價格修正將是短暫的,因長期基本面依然支持。價格回落至9,000至9,500美元區間被視為買入良機,基金正為2026年下一波上漲做準備。
分析:推動黃金價格與美國股市同步上漲的原因是什麼?
黃金價格與美國股市的同步上漲有些不尋常,因為傳統上,黃金被視為「避險」資產。
黃金價格與美國股市的同步上漲有些不尋常,因為傳統上,黃金被視為一種「避險」資產,通常在經濟不確定時期表現良好,而股票則更多與經濟成長和風險偏好相關。分析師指出,有多個因素同時推動這兩個市場上漲。
根據 CME 的 FedWatch 工具,交易者認為 12 月降息 25 個基點的機率為 63%。這個單一敘事——資金成本降低——推升了通常走勢相反的資產:黃金這個經典避險資產與股票這個傳統風險資產。
兩個市場都是受到政策驅動的樂觀情緒推動,而非經濟實力。疲弱的就業數據、低迷的消費者信心以及財政壓力跡象促使交易者預期貨幣政策將趨於寬鬆,推動流動性行情,模糊了安全與投機之間的界線。
主要重點
- 黃金持穩於每盎司 4,100 美元以上,為兩週以來最高水平,交易者預期聯準會將放寬政策。
- 美股也因降息預期提升未來盈餘估值而上漲。
- 這波漲勢反映流動性信心,而非經濟成長——市場由央行驅動,而非基本面。
- 財政焦慮與美國公債殖利率上升為黃金提供第二層支撐。
- 印度與央行的強勁實體需求支撐價格,超越投機浪潮。
聯準會降息預期推動黃金與美股
這波聯合漲勢源自明顯的宏觀轉變。近期美國經濟數據顯示動能減弱——10 月私人就業疲軟,政府與零售就業下降,消費者信心降至數月低點。市場將此解讀為聯準會 12 月將轉向降息的確認。
較低的利率同時影響市場兩端:
- 對股票而言,降低借貸成本並提升企業盈餘的現值。
- 對黃金而言,降低持有無收益資產的機會成本。
結果是同步的上漲。投資者不再在安全與風險間選擇;他們同時買入兩者,因為共同的預期是資金將更寬鬆回歸。
對於使用Deriv MT5的交易者來說,這種跨資產動態創造了新的多元化機會,因為指數、商品與金屬的波動都對同一政策脈動作出反應。
美國財政政策再現為隱藏推手
美國政府關門及其暫時解決方案使財政穩定性成為焦點。參議院兩黨妥協重啟政府——獲得川普總統支持——緩解了短期市場壓力,但提醒投資者美國長期債務問題。
正如 Saxo Bank 的 Ole Hansen 所言,「由財政焦慮而非經濟實力推動的殖利率上升,歷來對投資金屬有支持作用。」在此背景下,較高的債券殖利率反映的是對債務可持續性的擔憂,而非經濟強勁——強化持有黃金作為財政不確定性對沖的理由。
政府機構重啟也將恢復官方經濟數據的取得,為市場提供更大明朗度。然而,這些數據可能證實經濟活動放緩,交易者因此看到聯準會採取行動的更多理由。
黃金與股票:市場罕見的雙重飆升
黃金與股票傳統上走勢相反,一者代表恐懼,另一者代表信心。然而,2025 年的市場行為顯示兩者現在都是流動性預期的表現。
當投資者預期貨幣寬鬆時,所有受益於低成本資金的資產都會上漲——從黃金到成長型科技股。這種相關性轉變凸顯市場運作的結構性變化:政策預期已超越基本面成為主要價格驅動力。
黃金即使在美元走強時仍能上漲,進一步強化這種轉變。貨幣動態被央行政策在全球資產定價中的主導地位所取代。
黃金需求為漲勢增添深度
除了投機敘事外,黃金上漲有強勁的實體需求支撐,尤其來自印度與央行:
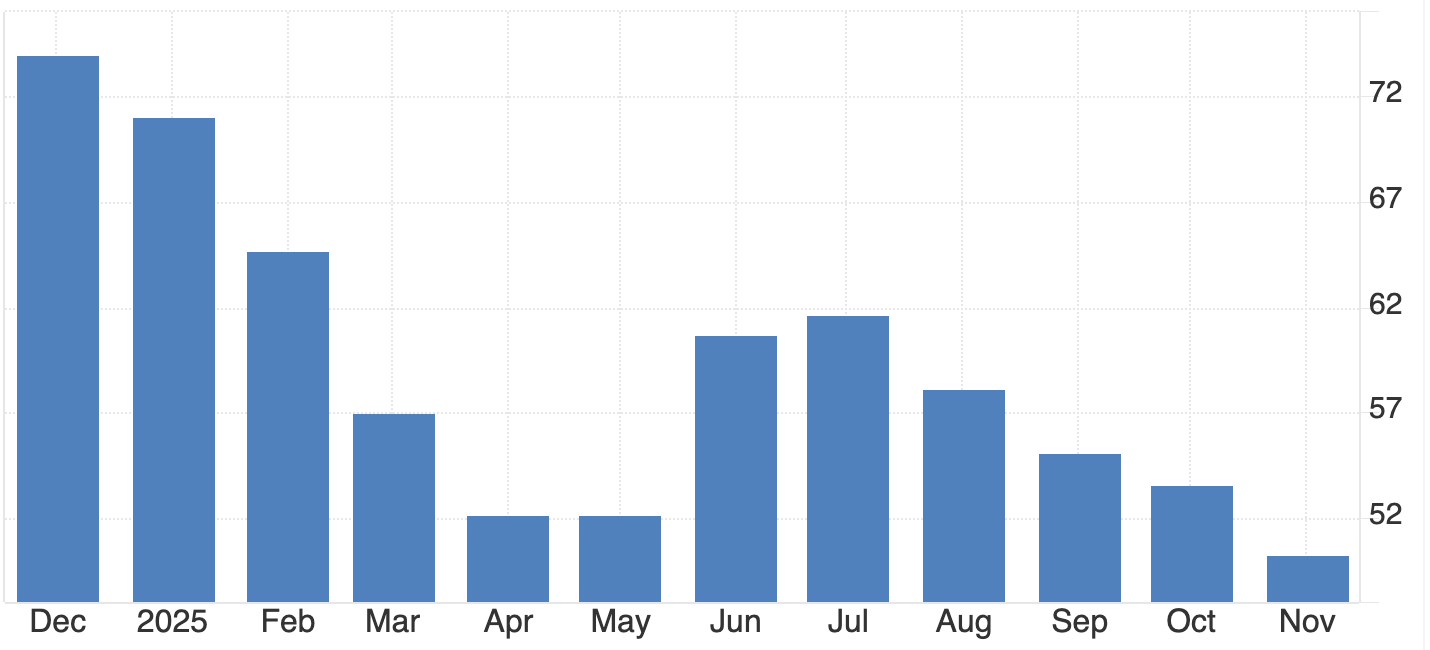
- 印度黃金 ETF 流入在 2025 年前 10 個月達到 29 億美元——相當於 26 噸黃金,幾乎等同於 2020 至 2024 年的總和。
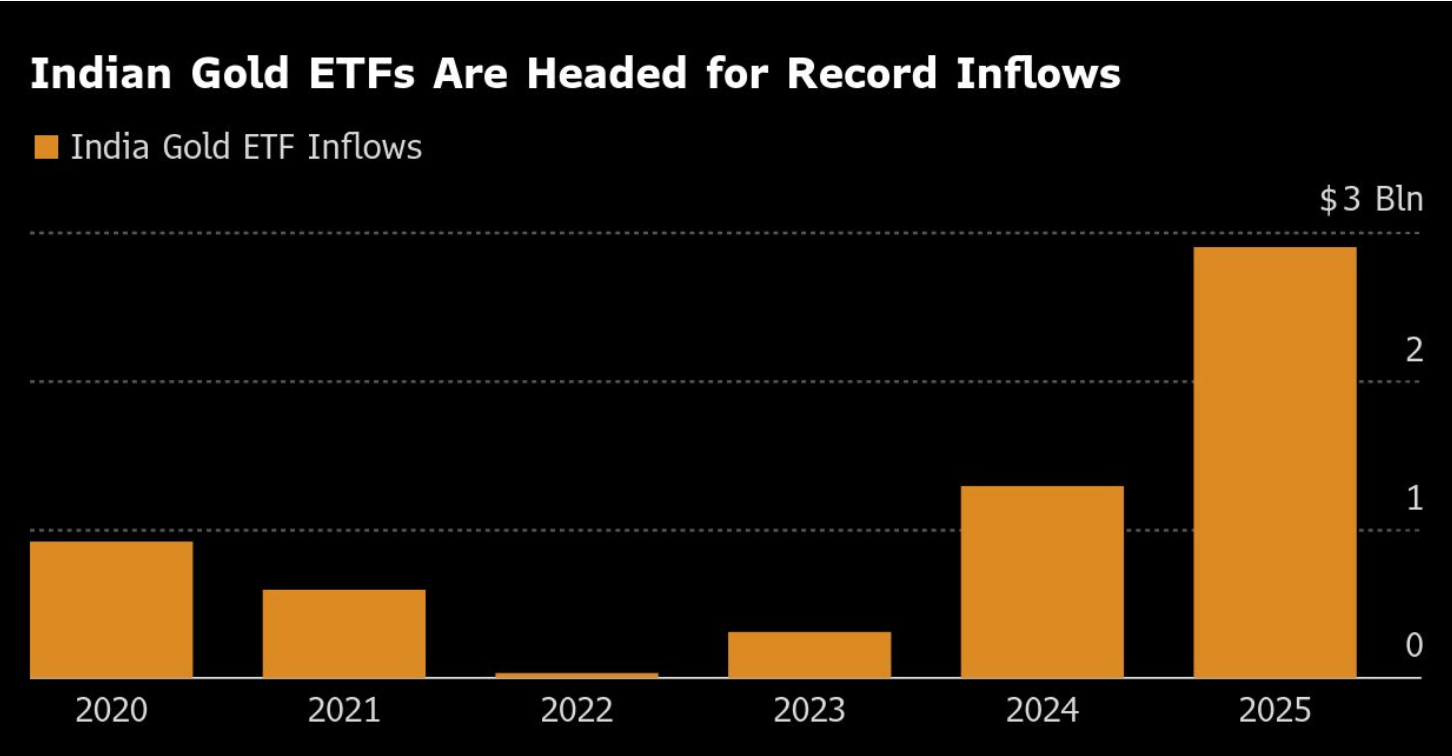
- 僅 10 月就有 8.5 億美元新流入,繼 9 月創紀錄的 9.42 億美元之後。
- 印度黃金 ETF 總持有量現為 83.5 噸,價值超過 110 億美元。
這些需求顯示漲勢並非純粹投機,而是反映全球對黃金作為長期價值儲存工具的真實需求——作為貨幣與財政不確定性的平衡。
黃金礦商反映投資者信心
黃金市場的企業面向也呼應此情緒。全球最大生產商之一 Barrick Gold (ABX.TO) 在調整後利潤超出預期後,將季度股息提高 25%,並擴大 5 億美元的股票回購計劃。
- 平均實現黃金價格:每盎司 3,457 美元,較去年同期的 2,494 美元上升。
- 產量從 943,000 盎司降至 829,000 盎司,全包持續成本略升至每盎司 1,538 美元。
儘管面臨營運挑戰及因失去馬里礦山而產生的 10 億美元減值,Barrick 向北美生產的策略轉向顯示對黃金價格持續高位的信心。
然而,馬里爭議——包括員工被拘留及出口限制——凸顯全球黃金供應的地緣政治脆弱性,若未解決,可能進一步收緊市場。
市場背景:債務、殖利率與政策悖論
黃金今年漲幅超過 50%,不僅是通膨恐懼的反映,更是對財政脆弱性與市場對流動性的依賴的回應。
公債殖利率上升較非經濟健康的信號,而是對債務可持續性的警告。投資者購買黃金以對沖這些結構性風險,同時基於流動性將持續流入的假設推高股票價格。
這種同時尋求安全與風險的雙重行為,是 2025 年市場心理的定義性悖論。
未來數月黃金與美股情境
- 看漲突破
若聯準會 12 月降息並暗示進一步寬鬆,黃金可能迅速突破 4,200 美元,受財政憂慮與央行穩定需求支撐。
- 短期盤整
聯準會態度謹慎或延遲,黃金可能在 4,050 至 4,150 美元間盤整,股票則可能維持漲勢,直到流動性預期減弱。
無論如何,關鍵結論是黃金與股票現正回應相同的宏觀經濟驅動力——資金價格,而非相反的情緒力量。
黃金技術面洞察
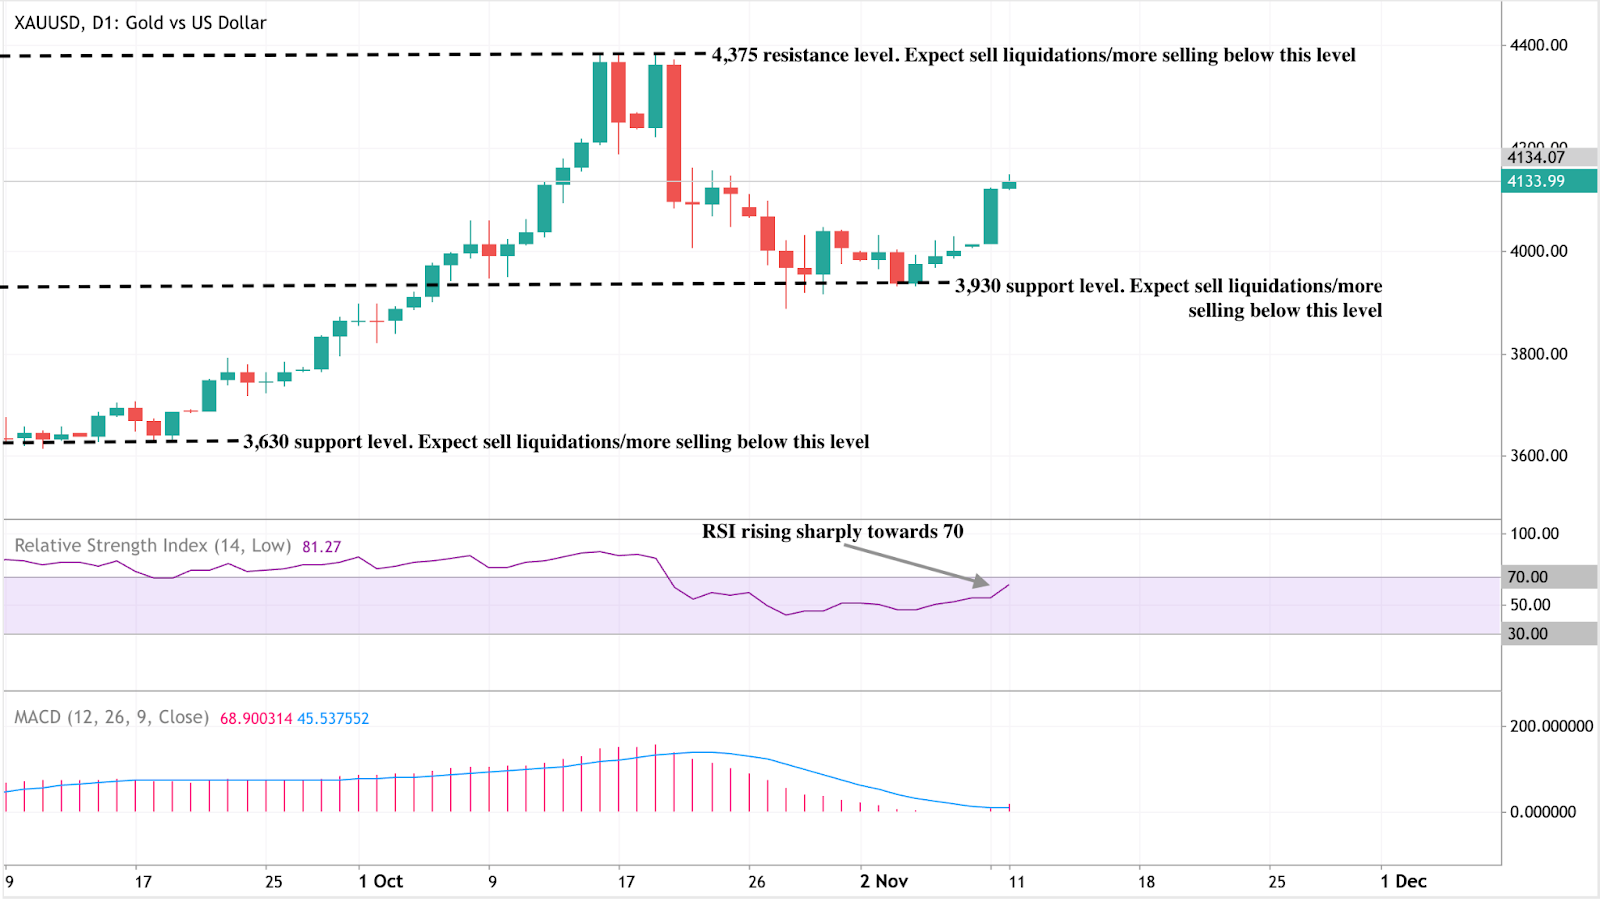
黃金 (XAU/USD) 目前交易於約 4,134 美元,在關鍵區間盤整——阻力位於 4,375 美元,支撐位於 3,930 美元。突破 4,375 美元可能延續漲勢,跌破 3,930 美元則可能引發賣壓回落至 3,630 美元。
RSI(81)顯示強勁的多頭動能,但同時提示超買狀態,暗示短期可能盤整或回調。MACD 則維持多頭交叉,確認持續買盤壓力。
整體而言,黃金在 3,930 美元以上偏多,但交易者應留意動能在超買區域可能降溫。您可直接在 Deriv MT5 監控這些關鍵水平,或使用Deriv 交易計算器試算保證金與風險設定,規劃金屬與指數的交易部位。
黃金投資展望
- 短期交易者:4,100 至 4,200 美元區間是聯準會 12 月決策前的關鍵觀察範圍。
- 中期投資者:財政壓力、實質殖利率波動與印度需求是持續走強的核心驅動力。
投資組合經理:黃金與股票的相關性演變,意味著黃金現已成為政策敏感的平行資產,而非純粹避險工具。多元化策略應考慮此結構性轉變。

Can a tariff dividend create a new liquidity cycle for Bitcoin in 2025?
Analysts suggest that President Donald Trump’s proposed $2,000 “tariff dividend” has fuelled a wave of market optimism rather than a genuine injection of liquidity.
Yes - but only in sentiment, not in substance. Analysts suggest that President Donald Trump’s proposed $2,000 “tariff dividend” has fuelled a wave of market optimism rather than a genuine injection of liquidity.
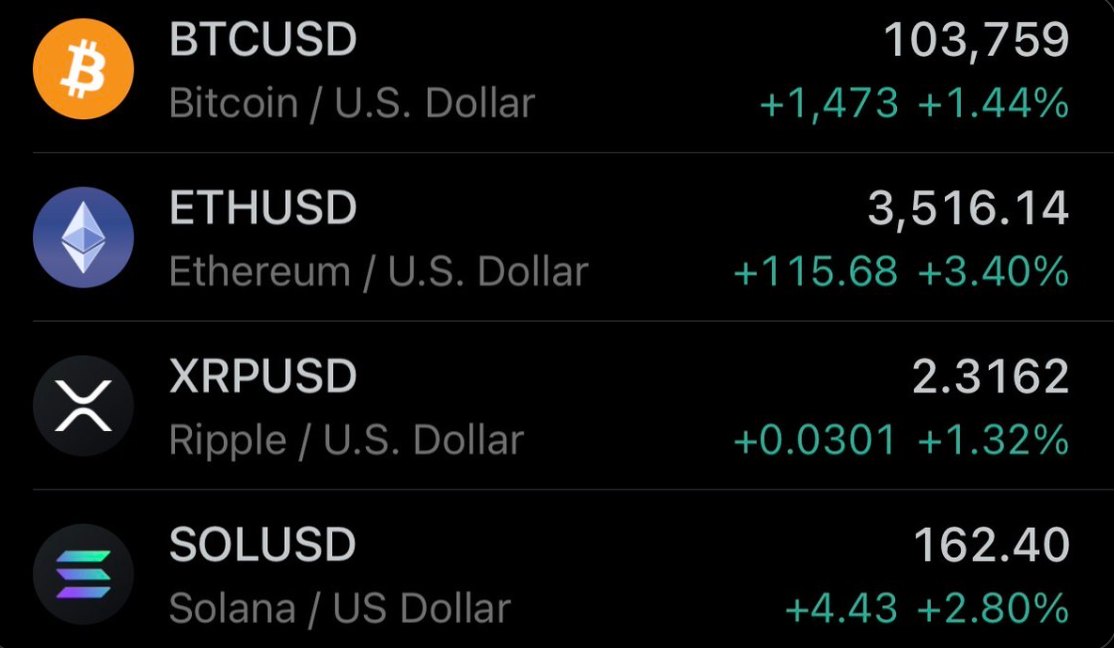
The announcement triggered a short-lived crypto rebound, lifting Bitcoin back above $104,000, as traders drew parallels with the 2020 pandemic payments that helped fuel the last major bull run. Yet with limited fiscal backing and political obstacles, many believe this rally may be driven more by sentiment than by substance.
Key takeaways
- Trump’s $2,000 “tariff dividend” prompted a brief rally in Bitcoin and Ethereum, despite serious doubts over its feasibility.
- Funding gap: The proposed payout would cost around $300 billion, but tariff revenues generate only about $90 billion net.
- Institutional demand remains strong, with $2.7 billion in ETF inflows and BlackRock’s IBIT managing close to $100 billion in BTC.
- The Federal Reserve’s 25-basis-point rate cut and improved risk appetite continue to support Bitcoin above the $100K mark.
- Analysts see two paths: A climb towards $120K–$125K if optimism holds, or a slide below $100K once political enthusiasm fades.
- Crypto’s sensitivity to liquidity narratives underscores how sentiment - not policy - often leads market direction.
Trump’s tariff dividend promise and the market reaction
In a Truth Social post, President Trump claimed that the United States was generating “trillions of dollars” from tariffs and could use those funds to both reduce its $38 trillion national debt and finance a “dividend” for most Americans, excluding high earners.
The statement triggered a modest crypto rally as traders priced in the possibility of more household liquidity.
Markets quickly drew comparisons to the pandemic-era stimulus cheques that helped spark a historic bull market. Traders, long conditioned to respond to any hint of fresh money supply, reacted instinctively - even though the policy remains more political talking point than fiscal plan.
Why the maths don’t add up
Despite the excitement, the numbers simply do not work. Fiscal experts note that Trump cannot unilaterally authorise such payments; they require Congressional approval and a new funding bill.
The funding shortfall is also substantial:
- A $2,000 payment for 150 million adults would cost around $300 billion.
- Tariff collections to date total $120 billion, and after factoring in slower economic growth and lower tax receipts, net revenue sits closer to $90 billion.
As Erica York, Vice President of Federal Tax Policy, explained: “Each dollar raised through tariffs offsets about 24 cents in income and payroll tax revenue.” In short, the government lacks both the legal authority and the financial headroom to execute this plan, making any near-term payout highly unlikely.
Stimulus Déjà Vu: Why markets still care
The crypto rally reflects not fiscal reality but liquidity psychology. Even without concrete policy action, the mere suggestion of a “dividend” rekindles traders’ belief in free-flowing money and renewed risk-taking.
This mirrors 2020, when stimulus payments coincided with a surge in Bitcoin and altcoins as retail investors redirected government cheques into digital assets.

Although the scale is smaller this time, the pattern remains: crypto markets respond instantly to liquidity cues - whether real or imagined.
Bitcoin ETF inflows and structural strength
Beyond political headlines, Bitcoin’s structural outlook remains solid. Institutional inflows into U.S. spot Bitcoin ETFs exceeded $2.7 billion in early November, led by BlackRock’s IBIT and Fidelity’s FBTC. IBIT alone now holds $80.47 billion, cementing its position as the fastest-growing ETF in U.S. history.
Macroeconomic conditions are also supportive:
- The Federal Reserve’s 25-basis-point rate cut has lifted risk appetite.
- Trump’s pardon of Binance founder Changpeng Zhao signalled a more conciliatory stance towards crypto.
- Thailand and Malaysia are exploring the inclusion of Bitcoin in national reserves, marking a step towards mainstream adoption.
These developments indicate that even if Trump’s “dividend” proves politically untenable, the underlying liquidity narrative remains alive.
Market impact and price scenarios
If bullish sentiment and ETF inflows persist, Bitcoin could extend towards $120,000, driven by institutional accumulation and looser policy. However, should enthusiasm fade, a pullback below $100,000 remains a possibility as traders reassess the fundamentals.
So far, Bitcoin’s stability above $100,000 reflects confidence from institutional investors - although analysts warn that the rally is driven more by belief than by financial logic.
Bitcoin technical insights
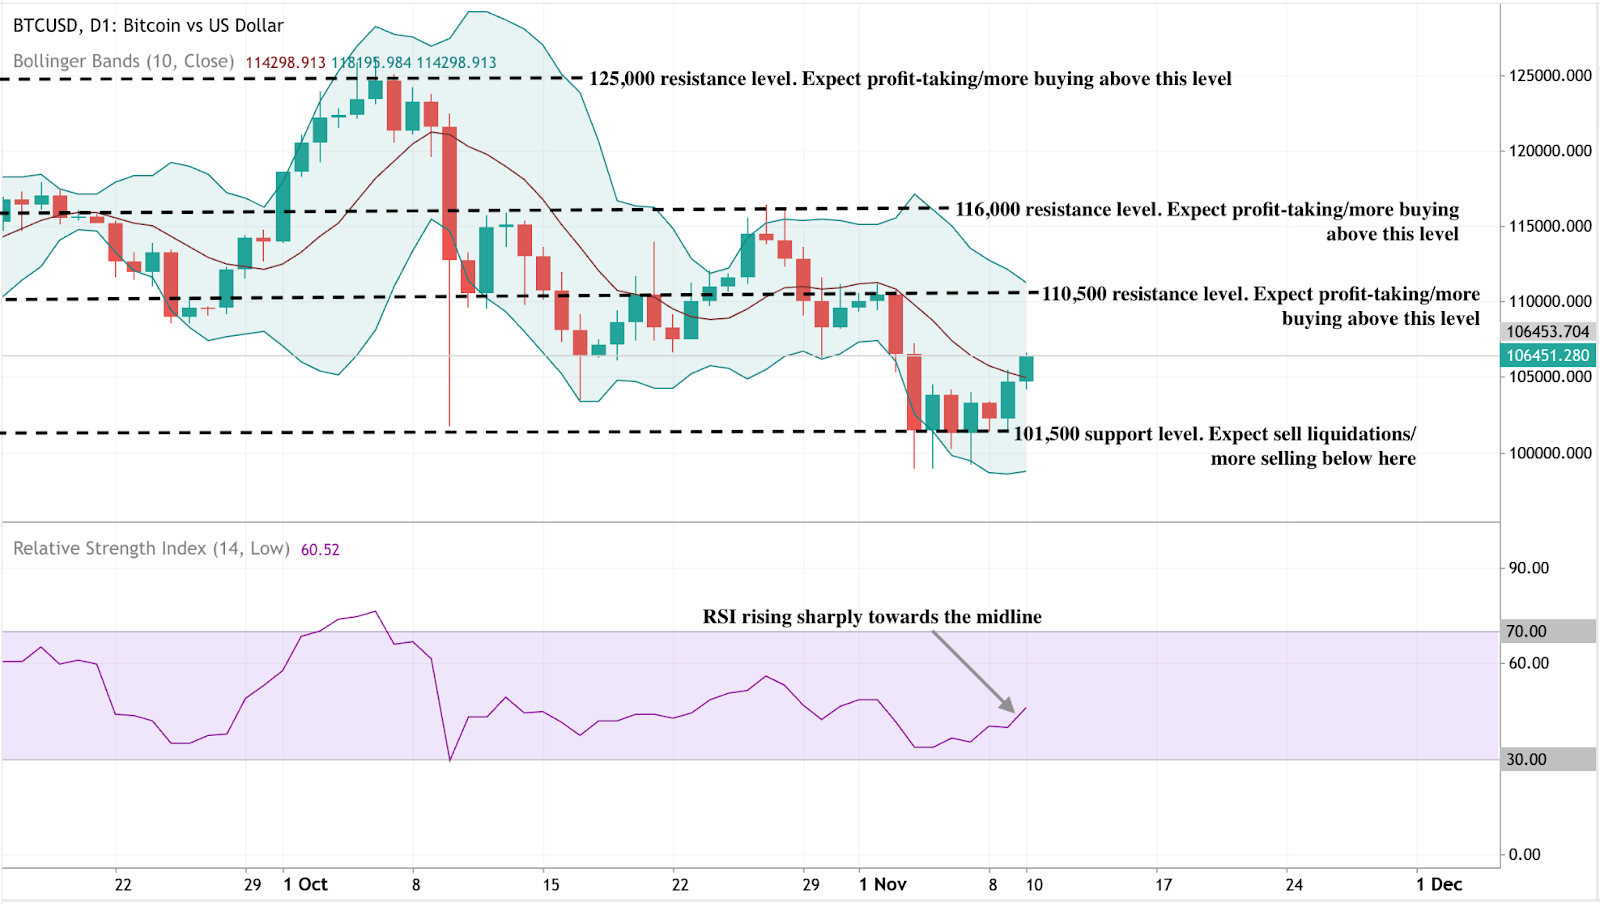
Bitcoin’s price action shows early signs of recovery after holding above the key $101,500 support level, where sellers appear to have exhausted their momentum. This level remains crucial - a decisive break below could trigger further liquidations. On the upside, $110,500 serves as the first major resistance, followed by $116,000 and $125,000, where profit-taking is likely to intensify.
The Bollinger Bands are beginning to narrow after a period of strong volatility, suggesting potential consolidation before the next breakout. The price is also attempting to climb back toward the middle band (the 10-day moving average), signalling an improving short-term outlook.
Meanwhile, the RSI (14) has risen sharply to around 60, pointing to strengthening bullish momentum without yet entering overbought territory. If RSI continues upward past 60–70, it would confirm a shift in market sentiment toward renewed buying pressure.
Investment implications
For traders, sentiment remains the main short-term driver. Bitcoin’s $100K level represents the critical dividing line between bullish conviction and renewed caution.
Those trading crypto through Deriv MT5 can access advanced charting tools and cross-market analysis, making it easier to track correlations between Bitcoin, gold, and the U.S. dollar - especially during policy-driven volatility.
Meanwhile, traders can use the Deriv Trading Calculator to estimate potential profits, required margin, and swap rates before entering a position, ensuring tighter risk control in fast-moving conditions.
- Short term: Tactical buying opportunities exist above $102K–$104K if ETF inflows remain robust.
- Medium-term: Expect volatility tied to political announcements and monetary policy signals.
Long-term: Institutional accumulation and steady global adoption continue to underpin a structurally bullish outlook, even if near-term hype cools.

Is Filecoin’s price surge the start of a broader crypto market recovery?
According to experts, Filecoin’s 50% surge could mark the early stages of a broader recovery across the cryptocurrency market, driven by renewed interest in utility-based blockchain assets.
According to experts, Filecoin’s 50% surge could mark the early stages of a broader recovery across the cryptocurrency market, driven by renewed interest in utility-based blockchain assets. The decentralised storage token’s sharp rebound above the $2 level has placed it at the forefront of the DePIN (Decentralised Physical Infrastructure Network) rally - a niche sector that has gained roughly 11% overall in recent days.
Analysts point to rising network activity, strong developer funding, and growing institutional focus on real-world blockchain utilities as reasons why Filecoin’s latest move may represent more than just a speculative bounce. Still, whether the rally extends further will depend on broader market sentiment and sustained adoption within the decentralised storage ecosystem.
Key takeaways
- Filecoin leads crypto recovery: Up over 50% in 24 hours, Filecoin is outperforming most major tokens and driving gains in the DePIN sector.
- DePIN sector strength: Decentralised infrastructure projects have collectively gained 11%, signalling investor interest in tokens with tangible use cases.
- Ecosystem investment expanding: Protocol Labs has launched RetroPGF Round 3, allocating 585,000 FIL to support developer projects from November 2024 to September 2025.
- Market capitalisation: Filecoin’s valuation now stands at $1.52 billion, ranking it among the top 50 public blockchains.
- A short-term focus on maintaining momentum above $2 could pave the way for a move to $3, a key technical resistance level.
- Long-term outlook: Experts see Filecoin as a leading project in the growing Web3 infrastructure and decentralised storage economy.
Filecoin rally leads the market’s structural recovery
Filecoin’s performance is part of a broader market trend where investors are shifting capital towards utility-based projects - tokens that provide real-world functionality. Within this trend, DePIN networks stand out. These projects bridge physical resources such as computing power, energy, and data storage with blockchain incentive mechanisms, creating measurable productivity within decentralised systems.
The DePIN sector’s 11% rise reflects a shift in sentiment from speculative trading towards functional blockchain services. Filecoin’s 50% rally to above $2.00 has cemented its status as the flagship token for decentralised storage and one of the strongest indicators that the market is rediscovering value in blockchain infrastructure.

Filecoin vs traditional cloud storage
Launched in October 2020 by Protocol Labs, Filecoin provides a peer-to-peer marketplace for data storage. It enables users to rent out unused hard drive space, earning FIL tokens in exchange. Unlike traditional storage services such as Google Drive, iCloud, or Dropbox, Filecoin’s system operates without a central authority - meaning that pricing, availability, and access are determined entirely by the network.
The system relies on two unique consensus mechanisms:
- Proof-of-Replication (PoRep): Verifies that storage providers hold exact copies of the data they claim to store.
- Proof-of-Spacetime (PoSt): Confirms that the data remains stored for the entire agreed period.
Together, these mechanisms make Filecoin’s network verifiable, secure, and tamper-resistant, addressing long-standing challenges in data storage trust and transparency.
Decentralised storage: From research to real-world impact
Filecoin’s origins date back to 2014, when Protocol Labs developed the InterPlanetary File System (IPFS) - a decentralised file-sharing protocol designed to replace centralised web servers. Filecoin was later introduced as the economic layer of IPFS, incentivising users to store and maintain data using blockchain rewards.
In August 2017, Filecoin completed one of the largest token offerings in crypto history, raising $257 million in its Initial Coin Offering (ICO). Major investors, including Sequoia Capital, Union Square Ventures, and Digital Currency Group, backed the project.
By the time its mainnet launched in October 2020, Filecoin had become one of the most anticipated blockchain networks globally. Its price soared to an all-time high of $236.97 in 2021 before correcting sharply alongside the broader market downturn. Despite that decline, the network has continued to expand and maintain strong developer interest, positioning it as one of the most credible decentralised storage solutions in the Web3 space.
Filecoin’s ecosystem expansion reinforces fundamentals
While price volatility has dominated headlines, Filecoin’s ecosystem growth has been quietly strengthening. Protocol Labs recently launched RetroPGF Round 3, allocating 585,000 FIL to projects that contributed to the ecosystem between late 2024 and 2025.
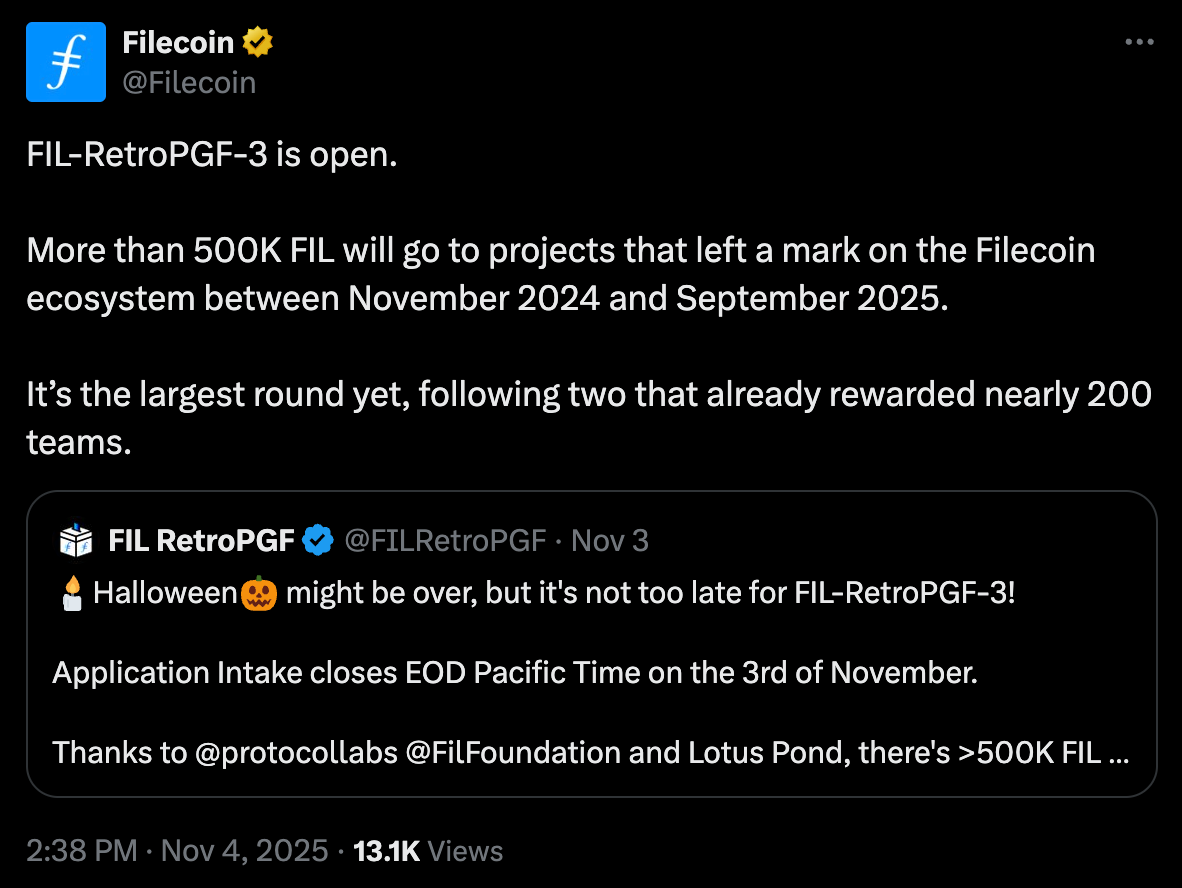
This round follows two earlier programmes that rewarded nearly 200 development teams, supporting innovations in decentralised computing, data retrieval, and dApp integration. The funding initiative underscores Filecoin’s commitment to sustainable growth - a key differentiator in a market often driven by short-term speculation.
Such ecosystem support not only encourages innovation but also signals confidence to institutional investors who are increasingly assessing Web3 infrastructure projects as long-term opportunities.
Market outlook: Can Filecoin sustain momentum?
Breaking past the $2 psychological level marks a pivotal moment for Filecoin. The next major resistance sits near $3, a level last tested in mid-2023. Technical analysts suggest that continued momentum could propel prices toward this mark if trading volumes remain high and the DePIN rally sustains.
However, Filecoin still trades far below its 2021 highs, underscoring both its potential for recovery and its vulnerability to market sentiment. Short-term corrections are possible as traders take profits, but experts say the latest surge is supported by more robust fundamentals than previous speculative rallies.
With a market cap of $1.52 billion and growing integration across decentralised applications, Filecoin is viewed as a key player in Web3’s evolving infrastructure layer. Its combination of utility, decentralisation, and developer support could allow it to benefit from the next major rotation into functional crypto assets.
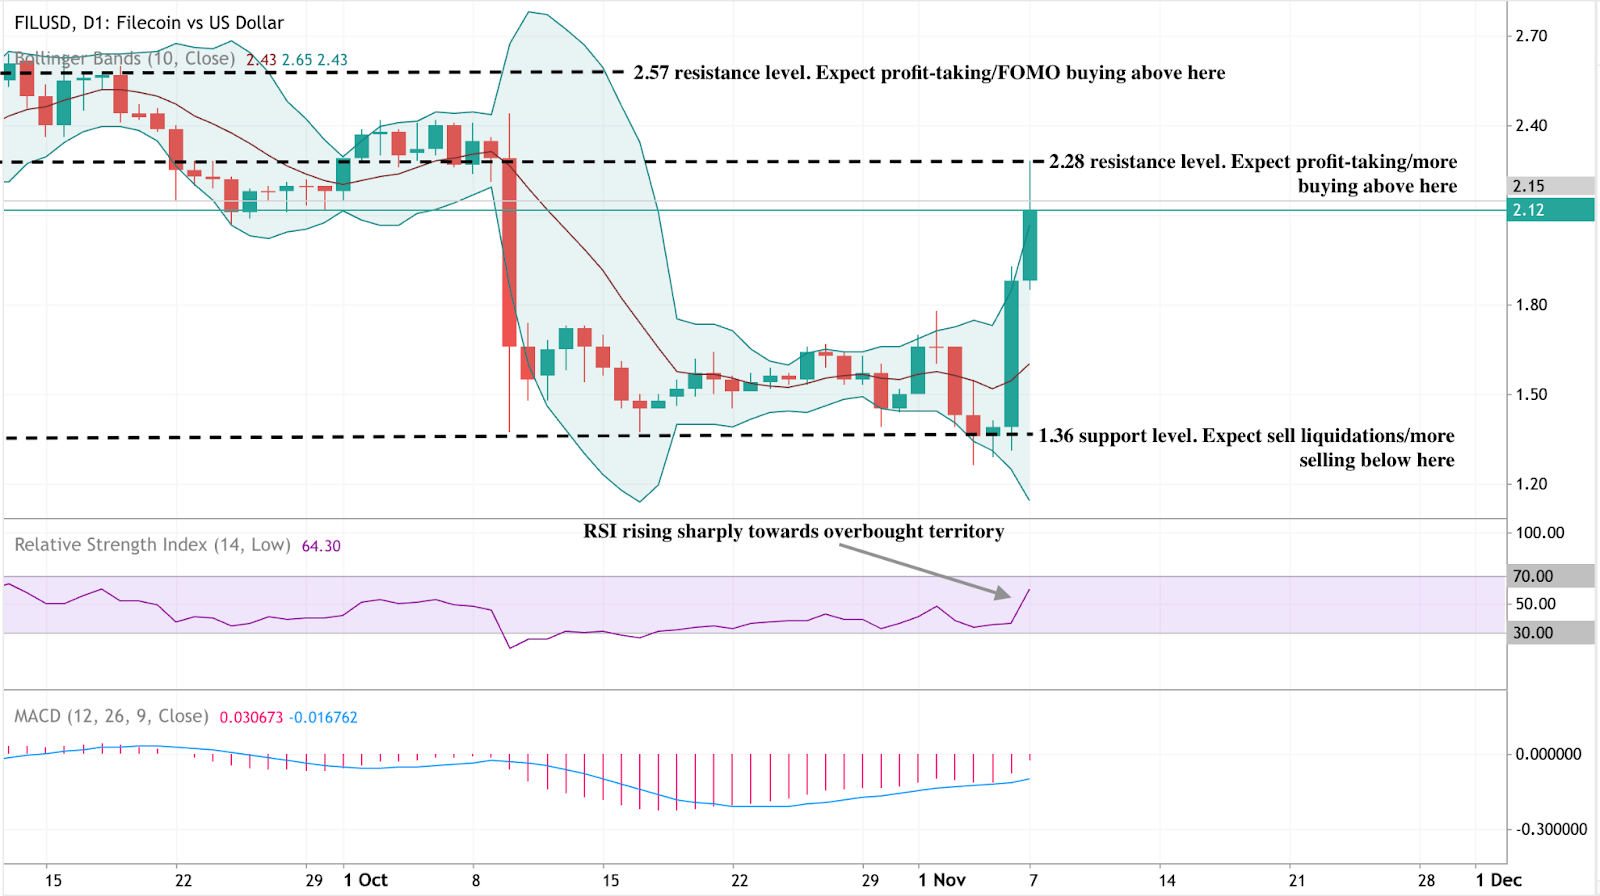
Filecoin technical analysis
At the time of writing, Filecoin (FIL/USD) is trading around $2.12, extending its rally after rebounding from the $1.36 support level. The Bollinger Bands have expanded, reflecting heightened volatility, with price now testing the upper band - often a sign of short-term exhaustion. The RSI, at 64.3, is rising sharply toward the overbought zone, suggesting momentum remains strong but could soon face a cooling period.
Meanwhile, the MACD has turned positive with a fresh bullish crossover, reinforcing the current uptrend. However, traders should monitor momentum closely as the histogram begins to flatten. The next key resistance levels sit at $2.28 and $2.57, where profit-taking or renewed buying may occur. On the downside, $1.36 remains the critical support level - a break below it could trigger another wave of selling.
To explore and analyse these setups in real-time, traders can track Filecoin price action directly on Deriv MT5, which provides advanced charting tools, indicators, and multi-asset trading access for crypto, forex, and commodities markets.
Filecoin’s short-term outlook is bullish but nearing overbought territory, hinting at a potential cooldown if resistance levels hold.
Filecoin investment implications
For traders, Filecoin’s recent breakout offers short-term momentum opportunities above the $2 level, with upside potential towards $3 if DePIN sector strength continues. Caution remains warranted given crypto market volatility, but the technical setup favours buyers as long as Filecoin holds its newly reclaimed support zone.
For long-term investors, Filecoin stands out as one of the few blockchain networks with clear real-world use cases. Its robust developer base, institutional backing, and role in the decentralised data economy make it an appealing bet on the future of Web3 infrastructure.
Competition from centralised cloud giants and other blockchain storage protocols could cap growth if adoption plateaus. Filecoin’s success will depend on scaling efficiently, maintaining ecosystem incentives, and integrating more deeply into decentralised application frameworks.
Before entering Filecoin positions, traders can use the Deriv trading calculator to estimate potential profit and loss based on position size, leverage, and price movement - an essential tool for managing risk in volatile crypto markets.
Trading Filecoin on Deriv
- Momentum trading: Traders can use RSI and MACD crossovers on Deriv MT5 to capture short bursts of volatility during rallies above key breakout levels.
- Range trading: When Filecoin consolidates between $1.80–$2.50, short-term traders may use Bollinger Band reversals to enter positions at range extremes.
- Breakout strategy: A sustained move above $2.57 could signal a new bullish leg toward $3.00 - traders can confirm signals using MT5’s volume indicators and EMA crossovers.

How Solana’s real-world integrations are redefining crypto in 2025
From institutional ETFs to payment infrastructure and decentralised finance (DeFi) applications, Solana is reshaping what it means for a blockchain to operate at scale in 2025.
Solana’s expanding real-world integrations - ranging from institutional ETFs to payment infrastructure and decentralised finance (DeFi) applications - are redefining what it means for a blockchain to operate at scale in 2025. The network’s steady ETF inflows, validator reforms, and partnership activity show that Solana’s growth story is no longer simply about price volatility; it is about building financial and operational depth across both on-chain and institutional layers.
Key takeaways
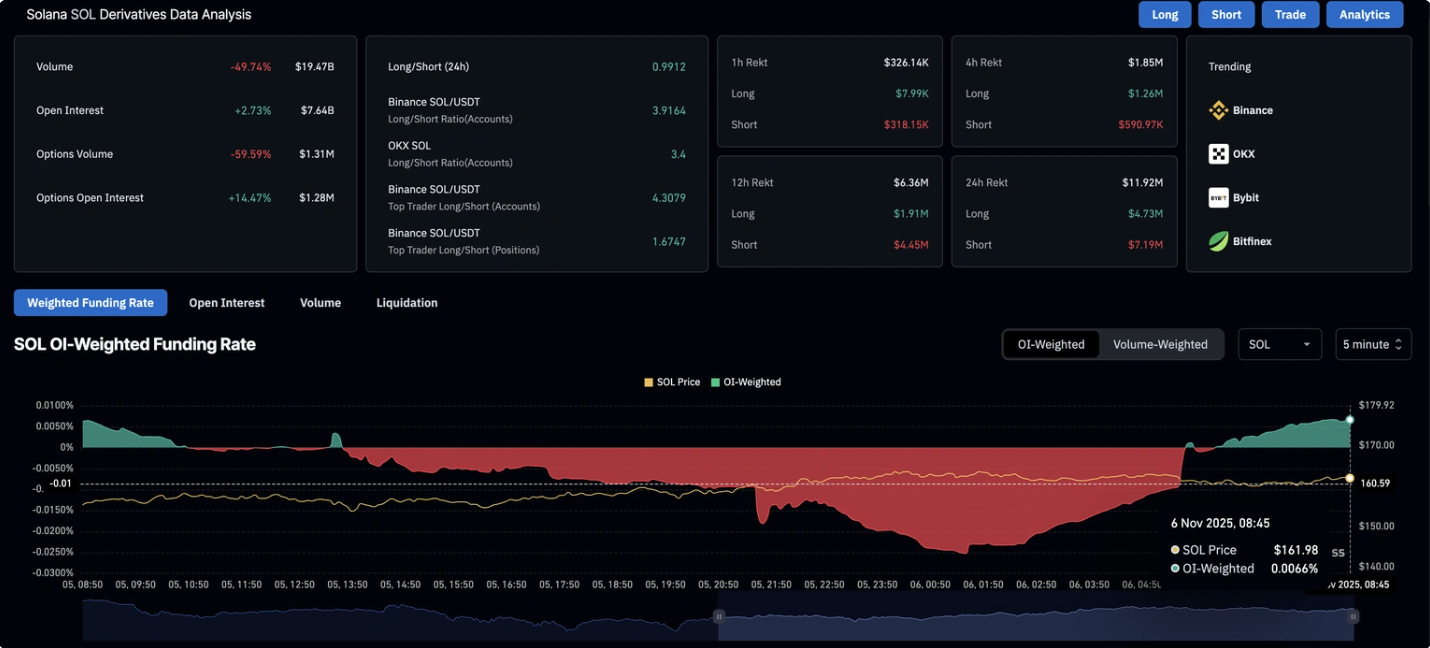
- Institutional inflows remain steady: Solana ETFs have recorded six consecutive days of positive inflows, signalling confidence from long-term investors.
- Retail activity returns: Futures open interest has climbed to $7.64 billion, up 2.73% in 24 hours, while funding rates have turned positive - a sign of renewed retail optimism.
- Real-world integration grows: Solana is under evaluation for Western Union’s blockchain-based remittance pilot, positioning it for mainstream financial use.
- Network efficiency improves: Validator count has fallen 64% since early 2023, yet performance has strengthened as outdated operators were removed.
- Liquidity risks persist: Despite Solana total value locked (TVL) rising to $10.2 billion, stablecoin liquidity has declined 8.16% in a week - a warning for on-chain demand.
Solana institutional investment anchors Solana’s 2025 momentum
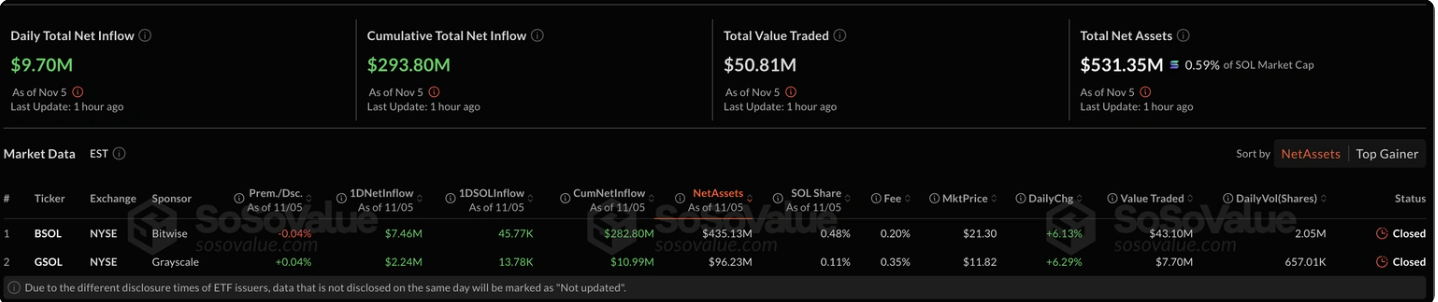
Institutional interest has become the foundation of Solana’s resilience this year. The Bitwise Solana Staking ETF (BSOL) drew $417 million in its debut week - outpacing even Bitcoin and Ethereum products - while the Grayscale Solana Trust (GSOL) attracted more than $1 million on its first day.
This consistent flow marks Solana’s shift from speculative trade to structured investment vehicle. For the sixth consecutive day, Solana ETFs have reported net inflows totalling $9.7 million mid-week, as professional investors position for long-term exposure despite macroeconomic uncertainty.
The rise of ETFs also introduces new liquidity and transparency. Each inflow represents a vote of confidence in Solana’s sustainability, particularly significant in a market shaped by cautious institutional allocators following the turbulence of 2022–23.
Solana retail traders re-engage as on-chain data strengthens
Following a weak start to the week, retail interest in Solana has picked up. According to CoinGlass, open interest in Solana futures increased 2.73% within 24 hours, and funding rates flipped from negative to positive territory. This indicates an expansion in leveraged long positions as traders bet on a continued rebound from the $155 support zone, with potential tests at $174–$177.
Short liquidations totaling $7.19 million exceeded long liquidations of $4.73 million, indicating that bearish positions were squeezed out and adding upward pressure on the price. The long-to-short ratio of 0.9912 indicates a market leaning cautiously bullish, yet still balanced.
Solana validator reforms make the network leaner and faster
Solana’s validator count has declined from around 2,500 to under 900 since 2023 - a 64% reduction - but this contraction reflects strategic consolidation rather than weakness. Many of the removed validators were outdated, slow, or linked to exploitative trading behaviours such as “sandwich” attacks.
The Solana Foundation has restructured its subsidy programme, now removing three subsidised validators for every new one added. The result: lower congestion, smoother transaction flow, and a healthier infrastructure.
As Tomas Eminger, Chief Infrastructure Officer at RockawayX, noted, this shift improves hardware quality and eliminates inefficiencies that previously slowed the network.
Solana real-world adoption: From DeFi to payments
Beyond market speculation, Solana is strengthening its institutional relevance through real-world adoption. Western Union has officially partnered with Solana to develop and test blockchain-powered cross-border transfer systems.
If adopted, the integration could channel significant transactional volume through Solana’s ecosystem, lifting both TVL and stablecoin demand. Simultaneously, developers are expanding Solana’s DeFi and asset-listing infrastructure:
- New perpetual markets are live.
- Launchpads are enabling faster token distribution.
- A revised asset-listing process simplifies onboarding for fintech and DeFi projects.
Together, these improvements suggest that Solana’s next growth phase will be driven less by speculative yield-farming and more by functional adoption - a shift reminiscent of how cloud computing matured from experimentation to enterprise utility.
Solana’s liquidity constraints: The risk beneath the rally
Despite these advances, the network faces liquidity constraints. DeFiLlama data shows Solana’s TVL rose 2.27% in 24 hours to $10.215 billion, but its stablecoin market capitalisation fell 8.16% over the week to $13.816 billion.

Falling stablecoin liquidity often signals shrinking capital reserves for decentralised applications, potentially reducing on-chain activity even as price metrics remain elevated.
If this decline continues, Solana may require stronger external inflows, such as ETF-driven liquidity or new payment-related transactions, to sustain ecosystem growth.
Comparing Solana’s institutional path to gold’s macro role
Solana’s 2025 performance mirrors gold’s cautious yet persistent rally amid uncertainty from the Federal Reserve. Both assets now reflect investor demand for alternatives that combine liquidity with long-term value preservation.
Just as gold ETFs legitimised physical gold as a mainstream portfolio component in the early 2000s, Solana’s regulated ETFs are giving institutions a compliant channel to access crypto exposure.
If the Fed’s December meeting signals prolonged policy tightness, risk assets could falter - yet steady institutional inflows suggest Solana is maturing into a digital asset capable of weathering policy-driven volatility.
Solana trading strategies on Deriv
- Breakout trading: Use Bollinger Bands or trendlines on Deriv MT5 to identify volatility-driven price movements. A confirmed breakout above resistance levels, such as $178 could indicate a bullish momentum continuation.
- Swing trading: Analyse Solana’s RSI and moving averages to time short- to medium-term entries. Combining this with the Deriv Trading Calculator can help manage position sizes and margin efficiently.
- Range trading: During consolidation, consider buying near support and selling near resistance using smaller lot sizes to manage risk effectively.
Deriv provides tight spreads, flexible leverage, and 24/7 access to crypto markets, allowing traders to act swiftly as Solana’s price responds to institutional flows or network developments.
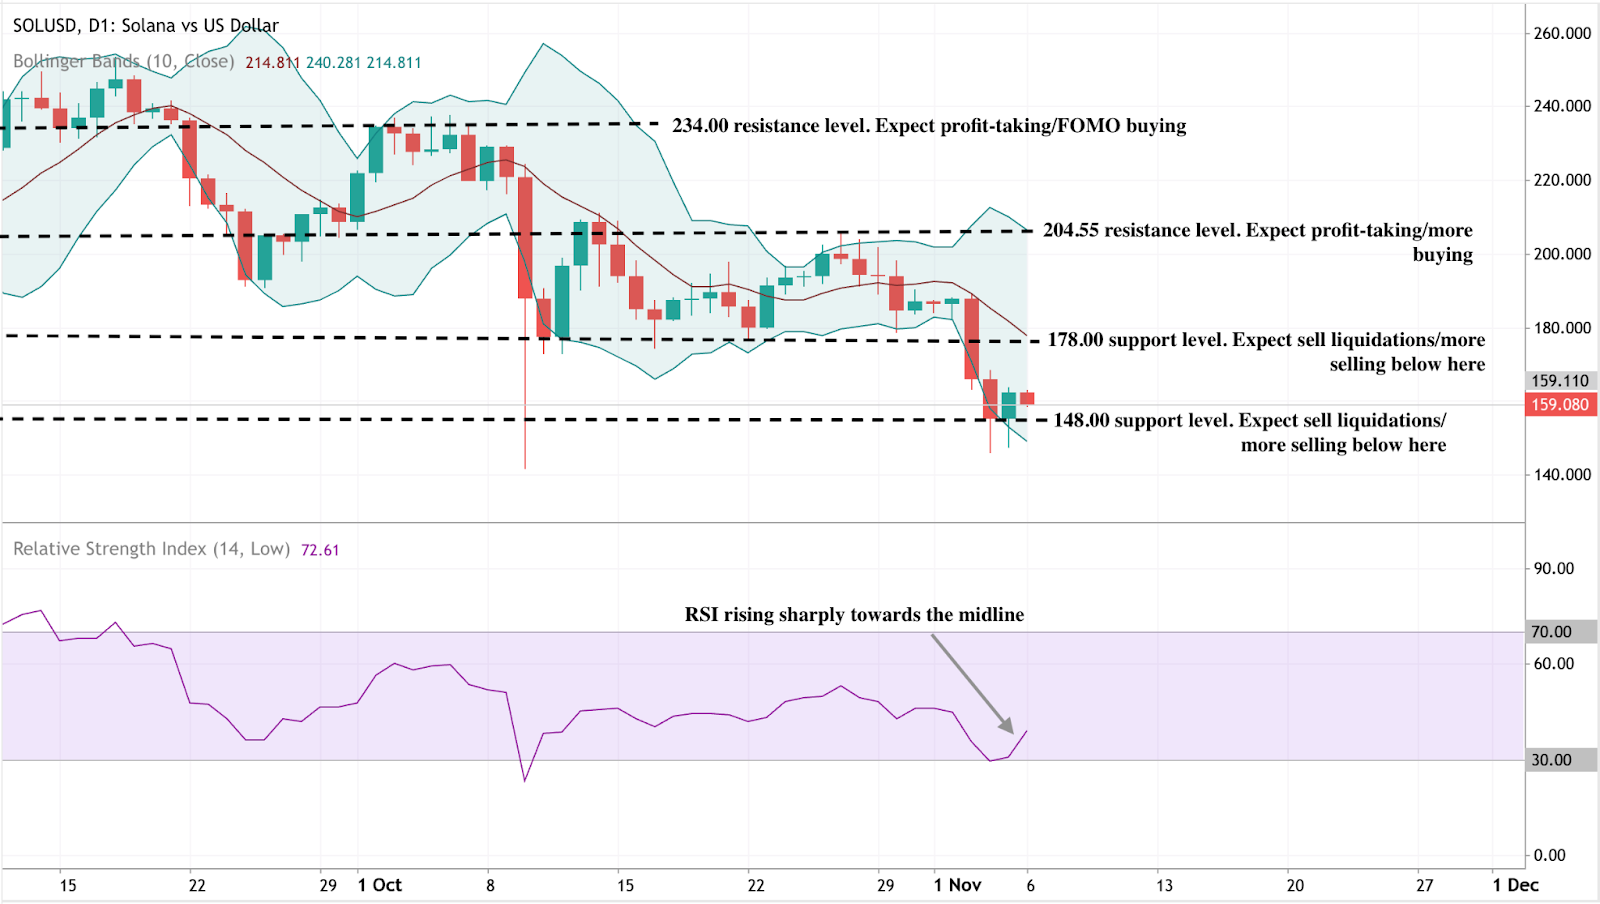
Solana technical insights
Solana is consolidating around $159 after bouncing from the $148 support, a key level where further sell-offs could accelerate if breached. The RSI at 72.6 is rising sharply towards the midline, signalling improving momentum and the potential for a short-term rebound.
The Bollinger Bands indicate that the price is hugging the lower band, suggesting oversold conditions with room for mean reversion if buying pressure strengthens. Immediate resistance lies at $178, followed by $204.55, where profit-taking is likely. A sustained break above $178 could signal a move towards $200–$210, while a failure to hold $148 risks a slide towards $135.
For traders interested in capitalising on such opportunities, Solana CFDs are available on Deriv MT5.
Solana price prediction and investment outlook
For portfolio managers, Solana’s transformation signals a gradual shift from a speculative token to an institutional-grade digital infrastructure.
- In the short term, price performance may remain tied to macroeconomic sentiment and ETF flows.
- Medium-term: The adoption of payment rails and DeFi applications could deepen liquidity.
- In the long term, continued integration with global finance and efficient network scaling may establish Solana as one of the few crypto assets offering both utility and institutional credibility.
In 2025, the real story is not the daily price chart - it is the quiet institutional infrastructure forming beneath it.

Ethereum price crash: Are we in a crypto winter or just a profit-taking phase?
Ethereum’s sharp fall below $3,500 looks less like the beginning of a crypto winter and more like a large-scale profit-taking reset.
Ethereum’s sharp fall below $3,500 looks less like the beginning of a crypto winter and more like a large-scale profit-taking reset. Data across on-chain, derivatives, and institutional flows suggest the market is undergoing a correction after months of aggressive gains, rather than entering a prolonged bearish cycle.
While retail traders and exchange-traded funds (ETFs) are showing fear, whales and institutional treasuries are using the pullback to accumulate - hinting that the current phase could set the foundation for a late-year recovery.
Key takeaways
- Ethereum trades at around $3,312, down 8.92% over the past month.
- Over $1.1 billion in leveraged positions were liquidated within 24 hours, as 303,000 traders were forced out.
- The Crypto Fear & Greed Index dropped to 20 (“Fear”), down from 59 (“Greed”) a month ago.
- Whale wallets added 1.64 million ETH (~$6.4 billion) in October, despite declining prices.
- The Fusaka hard fork upgrade scheduled for 3 December 2025 introduces PeerDAS, expected to cut Layer-2 fees by up to 95%.
- November has historically been Ethereum’s best-performing month, with an average return of +6.9% over the past eight years.
Crypto Market sentiment turns fearful
The Crypto Fear and Greed Index has plunged to 20, signaling widespread unease among investors.
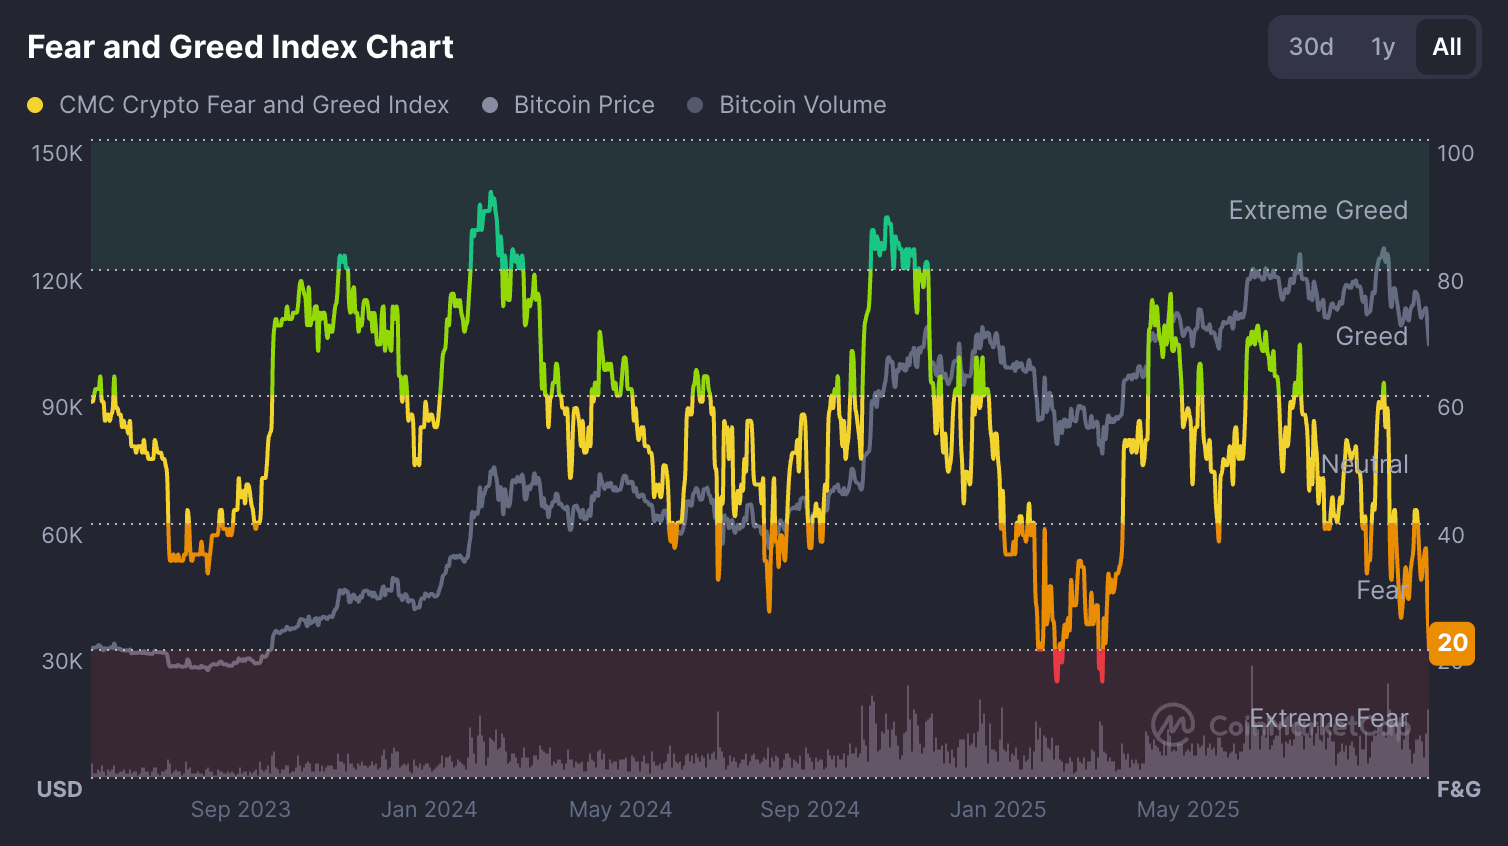
Just a month ago, readings above 50 showed moderate greed. The shift underscores a dramatic shift in sentiment as traders move from optimism to caution.
Across the broader market, nearly every major asset has turned red. Bitcoin fell 2.8% to $104,577, Solana dropped 11%, BNB lost 8.3%, XRP fell 6.7%, and Cardano slid 7.4% in the past 24 hours. The total cryptocurrency market cap has slipped 4% daily, erasing over $140 billion in value.
The macro backdrop compounds the pressure. The Federal Reserve’s uncertain rate outlook and a strengthening U.S. dollar are draining liquidity from risk assets - a dynamic often associated with crypto drawdowns.
ETH Whale accumulation intensifies while retail retreats
While fear dominates headlines, blockchain data reveals that the largest holders are quietly accumulating Ethereum. According to analytics firm Santiment, wallets holding between 1,000 and 100,000 ETH increased their balance from 99.28 million to 100.92 million ETH during the month of October.

This buying occurred even as Ethereum fell around 7% that month - a strong sign that institutional and high-net-worth investors view current prices as attractive entry points.
In contrast, long-term retail accumulation has slowed. Glassnode data show that the Holder Accumulation Ratio has declined from 31.27% to 30.45% since late October.
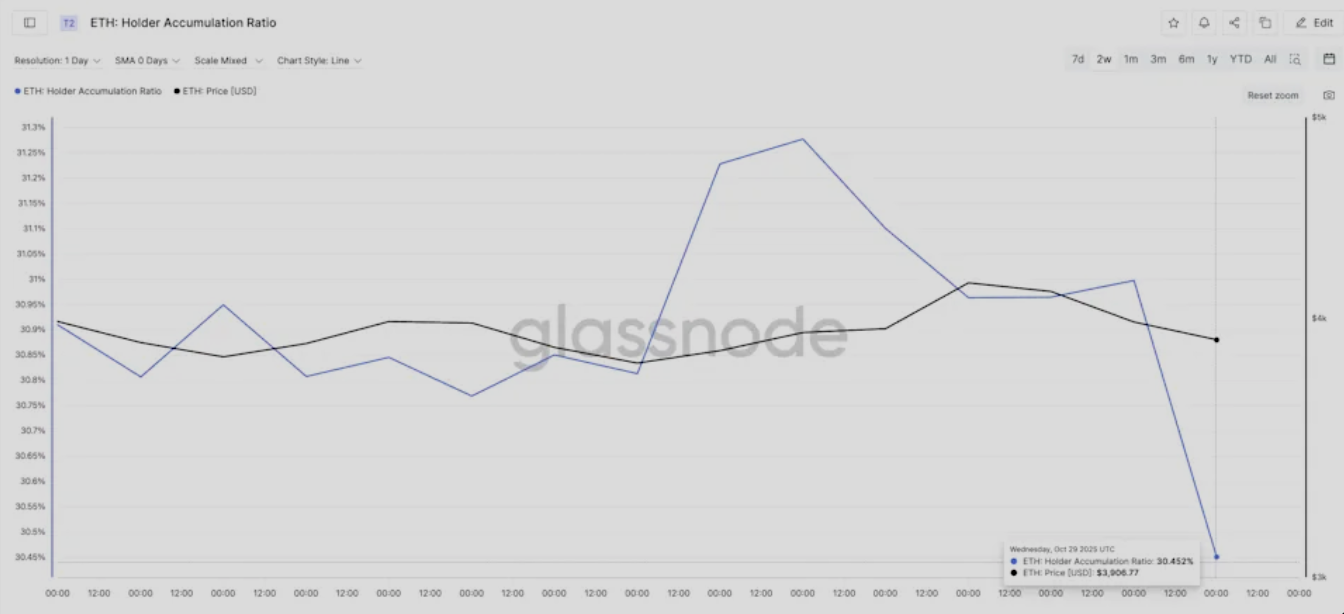
Retail investors are reducing exposure, waiting for clearer signals before re-entering. This divergence between whale buying and retail caution has become the defining feature of the current correction.
Institutional positioning: ETFs and treasuries diverge
Institutional flows paint a mixed picture. On the one hand, U.S. spot Ethereum ETFs experienced $135.76 million in outflows on 3 November.
- BlackRock’s ETHA: −$81.7 million
- Fidelity’s FETH: −$25.1 million
- Grayscale’s ETHE: −$15 million
These redemptions came alongside $186.5 million in Bitcoin ETF outflows, as institutional desks reduced exposure amid heightened volatility.
On the other hand, corporate treasuries are accumulating. Publicly traded BitMine Immersion Technologies (BMNR) added 82,353 ETH last week - worth roughly $294 million - bringing its total holdings to 3.39 million ETH, or 2.8% of Ethereum’s circulating supply. The company’s average purchase price stands around $3,909, suggesting confidence in long-term upside.
BMNR’s chairman, Tom Lee, told CNBC that the market is “consolidating after a reset,” adding that fundamentals such as stablecoin volume and application revenues are at all-time highs. Lee predicts a possible rally toward $7,000 for Ethereum before the end of the year, framing current conditions as a healthy correction rather than a crisis.
Liquidations reveal a market reset
The most dramatic signal of the correction came from the derivatives market. Data from Coinglass shows that over 303,000 traders were liquidated in just 24 hours, resulting in a total of $1.1 billion in forced positions. Within a single hour, more than $300 million was wiped out - $287 million of which were long positions.
This scale of liquidation reveals how over-leveraged bullish bets unraveled once prices broke below key support levels. Ethereum and Bitcoin accounted for the bulk of the wipeout, while high-beta altcoins like Solana and BNB saw even sharper declines.
The outcome is paradoxically constructive: leverage has been purged, funding rates have normalised, and open interest now reflects disciplined accumulation rather than speculative excess. Ethereum’s open interest remains high at $19.9 billion, but funding rates are flat - an equilibrium that often precedes a more stable recovery phase.
Fusaka upgrade offers long-term optimism
While short-term traders react to price volatility, developers are preparing for one of Ethereum’s most ambitious upgrades yet.
The Fusaka hard fork, confirmed for 3 December 2025, introduces Peer Data Availability Sampling (PeerDAS) - a technology that increases block capacity from 6 to 48 per block. This upgrade could reduce Layer-2 transaction fees by up to 95%, significantly improving scalability for DeFi and rollup networks.
Such infrastructure improvements strengthen Ethereum’s long-term competitiveness against alternative Layer-1 chains. With stablecoin transactions on Ethereum hitting $2.8 trillion in October, network fundamentals remain robust despite price turbulence.
Ethereum’s November historical pattern: a bullish bias
Seasonality may soon lend support. Over the past eight years, Ethereum has averaged a monthly return of +6.9 % in November. In 2024, it recorded a remarkable 47.4% rally, marking one of its strongest months ever.
The Net Unrealised Profit/Loss (NUPL) ratio - which measures the percentage of investors in profit - has fallen from 0.43 to 0.39, near the monthly low of 0.38 that last triggered a 13% rebound from $3,750 to $4,240.
This trend suggests selling pressure may be fading as investor incentives to take profits decline.
Macro context: profit-taking, not panic
Ethereum’s downturn mirrors the broader behavior of risk assets. After months of double-digit gains across cryptocurrencies, profit-taking has accelerated amid global liquidity concerns. The U.S. dollar index strengthened sharply, and Fed officials have hinted at slower rate cuts, encouraging investors to rotate out of speculative assets.
Unlike prior bear-market conditions, however, there is no collapse in network activity or developer engagement. DeFi revenue remains strong, stablecoin velocity is high, and whale inflows indicate rotation rather than retreat. The sell-off, therefore, aligns more with profit-locking behavior than the sustained capital flight that characterised the 2022–2023 crypto winter.
Traders on Deriv MT5 can track these shifts across multiple assets, from cryptocurrencies to forex, to gauge broader market sentiment in real-time.
Ethereum technical insights: Stabilisation vs. further weakness

Ethereum is currently trading near $3,313, rebounding after a sharp decline that tested the $3,745 support level. This zone has acted as a key area where sell liquidations intensified, but the recent bounce suggests early signs of buyer interest.
The Bollinger Bands have widened significantly, indicating elevated volatility, while price action remains near the lower band - typically a sign of short-term oversold conditions. A sustained close above the middle band could confirm a recovery in momentum.
Meanwhile, the Relative Strength Index (RSI) has risen sharply from 33, signaling improving bullish momentum after near-oversold readings. A further RSI move above 50 would reinforce a potential short-term reversal.
Resistance levels remain at $4,250 (where profit-taking and more buying may emerge) and $4,700, marking a stronger ceiling for any extended rally. Overall, ETH shows early signs of recovery but still faces strong resistance ahead.
The near-term outlook depends on whether ETF outflows stabilise and whether the whale accumulation trend continues through November. With fear levels elevated, contrarian traders are closely watching for a potential bottoming process similar to past mid-cycle corrections. The Deriv trading calculator can help traders assess potential profit and margin exposure before taking positions in such volatile environments.
Ethereum investment implications
For short-term traders, Ethereum’s setup suggests a high-volatility environment with tactical entry opportunities near the $3,500–$3,700 support range. Upside targets into December sit between $4,400 and $4,600, assuming sentiment stabilises and ETF outflows slow.
For medium-term investors, current levels represent an accumulation window. Whale buying, the Fusaka upgrade, and seasonal patterns point to improving fundamentals beneath the surface fear. Institutional participation is likely to return once macroeconomic uncertainty eases and on-chain stability confirms a bottom.
In essence, Ethereum’s decline is a market normalisation, not a meltdown. As leverage unwinds and fundamentals strengthen, the groundwork for the next leg higher may already be forming.
抱歉,無法找到符合 的結果。
搜尋提示:
- 檢查拚寫並重試
- 嘗試其他關鍵字