ප්රතිඵල

රිදී නිහඬවම රන් අභිබවා යයි: මෙම ධාවනය දිගටම පැවතිය හැකිද?
මෑත දත්ත පෙන්වා දෙන්නේ මෙම සතියේ රිදී 7% කට වඩා ඉහළ ගොස් ඇති අතර, එය එහි වාර්තාගත ඉහළම අගයට ඉතා ආසන්න වී ඇති බවයි.
රිදී නිහඬවම රන් අභිබවා යයි - නමුත් මෙම ධාවනය දිගටම පැවතිය හැකිද? මෑත දත්ත පෙන්වා දෙන්නේ මෙම ලෝහය මෙම සතියේ 7% කට වඩා ඉහළ ගොස් ඇති අතර, තුනී Thanksgiving ද්රවශීලතාවය (liquidity) සෑම චලනයක්ම විශාල කර පෙන්වන බැවින් XAG/USD එහි වාර්තාගත ඉහළම අගයට ඉතා ආසන්න වී ඇති බවයි. සාමාන්යයෙන් ප්රධාන මාතෘකාව වන රන් (Gold), එහි අස්ථාවරත්වය මැකී ගොස් ඇති නමුත්, රිදී සෘතුමය නොවන බව පෙනෙන හදිසි ඉහළ යාමක් සමඟින් කරළියට පැමිණ ඇත.
වෙළඳපල නිරීක්ෂකයින් ප්රකාශ කළේ මෙම බිඳී යාම පිටුපස ඇති බලවේග සැබෑ බවයි: දුර්වල US සිල්ලර විකුණුම්, බිඳ වැටෙන පාරිභෝගික අපේක්ෂාවන් සහ දෙසැම්බර් Fed කප්පාදුවක් සඳහා 84% ක වෙළඳපල ඇඟවුම් සම්භාවිතාව ආරක්ෂිත වත්කම් (haven assets) සඳහා ඉල්ලුම වේගවත් කර ඇත. මෙම හදිසි ඉහළ යාම තාවකාලික නිවාඩු කාලීන විස්ථාපනයක් ද නැතහොත් ව්යුහාත්මක නැවත ශ්රේණිගත කිරීමක මුල් අවධිය ද යන්න වෙළඳුන් දැන් කිරා මැන බලයි. රිදීවල මෙම ඉහළ ක්රියාකාරිත්වය පැවතිය හැකිද යන එම ප්රශ්නය - වෙළඳපල විශ්ලේෂණයේ ඉතිරි කොටස සඳහා තානය සකසයි.
රිදීවල හදිසි ඉහළ යාමට හේතුව කුමක්ද?
රිදීවල නවතම රැලි (rally) එක මැක්රෝ ආතතිය සහ තුනී වන ද්රවශීලතාවයේ මංසන්ධියේ පවතී. 2021 සිට US සිල්ලර විකුණුම් නාමිකව වැඩි වී ඇති අතර, එය වර්ධනයට ඉඩක් නොතබන ඇනහිටි පාරිභෝගික එන්ජිමක් සංඥා කරයි. Conference Board හි අපේක්ෂා දර්ශකය 63.2 දක්වා පහත වැටී ඇති අතර, එය ඓතිහාසිකව අවපාතයන්ට පෙර පැවති මට්ටමක් වන අතර, ආරක්ෂිත වත්කම් වෙත යොමු වීම ශක්තිමත් කරයි.

ආයෝජකයින් US ඉල්ලුමේ ගමන් මග නැවත තක්සේරු කිරීමත් සමඟ, ආර්ථික වෙනස්කම් වලට සංවේදී ලෝහ ඉක්මනින් ප්රතිචාර දක්වා ඇත - ඒ අතරින් රිදී ප්රධාන වේ.
Federal Reserve හි හැරීම මෙම වෙනස වේගවත් කර ඇත. වෙළඳපලවල් පොලී අනුපාත කප්පාදුවක සම්භාවිතාව වේගයෙන් නැවත මිල කර ඇති අතර, එය දින කිහිපයක් ඇතුළත 50% සිට 84% දක්වා ඉහළ ගොස් ඇත.
New York Fed සභාපති John Williams සහ අනෙකුත් නිලධාරීන්ගේ අදහස් දැක්වීම් මගින් පෙන්නුම් කර ඇත්තේ ගම්යතාවය දිගටම දුර්වල වුවහොත් ලිහිල් කිරීමට සූදානම් බවයි. Treasury yields මාසයක අඩුම අගයන් කරා පසුබසින විට සහ ඩොලරය දුර්වල වන විට, ප්රතිලාභ නොලබන වත්කම් විශාල වාසියක් භුක්ති විඳියි. මෙම තත්වයන්ට රිදීවල ඇති ලීවරය (leverage), එහි චලනය මෙතරම් ක්ෂණික - සහ මෙතරම් නාටකාකාර වීමට හේතුව පැහැදිලි කිරීමට උපකාරී වේ.
එය වැදගත් වන්නේ ඇයි
විශ්ලේෂකයින්ට අනුව, රිදීවල ඉහළ යාම වැදගත් වන්නේ රැලි (rally) එකේ වේගය නිසා පමණක් නොව එය පිළිබිඹු කරන දේ නිසාය. රන් (gold) අවසාන ආරක්ෂිත ස්ථානය ලෙස ප්රසිද්ධියක් උසුලන නමුත්, රිදී එය විශාල පරතරයකින් අභිබවා ගොස් ඇති අතර, 2023 ඔක්තෝබර් මාසයේ සිට 163% කින් ඉහළ ගොස් මෙම මස මුලදී ඩොලර් 54.38 ක වාර්තාගත ඉහළ අගයක් වාර්තා කළේය. රිදී මූල්ය හෙජින් (monetary hedging) සහ කාර්මික උපයෝගීතාවයේ මංසන්ධියේ පවතින බැවින් ආයතනවලට එම ඉහළ ක්රියාකාරිත්වය නොසලකා හැරීම වඩ වඩාත් දුෂ්කර ය.
මිල ක්රියාකාරිත්වය ගැඹුරු කනස්සල්ලක් හෙළි කරන බවට ද ඔවුහු අනතුරු අඟවති. KCM Trade හි ප්රධාන වෙළඳපල විශ්ලේෂක Tim Waterer සඳහන් කරන්නේ මෘදු මැක්රෝ දර්ශක ගොඩගැසෙන විට වෙළඳපල "ලිහිල් අදහස් දැක්වීම් සමූහයකට" ප්රතිචාර දක්වන බවයි. ඔහුගේ තක්සේරුව පුළුල් ගැටළුවක් පෙන්වා දෙයි: රිදී ඉහළ යන්නේ වර්ධනය ශක්තිමත් නිසා නොව, US ආර්ථිකයේ ගමන් මග පිළිබඳ විශ්වාසය අඩුවෙමින් පවතින බැවිනි. ලෝහ එම අවිනිශ්චිතතාවය තත්ය කාලීනව අවශෝෂණය කර ගනී.
වෙළඳපල සහ කර්මාන්ත කෙරෙහි බලපෑම
වෙළඳුන් සඳහා, නිවාඩු කාලය සඳහා වෙළඳපල තුනී වන විට රිදීවල හදිසි ඉහළ යාම ස්ථානගත කිරීම සංකීර්ණ කරයි. අඩු සහභාගීත්වය දිනක් තුළ සිදුවන චලනයන් (intraday moves) විශාල කරන අතර, දිශානුගත අවදානම් හෙජ් කිරීම වඩාත් අපහසු කරයි. අස්ථාවර තත්වයන් තුළ ක්රියාත්මක කිරීමේ වේගය සහ නිශ්චිත වෙළඳ ප්රමාණය තීරණාත්මක වන Deriv MT5 වැනි වේදිකාවල, මෙම පරිසරය වෙළඳුන් විමසිලිමත්ව සිටීම අවශ්ය කරයි. රිදීවල තියුණු දෛනික උච්චාවචනයන් භාර ගැනීමට පෙර විභව ලාභය, swap ගාස්තු සහ ස්ථාන නිරාවරණය මැනීම සඳහා බොහෝ දෙනෙක් Deriv trading calculator වැනි මෙවලම් මත වැඩි වැඩියෙන් රඳා සිටිති.
නමුත් ගැඹුරු කතාව ඇත්තේ කාර්මික අංශය තුළ ය. සූර්ය පැනල නිෂ්පාදනයෙන් රිදී ඉල්ලුම 2024 දී අවුන්ස මිලියන 243.7 දක්වා ඉහළ ගිය අතර, එය 2023 දී මිලියන 191.8 ක් වූ අතර 2020 දී දක්නට ලැබුණු මට්ටමට වඩා දෙගුණයකටත් වඩා වැඩි ය.
ගෝලීය සූර්ය ධාරිතාව 2030 වන විට වාර්ෂිකව 1,000 GW පමණ කරා ළඟා වීමට නියමිතව ඇති හෙයින්, ඉල්ලුම වසරකට තවත් අවුන්ස මිලියන 150 කින් ඉහළ යනු ඇතැයි අපේක්ෂා කෙරේ. කෙසේ වෙතත්, සැපයුම සීමිතව පවතී: ගෝලීය රිදී නිෂ්පාදනයෙන් බහුතරයක් තඹ, සින්ක්, ඊයම් හෝ රන් නිෂ්පාදනයේ අතුරු ඵලයක් වන අතර, එය මිල සංඥා වලට ගැලපීම මන්දගාමී කරයි. Mining Technology ඇස්තමේන්තු කරන්නේ ගෝලීය නිෂ්පාදනය 2030 වන විට අවුන්ස මිලියන 901 දක්වා පහත වැටිය හැකි බවයි - මෙය ඉහළ මිල ගණන් සඳහා දිගුකාලීන තර්කය ශක්තිමත් කරන ව්යුහාත්මක හිඟයකි.
විශේෂඥ දැක්ම
රිදීවල ධාවනයේ තිරසාරභාවය මූලික සාධක තුනක් මත රඳා පවතින බව වෘත්තීය වෙළඳුන් ප්රකාශ කළහ: Fed හි ඊළඟ පියවර, US පරිභෝජනයේ ගමන් මග සහ කාර්මික ව්යාප්තියේ වේගය. ප්රතිපත්ති සම්පාදකයින් දෙසැම්බර් හැරීම තහවුරු කරන්නේ නම්, අඩු ප්රතිලාභ (yields) සහ මෘදු ඩොලරයක එකතුව මිල ගණන් නව වාර්තාගත භූමියකට ගෙන යාමට අවශ්ය උත්ප්රේරකය ලබා දිය හැකිය. අවපාත සංඥා වඩාත් දීප්තිමත්ව දැල්වෙන විට, ආරක්ෂිත වත්කම් සඳහා ඇති ඉල්ලුම ඉක්මනින් වාෂ්ප වී යාමට ඉඩක් නැත.
එහෙත් කිසිවක් සහතික නැත. පාරිභෝගික ක්රියාකාරකම්වල හදිසි නැවත පැමිණීමක් හෝ උද්ධමන පුදුමයක් ප්රතිපත්ති ලිහිල් කිරීමේ අපේක්ෂාවන් මන්දගාමී කළ හැකිය. කෙටි කාලීන අස්ථාවරත්වය අවශෝෂණය කර ගැනීමට තරම් සූර්ය ඉල්ලුම ශක්තිමත් බව පෙනුනද, කාර්මික පරිශීලකයින් අවසානයේ ඉහළ මිල ගණන් වලට එරෙහිව පියවර ගත හැකිය. දැනට, වෙළඳුන් පැමිණෙන සාර්ව ආර්ථික දත්ත සහ Federal Reserve සන්නිවේදනයන් සමීපව නිරීක්ෂණය කරයි. පෙර පැවති උපරිමයට වඩා තීරණාත්මක බිඳී යාමක් මගින් වෙළඳපල රිදී සඳහා මූලික වශයෙන් නව මිලකරණ පාලන තන්ත්රයක් දකින බවට සංඥා කළ හැකිය.
ප්රධාන කරුණු
රිදීවල හදිසි ඉහළ යාම, දුර්වල වන US දත්තවල සිට ආසන්න කාලීන අනුපාත කප්පාදු කිරීමේ ඉහළ යන අපේක්ෂාවන් දක්වා සැබෑ ආර්ථික සංඥා තුළ මුල් බැස ඇත. මෙම ලෝහය රන් අභිබවා ගොස් ඇති අතර දැන් ආරක්ෂිත ගලා ඒම් සහ ප්රබල කාර්මික කතාවක සහාය ඇතිව ඓතිහාසික ඉහළ අගයන් සමඟ ගැවසෙමින් පවතී. ධාවනය දිගටම පවතීද යන්න Fed හි පණිවිඩ සහ US කුටුම්භවල ඔරොත්තු දීමේ හැකියාව මත රඳා පවතී, නමුත් පුළුල් ප්රවණතාවය දැඩි සැපයුම සහ කල් පවතින ඉල්ලුම දෙසට යොමු වේ. ඉදිරි සති කිහිපය තුළ රිදී හුදෙක් රැලි (rally) එකක් ද - නැතහොත් නව චක්රයක් සඳහා නැවත මිල කිරීමක් ද යන්න හෙළි වනු ඇත.
රිදී තාක්ෂණික අවබෝධයන්
ලියන අවස්ථාව වන විට, රිදී (XAG/USD) ඩොලර් 53.79 පමණ අගයක ගනුදෙනු වන අතර, ප්රධාන ඩොලර් 54.22 ප්රතිරෝධක මට්ටමට ළඟා වන විට ආක්රමණශීලී ලෙස ඉහළ යයි. මෙම කලාපය ලාභ ලබා ගැනීම (profit-taking) ආකර්ෂණය කර ගැනීමට ඉඩ ඇතත්, වර්තමාන රැලි (rally) එකේ ශක්තිය අනුව පැහැදිලි බිඳී යාමක් නැවුම් ගම්යතා මිලදී ගැනීම් ඇති කළ හැකිය.
පහළට යන විට, ප්රධාන ආධාරක ඩොලර් 50.00 සහ ඩොලර් 47.00 හි පවතී. මෙම දෙකෙන් එකකට පහළින් ආපසු යාම මගින් ඉහළ යාමේ පීඩනය අඩුවීමක් පෙන්නුම් කළ හැකි අතර, විශේෂයෙන් මිල Bollinger Band නාලිකාවේ මැද ලක්ෂ්යය හරහා ලිස්සා ගියහොත් විකුණුම් ද්රවශීලතාවයන් හෝ ගැඹුරු පසුබෑමක් ඇති කළ හැකිය.
ගම්යතාවය ශක්තිමත්ව පවතින අතර, RSI 80 පමණ දක්වා තියුනු ලෙස ඉහළ යාමත් සමඟ, එය දැඩි ලෙස අධික ලෙස මිලදී ගත් (overbought) භූමියක පවතී. මෙය ගැනුම්කරුවන් පාලනයේ සිටින බව සංඥා කරන නමුත් විභව කෙටි කාලීන වෙහෙස ගැන අනතුරු අඟවයි. ඉහළ යාමේ ප්රවණතාවය නොවෙනස්ව පවතින අතර, අධික ලෙස මිලදී ගත් තත්වයන් දිගටම පැවතුනහොත් රිදී පසුබෑම් හෝ අතුරුපස ඒකාබද්ධ කිරීම් (sideways consolidation) වලට ගොදුරු විය හැකිය.


Bitcoin හි පුනරාගමනය: $90,000 කඩාගෙන යාම සැබවින්ම පැවතිය හැකිද?
Bitcoin $90,000 ට ඉහළින් නැවත පැමිණීමත් සමඟ එහි පුනරාගමනය පැහැදිලිව දැකගත හැකි අතර, මෙම කඩාගෙන යාම සැබවින්ම පැවතිය හැකිද යන්න පිළිබඳ ප්රශ්නය මතු කරයි.
ලොව විශාලතම cryptocurrency එක වන Bitcoin $90,000 ට ඉහළින් නැවත පැමිණීමත් සමඟ එහි පුනරාගමනය පැහැදිලිව දැකගත හැකි අතර, මෙම කඩාගෙන යාම සැබවින්ම පැවතිය හැකිද යන්න පිළිබඳ ප්රශ්නය මතු කරයි. වාර්තා වලට අනුව, දින කිහිපයකට පෙර දක්නට ලැබුණු ~$80,400 අවම මට්ටමේ සිට මෙම තියුණු යළි නැගිටීම සිදුවූයේ, දෙසැම්බර් මාසයේදී Federal Reserve පොලී අනුපාත කපා හරිනු ඇතැයි යන අපේක්ෂාවන් ඉහළ යාම සහ අවදානම් වත්කම් වෙත පුළුල් ලෙස මාරුවීම හේතුවෙනි.
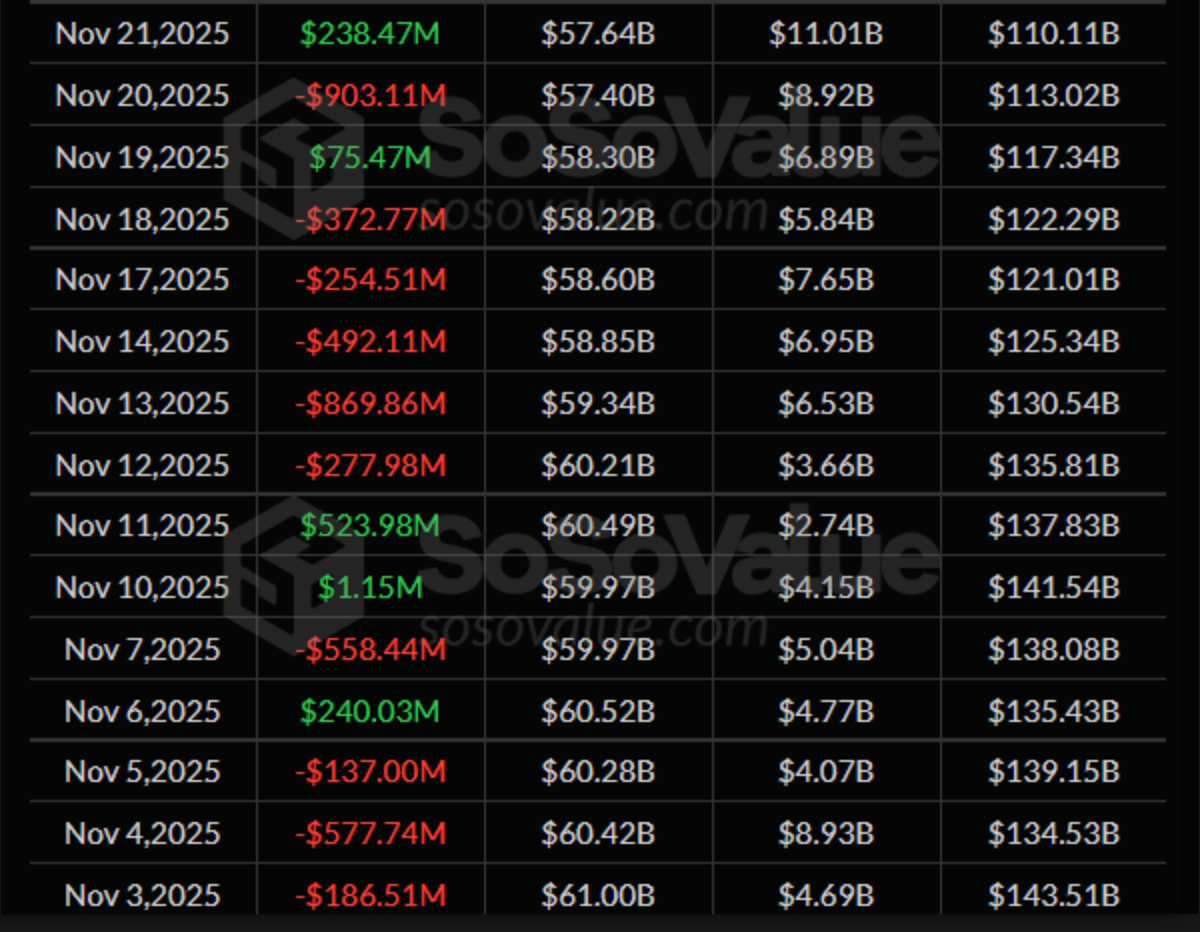
එහෙත් Bitcoin හි ඉහළ යාම අස්ථාවර පදනමක් මත පවතී, spot ETFs තවමත් දුර්වල ගලා ඒම් අත්විඳින අතර මාසික කාර්ය සාධනය BTC 19% කින් පමණ පහත වැටී ඇති බව පෙන්වයි, එය මෙම නැවත පැමිණීම පිටුපස ඇති අසමාන පදනම අවධාරණය කරයි.
විශ්ලේෂකයින් ප්රකාශ කළේ අලුත් වූ ශුභවාදී බව සහ පිරිහෙන ද්රවශීලතාවය අතර මෙම ආතතිය දැන් වෙළඳපල මනෝභාවය නිර්වචනය කරන බවයි. Bitcoin මෙම ප්රතිසාධනය කල් පවතින දෙයක් බවට පරිවර්තනය කිරීමට නම්, එය $92,000–$95,000 කලාපයේ දැඩි ප්රතිරෝධය ජය ගත යුතු අතර සිල්ලර පරිමාව සහ ETF සහභාගීත්වය තීරණාත්මක ලෙස ආකර්ෂණය කර ගත යුතුය. එම තත්වයන් මතු වේද - නැතහොත් කඩාගෙන යාම තවත් නිවැරදි කිරීමේ පහත වැටීමක් බවට පත්වේද යන්න - Bitcoin හි ඊනියා පුනරාගමනයේ ඊළඟ පරිච්ඡේදය තීරණය කරනු ඇත.
Bitcoin හි නවතම චලනය මෙහෙයවන්නේ කුමක්ද
Bitcoin හි නවතම නැගීම අර්ධ වශයෙන් වෙනස් වන සාර්ව ආර්ථික අපේක්ෂාවන් මගින් බල ගැන්වී ඇත. වෙළඳුන් දැන් දෙසැම්බර් Federal Reserve අනුපාත කප්පාදුවක් සඳහා ඉහළ සම්භාවිතාවක් ලබා දෙමින් සිටින අතර, එය කොටස් සහ cryptocurrency වෙළඳපල හරහා අවදානම් රුචිය නැවත ඇති කිරීමට උපකාරී වේ.
මෙම හැඟීම් වෙනස්වීම පසුගිය සතියේ $80,000 කලාපයට වැටීමෙන් පසු BTC හට $90,000 මට්ටම නැවත ලබා ගැනීමට උපකාරී විය. එහෙත් පසුබිම වඩාත් සංකීර්ණ ය: උද්ධමනය ඉහළ මට්ටමක පවතින අතර, QCP Capital හි විශ්ලේෂකයින්ට “සැපයුම මගින් BTC මැද-$90K හි සීමා කිරීමට ඉඩ ඇතැයි” අනතුරු ඇඟවීමට පොළඹවයි, එයින් ඇඟවෙන්නේ ඉහළ යාම වෙහෙසට පත්විය හැකි බවයි.
ETF භූ දර්ශනය තවත් ස්ථරයක් එක් කරයි. සති ගණනාවක වාර්තාගත පිටතට ගලා යාමෙන් පසුව, එක්සත් ජනපද bitcoin ETFs ස්ථාවර ගලා ඒම් ආකර්ෂණය කර ගැනීමට අරගල කර ඇත. විශ්ලේෂකයින් සටහන් කරන්නේ ද්රවශීලතාවය සිහින්ව පවතින බවත්, ආයෝජක ඉල්ලුම දෙගිඩියාවෙන් පවතින බවත්ය.
Bitcoin හි විශාලතම ආයතනික හිමිකරුවන්ගෙන් එකක් වන MicroStrategy - යන්තම් ලාභ අලාභ රහිත මට්ටම්වලට ළඟා වී ඇති අතර දැන් MSCI හි ලැයිස්තුගත කිරීමෙන් ඉවත් කිරීමේ මුර ලැයිස්තුවේ සිටී, එය ආයතනික නිරාවරණය පිළිබඳ අවිනිශ්චිතතාවය වැඩි කරයි. මිල ගණන් යථා තත්ත්වයට පත් වුවද, මෙම ආතතීන් මතුපිටට යටින් පවතින අතර, ශක්තිමත් ප්රාග්ධන ගලා ඒමට වඩා සාර්ව ස්ථානගත කිරීම මත ගොඩනගා ඇති ඉහළ යාමක් හෙළි කරයි.
එය වැදගත් වන්නේ ඇයි
මිල ක්රියාකාරිත්වය සහ ව්යුහාත්මක මිනුම් අතර විෂමතාවය ආයෝජකයින්ගේ කේන්ද්රීය ලක්ෂ්යයක් බවට පත්ව ඇත. Apollo හි ප්රධාන ආර්ථික විද්යාඥ Torsten Slok සටහන් කරන්නේ Nasdaq සමඟ Bitcoin හි සාමාන්ය සහසම්බන්ධය මෑත සතිවල දුර්වල වී ඇති බවයි, මන්ද BTC ප්රධාන තාක්ෂණික මිණුම් සලකුණු වලට වඩා වේගයෙන් පහත වැටී ඇති බැවිනි.

කොටස් ස්ථාවර වෙමින් පවතින අවස්ථාවක මෙම විසන්ධි වීම crypto-විශේෂිත ද්රවශීලතා ගැටළු පිළිබඳ ප්රශ්න මතු කරයි. මේ අතර, 10X Research හි විශ්ලේෂකයින් අනතුරු අඟවන්නේ වෙළඳපල දෙසැම්බර් අනුපාත කප්පාදුවක් කෙරෙහි වැඩි විශ්වාසයක් තබා ඇති බවයි. ඔවුන්ගේ කාර්යය යෝජනා කරන්නේ Bitcoin සැබෑ ප්රතිපත්තිමය පියවරයන්ට වඩා Fed හි සන්නිවේදනය සහ ස්වරයට ප්රතිචාර දක්වන බවයි.
Powell ප්රවේශම් වන බවට සංඥා කළහොත් හෝ අනාගත ලිහිල් කිරීමේ වේගය අවතක්සේරු කළහොත්, වෙළඳපල ඉක්මනින් ආපසු හැරවිය හැකිය. crypto ද්රවශීලතාවය සඳහා උත්ප්රේරකයක් ලෙස Treasury General Account (TGA) වියදම් කිරීම වටා ඇති උපකල්පනවලට ද සමාගම අභියෝග කරයි, පෙර TGA නිකුතු Bitcoin හි මිලට බලපෑම් කිරීමට මාස දෙකක් දක්වා ගත වූ බව සටහන් කරයි.
කර්මාන්තය, වෙළඳපල සහ පාරිභෝගිකයින් කෙරෙහි බලපෑම
මෑත දත්ත හෙළි කළ පරිදි, Bitcoin නැවත $90,000 ට ඉහළින් ගමන් කිරීම යම් මානසික විශ්වාසයක් ප්රතිෂ්ඨාපනය කර තිබිය හැකි නමුත් ව්යුහාත්මක චිත්රය අසමාන ලෙස පවතී. වත්කම වසරේ මේ දක්වා 5% කින් පහත වැටී ඇති අතර, BTC $80K පමණ දක්වා පහත වැටීමට දායක වූ දැඩි පිටතට ගලා යාමෙන් පසුව ETF නිෂ්පාදන ස්ථාවර වූයේ මෑතකදී ය. මෙම යළි නැගිටීම සහනයක් ලබා දී ඇතත්, වෙළඳපල පැහැදිලි ඉහළ යාමේ ප්රවණතාවක් සංඥා කිරීමට බොහෝ දුරයි.
ආයතනික ගලා ඒම් වෙනස් වීමේ සලකුණු ලබා දෙයි. VALR ප්රධාන විධායක නිලධාරී Farzam Ehsani පැවසුවේ spot ETFs අඟහරුවාදා සති ගණනාවකට පසු පළමු වරට ගලා ඒම් දුටු බවයි - “ආයතනික ද්රවශීලතාවය නැවත පැමිණෙන බවට මුල් ලකුණක්.” Deriv MT5 හරහා මිල හැසිරීම නිරීක්ෂණය කරන වෙළඳුන් ව්යුහාත්මක හැරවුම් ලක්ෂයක් ලෙස $90,000 හි වැදගත්කම සටහන් කර ඇති අතර, කෙටි කාල රාමු ඉහළ යාමේ උත්සාහයන් සහ ලාභ ලබා ගැනීමේ තරංග අතර අස්ථාවරත්වය පෙන්වයි. මේ අතර, BTC ප්රධාන ප්රතිරෝධය සමඟ ගැටෙන විට ස්ථාන පිරිවැය සහ අවදානම තක්සේරු කිරීමට බලාපොරොත්තු වන වෙළඳුන් සඳහා Deriv trading calculator වැඩි වැඩියෙන් ප්රයෝජනවත් වී ඇත.
වෙළඳපල නිරීක්ෂකයින්ට අනුව, Bitcoin හි කාර්ය සාධනය පුළුල් ඩිජිටල් වත්කම් සංකීර්ණයට දිගටම බලපෑම් කරයි. $90,000 ට ඉහළින් තීරණාත්මකව රැඳී සිටීම altcoin සහ stablecoin වෙළඳපල හරහා ද්රවශීලතාවය ඉහළ නැංවිය හැකිය. අවදානම් බිඳවැටීමක් බලහත්කාරයෙන් විකිණීම නැවත පණ ගැන්විය හැකි අතර අංශය පුරා විශ්වාසය ඛාදනය කළ හැකිය.
විශේෂඥ දැක්ම
QCP Capital $92,000 සහ $95,000 අතර පැහැදිලි ප්රතිරෝධක කලාපයක් නිර්මාණය වන බව දකින අතර, ද්රවශීලතාවය හැකිලීම ඉහළට තල්ලු කිරීමට ගන්නා ඕනෑම උත්සාහයක් සීමා කළ හැකි බවට අනතුරු අඟවයි. නවතම විකිණීමේදී ගැනුම්කරුවන් ආරක්ෂා කළ තීරණාත්මක ආධාරක ප්රදේශයක් ලෙස ඔවුන් $80,000 –$82,000 පරාසය හඳුනා ගනී. 10X Research හි විශ්ලේෂකයින් එකතු කරන්නේ ඓතිහාසික TGA-ද්රවශීලතා ප්රමාදයන් පවතින්නේ නම්, Bitcoin 2026 ජනවාරි අග දක්වා ඒකාබද්ධ විය හැකි අතර, වේගවත් කඩාගෙන යාමක සම්භාවිතාව අඩු කරන බවයි.
පහළම මට්ටමට ළඟා වී ඇති බව සියලුම උපායමාර්ගිකයින් විශ්වාස නොකරයි. Compass Point විශ්ලේෂක Ed Engel තර්ක කරන්නේ වලස් වෙළඳපල බොහෝ විට “වේගවත් සහන රැලි සහ පසුව ශක්තියට ආක්රමණශීලී ලෙස විකිණීම” ඇතුළත් වන බවයි. ධනාත්මක වීමට පෙර දිගුකාලීන හිමිකරුවන්ගෙන් ශුද්ධ සමුච්චය වීම සහ අනාගත වෙළඳපල තුළ වඩාත් ස්ථීර කෙටි ස්ථානගත කිරීම් දැකීමට ඔහුට අවශ්යය. මෙම සංඥා නොමැතිව, BTC $92,000-$95,000 වෙත ළඟා වුවහොත් දැඩි ප්රතිරෝධයකට මුහුණ දිය හැකි බවට Engel අවදානමක් හඳුනා ගනී, එය අලුත් වූ පසුබෑමක් ඇති කළ හැකිය.
ප්රධාන කරුණු
විශ්ලේෂකයින් සටහන් කරන්නේ, Bitcoin නැවත $90,000 ට ඉහළින් නැගීම එහි පවතින පුනරාගමනයේ සංකේතාත්මක හැරවුම් ලක්ෂයක් සනිටුහන් කරන නමුත් මෙම ඉහළ යාමේ පදනම සිහින්ව පවතින බවයි. $92,000 –$95,000 ආසන්නයේ ප්රතිරෝධය, දුර්වල ETF ගලා ඒම් සහ ඓතිහාසිකව බිඳෙනසුලු වසර අවසාන ද්රවශීලතා පසුබිම යන සියල්ල කඩාගෙන යාමේ තිරසාරභාවයට අභියෝග කරයි.
ඊළඟ අදියර රඳා පවතින්නේ වෙළඳපල Fed හි දෙසැම්බර් පණිවිඩ දිරවා ගන්නේ කෙසේද, සිල්ලර වෙළඳුන් නැවත පැමිණේද සහ ආයතනික ගලා ඒම් ශක්තිමත් වේද යන්න මතය. Bitcoin හි පුනර්ජීවනය දිගටම පවතීද - නැතහොත් හුරුපුරුදු ප්රතිරෝධයේදී නතර වේද යන්න මෙම බලවේග තීරණය කරනු ඇත.
Bitcoin තාක්ෂණික අවබෝධය
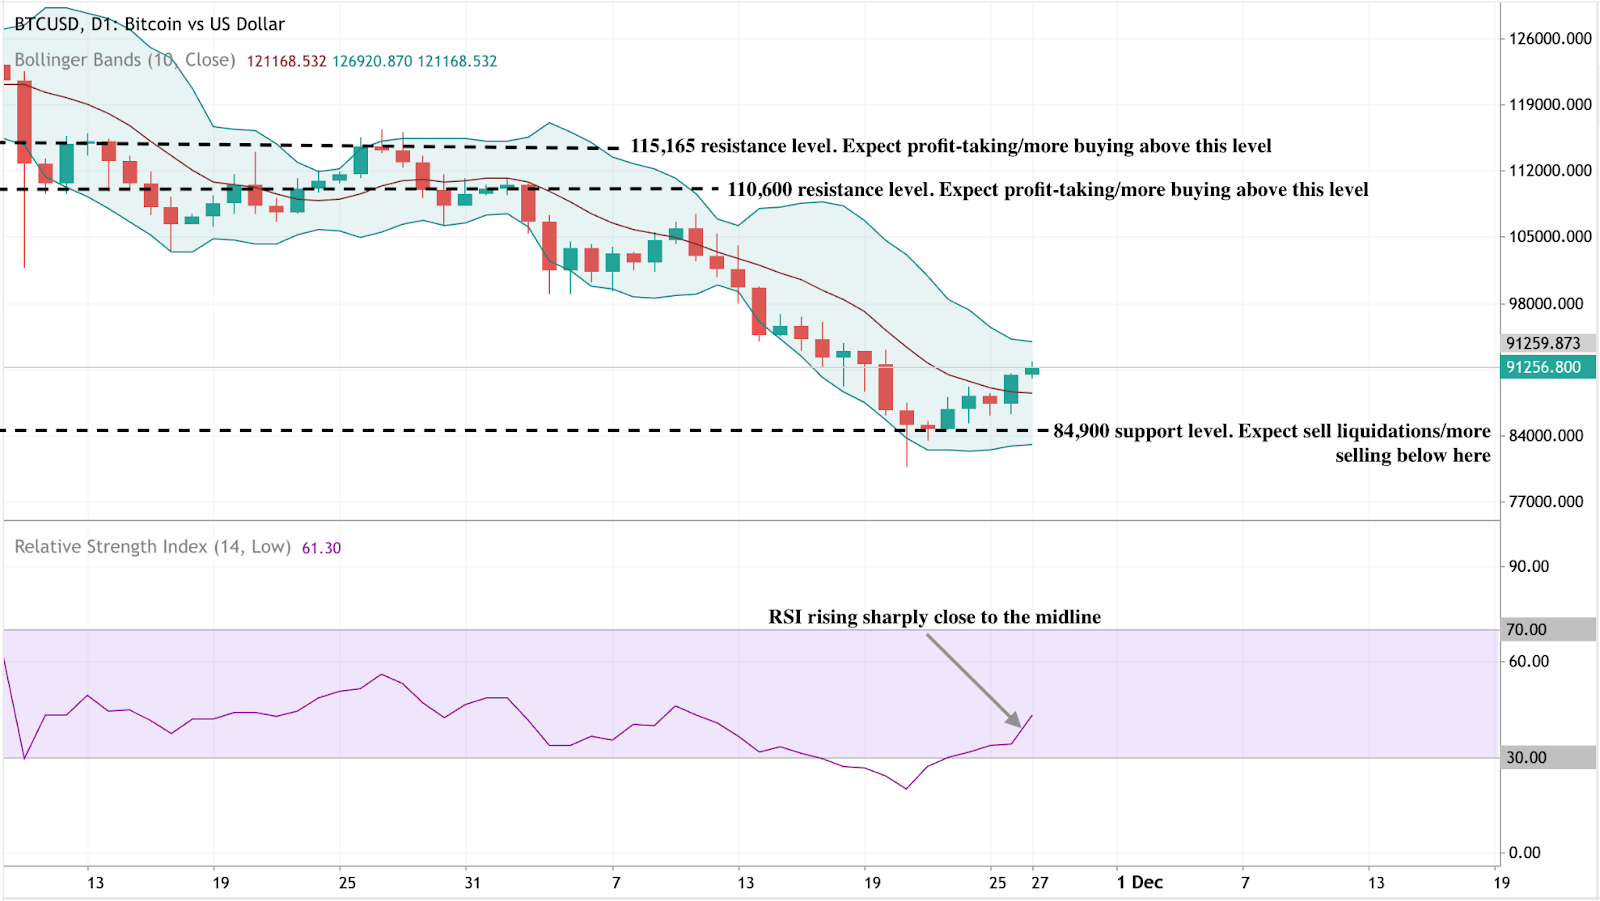
ලියන අවස්ථාව වන විට, Bitcoin (BTC/USD) මෑත කාලීන අවම මට්ටම් වලින් යථා තත්ත්වයට පත්වීමට උත්සාහ කරමින් සිටින අතර, ප්රධාන $84,900 ආධාරක කලාපයෙන් යළි නැගිටීමෙන් පසු $91,200 ට මදක් ඉහළින් වෙළඳාම් කරයි. මෙම මට්ටම රඳවා තබා ගැනීම ඉතා වැදගත් වේ - ඊට පහළින් බිඳවැටීමක් විකිණීම් ද්රවශීලතාවයන් අවුලුවාලිය හැකි අතර පහළට යන ප්රවණතාව නැවත විවෘත කළ හැකිය. ඉහළට යන විට, BTC දැන් වැදගත් ප්රතිරෝධක මට්ටම් දෙකකට මුහුණ දෙයි: $110,600 සහ $115,165, මිලට ඒවා නැවත පරීක්ෂා කිරීමට ප්රමාණවත් ගම්යතාවයක් ගොඩනගා ගත හැකි නම් වෙළඳුන් ලාභ ලබා ගැනීම හෝ අලුත් වූ මිලදී ගැනීමේ උනන්දුව සොයා බැලිය හැකිය.
මිල ක්රියාකාරිත්වය Bollinger Bands තුළ අන්තර්ගතව පවතින අතර, දිගු කාලීන දුර්වලතාවයකින් පසු BTC මැද කලාපය දෙසට තල්ලු වීමට පටන් ගනී. ප්රතිරෝධක කලාපවලට ඉහළින් පිරිසිදු කඩාගෙන යාමක් සිදුවන තෙක් පුළුල් ප්රවණතාව තවමත් ප්රවේශම් සහගත වුවද, මෙය ස්ථාවර වීමේ මුල් සලකුණු යෝජනා කරයි.
RSI 61 පමණ දක්වා තියුනු ලෙස ඉහළ ගොස් ඇති අතර, අධික ලෙස විකිණීමේ තත්වයන් තුළ කාලය ගත කිරීමෙන් පසු නැවත මධ්ය රේඛාව දෙසට නැඟී ඇත. මෙම වෙනස වැඩිදියුණු වන ධනාත්මක ගම්යතාවය ඉස්මතු කරයි, නමුත් අධික ලෙස මිලදී ගත් මට්ටම් කරා ළඟා වීමට පෙර ඕනෑ තරම් ඉඩ ඇති බැවින්, ගැනුම්කරුවන් දිගටම මැදිහත් වුවහොත් ප්රතිසාධනයට ධාවනය වීමට වැඩි ඉඩක් තිබිය හැකි බව යෝජනා කරයි.

BoJ vs Fed: How December decisions could shatter the yen’s fragile range
A potential BoJ rate hike clashing against near-certain Fed easing could finally tip the scales
December 2025 is poised to deliver a high-stakes policy showdown between the Bank of Japan (BoJ) and the US Federal Reserve, with USD/JPY hovering in a precarious 154–158 band, suggesting intervention is likely.
As of 27 November 2025, the pair trades around 155.91, down slightly from recent highs near 157.89 but still vulnerable to a break in either direction. A potential BoJ rate hike clashing against near-certain Fed easing could finally tip the scales - yen bulls are banking on a downside rupture, while bears eye a dollar rebound if either central bank disappoints.
The yen’s tightrope: USD/JPY’s November range
USD/JPY has been confined between the 154.00 support price and 158.00 danger zone price through much of November, a tug-of-war between persistent US yield strength propping up the dollar and mounting speculation on policy divergence.
The upper end-157-158-marks familiar "intervention territory," where Tokyo has deployed verbal and actual yen support in past episodes of rapid depreciation. This range persists amid a backdrop of weak yen-fueled inflation risks in Japan and cooling US data, which is tilting toward Fed cuts.
BoJ: A December hike edges into focus
BoJ rhetoric has sharpened on yen weakness as an inflation accelerant, with import costs now a key concern. A Reuters poll from 11-18 November revealed a slim majority - 53% (43 of 81 economists) - anticipating a 25 basis point hike to 0.75% at the 18-19 December meeting, up from prior surveys. All polled forecasters see at least that level by March 2026.
Easing political friction has helped: Prime Minister Sanae Takaichi’s recent nod to gradual normalisation, following talks with Governor Kazuo Ueda, has reduced near-term hurdles. Ex-BoJ insiders echo this, citing current levels as a catalyst for action sooner than later.
Fed: Overwhelming odds on a December cut
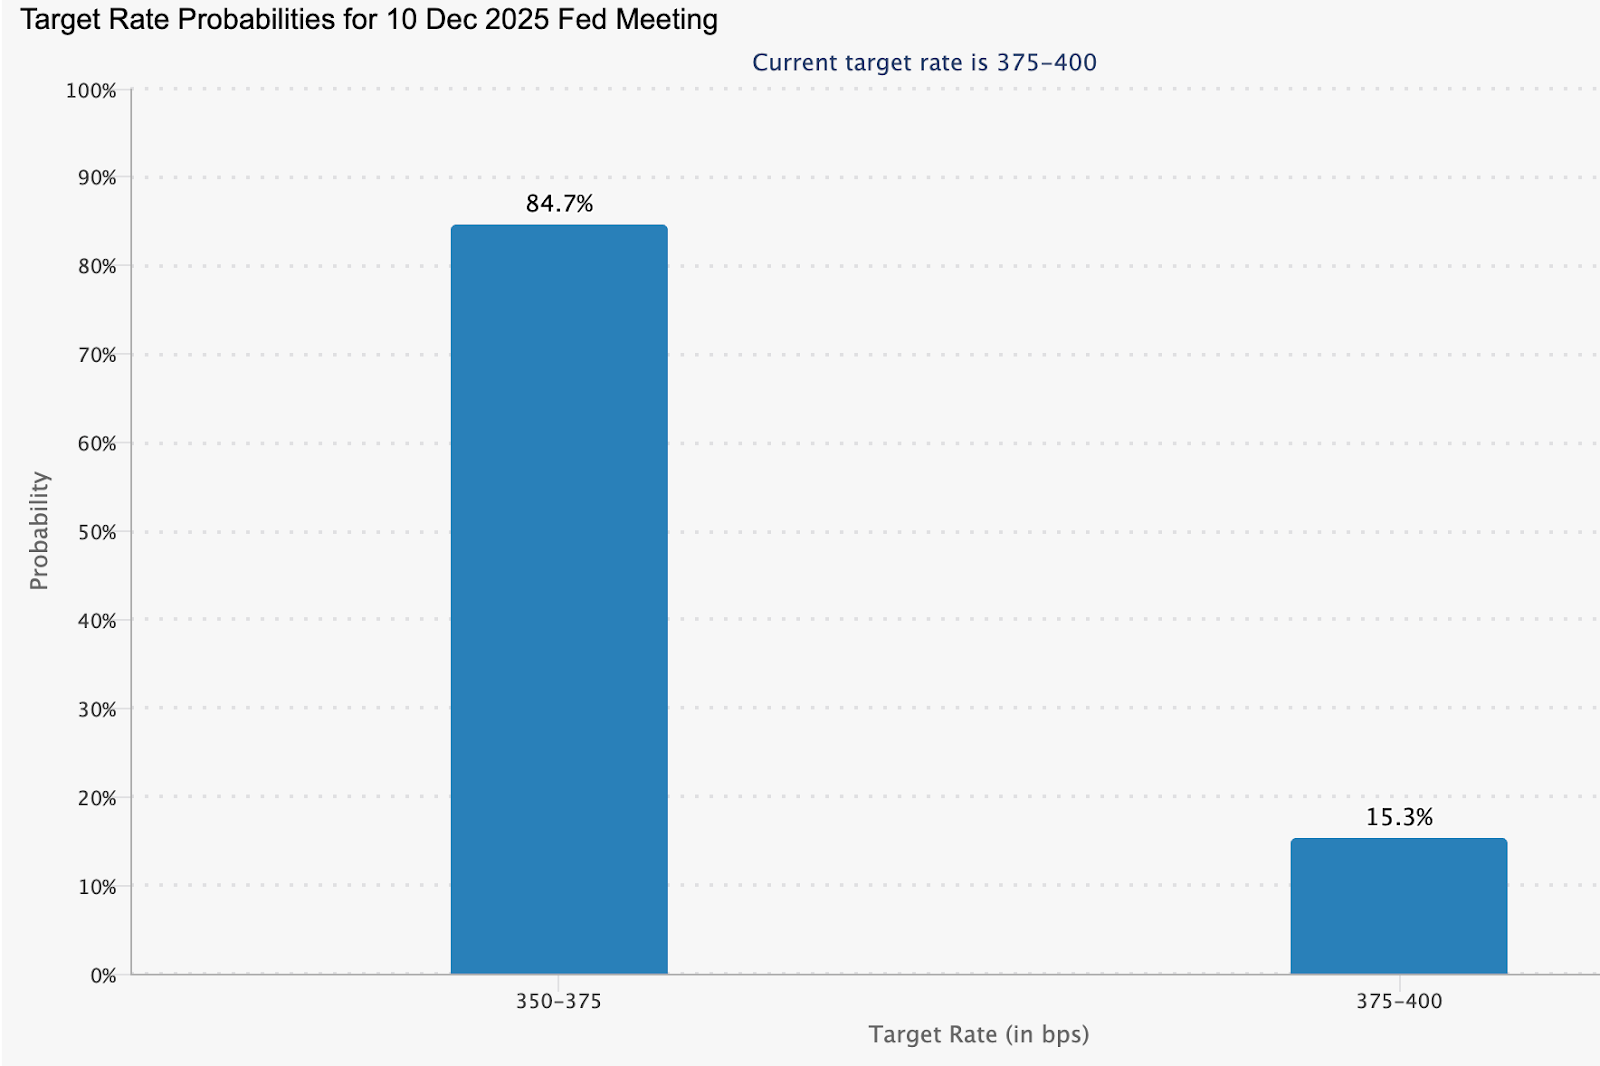
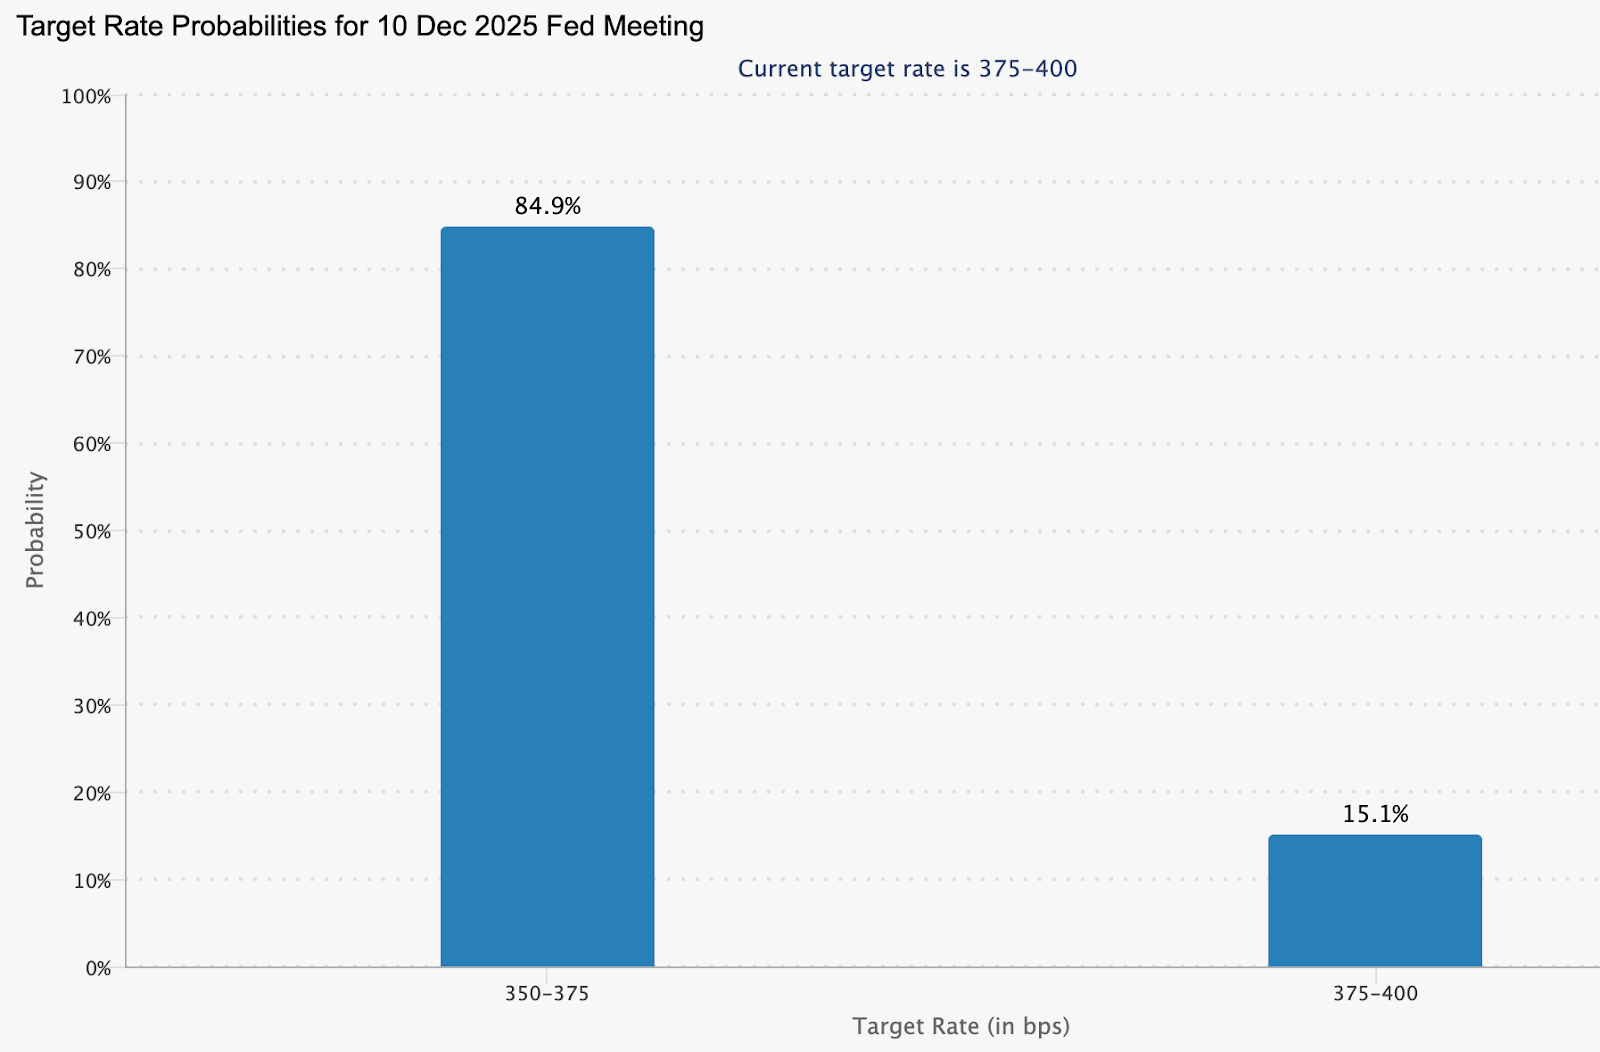
Market pricing leans heavily toward Fed easing, with the CME FedWatch Tool data as of 26 November showing an 84.9% probability of a 25-basis-point reduction at the 10 December FOMC meeting.
This reflects softer US indicators, including recent jobs data that hasn't derailed cut expectations despite some internal Fed debate. Such a move would trim the US–Japan yield gap modestly, offering tailwinds to the yen independent of BoJ moves.
Why it matters
The December decisions will determine whether the yen’s months-long stasis finally resolves into a trend - a critical shift for traders, Japanese policymakers, and multinational firms managing currency exposure. A break from the 154–158 range would influence capital flows, hedging strategies, and carry-trade dynamics at a time when global FX volatility is already rising.
For Japan, the stakes are especially high. A stronger yen would ease imported inflation and energy-cost pressures, while a renewed slide would intensify political scrutiny and prompt the Ministry of Finance to consider direct intervention. For the US, the Fed’s decision will signal how confidently it believes inflation is returning to its target, shaping global risk appetite as the year-end approaches.
Breakout scenarios: Two paths for USD/JPY
These outcomes hinge on post-meeting commentary - hawkish BoJ signals or dovish Fed dots could exaggerate moves.
What to monitor closely
- Event timeline: Fed decision on 10 December; BoJ on 18–19 December.
- Volatility gauges: One- and two-week option-implied vol expected to spike, signaling hedge flows.
- The intervention threshold of 157–160 remains a political flashpoint for Ministry of Finance action.
USDJPY technical insights
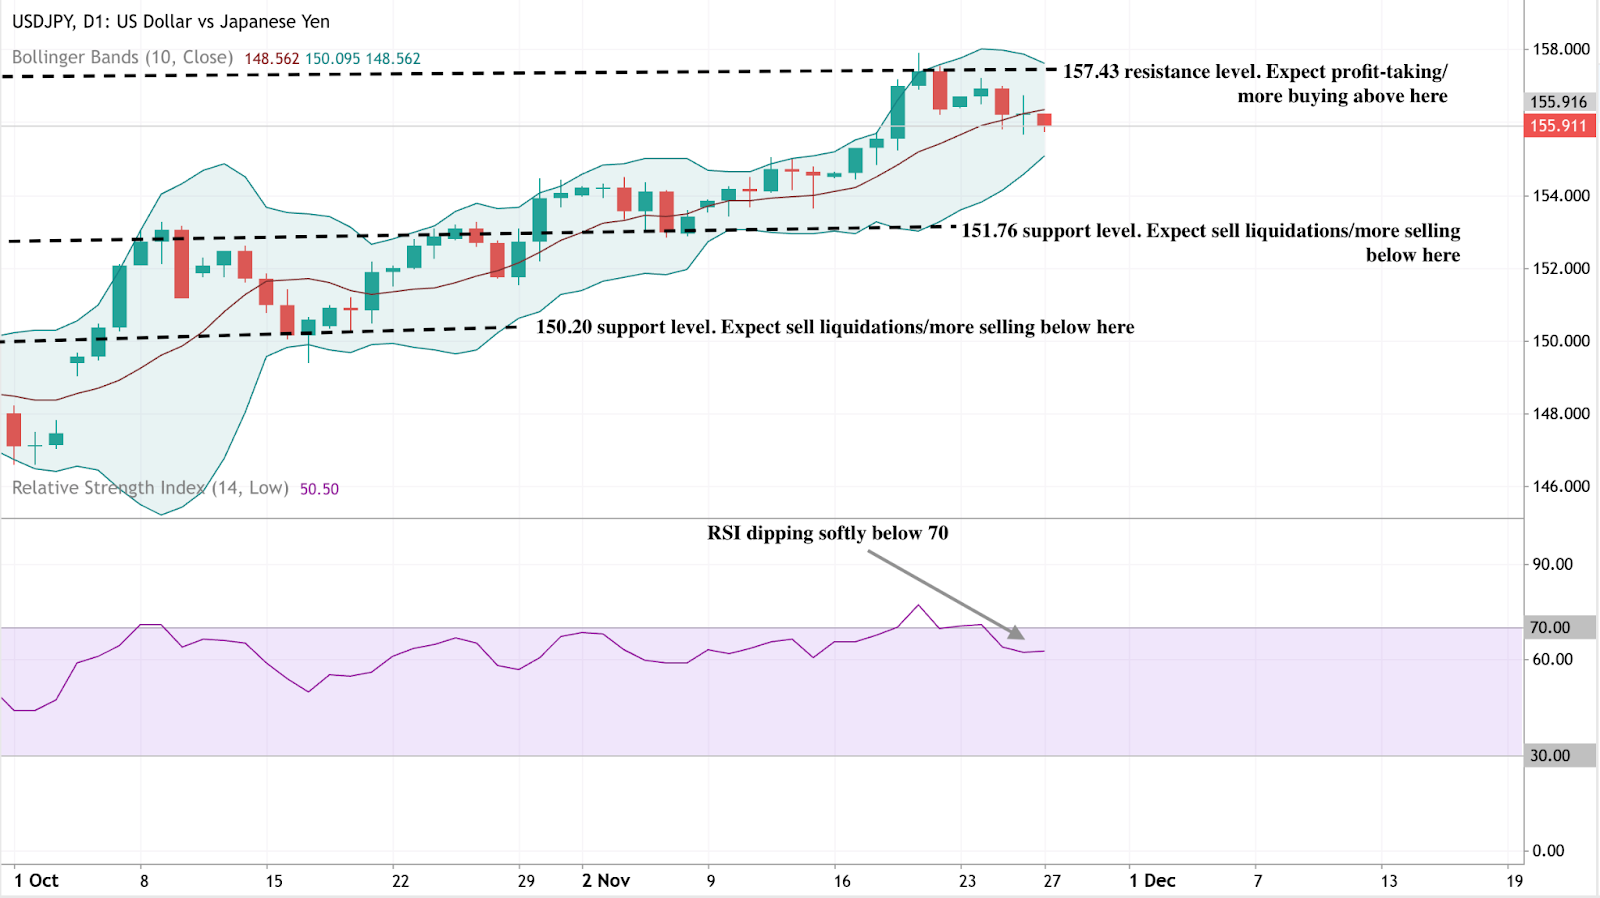
At the start of writing, USD/JPY is trading just below 156, easing slightly after failing to hold levels near the 157.43 resistance zone - an area where traders typically look for profit-taking or fresh upside breakouts. The pair now sits above two key supports at 151.76 and 150.20; slipping below either level could trigger sell liquidations and a deeper corrective move toward the lower Bollinger Band.
Despite the recent pullback, price action remains broadly constructive, with the pair still riding the middle Band and holding below the short-term moving averages.
The RSI, meanwhile, has dipped gently below 70, signalling that bullish momentum is cooling after a stretch of overbought readings. This soft decline hints at consolidation rather than a full reversal, suggesting the pair may trade sideways while the market waits for new catalysts, such as U.S. data or Bank of Japan commentary, to determine its next leg.

Big tech’s 2025 AI capex race: Amazon leads the pack with $125B+ spend
The numbers are staggering. In 2025, Amazon, Microsoft, Alphabet and Meta are collectively guiding to $360–400 billion in capital expenditures.
The numbers are staggering. In 2025, Amazon, Microsoft, Alphabet and Meta are collectively guiding to $360–400 billion in capital expenditures – a ~60% year-over-year increase, with the overwhelming majority directed toward AI-related infrastructure (data centres, custom silicon, GPU/Trainium clusters).
On 24 November 2025, BNP Paribas Exane initiated coverage on Amazon with an Outperform rating and a $320 price target - currently the highest among major brokers and implying ~39% upside from the 26 November close of ~$230.
2025 capex guidance - The big four
Sources: Company filings, earnings calls, BNP Paribas Exane, BBC, Bloomberg, Reuters
Why BNP Paribas exane sees Amazon differently
Analysts at BNP Paribas Exane argue that concerns about Amazon under-investing or being late in AI are “overblown” in light of the company’s disclosed spending and pipeline. Amazon’s finance team has discussed a 2025 capex outlook of roughly $125B, with expectations for a higher figure in 2026, and has indicated that the vast majority is focused on AI-focused infrastructure such as data centres, networking and in-house accelerators for AWS.
The note highlights several points that differentiate Amazon in this capex cycle:
- Vertical integration: By designing its own AI chips such as Trainium and Inferentia, management has indicated potential cost and efficiency benefits relative to relying solely on third-party GPUs, which could help with both pricing and capacity flexibility over time.
- Multiple monetisation channels: The AI infrastructure is positioned to support not only AWS enterprise and government workloads but also improvements in advertising relevance, logistics optimisation, and consumer-facing services, giving Amazon several ways to translate infrastructure into revenue.
- Long-term margin narrative: The firm’s thesis references scenarios where AWS growth re-accelerates into the mid-20% range and advertising grows at 20–25%+ annually, contributing to potential group-level operating margin expansion over a multi-year horizon, though actual outcomes will depend on execution and demand.
Key investor debates & risks
Upcoming catalysts/data points
- AWS re:Invent - early December 2025
Market participants will likely watch for announcements on new AI services, model offerings, and capacity expansions, as well as customer case studies that illustrate production-scale workloads.
- Amazon Q4 2025 results - expected late January / early February 2026
Key metrics to watch include AWS revenue growth rates, segment operating income, and management commentary on AI-driven demand and 2026 capex plans.
- Peer earnings and updated guidance - early 2026
Earnings from Microsoft, Alphabet and Meta in early 2026 are expected to provide fresh details on capex trajectories, AI product adoption, and how each company is balancing investment with free cash flow.
These events may offer more clarity on how quickly AI investments are translating into revenue and whether capex levels remain elevated, moderate, or increase further in 2026.
Amazon technical insights
At the start of writing, Amazon (AMZN) is trading near $229, recovering modestly from recent lows while holding above key supports at $218.45 and $213. A drop below these zones could trigger sell liquidations, while a push higher puts the $250.15 resistance level back in focus - an area where traders may take profits or look for renewed buying.
The RSI remains flat around 50, signalling neutral momentum and suggesting the market is still searching for direction after the recent pullback.


XRP මිල දැක්ම: ETF ගම්යතාව විකිණී යාම් සමඟ ගැටෙන විට මීළඟට කුමක් සිදුවේද?
ETF ගම්යතාවයේ ඉහළ නැගීම, විශාල වශයෙන් සිදුවන විකිණී යාම් රැල්ලක් සමඟ සෘජුවම ගැටීම නිසා XRP හි මිල දැක්ම අසාමාන්ය ලෙස තීරණාත්මක වී ඇත.
ETF (හුවමාරු-වෙළඳාම් අරමුදල්) ගම්යතාවයේ ඉහළ නැගීම, විශාල වශයෙන් සිදුවන විකිණී යාම් රැල්ලක් සමඟ සෘජුවම ගැටීම නිසා XRP හි මිල දැක්ම අසාමාන්ය ලෙස තීරණාත්මක වී ඇත. වෙළඳපොළ විශ්ලේෂක Eric Balchunas ට අනුව, නොවැම්බර් 21 වන දින එක්සත් ජනපදයේ ETF අනුමත කිරීම් කිහිපයක් සිදු වූ අතර, ඉන් සමහරක් පළමු දින වෙළඳ පරිමාවෙන් ඩොලර් මිලියන 50කට වඩා ආකර්ෂණය කර ගත්හ. මෙම තත්ත්වය මත ටෝකනය ඉහළ යා යුතු වුවද, පුළුල් ක්රිප්ටෝ විකිණී යාම් මධ්යයේ XRP හි මිල 2.29 ක ඉහළ අගයක සිට 2.18 දක්වා පහත වැටුණි. මෙම ව්යුහාත්මක ප්රගතිය සහ වෙළඳපොළ පීඩනය අතර ඇති පරස්පර විරෝධීතාව වත්මන් තත්ත්වය නිර්වචනය කරයි.
මෙම ගැටුම ආයෝජකයින්ට තියුණු ප්රශ්නයක් මතු කරයි: නියාමනය කරන ලද ETF ප්රවාහයන්ගේ පැමිණීම දිගුකාලීන නැවත ඇගයීමක පදනම නියෝජනය කරයිද, නැතහොත් අඛණ්ඩව සිදුවන විකිණීම් මගින් වෙළඳපොළ හැඟීම් යටපත් කර ගැඹුරු යළි සැකසීමක් කරා වෙළඳපොළ ඇද දමයිද? XRP දැන් තාක්ෂණික හා මනෝවිද්යාත්මක හැරවුම් ලක්ෂ්යයක පවතින අතර, මෙම ආතතිය විසඳෙන ආකාරය එහි මීළඟ ප්රධාන ගමන් මග තීරණය කරනු ඇත.
XRP හි නවතම වෙනසට හේතුව කුමක්ද?
වාර්තාවලට අනුව, XRP හි මෑත කාලීන මිල ගතිකත්වය එකිනෙකට පරස්පර කතාන්දර දෙකකින් හැඩගැසෙමින් පවතී. එක් අතකින්, 24HrsCrypto සහ Black Swan Capitalist හි නිර්මාතෘ Versan Aljarrah වැනි ඉහළ ඉලක්ක වෙනුවෙන් දිගු කලක් පෙනී සිටි විශ්ලේෂකයින් තර්ක කරන්නේ XRP හි වටිනාකම අවසානයේ දී සිල්ලර වෙළඳාමේ උද්යෝගයට වඩා ගෝලීය පියවීම් ඉල්ලුම සමඟ බැඳී ඇති බවයි.
ඔවුන්ගේ මතය වන්නේ Bitcoin ඉහළ යන්නේ සමපේක්ෂනය මත වන අතර, XRP හි දිගුකාලීන ඉහළ යාම "ප්රයෝජනය, පියවීම් ඉල්ලුම සහ ගෝලීය ද්රවශීලතා අවශ්යතා" මත රඳා පවතින බවයි. මෙම විශ්ලේෂකයින් පවසන්නේ ඉවසිලිවන්තව රැස් කිරීම සහ ආයතනික වශයෙන් පිළිගැනීම XRP හි වටිනාකම නිර්මාණය කිරීමේදී මූලික වන බවයි.
එම තේමාව ප්රධාන නියාමන වර්ධනයක් සමඟ ගැටුණි: එනම්, එක්සත් ජනපදයේ XRP ETF කිහිපයක් විධිමත් ලෙස අනුමත කිරීමයි. Franklin Templeton හි ETF සඳහා NYSE සහතිකය සහ Bitwise, 21Shares සහ වෙනත් අය විසින් නිෂ්පාදන දියත් කිරීම, සම්ප්රදායික ආයෝජකයින් සඳහා පැහැදිලි, නීත්යානුකූල දොරටුවක් නිර්මාණය කළේය.
මුල් ප්රවාහයන් සැබෑ උනන්දුවක් පිළිබිඹු කරයි - Bitwise ආරම්භක දින පරිමාවෙන් ඩොලර් මිලියන 22ක් වාර්තා කළ අතර, Canary Capital හි XRPC නිෂ්පාදනය ඩොලර් මිලියන 58ක් වාර්තා කළේය, එය වසරේ ප්රබලම ආරම්භයක් විය. ක්ෂණික වෙළඳපොළ (spot market) අස්ථාවරව පැවතුනද, මෙම නිෂ්පාදන XRP හි විභව ඉල්ලුම් පදනම පුළුල් කරයි.
මෙය වැදගත් වන්නේ ඇයි?
වෙළඳපොළ විශ්ලේෂකයින් ප්රකාශ කළේ ETF අනුමත කිරීම් XRP හි දිගුකාලීන විශ්වසනීයත්වය සඳහා ව්යුහාත්මක ශක්තියක් ලබා දෙන බවයි. Bitwise සිය ETF ආරම්භය "ඓතිහාසික මොහොතක්" ලෙස විස්තර කළ අතර, ඩිජිටල් වත්කම් පිළිබඳව තවමත් ප්රවේශම් වන මූල්ය උපදේශකයින් සහ විශ්රාම වැටුප් කළමනාකරුවන් සඳහා නියාමනය කරන ලද නිෂ්පාදන වැදගත් වන බව අවධාරණය කළේය. මෙම ආයෝජකයින් බොහෝ විට නියාමන අනුමැතියෙන් මාස කිහිපයකට පසුව තීරණ ගන්නා අතර, එයින් ඇඟවෙන්නේ 2026 දී කළඹ රාමු සකස් වන විට සැලකිය යුතු ප්රවාහයන් ඇති විය හැකි බවයි.
නමුත් කෙටිකාලීන වෙළඳපොළ හැඟීම් වෙනස් කතාවක් කියයි. ETF සන්ධිස්ථානය නොතකා XRP හි මිල ඩොලර් 2 ට වඩා පහත වැටීමෙන් පෙන්නුම් කරන්නේ ක්ෂණික වෙළඳපොළ පරිසරය කෙතරම් බිඳෙනසුලුද යන්නයි. Glassnode දත්ත මගින් පෙන්නුම් කරන්නේ සංසරණ සැපයුමෙන් 41.5%ක් දැනට පාඩු ලබන මට්ටමක පවතින අතර, වෙළෙන්දන් අත්හැර දැමීමත් සමඟ පීඩනයක් ඇති කරන බවයි.

විශාල ආයෝජකයින්ගේ (Whale) ක්රියාකාරකම් මෙම පහත වැටීම තීව්ර කළ අතර, ETF ප්රවෘත්ති වලින් දින දෙකක් ඇතුළත XRP මිලියන 200කට වඩා අලෙවි විය. ව්යුහාත්මක ජයග්රහණ සහ කෙටිකාලීන දුර්වලතා අතර මෙම වෙනස දැන් XRP හි දැක්මෙහි කේන්ද්රීය වී ඇත.
වෙළඳපොළ සහ ආයෝජකයින්ට ඇති බලපෑම
මෑත වාර්තාවලට අනුව, Ripple හි ආයතනික උපායමාර්ගය XRP හි ගමන් මගට තවත් මානයක් එක් කරයි. සමාගම විසින් ඩොලර් බිලියන 1.25 කට Hidden Road අත්පත් කර ගැනීම සහ එය Ripple Prime ලෙස නැවත සන්නාමකරණය කිරීම, ක්රිප්ටෝ-ස්වදේශීය සමාගමක් ගෝලීය, බහු-වත්කම් ප්රධාන තැරැව්කරුවෙකු (prime broker) හිමිකරගත් පළමු අවස්ථාව සනිටුහන් කරයි.
මෙම වේදිකාව වාර්ෂිකව ඩොලර් ට්රිලියන 3ක් නිෂ්කාශනය කරන අතර, අත්පත් කර ගැනීමෙන් පසු සැලකිය යුතු වර්ධනයක් Ripple විධායකයින් වාර්තා කරයි. ආයතනික ගනුදෙනුකරුවන් සඳහා ඇපකරයක් ලෙස XRP සහ RLUSD යෙදවීමට නියමිත අතර, එය වෘත්තීය වෙළඳාම සහ පියවීම් යටිතල පහසුකම් තුළ ටෝකනය ස්ථාපිත කිරීමේ උත්සාහයක් සංඥා කරයි.
නිරීක්ෂකයින් මෙම වෙනස තීරණාත්මක ලෙස සලකන්නේ ප්රධාන තැරැව්කාර සේවාව (prime brokerage) ආයතනික ප්රාග්ධන ප්රවාහයේ ස්නායු කේන්ද්රය ලෙස ක්රියා කරන බැවිනි. ඇපකර සහ පියවීම් නාලිකා තුළට XRP කාවැද්දීම, සිල්ලර වෙළඳාමේ උද්යෝගය මත රඳා නොපවතින ද්රවශීලතා මාර්ග ශක්තිමත් කරයි. Hidden Road හි වේගවත් ව්යාප්තියෙන් ඇඟවෙන්නේ නීත්යානුකූල ඩිජිටල් වත්කම් මෙවලම් සඳහා ඇති ඉල්ලුම අඛණ්ඩව ඉහළ යන බවයි. ආයෝජකයින් සඳහා, මෙය කෙටිකාලීන ප්රස්ථාරය දුර්වල වන විට පවා මූලික යටිතල පහසුකම් වැඩිදියුණු වන අසාමාන්ය තත්ත්වයක් නිර්මාණය කරයි, එය සංක්රාන්ති වෙළඳපොළ අදියරවල සුලභ රටාවකි.
විශේෂඥ දැක්ම
තාක්ෂණික විශ්ලේෂකයින් XRP විස්තර කරන්නේ තීරණාත්මක සීමාවකට ළඟා වෙමින් පවතින බවයි. ඩොලර් 2.195 මට්ටම නැවත ලබා ගැනීම ස්ථාවරත්වයක් සංඥා කරන අතර ඩොලර් 2.6 දක්වා මාර්ගයක් විවෘත කළ හැකිය. එහෙත් ඩොලර් 2 මට්ටම අහිමි වුවහොත් ඩොලර් 1.5 දක්වා පහත වැටීමේ අවදානමක් ඇති අතර, එහිදී දිගුකාලීන ආයෝජකයින් නැවත රැස් කිරීමට උත්සාහ කළ හැකිය. පුළුල් ක්රිප්ටෝ වෙළඳපොළ හැඟීම් ආපසු හැරෙන්නේ නැත්නම්, කලක් ජනප්රිය වූ ඩොලර් 3.6 ඉලක්කය දැන් දුරස්ථ බව පෙනේ.
දිගුකාලීන විවාදය තවමත් දෙකට බෙදී පවතී. ඩොලර් 100 කල්පිතයට සහාය දක්වන්නන් තර්ක කරන්නේ XRP හි අනාගතය සමපේක්ෂන චක්ර මත නොව, ද්රවශීලතා මාර්ග සහ ආයතනික පියවීම් මත රඳා පවතින බවයි. විවේචකයින් පවසන්නේ උපදේශකයින් සහ නියාමනය කරන ලද අරමුදල් සැබවින්ම වෙන් කිරීම් සිදු කරන තෙක් - බොහෝ විට 2026 දී - සැබෑ ප්රවාහයන් මතු නොවිය හැකි බවයි. සාර්ව ආර්ථික බාධක සහ Bitcoin හි දිශාව තීරණාත්මකව පවතී: වෙළඳපොළ පුරා ප්රකෘතිමත් වීමක් ETF ඉල්ලුම ඉහළ නැංවිය හැකි අතර, අඛණ්ඩ දුර්වලතාවය XRP ආධාරක මට්ටම් අසල රඳවා තබා ගත හැකිය.
ප්රධාන කරුණ
බොහෝ දෙනා පවසන පරිදි, XRP හි දැක්ම හැඩගැසෙන්නේ ETF-මූලික ශුභවාදීත්වය සහ විශාල විකිණී යාම් වලින් එන පීඩනය අතර ගැටුමකිනි. විශ්ලේෂකයින් ප්රකාශ කර ඇත්තේ ආයතනික ඒකාබද්ධතාවය හරහා යටින් පවතින පරිසර පද්ධතිය ශක්තිමත් වෙමින් පවතින බවයි; කෙසේ වෙතත්, විශාල ආයෝජකයින් (whales) බෙදා හැරීම සහ සාර්ව ආර්ථික තත්ත්වයන් අවදානම් වත්කම් මත බර තැබීම නිසා මිල තවමත් අවදානම් සහිතව පවතී. මීළඟ ප්රධාන ගමන් මග රඳා පවතින්නේ XRP හට ඩොලර් 2 කලාපය නැවත ලබා ගැනීමට, තිරසාර ETF ප්රවාහයන් ආකර්ෂණය කර ගැනීමට සහ ඕනෑම පුළුල් ක්රිප්ටෝ ප්රකෘතියක් සමඟ ඉහළ යාමට හැකිද යන්න මතය. මෙම බලවේගවල සමතුලිතතාවය 2026 දක්වා ගමන් මග නිර්වචනය කරනු ඇත.
XRP තාක්ෂණික විමසුම්
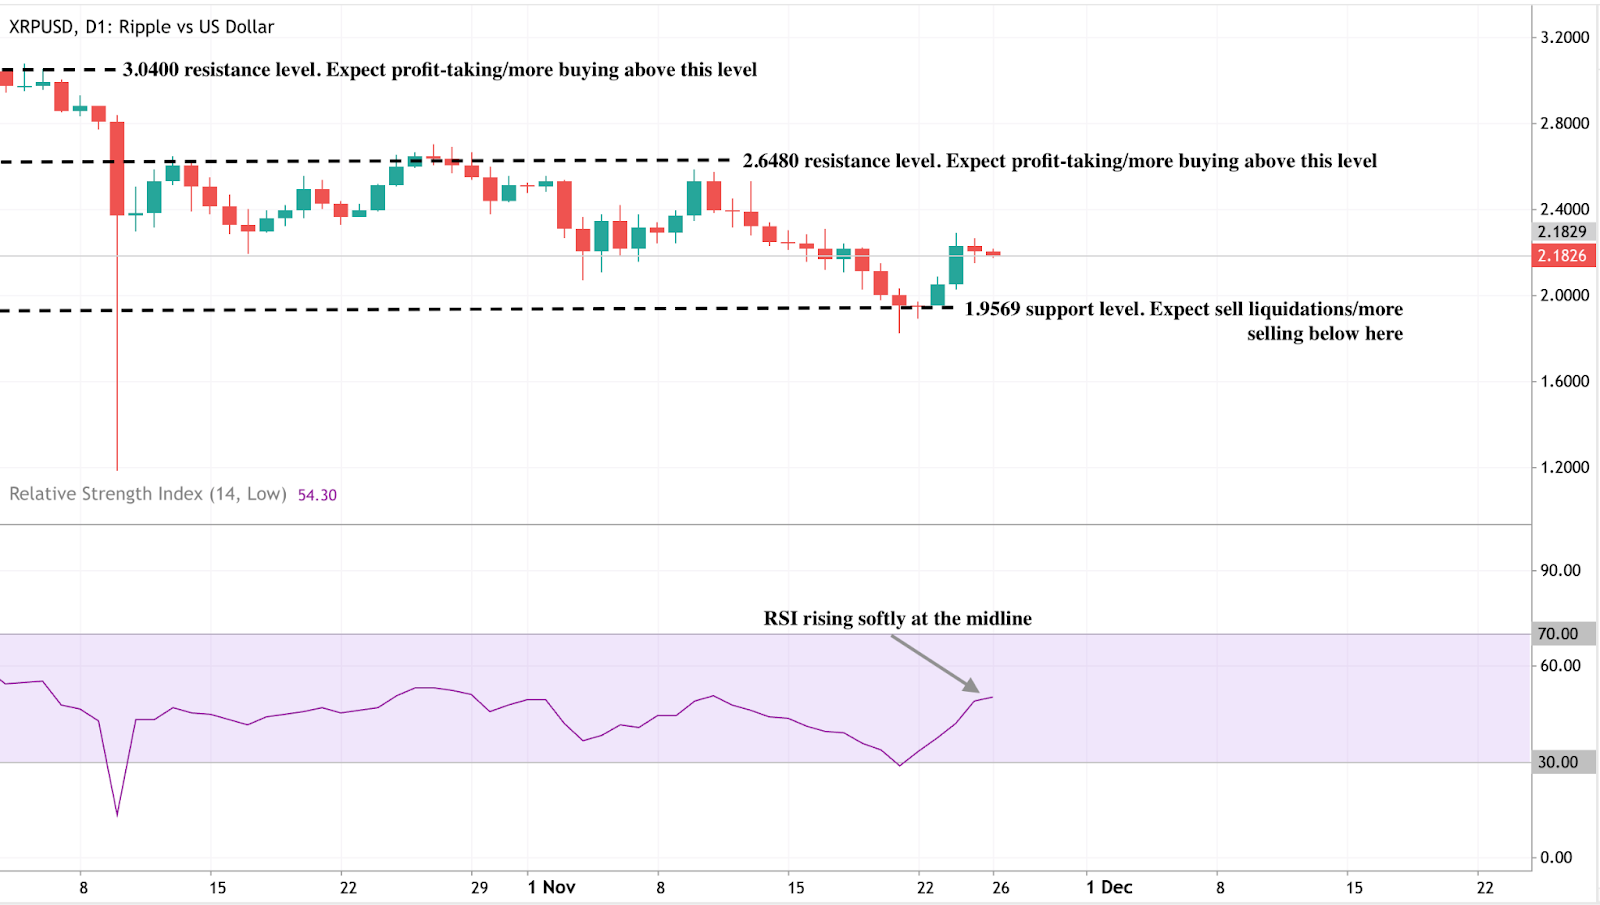
මෙම ලිපිය ලියන අවස්ථාව වන විට, XRP/USD ඩොලර් 2.1800 පමණ මට්ටමේ පවතින අතර, ඩොලර් 2.6480 හි ප්රධාන ප්රතිරෝධය සහ ඩොලර් 1.9569 හි ශක්තිමත් ආධාරකය අතර වෙළඳාම් වේ. ආධාරක මට්ටමට වඩා පහළට කඩා වැටීමක් විකුණුම් ද්රවීකරණයන් ඇති කළ හැකි අතර, ඩොලර් 2.6480 හෝ ඩොලර් 3.0400 ට ඉහළින් සිදුවන චලනයන් ලාභ ලබා ගැනීම හෝ නව මිලදී ගැනීමේ උනන්දුවක් ආකර්ෂණය කර ගත හැකිය.
RSI (සාපේක්ෂ ශක්ති දර්ශකය) දර්ශකය 54 ක පමණ මධ්ය රේඛාවේ සිට සෙමෙන් ඉහළ යමින් පවතින අතර, එය ගම්යතාවයේ මෘදු ප්රකෘතියක් සංඥා කරන නමුත් තවමත් අධි-මිලදී ගැනීමේ තත්ත්වයන් (overbought conditions) පෙන්නුම් නොකරයි.
.png)
Google’s AI comeback: Has the sleeping giant finally awoken?
Google has been criticised for years for lagging behind OpenAI, especially after ChatGPT exploded in late 2022 and reshaped the AI landscape.
Google has been criticised for years for lagging behind OpenAI, especially after ChatGPT exploded in late 2022 and reshaped the AI landscape. Yet the company’s recent streak of breakthroughs has triggered a dramatic reappraisal.
At the centre of this shift is Gemini 3, Google’s newest flagship AI model, which has impressed analysts with its performance in reasoning, coding and specialised tasks that traditionally stump chatbots. As demand grows for both cloud compute and Google’s custom AI chips, investors are beginning to question whether Google’s comeback is already underway - and whether the AI race is entering a new phase.
What’s driving Google’s resurgence
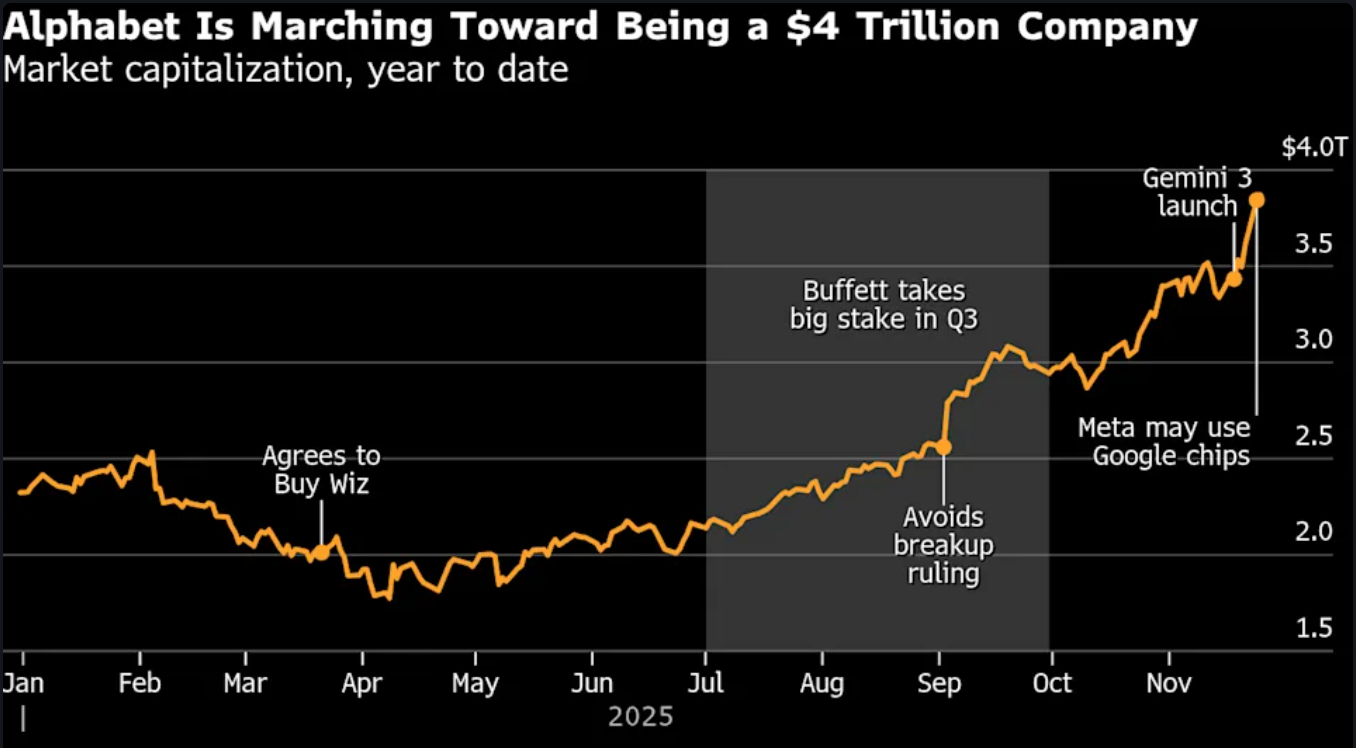
Alphabet has gained substantially since mid-October, sending shares to $323.64 and bringing it within reach of the $4 trillion club.
Google’s return to form is rooted in a combination of technical breakthroughs and strategic repositioning. The launch of Gemini 3 captured global attention after the model surged to the top of AI leaderboards such as LMArena and Humanity’s Last Exam, winning praise from analysts and technologists for its reasoning ability and performance on complex science tasks
Its improved reliability in generating images with accurate embedded text - a challenge that has plagued many chatbots - signals a maturity necessary for enterprise adoption. At the same time, Google has refreshed its AI product suite, including updates to its viral Nano Banana generator, which reinforces momentum across both consumer and developer segments.
The second force propelling Google forward is its deep investment in infrastructure. Once criticised for falling behind Microsoft, OpenAI and Nvidia, the company now benefits from rising demand for Google’s Tensor Processing Units (TPUs) - a specialised chip architecture Google has refined for over a decade.
Reports that Meta is in talks to deploy Google’s chips in its data centres by 2027 triggered a rally in Alphabet stock, demonstrating that Google’s hardware ecosystem may finally offer a meaningful alternative to Nvidia’s dominant GPUs. Partnerships with Anthropic - potentially involving up to 1 million TPUs - further signal a structural shift in AI compute preferences.
Why it matters
Google’s resurgence has implications far beyond its own balance sheet. As Neil Shah of Counterpoint Research put it, “Google has arguably always been the dark horse in this AI race — a sleeping giant now fully awake.” . If Gemini 3 continues to outperform expectations, it may reshape competitive dynamics between the three pillars of modern AI: OpenAI for model innovation, Nvidia for hardware, and Microsoft for cloud and enterprise distribution. A strengthened Google challenges this equilibrium, creating new strategic options for companies seeking alternatives to Nvidia’s high-cost GPUs or Microsoft’s deep integrations with OpenAI.
The return of competitive balance is also important for consumers and regulators. Google escaped the most severe outcome in a US antitrust case partly because AI competition has intensified. If Google proves it can innovate at scale, it may relieve pressure on regulators while accelerating the adoption of AI products beyond search advertising.
Units like Waymo, which is expanding into multiple cities and now supports highway driving, illustrate how Alphabet’s deep research pipeline fuels progress beyond software. The question is whether Google can convert technical superiority into commercial leadership - something it has historically struggled with outside advertising.
Impact on industry, markets and consumers
Google’s ascent poses both opportunity and disruption across the tech landscape. Nvidia, which lost $150 billion in market value on the day Meta’s chip discussions were reported, now contends with the prospect of a viable alternative for certain AI workloads. While Nvidia insists its GPUs remain the industry’s Swiss Army knife - flexible, widely supported, and essential for model training - TPUs give Google a niche advantage. As ASIC-based designs gain traction, analysts expect custom silicon to grow faster than the GPU market over the next several years.
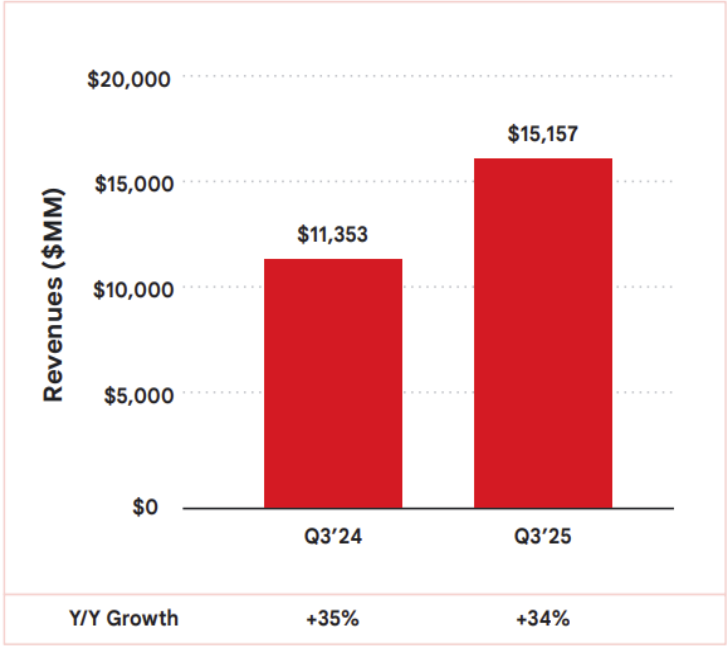
This shift has a significant impact on the broader cloud industry. Google Cloud, which generated $15.2 billion in third-quarter revenue - up 34% year-on-year - remains behind AWS and Microsoft Azure, but the demand for generative-AI compute is narrowing the gap.
Companies attracted by TPUs' cost efficiency may choose Google Cloud for specialised workloads, while still relying on Nvidia GPUs for general tasks. For consumers, the competition translates into better AI experiences: models with stronger reasoning, fewer errors, and safer behaviour.
Across financial markets, Alphabet’s rally affects index weightings and rotation patterns. As traders reassess Google’s valuation, volatility in Nvidia, AMD, Microsoft and Meta increases - creating opportunities for directional and event-driven strategies on platforms like Deriv MT5, where both tech stocks and index CFDs see heightened activity during AI-driven shifts. Tools such as the Deriv Trading Calculator help quantify margin impact and manage exposure as market reactions intensify.
Expert outlook
Forecasts for Google’s next phase remain divided. Some analysts argue that Google’s resurgence marks a long-awaited payoff from its “full-stack” strategy - controlling data, models, chips, cloud and applications. CEO Sundar Pichai emphasised during the last earnings call that this unified approach “really plays out” when scaling frontier models that integrate reasoning, multimodal capabilities and advanced coding. If Google continues to refine its ecosystem, it could rival or surpass OpenAI in enterprise adoption while weakening Nvidia’s dominance in hardware.
Yet uncertainties persist. Data revealed consumer adoption of Gemini still lags behind that of ChatGPT, with 650 million users compared to ChatGPT's 800 million weekly users, and monthly downloads of 73 million, which trail ChatGPT’s 93 million. Google Cloud, although accelerating, is still half the size of AWS and Azure.
It was noted that if Google cannot convert its technological strength into sustained commercial traction, the gap could widen again. Much will depend on whether Meta and other AI-intensive companies formalise their TPU commitments and whether Gemini 3 continues outperforming rivals in real-world deployments. The next six to nine months will be decisive, according to analysts.
Key takeaway
For market watchers, Google’s rapid AI resurgence suggests the company has moved far beyond its defensive posture of recent years. Gemini 3’s strong performance, rising TPU adoption and fresh cloud momentum have revived Alphabet’s standing in the global AI race. Yet the outcome is far from settled.
The next phase hinges on whether Google can scale its breakthroughs commercially while sustaining hardware and model performance. Traders and analysts await confirmation from enterprise adoption, chip-supply agreements and quarterly cloud-revenue growth - the indicators that will decide whether this comeback becomes a lasting transformation.
Alphabet technical insights
At the start of writing, Alphabet (GOOG) has broken into a price discovery zone above $323, signalling strong bullish momentum after an extended run along the upper Bollinger Band. Key supports sit at $268.75 and $240, where a drop below either level could trigger sell liquidations or deeper pullbacks.
The RSI, now around 74, is approaching overbought territory, highlighting stretched conditions that may lead to short-term cooling or consolidation, even as the broader trend remains firmly upward.


Gold’s November surge: From $4,000 barrier to all-time highs. What’s really happening?
Imagine waking up to headlines screaming 'Gold Smashes Past $4,300,' and no, it’s not a dream; it has been the reality of October 2025.
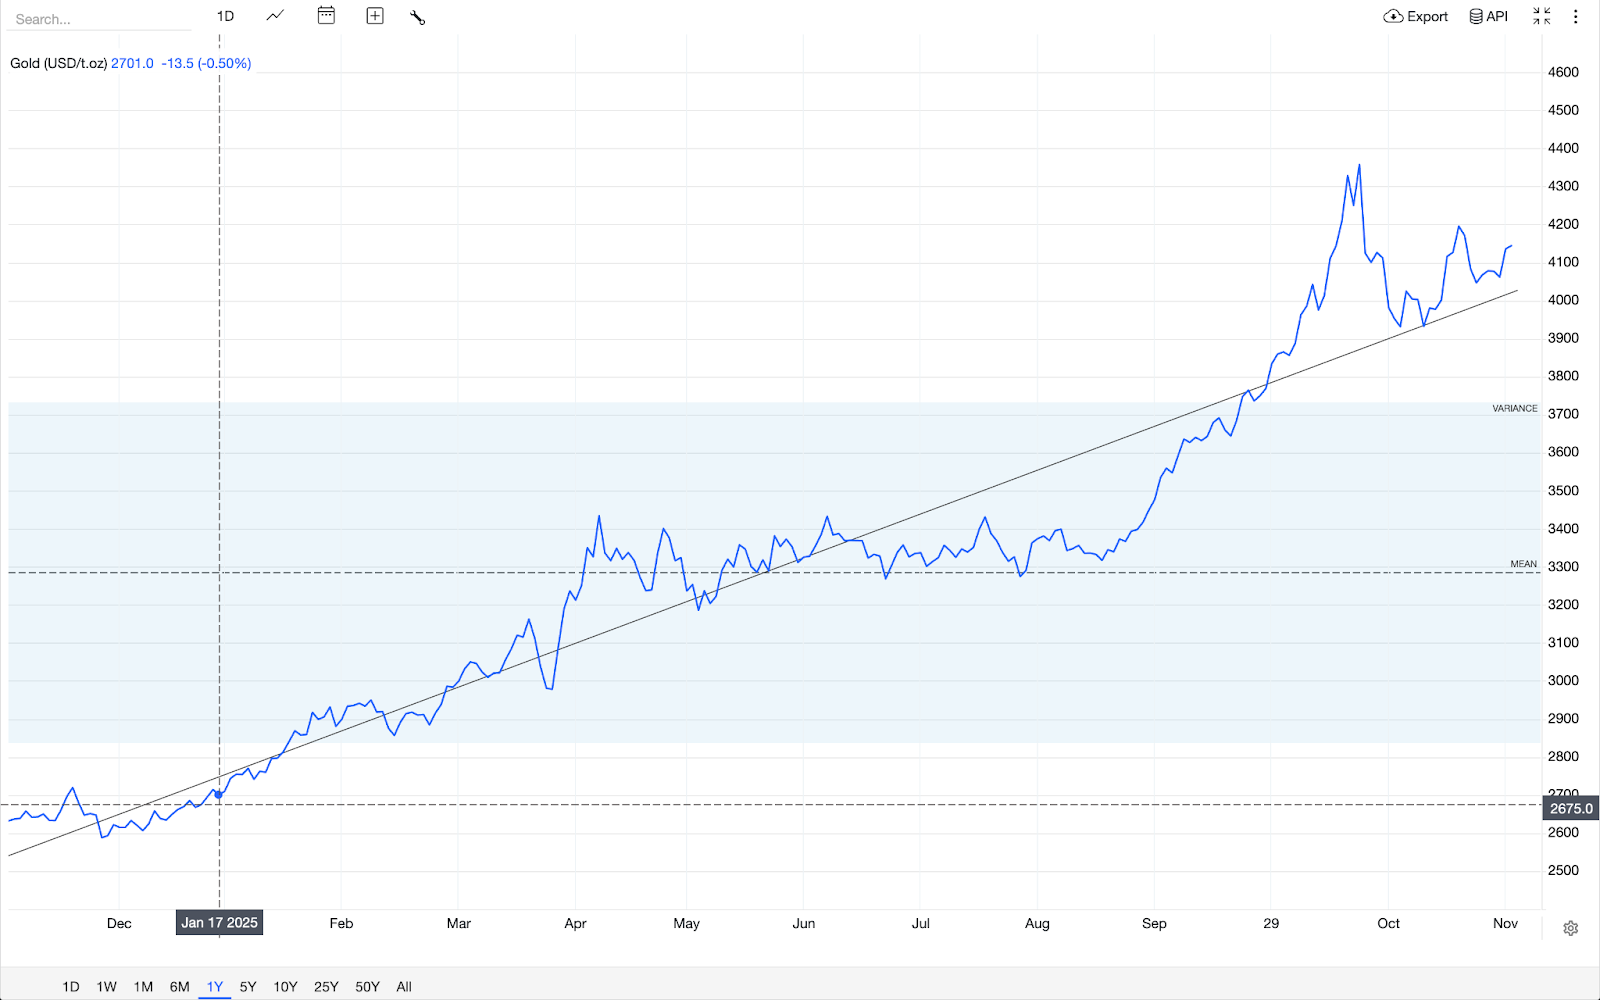
Imagine waking up to headlines screaming 'Gold Smashes Past $4,300,' and no, it’s not a dream; it has been the reality of October 2025. Now, November’s keeping the momentum alive with prices hovering near $4,132 as of 25 November 2025. If you’re wondering whether this shiny metal remains a smart addition to your financial mix, stick around. We’re breaking down the fresh data, historical peaks, and practical takeaways without the hype.
Why is gold climbing so sharply in late 2025?
The gold spot price breached $4,100 per ounce on November 24, a 1.65% increase from the prior day, driven by investor bets on U.S. Federal Reserve rate cuts amid cooling inflation signals. This isn't random volatility; it's a response to broader economic jitters. Geopolitical tensions, like ongoing Russia-Ukraine talks, add a layer of safe-haven demand, pushing prices up even as crude oil dips on "peace" rumours.
Breaking it down: Central banks worldwide are projected to acquire over 900 tons of gold in 2025, according to reports, surpassing demand for jewellery and technology. This institutional buying creates a floor under prices - think of it as a global vote of confidence in gold as a hedge against currency wobbles.
For everyday folks, it means reviewing your asset allocation might reveal whether gold’s 58% year-to-date gain (from -$2,600 in January) aligns better with your risk tolerance now than it did during last year’s flatline.
How close is gold to its historic peaks, and what do the charts say?
Gold’s all-time high? $4,379.13 on October 17, 2025, eclipsing the inflation-adjusted 1980 record of about $3,400 (when an ounce topped $850 nominally). Fast-forward to November: Spot prices traded between $4,046 and $4,145 on 24 November, coiling in a bull pennant pattern on daily charts - a setup that hints at continuation if it breaks upward, based on Kitco’s intra-day analysis.
Visualise this: On a 5-minute Comex futures chart, gold is hugging the 50-period moving average as support around $4,010, with resistance at $4,108. Zoom out to weekly: It’s testing the upper Bollinger Band after a 3.7% monthly rise.

Historically, such consolidations after highs (like the post-2020s $2,070 peak) often precede 10-15% corrections or fresh legs up - a reminder to track these levels when assessing gold’s role in long-term savings, such as in a retirement portfolio.
Expert take: "Gold’s resilience stems from its inverse correlation to real yields,” notes FX Empire analyst Yoav Niv, who points to the metal’s consolidation amid delayed U.S. data releases. Actionable angle? If inflation reports this week nudge yields lower, gold could revisit its October high - use that as a cue to compare gold’s performance against your bond or cash holdings.
Gold’s role in everyday portfolios
Hypothetically, let’s consider a mid-40s couple in Chicago, facing 7% inflation that ate into their savings in 2024. So, they shifted 5% of their nest egg to a gold ETF in early 2025; by November, that slice would have grown 58%, offsetting spikes in grocery and housing costs. Nothing magical here, but gold acting as a diversifier when stocks wobble.
Or take an example of a small business like a jeweller who rode out November’s uptick by locking in supplier rates at $4,000, buffering against dollar strength that hammered imports. The insight? Gold isn’t just for vaults; it’s a tool for smoothing cash flow volatility.
Scan your expenses - if currency fluctuations hit suppliers or travel, a modest gold exposure (via accessible ETFs) could stabilise planning without overcomplicating things.
November’s gold action underscores its enduring appeal: a buffer against the unpredictable. Whether eyeing historic charts or current consolidations, the key is integration - weave it into your financial story thoughtfully.
Gold technical insights
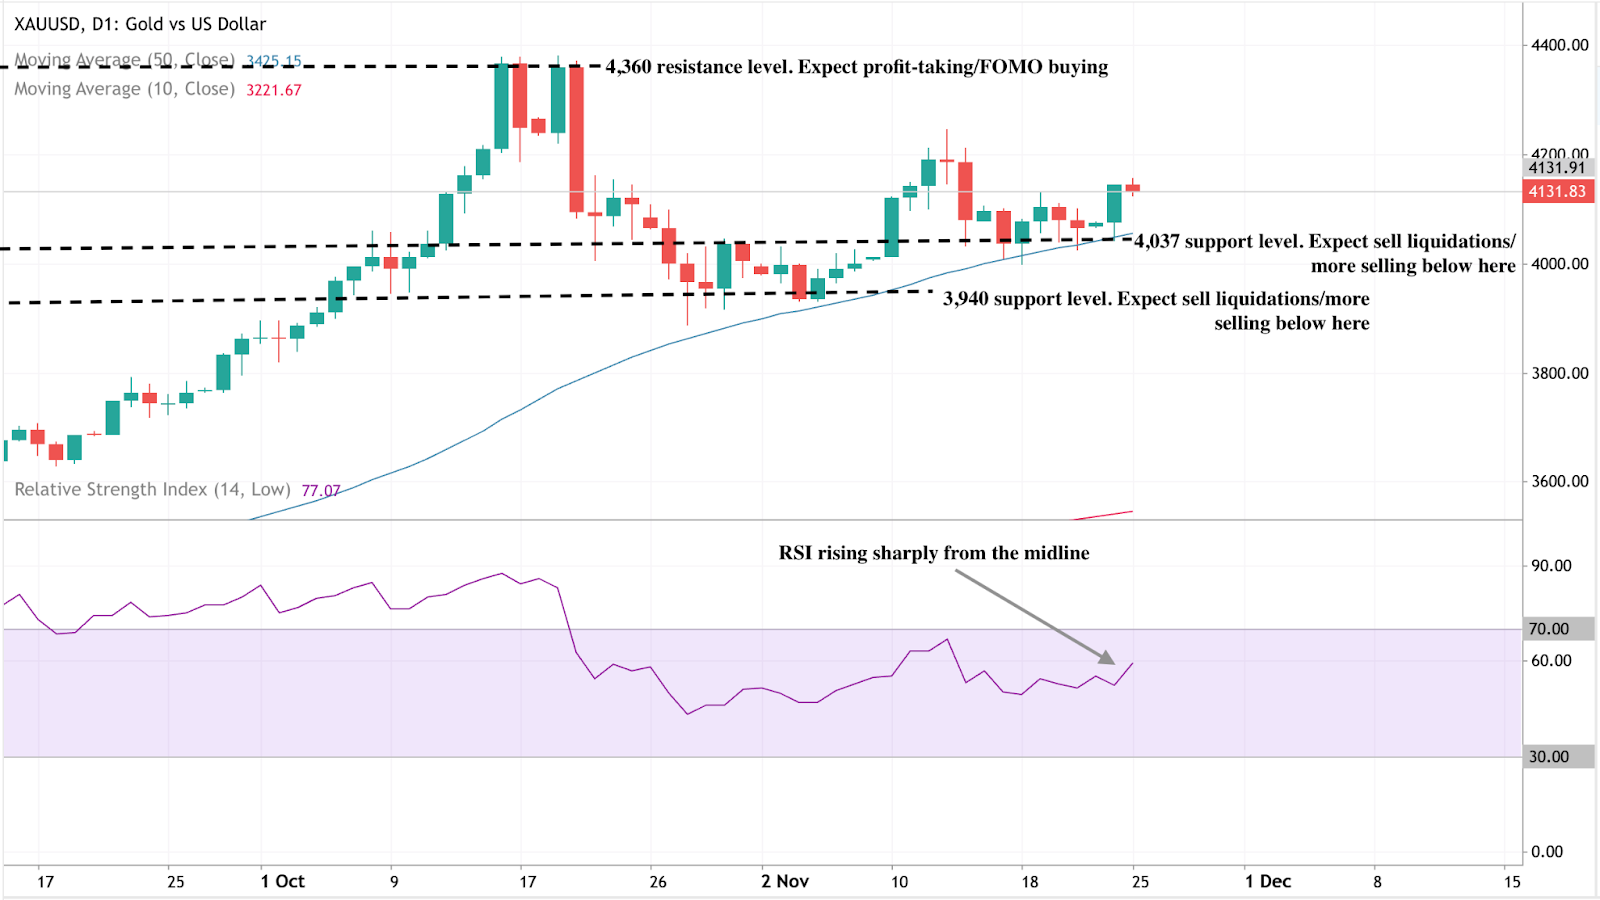
At the start of writing, Gold (XAU/USD) is trading near $4,132, maintaining bullish momentum above key supports at $4,037 and $3,940. A sustained move above these levels suggests buyers remain in control, though a drop below either could trigger sell liquidations.
The $4,360 level stands out as a major resistance, where traders may take profits or new buyers could enter on FOMO sentiment. Meanwhile, the RSI has surged to around 77, rising sharply from the midline - a signal of strengthening momentum but also a potential sign of overbought conditions that could invite short-term pullbacks.

The tech stock rally: Is this the start of a new cycle?
This week’s sharp rebound in tech stocks poses a compelling question: Is this more than just a bounce?
This week’s sharp rebound in tech stocks poses a compelling question: Is this more than just a bounce? With the Nasdaq Composite jumping 2.7% and the S&P 500 up roughly 1.5% as investors embraced both AI momentum and hopes for a December rate cut, the tone has shifted, according to reports.
The deeper issue, however, is whether this marks the beginning of a new tech cycle, underpinned by accelerating AI deployment and cheaper capital, or simply a rally within an existing one. The following insights examine what drives the move, its significance, its impact on markets, and what comes next.
What’s driving the tech stock rally
Market watchers say that at the heart of the current advance lie two forces: renewed confidence in AI-led innovation and fresh traction in monetary policy expectations. On the policy side, signals from the Federal Reserve, including Governor Christopher Waller and President John Williams of the New York Fed, have bolstered expectations for a December rate cut, helping to lift growth-stock valuations.
The reduction in discount rates on long-term earnings tends to favour tech firms, which rely on high forward-rate growth. Parallel to that, the AI story remains central. Firms such as Alphabet Inc. surged after enthusiasm for its Gemini model, while the “Magnificent Seven” pulled the broader tech cohort higher.
The market appears to be reconciling the earlier pullback (driven by bubble fears) and repositioning into stocks that benefit from the AI infrastructure build-out, including chips, cloud, and software. The question now is whether this is the launch of a new growth wave or simply the next leg of the existing one.
Why it matters
If tech is entering a new cycle, the implications extend far beyond a handful of large-cap stocks. These companies increasingly lag behind not only in market weight but also in shaping index trajectory, sector rotation, and investor psychology. As one analyst observed: “Scepticism around AI cap-ex might be a contrarian positive” for the trade in the long term.
For institutional and retail investors alike, the timing could matter: a true cycle shift may favour growth and innovation over value, alter asset-allocation flows, and provide a greater runway for risk assets. Conversely, if this is not a new cycle, then mispricing valuations could lead to sharp reversals. For corporates - from chip fabricators to SaaS startups - the cost of capital, demand for AI services, and global semiconductor supply chains all hinge on how the cycle evolves.
Impact on the market and industry
A credible new tech cycle would signal substantial real-world change: surging investment in data-centres, exponential scaling of AI models, and ecosystem shifts toward cloud-native, AI-first companies. We’re seeing some of that. Analysts estimate that AI could add $5-19 trillion in incremental revenue to US companies, although many warn that much of this may already be priced in.
In market terms, a cycle change could reinvigorate under-weight tech portfolios, trigger rotation out of value/cyclicals and reshape the “growth vs. value” trade. For the industry, this means that winners will likely emerge among firms that scale AI profitably, while laggards will face margin pressure, heavier capital expenditure burdens, and competitive erosion. The stakes are high: the surge could be transformative - but the infrastructure and competitive demands are intense.
For the market, that means volatility is likely to stay elevated. Traders balancing positions on platforms like Deriv MT5 can use advanced order types, leverage settings and stop-loss controls to navigate sharp swings. Understanding margin impact and exposure - via the Deriv Trading Calculator - is increasingly essential as the cycle matures.
Expert outlook
Looking ahead, professional traders note that key signals to monitor include inflation trajectories, clarity on Fed policy, earnings from major tech companies, and progress on supply-chain goals in the AI build-out. Markets currently price in a high probability of a December rate cut, but if inflation proves persistent or earnings disappoint, momentum could stall.
Some strategists caution that we may simply be in yet another leg of the initial tech-cycle rather than in the dawn of a fresh era. For instance, Goldman Sachs analysts suggest much of the potential upside from AI is already embedded in current valuations.
This means that while the upside exists, the risk-reward becomes less attractive. The best scenario: a renewed tech cycle with broad-based participation. The risk: concentrated gains, fading momentum and underlying disillusionment. Either way, the next few months will be critical.
Key takeaway
The surge in tech stocks carries more than a feel-good bounce - it could mark the opening stages of a new cycle where AI deployment and supportive policy drive sustained growth. However, the caveats remain substantial: valuations are stretched, execution risk is real, and macroeconomic headwinds loom. Investors should watch upcoming inflation data, Fed commentary and earnings from tech heavyweights as signals to validate the shift. The moment is promising, but not yet definitive.
Alphabet technical insights
At the start of writing, Alphabet’s stock (GOOG) has entered a price discovery zone above $318, signalling strong bullish momentum. The $280 and $238 levels act as key supports - a break below these zones could trigger sell liquidations or deeper corrections.
Meanwhile, the RSI has climbed to around 74.5, pushing into overbought territory, suggesting that the stock may face short-term profit-taking or consolidation before attempting further upside.


USD/JPY අනතුරු කලාපයේ සැරිසරයි: ජපානයට 160 දක්වා ඉහළ යාම නතර කළ හැකිද?
USD/JPY වෙළඳුන් දැන් “අනතුරු කලාපය” ලෙස හඳුන්වන දේ තුළ සැරිසරමින් පවතී - කලින් ජපානයේ අත බලෙන් ඇති 155—160 පරාසය.
USD/JPY වෙළඳුන් දැන් “අනතුරු කලාපය” ලෙස හඳුන්වන දේ තුළ සැරිසරමින් පවතී - කලින් ජපානයේ අත බලෙන් ඇති 155—160 පරාසය. විශ්ලේෂකයන්ට අනුව මෙම යුගලය කඩ කළහොත්, යෙන් ආරක්ෂා කිරීම සඳහා නැවත වරක් මැදිහත් වීමට ටෝකියෝවට බල කළ හැකි මට්ටම් පරීක්ෂා කරයි. වෙළඳපල සඳහා, මෙය මානසික සීමාවක් පමණක් නොවේ; එය ඉතිහාසය විසින් අඳින ලද රේඛාවකි. 160 ට සමීප වන සෑම පියවරක්ම අතීත මැදිහත්වීම් පිළිබඳ මතකයන් පුනර්ජීවනය කරයි සහ ජපානය ඇතුල් වීමට පෙර සිය මුදල් දුර්වල වීමට කොතරම් දුරට ඉඩ දෙනු ඇත්ද යන්න පිළිබඳ සම
ආතතියේ හදවත ජපානයේ රාජ්ය මූල්ය ව්යාප්තිය සහ එහි ප්රවේසම් මූල්ය ස්ථාවරය අතර වර්ධනය වන විභේදයක් බව වාර්තා සඳහන් කරයි. එක්සත් ජනපදය ඉහළ පොලී අනුපාත පවත්වා ගෙන යනවා සේම අගමැති සනේ ටකායිචිගේ ¥21.3 ට්රිලියන (£112 බිලියන) උත්තේජක සැලැස්ම ඵලදාව ඉහළ තල්ලු කර යෙන් තවදුරටත් දුර්වල කර ඇත.
දැන් ප්රශ්නය වන්නේ 160 හරහා බිඳ වැටීමට පෙර ජපානයට USD/JPY නැගීම නැවැත්වීමට නියමිත වේලාවට ක්රියා කළ හැකිද නැතහොත් කැමතිද යන්න සහ ගෝලීය වේදිකාවේ ටෝකියෝගේ විසඳුම පරීක්ෂා කිරීමයි.
USD/JPY ධාවනය කරන්නේ කුමක්ද?
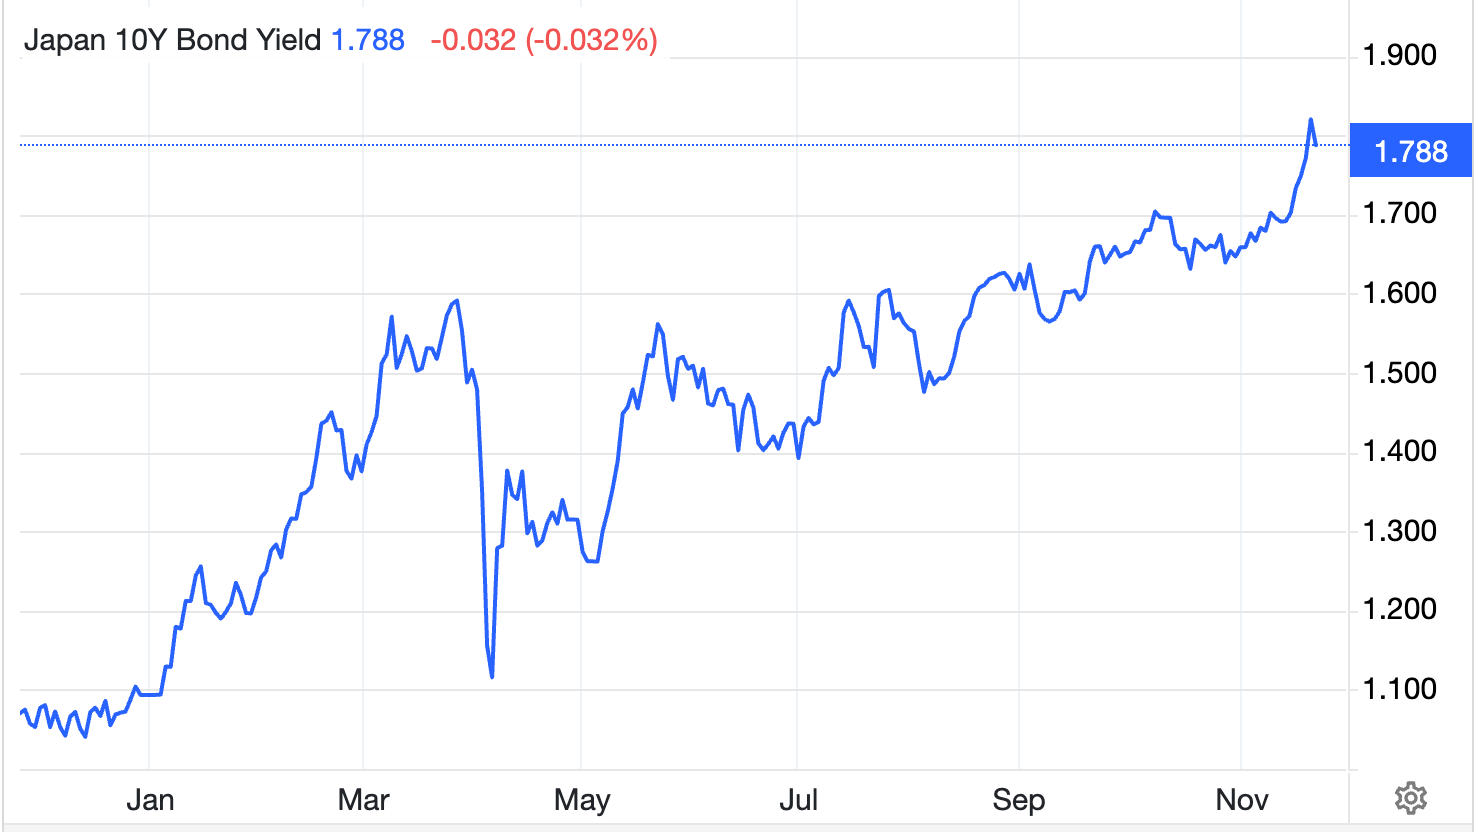
යෙන් හි නවතම පහත වැටීම මුල්බැස ඇත්තේ එක්සත් ජනපදය සමඟ ජපානයේ පුළුල් වන ප්රතිපත්ති පරතරය තුළය. වසංගතයෙන් පසුව විශාලතම වන ටකායිචිගේ උත්තේජකයට බලශක්ති සහන, බදු විරාම සහ මුදල් අත්හැරීම් සඳහා වියදම් කිරීම ඇතුළත් වේ. ජීවන වියදම් පීඩන ලිහිල් කිරීම එහි අරමුණයි, නමුත් ආයෝජකයින් එය උද්ධමන හා මූල්ය වශයෙන් නොසැලකිලිමත් ලෙස සලකයි. ණය කනස්සල්ල ගැඹුරු වන අතර දිගුකාලීන රාජ්ය මූල්ය විනය පිළිබඳ විශ්වාසය අඩුවීමත් සමඟ ජපාන රජයේ බැඳුම්කර (ජේජීබී) ඵලදාව 2008 සිට ඉහළම මට්ටමකට ඉහළ ගොස් ඇති බව බ්ලූම්බර්ග් වාර්තා කරයි
ජපාන බැංකුවේ ප්රවේශම් සහගත ස්ථාවරය පීඩනය වැඩි කර ගැනීම පමණි. උද්ධමනය සියයට 2 ඉලක්කයට වඩා ඉහළින් පැවතියද ඕනෑම ප්රධාන ප්රතිපත්ති මාරුවකට පෙර වැටුප් වර්ධනය ස්ථාවර විය යුතු බව ආණ්ඩුකාර කසුඕ උෙඩා දිගින් දිගටම තර්ක කරයි.

ඊට වෙනස්ව, ෆෙඩරල් සංචිතය එක්සත් ජනපද පොලී අනුපාත ඉහළ මට්ටමක තබා ඇති අතර ඉක්මනින් කපා හැරීමට මැලිකමක් පවතී. එම අස්වැන්න අවකලනය මගින් ඩොලර් රඳවා තබා ගැනීම වඩාත් ඵලදායී වේ, යෙන් පිටතට ගලා යන ප්රාග්ධනය යැවීම සහ USD/JPY බහු අවුරුදු උපරිම අගයන් ආසන්නයේ තබා ගැනීම.
එය වැදගත් වන්නේ ඇයි
වෙලඳපල නරඹන්නන් පවසන්නේ යෙන් හි දුර්වලතාවය දෙපැත්තෙන් කපා හරින බවයි. මෘදු මුදලක් ටොයෝටා සහ සෝනි වැනි අපනයනකරුවන්ට ප්රතිලාභ ලැබෙන අතර ඒවායේ විදේශීය ඉපැයීම් ඉහළ ලාභ බවට පරිවර්තනය වේ. එහෙත් ආනයනකරුවන්ට සහ කුටුම්භවලට වේදනාව ක්ෂණිකයි. ජපානය ආනයනික ඉන්ධන සහ ආහාර මත දැඩි ලෙස රඳා පවතී, එයින් අදහස් කරන්නේ USD/JPY හි ඉහළ එක් ටික් එදිනෙදා ජීවිතය වඩා මිල අධික කරයි. “සැබෑ ඵලදායී ලෙස ජපානයේ යෙන් තුර්කි ලීරා තරම් දුර්වල ය” යැයි බෲකින්ග්ස් ආයතනයේ රොබින් බෲක්ස් අනතුරු ඇඟවූ අතර රජයේ මූල්ය ස්ථාවරය “ණය මත ප්රතික්ෂේප කිරීම” ලෙස විස්තර කළේය.
ජපානයේ දේශසීමාවලින් ඔබ්බට, යෙන් අවදානම් මනෝභාවයේ ගෝලීය බැරොමීටරයක් ලෙස සේවය කරයි. එය තියුනු ලෙස දුර්වල වූ විට, එය ඩොලරය කෙරෙහි වර්ධනය වන විශ්වාසය සංඥා කරන අතර යෙන් වලින් අරමුදල් සපයන ලද වාහන-වෙළඳ උපාය මාර්ග ශක්තිමත් කරයි. නමුත් ටෝකියෝ මැදිහත් වුවහොත් එය හදිසි ආපසු හැරවීමේ අවදානම ද වැඩි කරයි. USD/JPY කෙටියෙන් ඉහළට පැමිණි පසු ජපානය සිය මුදල් ආරක්ෂා කිරීමට ඩොලර් බිලියන 60 කට අධික මුදලක් වැය කළ බව වාර්තා වන පරිදි වෙළඳපල තවමත් වසර මැද කාලය සිහිපත් කරයි. එම උරුමය මෙම සංගීත කණ්ඩායම තුළ ඇති සෑම පියවරක්ම ගණන් බැසීමක් ලෙස හැඟෙයි.
වෙළඳපල සහ උපාය මාර්ගයට බලපෑම
බැඳුම්කර වෙලඳපොලවලදී ආයෝජකයන් රාජ්ය මූල්ය අවදානම පියවා ගැනීම සඳහා ඉහළ ඵලදායී ඉල්ලා සිටින අතර, දස වසරක JGB අනුපාත සියයට 1 ට වඩා ඉහළට තල්ලු කරමින් සහ හතළිස් වසරක ඵලදාව සියයට 3.6 මෙම නැගීම පිළිබිඹු කරන්නේ ජපානයේ ණය - දැනටමත් එහි ආර්ථිකයේ විශාලත්වය මෙන් දෙගුණයකට වඩා වැඩි - ටකායිචිගේ වර්ධන ගැති න්යාය පත්රය යටතේ තවදුරටත් ඉදිමනු ඇති බවට ඇති කනස්සල්ල පිළිබිඹු කරයි.
මුදල් අමාත්ය සට්සුකි කටයමා දැනටමත් අනතුරු අඟවා ඇත්තේ ආණ්ඩුව “අක්රමිකතා පියවරයන්ට එරෙහිව ක්රියා කරනු ඇති” බවට, වැකියක් වෙළඳුන් දැන් මැදිහත්වීමේ ආවරණ තර්ජනයක් ලෙස අර්ථකථනය කරයි.
කොටස් ආයෝජකයින් සඳහා, දුර්වල යෙන් කෙටි කාලීන තල්ලුවක් ලබා දී ඇත. අපනයන අධික තොග සහ විදේශීය ඉපැයීම් සුළං ආධාරයෙන් නිකී 225 දශක ගණනාවක ඉහළම මට්ටමට නැඟී ඇත.
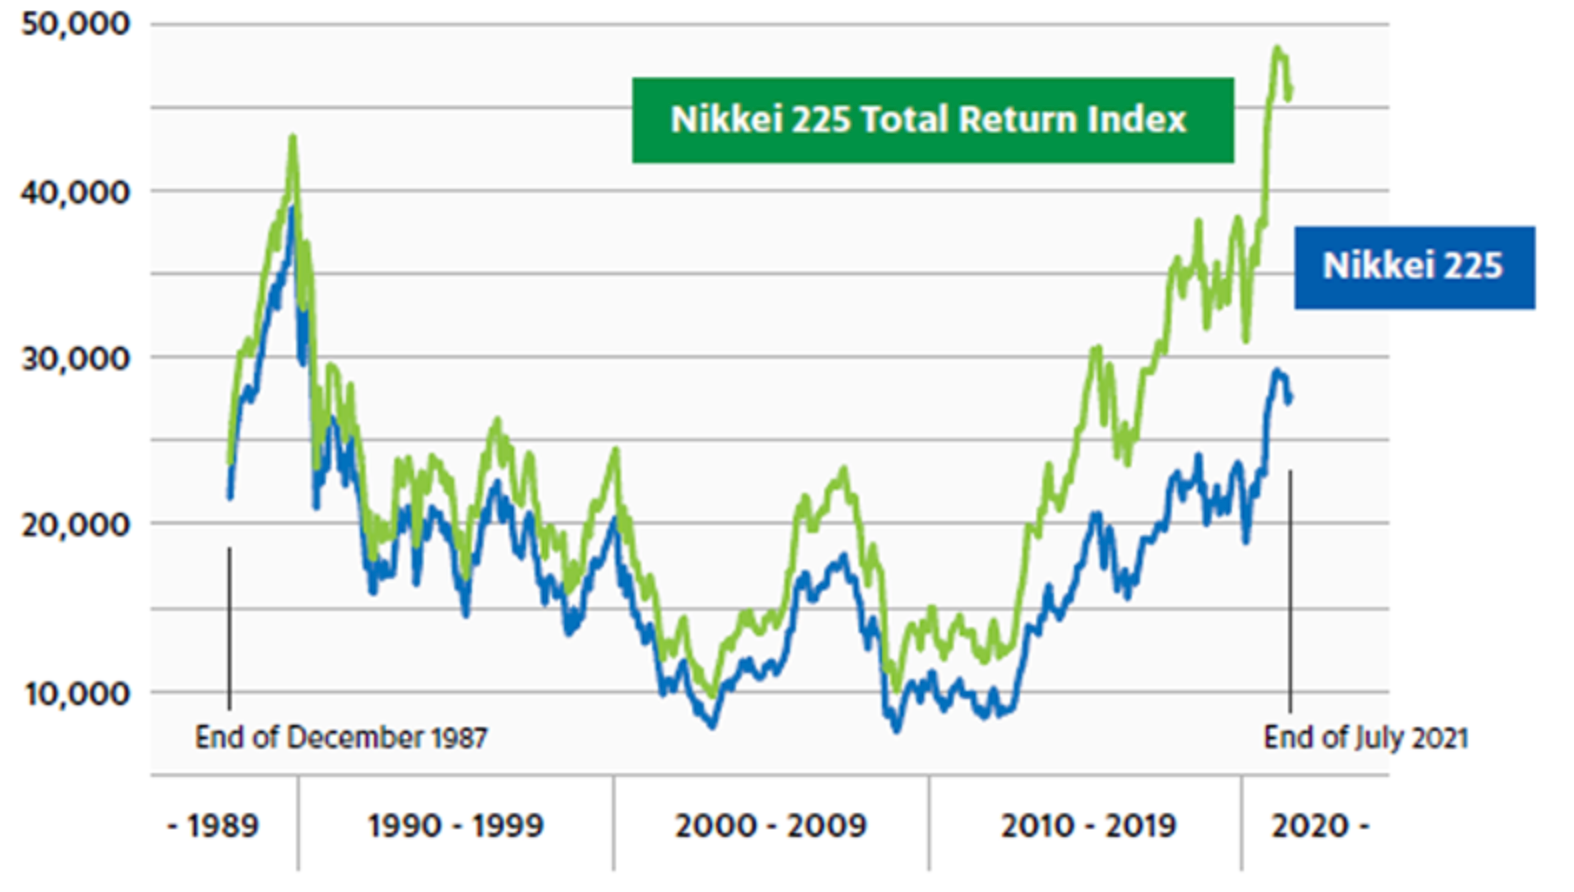
එහෙත් මෙය පිරිවැයක් දරයි: පාරිභෝගික විශ්වාසය පහත වැටී ඇති අතර උද්ධමන අපේක්ෂාවන් ඉහළ යමින් පවතී. ගෝලීය වශයෙන්, යෙන් හි මෘදුකම අවදානම් රුචිය පෝෂණය කරයි - කොටස් සඳහා ඉන්ධන සහ ක්රිප්ටෝ පවා - නමුත් ටෝකියෝ හෝ BoJ හදිසියේම ස්ථාවරය මාරු කරන්නේ නම් වෙලඳපොලවල් තියුණු නිවැරදි කිරීමකට ගොදුරු වේ.
සිල්ලර වෙළඳුන් සඳහා, මෙම අස්ථාවරත්වය සමාන මිනුමකින් අවස්ථාව සහ අවදානම ඉදිරිපත් කරයි. ප්රධාන මට්ටම් වටා ඉහළ අස්ථාවරත්වයක් සමඟ, විනයගරුක ස්ථාන ප්රමාණය කිරීම සහ ආන්තික ලුහුබැඳීම අත්යවශ්ය වේ - වැනි මෙවලම් ඩෙරිව් කැල්ක්යුලේට වෙළඳපොළට පිවිසීමට පෙර පයිප් අගයන්, කොන්ත්රාත් ප්රමාණ සහ විය හැකි ලාභය හෝ අලාභය ඇස්තමේන්තු කිරීමට වෙළඳුන්ට උදව් කළ හැකිය.
විශේෂඥ දෘෂ්ටිය
USD/JPY සඳහා පුරෝකථන කාලය මත පදනම්ව පවතී. පටු බහුතරයක් ආර්ථික විද්යාඥයින් අපේක්ෂා කරන පරිදි BoJ දෙසැම්බර් මාසයේදී අනුපාත සියයට 0.75 දක්වා ඉහළ නැංවුවහොත්, යෙන් ආපසු 150 දක්වා සහන රැළියක් ඇති කළ හැකිය.
කෙසේ වෙතත්, මහ බැංකුව ප්රමාද වුවහොත් සහ එක්සත් ජනපද දත්ත ස්ථිරව පවතී නම්, වෙළඳුන්ට පරාසයේ ඉහළ සීමාව දිගටම පරීක්ෂා කළ හැකිය. “සනේ ටකායිචිගේ ඇබෙනොමික්ස්-පන්නයේ උත්තේජකය ගෝලීය ද්රවශීලතාව පුළුල් කර ඩොලරය ශක්තිමත් කරනු ඇත - ඩොලරය රජු ජීවතුන් අතර සහ හොඳින් සිටී” යනුවෙන් වෙලින්ටන් ඇල්ටස් හි ජේම්ස් තෝර්න් පැවසීය.
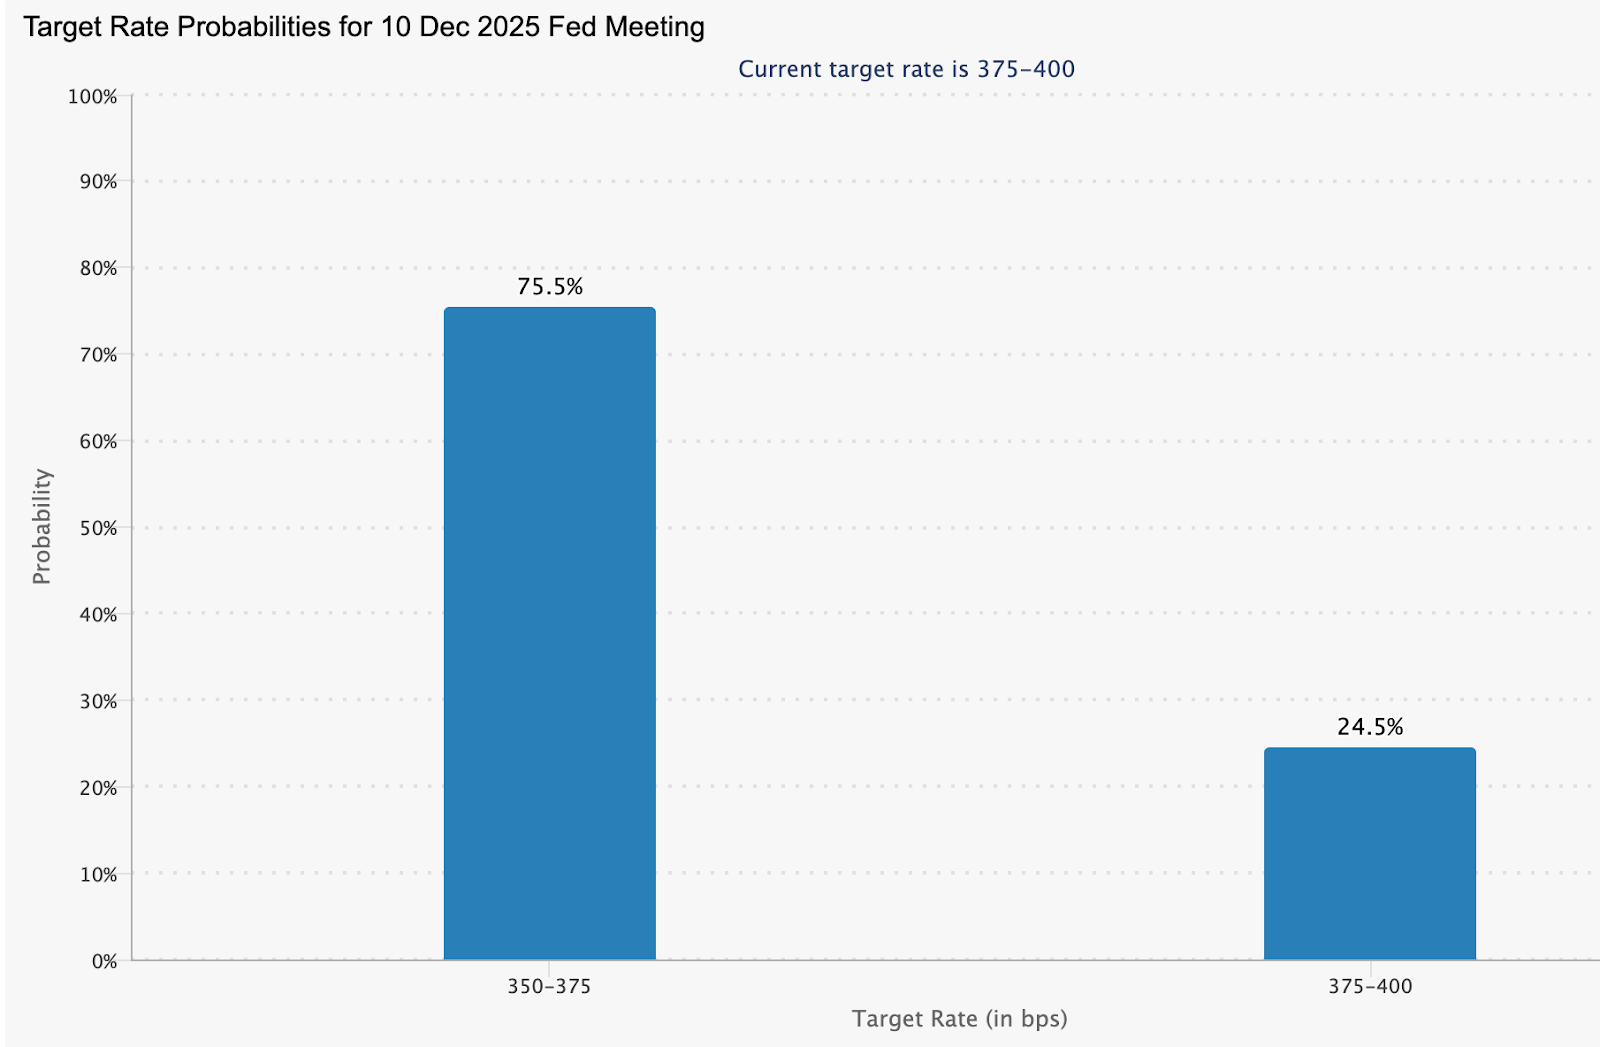
බොහෝමයක් රඳා පවතින්නේ මහ බැංකුව BoJ කිරීමට පෙර මාරු වේද යන්න මතය. අනාගත වෙලඳපොලවල් දැනට දෙසැම්බර් මාසයේදී එක්සත් ජනපද අනුපාත කප්පාදුවක 75.5% ක අවස්ථාවක් මිල ගනී.
විශ්ලේෂකයෝ වැඩිදුරටත් පැවසූහ ෆෙඩරල් අස්වැන්න පරතරය අඩු කර යෙන් මිලදී ගැනීමට හේතු විය හැකිය. නමුත් එය නොමැතිව ජපානයේ මුදල් ප්රතිපත්ති අවස්ථිතිකත්වයට සහ ගෝලීය හැඟීම්වලට ප්රාණ ඇපකරුවෙකි. දිගු USD/JPY 160 ආසන්නයේ රැඳී සිටින තරමට, එය සනාථ කිරීමට ටෝකියෝ මත පීඩනය වැඩි වන තරමට වෙළඳපොළේ ගෞරවය තවමත් අණ කරයි.
USD/JPY තාක්ෂණික අවබෝධය
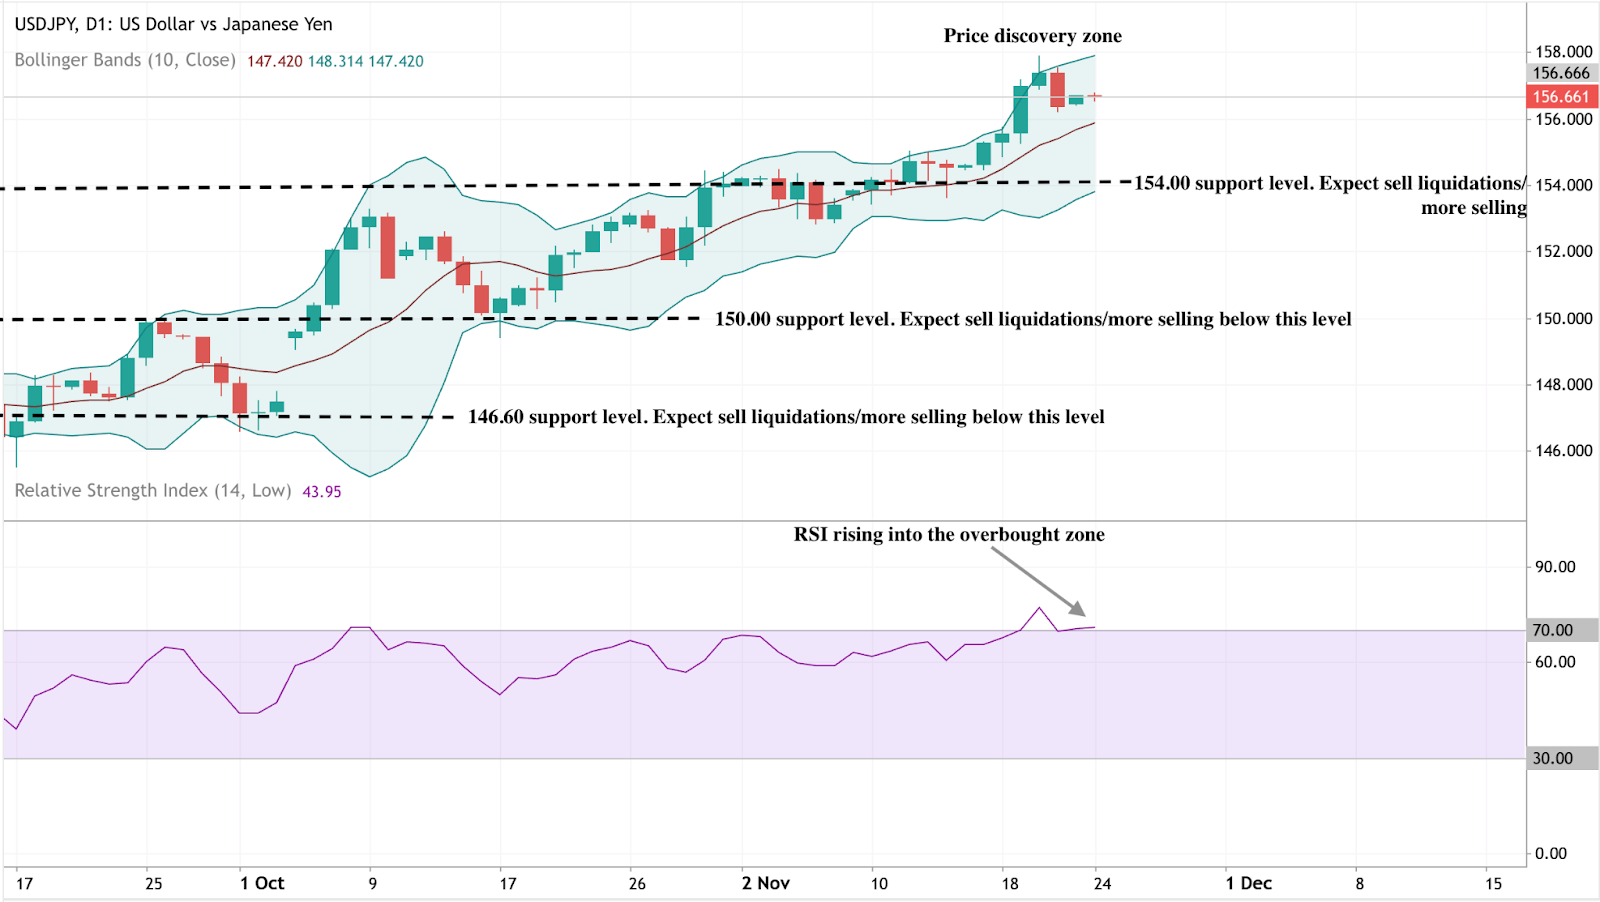
ලියන අවස්ථාවේ දී, USD/JPY 156.66 ආසන්නයේ වෙළඳාම් කරමින් සිටින අතර එය දීර්ඝ කිරීමෙන් පසු මිල සොයා ගැනීමේ කලාපයක් තුළ ඒකාබද්ධ වේ බුලිෂ් ධාවනය කරන්න. බොලින්ගර් බෑන්ඩ් (10, කිට්ටු) පුළුල් වෙමින් පවතින අතර මිල ක්රියාකාරීත්වය ඉහළ පටියට ආසන්නව පවතින බැවින් ඉහළ අස්ථාවරත්වයක් සහ අඛණ්ඩ නැඹුරුවක් පෙන්නුම් කරයි - ශක්තිමත් බුලිෂ් ගම්යතාවයේ සලකුණක් පමණක් නොව කෙටිකාලීන වෙහෙස වීමේ අවදානම වැඩි වේ.
ප්රධාන ආධාරක කලාප 154.00, 150.00, සහ 146.60 හි වාඩි වී ඇති අතර එහිදී එක් එක් පහත විවේකයක් විකුණුම් ද්රාවණ සහ ගැඹුරු නිවැරදි කිරීම් අවුලුවනු ඇත. උඩු අතට ගත් කල, 156.00 ට වඩා මිල සොයා ගැනීම සීමිත ප්රතිරෝධයක් ඉතිරි කරයි, එයින් අදහස් කරන්නේ අස්ථාවරත්වය ඉහළ යාම මිස ඊළඟ අදිටන් ගැනුම්කරුවන් ආකර්ෂණය කර ගත හැකිය.
ද ආර්එස්අයි (14) අධික ලෙස මිල දී ගත් කලාපයට නැග ඇති අතර, බුලිෂ් ශක්තිය එහි උච්චතම අවස්ථාවට ළඟා විය හැකි බව යෝජනා කරයි. ආර්එස්අයි 70 ට වඩා වැඩි කියවීමක් පවත්වා ගන්නේ නම්, ගම්යතාව ඉහළ යා හැකිය; කෙසේ වෙතත්, මෙම මට්ටමට වඩා අඩු ඕනෑම ආපසු හැරවීමක් ඉදිරියට ලාභ ලබා ගැනීම හෝ මුල් විකුණුම් පීඩනය පෙන්නුම් කළ හැකිය.
ප්රධාන පිටුවහලක්
විශ්ලේෂකයන්ට අනුව, USD/JPY 155—160 කොරිඩෝව වෙත නැවත පැමිණීම ප්රස්ථාර රටාවකට වඩා වැඩියි; එය ජපානයේ ප්රතිපත්ති මිශ්රණය පිළිබඳ ජනමත විචාරණයකි. මුදල් ගැලපුම් නොගැලපීමකින් තොරව රාජ්ය මූල්ය ව්යාප්තිය යෙන් අවදානමට ලක් කර ඇති අතර ආයෝජකයින් සංවේදී වී ඇත. මැදිහත් වීමෙන් වෙලඳපොලවල් කෙටියෙන් ස්ථාවර විය හැකි නමුත් තීරණාත්මක තද කිරීම හෝ රාජ්ය මූල්ය සංයමය පමණක් විශ්වාසය යළි එතෙක්, යුගලය අනතුරේ කලාපයේ චතුරස්රාකාරව වාඩි වී ඇත - එහිදී සෑම පියවරක් ඉහළ පරීක්ෂණ පමණක් ටෝකියෝගේ ඉවසීම නොව, ජපානයේ තමන්ගේම මුදල් පාලනය කිරීමට ඇති හැකියාව පිළිබඳ ලෝකයේ විශ්වාසය.
කනගාටුයි, අපට ගැළපෙන ප්රතිඵල කිසිවක් සොයාගත නොහැකි විය .
සෙවුම් ඉඟි:
- ඔබේ අක්ෂර වින්යාසය පරීක්ෂා කර නැවත උත්සාහ කරන්න
- වෙනත් මූල පදයක් උත්සාහ කරන්න