검색 결과

Yen carry trade in reverse: Japan’s yield shift and its impact on USD/JPY
As domestic yields rise, Japanese investors are increasingly repatriating funds from abroad, strengthening the yen and unsettling one of the world’s longest-standing funding trades.
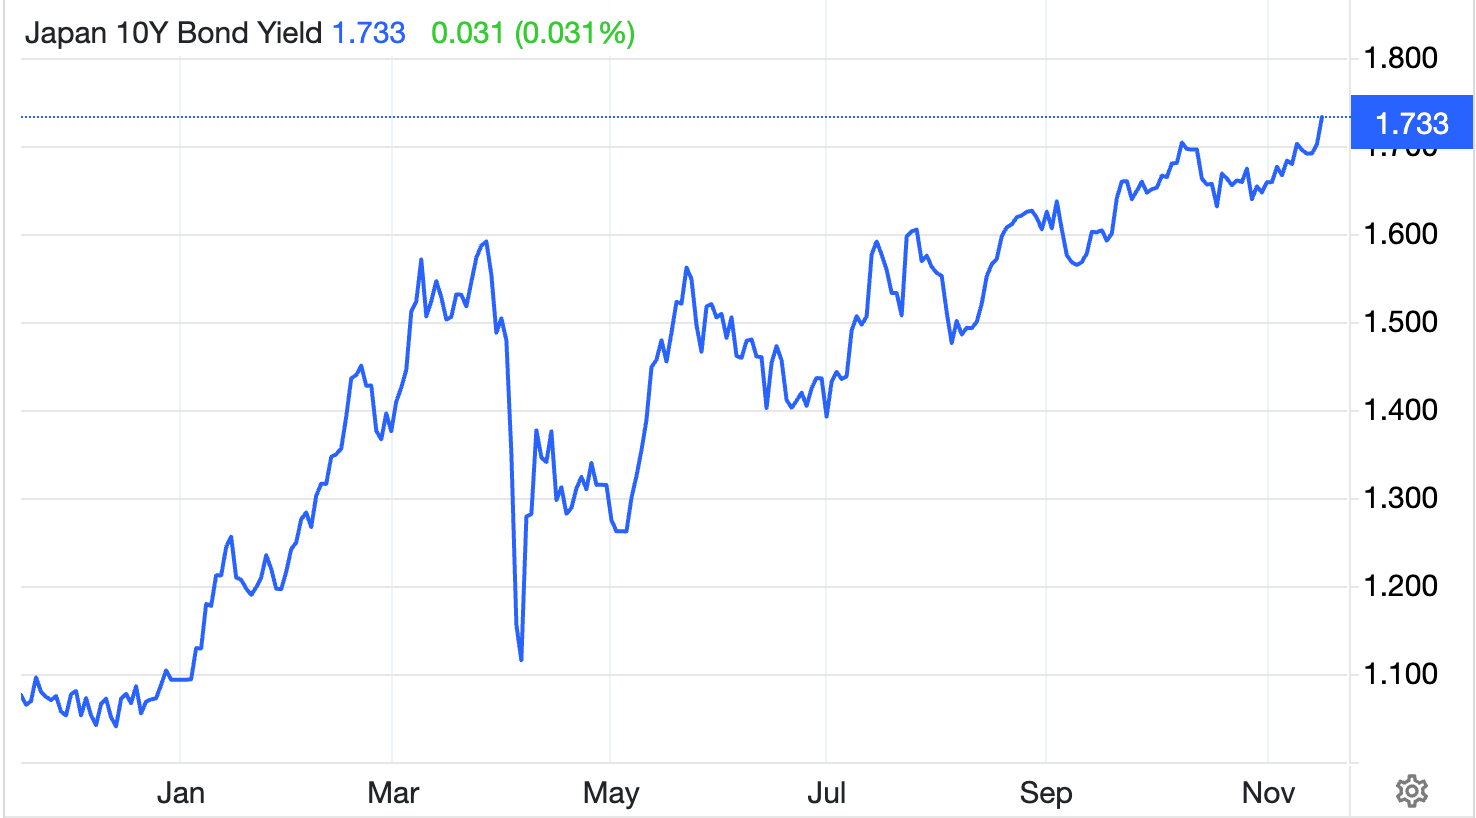
Japan’s bond market is rewriting the rules of the global foreign exchange market. The country’s 10-year government bond (JGB) yield has surged to 1.73% - its highest level since June 2008 - as markets brace for a ¥17 trillion (£88 billion / $110 billion) fiscal stimulus and a further reduction in Bank of Japan (BoJ) bond purchases. The move signals the beginning of a new phase: the yen carry trade in reverse.
As domestic yields rise, Japanese investors are increasingly repatriating funds from abroad, strengthening the yen and unsettling one of the world’s longest-standing funding trades.
The question now dominating markets is clear - will this shift pull USD/JPY back from its multi-decade highs near 156, or force the BoJ and Ministry of Finance (MoF) to intervene once again to stabilise the currency?
Key takeaways
- Japan’s 10-year bond yield has reached 1.73%, the highest since 2008, as markets price in rising inflation, fiscal stimulus, and reduced BoJ support.
- The BoJ’s gradual normalisation - with short-term rates now at 0.5% - is driving a global reassessment of the yen’s funding role.
- A planned ¥17 trillion stimulus aims to offset Japan’s 0.4% GDP contraction in Q3 but risks adding inflationary pressure.
- Rising yields are drawing capital back into Japan, prompting a partial unwinding of the yen carry trade.
- USD/JPY faces key resistance near 155–156, a zone where past interventions have been triggered.
Japan bond yields go up to breach the 1.7 mark
After nearly two decades of near-zero yields, Japan’s bond market is finally moving under its own weight.
The 10-year JGB yield, which stayed below 1% for years due to the BoJ’s Yield Curve Control (YCC), has now broken decisively higher - a sign that investors expect sustained inflation, more fiscal spending, and a lighter BoJ hand in the market.
Several forces have converged:
- The BoJ is tapering bond purchases, reducing artificial demand for JGBs.
- Short-term policy rates have been raised to 0.5%, marking the end of an era of negative rates.
- A massive stimulus plan under Prime Minister Sanae Takaichi is expected to inject over ¥17 trillion into the economy through tax cuts, infrastructure spending, and household support.
Together, these dynamics have pushed bond yields to levels unseen since the global financial crisis, marking what analysts describe as the end of Japan’s “zero-cost money” era.
Higher yields despite Japan’s fragile economy
Despite higher yields, Japan’s economy remains fragile. Data from the Cabinet Office show that GDP contracted by 0.4% in Q3, its first decline in six quarters. Weak residential investment and subdued consumer demand dragged growth lower, even as exports rebounded slightly in September.
BNP Paribas economist Ryutaro Kono noted that while the contraction is not “particularly serious”, it highlights uneven recovery momentum. Still, the forthcoming stimulus package - expected to be approved soon - aims to restore confidence and support households facing rising living costs.
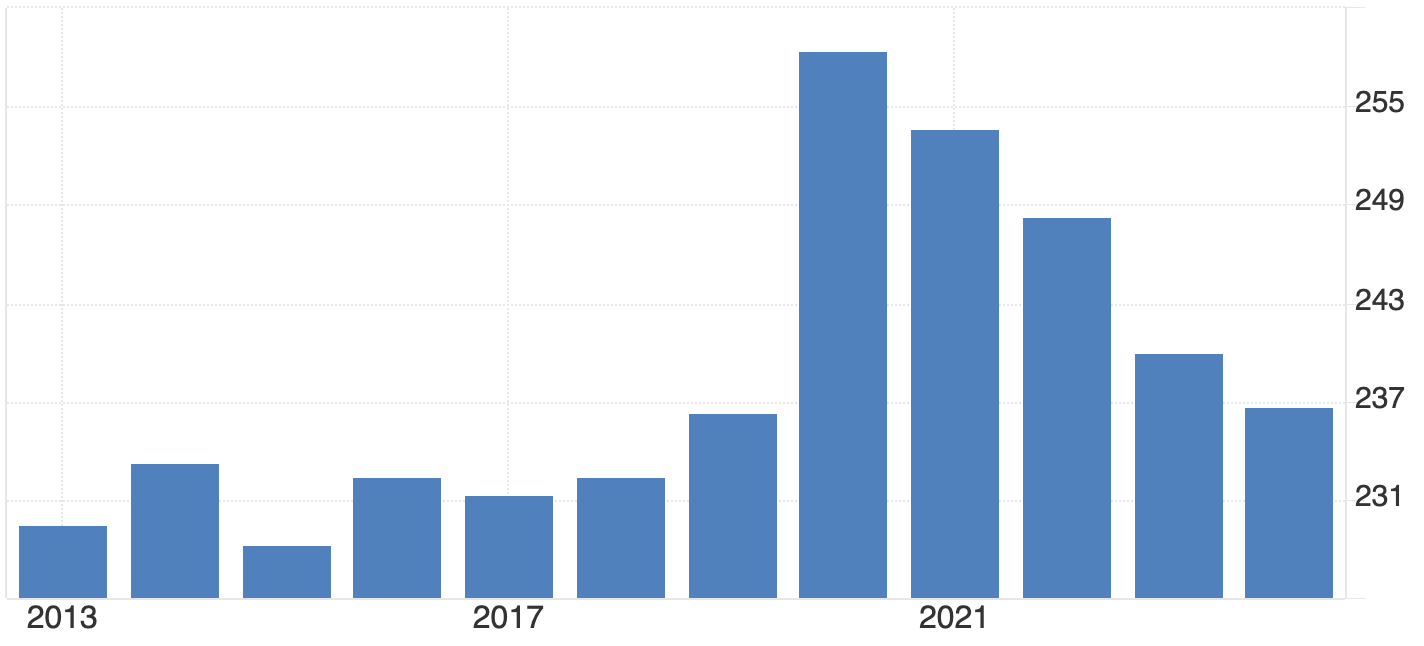
Yet the market reaction suggests scepticism. Investors view fiscal expansion as inflationary and debt-heavy. With Japan’s public debt exceeding 230% of GDP, every new round of spending increases pressure on the bond market - and by extension, the yen.
The mechanics: Why higher yields strengthen the yen
The surge in Japanese yields has immediate foreign exchange implications, particularly for the USD/JPY exchange rate.
1. Repatriation of capital
Japan’s institutional investors - who collectively hold trillions of dollars in foreign bonds - are now finding better returns at home. As domestic yields climb, they begin selling U.S. Treasuries, European debt, and emerging market assets to reinvest in JGBs. This process increases demand for yen, supporting its value against major currencies.
2. Unwinding the carry trade
The yen carry trade - borrowing in low-yielding yen to buy higher-yielding assets abroad - has been a cornerstone of global markets for years. With Japanese rates rising, this trade becomes less profitable. Traders must buy yen to repay loans, triggering powerful short-term rallies.
3. Yield Differentials and Global Comparison
Even with U.S. 10-year yields near 4–5%, Japan’s rapid shift from near-zero to 1.7% is significant. For Japanese investors who once earned nothing on domestic bonds, the new yield environment is competitive enough to slow outflows and boost inflows, tilting currency dynamics in favour of the yen.
Yen policy trade-offs: Growth, debt, and stability
For the BoJ, this shift poses a major challenge. Governor Kazuo Ueda must balance a weak economy, rising inflation, and market volatility. The ¥17 trillion fiscal push could revive domestic demand, but it also risks fueling inflation expectations and adding strain to already high debt levels.
If yields rise too high, the BoJ may need to intervene in bond markets again or issue verbal guidance to temper speculation. Finance Minister Satsuki Katayama has already warned she is “watching FX moves with a sense of urgency”. Historically, such language has preceded yen-supportive interventions, particularly when USD/JPY nears 155–156 - a zone Credit Agricole analysts flag as Tokyo’s soft intervention threshold.
Geopolitics: China tensions and trade headwinds
External risks compound Japan’s policy dilemma. Relations with China have deteriorated following Takaichi’s remarks on Taiwan, prompting mutual travel warnings and raising fears of trade retaliation.
Economists such as Marcel Thieliant at Capital Economics warn that restrictions on rare earth exports or Japanese goods could escalate into a broader trade dispute - one that hurts exporters already under pressure from Chinese electric vehicle competition.
These tensions could trigger safe-haven inflows into the yen, but they also risk weakening Japan’s export engine - another reason why policymakers may resist further currency volatility.
USD/JPY forecast: Scenarios for late 2025
In the near term, a test of 145–148 remains plausible as capital returns home. But if the U.S. Federal Reserve delays rate cuts - keeping U.S. yields high - USD/JPY could stay anchored closer to 150–153.
Either way, the BoJ’s tolerance threshold around 156 is becoming a critical line for traders to watch. Traders can monitor these levels directly on Deriv MT5, which offers live market depth and advanced charting to track yen volatility in real time.
USD/JPY technical analysis

At the time of writing, USD/JPY is trading around 154.72, holding just below a fresh price discovery zone. The RSI sits flat just below the overbought threshold, signalling that bullish momentum remains strong but may be nearing exhaustion if no further upside breakout occurs.
Meanwhile, Bollinger Bands are expanding, indicating an increase in volatility. The price is hugging the upper band, reflecting sustained buying pressure - though such positioning often precedes short-term pullbacks or consolidation phases.
On the downside, immediate support lies at 153.00, with further key levels at 150.00 and 146.45. A break below these levels could trigger sell liquidations or panic selling, especially if sentiment turns against the dollar.
Overall, momentum currently favours the bulls, but with the RSI nearing overbought territory and price extended along the upper Bollinger Band, traders should watch for possible short-term corrections before any continuation higher.
Global ripple effects of yen
Japan’s yield shift is not an isolated story. As the world’s largest creditor nation, any repatriation of Japanese funds can affect global bond markets:
- U.S. Treasuries: Selling pressure from Japanese investors could lift U.S. yields.
- Europe and Australia: Investors may rebalance towards JGBs, driving global yield convergence.
- Emerging markets: Funding costs could rise as yen liquidity tightens.
The implications are profound - the end of Japan’s zero-yield era may gradually unwind two decades of global risk-taking built on cheap yen funding.
Investment and trading implications of yen
For traders, Japan’s bond market is now the most important variable in the yen equation.
- Short-term outlook: Higher JGB yields and repatriation flows could push USD/JPY lower towards 145–148, especially if U.S. yields stabilise.
- Medium-term: Fiscal stimulus and persistent inflation may keep yields elevated but volatile, anchoring USD/JPY near 150–153.
Intervention watch: If the pair nears 156, expect stronger verbal warnings and possible BoJ/MoF coordination.

미국 인플레이션 및 노동 데이터 발표를 앞둔 EUR/USD 전망
미국 인플레이션 데이터 지연으로 시장이 명확성을 기다리는 가운데 EUR/USD는 횡보세를 유지하고 있습니다.
미국 인플레이션 데이터 지연으로 시장이 명확성을 기다리는 가운데 EUR/USD는 1.156에서 1.166 사이에서 횡보하고 있습니다. 트레이더들은 소비자물가지수(CPI) 수치가 연방준비제도(Fed)가 완화적 기조를 유지할지 또는 추가 완화를 중단할지를 보여줄 때까지 신중한 입장을 유지하고 있습니다.
데이터 부재는 변동성을 줄이고 달러 약세 속에서 유로를 안정적으로 유지시켰으며, 시장은 성장 둔화, 금리 기대 변화, 그리고 개선되는 글로벌 위험 심리를 저울질하고 있습니다.
주요 요점
- EUR/USD는 1.1642 근처에서 안정세를 유지하며, 트레이더들이 CPI 데이터를 기다리는 가운데 1.156~1.166의 좁은 범위 내에서 거래되고 있습니다.
- 정부 셧다운 이후 미국 데이터 지연으로 시장 방향성이 얼어붙고 달러 모멘텀이 약화되었습니다.
- 정책 차이는 좁혀지고 있으며, Fed는 금리 인하 쪽으로 기울고 ECB는 현 수준을 유지하고 있습니다.
- 유로존의 안정성과 개선되는 심리는 미국의 불확실성과 대조를 이루며 유로의 회복력을 지지합니다.
- 변동성 축소는 인플레이션 데이터 발표 후 잠재적 돌파구를 시사합니다.
미국 인플레이션 및 노동 데이터 지연 지속으로 시장 정체
미국 인플레이션 및 노동 데이터 발표 지연으로 시장은 방향성을 잃었습니다. 노동통계국(BLS)은 최근 정부 셧다운으로 인한 혼란을 여전히 해결 중이며, 일부 10월 수치가 아예 발표되지 않을 가능성도 제기되고 있습니다.
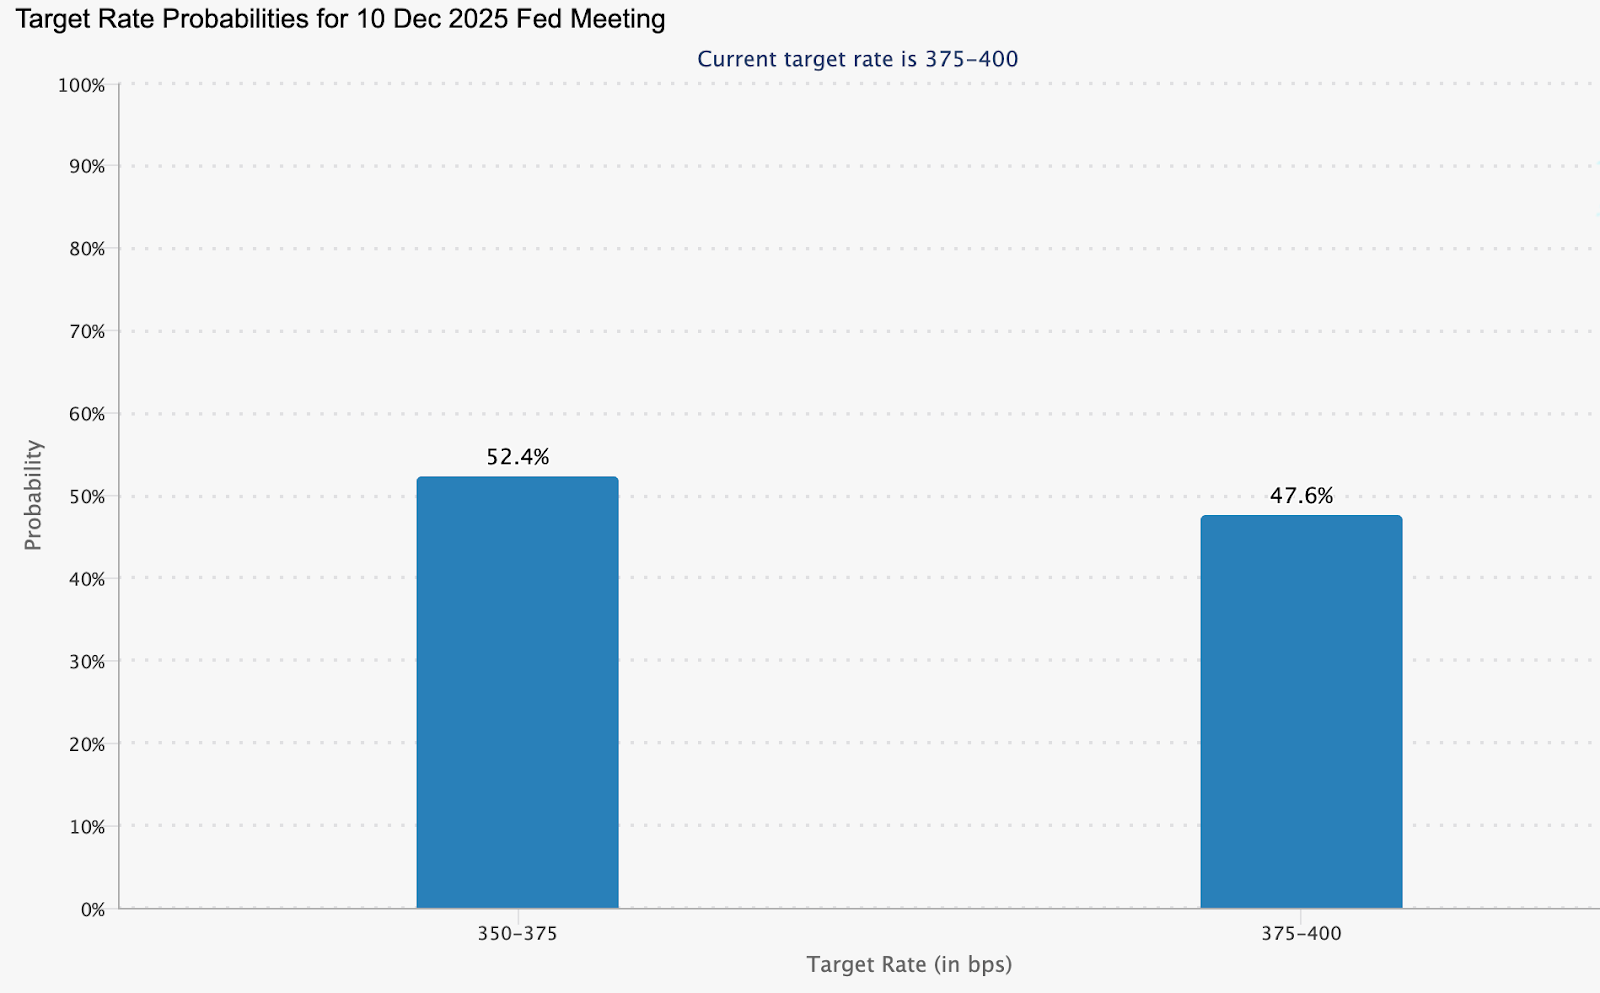
이러한 가시성 부족은 트레이더와 정책 입안자 모두를 마비시켰습니다. CPI나 비농업 고용지표 데이터 없이는 Fed의 의사결정이 추측에 불과합니다. CME FedWatch Tool에 따르면, 시장은 12월 25bp 금리 인하 확률을 52.4%로 반영하고 있으나 확신은 빠르게 약화되고 있습니다.
한편 위험 선호 심리는 개선되고 있으며, 유럽 지수는 안정적입니다. 이러한 조합은 일반적으로 달러를 약화시키는 요인입니다. 위험 선호 심리가 확산되면서 유로는 개선된 자본 흐름과 안전자산 수요 감소로부터 수동적 지지를 받고 있습니다.
ECB-Fed 정책 격차 및 성장 격차 축소로 유로 강세
현재 데이터 공백을 넘어, 전반적인 펀더멘털은 유로 지지 쪽으로 기울고 있습니다. IMF는 미국 GDP 성장률이 2025년 2.8%에서 2.0%로 둔화될 것으로 전망하는 반면, 유로존 성장률은 0.9%에서 1.2%로 상승할 것으로 예상합니다. 이러한 성장 격차 축소는 달러의 전통적 강점 중 하나를 약화시킵니다.
통화 정책도 수렴하고 있습니다. 유럽중앙은행(ECB)은 완화 국면을 마무리한 것으로 보이며, Federal Reserve 는 미국 모멘텀 둔화에 따라 금리 인하에 더 가까워 보입니다. 수익률 차이 축소는 역사적으로 EUR/USD에 긍정적입니다.
동시에 유로존의 안정성은 자산이 되고 있습니다. 에너지 위험은 줄어들었고, 정치적 변동성은 완화되었으며, 소비자 신뢰도 회복의 미약한 신호를 보이고 있습니다. 구조적 위험이 줄고 통화 정책이 안정적이므로 유로는 낙관론에 기대어 반등할 필요 없이, 달러가 방향성을 찾지 못하는 가운데 꾸준함만 유지하면 됩니다.
CPI 데이터 영향: 시장의 가장 큰 맹점
인플레이션은 여전히 중심축입니다. 미국 CPI가 예상보다 높게 나오면, 시장은 Fed의 금리 동결 기대를 재조정하며 EUR/USD는 하락할 수 있습니다. 반대로 낮은 수치는 완화적 전망을 확인시켜 주어 유로 강세를 강화할 것입니다.
현재로서는 인플레이션 데이터 부재 자체가 촉매제가 되었습니다. 새로운 수치가 없으니 트레이더들은 펀더멘털보다는 심리와 기술적 신호에 점점 더 의존하고 있습니다. 이로 인해 변동성은 축소되고 확신은 줄었지만, 이 상황이 길어질수록 결국 돌파는 더 강력할 수 있습니다.
EUR/USD 투자 시사점: 모멘텀과 저항의 충돌
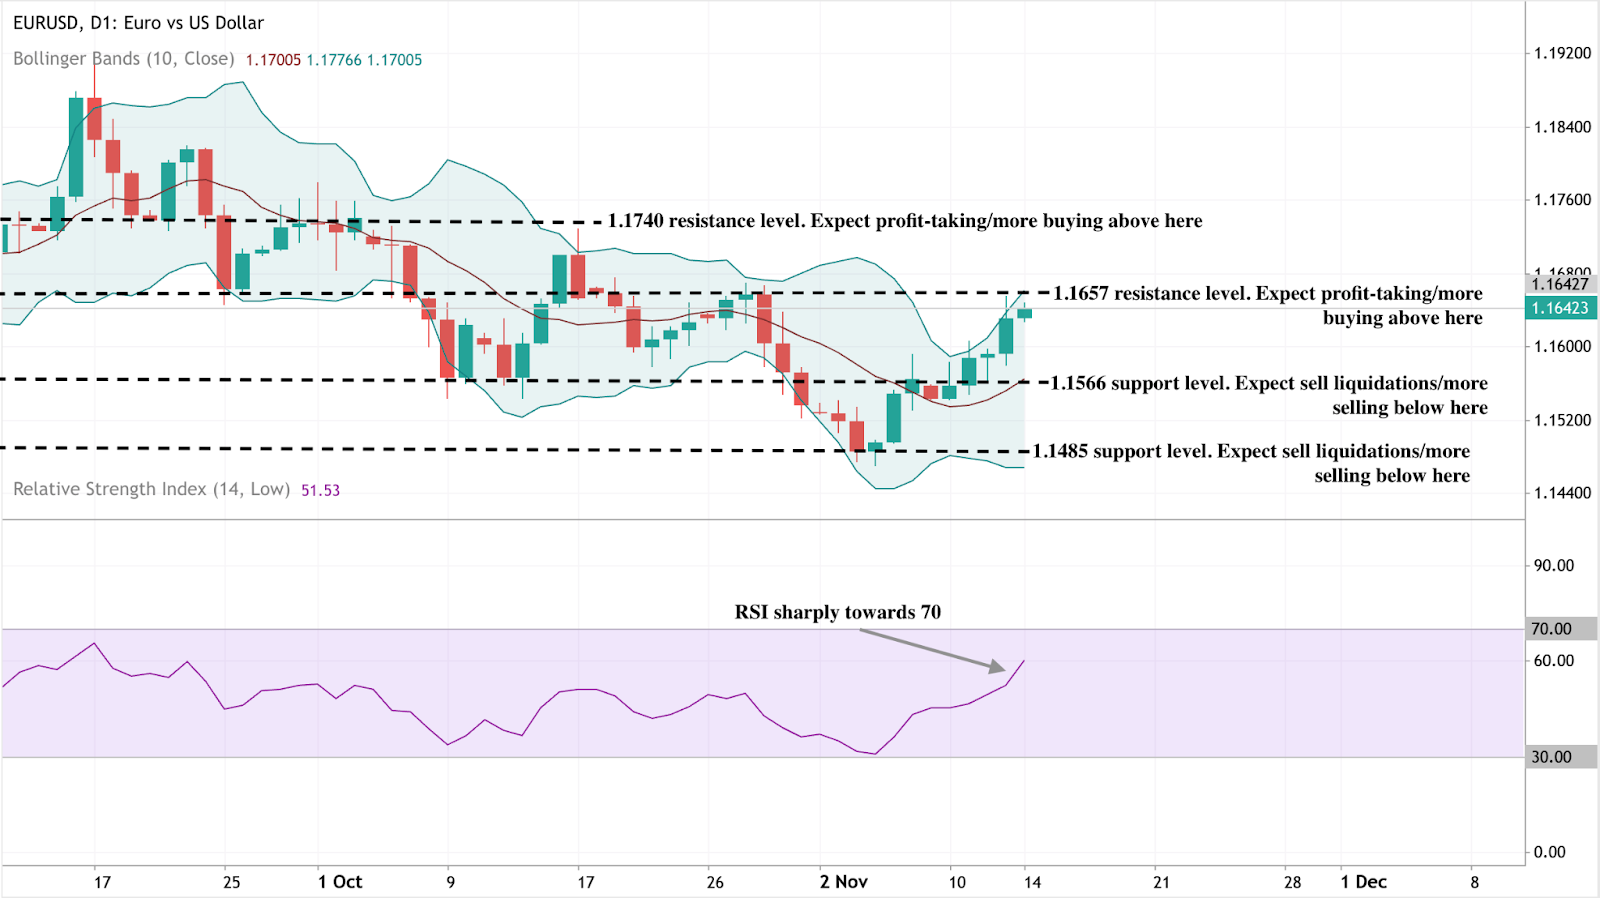
작성 시점에서 EUR/USD는 1.1642 근처에서 거래되고 있으며, 모멘텀은 강세를 보이나 중요한 저항 구간에 직면해 있습니다.
볼린저 밴드는 가격 움직임이 상단 밴드에 근접해 있음을 나타내며, 이는 변동성 증가와 강한 매수 압력을 시사합니다. 그러나 1.1657에 접근할수록 트레이더들은 이익 실현이나 단기 조정을 예상할 수 있습니다.
1.1740을 명확히 돌파하면 bullish 심리가 강화되고 추가 매수세를 유인할 수 있습니다. 반면 하방에서는 즉각적인 지지선이 1.1566에 있으며, 더 깊은 지지선은 1.1485 부근에 있습니다. 이 수준 아래로 하락하면 매도 청산과 하락 압력이 재개될 가능성이 큽니다.
한편 RSI는 70에 근접해 과매수 구간에 다다르고 있음을 알리고 있습니다. 이는 추세가 다시 상승하기 전에 단기 조정이 있을 수 있음을 시사합니다.
EUR/USD 투자 시사점
트레이더들에게 이 시장은 공격적 접근보다는 인내심이 요구되는 시장입니다. 1.156~1.166 범위 내에서의 횡보 거래는 여전히 유효하지만, 데이터에 따른 돌파 위험을 고려해 엄격한 손절매 설정이 필수적입니다.
중기 투자자들은 유로의 기초 안정성, 성장 격차 축소, 유로존 위험 감소가 달러가 2026년 초까지 약세를 지속할 경우 1.18~1.20까지 점진적 상승 모멘텀을 유지할 수 있음을 주목해야 합니다.
변동성 축소로 인해 리스크 관리가 매우 중요해졌습니다. Deriv trading calculator를 사용하면 트레이더들은 포지션 실행 전 핍 가치, 증거금 요구량, 잠재적 손익을 추정할 수 있습니다. 이는 1.156 지지선이나 1.174 저항선과 같은 중요한 구간에서 노출을 관리하는 데 중요한 우위가 됩니다.
EUR/USD가 주요 기술적 수준 근처에서 움직이는 가운데, 트레이더들은 Deriv MT5에서 실시간 가격 움직임을 추적하고 Deriv Trading Calculator를 활용해 데이터 기반 진입 전략을 계획할 수 있습니다. CPI 보고서가 발표되면 두 도구 모두 돌파 모멘텀 식별과 실시간 노출 관리에 필수적일 것입니다.

은 가격 전망: 이번 금속 랠리가 강력한 이유
분석가들에 따르면, 지난 5일간의 은 랠리는 허황된 기대가 아닌 펀더멘털에 기반한 움직임이다.
분석가들에 따르면, 지난 5일간의 은 랠리는 허황된 기대가 아닌 펀더멘털에 기반한 움직임이다. 과거의 투기적 급등과 달리 이번 상승은 통화 완화 기대, 공급 부족 상황, 재생에너지 및 반도체 제조에서의 급증하는 산업 수요가 결합된 결과다.
달러가 압박을 받는 가운데 트레이더들이 12월 금리 인하를 반영하면서, 은의 최근 강세는 또 다른 단기 낙관론이 아닌 펀더멘털에 기반한 국면의 시작을 알린다.
주요 요점
- 은 가격은 약 54.40달러 근처에서 거래되며 10월 이후 가장 강한 랠리를 이어가고 있다.
- 연준 금리 인하 확률이 68%로 상승하며 투자자들이 은과 같은 무수익 자산으로 이동했다.
- 2016년 이후 광산 공급이 7% 감소했으며, 산업 수요가 생산을 앞서고 있다.
- 재생에너지와 전기차 수요가 은 총 소비의 절반 이상을 차지한다.
은 정책 전환과 데이터 약세가 매수 촉진
은의 최근 랠리는 금리 기대치의 급격한 변화에 의해 촉발되었다. 최근 미국 경제 지표는 모멘텀 둔화를 보여주었는데, ADP에 따르면 10월 말까지 민간 부문 일자리 창출이 주당 약 11,000명 감소했다. 이러한 둔화는 연방준비제도(Fed)가 12월에 금리를 인하할 것이라는 시장 신뢰를 높였으며, CME FedWatch Tool에 따르면 인하 확률이 62%에서 68%로 상승했다.
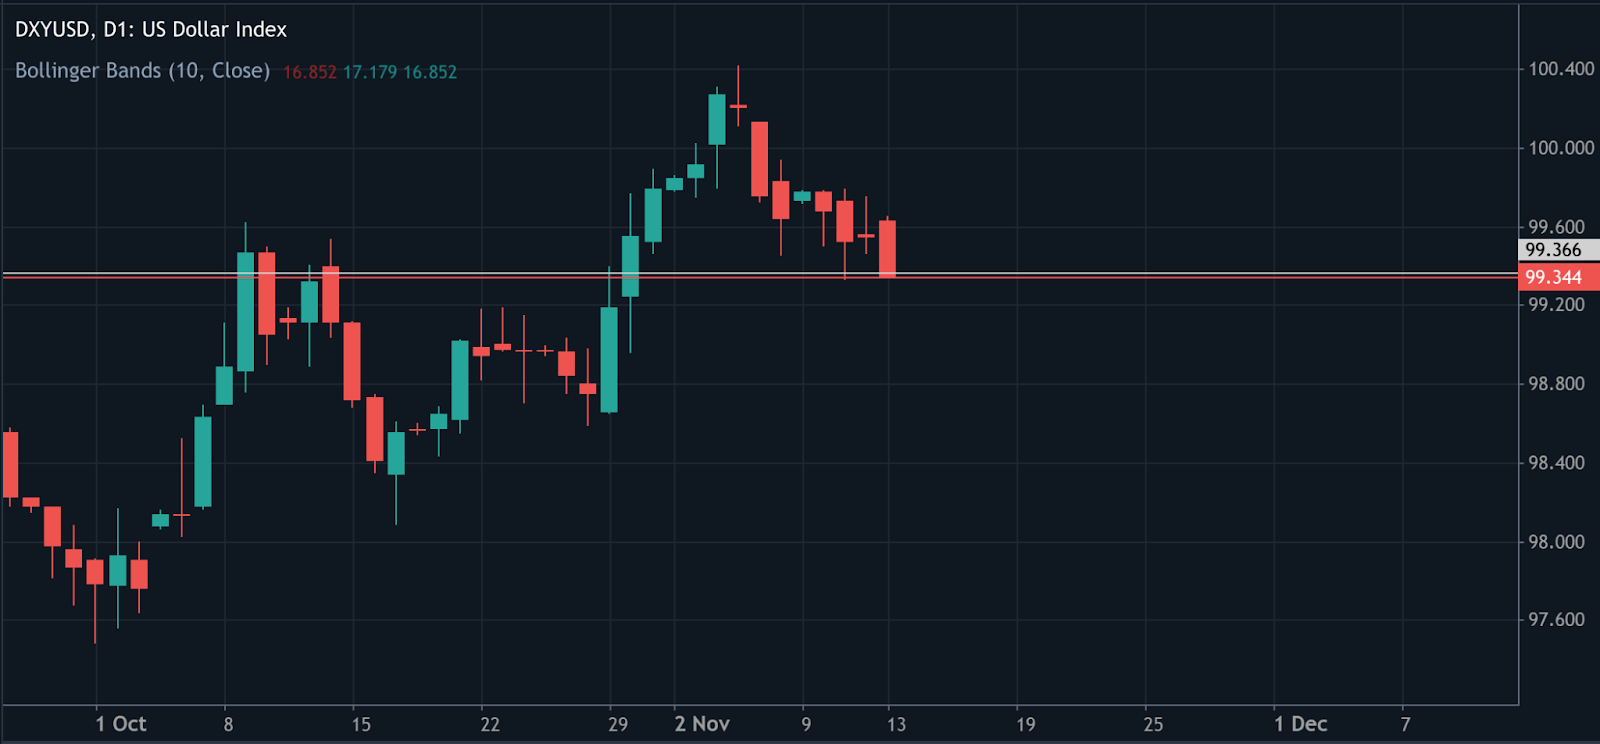
금리 인하는 일반적으로 달러를 약화시키고 무수익 안전자산에 대한 수요를 증가시킨다. 미국 달러 지수(DXY)는 약 99.60으로 하락하여 투자자들이 저수익 현금 대신 금과 은으로 대체 자산을 찾으면서 이들의 상승을 가속화했다.
통상적으로 미국 정부 셧다운 진전은 안전자산 수요를 진정시켰겠지만, 이번에는 정책 기대가 정치적 이슈보다 우세했다. 시장은 성장 둔화와 완화로 강제된 연준이라는 더 넓은 이야기에 반응하고 있다.
공포에서 펀더멘털로: 은의 공급 적자와 수요 이야기
이번 랠리는 투기적 거래에 의해 촉발된 이전 사례들과는 다르다. Sprott Asset Management에 따르면 은의 강세는 이제 과장된 기대가 아닌 구조적 공급 적자와 산업 확장에 기반하고 있다. 2016년 이후 총 광산 생산량은 7% 감소했으며, 재생에너지, 전기차(EV), 전자제품에서의 수요는 꾸준히 증가하고 있다.
은 산업 수요가 공급 증가를 계속 앞서다
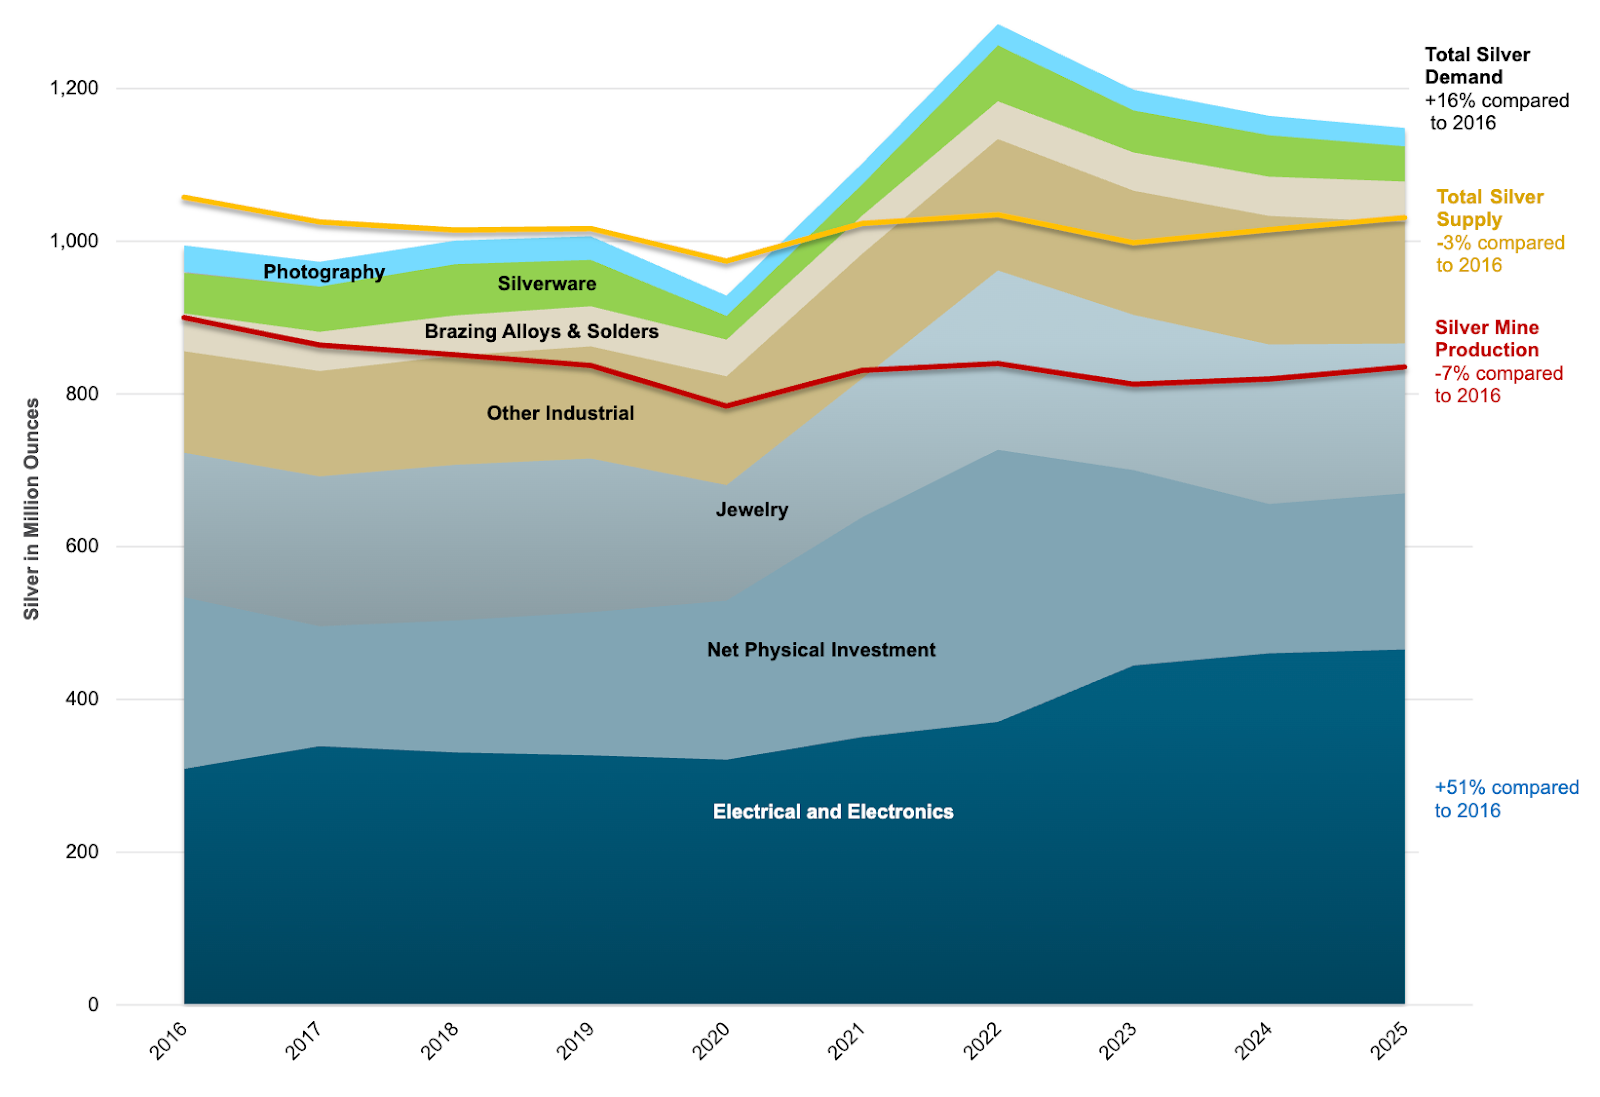
은 총 수요의 절반 이상이 현재 산업용에서 나오며, 주로 태양광 패널 제조, 반도체, 전기차 부품이 포함된다. 그러나 공급은 이에 미치지 못하고 있다. 재활용량은 소폭 증가에 그쳤고, 신규 광산 투자도 제한적이어서 시장은 점점 더 타이트해지고 있다.
한 분석가는 “이번 은 랠리는 수년 만에 공포가 아닌 공장에 의해 주도된 첫 번째 랠리”라고 평가했다.
거래 진입을 계획 중이라면, Deriv 거래 계산기를 통해 Deriv MT5 등 Deriv 플랫폼에서 마진, 스왑, 잠재 수익을 추정할 수 있다.
거시 환경: 달러 약세와 비둘기파 정책
더 넓은 환경이 은의 강세를 뒷받침한다. 약한 달러, 하락하는 수익률, 부진한 경제 지표의 조합이 귀금속에 이상적인 조건을 만들었다. 미시간 대학교 소비자 심리지수는 2022년 이후 최저치로 떨어졌고, 소매 활동도 둔화되어 연준의 긴축 사이클이 한계에 도달했음을 시사한다.
미국 소비자 심리


금도 10월에 온스당 4,300달러를 잠시 넘으며 섹터 모멘텀에 기여했다. 전통적으로 변동성이 더 큰 은은 통화 완화가 장기화될 것이라는 기대 속에서 투자자들이 금속 전반에 분산 투자하면서 그 혜택을 받았다.
동시에, 구리 공급 부족은 금속 전체가 공급 주도 재평가 국면에 진입하고 있다는 주장을 뒷받침한다. 구리에서 나타난 구조적 부족 현상이 이제 은에서도 나타나며, 주요 원자재 전반에 걸쳐 수요 증가가 생산을 앞서고 있다는 공통된 이야기를 강조한다.
산업 강세: 은 사이클의 새로운 동력
은은 안전자산이자 산업용 금속이라는 이중 역할로 원자재 중 독특하다.
금이 주로 투자자와 중앙은행 수요에 의존하는 반면, 은은 청정 에너지와 기술 공급망에서의 역할로 혜택을 본다. 태양광 설치는 2025년에 기록적인 수준에 도달할 것으로 예상되며, 전기차 보급도 계속 가속화되고 있다.
분석가들은 재생에너지와 전자제품에서의 수요가 향후 최소 2년간 광산 생산량보다 빠르게 증가할 것으로 추정하며, 2025년에는 34%, 2026년에는 8%의 가격 상승이 예상된다. 현재의 소비가 소폭 증가해도 지속적인 적자로 인해 가격 반응은 크게 나타난다.
은 기술적 통찰
작성 시점에서 은(XAG/USD)은 54.30달러 저항선을 시험하고 있으며, 이는 강한 상승 랠리 후 이익 실현이 증가할 수 있는 주요 구간이다. RSI는 69 근처에서 과매수 구간에 접근 중으로, 매수 모멘텀의 소진 가능성과 단기 조정 또는 되돌림 가능성을 시사한다.
볼린저 밴드는 가격이 상단 밴드를 따라 움직이며 강한 상승 압력을 나타내지만 단기 과열 위험도 내포한다. 54.30달러를 확실히 돌파하면 추가 매수가 유입되어 새로운 고점을 목표로 할 수 있다.
그러나 이 수준을 넘지 못하면 47.00달러 지지선으로 되돌림이 발생할 수 있으며, 이 구간에서 매수세가 재등장할 수 있다. 그 아래로는 이전 누적과 관련된 더 깊은 지지 구간인 41.28달러가 다음 주요 수준이다.

은의 위험과 잠재적 반전
강한 전망에도 불구하고 몇 가지 위험이 남아 있다:
- 미국 경제 지표 강세로 달러가 반등하면 일시적으로 상승세가 제한될 수 있다.
- 산업 회복 지연 또는 재생에너지 보급 감소가 수요 성장 둔화를 초래할 수 있다.
- 단기 이익 실현으로 50~52달러 구간에서 변동성이 발생할 수 있다.
그러나 이러한 현상은 추세 반전보다는 일시적 조정일 가능성이 크다. 타이트한 공급 상황과 견고한 산업 펀더멘털이 시장의 견고한 바닥을 제공한다.
은 전망: 실체에 기반한 랠리
은의 상승은 투기보다는 구조적 변화에 관한 것이다. 통화 정책이 완화적으로 전환되고 산업 수요가 가속화됨에 따라 시장은 반응적 거래에서 장기 재평가로 전환하고 있다.
분석가들은 2025년에도 은 가격이 온스당 50달러 이상을 유지할 것으로 예상하며, 금리 인하가 현실화되고 산업 활동이 안정되면 10월의 54달러 고점을 재시험할 가능성이 있다. 거시경제 완화, 녹색 에너지 확장, 공급 적자의 조합이 이번 랠리에 지난 10년간 가장 신뢰할 만한 기반을 제공한다.
간단히 말해, 공포가 촉발했지만 이제는 펀더멘털이 이를 주도하고 있다.

인공지능, 전기차, 에너지 수요 증가가 구리를 차세대 석유로 만들 것인가?
구리는 산업용 원자재에서 에너지 및 기술 전환을 뒷받침하는 전략적 자원으로서 글로벌 경제에서의 역할이 변화하고 있습니다.
네 - 그리고 데이터가 점점 더 이러한 견해를 뒷받침하고 있습니다. 구리는 산업용 원자재에서 에너지 및 기술 전환을 뒷받침하는 전략적 자원으로서 글로벌 경제에서의 역할이 변화하고 있습니다. 런던 금속 거래소(LME)에서 톤당 약 11,000달러 근처에서 거래되고 있으며, 2025년 1월 이후 약 27% 상승했는데, 이는 AI 데이터 센터, 전기차(EV), 재생 에너지 인프라 수요가 급증한 결과입니다.
글로벌 공급이 수요를 따라가지 못하는 상황에서, 분석가들은 구리가 20세기 석유만큼 현대 성장에 중심적인 역할을 곧 하게 될 것으로 보고 있습니다. 고전압 전력망부터 디지털 시대의 AI 서버까지 모든 것을 구리가 지원할 것입니다.
주요 요점
- 구리 가격은 AI 데이터 센터, 전기차, 재생 에너지 프로젝트 수요에 힘입어 기록적인 고점 근처에 머물고 있습니다.
- 칠레와 페루의 공급 차질, 광석 품위 하락 및 프로젝트 지연이 글로벌 생산을 긴축시키고 있습니다.
- 연금 및 국부펀드의 기관 자금 유입으로 구리는 전략적 투자 자산으로 변모했습니다.
- JPMorgan은 2026년 초까지 구리 가격이 톤당 12,000달러에 이를 것으로 예상하며, Morgan Stanley는 2029년까지 공급 적자가 심화될 것으로 전망합니다.
- 무역 정책 불확실성과 신중한 Fed 정책이 단기 변동성을 초래할 수 있으나, 구조적 펀더멘털은 매우 강세를 유지하고 있습니다.
구리 공급 부족과 급증하는 수요
이전 원자재 호황과 달리, 구리 랠리는 투기적 현상이 아니라 깊고 구조적인 불균형에 대한 반응입니다. 전 세계 생산은 여전히 어려움을 겪고 있으며, 남미 전역의 노동 파업, 기상 악화, 인프라 병목 현상으로 약 6%의 공급이 현재 중단된 상태입니다.
세계 구리 생산량의 약 40%를 차지하는 칠레와 페루는 심각한 운영 압박에 직면해 있습니다. 손상된 물류망, 지연된 유지보수 일정, 제한된 운송 능력으로 광석 이동이 제한되고 있으며, 노후된 제련소는 용량 이하로 가동되고 있습니다.
여기에 지질학적 문제도 더해집니다. 새로운 구리 광상은 광석 품위가 낮아지고 있는데, 일반적으로 0.3~0.8% 구리 함량으로, 과거 수십 년간의 2~5%에 비해 현저히 낮습니다. 이는 광산업자들이 동일한 금속 생산량을 위해 더 많은 암석을 처리해야 하며, 비용과 환경적 영향이 모두 증가함을 의미합니다.
한편, 광산 개발 기간은 7년에서 18년으로 늘어나, 새로운 공급이 증가하는 수요에 신속히 대응하는 것을 제한하고 있습니다. Morgan Stanley는 2026년에 전 세계적으로 59만 톤의 공급 적자를 예측하며, 2029년에는 110만 톤으로 확대되어 20년 만에 최대 적자가 될 것으로 전망합니다.

구리 수요 혁명: AI, 전기차, 청정 에너지
향후 10년간 구리 수요는 건설이나 전통 제조업에서 나오지 않고, 글로벌 에너지 및 데이터 전환을 지원하는 기술에서 나올 것입니다.
AI 데이터 센터는 주요 신규 수요원으로 부상했습니다. 미국 에너지부와 Lawrence Berkeley National Laboratory의 연구에 따르면, 데이터 센터는 2028년까지 미국 전체 전력 소비의 6.7%에서 12%를 차지할 수 있으며, 이는 2023년의 4.4%에서 증가한 수치입니다. 모든 신규 시설은 케이블, 변압기, 전력 분배를 위해 막대한 양의 구리를 필요로 합니다.
전기차(EV)도 성장의 핵심 동력입니다. 각 전기차에는 약 40~50킬로그램의 구리가 포함되어 있는데, 이는 내연기관 차량의 약 4배에 해당합니다. 전 세계적으로 EV 생산이 확대됨에 따라 자동차 제조에서 구리의 역할이 빠르게 커지고 있습니다.
한편, 재생 에너지 부문, 특히 풍력과 태양광 발전은 전례 없는 구리 수요를 흡수하고 있습니다. 단일 2~3메가와트 해상 풍력 터빈은 발전기 코일, 배선, 제어 시스템에 걸쳐 5~7톤의 구리를 사용합니다. 전력망 현대화와 배터리 저장 투자도 구리 수요를 더욱 증가시키고 있습니다.
이러한 요인들이 결합되어 많은 분석가들이 ‘세대에 한 번 있는 수요 전환’이라고 부르는 현상을 촉진하고 있으며, 구리를 전기화, 디지털화, 탈탄소화 사이의 핵심 연결고리로 자리매김하게 하고 있습니다.
구리의 모멘텀: 산업 금속에서 전략 자산으로
구리는 더 이상 단순한 산업 금속이 아니라 금융 및 전략 자산이 되었습니다. 런던 금속 거래소는 여전히 글로벌 가격의 주요 기준이지만, 2025년 내내 구리 선물과 ETF 거래량이 급증했습니다.
연금 펀드와 국부펀드를 포함한 기관 투자자들은 글로벌 에너지 전환에 대한 헤지 수단으로 구리 노출을 확대하고 있습니다. 이러한 기관 수요는 기존 공급 압박을 가중시키며, 가격 상승이 추가 자본 유입을 유도하는 피드백 루프를 형성하고 있습니다.
상품 전략가들은 이 사이클이 자기 강화적이라고 지적합니다: “적자가 지속되는 한, 투자자들은 부족분을 계속 매수할 것”이라고 한 분석가는 말했습니다.
Deriv MT5에서는 트레이더들이 고급 차트와 기술 지표를 통해 구리 가격 움직임(XCU/USD)을 직접 모니터링할 수 있어, 전문 거래 환경에서 사용되는 기관급 분석 도구에 접근할 수 있습니다.
구리 관세, 정책, 그리고 Fed의 신중함
강력한 펀더멘털에도 불구하고, 구리의 단기 성과는 여전히 무역 및 통화 정책의 영향을 받고 있습니다.
올해 초 트럼프 행정부의 정제 구리에 대한 관세 정책 변화는 CME와 LME 벤치마크 간 변동성을 초래했습니다. 관세가 처음 제안되었을 때, 수입업자들이 공급 확보에 서두르면서 미국 구리 가격이 급등했습니다. 정제 구리가 면제되자 가격은 조정되었지만, 이 격차는 정치적 위험이 금속 시장을 움직이는 방식을 보여주었습니다.
2026년 관세 재검토는 주요 위험 이벤트로 남아 있으며, 면제가 해제될 경우 추가 혼란이 예상됩니다. BCA Research의 Roukaya Ibrahim 같은 분석가들은 “정제 구리에 대한 관세 가능성이 시장에 계속 영향을 미칠 것”이라며 미국 가격이 프리미엄을 유지할 것으로 보고 있습니다.
한편, Federal Reserve의 금리 인하에 대한 신중한 태도는 단기적으로 상품에 대한 투기적 자금 유입을 둔화시켰습니다. 그러나 장기 투자자들에게는 구리 공급의 구조적 긴축이 단기 정책 소음을 압도하고 있습니다.
구리 투자 전망: 12,000달러 돌파 및 그 이상으로 가는 길
JPMorgan Chase는 구리 가격이 2026년 초까지 톤당 12,000달러에 도달할 수 있다고 전망하며, 이는 현재 수준에서 11% 상승한 수치입니다. 이 강세 전망은 다음에 기반합니다:
- 재생 에너지, 전기차, AI 인프라에 대한 투자 확대.
- 주요 생산자의 단기 공급 대응 제한.
- 긴 광산 개발 주기로 인한 신규 생산 지연.
- 상품 노출에 대한 지속적인 기관 수요.
마찬가지로 Morgan Stanley는 시장이 22년 만에 가장 심각한 적자에 진입할 것으로 예상하며, Goldman Sachs는 구리를 “산업 금속 복합체에서 가장 매력적인 장기 기회”라고 평가했습니다.
이러한 전망이 현실화된다면, 구리는 일시적인 거시경제 둔화에도 불구하고 톤당 10,000달러 이상의 새로운 가격 하한선을 유지할 수 있을 것입니다.
구리 기술적 분석
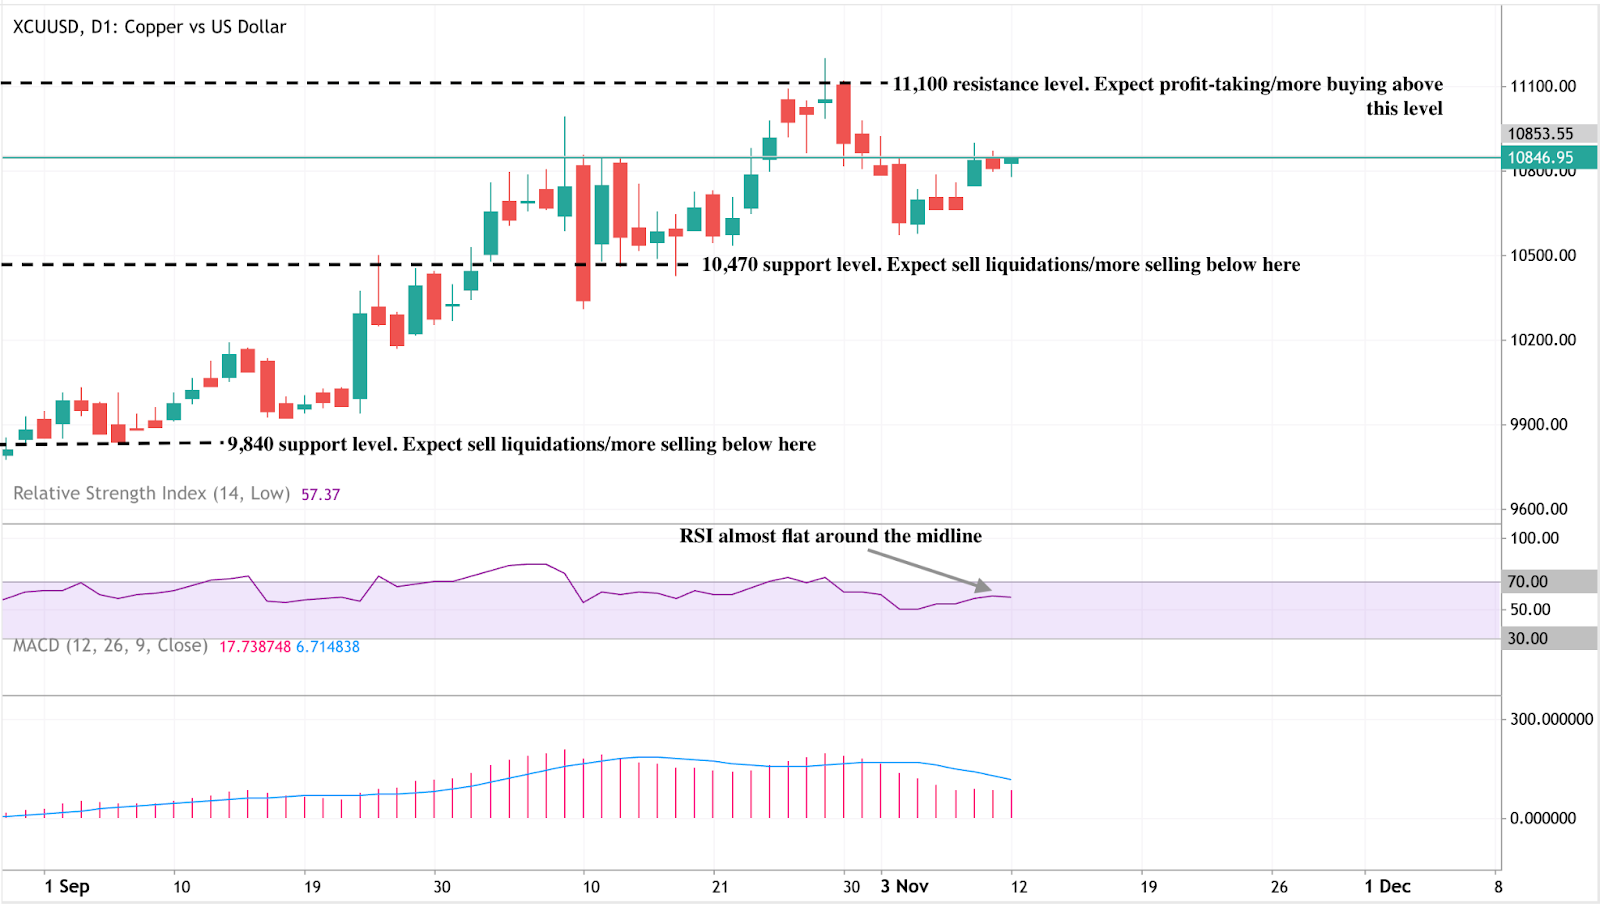
작성 시점에서 구리(XCU/USD)는 10,850 근처에서 거래되며, 10,470의 주요 지지 구간과 11,100의 저항선 사이에서 횡보하고 있습니다. 11,100을 돌파하면 강세 모멘텀이 재개될 수 있으며, 10,470 아래로 하락하면 추가 매도 압력이 발생할 수 있습니다. 다음 하단 지지는 약 9,840에 위치하며, 투자 심리가 위험 회피로 전환될 경우 추가 청산이 일어날 수 있습니다.
RSI는 약 57로 중간선 근처에서 거의 평탄하여 중립적 편향을 나타내며, 과매수나 과매도 상태가 아님을 시사합니다. 이는 시장이 관망 모드에 있으며 모멘텀이 명확한 방향성을 결여하고 있음을 의미합니다.
한편, MACD 선은 신호선 위에 약간 위치하지만 모멘텀이 약화되고 있어 강세 추진력이 약해지고 있음을 반영합니다. MACD가 신호선 아래로 교차하면 단기 약세 심리를 확인할 수 있습니다.
트레이더들은 Deriv 거래 계산기를 사용하여 구리 및 기타 금속 거래 시 증거금 요구 사항과 수익 잠재력을 추정할 수 있습니다. 상품 거래 전략에 대한 이해를 심화하려면 Deriv의 상세한 상품 거래 가이드를 탐색해 보세요. 초보자와 고급 트레이더 모두에게 적합합니다.
구리의 단기 변동성 대 장기 확신
강세 장기 추세에도 불구하고 단기 역풍은 계속되고 있습니다. 중국 부동산 부문의 둔화가 산업 금속에 대한 심리를 압박하고 있으며, 금융 여건의 긴축은 투기적 자금 유입을 지연시킬 수 있습니다.
그러나 분석가들은 장기 펀더멘털이 지지되는 한 가격 조정은 단기간에 그칠 것으로 널리 보고 있습니다. 9,000~9,500달러 구간으로의 조정은 2026년 다음 상승 추세를 대비하는 펀드들에게 매수 기회로 간주됩니다.
분석: 금 가격과 미국 주식의 동반 상승을 이끄는 요인은 무엇인가?
금 가격과 미국 주식의 동반 상승은 다소 이례적입니다. 전통적으로 금은 "안전자산"으로 간주되기 때문입니다.
금 가격과 미국 주식의 동반 상승은 다소 이례적입니다. 전통적으로 금은 경제 불확실기 동안 좋은 성과를 내는 "안전자산"으로 여겨지는 반면, 주식은 경제 성장과 위험 선호도와 더 밀접하게 연관되어 있습니다. 분석가들에 따르면 여러 요인이 두 시장을 동시에 상승시키고 있습니다.
CME의 FedWatch 도구에 따르면 트레이더들은 12월에 25bp 금리 인하 가능성을 63%로 보고 있습니다. 이 단일한 내러티브인 "저렴한 자금"이 보통 반대 방향으로 움직이는 자산들, 즉 고전적인 안전자산인 금과 전통적인 위험 자산인 주식을 모두 끌어올리고 있습니다.
두 시장 모두 경제력보다는 정책 주도 낙관론에 힘입고 있습니다. 약한 고용 데이터, 부진한 소비자 심리, 재정 압박 신호가 트레이더들로 하여금 완화적인 통화 정책을 예상하게 하여 유동성 랠리를 촉진하며 안전과 투기 사이의 경계를 모호하게 만들고 있습니다.
주요 요점
- 금은 온스당 4,100달러 이상을 유지하며 2주 만에 최고 수준에 도달, 트레이더들은 Fed의 완화를 예상하고 있습니다.
- 미국 주식도 금리 인하 기대감에 힘입어 미래 수익 평가가 상승하며 오르고 있습니다.
- 이번 랠리는 성장보다는 유동성 신뢰를 반영하며, 기본적 요인보다는 중앙은행 주도로 움직이는 시장입니다.
- 재정 불안과 상승하는 미국 국채 수익률이 금에 대한 두 번째 지지층을 형성하고 있습니다.
- 인도와 중앙은행의 강한 실물 수요가 투기적 물결 아래에서 가격을 지지하고 있습니다.
Fed 금리 인하 기대가 금과 미국 주식을 견인하다
이번 공동 랠리는 명확한 거시경제 변화에서 비롯되었습니다. 최근 미국 경제 지표는 모멘텀 상실을 시사합니다. 10월 민간 고용이 약화되고 정부 및 소매 고용이 감소했으며 소비자 심리는 수개월 만에 최저치로 떨어졌습니다. 시장은 이를 Fed가 12월 금리 인하로 전환할 것이라는 확인으로 해석했습니다.
금리 인하는 시장 양쪽에 동시에 영향을 미칩니다:
- 주식 시장에는 차입 비용을 낮추고 기업 수익의 현재 가치를 높입니다.
- 금 시장에는 수익을 내지 않는 자산 보유의 기회비용을 줄입니다.
결과는 동기화된 상승세입니다. 투자자들은 안전과 위험 중 하나를 선택하는 것이 아니라, 완화적 통화 정책의 귀환이라는 하나의 기대에 의해 두 자산을 모두 매수하고 있습니다.
Deriv MT5의 트레이더들에게 이 교차 자산 역학은 지수, 원자재, 금속의 변동성이 동일한 정책 신호에 반응함에 따라 새로운 다각화 기회를 창출했습니다.
미국 재정 정책, 숨겨진 동력으로 재부상
미국 정부 셧다운과 그 임시 해결책은 재정 안정성에 대한 관심을 높였습니다. 상원의 초당적 타협으로 정부가 재개되었고, 도널드 트럼프 대통령의 지지를 받아 단기 시장 스트레스는 완화되었지만 미국의 장기 부채 문제를 투자자들에게 상기시켰습니다.
Saxo Bank의 Ole Hansen은 “경제력보다는 재정 불안에 의해 상승하는 수익률이 역사적으로 투자 금속에 우호적이었다”고 지적했습니다. 이 맥락에서 높은 채권 수익률은 강한 경제가 아니라 부채 지속 가능성에 대한 우려를 반영하며, 재정 불확실성에 대한 헤지로서 금 보유의 근거를 강화합니다.
정부 기관의 재개는 공식 경제 데이터 접근성을 회복시켜 시장에 더 큰 명확성을 제공할 것입니다. 그러나 그 데이터가 경기 둔화를 확인할 가능성이 높아 트레이더들은 Fed의 추가 조치 필요성을 더욱 확신하고 있습니다.
금과 주식: 드문 동반 급등
금과 주식은 전통적으로 반대 방향으로 움직입니다. 하나는 공포를, 다른 하나는 신뢰를 나타냅니다. 그러나 2025년 시장 행태는 두 자산 모두 유동성 기대의 표현임을 시사합니다.
투자자들이 통화 완화를 예상할 때, 저렴한 자금의 혜택을 받는 모든 자산, 금에서 성장 기술주까지가 랠리를 펼칩니다. 이러한 상관관계 변화는 시장 작동 방식의 구조적 변화를 강조하며, 정책 기대가 기본적 요인을 넘어 주요 가격 결정 요인이 되었습니다.
미국 달러가 강세를 보이면서도 금이 상승하는 현상은 이러한 변화를 더욱 강화합니다. 통화 역학은 글로벌 자산 가격 책정에서 중앙은행 정책의 지배력에 의해 가려지고 있습니다.
금 수요가 랠리에 깊이를 더하다
투기적 내러티브를 넘어, 금 상승은 강력한 실물 수요에 의해 뒷받침되고 있습니다. 특히 인도와 중앙은행에서 실물 수요가 견고합니다:
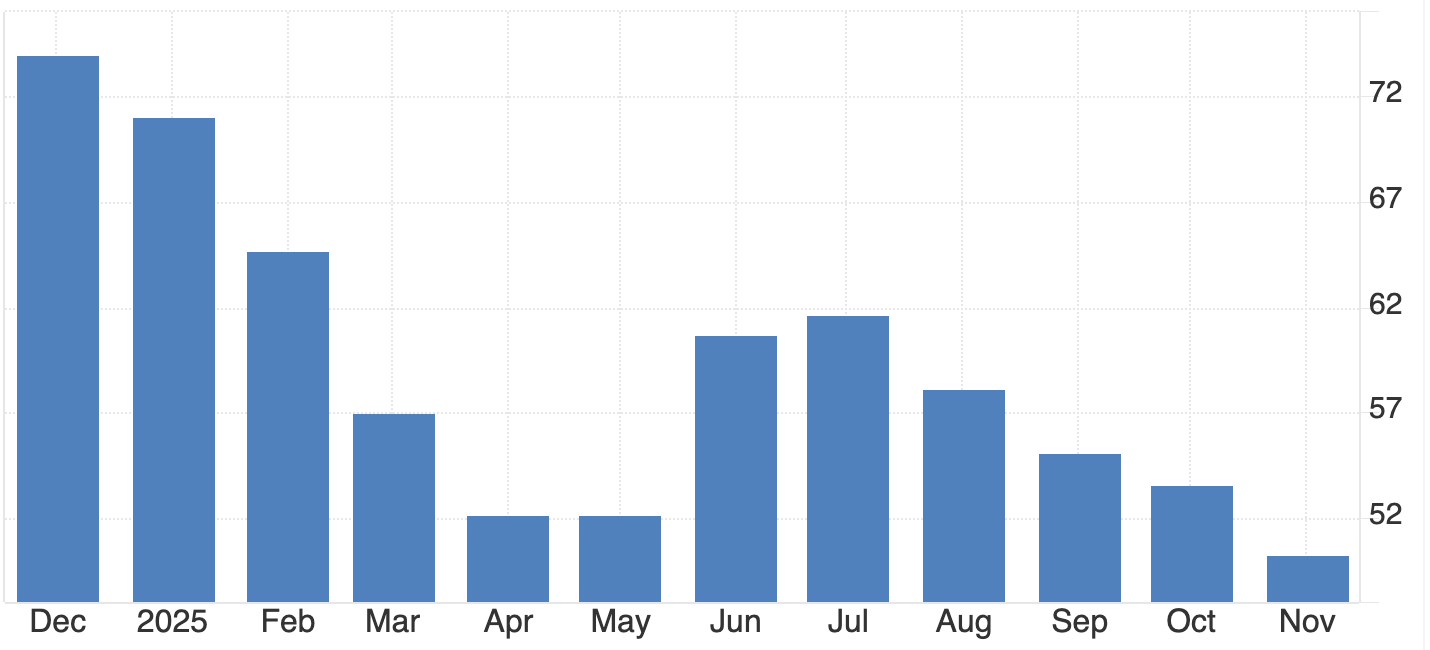
- 인도의 금 ETF 유입액은 2025년 첫 10개월 동안 29억 달러에 달했으며, 이는 26톤의 금에 해당하며 2020년부터 2024년까지의 총량과 거의 맞먹습니다.
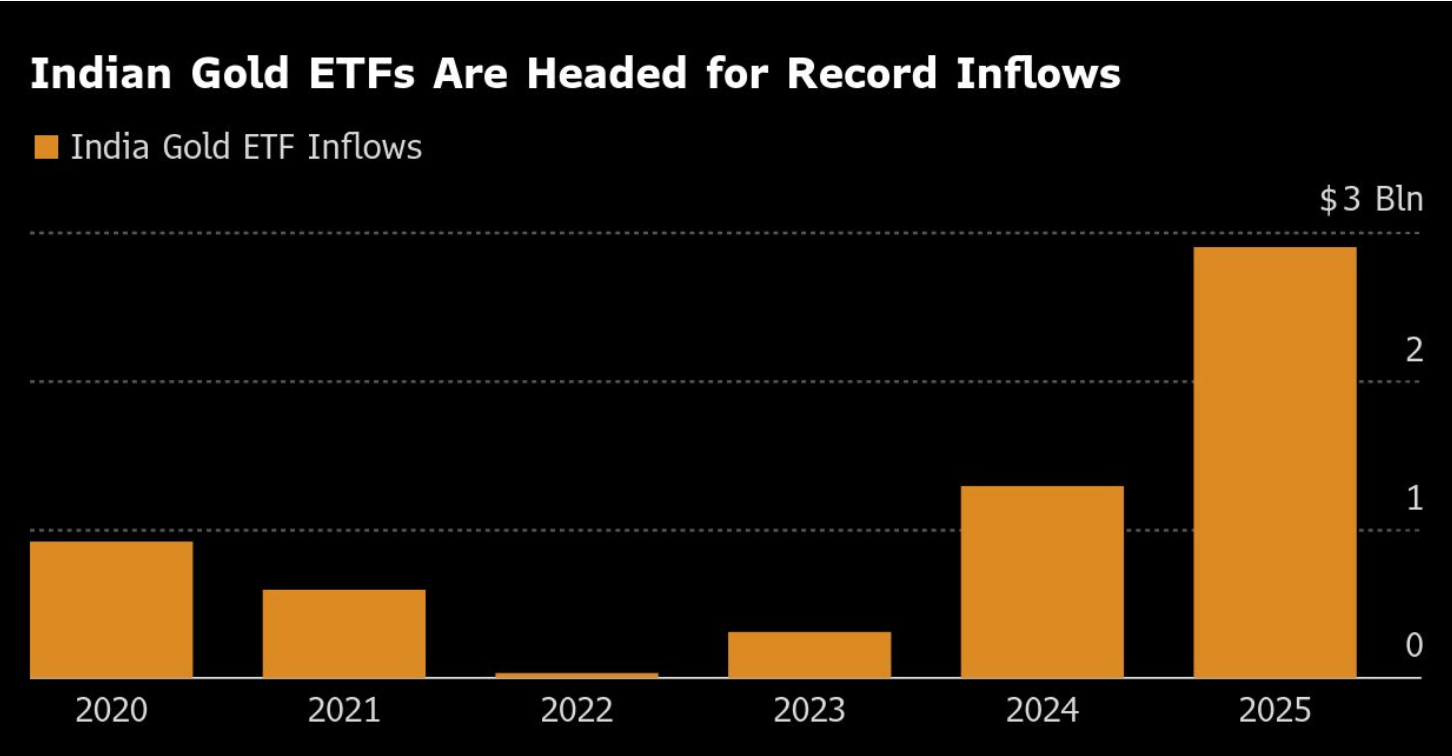
- 10월 한 달에만 8억 5천만 달러의 신규 유입이 있었으며, 9월의 기록적인 9억 4,200만 달러에 이은 수치입니다.
- 인도의 총 ETF 보유량은 현재 83.5톤으로, 110억 달러 이상의 가치를 지닙니다.
이 수요는 랠리가 순수한 투기적 현상이 아님을 시사합니다. 이는 통화 및 재정 불확실성에 대한 대응책으로서 금에 대한 진정한 글로벌 수요를 반영합니다.
금 채굴업체, 투자자 신뢰를 반영하다
금 시장의 기업 측면도 이러한 심리를 반영합니다. 세계 최대 생산업체 중 하나인 Barrick Gold(ABX.TO)는 조정된 이익 호조를 보고한 후 분기 배당금을 25% 인상하고 5억 달러 규모의 자사주 매입 프로그램을 확대했습니다.
- 평균 실현 금 가격: 온스당 3,457달러, 전년 2,494달러에서 상승.
- 생산량은 943,000온스에서 829,000온스로 감소했으나, 전반적인 유지 비용은 온스당 1,538달러로 소폭 상승.
운영상의 어려움과 말리 광산 손실과 관련된 10억 달러의 손실 처리에도 불구하고, Barrick의 북미 생산으로의 전략적 전환은 높은 금 가격이 지속될 것이라는 자신감을 나타냅니다.
그러나 직원 구금과 수출 제한을 포함한 말리 분쟁은 글로벌 금 공급의 지정학적 취약성을 강조하며, 해결되지 않을 경우 시장을 더욱 긴축시킬 수 있는 요인입니다.
시장 배경: 부채, 수익률, 그리고 정책의 역설
금의 올해 50% 이상의 상승은 단순한 인플레이션 우려 때문만은 아닙니다. 이는 재정 취약성과 시장의 유동성 의존성에 대한 반응입니다.
상승하는 국채 수익률은 경제 건강의 신호라기보다는 부채 지속 가능성에 대한 경고입니다. 투자자들은 이러한 구조적 위험에 대한 헤지로 금을 매수하는 동시에, 유동성이 계속 공급될 것이라는 가정 하에 주식도 매수하고 있습니다.
이러한 이중 행동—안전과 위험을 동시에 추구하는 것—이 2025년 시장 심리의 핵심 역설입니다.
앞으로 몇 달간 금과 미국 주식 시나리오
- 강세 돌파
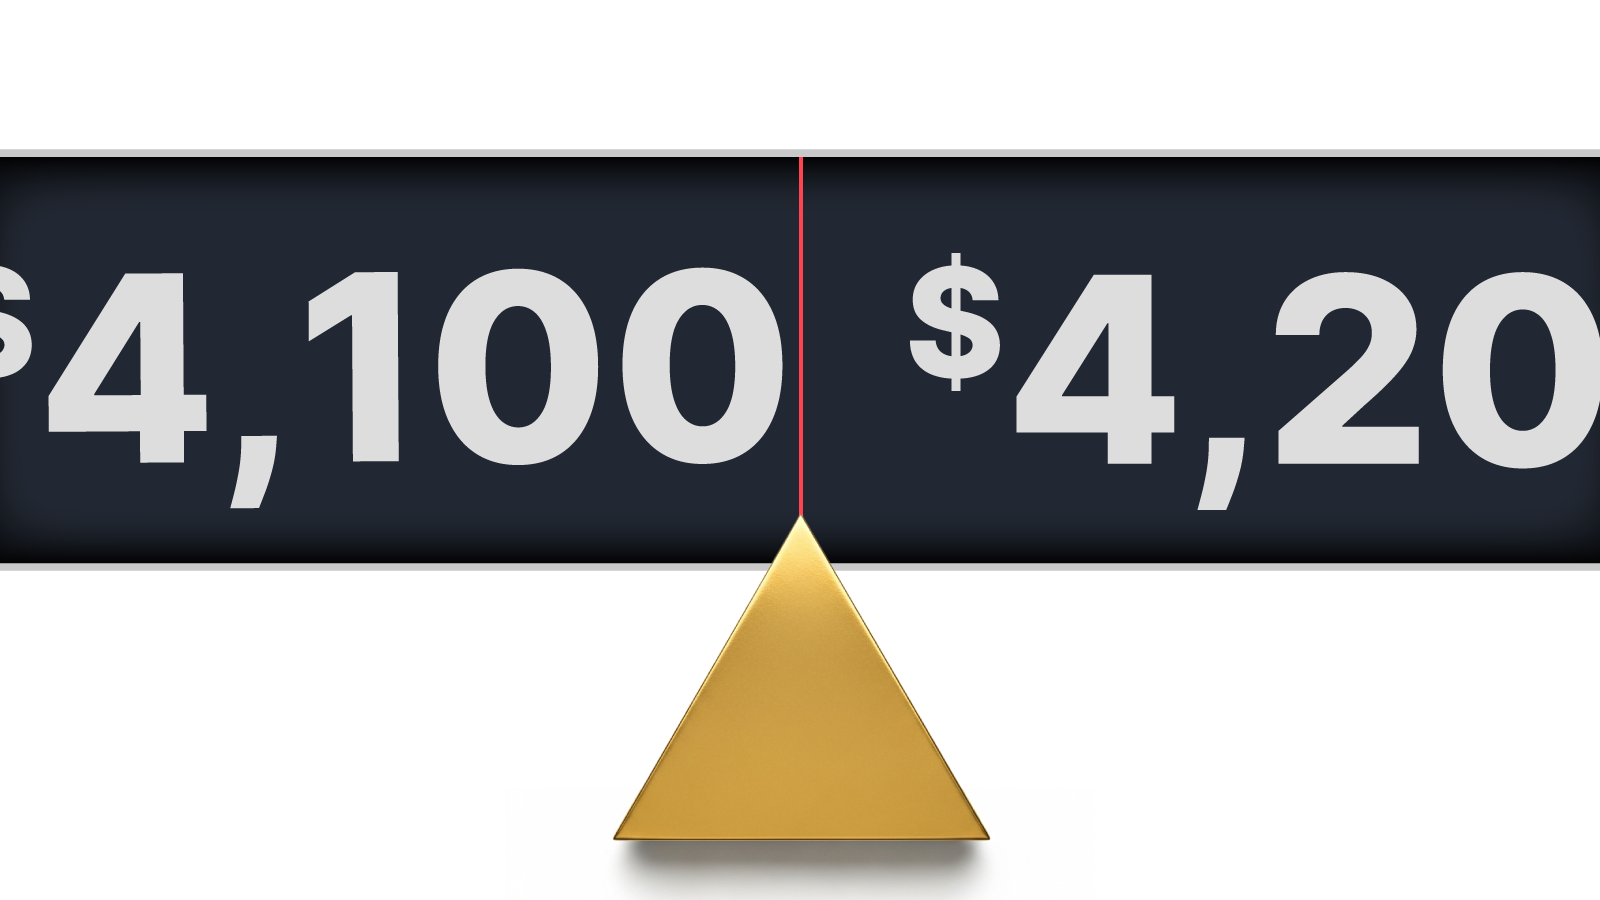
Fed가 12월에 금리를 인하하고 추가 완화를 시사하면, 금은 재정 우려와 안정적인 중앙은행 수요에 힘입어 빠르게 4,200달러를 돌파할 수 있습니다.
- 단기 조정
Fed가 신중하거나 완화 조치를 지연할 경우, 금은 4,050~4,150달러 사이에서 횡보할 수 있으며, 주식은 유동성 기대가 사라질 때까지 상승세를 유지할 가능성이 높습니다.
어느 쪽이든 핵심 요점은 금과 주식이 이제 상반된 감정이 아니라 자금의 가격이라는 동일한 거시경제 동인에 반응하고 있다는 점입니다.
금 기술적 분석
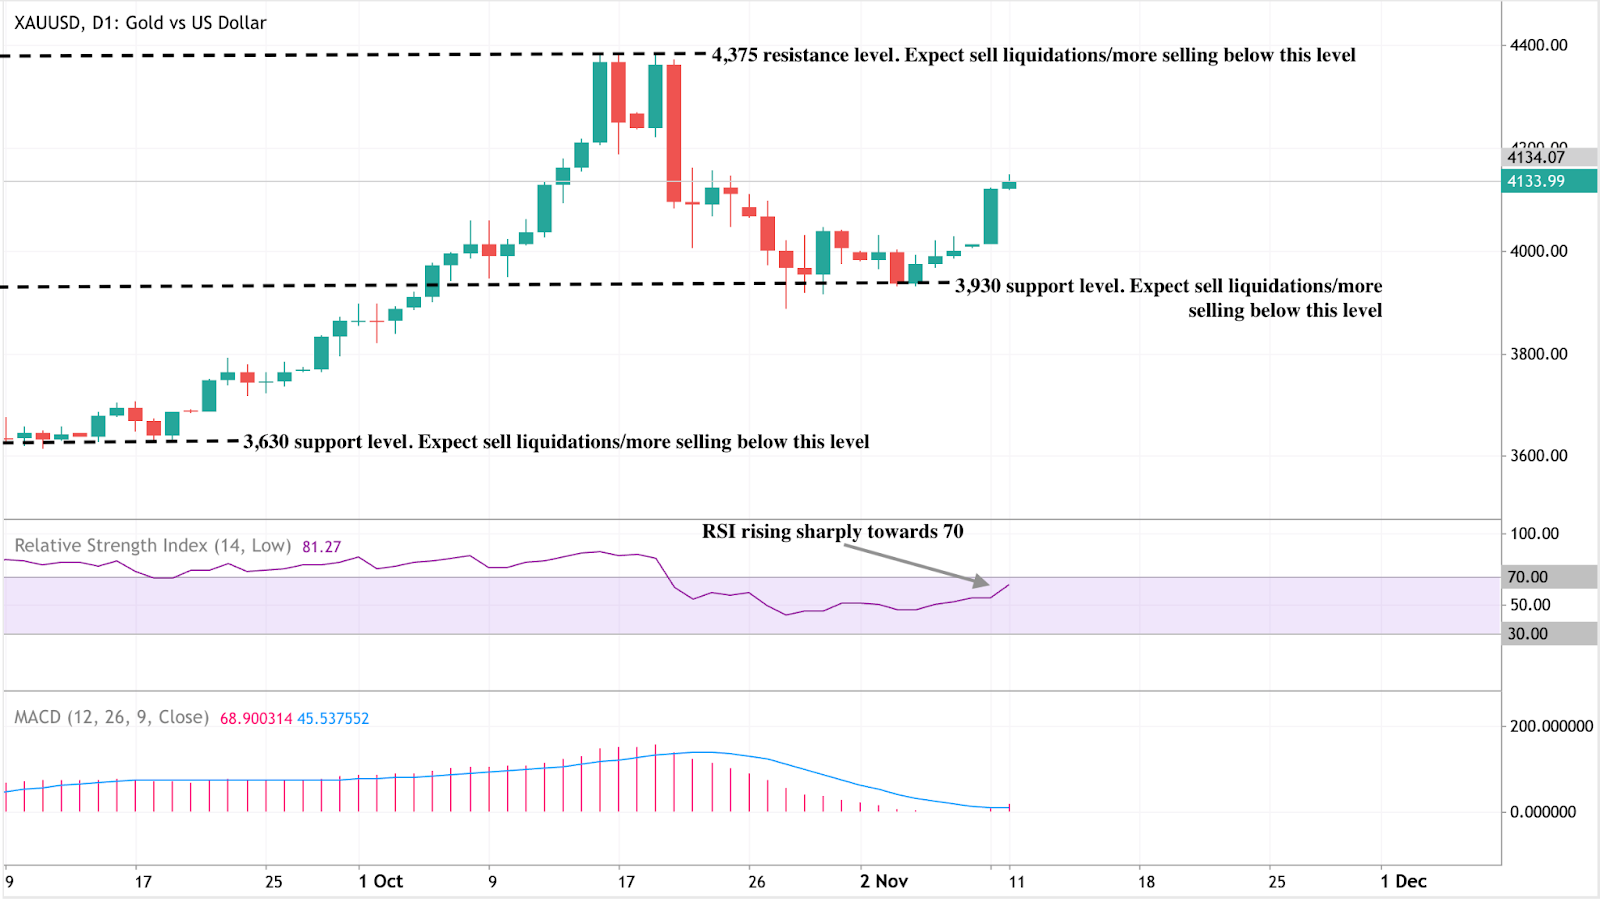
금(XAU/USD)은 약 4,134달러에서 거래되며 주요 저항선 4,375달러와 지지선 3,930달러 사이에서 조정 중입니다. 4,375달러를 돌파하면 랠리가 확장될 수 있으며, 3,930달러 아래로 떨어지면 3,630달러까지 매도세가 재개될 위험이 있습니다.
RSI(81)는 강한 상승 모멘텀을 나타내지만 과매수 상태를 시사하여 단기 조정이나 되돌림 가능성을 보여줍니다. 한편, MACD는 여전히 강세 교차 상태를 유지하며 지속적인 매수 압력을 확인합니다.
전반적으로 금은 3,930달러 이상에서 긍정적 편향을 유지하지만, 트레이더들은 과매수 구간 근처에서 모멘텀 둔화를 주시해야 합니다. Deriv MT5에서 직접 이 수준을 모니터링하거나 Deriv Trading Calculator를 사용해 금속과 지수 전반에 걸친 포지션 계획을 위한 마진 및 리스크 설정을 실험해 볼 수 있습니다.
금 투자 전망
- 단기 트레이더: Fed의 12월 결정 전까지 4,100~4,200달러 구간이 핵심 관전 포인트입니다.
- 중기 투자자: 재정 스트레스, 실질 수익률 변동성, 인도 수요가 지속 강세의 핵심 동인입니다.
포트폴리오 매니저: 금과 주식 간의 진화하는 상관관계는 금이 이제 순수 헤지가 아닌 정책 민감 동반 자산으로 작용함을 의미합니다. 다각화 전략은 이러한 구조적 변화를 고려해야 합니다.

Can a tariff dividend create a new liquidity cycle for Bitcoin in 2025?
Analysts suggest that President Donald Trump’s proposed $2,000 “tariff dividend” has fuelled a wave of market optimism rather than a genuine injection of liquidity.
Yes - but only in sentiment, not in substance. Analysts suggest that President Donald Trump’s proposed $2,000 “tariff dividend” has fuelled a wave of market optimism rather than a genuine injection of liquidity.
The announcement triggered a short-lived crypto rebound, lifting Bitcoin back above $104,000, as traders drew parallels with the 2020 pandemic payments that helped fuel the last major bull run. Yet with limited fiscal backing and political obstacles, many believe this rally may be driven more by sentiment than by substance.
Key takeaways
- Trump’s $2,000 “tariff dividend” prompted a brief rally in Bitcoin and Ethereum, despite serious doubts over its feasibility.
- Funding gap: The proposed payout would cost around $300 billion, but tariff revenues generate only about $90 billion net.
- Institutional demand remains strong, with $2.7 billion in ETF inflows and BlackRock’s IBIT managing close to $100 billion in BTC.
- The Federal Reserve’s 25-basis-point rate cut and improved risk appetite continue to support Bitcoin above the $100K mark.
- Analysts see two paths: A climb towards $120K–$125K if optimism holds, or a slide below $100K once political enthusiasm fades.
- Crypto’s sensitivity to liquidity narratives underscores how sentiment - not policy - often leads market direction.
Trump’s tariff dividend promise and the market reaction
In a Truth Social post, President Trump claimed that the United States was generating “trillions of dollars” from tariffs and could use those funds to both reduce its $38 trillion national debt and finance a “dividend” for most Americans, excluding high earners.
The statement triggered a modest crypto rally as traders priced in the possibility of more household liquidity.
Markets quickly drew comparisons to the pandemic-era stimulus cheques that helped spark a historic bull market. Traders, long conditioned to respond to any hint of fresh money supply, reacted instinctively - even though the policy remains more political talking point than fiscal plan.
Why the maths don’t add up
Despite the excitement, the numbers simply do not work. Fiscal experts note that Trump cannot unilaterally authorise such payments; they require Congressional approval and a new funding bill.
The funding shortfall is also substantial:
- A $2,000 payment for 150 million adults would cost around $300 billion.
- Tariff collections to date total $120 billion, and after factoring in slower economic growth and lower tax receipts, net revenue sits closer to $90 billion.
As Erica York, Vice President of Federal Tax Policy, explained: “Each dollar raised through tariffs offsets about 24 cents in income and payroll tax revenue.” In short, the government lacks both the legal authority and the financial headroom to execute this plan, making any near-term payout highly unlikely.
Stimulus Déjà Vu: Why markets still care
The crypto rally reflects not fiscal reality but liquidity psychology. Even without concrete policy action, the mere suggestion of a “dividend” rekindles traders’ belief in free-flowing money and renewed risk-taking.
This mirrors 2020, when stimulus payments coincided with a surge in Bitcoin and altcoins as retail investors redirected government cheques into digital assets.

Although the scale is smaller this time, the pattern remains: crypto markets respond instantly to liquidity cues - whether real or imagined.
Bitcoin ETF inflows and structural strength
Beyond political headlines, Bitcoin’s structural outlook remains solid. Institutional inflows into U.S. spot Bitcoin ETFs exceeded $2.7 billion in early November, led by BlackRock’s IBIT and Fidelity’s FBTC. IBIT alone now holds $80.47 billion, cementing its position as the fastest-growing ETF in U.S. history.
Macroeconomic conditions are also supportive:
- The Federal Reserve’s 25-basis-point rate cut has lifted risk appetite.
- Trump’s pardon of Binance founder Changpeng Zhao signalled a more conciliatory stance towards crypto.
- Thailand and Malaysia are exploring the inclusion of Bitcoin in national reserves, marking a step towards mainstream adoption.
These developments indicate that even if Trump’s “dividend” proves politically untenable, the underlying liquidity narrative remains alive.
Market impact and price scenarios
If bullish sentiment and ETF inflows persist, Bitcoin could extend towards $120,000, driven by institutional accumulation and looser policy. However, should enthusiasm fade, a pullback below $100,000 remains a possibility as traders reassess the fundamentals.
So far, Bitcoin’s stability above $100,000 reflects confidence from institutional investors - although analysts warn that the rally is driven more by belief than by financial logic.
Bitcoin technical insights
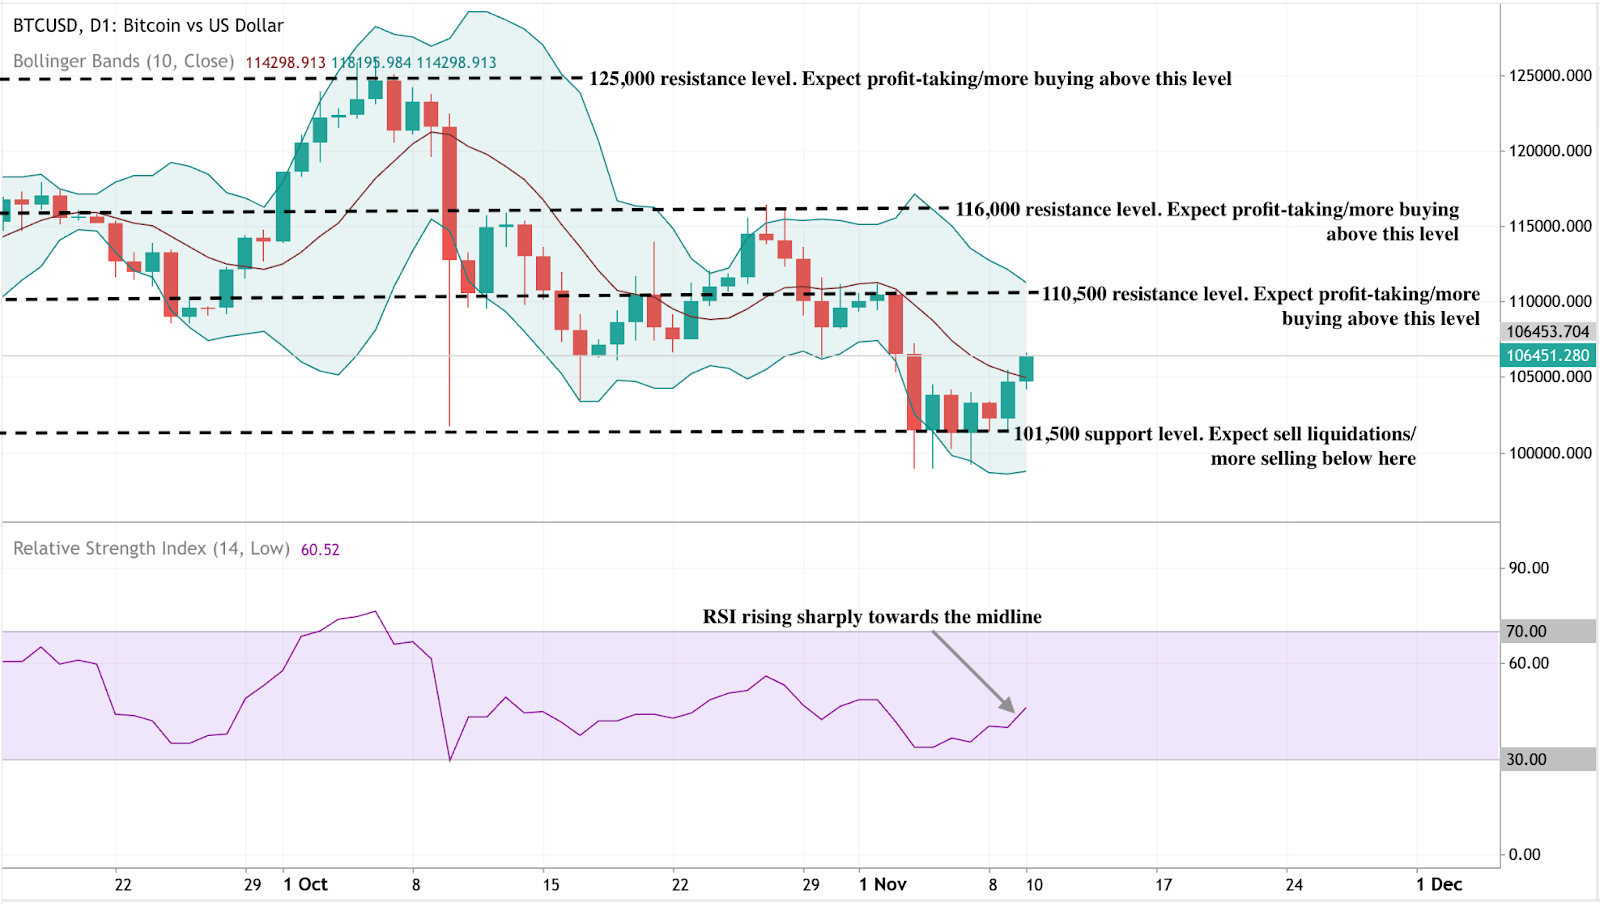
Bitcoin’s price action shows early signs of recovery after holding above the key $101,500 support level, where sellers appear to have exhausted their momentum. This level remains crucial - a decisive break below could trigger further liquidations. On the upside, $110,500 serves as the first major resistance, followed by $116,000 and $125,000, where profit-taking is likely to intensify.
The Bollinger Bands are beginning to narrow after a period of strong volatility, suggesting potential consolidation before the next breakout. The price is also attempting to climb back toward the middle band (the 10-day moving average), signalling an improving short-term outlook.
Meanwhile, the RSI (14) has risen sharply to around 60, pointing to strengthening bullish momentum without yet entering overbought territory. If RSI continues upward past 60–70, it would confirm a shift in market sentiment toward renewed buying pressure.
Investment implications
For traders, sentiment remains the main short-term driver. Bitcoin’s $100K level represents the critical dividing line between bullish conviction and renewed caution.
Those trading crypto through Deriv MT5 can access advanced charting tools and cross-market analysis, making it easier to track correlations between Bitcoin, gold, and the U.S. dollar - especially during policy-driven volatility.
Meanwhile, traders can use the Deriv Trading Calculator to estimate potential profits, required margin, and swap rates before entering a position, ensuring tighter risk control in fast-moving conditions.
- Short term: Tactical buying opportunities exist above $102K–$104K if ETF inflows remain robust.
- Medium-term: Expect volatility tied to political announcements and monetary policy signals.
Long-term: Institutional accumulation and steady global adoption continue to underpin a structurally bullish outlook, even if near-term hype cools.

Is Filecoin’s price surge the start of a broader crypto market recovery?
According to experts, Filecoin’s 50% surge could mark the early stages of a broader recovery across the cryptocurrency market, driven by renewed interest in utility-based blockchain assets.
According to experts, Filecoin’s 50% surge could mark the early stages of a broader recovery across the cryptocurrency market, driven by renewed interest in utility-based blockchain assets. The decentralised storage token’s sharp rebound above the $2 level has placed it at the forefront of the DePIN (Decentralised Physical Infrastructure Network) rally - a niche sector that has gained roughly 11% overall in recent days.
Analysts point to rising network activity, strong developer funding, and growing institutional focus on real-world blockchain utilities as reasons why Filecoin’s latest move may represent more than just a speculative bounce. Still, whether the rally extends further will depend on broader market sentiment and sustained adoption within the decentralised storage ecosystem.
Key takeaways
- Filecoin leads crypto recovery: Up over 50% in 24 hours, Filecoin is outperforming most major tokens and driving gains in the DePIN sector.
- DePIN sector strength: Decentralised infrastructure projects have collectively gained 11%, signalling investor interest in tokens with tangible use cases.
- Ecosystem investment expanding: Protocol Labs has launched RetroPGF Round 3, allocating 585,000 FIL to support developer projects from November 2024 to September 2025.
- Market capitalisation: Filecoin’s valuation now stands at $1.52 billion, ranking it among the top 50 public blockchains.
- A short-term focus on maintaining momentum above $2 could pave the way for a move to $3, a key technical resistance level.
- Long-term outlook: Experts see Filecoin as a leading project in the growing Web3 infrastructure and decentralised storage economy.
Filecoin rally leads the market’s structural recovery
Filecoin’s performance is part of a broader market trend where investors are shifting capital towards utility-based projects - tokens that provide real-world functionality. Within this trend, DePIN networks stand out. These projects bridge physical resources such as computing power, energy, and data storage with blockchain incentive mechanisms, creating measurable productivity within decentralised systems.
The DePIN sector’s 11% rise reflects a shift in sentiment from speculative trading towards functional blockchain services. Filecoin’s 50% rally to above $2.00 has cemented its status as the flagship token for decentralised storage and one of the strongest indicators that the market is rediscovering value in blockchain infrastructure.

Filecoin vs traditional cloud storage
Launched in October 2020 by Protocol Labs, Filecoin provides a peer-to-peer marketplace for data storage. It enables users to rent out unused hard drive space, earning FIL tokens in exchange. Unlike traditional storage services such as Google Drive, iCloud, or Dropbox, Filecoin’s system operates without a central authority - meaning that pricing, availability, and access are determined entirely by the network.
The system relies on two unique consensus mechanisms:
- Proof-of-Replication (PoRep): Verifies that storage providers hold exact copies of the data they claim to store.
- Proof-of-Spacetime (PoSt): Confirms that the data remains stored for the entire agreed period.
Together, these mechanisms make Filecoin’s network verifiable, secure, and tamper-resistant, addressing long-standing challenges in data storage trust and transparency.
Decentralised storage: From research to real-world impact
Filecoin’s origins date back to 2014, when Protocol Labs developed the InterPlanetary File System (IPFS) - a decentralised file-sharing protocol designed to replace centralised web servers. Filecoin was later introduced as the economic layer of IPFS, incentivising users to store and maintain data using blockchain rewards.
In August 2017, Filecoin completed one of the largest token offerings in crypto history, raising $257 million in its Initial Coin Offering (ICO). Major investors, including Sequoia Capital, Union Square Ventures, and Digital Currency Group, backed the project.
By the time its mainnet launched in October 2020, Filecoin had become one of the most anticipated blockchain networks globally. Its price soared to an all-time high of $236.97 in 2021 before correcting sharply alongside the broader market downturn. Despite that decline, the network has continued to expand and maintain strong developer interest, positioning it as one of the most credible decentralised storage solutions in the Web3 space.
Filecoin’s ecosystem expansion reinforces fundamentals
While price volatility has dominated headlines, Filecoin’s ecosystem growth has been quietly strengthening. Protocol Labs recently launched RetroPGF Round 3, allocating 585,000 FIL to projects that contributed to the ecosystem between late 2024 and 2025.
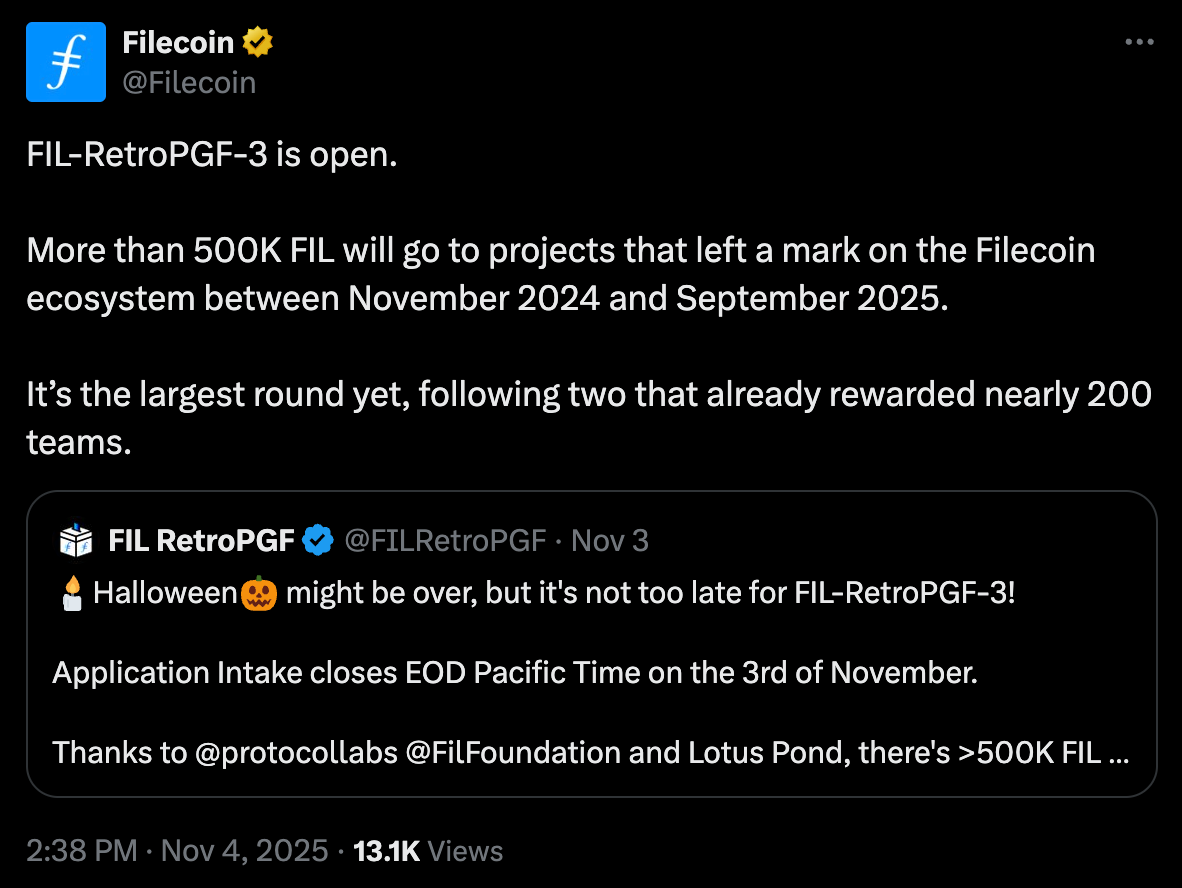
This round follows two earlier programmes that rewarded nearly 200 development teams, supporting innovations in decentralised computing, data retrieval, and dApp integration. The funding initiative underscores Filecoin’s commitment to sustainable growth - a key differentiator in a market often driven by short-term speculation.
Such ecosystem support not only encourages innovation but also signals confidence to institutional investors who are increasingly assessing Web3 infrastructure projects as long-term opportunities.
Market outlook: Can Filecoin sustain momentum?
Breaking past the $2 psychological level marks a pivotal moment for Filecoin. The next major resistance sits near $3, a level last tested in mid-2023. Technical analysts suggest that continued momentum could propel prices toward this mark if trading volumes remain high and the DePIN rally sustains.
However, Filecoin still trades far below its 2021 highs, underscoring both its potential for recovery and its vulnerability to market sentiment. Short-term corrections are possible as traders take profits, but experts say the latest surge is supported by more robust fundamentals than previous speculative rallies.
With a market cap of $1.52 billion and growing integration across decentralised applications, Filecoin is viewed as a key player in Web3’s evolving infrastructure layer. Its combination of utility, decentralisation, and developer support could allow it to benefit from the next major rotation into functional crypto assets.
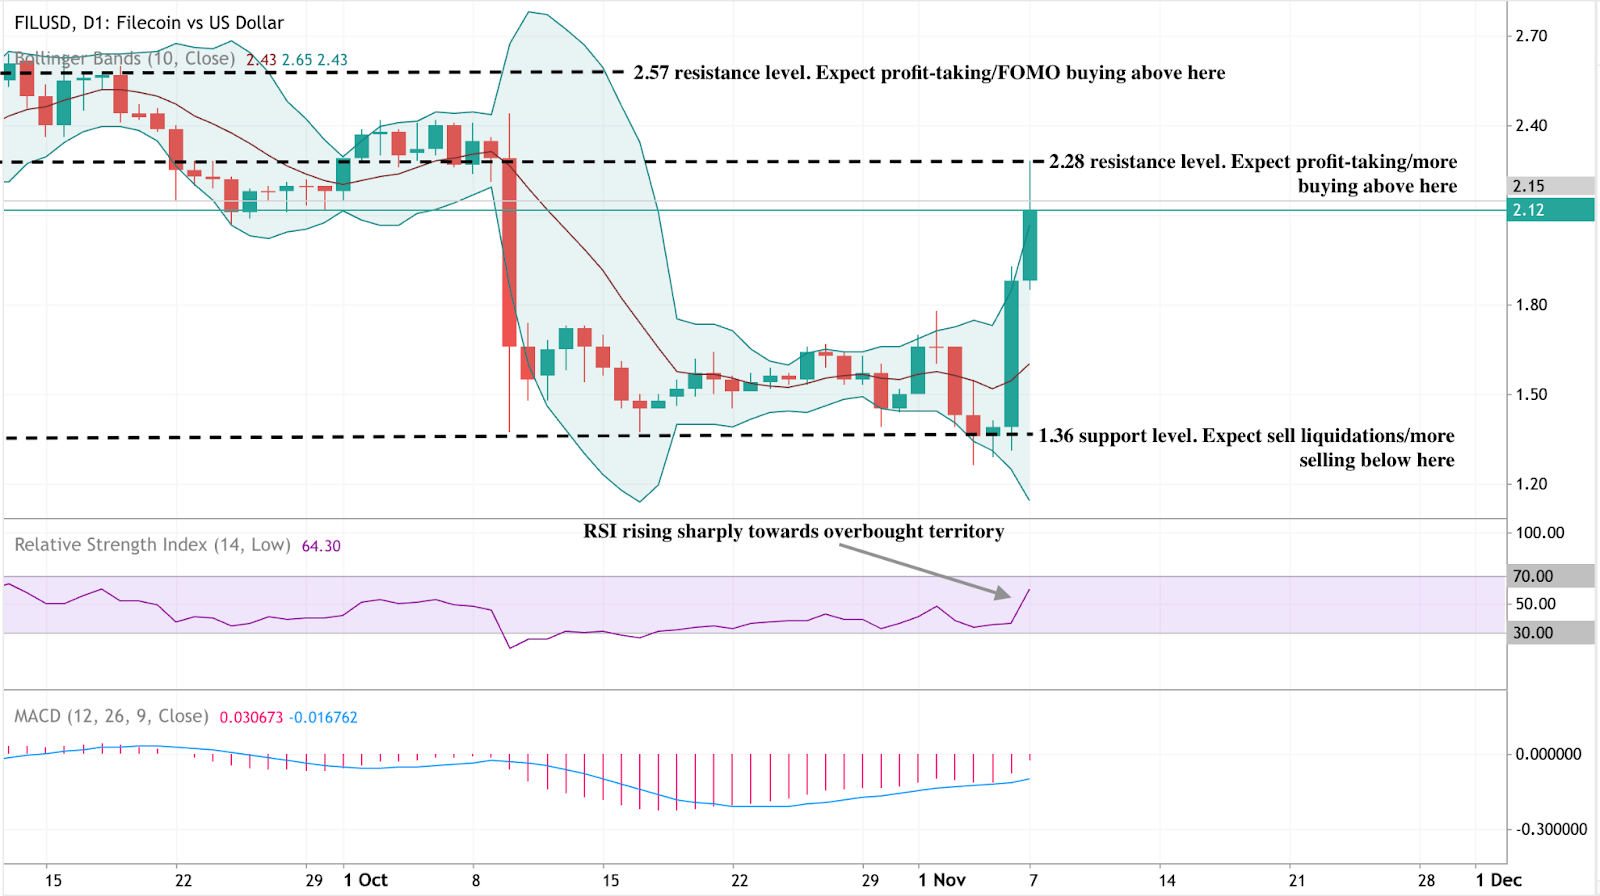
Filecoin technical analysis
At the time of writing, Filecoin (FIL/USD) is trading around $2.12, extending its rally after rebounding from the $1.36 support level. The Bollinger Bands have expanded, reflecting heightened volatility, with price now testing the upper band - often a sign of short-term exhaustion. The RSI, at 64.3, is rising sharply toward the overbought zone, suggesting momentum remains strong but could soon face a cooling period.
Meanwhile, the MACD has turned positive with a fresh bullish crossover, reinforcing the current uptrend. However, traders should monitor momentum closely as the histogram begins to flatten. The next key resistance levels sit at $2.28 and $2.57, where profit-taking or renewed buying may occur. On the downside, $1.36 remains the critical support level - a break below it could trigger another wave of selling.
To explore and analyse these setups in real-time, traders can track Filecoin price action directly on Deriv MT5, which provides advanced charting tools, indicators, and multi-asset trading access for crypto, forex, and commodities markets.
Filecoin’s short-term outlook is bullish but nearing overbought territory, hinting at a potential cooldown if resistance levels hold.
Filecoin investment implications
For traders, Filecoin’s recent breakout offers short-term momentum opportunities above the $2 level, with upside potential towards $3 if DePIN sector strength continues. Caution remains warranted given crypto market volatility, but the technical setup favours buyers as long as Filecoin holds its newly reclaimed support zone.
For long-term investors, Filecoin stands out as one of the few blockchain networks with clear real-world use cases. Its robust developer base, institutional backing, and role in the decentralised data economy make it an appealing bet on the future of Web3 infrastructure.
Competition from centralised cloud giants and other blockchain storage protocols could cap growth if adoption plateaus. Filecoin’s success will depend on scaling efficiently, maintaining ecosystem incentives, and integrating more deeply into decentralised application frameworks.
Before entering Filecoin positions, traders can use the Deriv trading calculator to estimate potential profit and loss based on position size, leverage, and price movement - an essential tool for managing risk in volatile crypto markets.
Trading Filecoin on Deriv
- Momentum trading: Traders can use RSI and MACD crossovers on Deriv MT5 to capture short bursts of volatility during rallies above key breakout levels.
- Range trading: When Filecoin consolidates between $1.80–$2.50, short-term traders may use Bollinger Band reversals to enter positions at range extremes.
- Breakout strategy: A sustained move above $2.57 could signal a new bullish leg toward $3.00 - traders can confirm signals using MT5’s volume indicators and EMA crossovers.

How Solana’s real-world integrations are redefining crypto in 2025
From institutional ETFs to payment infrastructure and decentralised finance (DeFi) applications, Solana is reshaping what it means for a blockchain to operate at scale in 2025.
Solana’s expanding real-world integrations - ranging from institutional ETFs to payment infrastructure and decentralised finance (DeFi) applications - are redefining what it means for a blockchain to operate at scale in 2025. The network’s steady ETF inflows, validator reforms, and partnership activity show that Solana’s growth story is no longer simply about price volatility; it is about building financial and operational depth across both on-chain and institutional layers.
Key takeaways
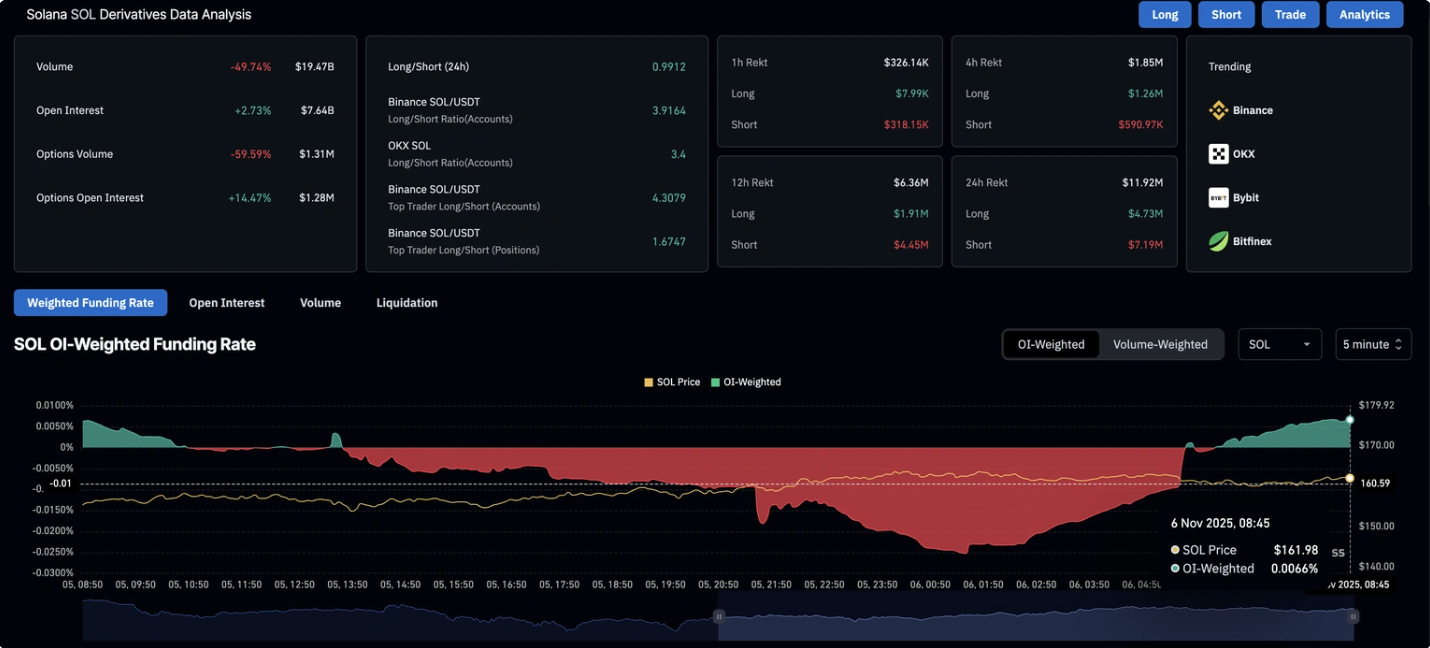
- Institutional inflows remain steady: Solana ETFs have recorded six consecutive days of positive inflows, signalling confidence from long-term investors.
- Retail activity returns: Futures open interest has climbed to $7.64 billion, up 2.73% in 24 hours, while funding rates have turned positive - a sign of renewed retail optimism.
- Real-world integration grows: Solana is under evaluation for Western Union’s blockchain-based remittance pilot, positioning it for mainstream financial use.
- Network efficiency improves: Validator count has fallen 64% since early 2023, yet performance has strengthened as outdated operators were removed.
- Liquidity risks persist: Despite Solana total value locked (TVL) rising to $10.2 billion, stablecoin liquidity has declined 8.16% in a week - a warning for on-chain demand.
Solana institutional investment anchors Solana’s 2025 momentum
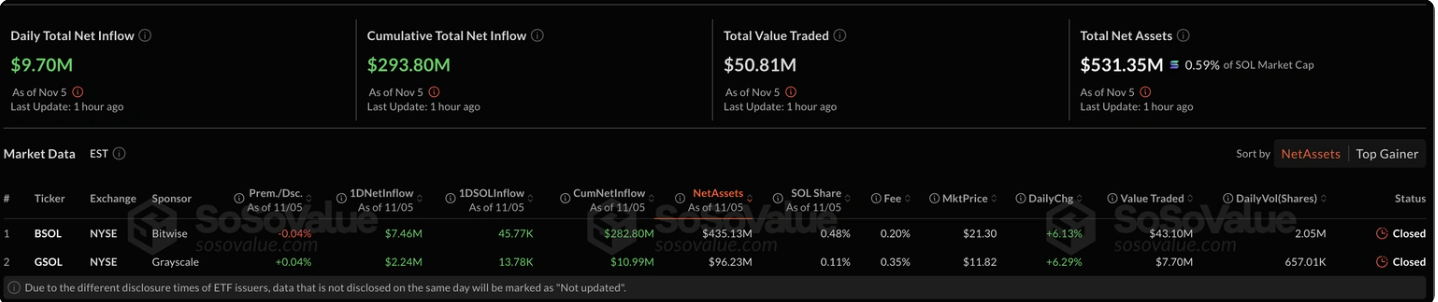
Institutional interest has become the foundation of Solana’s resilience this year. The Bitwise Solana Staking ETF (BSOL) drew $417 million in its debut week - outpacing even Bitcoin and Ethereum products - while the Grayscale Solana Trust (GSOL) attracted more than $1 million on its first day.
This consistent flow marks Solana’s shift from speculative trade to structured investment vehicle. For the sixth consecutive day, Solana ETFs have reported net inflows totalling $9.7 million mid-week, as professional investors position for long-term exposure despite macroeconomic uncertainty.
The rise of ETFs also introduces new liquidity and transparency. Each inflow represents a vote of confidence in Solana’s sustainability, particularly significant in a market shaped by cautious institutional allocators following the turbulence of 2022–23.
Solana retail traders re-engage as on-chain data strengthens
Following a weak start to the week, retail interest in Solana has picked up. According to CoinGlass, open interest in Solana futures increased 2.73% within 24 hours, and funding rates flipped from negative to positive territory. This indicates an expansion in leveraged long positions as traders bet on a continued rebound from the $155 support zone, with potential tests at $174–$177.
Short liquidations totaling $7.19 million exceeded long liquidations of $4.73 million, indicating that bearish positions were squeezed out and adding upward pressure on the price. The long-to-short ratio of 0.9912 indicates a market leaning cautiously bullish, yet still balanced.
Solana validator reforms make the network leaner and faster
Solana’s validator count has declined from around 2,500 to under 900 since 2023 - a 64% reduction - but this contraction reflects strategic consolidation rather than weakness. Many of the removed validators were outdated, slow, or linked to exploitative trading behaviours such as “sandwich” attacks.
The Solana Foundation has restructured its subsidy programme, now removing three subsidised validators for every new one added. The result: lower congestion, smoother transaction flow, and a healthier infrastructure.
As Tomas Eminger, Chief Infrastructure Officer at RockawayX, noted, this shift improves hardware quality and eliminates inefficiencies that previously slowed the network.
Solana real-world adoption: From DeFi to payments
Beyond market speculation, Solana is strengthening its institutional relevance through real-world adoption. Western Union has officially partnered with Solana to develop and test blockchain-powered cross-border transfer systems.
If adopted, the integration could channel significant transactional volume through Solana’s ecosystem, lifting both TVL and stablecoin demand. Simultaneously, developers are expanding Solana’s DeFi and asset-listing infrastructure:
- New perpetual markets are live.
- Launchpads are enabling faster token distribution.
- A revised asset-listing process simplifies onboarding for fintech and DeFi projects.
Together, these improvements suggest that Solana’s next growth phase will be driven less by speculative yield-farming and more by functional adoption - a shift reminiscent of how cloud computing matured from experimentation to enterprise utility.
Solana’s liquidity constraints: The risk beneath the rally
Despite these advances, the network faces liquidity constraints. DeFiLlama data shows Solana’s TVL rose 2.27% in 24 hours to $10.215 billion, but its stablecoin market capitalisation fell 8.16% over the week to $13.816 billion.

Falling stablecoin liquidity often signals shrinking capital reserves for decentralised applications, potentially reducing on-chain activity even as price metrics remain elevated.
If this decline continues, Solana may require stronger external inflows, such as ETF-driven liquidity or new payment-related transactions, to sustain ecosystem growth.
Comparing Solana’s institutional path to gold’s macro role
Solana’s 2025 performance mirrors gold’s cautious yet persistent rally amid uncertainty from the Federal Reserve. Both assets now reflect investor demand for alternatives that combine liquidity with long-term value preservation.
Just as gold ETFs legitimised physical gold as a mainstream portfolio component in the early 2000s, Solana’s regulated ETFs are giving institutions a compliant channel to access crypto exposure.
If the Fed’s December meeting signals prolonged policy tightness, risk assets could falter - yet steady institutional inflows suggest Solana is maturing into a digital asset capable of weathering policy-driven volatility.
Solana trading strategies on Deriv
- Breakout trading: Use Bollinger Bands or trendlines on Deriv MT5 to identify volatility-driven price movements. A confirmed breakout above resistance levels, such as $178 could indicate a bullish momentum continuation.
- Swing trading: Analyse Solana’s RSI and moving averages to time short- to medium-term entries. Combining this with the Deriv Trading Calculator can help manage position sizes and margin efficiently.
- Range trading: During consolidation, consider buying near support and selling near resistance using smaller lot sizes to manage risk effectively.
Deriv provides tight spreads, flexible leverage, and 24/7 access to crypto markets, allowing traders to act swiftly as Solana’s price responds to institutional flows or network developments.
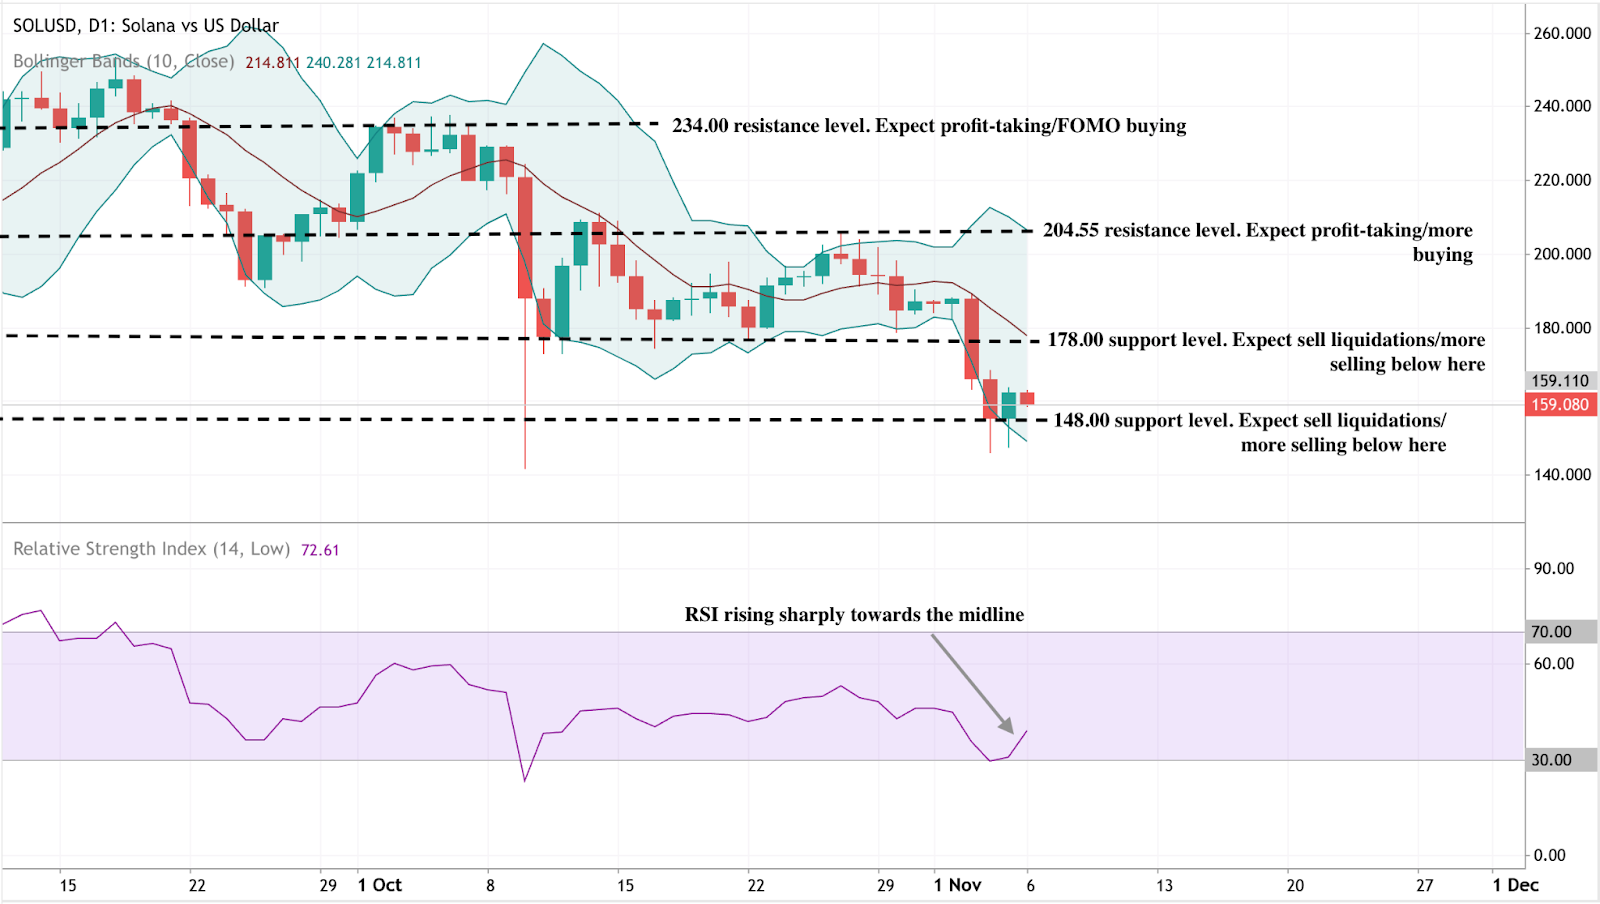
Solana technical insights
Solana is consolidating around $159 after bouncing from the $148 support, a key level where further sell-offs could accelerate if breached. The RSI at 72.6 is rising sharply towards the midline, signalling improving momentum and the potential for a short-term rebound.
The Bollinger Bands indicate that the price is hugging the lower band, suggesting oversold conditions with room for mean reversion if buying pressure strengthens. Immediate resistance lies at $178, followed by $204.55, where profit-taking is likely. A sustained break above $178 could signal a move towards $200–$210, while a failure to hold $148 risks a slide towards $135.
For traders interested in capitalising on such opportunities, Solana CFDs are available on Deriv MT5.
Solana price prediction and investment outlook
For portfolio managers, Solana’s transformation signals a gradual shift from a speculative token to an institutional-grade digital infrastructure.
- In the short term, price performance may remain tied to macroeconomic sentiment and ETF flows.
- Medium-term: The adoption of payment rails and DeFi applications could deepen liquidity.
- In the long term, continued integration with global finance and efficient network scaling may establish Solana as one of the few crypto assets offering both utility and institutional credibility.
In 2025, the real story is not the daily price chart - it is the quiet institutional infrastructure forming beneath it.

Ethereum price crash: Are we in a crypto winter or just a profit-taking phase?
Ethereum’s sharp fall below $3,500 looks less like the beginning of a crypto winter and more like a large-scale profit-taking reset.
Ethereum’s sharp fall below $3,500 looks less like the beginning of a crypto winter and more like a large-scale profit-taking reset. Data across on-chain, derivatives, and institutional flows suggest the market is undergoing a correction after months of aggressive gains, rather than entering a prolonged bearish cycle.
While retail traders and exchange-traded funds (ETFs) are showing fear, whales and institutional treasuries are using the pullback to accumulate - hinting that the current phase could set the foundation for a late-year recovery.
Key takeaways
- Ethereum trades at around $3,312, down 8.92% over the past month.
- Over $1.1 billion in leveraged positions were liquidated within 24 hours, as 303,000 traders were forced out.
- The Crypto Fear & Greed Index dropped to 20 (“Fear”), down from 59 (“Greed”) a month ago.
- Whale wallets added 1.64 million ETH (~$6.4 billion) in October, despite declining prices.
- The Fusaka hard fork upgrade scheduled for 3 December 2025 introduces PeerDAS, expected to cut Layer-2 fees by up to 95%.
- November has historically been Ethereum’s best-performing month, with an average return of +6.9% over the past eight years.
Crypto Market sentiment turns fearful
The Crypto Fear and Greed Index has plunged to 20, signaling widespread unease among investors.
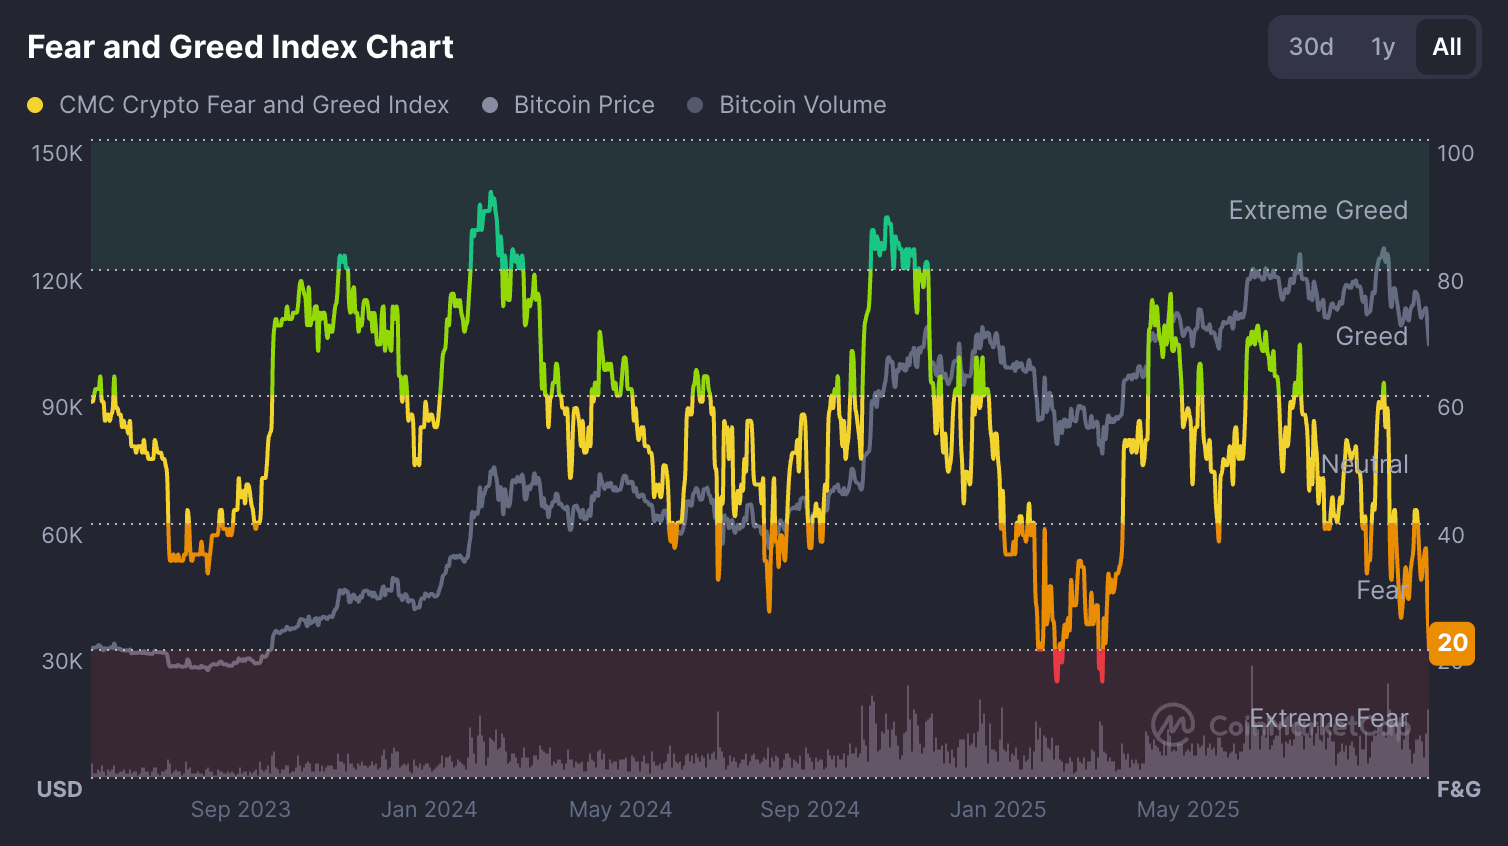
Just a month ago, readings above 50 showed moderate greed. The shift underscores a dramatic shift in sentiment as traders move from optimism to caution.
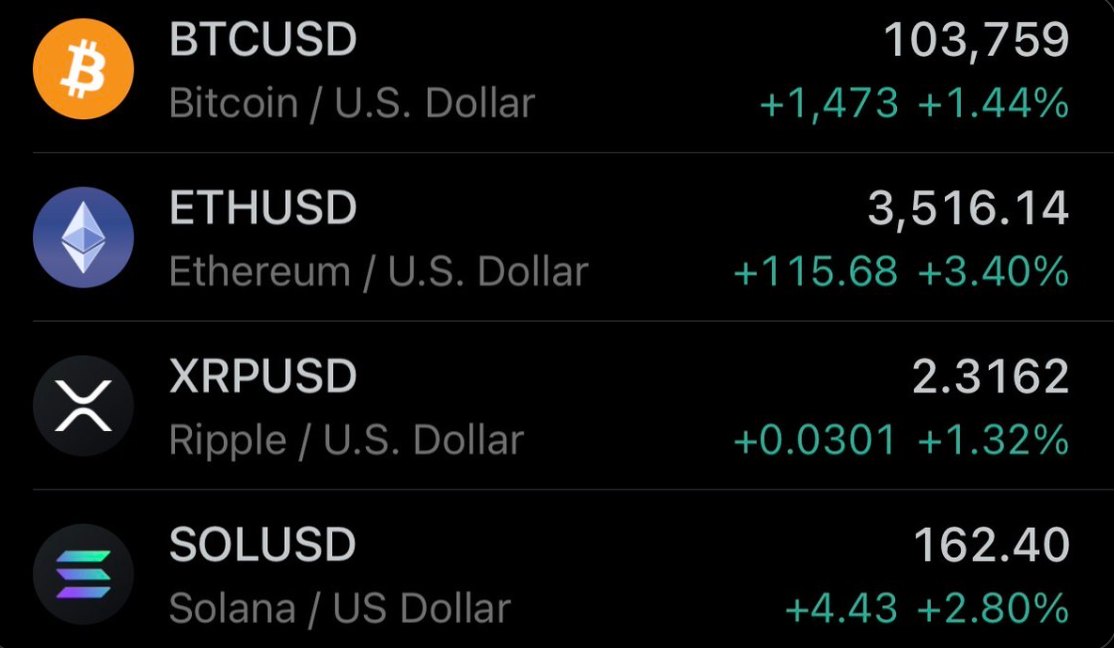
Across the broader market, nearly every major asset has turned red. Bitcoin fell 2.8% to $104,577, Solana dropped 11%, BNB lost 8.3%, XRP fell 6.7%, and Cardano slid 7.4% in the past 24 hours. The total cryptocurrency market cap has slipped 4% daily, erasing over $140 billion in value.
The macro backdrop compounds the pressure. The Federal Reserve’s uncertain rate outlook and a strengthening U.S. dollar are draining liquidity from risk assets - a dynamic often associated with crypto drawdowns.
ETH Whale accumulation intensifies while retail retreats
While fear dominates headlines, blockchain data reveals that the largest holders are quietly accumulating Ethereum. According to analytics firm Santiment, wallets holding between 1,000 and 100,000 ETH increased their balance from 99.28 million to 100.92 million ETH during the month of October.

This buying occurred even as Ethereum fell around 7% that month - a strong sign that institutional and high-net-worth investors view current prices as attractive entry points.
In contrast, long-term retail accumulation has slowed. Glassnode data show that the Holder Accumulation Ratio has declined from 31.27% to 30.45% since late October.
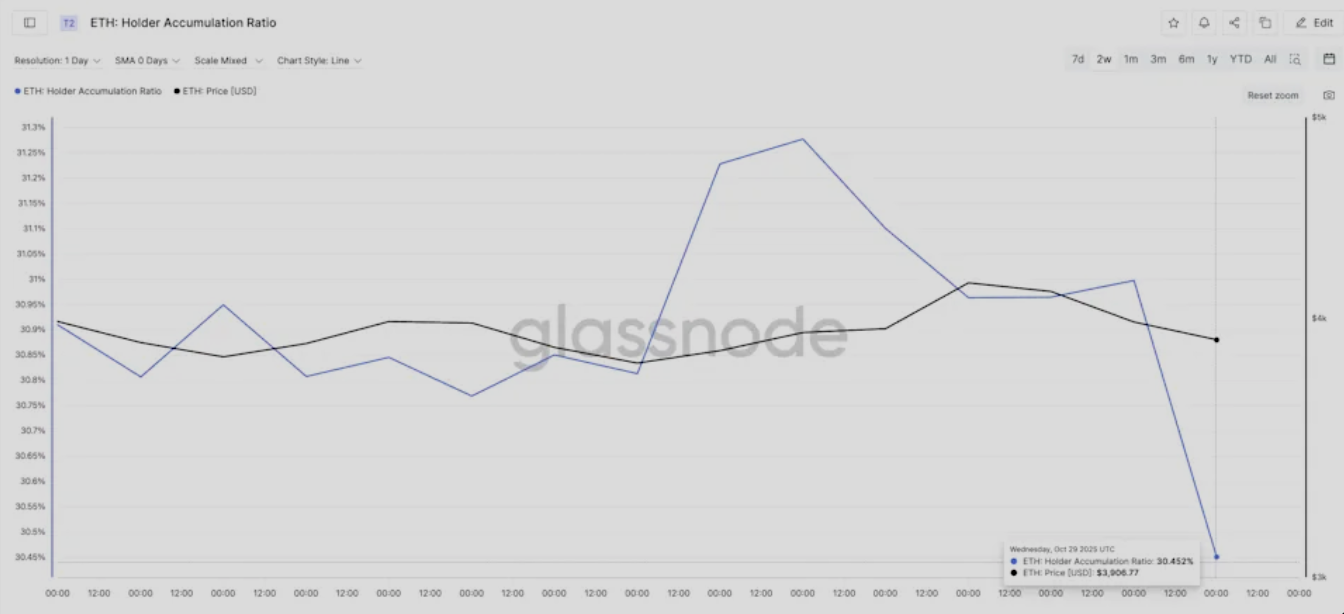
Retail investors are reducing exposure, waiting for clearer signals before re-entering. This divergence between whale buying and retail caution has become the defining feature of the current correction.
Institutional positioning: ETFs and treasuries diverge
Institutional flows paint a mixed picture. On the one hand, U.S. spot Ethereum ETFs experienced $135.76 million in outflows on 3 November.
- BlackRock’s ETHA: −$81.7 million
- Fidelity’s FETH: −$25.1 million
- Grayscale’s ETHE: −$15 million
These redemptions came alongside $186.5 million in Bitcoin ETF outflows, as institutional desks reduced exposure amid heightened volatility.
On the other hand, corporate treasuries are accumulating. Publicly traded BitMine Immersion Technologies (BMNR) added 82,353 ETH last week - worth roughly $294 million - bringing its total holdings to 3.39 million ETH, or 2.8% of Ethereum’s circulating supply. The company’s average purchase price stands around $3,909, suggesting confidence in long-term upside.
BMNR’s chairman, Tom Lee, told CNBC that the market is “consolidating after a reset,” adding that fundamentals such as stablecoin volume and application revenues are at all-time highs. Lee predicts a possible rally toward $7,000 for Ethereum before the end of the year, framing current conditions as a healthy correction rather than a crisis.
Liquidations reveal a market reset
The most dramatic signal of the correction came from the derivatives market. Data from Coinglass shows that over 303,000 traders were liquidated in just 24 hours, resulting in a total of $1.1 billion in forced positions. Within a single hour, more than $300 million was wiped out - $287 million of which were long positions.
This scale of liquidation reveals how over-leveraged bullish bets unraveled once prices broke below key support levels. Ethereum and Bitcoin accounted for the bulk of the wipeout, while high-beta altcoins like Solana and BNB saw even sharper declines.
The outcome is paradoxically constructive: leverage has been purged, funding rates have normalised, and open interest now reflects disciplined accumulation rather than speculative excess. Ethereum’s open interest remains high at $19.9 billion, but funding rates are flat - an equilibrium that often precedes a more stable recovery phase.
Fusaka upgrade offers long-term optimism
While short-term traders react to price volatility, developers are preparing for one of Ethereum’s most ambitious upgrades yet.
The Fusaka hard fork, confirmed for 3 December 2025, introduces Peer Data Availability Sampling (PeerDAS) - a technology that increases block capacity from 6 to 48 per block. This upgrade could reduce Layer-2 transaction fees by up to 95%, significantly improving scalability for DeFi and rollup networks.
Such infrastructure improvements strengthen Ethereum’s long-term competitiveness against alternative Layer-1 chains. With stablecoin transactions on Ethereum hitting $2.8 trillion in October, network fundamentals remain robust despite price turbulence.
Ethereum’s November historical pattern: a bullish bias
Seasonality may soon lend support. Over the past eight years, Ethereum has averaged a monthly return of +6.9 % in November. In 2024, it recorded a remarkable 47.4% rally, marking one of its strongest months ever.
The Net Unrealised Profit/Loss (NUPL) ratio - which measures the percentage of investors in profit - has fallen from 0.43 to 0.39, near the monthly low of 0.38 that last triggered a 13% rebound from $3,750 to $4,240.
This trend suggests selling pressure may be fading as investor incentives to take profits decline.
Macro context: profit-taking, not panic
Ethereum’s downturn mirrors the broader behavior of risk assets. After months of double-digit gains across cryptocurrencies, profit-taking has accelerated amid global liquidity concerns. The U.S. dollar index strengthened sharply, and Fed officials have hinted at slower rate cuts, encouraging investors to rotate out of speculative assets.
Unlike prior bear-market conditions, however, there is no collapse in network activity or developer engagement. DeFi revenue remains strong, stablecoin velocity is high, and whale inflows indicate rotation rather than retreat. The sell-off, therefore, aligns more with profit-locking behavior than the sustained capital flight that characterised the 2022–2023 crypto winter.
Traders on Deriv MT5 can track these shifts across multiple assets, from cryptocurrencies to forex, to gauge broader market sentiment in real-time.
Ethereum technical insights: Stabilisation vs. further weakness

Ethereum is currently trading near $3,313, rebounding after a sharp decline that tested the $3,745 support level. This zone has acted as a key area where sell liquidations intensified, but the recent bounce suggests early signs of buyer interest.
The Bollinger Bands have widened significantly, indicating elevated volatility, while price action remains near the lower band - typically a sign of short-term oversold conditions. A sustained close above the middle band could confirm a recovery in momentum.
Meanwhile, the Relative Strength Index (RSI) has risen sharply from 33, signaling improving bullish momentum after near-oversold readings. A further RSI move above 50 would reinforce a potential short-term reversal.
Resistance levels remain at $4,250 (where profit-taking and more buying may emerge) and $4,700, marking a stronger ceiling for any extended rally. Overall, ETH shows early signs of recovery but still faces strong resistance ahead.
The near-term outlook depends on whether ETF outflows stabilise and whether the whale accumulation trend continues through November. With fear levels elevated, contrarian traders are closely watching for a potential bottoming process similar to past mid-cycle corrections. The Deriv trading calculator can help traders assess potential profit and margin exposure before taking positions in such volatile environments.
Ethereum investment implications
For short-term traders, Ethereum’s setup suggests a high-volatility environment with tactical entry opportunities near the $3,500–$3,700 support range. Upside targets into December sit between $4,400 and $4,600, assuming sentiment stabilises and ETF outflows slow.
For medium-term investors, current levels represent an accumulation window. Whale buying, the Fusaka upgrade, and seasonal patterns point to improving fundamentals beneath the surface fear. Institutional participation is likely to return once macroeconomic uncertainty eases and on-chain stability confirms a bottom.
In essence, Ethereum’s decline is a market normalisation, not a meltdown. As leverage unwinds and fundamentals strengthen, the groundwork for the next leg higher may already be forming.
죄송합니다. 와(과) 일치하는 결과를 찾을 수 없습니다.
검색 팁:
- 철자를 확인하고 다시 시도해 주세요
- 다른 키워드로 시도해 보세요