Ergebnisse für

USD/JPY schwebt in der Gefahrenzone: Kann Japan einen Anstieg auf 160 verhindern?
Der USD/JPY bewegt sich in dem, was Händler heute die „Gefahrenzone“ nennen — der Spanne von 155-160, die Japan zuvor zum Handeln gezwungen hatte.
Der USD/JPY bewegt sich in dem, was Händler heute die „Gefahrenzone“ nennen — der Spanne von 155-160, die Japan zuvor zum Handeln gezwungen hatte. Analysten zufolge testet das Paar derzeit Niveaus, deren Überschreitung Tokio dazu zwingen könnte, erneut einzugreifen, um den Yen zu verteidigen. Für die Märkte ist dies nicht nur ein psychologischer Schwellenwert, sondern eine historische Grenze. Jede Annäherung an 160 weckt Erinnerungen an vergangene Interventionen und Spekulationen darüber, wie weit Japan seine Währung schwächen lassen wird, bevor es einschreitet.
Berichten zufolge ist der Kern der Spannungen eine wachsende Divergenz zwischen Japans fiskalpolitischer Expansion und seinem vorsichtigen geldpolitischen Kurs. Der Konjunkturplan von Premierminister Sanae Takaichi in Höhe von 21,3 Billionen Yen (112 Milliarden Pfund) hat die Renditen in die Höhe getrieben und den Yen weiter geschwächt, genau wie die Vereinigten Staaten die hohen Zinssätze beibehalten.
Die Frage ist nun, ob Japan rechtzeitig handeln kann — oder wird —, um den Anstieg des USD/JPY aufzuhalten, bevor er die Marke von 160 durchbricht und Tokios Entschlossenheit auf der globalen Bühne auf die Probe stellt.
Was treibt den USD/JPY an?
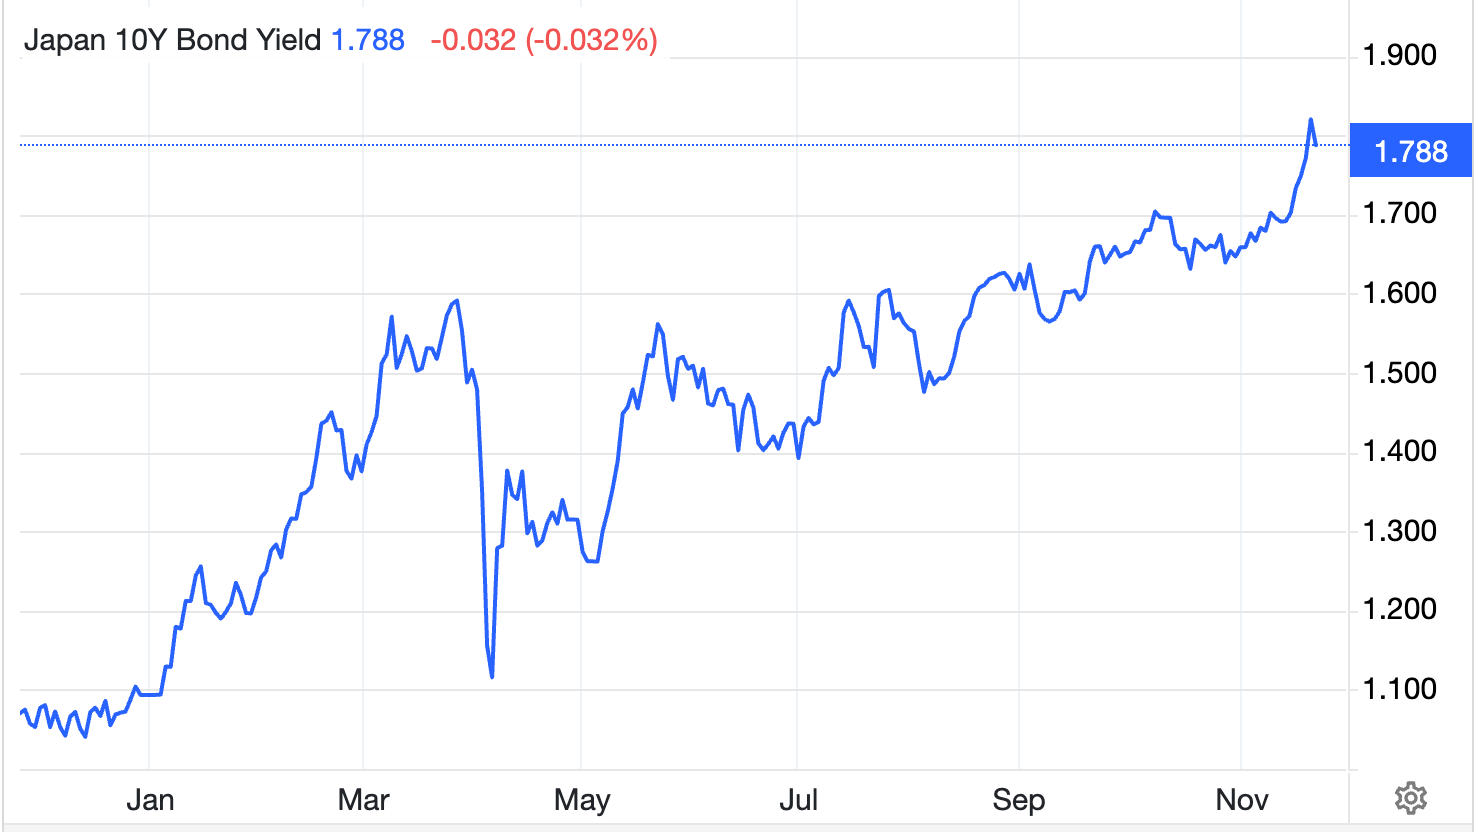
Der jüngste Rückgang des Yen ist auf Japans sich vergrößernde politische Kluft zu den Vereinigten Staaten zurückzuführen. Takaichis Konjunkturprogramm, das größte seit der Pandemie, umfasst Ausgaben für Energieerleichterungen, Steuererleichterungen und Bargeldzuschüsse. Es zielt darauf ab, den Druck auf die Lebenshaltungskosten zu verringern, doch die Anleger betrachten es als inflationär und fiskalisch rücksichtslos. Bloomberg berichtete, dass die Renditen japanischer Staatsanleihen (JGB) auf den höchsten Stand seit 2008 gestiegen sind, da sich die Schuldensorgen verschärfen und das Vertrauen in die langfristige Haushaltsdisziplin schwindet
Die vorsichtige Haltung der Bank of Japan hat den Druck nur verstärkt. Gouverneur Kazuo Ueda argumentiert weiterhin, dass sich das Lohnwachstum vor einem größeren politischen Kurswechsel stabilisieren muss, auch wenn die Inflation weiterhin über dem 2-Prozent-Ziel liegt.

Im Gegensatz dazu hat die Federal Reserve die US-Zinssätze auf einem hohen Niveau gehalten und zögert weiterhin, schnell zu senken. Dieser Renditeunterschied macht es lohnender, Dollars zu halten, was dazu führt, dass Kapital aus dem Yen abfließt und der USD/JPY in der Nähe von Mehrjahreshochs verharrt.
Warum es wichtig ist
Marktbeobachter sagen, dass sich die Schwäche des Yen in beide Richtungen auswirkt. Eine schwächere Währung kommt Exporteuren wie Toyota und Sony zugute, deren Gewinne im Ausland sich in höheren Gewinnen niederschlagen. Doch für Importeure und Haushalte stellt sich das Problem unmittelbar ein. Japan ist stark von importierten Treibstoffen und Lebensmitteln abhängig, was bedeutet, dass jeder Tick, der in USD/JPY ansteigt, das tägliche Leben teurer macht. „Japans Yen ist real effektiv fast so schwach wie die türkische Lira“, warnte Robin Brooks von der Brookings Institution und beschrieb den haushaltspolitischen Kurs der Regierung als „Schuldenverweigerung“.
Jenseits der japanischen Grenzen dient der Yen als globales Barometer für die Risikostimmung. Wenn er stark schwächer wird, signalisiert er ein wachsendes Vertrauen in den Dollar und unterstützt in Yen finanzierte Carry-Trade-Strategien. Aber es erhöht auch das Risiko abrupter Umkehrungen, falls Tokio eingreift. Die Märkte erinnern sich immer noch an die Jahresmitte, als Japan Berichten zufolge über 60 Milliarden Dollar für die Verteidigung seiner Währung ausgab, nachdem der USD/JPY kurzzeitig die Marke von 160 überschritten hatte. Aufgrund dieses Vermächtnisses fühlt sich jeder Schritt innerhalb dieser Band wie ein Countdown an.
Auswirkungen auf Märkte und Strategie
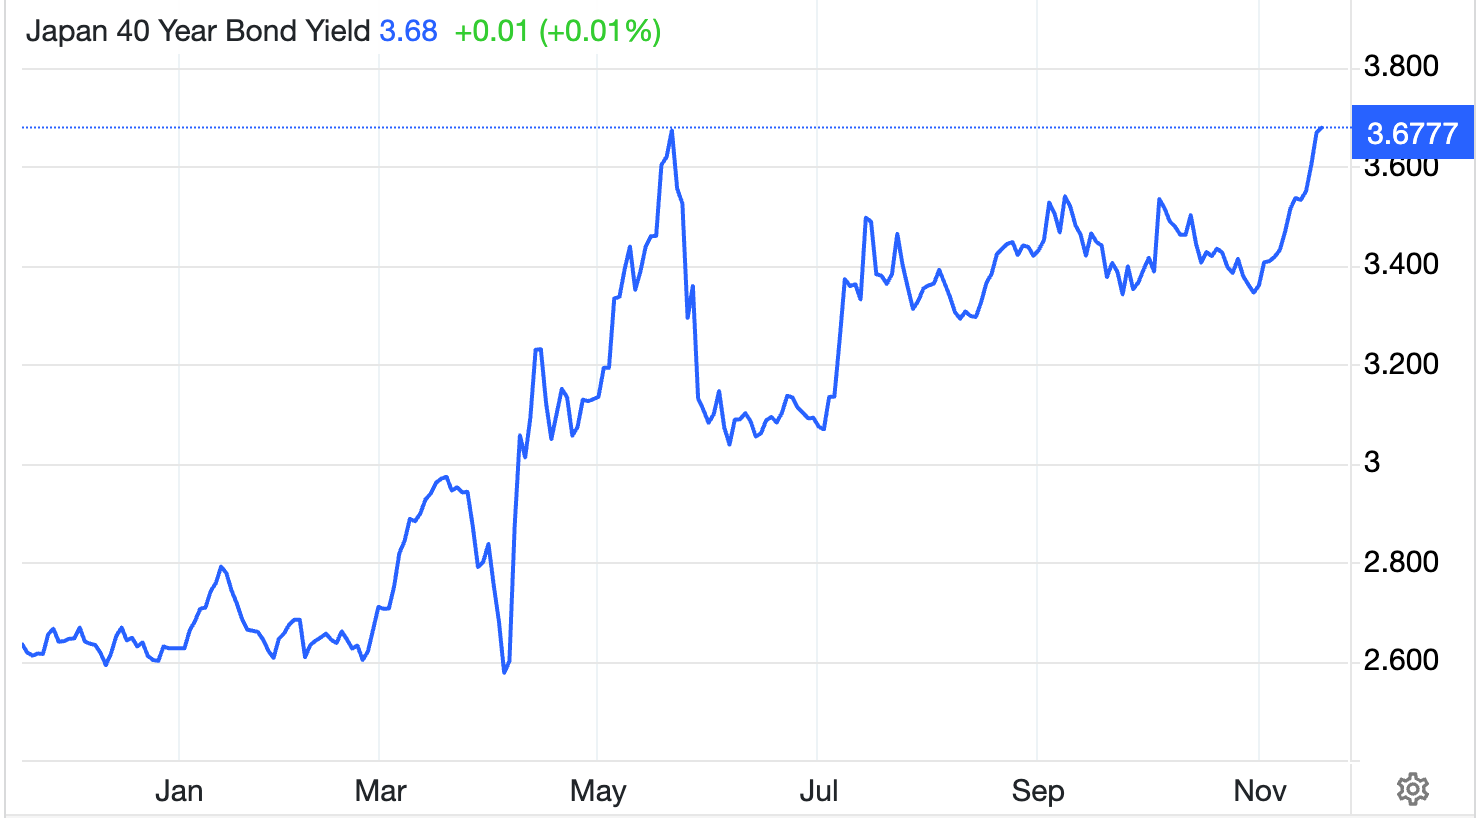
An den Anleihemärkten fordern Anleger höhere Renditen, um das fiskalische Risiko auszugleichen, wodurch die Zinssätze für zehnjährige JGB auf über 1 Prozent und die Renditen für vierzig Jahre auf über 3,6 Prozent steigen. Der Anstieg spiegelt die Sorge wider, dass Japans Schulden — die bereits mehr als doppelt so groß sind wie seine Wirtschaft — im Rahmen der wachstumsfördernden Agenda von Takaichi weiter ansteigen werden.
Finanzminister Satsuki Katayama hat bereits davor gewarnt, dass die Regierung „gegen ungeordnete Schritte vorgehen wird“, eine Formulierung, die Händler heute als verschleierte Androhung einer Intervention interpretieren.
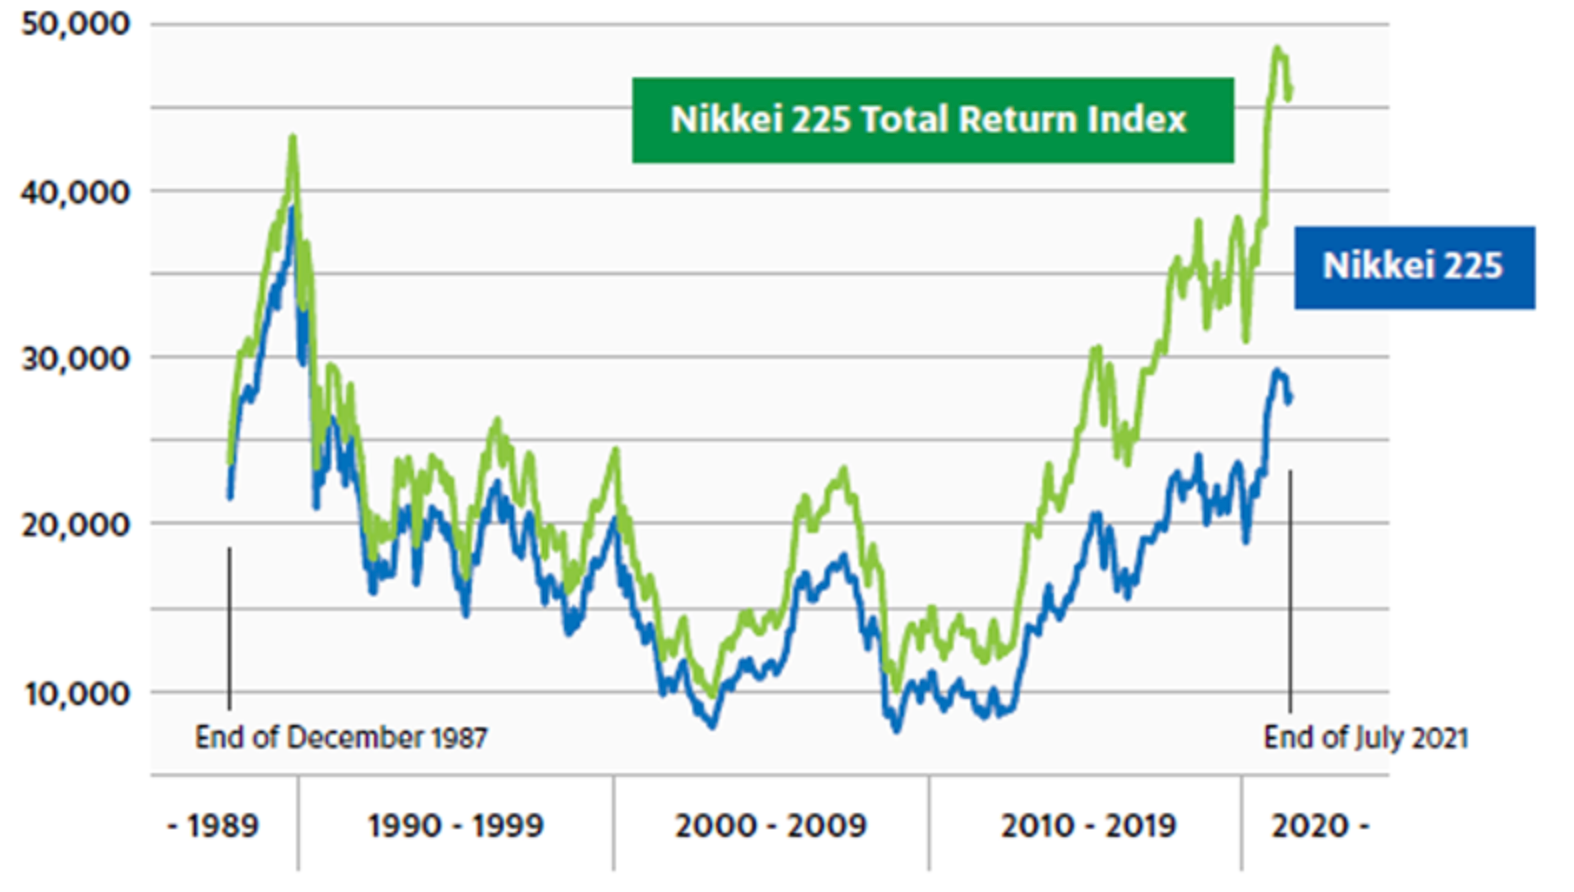
Für Aktieninvestoren hat der schwächere Yen für einen kurzfristigen Schub gesorgt. Der Nikkei 225 ist auf den höchsten Stand seit Jahrzehnten geklettert, unterstützt durch exportstarke Aktien und Gewinneinbußen im Ausland.
Dies hat jedoch seinen Preis: Das Verbrauchervertrauen ist gesunken, und die Inflationserwartungen steigen. Weltweit nährt die Schwäche des Yen die Risikobereitschaft — Treibstoff für Aktien und sogar Krypto —, macht die Märkte aber anfällig für eine drastische Korrektur, falls Tokio oder die BoJ plötzlich ihre Haltung ändern.
Für Einzelhändler stellt diese Volatilität gleichermaßen Chancen und Risiken dar. Angesichts der hohen Volatilität auf Schlüsselniveaus werden eine disziplinierte Positionsgröße und Margenverfolgung unverzichtbar — Tools wie der Deriv-Rechner kann Händlern helfen, Pip-Werte, Kontraktgrößen und potenzielle Gewinne oder Verluste abzuschätzen, bevor sie in den Markt eintreten.
Expertenausblick
Prognosen für USD/JPY hängen vom Zeitpunkt ab. Wenn die BoJ die Zinsen im Dezember auf 0,75 Prozent erhöht, wie eine knappe Mehrheit der Ökonomen erwartet, könnte der Yen eine Erholung in Richtung 150 erleben.
Wenn die Zentralbank jedoch zögert und die US-Daten stabil bleiben, könnten Händler weiterhin die Obergrenze der Spanne testen. „Sanae Takaichis Konjunkturprogramme im Abenomics-Stil werden die globale Liquidität erhöhen und den Dollar stärken — der König Dollar lebt und es geht ihm gut“, sagte James Thorne von Wellington Altus.
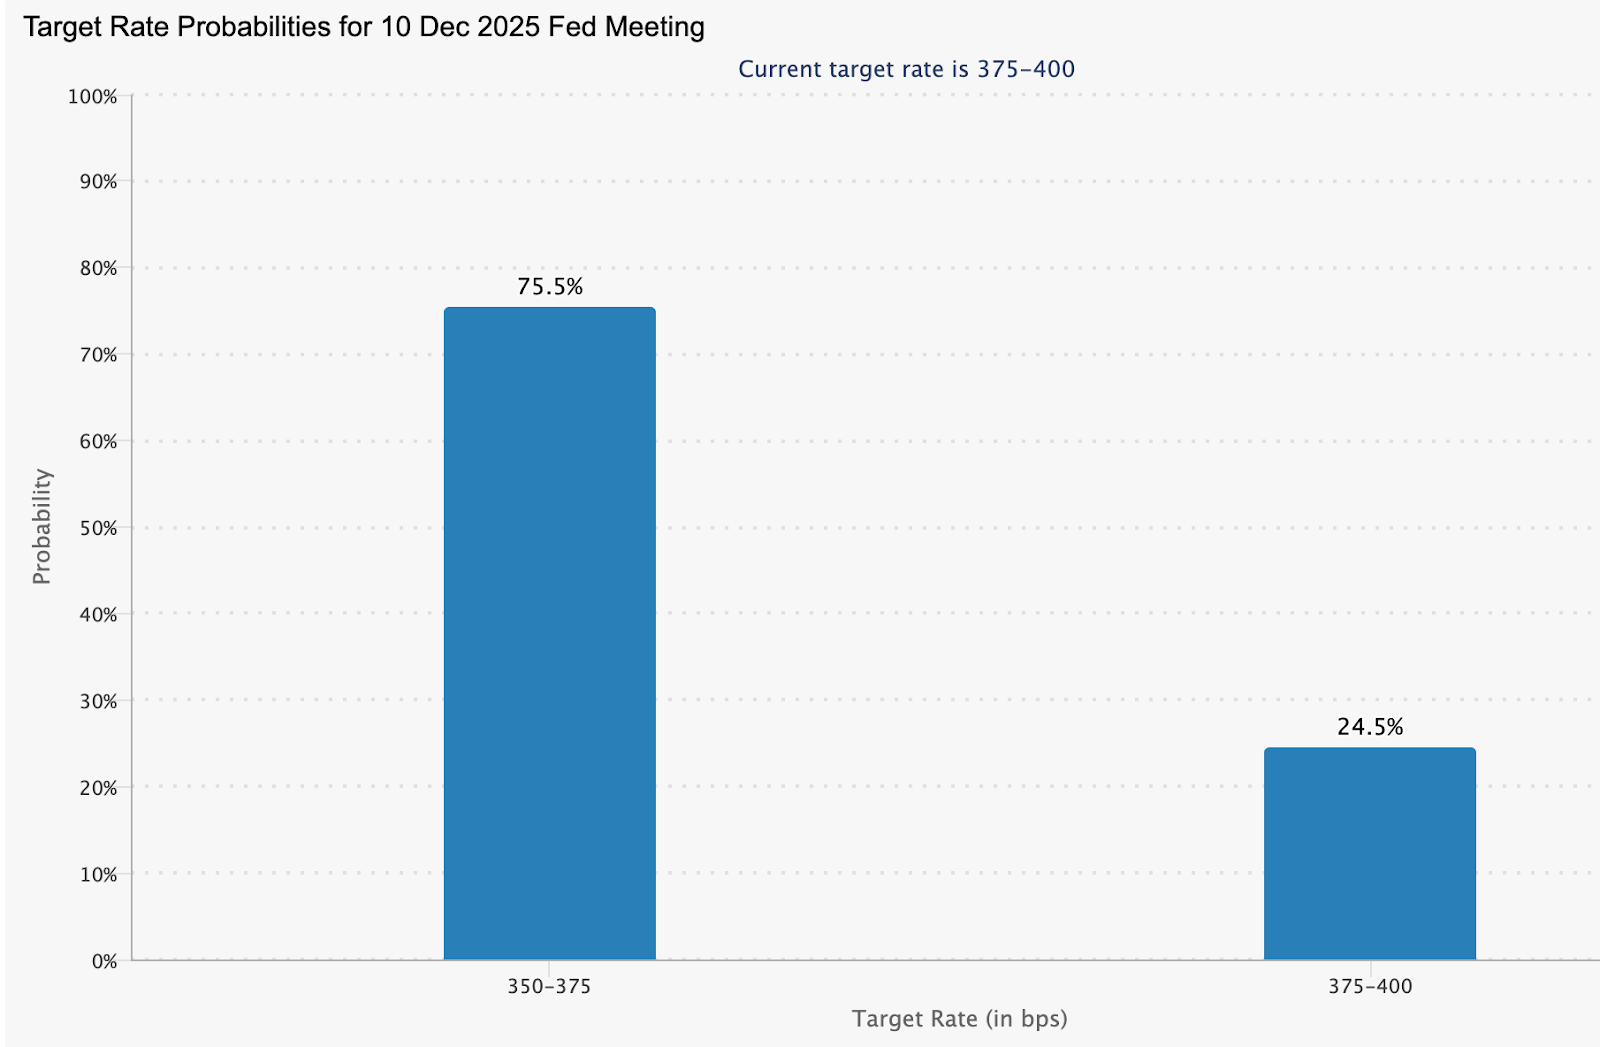
Viel hängt davon ab, ob die Fed vor der BoJ wechselt. Die Futures-Märkte gehen derzeit von einer Wahrscheinlichkeit von 75,5% aus, dass es im Dezember zu einer Zinssenkung in den USA kommt.
Analysten fügten hinzu, dass ein zurückhaltender Fed könnte die Renditelücke verringern und Yen-Käufe auslösen. Aber wenn das nicht passiert, bleibt Japans Währung eine Geisel der politischen Trägheit und der globalen Stimmung. Je länger der USD/JPY in der Nähe von 160 bleibt, desto größer ist der Druck auf Tokio, zu beweisen, dass es immer noch den Respekt des Marktes genießt.
Technische Einblicke in USD/JPY
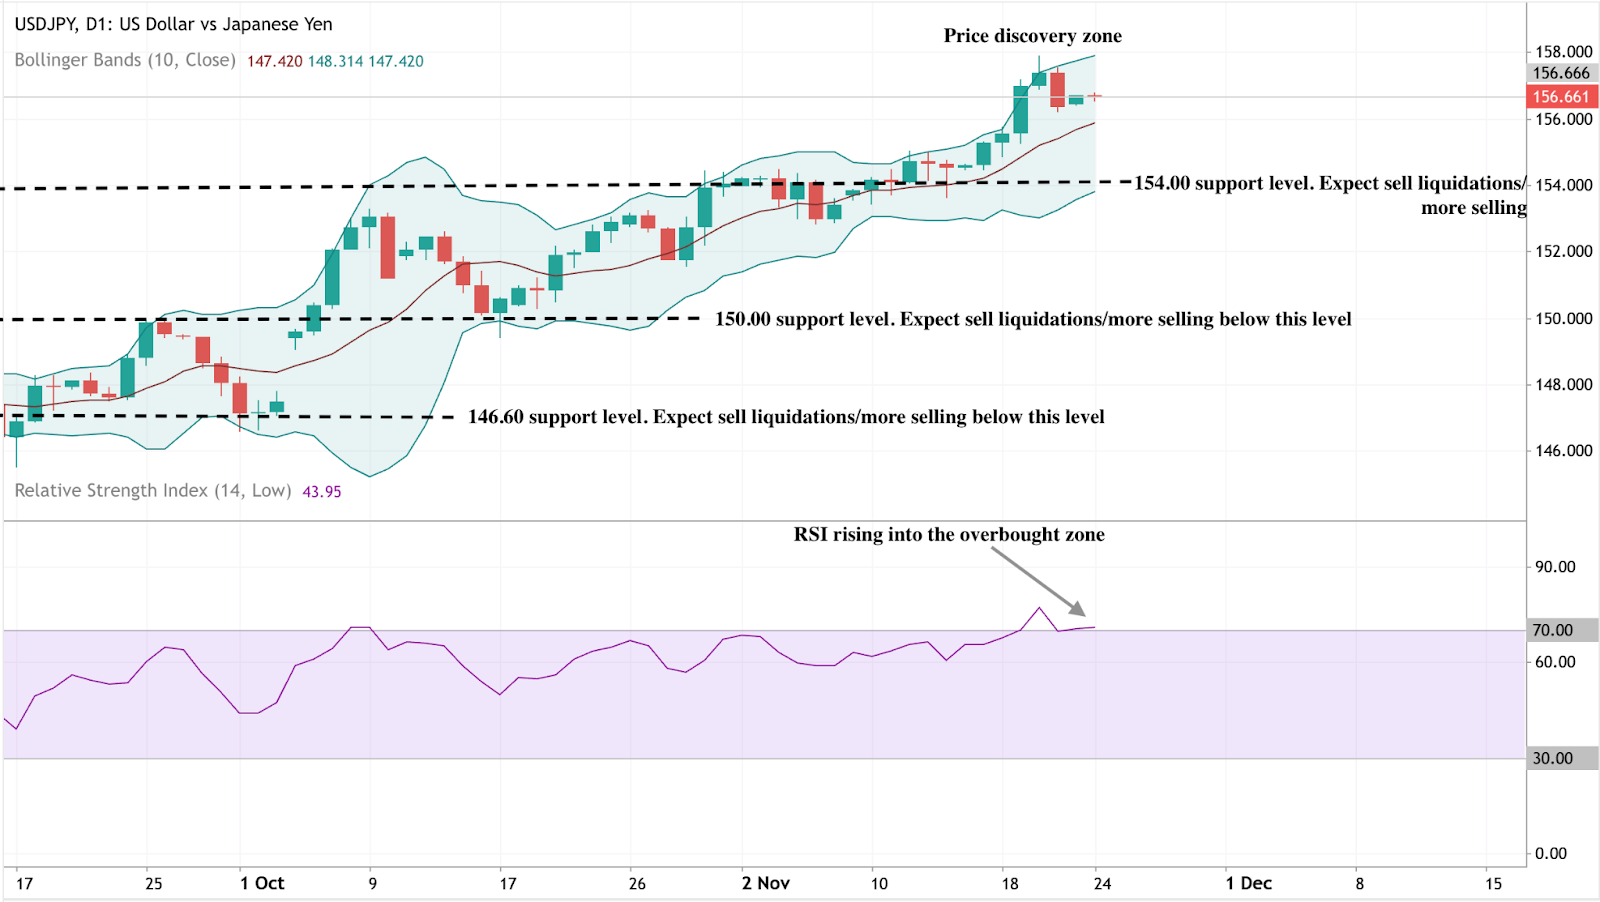
Zum Zeitpunkt der Erstellung dieses Artikels notiert USD/JPY in der Nähe von 156,66 und konsolidiert sich nach einem längeren Zeitraum innerhalb einer Preisentdeckungszone bullenhaft Lauf. Die Bollinger-Bänder (10, Schlusskurs) weiten sich aus und zeigen eine erhöhte Volatilität und eine Kontinuitätstendenz, da die Kursentwicklung weiterhin in der Nähe des oberen Bandes bleibt — ein Zeichen für eine starke Aufwärtsdynamik, aber auch ein erhöhtes Risiko einer kurzfristigen Erschöpfung.
Die wichtigsten Unterstützungszonen liegen bei 154,00, 150,00 und 146,60, wobei ein Absinken unter jede Zone zu Verkaufsliquidationen und tieferen Korrekturen führen könnte. Auf der anderen Seite hinterlässt eine Kursentwicklung über 156,00 nur begrenzten Widerstand, was bedeutet, dass die nächsten Kursrückgänge eher schwache Käufer anziehen könnten, sofern die Volatilität nicht ansteigt.
Das RSI (14) klettert in die überkaufte Zone, was darauf hindeutet, dass sich die bullische Stärke ihrem Höhepunkt nähern könnte. Wenn der RSI einen Wert über 70 beibehält, könnte das Momentum weiter steigen. Jede Umkehrung unter dieses Niveau könnte jedoch auf Gewinnmitnahmen oder einen baldigen Verkaufsdruck hindeuten.
Wichtiger Imbiss
Analysten zufolge ist die Rückkehr des USD/JPY in den Korridor 155-160 mehr als ein Chartmuster; es handelt sich um ein Referendum über den politischen Mix Japans. Eine fiskalische Expansion ohne entsprechende monetäre Anpassungen hat den Yen verwundbar gemacht und die Anleger skeptisch gemacht. Interventionen können die Märkte kurzzeitig stabilisieren, aber nur eine entschlossene Straffung oder eine restriktive Finanzpolitik werden das Vertrauen wiederherstellen. Bis dahin befindet sich das Paar genau in der Gefahrenzone — wo jeder Anstieg nicht nur Tokios Toleranz auf die Probe stellt, sondern auch das Vertrauen der Welt in Japans Fähigkeit, seine eigene Währung zu kontrollieren.

Nvidias Rekordquartal stößt am Markt auf kühle Reaktion
Trotz Nvidias Kurssprung und einer angehobenen Prognose von rund 65 Milliarden US-Dollar für das nächste Quartal fiel die Reaktion des Marktes überraschend verhalten aus.
Als die Nvidia Corporation einen Umsatz von 57 Milliarden US-Dollar für das dritte Quartal meldete – ein Anstieg von 62 % gegenüber dem Vorjahr – schien es ein weiterer makelloser Sieg im Rennen um KI-Hardware zu sein. Doch trotz des Anstiegs und der angehobenen Prognose von rund 65 Milliarden US-Dollar für das nächste Quartal fiel die Reaktion des Marktes überraschend verhalten aus.
In einem durchgesickerten All-Hands-Meeting gab CEO Jensen Huang zu: „Der Markt hat es nicht gewürdigt.“ Diese Diskrepanz zwischen Umsetzung und Begeisterung zeigt, wie hoch die Erwartungen – und die KI-Euphorie – die Messlatte selbst für die besten Performer gelegt haben.
Was Nvidias Rekordquartal antreibt
Das Lebenselixier von Nvidias Ergebnissen bleibt die Nachfrage nach Rechenzentren – das Rückgrat der KI-Infrastruktur. Allein dieses Segment erwirtschaftete rund 51 Milliarden US-Dollar Umsatz, ein Plus von 66 % gegenüber dem Vorjahr und 25 % gegenüber dem Vorquartal.

Flaggschiffprodukte wie die Blackwell-Plattform dominieren weiterhin die Unternehmensbestellungen, während die Prognose nun auf ein weiteres Rekordquartal hindeutet – 65 Milliarden US-Dollar Umsatz, 65 % Wachstum im Jahresvergleich. Nvidia wächst nicht nur; das Unternehmen gibt das Tempo für den gesamten Investitionszyklus einer Branche vor.
Geopolitische und strukturelle Kräfte verstärken dieses Wachstum. Während Cloud, Robotik und autonome Systeme weltweit skalieren, steht Nvidias Hardware im Zentrum der Innovation – und am Engpass der Versorgung. Doch mit dem Erfolg kommt auch die Fragilität: Wenn Perfektion erwartet wird, wirkt schon die kleinste Schwankung wie ein Beben. „Wenn man den Markt darauf trainiert hat, Perfektion zu erwarten“, witzelte ein Analyst, „ist selbst Großartiges nicht mehr gut genug.“
Warum das wichtig ist
Nvidia macht inzwischen rund 7,31 % der Gesamtgewichtung des S&P 500 aus und ist damit der einflussreichste Gradmesser für die KI-Stimmung. Wenn eine Aktie dieser Größe nach einem Rekordquartal seitwärts läuft, deutet das darauf hin, dass Anleger nicht die Daten, sondern die Erzählung hinterfragen.
FinancialContent nannte es „einen Prüfstein-Moment für KI und den breiteren Markt“. Wenn Nvidias Exzellenz nicht mehr begeistert, wird der Rest der Tech-Branche die Kälte spüren.
Huang selbst brachte es auf den Punkt: Liefert man ein schlechtes Quartal, wird man für das Platzen der Blase verantwortlich gemacht; liefert man ein großartiges, wird man beschuldigt, sie weiter anzuheizen. Diese Wahrnehmungsfalle markiert eine neue Phase im KI-Handel – eine, in der Ergebnisse überragend sein müssen, um die Märkte zu bewegen. Sie spiegelt auch einen subtilen Wandel wider: von Hype und Versprechen hin zu Disziplin und Lieferung.
Auswirkungen auf das Tech- & KI-Ökosystem
Nvidias Zahlen hoben zunächst die Tech-Aktien insgesamt an, mit AMD, Broadcom und Speicherlieferanten, die von der Euphorie profitierten. Doch im Tagesverlauf verpufften diese Gewinne – ein Beweis dafür, wie fragil die Begeisterung geworden ist.
Laut Analysten bedeutet es, wenn selbst überragende Ergebnisse keine Rally mehr auslösen, dass ein Großteil des Wachstums der KI-Infrastruktur bereits eingepreist ist. Anleger könnten nun operative Effizienz mehr belohnen als reines Wachstum. Das ist eine natürliche Entwicklung: Wenn das Wachstum reift, übernimmt Bewertungsdisziplin.
Für Hardware-Käufer und Unternehmenskunden könnte diese Entwicklung etwas entspanntere Lieferbedingungen, aber straffere Preise bedeuten. Nvidias Herausforderung wird es sein, die Margen zu halten und gleichzeitig die Produktion zu skalieren – ein Wandel von visionärem Wachstum zu industrieller Präzision.
Expertenausblick
Marktbeobachter sehen zwei Wege vor sich. Wenn Nvidia weiter liefert – neue Produktlinien skaliert, die Fertigungskapazitäten ausweitet und Export-Risiken meistert – kann das Unternehmen seine Führungsrolle behaupten und ausbauen. Nvidia verfügt weiterhin über einen technologischen Burggraben, den nur wenige überwinden können.
Das andere Szenario ist eine Neubewertung: Wenn Anleger anfangen zu hinterfragen, ob das Hardware-Wachstum dauerhaft die Kosteninflation und den Wettbewerb übertreffen kann, könnte Nvidia ein Plateau erreichen. Wie ein Bernstein-Analyst es ausdrückte: „Ich weiß nicht, was man noch verlangen könnte – zumindest bei diesen Zahlen.“
Für Trader sind die zu beobachtenden Signale die Entwicklung der Prognosen, Updates zum Auftragsbestand (insbesondere in China) und das Rollout-Tempo der Rubin- und Blackwell-Chips. Eine Marktkapitalisierungsschwankung von einer halben Billion Dollar innerhalb weniger Wochen zeigt, wie sensibel die Stimmung geworden ist.
Nvidia technische Einblicke
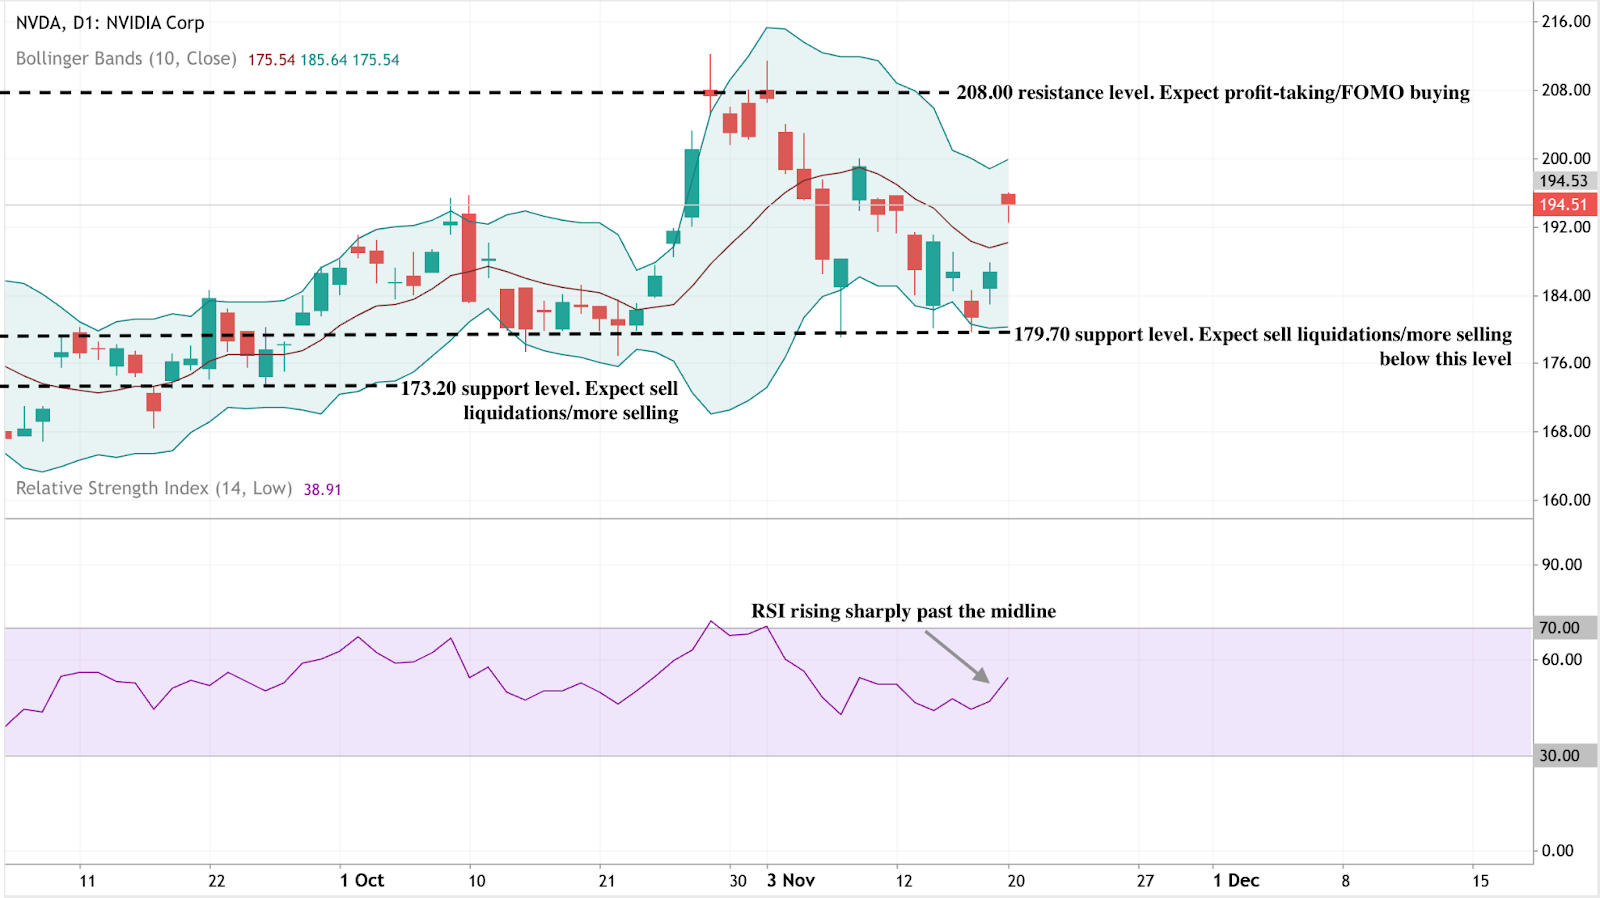
Zum Zeitpunkt der Erstellung dieses Artikels notiert Nvidia (NVDA) bei etwa 194,50 US-Dollar und erholt sich vom unteren Bollinger Band, nachdem das Unterstützungsniveau bei 179,70 US-Dollar getestet wurde. Die Bollinger Bänder (10, Schlusskurs) weiten sich moderat – ein Zeichen für zunehmende Volatilität – und die Kursbewegung nähert sich der Mittellinie an. Dies deutet kurzfristig auf eine mögliche Fortsetzung in Richtung oberes Band hin.
Das Niveau von 173,20 US-Dollar ragt als nächste wichtige Unterstützung heraus; ein Bruch darunter könnte Verkaufsliquidationen auslösen und den Abwärtsdruck verstärken. Umgekehrt bildet 208,00 US-Dollar eine starke Widerstandszone, in der sowohl Gewinnmitnahmen als auch spätes FOMO-Kaufen auftreten könnten, falls die Rally weitergeht.
Momentum-Indikatoren stützen das bullische Szenario zusätzlich. Der RSI (14) ist stark nach oben gedreht und hat die Mittellinie um 50 überschritten – ein technisches Signal für erneuten Kaufdruck. Ein nachhaltiger Anstieg über dieses Niveau, gestützt durch Stabilität über 179,70 US-Dollar, würde einen kurzfristigen Aufwärtstrend bestätigen und Trader anziehen, die auf Momentum setzen.
Für alle, die Szenarien durchspielen möchten, kann der Deriv Rechner nützlich sein, um Gewinn und Verlust bei verschiedenen Volatilitäts-Setups zu simulieren – eine wichtige Ergänzung zur Chartanalyse bei der Planung von NVDA-Trades auf Deriv MT5.
Fazit
Anleger sehen Nvidia weiterhin als das Zentrum des KI-Infrastrukturbooms – finanziell unerreicht und technologisch führend. Doch die verhaltene Marktreaktion markiert einen Wendepunkt: Versprechen werden nicht mehr belohnt, nur noch Beweise zählen. In dieser neuen Phase des KI-Handels werden Umsetzung, Margenstärke und Innovationsrhythmus die Führungsrolle bestimmen. Für Trader könnte Nvidias Chart kurzfristiges Aufwärtspotenzial andeuten, doch die größere Geschichte ist der Wandel der Erwartungen – Perfektion ist nun der Maßstab, nicht mehr die Überraschung.

Ausblick auf den Goldpreis: Die Zentralbanken gewähren eine Untergrenze
Hinter dem Lärm schwindender Wetten auf Zinssenkungen und der Stärke des Dollars verbirgt sich eine tiefere strukturelle Kraft: der unerbittliche Goldkauf durch die Zentralbanken der Welt.
Berichten zufolge ist die bemerkenswerte Stabilität von Gold in der Nähe von 4.050 USD pro Unze kein Zufall. Hinter dem Geräusch schwindender Wetten auf Zinssenkungen und der Stärke des Dollars verbirgt sich eine tiefere strukturelle Kraft: die unerbittlichen Käufe der Zentralbanken der Welt. Von Peking bis Ankara schreiben die politischen Entscheidungsträger im Stillen die Regeln der monetären Sicherheit um und nutzen Gold als Absicherung gegen politische Risiken, Währungsinstabilität und schwindendes Vertrauen in die US-Finanzordnung.
Analysten zufolge ist diese Nachfrage zur unsichtbaren Hand geworden, die Goldbarren stützt. Auch wenn sich spekulative Händler zurückziehen und die ETF-Ströme abflachen, tragen staatliche Käufer dazu bei, den Markt zu verankern.
Da die People's Bank of China ihre 12-monatige Goldkaufserie verlängert hat und andere Zentralbanken diesem Beispiel folgen, sieht das Abwärtsrisiko von Gold nun eher nach einer Pause als nach einem Zusammenbruch aus — eine Untergrenze, die von Nationen, nicht von Geldern, verstärkt wird.
Was treibt Gold gerade an?
Die neuesten Beschäftigungsdaten in den USA haben die Erwartungen auf den Weltmärkten auf den Kopf gestellt. Der Bericht Nonfarm Payrolls vom September zeigte einen Zuwachs von 119.000 Arbeitsplätzen, mehr als doppelt so viel wie von Ökonomen erwartet, während die Arbeitslosigkeit auf 4,4% stieg.

Oberflächlich betrachtet scheinen die Daten gemischt zu sein — starke Neueinstellungen, aber nachlassende Dynamik — doch sie reichten aus, um die Anleger dazu zu bewegen, ihre Forderungen nach einer Zinssenkung durch die Federal Reserve im Dezember zurückzuziehen.
Diese Rekalibrierung erhöhte die Dollar- und US-Renditen, was in der Regel eine toxische Kombination für Gold ist. Aber das Metall zuckte kaum zusammen. Der Grund dafür ist, dass die Nachfrage der Zentralbanken die Empfindlichkeit von Gold gegenüber politischen Zyklen verändert hat.
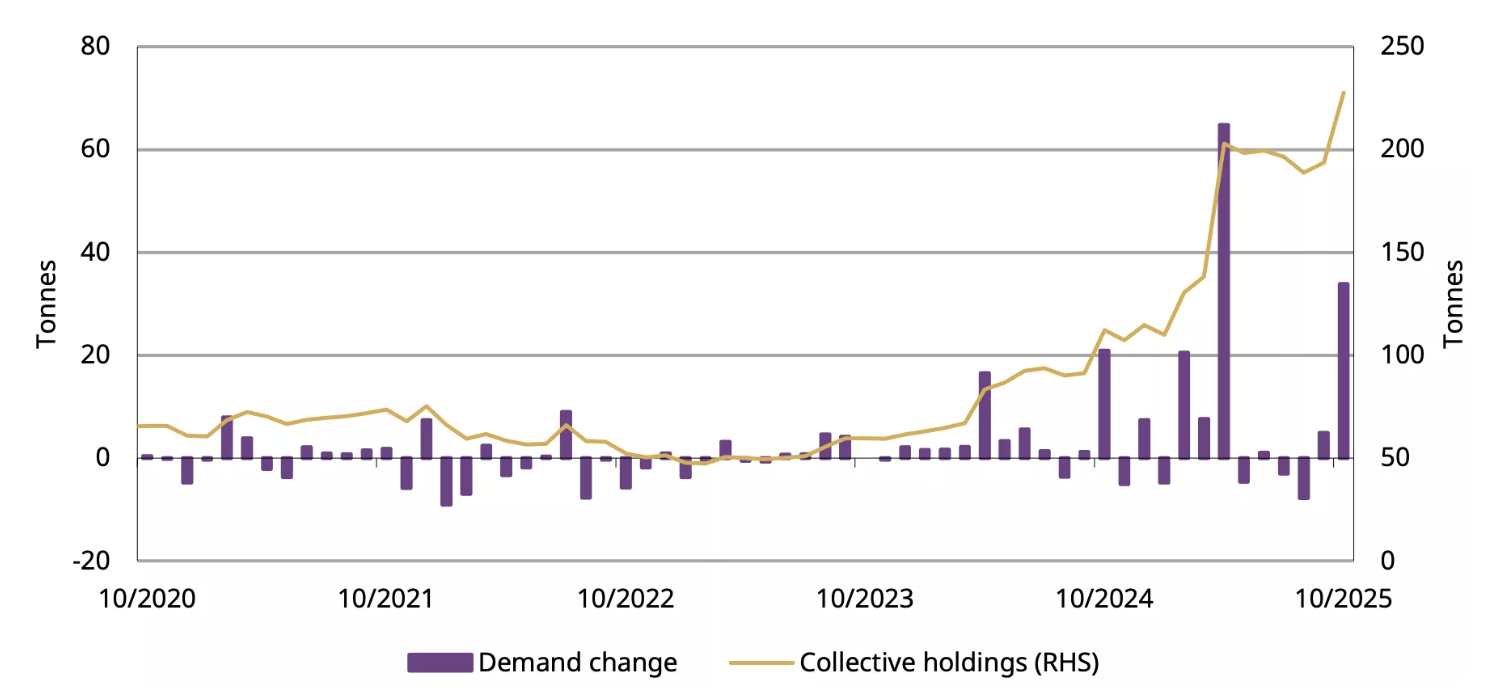
Nach Angaben des World Gold Council machen offizielle Käufe aus dem Sektor inzwischen fast ein Viertel der jährlichen Nachfrage aus — ein Strukturwandel gegenüber vor einem Jahrzehnt. Wenn die Fed zögert, tun es die Zentralbanken nicht.
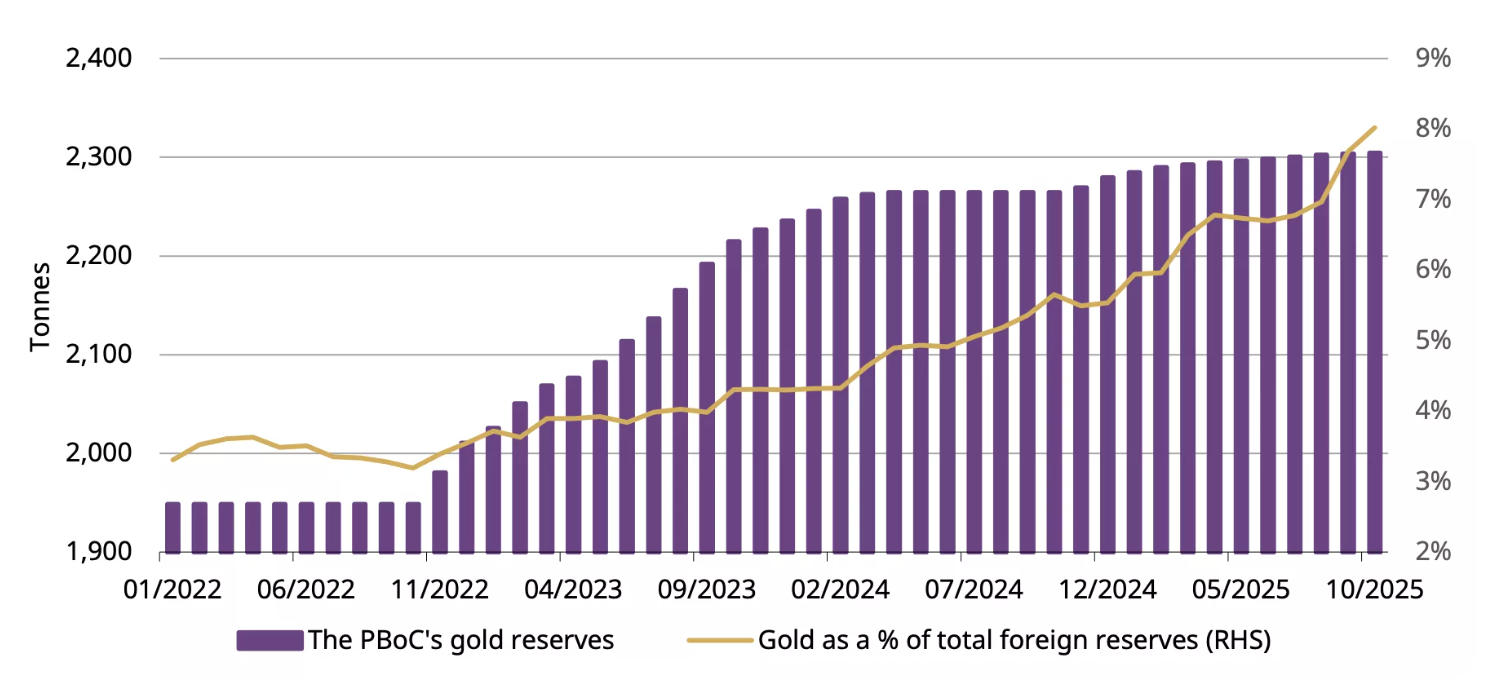
Die People's Bank of China (PBoC) hat zwölf Monate in Folge Goldkäufe gemeldet. Im Oktober legten sie 0,9 Tonnen zu, wodurch die Gesamtzahl auf 2.304 Tonnen stieg, was 8% der chinesischen Devisenreserven entspricht und ein ganzes Jahr ununterbrochener Käufe markiert. Die Türkei, Polen und Indien haben sich allesamt dem Trend der Akkumulation angeschlossen.
Warum es wichtig ist
Marktbeobachter sagen, dass diese stille Anhäufung von Staatsanleihen die Rolle von Gold im globalen Finanzsystem verändert. Was früher ein Handel war, bei dem das Risiko gescheut wurde, ist heute Teil der nationalen Reserve-Strategie. Das Einfrieren russischer Auslandsvermögen im Jahr 2022 veranlasste die Regierungen, ihr Engagement in dem vom Dollar dominierten System zu überdenken, und Gold erwies sich als neutrale Alternative.
Wie der Stratege von Zaner Metals, Peter Grant, es ausdrückt, bestätigen die neuesten US-Beschäftigungsdaten „einen sich verlangsamenden, aber stabilen Markt — aber das mindert nicht den Appetit auf Sicherheit“.
Für politische Entscheidungsträger in Schwellenländern bietet Gold etwas, was Papieranlagen nicht bieten können: Schutz vor Sanktionen, Inflation und Währungspolitik. Für Anleger bedeutet dies, dass der Goldpreis nicht mehr ausschließlich von den Zinssätzen oder der Risikobereitschaft abhängt. Es ist ein geopolitischer Indikator — ein Spiegel dafür, wie viel Vertrauen in die aktuelle Geldordnung noch besteht.
Auswirkungen auf Märkte und Anleger
Die auffälligste Veränderung in diesem Zyklus ist, dass Gold sich in der Nähe von Rekordhochs hält, obwohl der US-Dollar-Index (DXY) auf seinem stärksten Stand seit Monaten notiert. Das traditionelle umgekehrte Verhältnis hat sich abgeschwächt. Analysten zufolge werden beide Vermögenswerte aus demselben Grund gekauft: der Sicherheit. Diese Dynamik stellt die Vorstellung in Frage, dass Gold nur dann an Wert gewinnt, wenn die Zinsen fallen.
Für Händler erschwert dies die kurzfristige Positionierung. Da Gold nun rund 7% unter seinem Oktober-Rekord von 4.380 USD liegt, hat sich die Dynamik abgekühlt, aber die strukturelle Nachfrage bleibt intakt. Die ETF-Ströme waren in den letzten Wochen zwar leicht negativ, zeigen aber keine Anzeichen von Panik.
Privatanleger haben ihr Engagement reduziert, aber der offizielle Sektor hat sie als marginale Käufer abgelöst. Für langfristige Anleger deutet diese Verschiebung darauf hin, dass Kursrückgänge eher Chancen als Warnungen bieten könnten, insbesondere wenn sich die makroökonomische Unsicherheit bis ins Jahr 2026 hinein verschärft.
Expertenausblick
Analysten sind sich weiterhin uneinig, wie weit dieses Angebot der Zentralbank das Metall tragen kann. Goldman Sachs betrachtet die jüngste Schwäche immer noch als „Ausrutscher, nicht als Umkehrung“ und behauptet, dass sowohl die Nachfrage nach staatlichen als auch privaten Investitionen die Preise bis 2026 stützen werden. UBS prognostiziert einen möglichen Anstieg auf 4.900 USD pro Unze innerhalb der nächsten zwei Jahre, vorausgesetzt, die Diversifizierung weg von den Dollarreserven wird fortgesetzt.
Das Hauptrisiko für diesen Ausblick liegt in der monetären Selbstgefälligkeit. Wenn die US-Daten stabil bleiben und die Fed ihren Kurs „länger höher“ bekräftigt, könnte das spekulative Interesse weiter nachlassen. Doch vorerst spricht die Widerstandsfähigkeit von Gold für sich. Der Markt passt sich einer neuen Realität an — einer Realität, in der die Zentralbanken und nicht die Händler den Ton angeben.
Goldene technische Einblicke
Zum Zeitpunkt der Erstellung dieses Artikels notiert Gold (XAU/USD) in der Region von 4.030 USD und bewegt sich damit in der Nähe des Unterstützungsniveaus von 4.020 USD. Das RSI ist flach und liegt nahe der Mittellinie, was auf einen Mangel an starker Dynamik in beide Richtungen hindeutet — ein Zeichen der Unentschlossenheit des Marktes.
In der Zwischenzeit Bollinger-Bänder haben begonnen, sich zu verengen, was auf die geringere Volatilität nach den jüngsten Schwankungen zurückzuführen ist. Der Kurs oszilliert in der Nähe des mittleren Bandes, was auf eine mögliche Konsolidierungsphase vor dem nächsten Ausbruch hindeutet.
Auf der anderen Seite bleiben 4.200$ und 4.365$ wichtige Widerstandsniveaus, bei denen Händler mit Gewinnmitnahmen oder erneutes Kaufinteresse rechnen können, falls die bullische Stimmung zurückkehrt. Umgekehrt könnte ein Absinken unter 4.020$ die Tür zur Unterstützung von 3.940$ öffnen, was zu erhöhtem Verkaufsdruck oder Liquidationen führen könnte.

Wichtige Erkenntnisse
Die Widerstandsfähigkeit von Gold Ende 2025 ist kein Geheimnis — es ist eine Botschaft, die Analysten zum Ausdruck brachten. Dieselben Institutionen, die einst den US-Staatsanleihen vertrauten, kaufen jetzt Goldbarren, um sich gegen Politik, Politik und Unsicherheit abzusichern. Händler mögen die Rallye verblassen lassen, aber die Zentralbanken zucken nicht mit der Wimper. Wie der Fed navigiert durch einen gespaltenen politischen Ausblick und die globalen Reserven verschieben sich weiter nach Osten, der Boden unter Gold scheint so fest wie die Hände, die es halten.
.png)
Bitcoin’s harsh reset: Flows, fear and two lines that matter
The world’s largest cryptocurrency has shed nearly a third of its value since its October peak, slipping toward critical technical levels as headwinds take effect.
Bitcoin’s harsh reset has arrived. The world’s largest cryptocurrency has shed nearly a third of its value since its October peak, slipping toward critical technical levels as exchange-traded fund outflows and macroeconomic headwinds take effect.
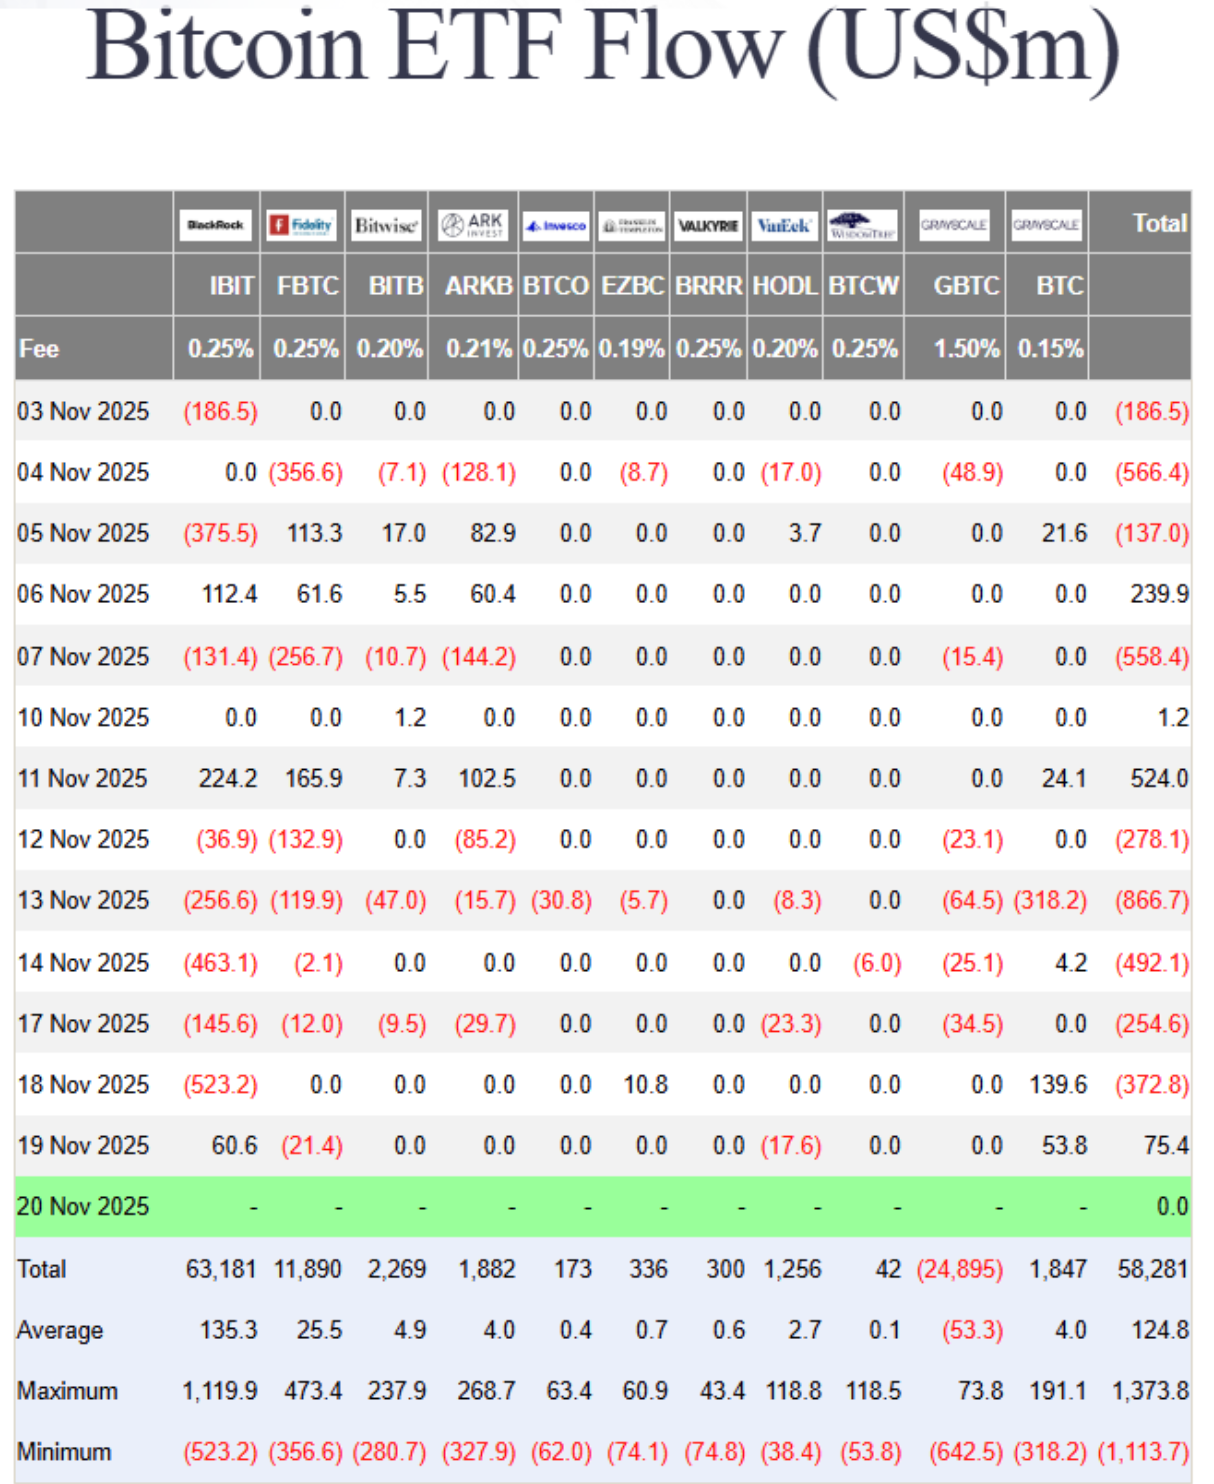
Recent data showed nearly $3 billion has exited Bitcoin ETFs this month alone, turning the same institutional flows that once fuelled the rally into a feedback loop of redemptions and retreat.
Behind the selloff lies a mix of fading Fed-rate-cut hopes, tightening liquidity, and a market paralysed by “extreme fear”. With prices hovering near $85,600 and the one-year low at $74,000 looming, the question is simple but urgent: is this correction a passing flush - or the start of a deeper shift in Bitcoin’s new ETF era?
What’s driving Bitcoin’s correction
Bitcoin’s 30% slide isn’t being driven by scandal or shock - it’s the result of structural forces finally reversing, according to analysts. After two years of relentless inflows, spot Bitcoin ETFs are now experiencing capital outflows. Institutional investors, once hailed as crypto’s stabilisers, are showing how quickly sentiment turns when markets wobble.
According to Farside data, ETF redemptions have occurred on all but four days this month, stripping nearly $3 billion in net outflows.
Part of that retreat stems from shifting macro conditions. The Federal Reserve’s reluctance to confirm rate cuts has strengthened the US dollar, drawing liquidity away from speculative assets.
Past movements have shown that a stronger dollar typically weighs on Bitcoin, and with inflation readings still sticky, traders are reassessing the narrative of “easy money” returning in December. The result is a market where rallies are met with selling rather than enthusiasm - a sharp turn from the euphoria that drove Bitcoin to $126,000 just weeks ago.
Why it matters
Bitcoin’s selloff is revealing just how tightly traditional and digital markets are now intertwined. ETFs opened the floodgates for institutional exposure, but they also linked Bitcoin to broader risk trends. When investors pull money from ETF products, the effect ricochets through liquidity pools and sentiment alike.
As Matt Williams of Luxor explained, “The drop to $86,000 is largely driven by macro forces - rate expectations, inflation - and by large holders cutting exposure after breaking key technical supports.”
For traders, this is a psychological turning point. The same retail crowd that once flooded exchanges during Thanksgiving 2017 - when Bitcoin first crossed $10,000 - is largely silent now.
Social data from Santiment shows sentiment evenly split between predictions of a plunge below $70,000 and wild optimism for a rally to $130,000. The divide signals indecision, not conviction. In this phase, fear - not fundamentals - is setting the tone.

Impact on markets and investors
The selloff has spilled beyond the crypto space. Bitcoin’s correlation with equity indices, such as the Nasdaq 100, has climbed above 0.8 at times, meaning that moves in tech stocks and digital assets now feed off the same macro triggers. When rate optimism fades, both markets suffer. That link cuts against Bitcoin’s long-standing claim as a hedge against monetary risk.
ETF outflows are another pressure point. As funds are redeemed, liquidity providers are compelled to unwind their positions in futures and spot markets, thereby deepening volatility.
The Crypto Fear & Greed Index, which plunged to 14 this week - its lowest since February - underscores how rapidly sentiment has deteriorated. Analysts like Rachael Lucas of BTC Markets warn that momentum, money flow, and volume trends “all reflect a sharp deterioration in sentiment,” driven by macro tightening and risk-off positioning.

In the background, liquidity providers are struggling. Tom Lee of Fundstrat compared crypto market makers to “central banks” of digital liquidity - and right now, those banks are running dry.
Following October’s $20 billion liquidation wave, market makers are operating with smaller balance sheets, which limits their ability to absorb order flow. It’s a reminder that crypto’s plumbing, though more sophisticated, is still fragile.
Expert outlook
Analysts are torn between caution and curiosity. Nic Puckrin of Coin Bureau describes the current landscape as a “bull-bear tug of war,” with macroeconomic pessimism offset by resilience in the tech sector.
Nvidia’s earnings beat briefly lifted risk appetite, but Bitcoin failed to follow through, suggesting traders are still unwinding rather than reloading. Puckrin pegs the next resistance at $107,500, if a rebound can gain traction.
Andre Dragosch of Bitwise sees parallels to past mid-cycle corrections, noting that the depth and duration of this decline “remain consistent with interim pullbacks in previous bull markets.” His base case still anticipates the cycle extending into 2026, driven by gradual global monetary easing.
For now, though, short-term risk remains tilted lower, with $85,600 and $74,000 as the two critical levels to watch. Hold those, and Bitcoin could form a base; lose them, and the next flush could be swift.
The bigger picture: Could Bitcoin trigger a financial crisis?
Despite the panic, Bitcoin remains relatively small compared to the real financial system. The total crypto market stands around $3–4 trillion, with Bitcoin representing roughly half. In contrast, global financial assets exceed $400 trillion. Past collapses, such as FTX in 2022 and Terra in 2021, caused chaos within the crypto industry but barely rippled across global markets.
That said, every cycle pulls crypto closer to traditional finance. ETFs, corporate holdings, and stablecoins backed by US Treasuries have created real linkages. A severe Bitcoin crash could trigger ETF redemptions, hurt balance sheets at companies holding BTC, and pressure stablecoins to liquidate their Treasury assets. None of that would cause a 2008-style crisis today - but as the overlap grows, the line between “crypto crash” and “financial contagion” gets thinner.
Bitcoin technical insights
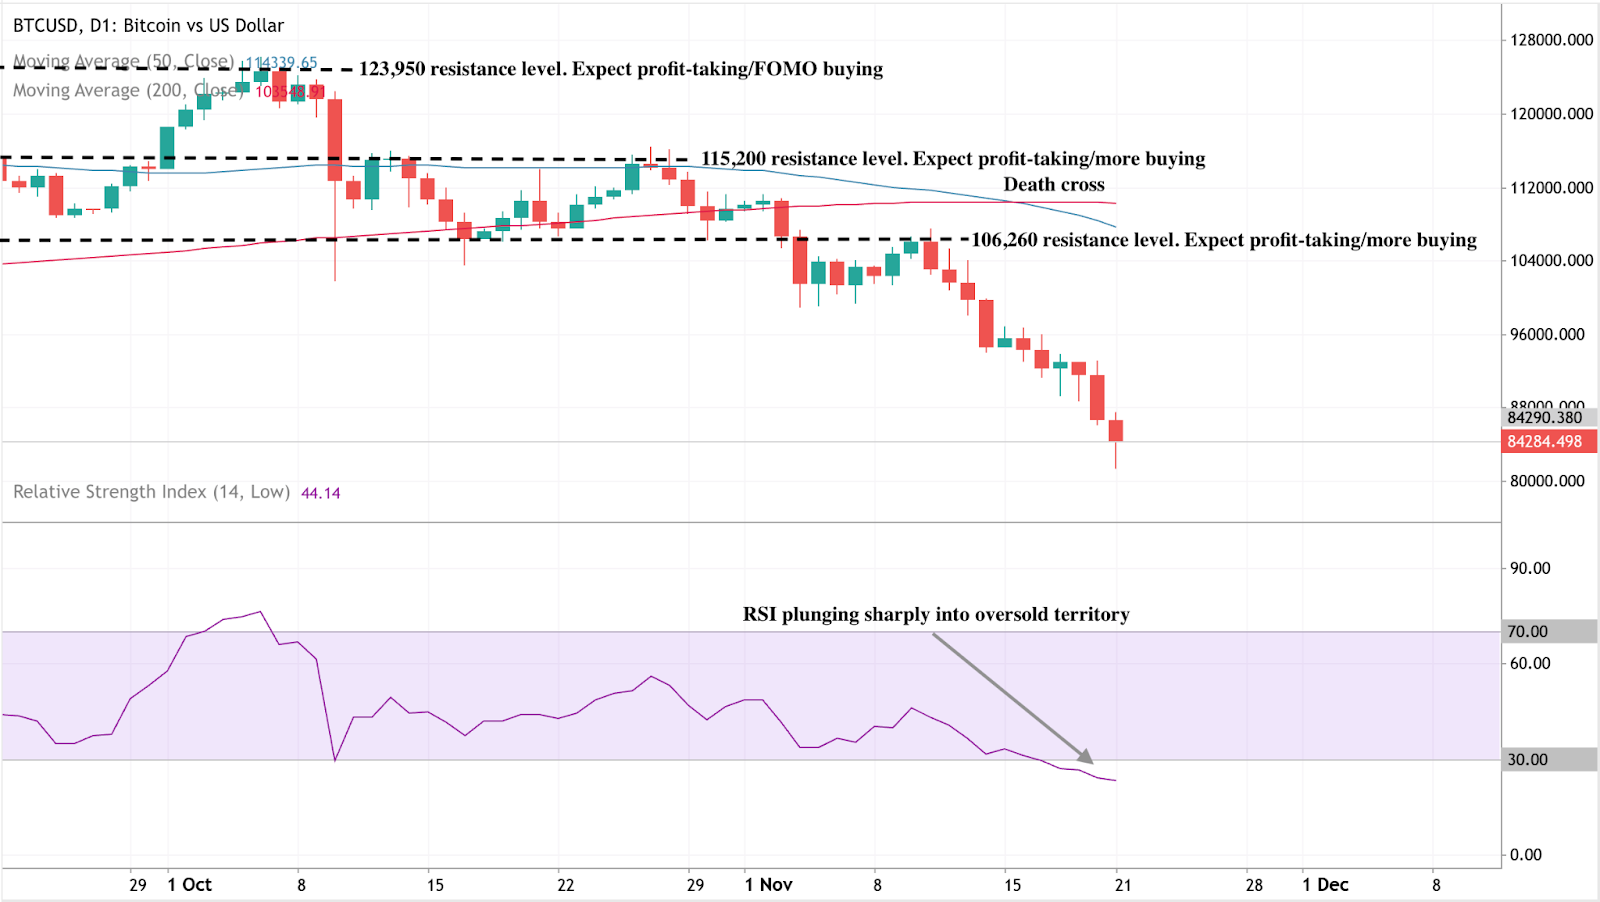
At the time of writing, Bitcoin (BTC/USD) is trading around the $84,200 mark after an extended downtrend. The RSI has plunged sharply into oversold territory, signalling intense bearish momentum and the potential for a short-term relief bounce if buyers step in.
A death cross - where the 50-day moving average has fallen below the 200-day moving average - reinforces the bearish bias, suggesting further downside pressure in the near term.
Key resistance levels sit at $106,260, $115,200, and $123,950, where traders may expect profit-taking or renewed buying interest if recovery attempts occur. Failure to reclaim these zones could see Bitcoin remain under pressure, with sentiment staying fragile amid persistent selling.
Key takeaways
Bitcoin’s decline isn’t an accident - it’s a stress test of its new reality. The ETF era has tied the cryptocurrency closer to the global financial system, for better and worse. Liquidity, once a tailwind, now cuts both ways. Fear dominates, but deep corrections are part of Bitcoin’s DNA.
If those two lines - $85,600 and $74,000 - hold firm, many say this reset may end up looking like just another cleansing phase before the next wave of institutional demand. Lose them, and Bitcoin’s harsh reset could turn into something much deeper.

Nvidia earnings reality check: Is the AI boom back on track?
Nvidia’s latest earnings didn’t inflate another round of hype; they restored confidence that artificial intelligence is entering its scale phase.
Yes - the AI boom is back on track, according to analysts, just in a different gear. Nvidia’s latest earnings didn’t inflate another round of hype; they restored confidence that artificial intelligence is entering its scale phase, not its speculative one.
Nvidia investors are bracing for a $300 billion surge in market value after the chipmaker reported its first sales acceleration in seven quarters, signalling that AI demand isn’t fading - it’s normalising into a sustainable growth cycle.
For months, markets were haunted by talk of “peak AI.” However, Nvidia’s results - record data centre revenue, renewed partnerships, and a 5% share spike in after-hours trading - show the story isn’t one of collapse, but calibration. This isn’t a bubble bursting; it’s the industry learning how to breathe again.
What’s driving Nvidia’s momentum
At the core of Nvidia’s dominance in artificial intelligence architecture is its data centre segment, which surpassed $50 billion this quarter, a milestone reached earlier than analysts expected.
This reflects an industrial-scale buildout, not a speculative frenzy. The surge in demand from AI workloads has transformed GPUs from niche products into the backbone of modern computing, powering everything from ChatGPT to enterprise cloud systems.
CEO Jensen Huang captured it best: “We’re in every cloud.” That ubiquity underpins Nvidia’s stability. Its chips are not optional - they’re essential infrastructure. With Blackwell GPUs offering up to 40 times faster inference speeds than the previous generation, the company isn’t chasing hype; it’s engineering the next leap in computational efficiency.
Why it matters
Nvidia’s report acts as a barometer for the AI economy. The stock’s post-earnings rally wasn’t just about profits; it was about validation. The market had priced in fear after days of tech sell-offs, but Nvidia’s blowout numbers reintroduced realism.
Analysts like Julian Emanuel of Evercore ISI summed up the pre-earnings tension: “The angst around ‘peak AI’ has been palpable.” Those fears evaporated when Nvidia showed that demand isn’t flattening - it’s broadening.
The company’s performance has become closely tied to the trajectory of U.S. equities. With AI now a structural growth driver, Nvidia’s consistency reassures investors that this is an economic revolution in progress, not a fleeting mania. Its $5 trillion valuation last month wasn’t an aberration; it was a preview of scale yet to come.
Impact on global markets
The aftershocks were immediate. Tech indices that had stumbled under the weight of “AI fatigue” rebounded as Nvidia reignited investor faith. Asian markets opened higher, and S&P futures turned positive, driven by renewed conviction that the AI trade still has legs. Even after a period of correction - Meta down 19%, Oracle off 20% - Nvidia’s performance reaffirmed that the long-term AI thesis remains intact.
Beyond markets, Nvidia’s results signal a new capital cycle. Its multibillion-dollar partnerships with Microsoft, OpenAI, and Anthropic aren’t one-off investments; they’re structural commitments to an AI-driven infrastructure era. Every dollar of GPU spending feeds into an ecosystem that’s building capacity for the next generation of models, data centres, and intelligent services.
Expert outlook
Forecasts are being rewritten. McKinsey estimates $7 trillion in AI infrastructure spending by 2030, with $5.2 trillion going toward data centres. According to McKinsey, we will also see significant incremental AI capacity added every year through to 2030.
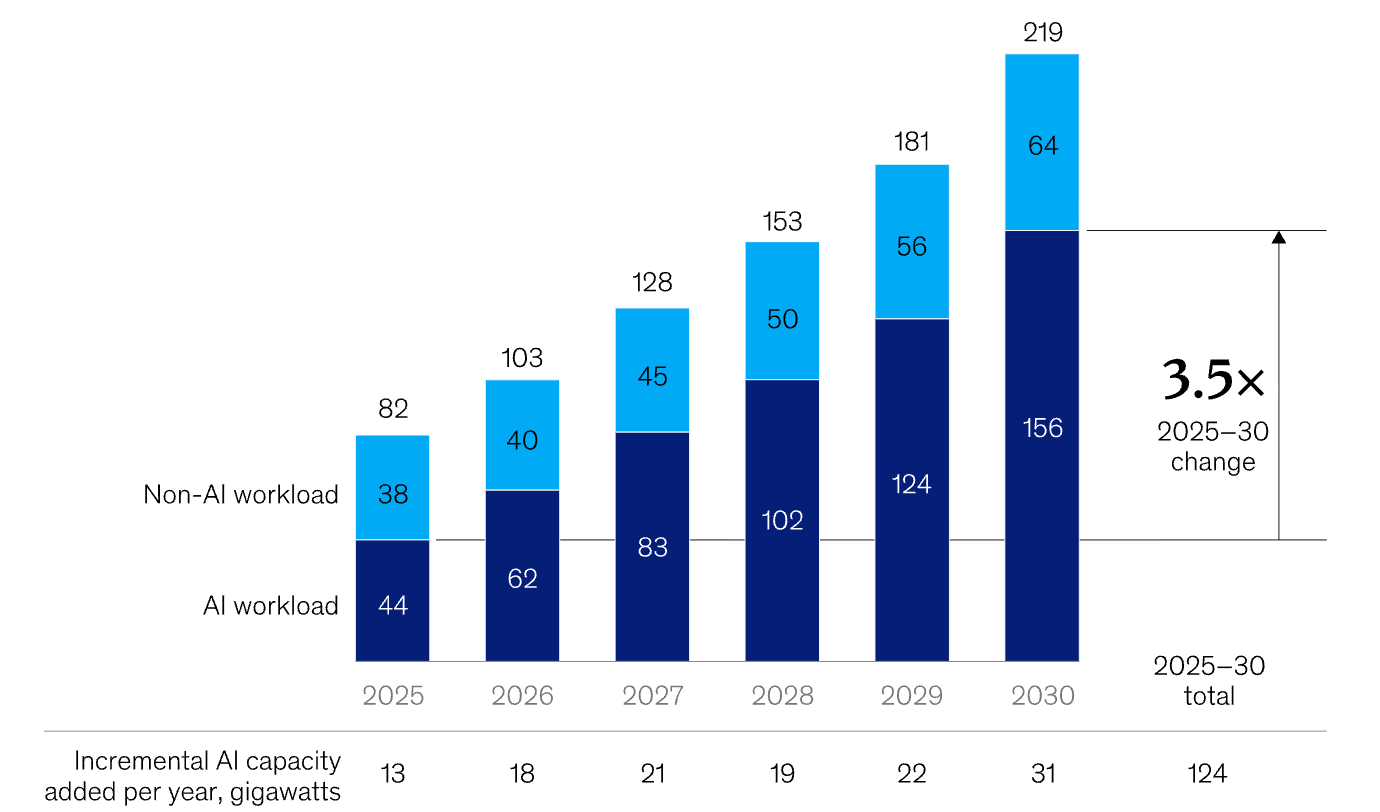
Nvidia’s share of that pie could exceed 50%, given its current dominance and design lead. Some analysts even project a $20 trillion market capitalisation by 2030 if the company maintains its pace of innovation.
Still, this is not a frictionless ascent. Export restrictions to China and the rise of custom silicon from rivals like AMD and Google pose challenges. Yet Nvidia’s edge isn’t just its hardware - it’s the CUDA software ecosystem, which locks developers and enterprises into its platform. As long as AI workloads require versatility and performance across models and frameworks, Nvidia’s moat will hold.
Nvidia technical analysis
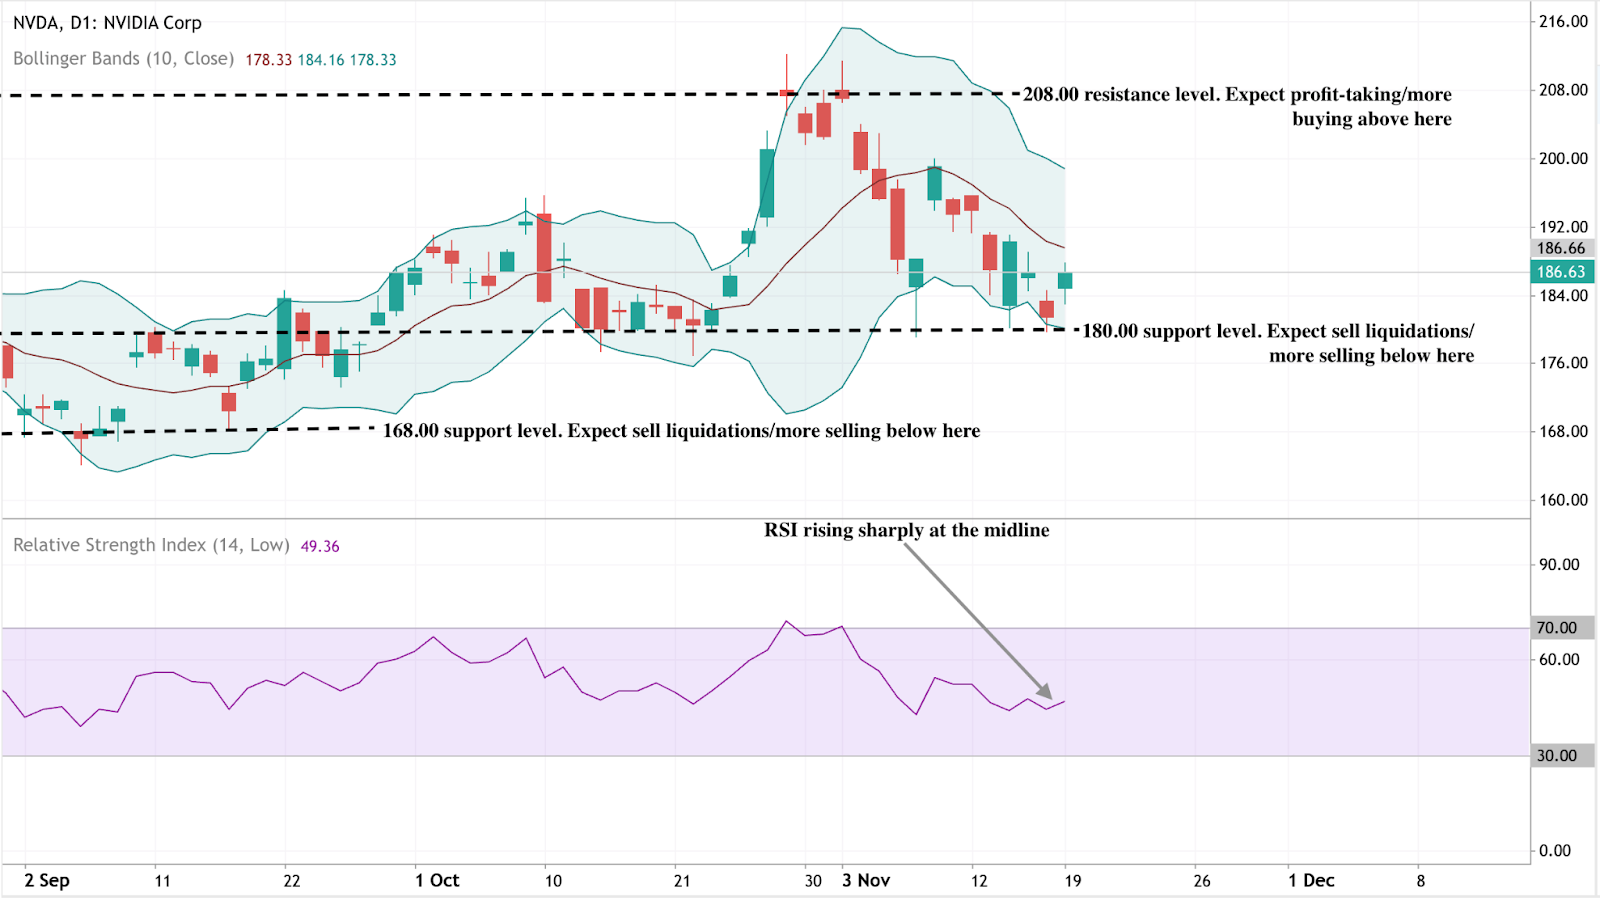
At the time of writing, Nvidia’s stock (NVDA) is hovering around $186, showing early signs of recovery after a short-term pullback. The RSI is rising sharply from the midline near 50, indicating that bullish momentum may be building as buying pressure intensifies.
Meanwhile, the Bollinger Bands are starting to narrow slightly, signalling a potential volatility squeeze that could precede a directional breakout. The price is currently positioned around the middle band, indicating a balance between buying and selling forces.
On the downside, support levels lie at $180 and $168. A drop below $180 may trigger further selling or stop-loss liquidations, while a break under $168 could confirm a deeper correction. On the upside, the key resistance sits at $208, where profit-taking and fresh buying activity are likely to intensify if the price breaks above it.
Key takeaway
Nvidia’s potential $300bn surge isn’t a sign of euphoria - it’s a reality check for those betting on an AI crash. The company’s results confirm that artificial intelligence has moved beyond the phase of promise into proof. As capital shifts from prototypes to platforms, the question isn’t whether AI will endure - it’s how fast it will reshape every market it touches. For now, Nvidia remains the pulse of that transformation.
For traders navigating that transformation, platforms like Deriv MT5 offer exposure to the tech rally’s next phase - while tools such as the Deriv trading calculator provide the precision to manage risk as the AI-driven market matures.

Sanctions vs supply glut: The battle defining Oil prices
Oil prices are caught in a tug-of-war that defines the entire energy narrative right now - sanctions versus surplus.
Oil prices are caught in a tug-of-war that defines the entire energy narrative right now - sanctions versus surplus. As Washington’s latest restrictions on Russian oil giants, such as Rosneft and Lukoil, take effect, traders are wondering whether this will finally squeeze supply enough to lift prices or if swelling inventories and record U.S. output will keep them grounded.
WTI crude has hovered near $60 in recent sessions, reflecting that same indecision. Every headline about sanctions sparks a flicker of optimism; every inventory report snuffs it out. The outcome of this standoff - between geopolitics and fundamentals - will decide whether oil’s next move is a breakout or another false dawn.
What’s driving the rebound
According to analysts, the recent oil bounce is largely fuelled by heightened concern over Russia’s export flows. In a press release issued by the U.S. Department of the Treasury, the United States and allied countries have imposed sweeping sanctions targeting major Russian oil producers, including Rosneft and Lukoil, along with hundreds of vessels from the “shadow fleet”.
These measures are designed to choke off Russia’s oil revenues and, by extension, reduce its export volumes. The logic is simple: fewer barrels from Russia = tighter global supply = higher prices. But the counter-force is significant: global supply remains robust, and demand isn’t bouncing back as expected.
According to the International Energy Agency (IEA), non-OPEC+ production is forecast to grow by 1.7 million barrels per day (bpd) in 2025, while demand growth is projected at just 0.79 million bpd, signalling a structural surplus unless changes occur.
Meanwhile, data show that Russia’s output and export adapt-workarounds remain effective so far - Russian production rose by about 100,000 bpd even after sanctions. Thus, the rebound is caught between a genuine supply shock narrative and a stubborn demand/stock overhang, and whether prices break out depends on which side prevails.
Why it matters
For traders, producers and consumers, this dynamic is far from academic. A sustained rally driven by supply constraints would favour oil-heavy portfolios, refining margins, and exporting nations. Conversely, if oversupply persists and demand disappoints, even the sanction narrative won’t save prices. As one senior energy analyst noted: “The market doesn’t expect much lost supply until enforcement becomes indisputable.”
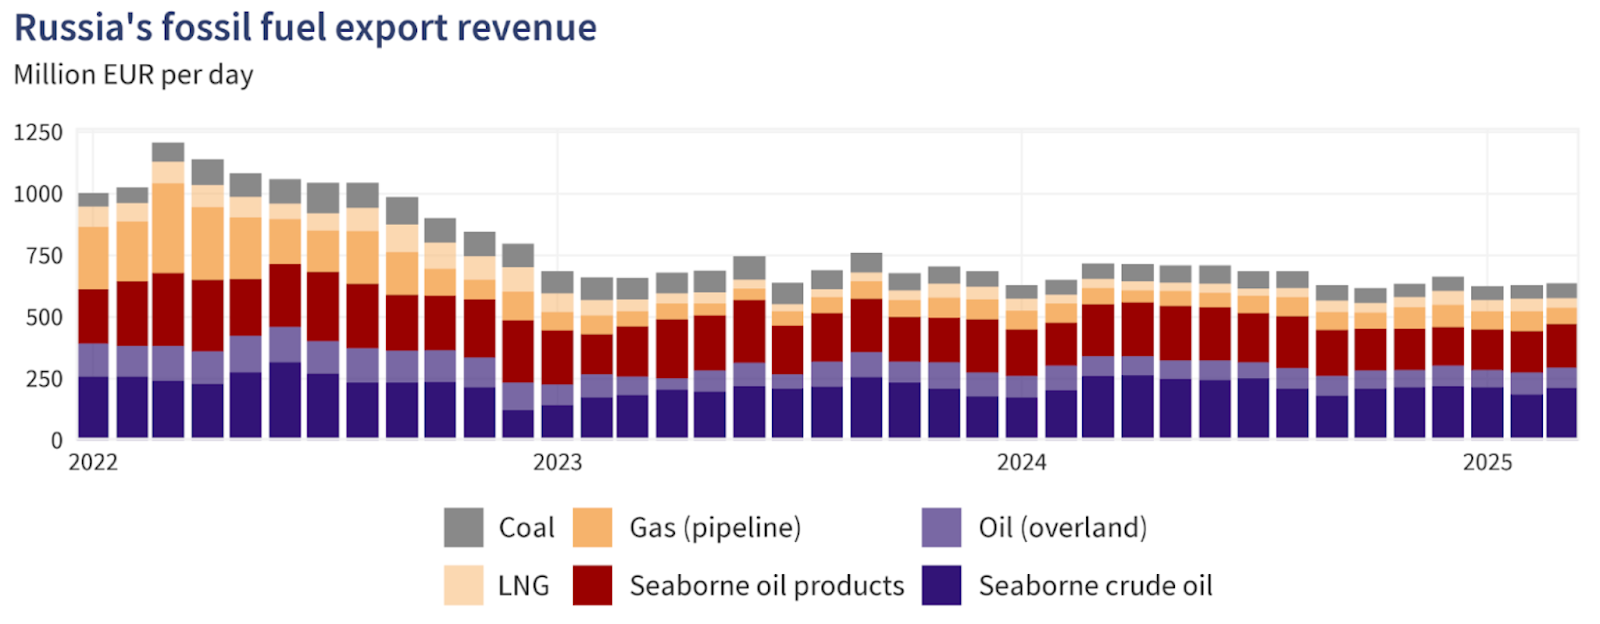
For Russia and its global buyers, the stakes are high. Russia’s oil and gas revenues plunged by 27% in October 2025 compared to the same month a year earlier, reflecting the pressure of sanctions even as volumes held up through workarounds.
At the same time, major oil importers such as India and China have been increasing their Russian cargoes in recent months before the November plunge, which has cast doubts about continued oil flows to those countries.
So, if importers continue to absorb discounted Russian barrels, global supply may remain ample even though the narrative suggests otherwise. On the consumer end, if oil prices are kept low due to oversupply, fuel costs remain manageable. If supply loss dominates, refined-product prices (diesel, gasoline) could rise, feeding inflation and impacting economic growth - a risk to be watched for in both developed and emerging markets.
Impact on the market
In practical terms, the battle lines are drawn according to analysts. On the supply-risk side, if sanctions bite and Russian exports drop materially, markets may tighten quickly, and oil prices could rally.
The risk premium is already reflected in crude spreads: the discount for Russian Urals crude versus global benchmarks jumped to around US$19 per barrel by early November, as buyers shunned Russian cargoes, according to a report by Meduza. That suggests the sanction effect may be starting to crack.
But on the flip side, tracking data suggest that Russian flows are still being rerouted, and global producers (especially shale, Brazil and the U.S.) are responding. With U.S. production at record levels and inventories increasing, the oversupply story remains viable, according to industry commentators. If demand remains weak - for instance, from China or the global industry - then any supply-shock rally may be short-lived, and prices could retreat.
Refining and trade flows are also adjusting. Dealers and refiners are now considering discounted Russian crude, longer shipping routes, and higher freight and insurance costs - all of which increase complexity but don’t necessarily immediately reduce volumes. Until actual barrel losses show up in export data, the market may remain in limbo, reluctant to commit to strong upward momentum.
Expert outlook
According to analysts, the most probable scenario is a market stuck in a range-bound trading pattern, punctuated by bursts of volatility. That is, oil may temporarily rally on rumours of sanctions or supply disruptions, but unless demand proves stronger and supply genuinely tightens, the move may lack legs. Reuters reported that the IEA continues to expect supply growth outpacing demand this year.
If enforcement of sanctions tightens - for example, if shadow-fleet tankers are blocked, insurance costs spike or major importers pull back from Russian oil - then we could see a meaningful rally.
On the demand front, counter-signals to watch include refining run-rates (which remain under pressure), travel and mobility trends, and China’s petro-chemical demand. Until one of these breaks clearly favourably, the oversupply story will likely keep a lid on prices.
In short, the supply risk is real, but it hasn’t yet overridden the oversupply/weak-demand backdrop. Until that happens, the rally remains tentative.
Oil technical insights
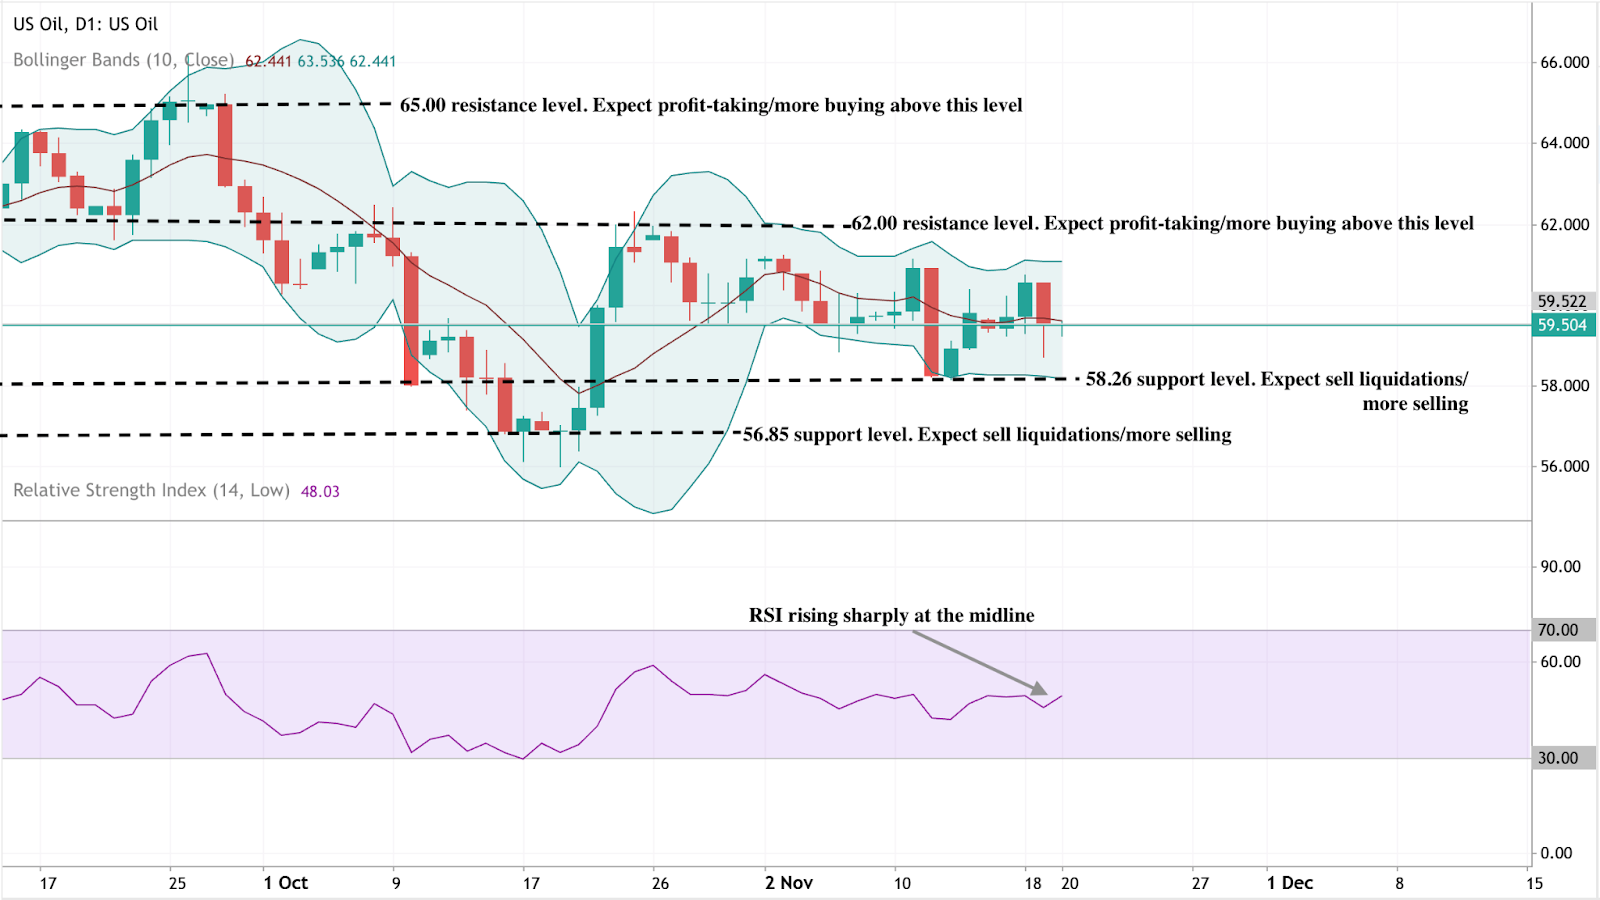
At the time of writing, US Oil is trading around $59.50, consolidating within a narrow range as momentum starts to stabilise. The RSI is climbing sharply from the midline near 50, hinting at strengthening bullish momentum and suggesting that buyers may be regaining short-term control.
The Bollinger Bands (10, close) are relatively tight, signalling reduced volatility and the potential for a breakout. Price action remains centred around the middle band, showing indecision but with a slight upward bias as buyers attempt to push above the mid-range.
Key support levels are found at $58.26 and $56.85, where a break lower could trigger further selling pressure or stop-loss liquidations. On the upside, resistance sits at $62.00 and $65.00 - levels where profit-taking and stronger buying activity could emerge if the market breaks higher.
Key takeaway
The oil market is at a crossroads where the sanction-driven supply-risk narrative clashes with the solid structural reality of oversupply and weak demand. While the latest Russian sanctions have sharpened the risk premium, global production and inventories remain elevated and demand remains fragile.
Unless export losses are real and demand picks up, the oversupply story will likely keep oil prices pinned. The next key signals to monitor: export data from Russia, inventory changes globally and demand indicators from Asia and the U.S. Stay alert - this is a high-stakes battle that could tip either way.
For traders navigating the oil market, Deriv MT5 offers exposure to both WTI and Brent. Meanwhile, tools such as the Deriv trading calculator provide the precision needed to manage risk as the AI-driven market matures.

USD/JPY outlook: Can the Yen hold its ground amid Japan’s policy tug-of-war?
Reports indicate that the Japanese yen is struggling to maintain its stability as Japan’s fiscal and monetary priorities diverge in opposite directions.
Reports indicate that the Japanese yen is struggling to maintain its stability as Japan’s fiscal and monetary priorities diverge in opposite directions. A massive ¥25 trillion stimulus plan from Prime Minister Sanae Takaichi has reignited concerns about inflation and weighed on the currency, while the Bank of Japan’s cautious stance on rate hikes offers little support. The result is a yen pinned near a nine-month low, with the USD/JPY pair hovering around ¥155.
Many say Japan’s policy tug-of-war is tilting decisively against the yen. Unless the government and central bank find common ground, traders may see further weakness - especially if the dollar remains buoyed by a patient but firm Federal Reserve.
What’s driving USD/JPY
The yen’s weakness stems from a widening policy divide inside Japan’s leadership. Prime Minister Takaichi’s administration has revived Abenomics-style stimulus, prioritising fiscal expansion to boost wages and consumer demand.
Lawmakers have proposed a supplementary budget exceeding ¥25 trillion, stoking concerns over rising debt issuance and sending 40-year Japanese government bond yields to record highs.
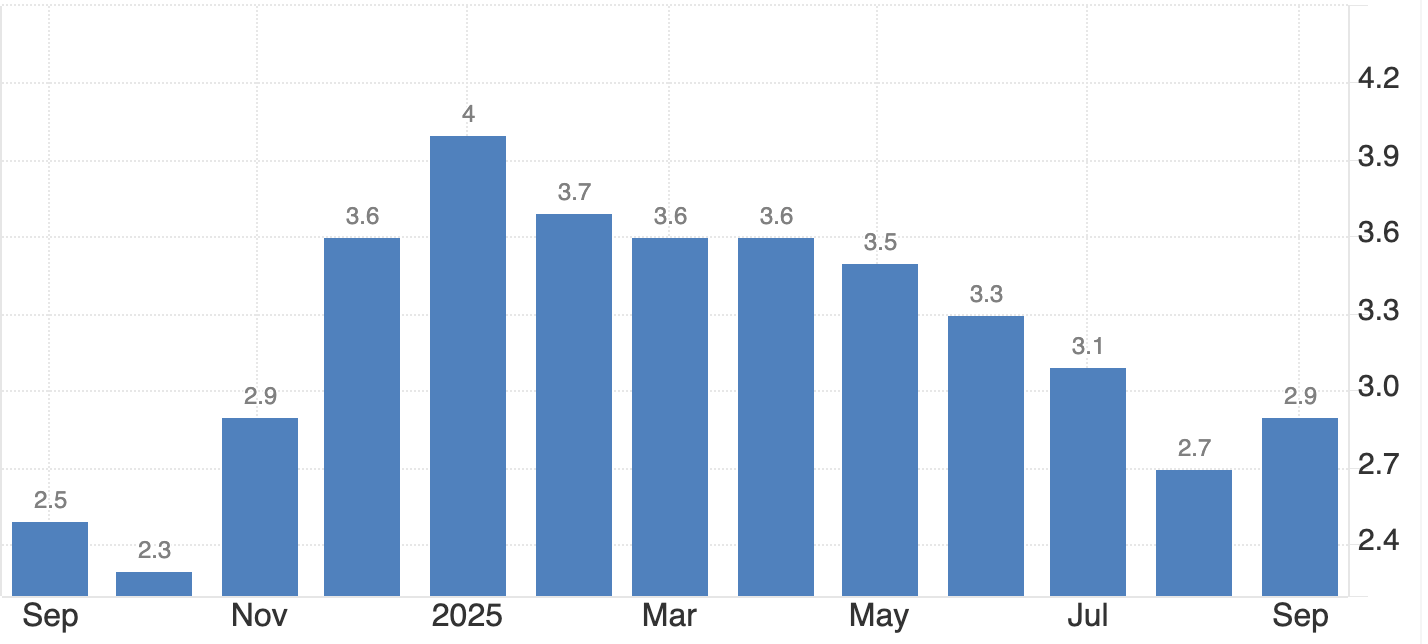
Meanwhile, the Bank of Japan (BoJ) is caught between political pressure and macroeconomic caution. Inflation, currently around 2.9%, remains above target, yet the prime minister insists on keeping rates low until wage growth - not food or energy costs - drives price stability.
Governor Kazuo Ueda has hinted at tightening if inflation persists, but uneven growth complicates matters: GDP grew 1.1% year-on-year, yet contracted 0.4% quarter-on-quarter. This tug-of-war has left investors unsure whether Japan’s policies are reflating the economy or eroding its currency.
Why it matters
This internal conflict is redefining how global markets view the yen. Once seen as a safe-haven anchor, it’s now behaving more like a risk currency, moving with rather than against global sentiment. “Japan has added a tumultuous element - they’re a little more wild, a little more volatile,” said Juan Perez of Monex USA. That volatility reflects a new reality: fiscal expansion is now Japan’s dominant narrative, while monetary prudence takes a back seat.
For traders, the risk is that verbal intervention replaces actual action. Finance Minister Satsuki Katayama has expressed concern over the yen’s sharp depreciation, but Tokyo has so far refrained from stepping into the market. Intervention is likely only if USD/JPY breaches ¥156 decisively - a level seen as politically sensitive rather than economically critical by analysts.
Impact across markets
According to reports, the consequences of Japan’s fiscal-monetary split are evident across its bond and currency markets. The yield curve has steepened sharply as investors price in heavier debt issuance, while near-zero short-term rates keep domestic liquidity abundant. This imbalance encourages capital outflows, as investors seek higher yields abroad, further putting downward pressure on the yen.
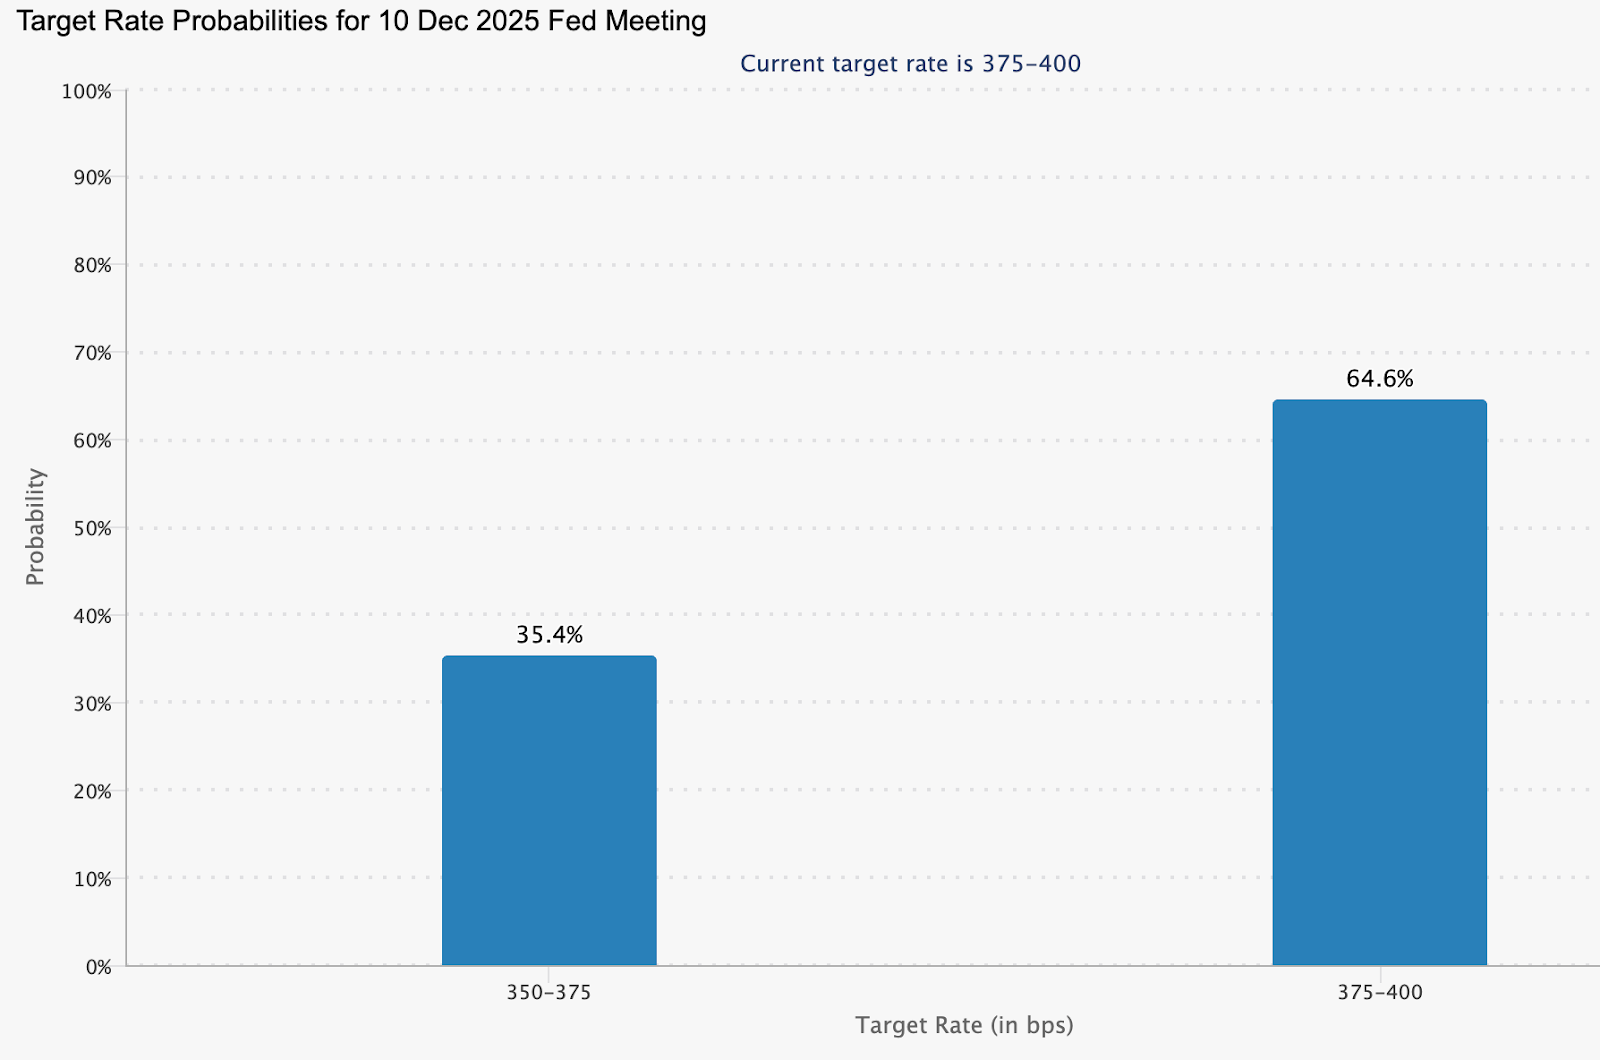
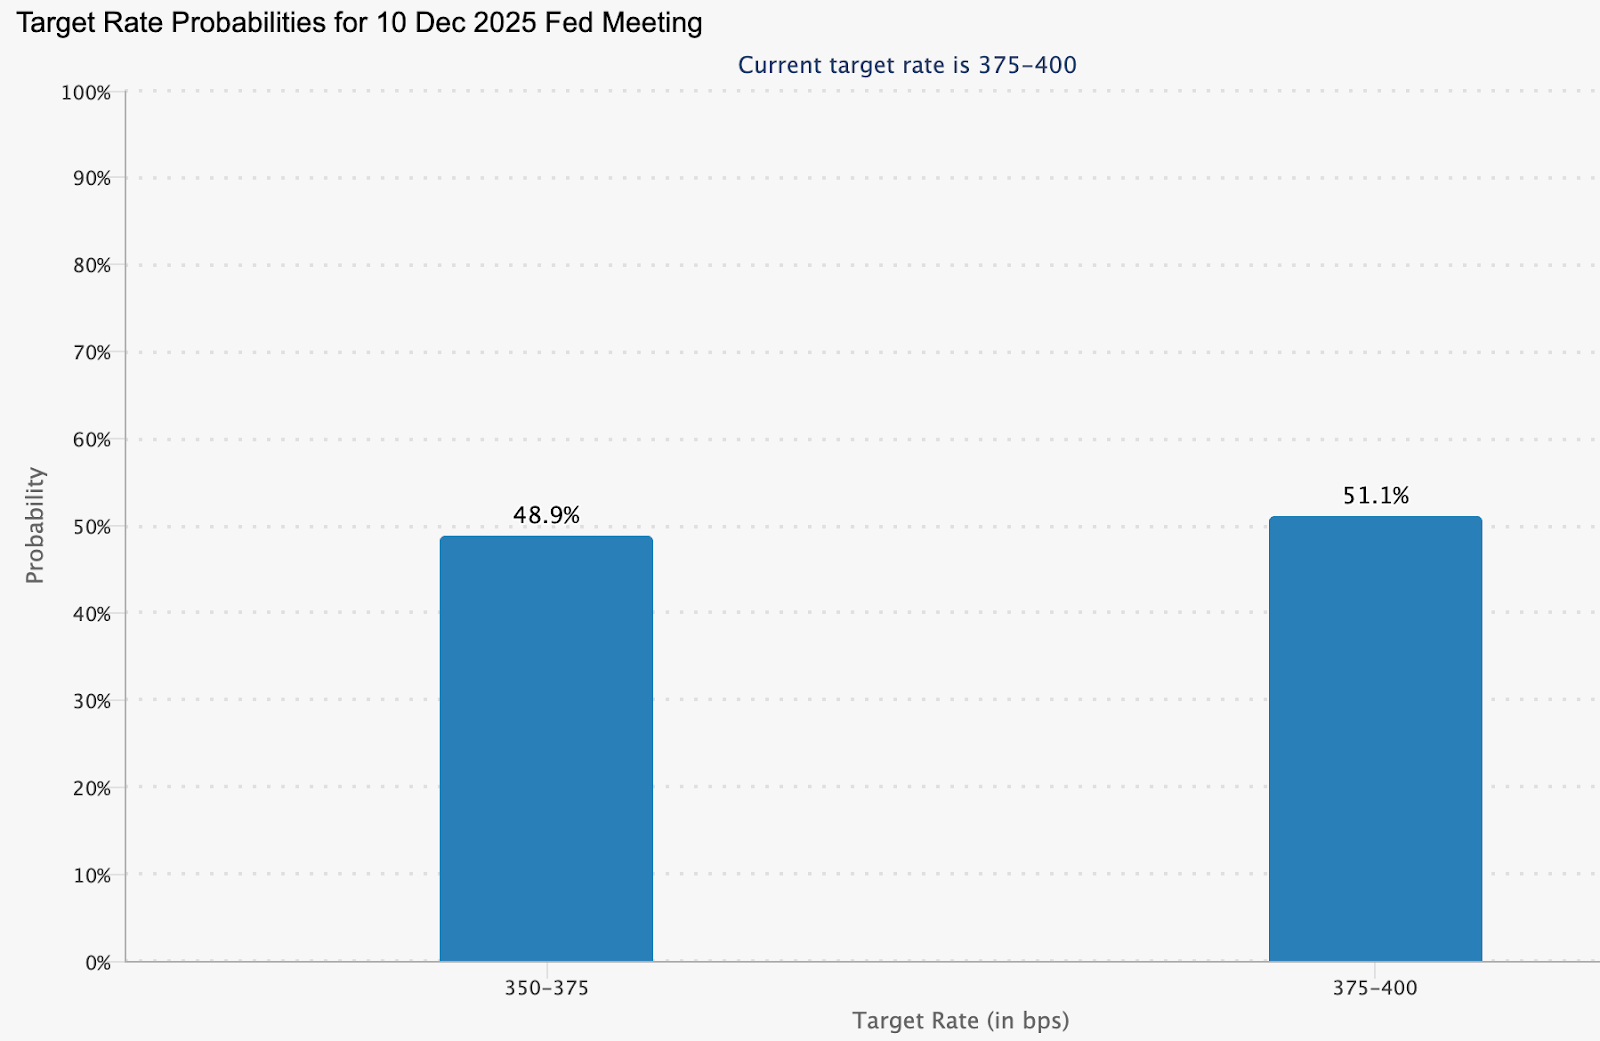
Across the Pacific, the Federal Reserve’s steadiness has reinforced dollar strength. Officials such as Philip Jefferson and Christopher Waller continue to advocate patience on rate cuts, trimming the probability of a December reduction to around 48%, down from 60% last week (CME FedWatch).
According to analysts, as long as this interest-rate gap persists, the dollar will remain structurally favoured against the yen, - and any yen rallies will likely prove temporary.
Expert outlook
Analysts see little relief for the yen in the near term. Barclays recommends holding a long position on the dollar against the yen, arguing that Takaichi’s expansionary agenda will suppress domestic yields and maintain downward pressure on the currency. Still, a sustained climb beyond ¥156 could test Tokyo’s resolve and force coordinated intervention.
The next key event is the delayed US Non-Farm Payrolls report, expected to provide fresh insight into labour market conditions. A weaker reading could trigger short-term dollar selling, allowing the yen to recover briefly. Yet without a policy shift in Japan, that reprieve may be short-lived. For now, the yen’s trajectory is dictated less by data and more by the dissonance between fiscal ambition and monetary caution.
USD/JPY technical insight
At the time of writing, USD/JPY is trading around 155.45, extending gains within a price discovery zone as bullish momentum persists. The pair is hugging the upper Bollinger Band, signalling strong buying pressure but also hinting at a possible overextension.
The RSI is climbing toward the overbought region, reinforcing the risk of a short-term pullback or profit-taking. Immediate support lies at 152.96, followed by 146.45, where a breakdown could trigger sell liquidations and accelerate downside movement.
However, as long as prices hold above the middle Bollinger Band and 153.00, the broader uptrend could remain intact, supported by policy divergence between the Federal Reserve and the Bank of Japan.

Key takeaway
Japan’s yen problem isn’t just about markets - it’s about messaging. Expansionary fiscal policy collides with a hesitant central bank, leaving investors unsure which signal to follow. The result is a currency under sustained strain, with verbal intervention doing little to stop the slide. Unless Tokyo finds alignment between stimulus and stability, the yen’s effort to hold its ground may remain more symbolic than successful.

Gold’s reversion to the mean: A pause before the next rally?
Gold has climbed back above $4,050 per ounce, stabilising after a sharp two-week selloff that pulled the metal down from record highs.
Gold has climbed back above $4,050 per ounce, stabilising after a sharp two-week selloff that pulled the metal down from record highs. The move reflects what analysts increasingly describe as a reversion to the mean - a natural correction following a steep run from $3,450 to $4,380 earlier in the quarter.
With the long-delayed US Non-Farm Payrolls (NFP) report now in focus, traders are watching whether this consolidation is a breather before the next leg up. The broader backdrop remains tense. Hawkish Federal Reserve remarks, delayed data from the US government shutdown, and continued geopolitical stress are all reshaping sentiment. Yet, behind the noise, gold’s pullback looks less like weakness - and more like equilibrium returning.
What’s driving gold’s mean reversion
The latest correction follows months of relentless buying, fuelled by soft US data, de-dollarisation flows, and record central-bank accumulation. Gold’s sprint from $3,450 to $4,380 outpaced fundamentals, leaving technical indicators stretched and sentiment euphoric.
Now, as traders recalibrate expectations for a December rate cut - pricing in a 48.9% chance according to CME FedWatch - the metal has slipped back toward its midrange, around $4,050–$4,100, where short-term and long-term averages converge.
This retreat also mirrors a psychological reset. Markets are digesting the Fed’s cautious tone, with Vice Chair Philip Jefferson urging a “slow approach” to policy changes and regional presidents Bostic and Schmid signalling preference for steady rates. Those comments, paired with delayed macro data, have thinned speculative positions and allowed gold to breathe. In effect, the market is rediscovering balance - a hallmark of mean reversion after an overextended move.
Why it matters
Gold’s mean reversion tells a deeper story about trust and monetary fatigue. As Citadel’s Ken Griffin noted, the rising price of gold reflects “a loss of trust first in US Treasuries, then in G7 bond markets.” Investors are responding not to short-term volatility, but to structural concerns about government debt and the stability of fiat currency.
Analysts at Deutsche Bank maintain that the medium-term trend remains intact, projecting an average gold price of $4,000 per ounce next year. They highlight “elevated official demand” - a reference to sustained central-bank buying.
In October, China’s central bank added 0.9 tonnes to its reserves, marking its 12th straight month of accumulation. Ongoing purchases throughout 2025 have lifted China’s official gold reserves to 2,304.5 tonnes.
This underlines that while traders may be reverting to the mean, nations are not - they’re steadily diversifying away from the dollar.
Impact across markets
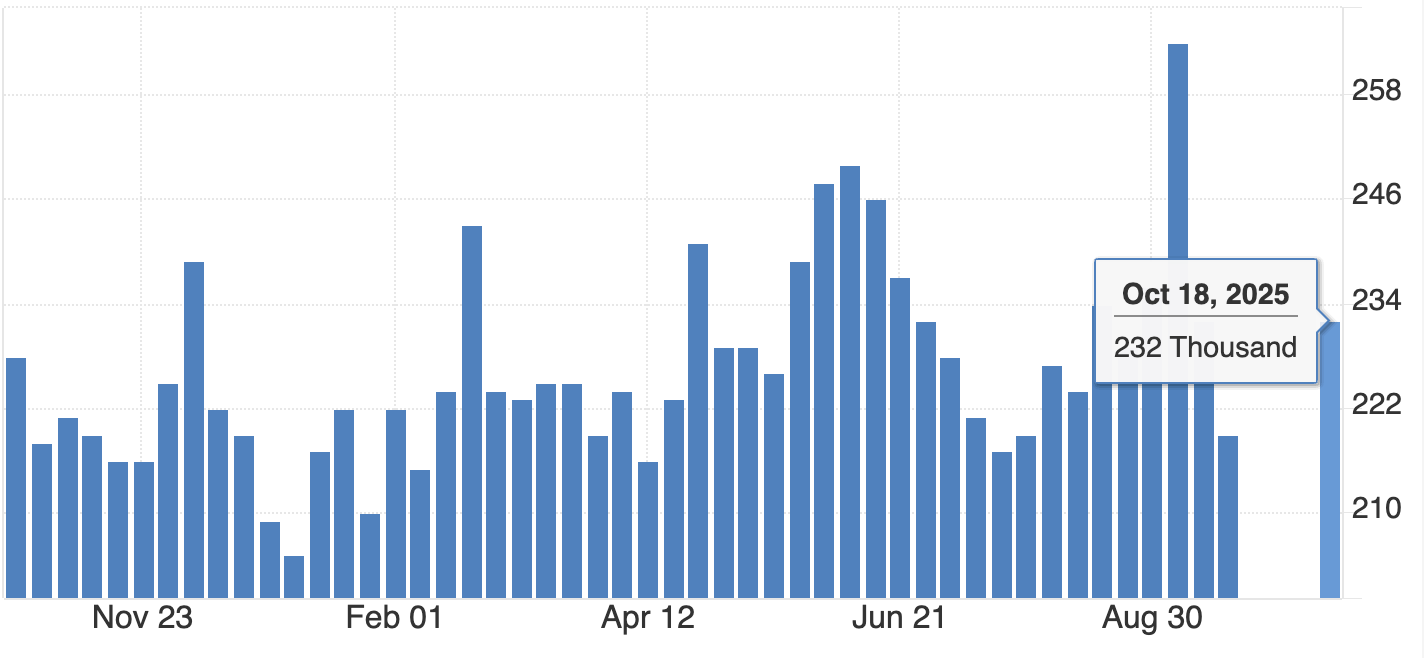
In China, investor appetite for gold remains vigorous even during the correction. ETF inflows jumped RMB 32 billion (US$4.5 billion) in October, pushing total holdings to a record 227 tonnes.
Physical demand, measured by withdrawals from the Shanghai Gold Exchange, rose 17 tonnes year-on-year to 124 tonnes, defying seasonal softness. The data suggests that investors see dips as opportunities, not red flags.
Globally, the story is similar. Soft US employment data and climbing jobless claims have tempered the dollar’s strength, nudging investors back into gold and silver.
Still, there’s awareness that a stronger NFP print or easing geopolitical risk could stall momentum. Even so, mean reversion isn’t a bearish event - it’s the market’s way of restoring order after a speculative sprint. And order, in uncertain times, is the most bullish foundation of all.
Expert outlook
Most analysts agree that gold’s medium-term trajectory remains higher, although near-term volatility will hinge on the US jobs data and the Fed’s stance in December. Independent trader Tai Wong says, “soft data is slightly boosting hopes for a December cut - helping gold and silver, which are trying to break a three-day losing streak.” That sentiment captures the current equilibrium: cautious optimism tempered by macro prudence.
If the NFP report underperforms, gold could swiftly retest $4,200, according to analysts. If it surprises to the upside, a dip toward $3,950 would complete a textbook mean reversion cycle before stabilising. Either way, the long-term bull case - driven by de-dollarisation, AI-driven labour disruption, and inflation inertia - remains intact. The question isn’t whether gold rises again, but when.
Gold technical analysis
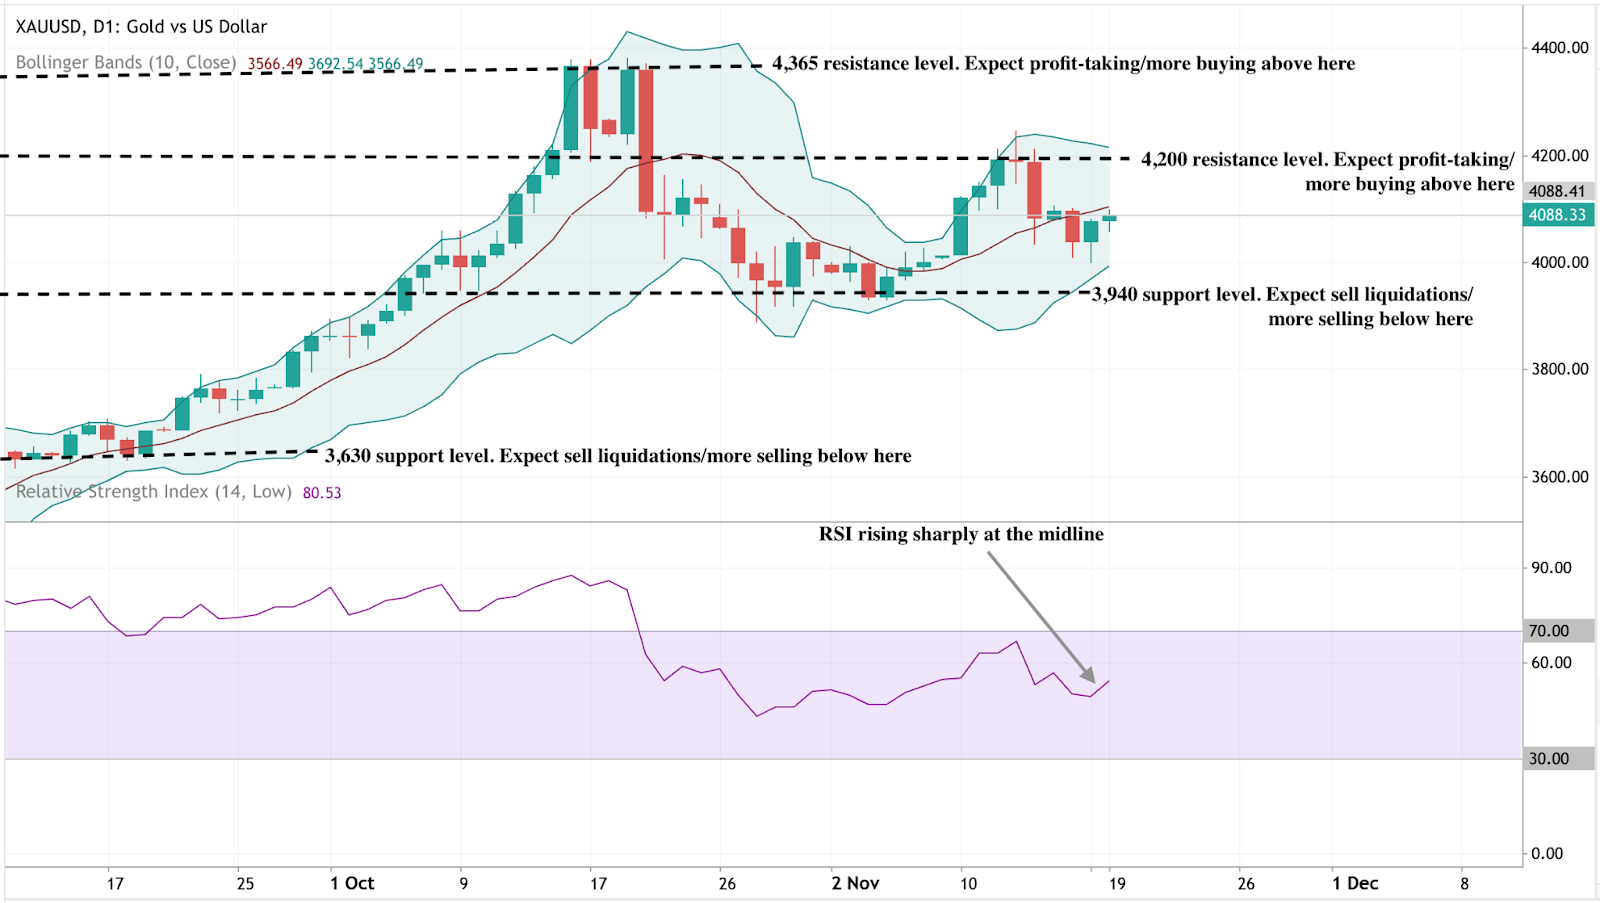
At the time of writing, XAU/USD is trading near $4,088, rebounding from the lower Bollinger Band as buyers re-enter the market. The Bollinger Bands are beginning to widen after a period of contraction, suggesting that volatility may be returning.
The RSI is rising sharply from the midline, signalling improving bullish momentum. Key resistance levels are seen at $4,200 and $4,365, where profit-taking or further buying could occur if gold breaks higher. On the downside, a fall below $3,940 would likely trigger sell liquidations, exposing deeper support at $3,630.
Overall, gold appears to be in the early stages of a potential bullish continuation, with the technical setup hinting at renewed upside pressure if momentum sustains above the mid-Bollinger Band.
Key takeaway
Gold’s pullback to the $4,000 zone isn’t weakness - it’s rhythm. A reversion to the mean after a parabolic rise is how sustainable trends reset. Beneath short-term volatility, the drivers of this bull phase - de-dollarisation, central-bank accumulation, and macro distrust - remain fully in play. As the US jobs data and Fed decisions unfold, this pause could mark the quiet before gold’s next major rally.

Bitcoin crashes under $90K as ‘death cross’ bites
Spot prices printed as low as 89,420 dollars, the weakest level since February, only six weeks after setting a record near 126,250 dollars.
Bitcoin slipped below 90,000 dollars on Tuesday, extending a selloff that has erased its 2025 gains and pushed sentiment toward the bleak end of the spectrum. Spot prices printed as low as 89,420 dollars, the weakest level since February, only six weeks after setting a record near 126,250 dollars.
The breakdown coincided with a bearish technical crossover known as a death cross and increasingly hesitant fund flows into U.S. spot ETFs.
Together with macro anxiety around the rate path, these factors have tightened liquidity and amplified swings across majors. The next phase hinges on whether price can quickly reclaim lost support and whether ETF prints stabilise from recent choppiness.
What’s driving the slide
The proximate trigger is technical: Bitcoin fell back through reclaimed support near 93,700 dollars, lost its 200-day moving average, and then registered a death cross as the 50-day slipped beneath the 200-day.
On its own the signal is imperfect, but in weak liquidity regimes it often coincides with multi-week drawdowns as momentum traders de-risk.
Flows add fuel. U.S. spot ETF activity has turned choppy after heavy intake earlier in the year, with trackers showing sequences of outflows or flat prints that blunt marginal demand. When the incremental demand fades, price tends to chase lower liquidity pockets until new buyers emerge. Recent dashboards corroborate the stop-start nature of ETF demand. CoinDesk+1.
The Mt. Gox repayments - a trigger, not the cause
Adding fuel to the fire, over 10,600 BTC (worth roughly $953 million) were transferred from Mt. Gox wallets on 18 November 2025, marking the first such movement in eight months.

The long-running repayment saga, stemming from the 2014 collapse of the world’s then-largest exchange, has left creditors waiting over a decade for compensation.
While some feared that repayments could unleash fresh supply, blockchain data shows these movements were administrative, not market sales. Still, perception alone was enough to unsettle sentiment, sparking liquidations and feeding the broader risk-off tone. Analysts now estimate over 230,000 trading accounts were liquidated within 24 hours, totalling more than $1 billion in forced sell orders.
Why this matters
Sentiment has swung hard into fear. CoinDesk flagged “extreme fear” conditions into the weekend and early week, aligning with widely followed gauges that punish downside volatility and negative breadth. In past cycles, similar extremes have marked acceleration phases within larger drawdowns or short-lived exhaustion points.
The macro overlay is not helping. Traders are parsing shifting expectations for U.S. rate cuts and inflation risks tied to policy developments, a mix that reduces risk appetite and tightens crypto liquidity. Reuters’ read-across captures the mood: a near 30 percent retreat from the October peak and growing caution among institutions.
Impact on markets and participants
Price leadership rotated back to bitcoin as traders sold altcoins to manage risk, a pattern visible when social attention and volumes consolidate in the benchmark asset during stress. Ether and other large caps have tracked lower alongside, while crypto-linked equities have generally underperformed on drawdown days, transmitting crypto volatility into listed proxies.
For allocators, ETF prints serve as the cleanest real-time barometer of spot demand. Multi-day flat or negative flows often coincide with fragility in order books and heavier slippage, which is why desks are laser-focused on whether the next sequence turns positive again. If it doesn’t, the unfilled liquidity pocket toward 86,000–88,000 dollars cited by traders continues to be a live risk.
Expert outlook
CoinDesk’s market desk notes that fear spikes of this magnitude have sometimes preceded relief rallies, particularly when realised-loss pressure begins to stabilise and ETF outflows slow. That requires confirmation: a swift reclaim of broken support and evidence of renewed net inflows. Until then, technicals and positioning argue for elevated two-way volatility.
Long-horizon investors continue to point at structural adoption and institutional participation as reasons to stay constructive on multi-year horizons. Dan Tapiero, whose 50T platform backs later-stage crypto companies, frames short-term turbulence as noise against a secular build-out, a view he has reiterated while forecasting a much larger digital-asset economy over the next decade.
Bitcoin price technical insight
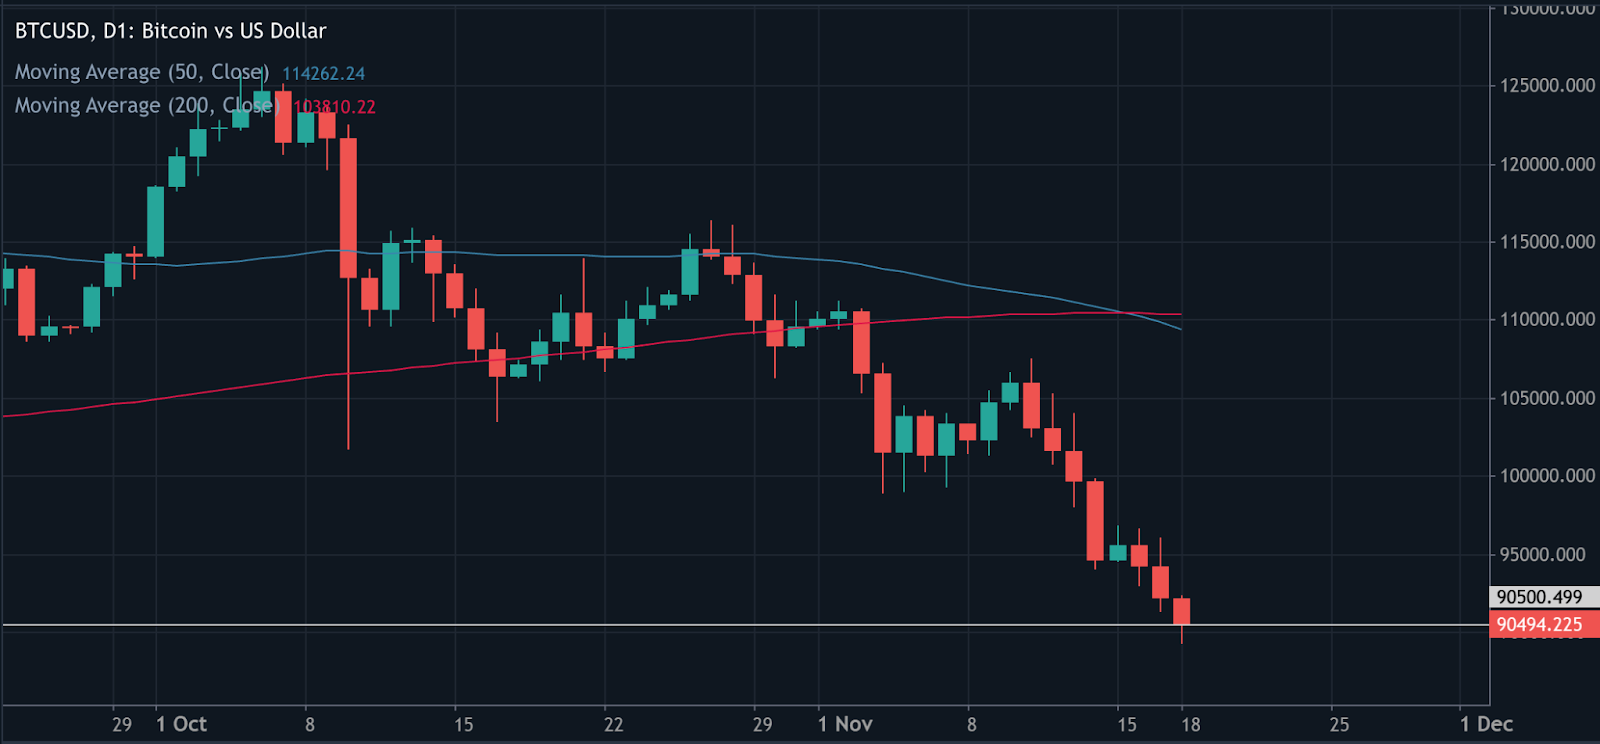
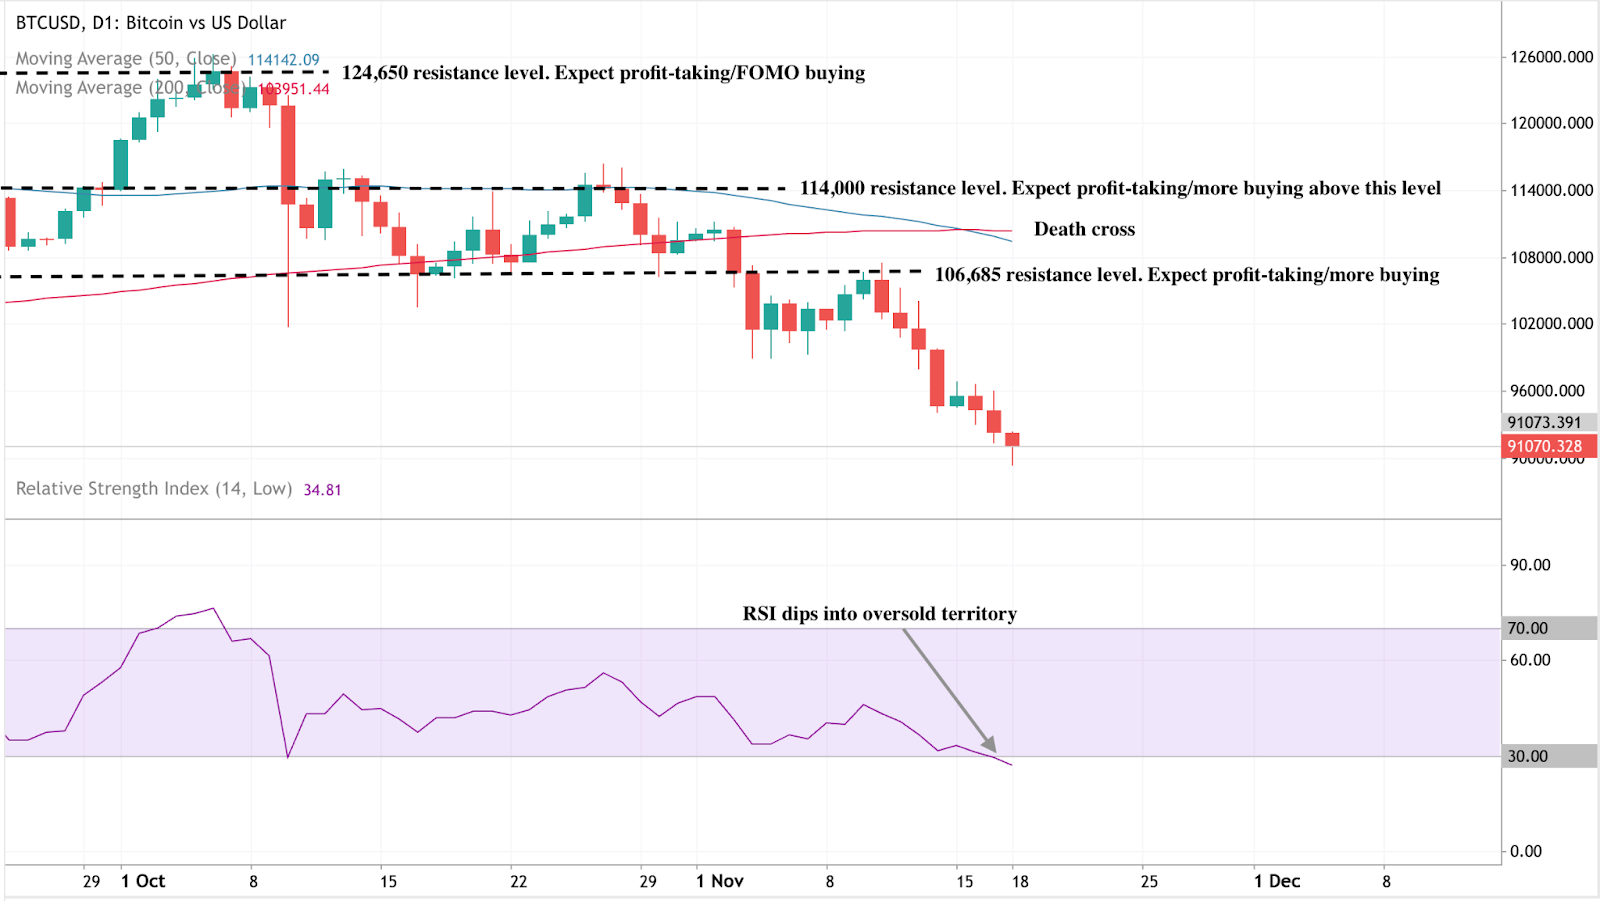
Bitcoin (BTC/USD) continues its downward trajectory after forming a death cross, with the 50-day moving average (MA) crossing below the 200-day MA - a classic bearish signal suggesting extended downside pressure. The price is currently hovering near $91,000, after repeatedly failing to hold above key resistance levels at $106,685, $114,000, and $124,650, where prior rallies saw heavy profit-taking and FOMO-driven buying.
The Relative Strength Index (RSI) has dipped into oversold territory, indicating that selling momentum may be overextended and a short-term technical rebound could occur. However, as long as BTC remains below the 50-day MA, the broader trend remains bearish, with traders likely to view any bounce as a chance to sell into strength.
Key takeaway
Bitcoin’s slide below $90,000 reflects a convergence of technical breakdown, hesitant ETF demand, and a risk-off macro tone. The resulting fear spike is typical of late-stage selloffs, but it needs flow confirmation before calling a durable low. Watch for a quick reclaim of the $ 90,000 - $93,000 zone and a run of positive ETF prints to validate any rebound attempt. Until then, expect elevated volatility and tighter liquidity conditions.
Leider konnten wir keine Ergebnisse für finden.
Tipps zur Suche:
- Überprüfe deine Schreibweise und versuche es erneut
- Versuchen Sie ein anderes Schlüsselwort