Results for

Beginners guide: The dos and don’ts of CFD trading
CFD (Contract for Difference) trading lets you speculate on price movements across financial markets without owning the underlying assets.
CFD (Contract for Difference) trading lets you speculate on price movements across financial markets without owning the underlying assets. It’s a flexible, high-potential way to participate in global markets — from forex to synthetic indices — but it carries a higher level of risk. For beginners, it can feel complex at first, which is why building a solid foundation is crucial. This guide walks you through the key dos and don’ts of CFD trading, helping you make informed, disciplined decisions while managing risk effectively.
Quick summary
- CFD trading allows you to trade price movements without owning the assets.
- Choosing a regulated broker is an important step toward greater safety and transparency.
- Leverage, emotions, and overnight positions must be managed carefully.
- Deriv offers CFD trading through Deriv MT5 and Deriv cTrader.
What makes a reliable CFD trading platform?
Your broker is your entry point to the market. Always check that it’s fully regulated and that all licences are current and verifiable. Regulatory transparency helps foster a more trustworthy and informed trading environment.
At Deriv, regulatory information is publicly available for verification at any time. You can trade CFDs on two platforms:
- Deriv MT5 – An all-in-one solution for multi-asset trading.
- Deriv cTrader – Built for those who value ultra-fast execution, advanced charting, and market-depth tools.
Each supports CFDs across forex, stocks and indices, commodities, cryptocurrencies, ETFs, and synthetic indices, giving traders diverse opportunities within one ecosystem.
How can you practise CFD trading safely as a beginner?
Financial markets evolve constantly, so beginners must first understand key concepts like margin, leverage, spread, and stop loss.
A Deriv demo account provides 10,000 USD in virtual funds, which is ideal for testing CFD strategies in a real-time environment without financial risk. You can experiment with order types, observe how price movements affect potential profits or losses, and develop confidence before trading live.
Continuous learning is essential. Follow official Deriv blog updates, webinars, and trading community discussions. Even experienced traders revisit fundamentals regularly to adapt to changing markets and regulations.
How should you diversify your CFD portfolio?
CFD trading gives you access to multiple markets, but diversification must be strategic. A balanced portfolio spreads risk without diluting focus.
Start with two or three complementary asset classes. For example, combine forex pairs, stock indices, and synthetic indices.
Synthetic indices, available exclusively on Deriv, operate 24/7 and are unaffected by real-world events, offering traders continuous access to the markets.
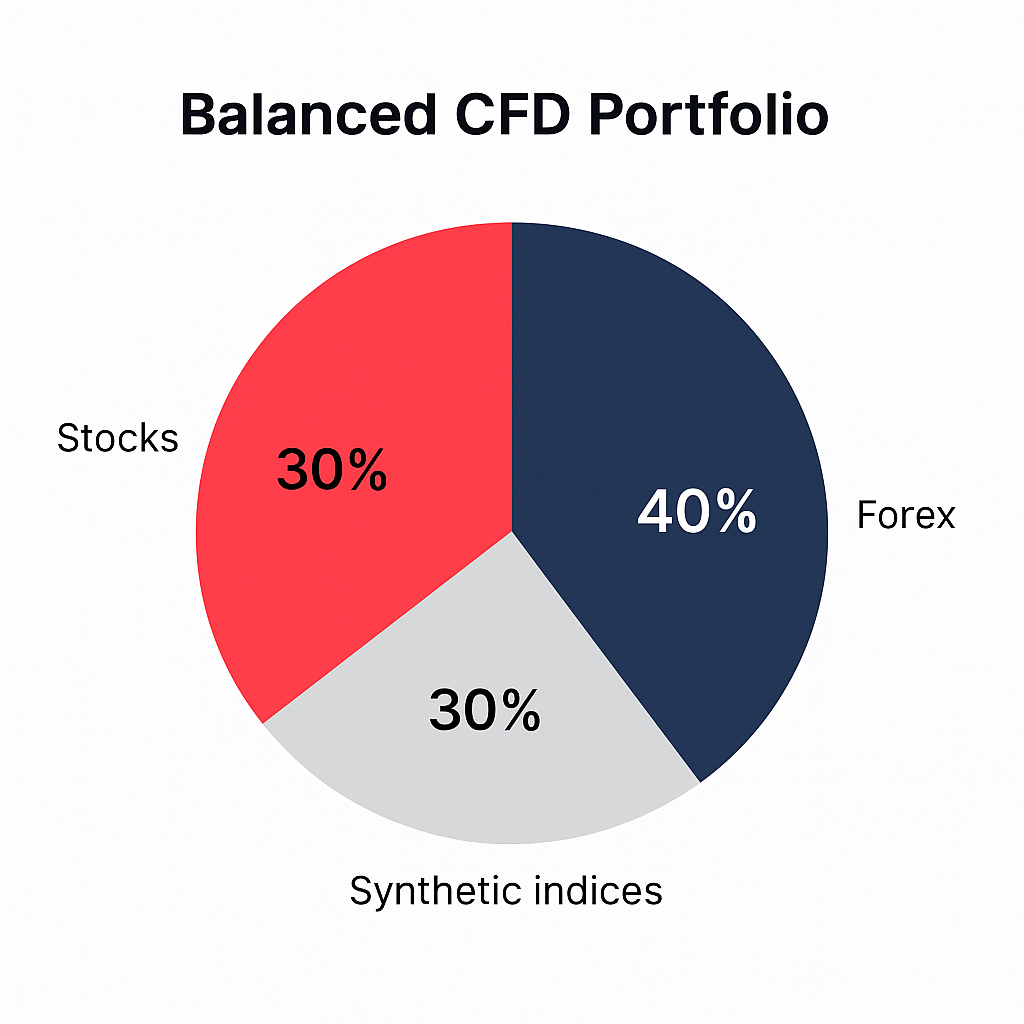
Diversification doesn’t guarantee profits, but it helps you control exposure and maintain performance.
Which risk-management tools should you use?
Leverage can magnify both potential profits and losses. That’s why proper risk management is vital. Use built-in tools like stop loss and take profit on every trade:
A stop loss closes your position when losses reach your preset limit.
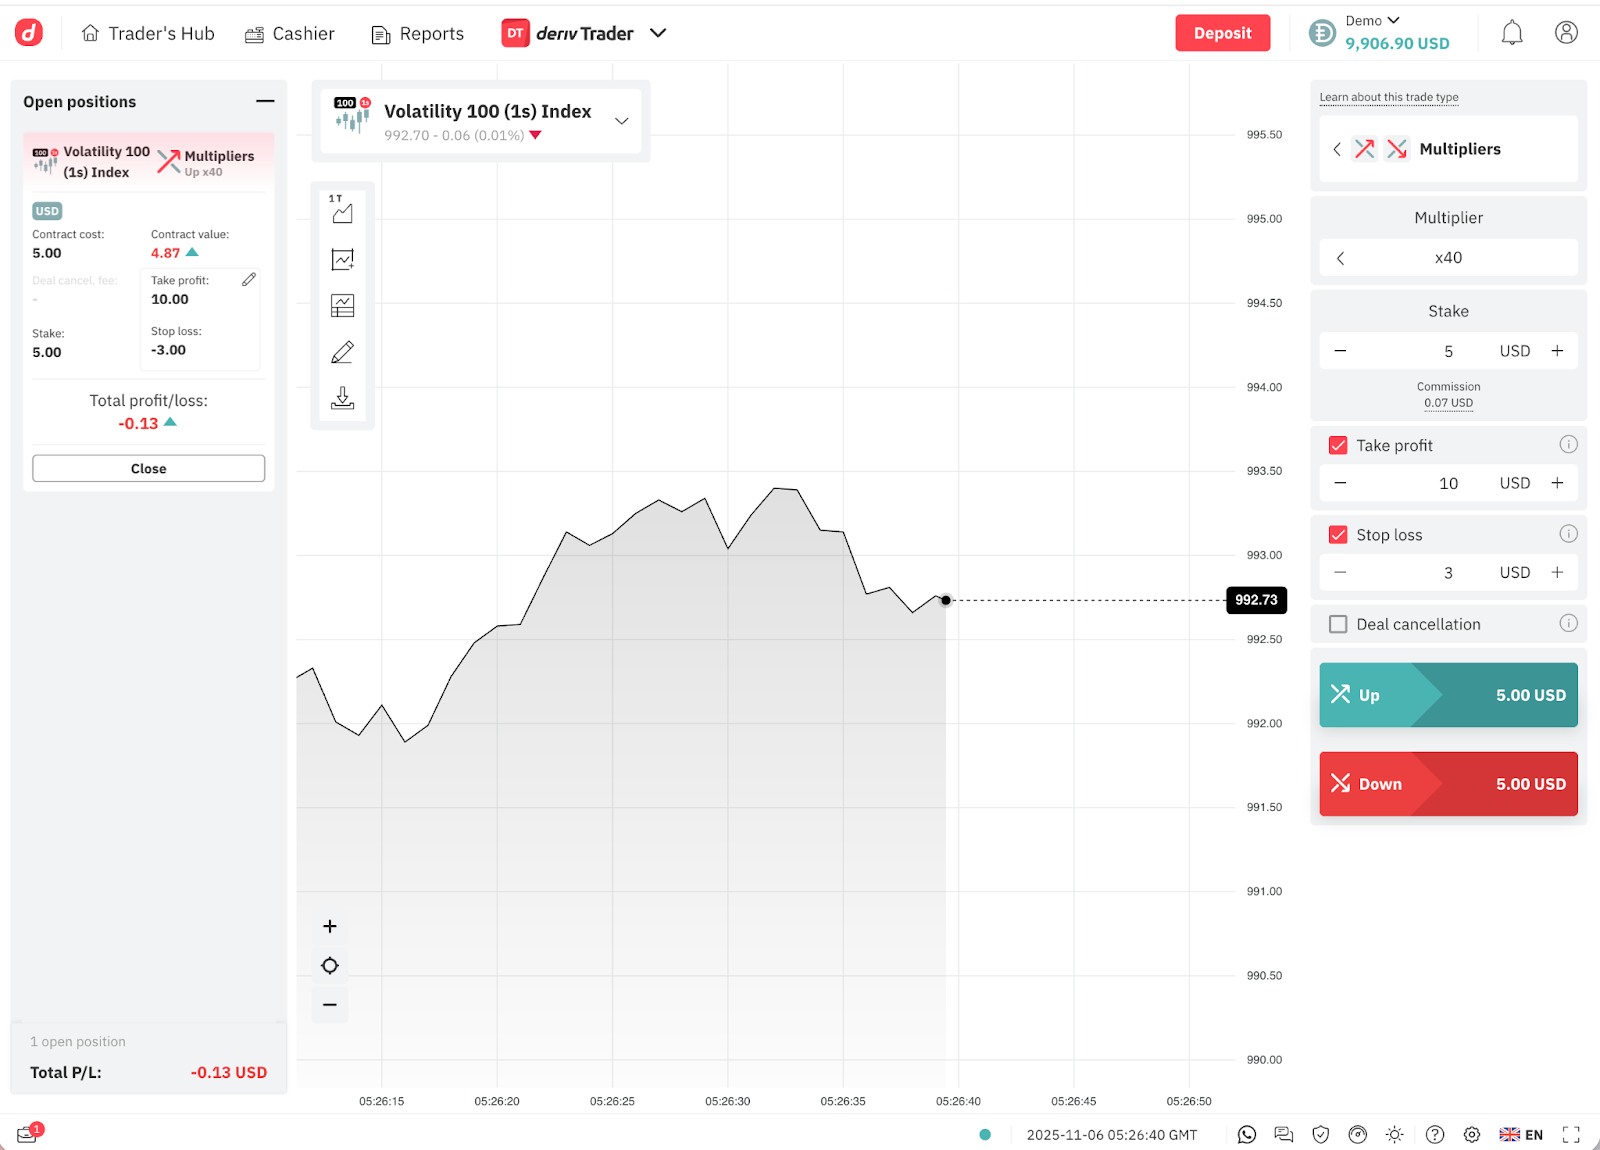
A take profit locks in potential gains automatically at your target price.

Deriv platforms display these functions clearly, helping you manage risk proactively.
“Leverage is a double-edged sword. It can magnify gains as easily as losses. Traders should never risk more than one to two per cent of their capital on a single trade.”
Also, calculate your risk-to-reward ratio before trading. A 1:3 ratio (risking $100 to target $300) helps strike a balance between ambition and caution.
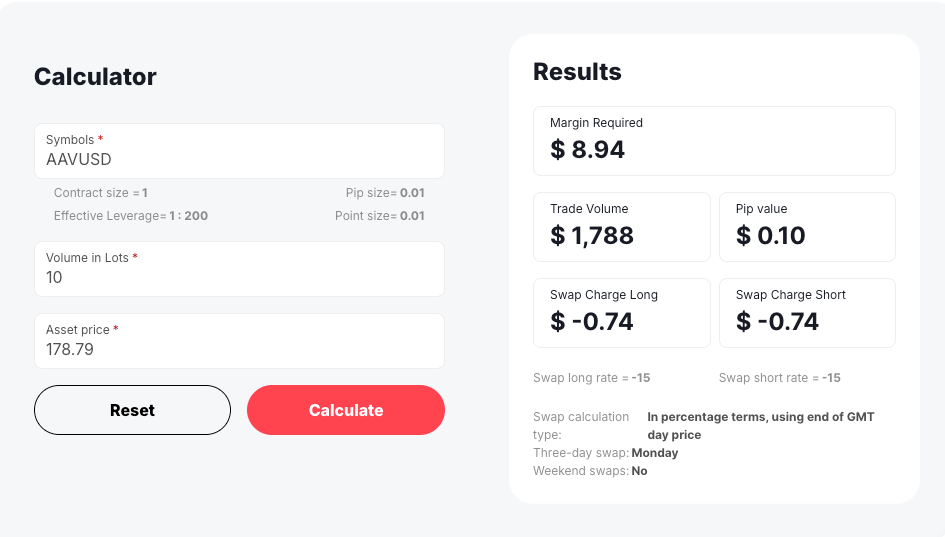
Use Deriv’s margin calculator to estimate exposure before you trade.
Why is it important to review your performance?
Keeping a trading journal is one of the most effective habits for consistent improvement. Record every trade’s reasoning, emotional state, and result. Over time, patterns emerge that reveal your strengths and weaknesses.
All Deriv platforms provide downloadable trade history and performance metrics, making reviews simple and actionable. Regular analysis helps you refine entries, improve timing, and stay accountable to your strategy.
Common mistakes to avoid when trading CFDs
1. Don’t over-leverage your account
Leverage enables larger positions with less capital, but high leverage also increases the potential for losses.
Before opening a trade, ask yourself: “Can my account comfortably cover the full position size if the market turns against me?”
If not, reduce leverage or choose a smaller trade.
Deriv’s margin calculator and risk indicators can help prevent overexposure.
Seeyan Padinjaraveettil, Senior Market Analyst, Deriv, elaborates:
“Consistent profitability in CFD trading comes from learning, not luck. Traders who track their performance monthly are more likely to adjust risk effectively.”
2. Don’t let emotions control your trades
Emotional trading leads to overreaction, especially after losses.
Avoid revenge trading or forming emotional attachments to assets.
Set predefined risk limits and take breaks during volatile periods to prevent impulsive decisions.
3. Don’t forget about overnight and hidden costs
CFD positions held overnight often incur swap or rollover fees, which can erode small potential profits.
Review each trade’s potential cost before holding it open. Deriv platforms display swap rates transparently so you can plan effectively.
4. Don’t ignore fundamental factors
Even if you prefer technical trading, understanding fundamentals gives you a clearer market view.
Economic data, interest rate decisions, and corporate earnings can all influence CFD prices.
Use Deriv’s economic calendar to monitor key global events
5. Don’t trade without a plan
Every CFD position should follow a defined structure:
- Entry rationale – Why you’re taking the trade.
- Profit target – Where you’ll exit if successful.
- Stop-loss limit – The loss you can tolerate.
Following a clear system reduces emotional errors and can create measurable results over time.
Final thoughts
CFD trading opens access to global markets with flexibility and precision, but lasting success relies on education, discipline, and risk awareness.
By applying these dos and don’ts, you’ll build a solid foundation for consistent, informed trading.
Deriv offers secure advanced platforms: Deriv MT5 and Deriv cTrader, plus free demo accounts and trading tools to support your growth.
Whether practising on demo or trading live, remember: learn, manage risk, and stay strategic.

How to use technical analysis tools on Deriv’s trading bot
Improve your strategy and teach your trading bot when to purchase a contract with the help of technical analysis.
Technical analysis is a process of analysing past data of financial markets, such as price and trading volume, to predict future price movements. While on other platforms, you analyse price chart patterns or apply technical indicators and execute trades manually, with Deriv Bot, these processes are automated with pre-set blocks.
If you are not familiar with the concept of technical analysis, we’ve covered it extensively in our What is technical analysis in trading blog. Let’s go through the details of how it works on Deriv Bot.
Ticks and candles analysis
The simplest way of using technical analysis on Deriv Bot is to use the ‘Tick and candle analysis’ blocks, which can be found under their respective subtab in the ‘Analysis’ tab.

These blocks analyse the prices of the previous ticks, candles, or the entire market direction. You can find a more detailed description of the functionality of each block by clicking the ‘Learn more’ next to them.
Here is a simple example of how to set up a basic options trading strategy that will purchase a contract based on the last digit of the previous tick:
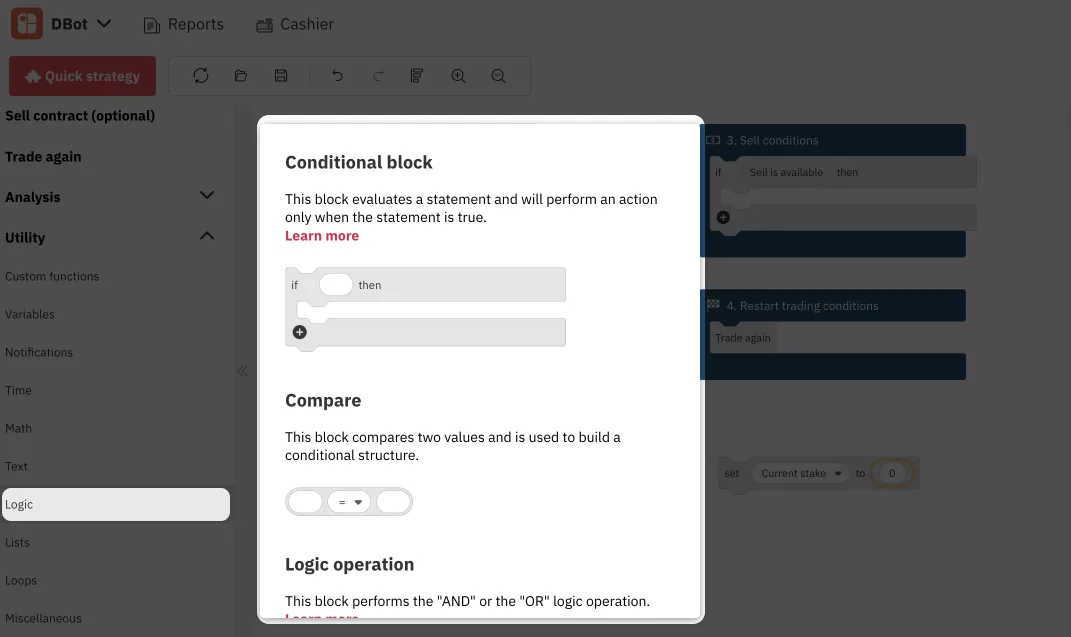
- Select the ‘Conditional block‘ and drag it to your mandatory ‘Purchase block’. It is located under the ‘Utility’ subtab ‘Logic’
- Select the ‘Compare block’ and drag it into the empty placeholder of your ‘Conditional’ block. It is under the same subtab.
- Select the ‘Last digit’ block from the ‘Tick and candle analysis’ subtab of the ‘Analysis tab’, and drag it into the first placeholder of your ‘Compare’ block.
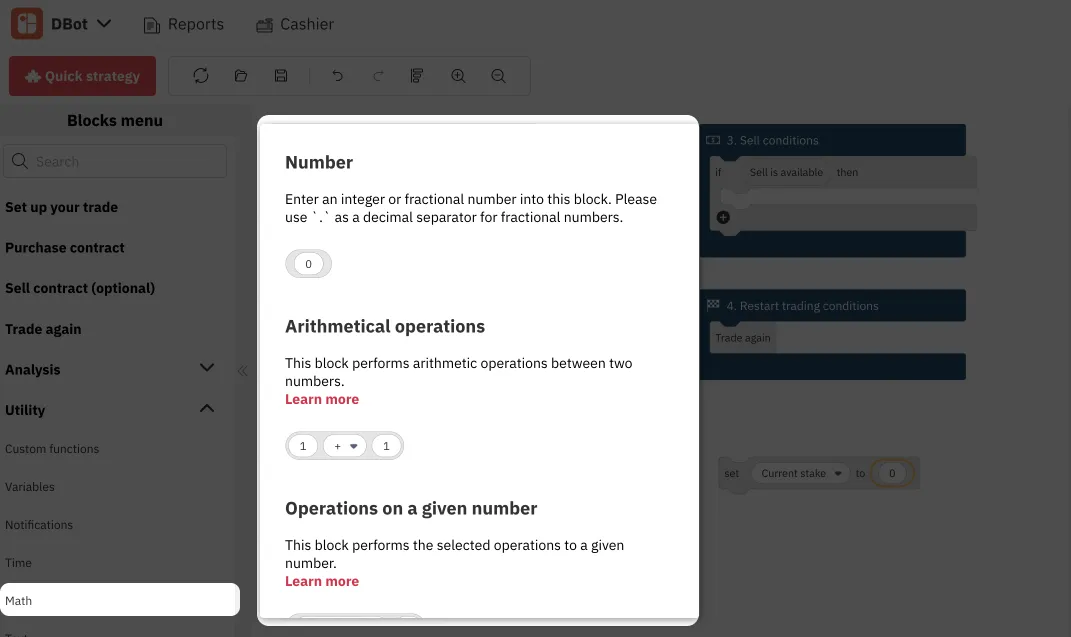
- Select the ‘Number block’, drag it into the second placeholder of your ‘Compare’ block, and select the rule (equal, or not equal to, or greater, etc.). It is located under the ‘Utility’ subtab ‘Math’.
- Select the type of contract for your trade – rise or fall in our example.

Once you complete all these steps, your ‘Purchase conditions’ block is ready. The conditions we’ve just set will instruct your trading bot to buy a Rise contract whenever the last digit of the previous tick is not equal to 4.
This particular strategy is only an example of how you can use the Tick and candle analysis blocks and doesn’t carry any value in a proper trading environment.
Technical indicators in Deriv Bot
Another way of using technical analysis with your trading bot is to apply technical indicator blocks that can be found in the ‘Indicators’ subtab of the ‘Analysis’ tab.

Deriv Bot has 5 main Indicator blocks to help you evaluate all the main signals that can predict future price movements:
- Simple Moving Average (SMA)
- Simple Moving Average Array (SMAA)
- Bollinger Bands (BB)
- Bollinger Bands Array (BBA)
- Exponential Moving Average (EMA)
- Exponential Moving Average Array (EMAA)
- Relative Strength Index (RSI)
- Relative Strength Index Array (RSIA)
- Moving Average Convergence Divergence (MACD)
The difference between a normal indicator and an indicator with an array is that a normal indicator shows only the latest calculation, whereas an indicator with an array shows the list of past calculations. An indicator with an array is catered for a complex strategy where you need to find the change in the calculation. In this example, we would be using Bollinger Bands (BB).
In a price chart, the Bollinger Bands indicator looks like a channel made of 3 lines. The middle line is the mean of the price, which is similar to the Simple Moving Average. The upper and lower bands are the standard deviation of the price. The simple rule is that whenever the price breaks out of one of the outer lines, it tends to move back to the middle line, serving as a signal for traders.

With Deriv Bot, you don’t need to monitor the price chart to catch the moment when the breakout happens – you can just instruct your bot to do it and buy a contract when it happens. Let’s demonstrate how to create the lower band of Bollinger Bands.
1. Select the ‘Bollinger Bands’ block from the list of indicators and drag it to your ‘Purchase conditions’ block.
2. Click the ‘bb’ variable, select the ‘Rename variable’ option from the dropdown, and assign the ‘bb down’ name to it.
3. Click the ‘middle’ variable and select the ‘lower’ value from the dropdown.
4. Select the ‘Tick list’ block from ‘Tick and candle analysis’ and insert it in the placeholder next to the Input list.
5. The ‘Period’ block shows the number of past ticks the indicator will use to analyse the market trend, while the ‘Standard Deviation Up/Down Multiplier blocks show how wide the outer lines of the indicator are. For this example, let’s set it to 20, 2 and 2, respectively.

To understand how the strategy is reflected visually, you can go to the ‘Charts’ tab at the top left corner of your workspace and apply the Bollinger bands indicator in the price chart. To add the indicator, you can do so by clicking on ‘Indicators’ on the left toolbar, clicking on the ‘Volatility’ tab and selecting ‘Bollinger Bands’. To change the settings, on the same page, click on the ‘Active’ tab and click on the settings icon. Alternatively, you can exit the page from the price chart, right-click on any of the bands change the numbers in the window that pops up and click ‘Done’.

6. Select the ‘Conditional block’ and place it right below Bollinger Bands, and place the ‘Purchase (Rise)’ block inside the ‘Conditional block’ and add the ‘Compare’ block to it, just like we did when we set up a trading strategy based on the last digit in the previous example.
7. Select the ‘Last tick’ block from ‘Tick and candle analysis’ and drag it into the first placeholder of your ‘Compare’ block.
8. Go to your ‘Variables’ subtab and select the ‘bb down’ variable we created earlier, placing it into the second placeholder of your ‘Compare’ block.
9. Set the rule to the Last tick is less than the ‘bb down’ so that your bot takes action when the previous tick is below the lower Bollinger band.
10. Set the ‘Purchase’ block to ‘Rise’.

This strategy tells your trading bot to buy a Rise contract whenever a previous tick is lower than the bottom line of the Bollinger bands indicator.
Here is how it will look like in your Deriv Bot platform:

Taking this strategy as an example, you can add one more ‘Bollinger bands’ block, replicating the same actions but for the upper line of the indicator. Below is an example.

Following the same methods, you can use other technical indicators on Deriv Bot to help your trading bot determine the best time to purchase a contract.
This sums up a complete overview of setting up a trading strategy with Deriv Bot – from setting up basic and advanced parameters to teaching your bot how to analyse markets.
Now you can test your newly acquired knowledge on your risk-free demo account, preloaded with 10,000 USD of virtual currency, or check our bonus Top 5 tips and tricks for your Deriv Bot trading strategy blog to find out a few more little hacks to make your Deriv Bot journey better.

An introduction to Deriv Bot – Deriv’s trading bot
Deriv Bot lets you enjoy automated trading without any coding skills. Get to know the available markets, trade types, and main features of Deriv’s trading bot.
This article was originally published on 30 Nov 2022 and updated on 7 May 2024.
Whether you’re a beginner or an experienced trader, you can take advantage of automated trading with Deriv Bot – a trading bot you can build without any coding.
To kickstart your trading journey, we’ve included a video guide above that parallels this blog’s content.
Watch it to gain a visual edge, or continue reading below at your own pace.
Let’s take a look at Deriv Bot’s basic functionalities before we jump into how to create your own trading bot. Building your trading bot with Deriv Bot means putting blocks together like bricks. Each block holds specific trading instructions, and all you have to do to build your strategy is attach them to each other, assigning values where necessary.
To make this process easier, Deriv Bot features a drag-and-drop functionality for arranging the blocks in your workspace:
- Trade parameters
- Purchase conditions
- Restart trading conditions
- Sell conditions
If you accidentally delete one of the blocks from your workspace, you can always add it back from the Deriv Bot dashboard. They are located within their respective tabs, as shown in the image below.

Markets to trade on Deriv Bot
With Deriv Bot, you can trade on popular financial markets, such as forex, stock indices, commodities, and derived indices.
To check all available markets and assets, you can click the Asset selection list in the ‘Trade parameters’ block.

Trade types on Deriv Bot
Deriv Bot offers various types of options trading contracts and multipliers, depending on the asset you select. It’s important to note that none of the contract types requires buying an underlying asset on Deriv – all you need to do is predict the asset’s future price movement. To familiarise yourself more about multipliers, check out our ‘Deriv multipliers: How they work’ blog post.
To select a trade type on Deriv Bot, click the trade type selection list in the ‘Trade parameters’ block, where you select a market and asset.

How Deriv Bot works
Once you select a market, asset, and trade type, your trading bot is ready to run, as the other parameters are already pre-set for you. These include your stake amount and trade duration. Remember to check them before starting your bot.
If you are happy with the default numbers, all you need to do is hit the green ‘Run’ button on the top right side of your screen. In our next blog – ‘How to build a basic trading bot with Deriv Bot’ – we will explain how to set up your own trade conditions, such as trade duration and stake amount, and create your first personalised trading bot.
Once your basic strategy is ready, you can explore more features and further customise your trading bot. With Deriv Bot, the more advanced your strategy becomes, the more blocks you’ll need to use. All the additional blocks are grouped under the two tabs on the left side of your screen: the ‘Utility’ tab, which gives access to additional parameters blocks, and the ‘Analysis’ tab, which provides blocks that can help you perform technical analysis on Deriv Bot.
We will review these additional blocks and examples of how you can use them in our ‘How to set up advanced parameters for Deriv’s trading bot’ and ‘How to use technical analysis with Deriv’s trading bot’ blogs.
Useful features on Deriv Bot
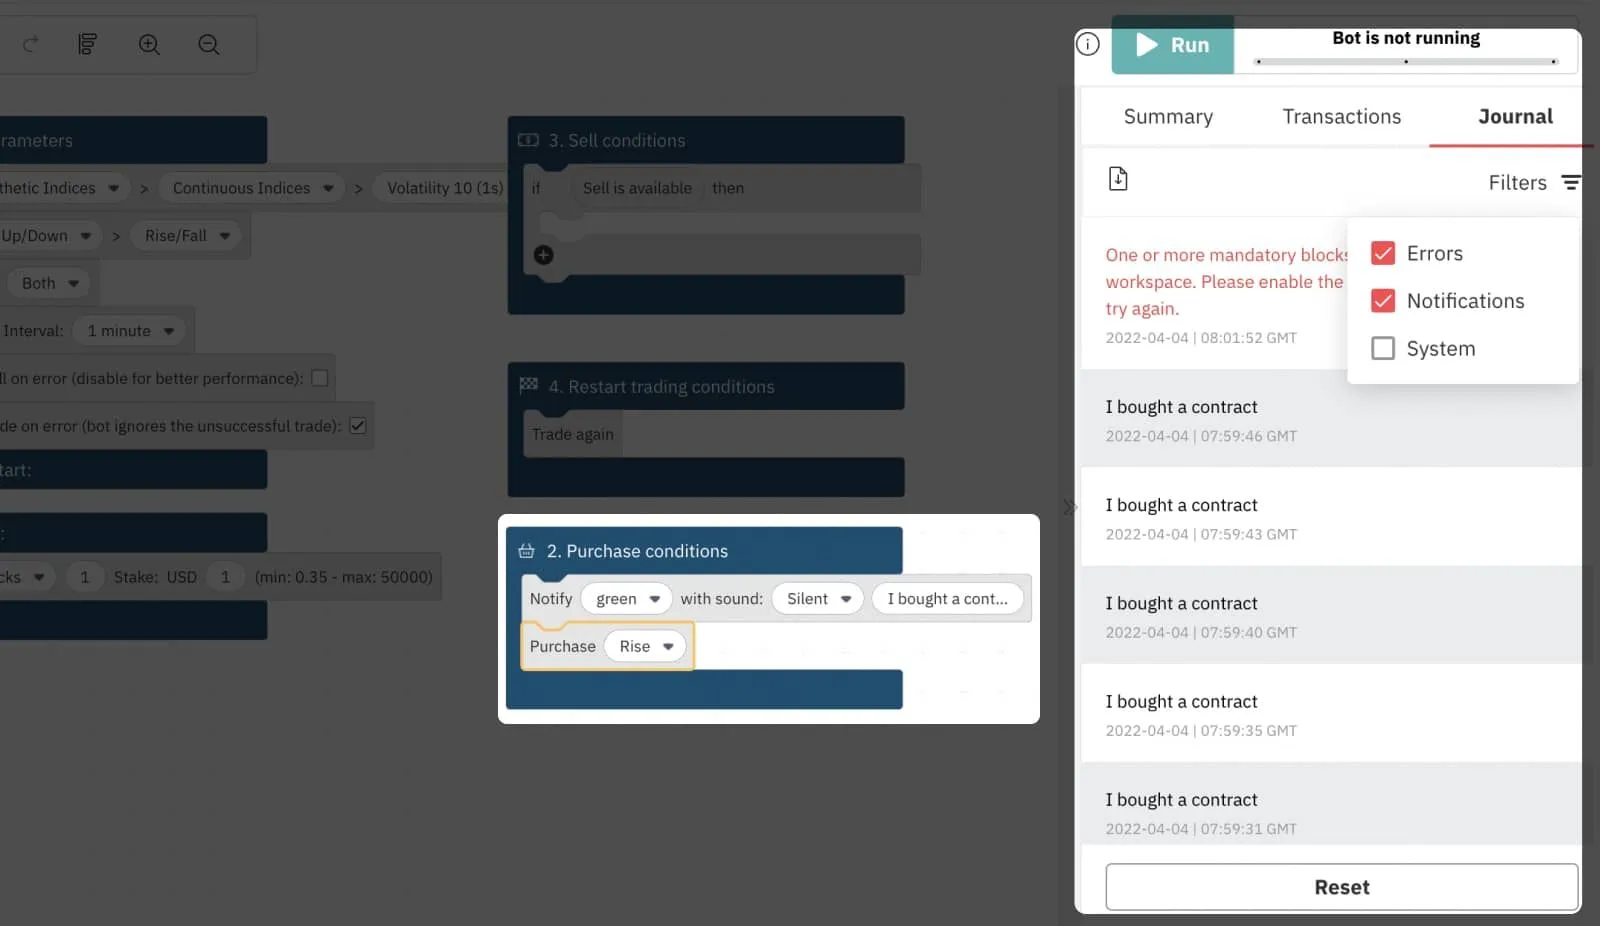
1. Once your trade runs, you can see its details on the right side of your screen, along with the ‘Transaction’ and ‘Journal’ tabs. If you need to clear your data to start fresh, you can hit the ‘Reset’ button to delete all the previous transactions and notifications.

2. The ‘Chart’ tab in the bottom left corner of your screen opens a window with real-time price movements of an asset you’ve selected.
3. The menu panel in the top left corner of your screen gives you quick access to ready-made trading strategies. Alternatively, it also provides an option to reset, import, or save the strategy you are building and undo the last action.
General information on Deriv Bot
In addition to Deriv Bot-specific features, the platform offers a selection of general settings to help you manage your Deriv account.

From the top menu bar, you can access:
- Reports tab to keep track of all your open and closed trades
- Cashier tab to make deposits and withdrawals
- Account settings to adjust your personal, safety, and security details
The buttons in the bottom right corner give you access to the following:
- Live chat
- Deriv homepage
- GMT time
- Responsible trading information
- Account limits
- Help centre
The best way to understand how a new trading platform works is to try it out yourself. Learn how to build your trading bot absolutely free of charge and practise automating your trades risk-free – just create a demo account pre-loaded with 10,000 USD of virtual money and give it a go.

Market news – Week 3, August 2022
Last week, the July CPI (Consumer Price Index) and the PPI (Producer Price Index) results were released, and readings were lower than expected. Markets welcomed these core readings positively.
Last week, the July CPI (Consumer Price Index) and the PPI (Producer Price Index) results were released, and readings were lower than expected. Markets welcomed these core readings positively.
Forex
Euro
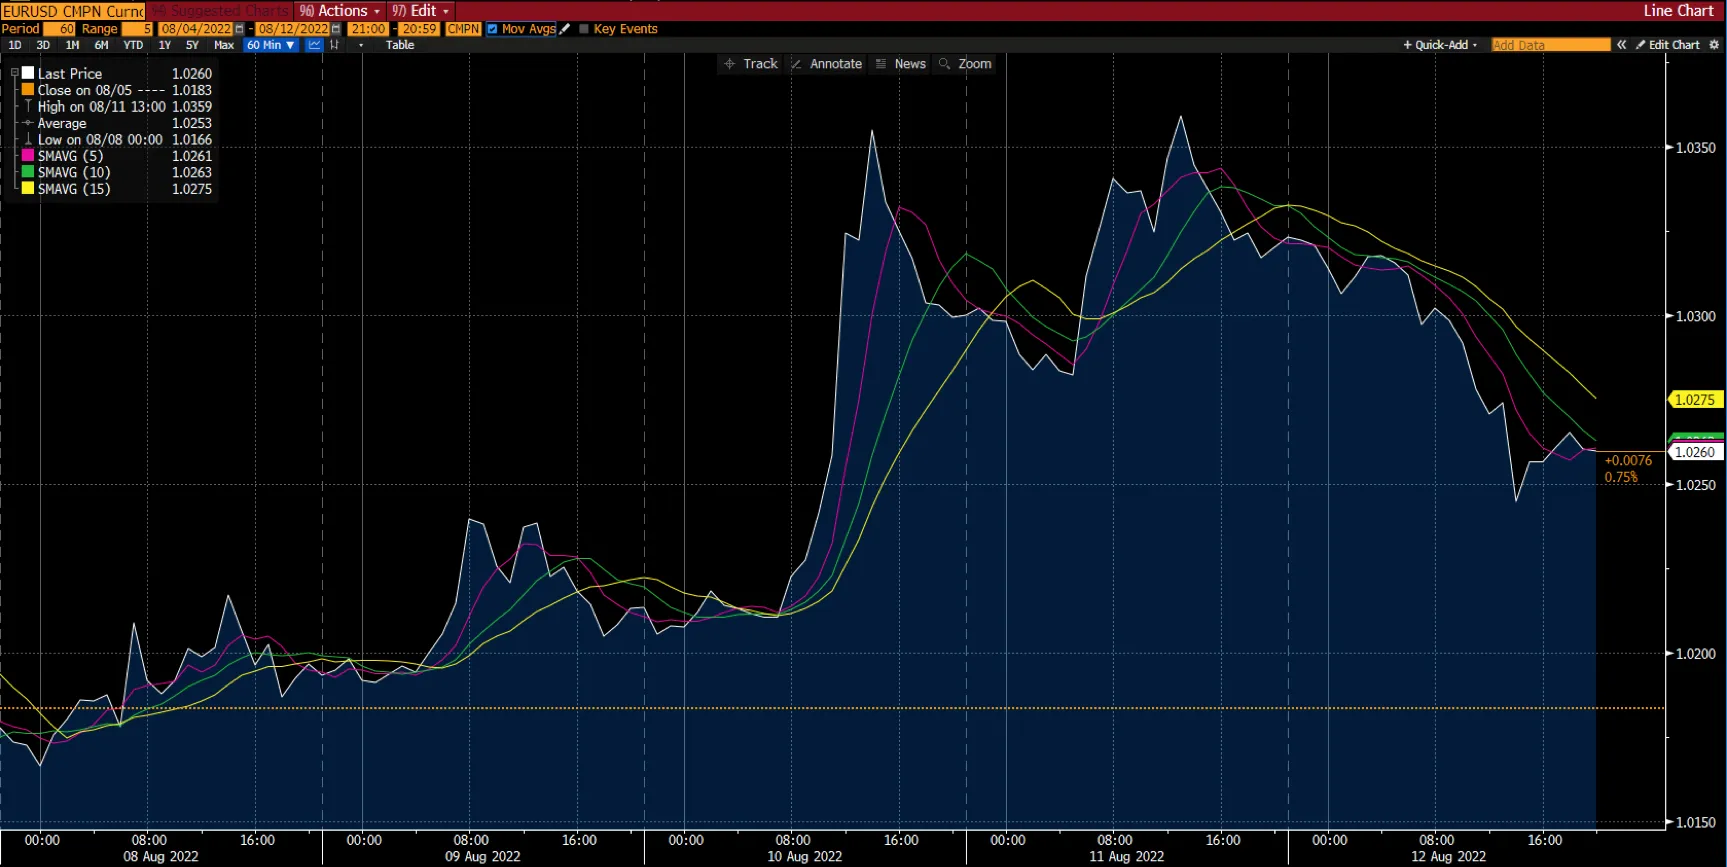
The euro had a terrific week versus the US dollar, climbing from $1.017 to a weekly high of around $1.037 before settling at around $1.030. The gain was spurred by a weaker dollar that resulted from worse US CPI statistics, forcing investors to reduce their rate hike estimates, from 75 to 50 basis points, for the Fed's September meeting. However, market euphoria was swiftly muted as Federal Reserve officials highlighted that price pressures remained intense, necessitating additional rate hikes.
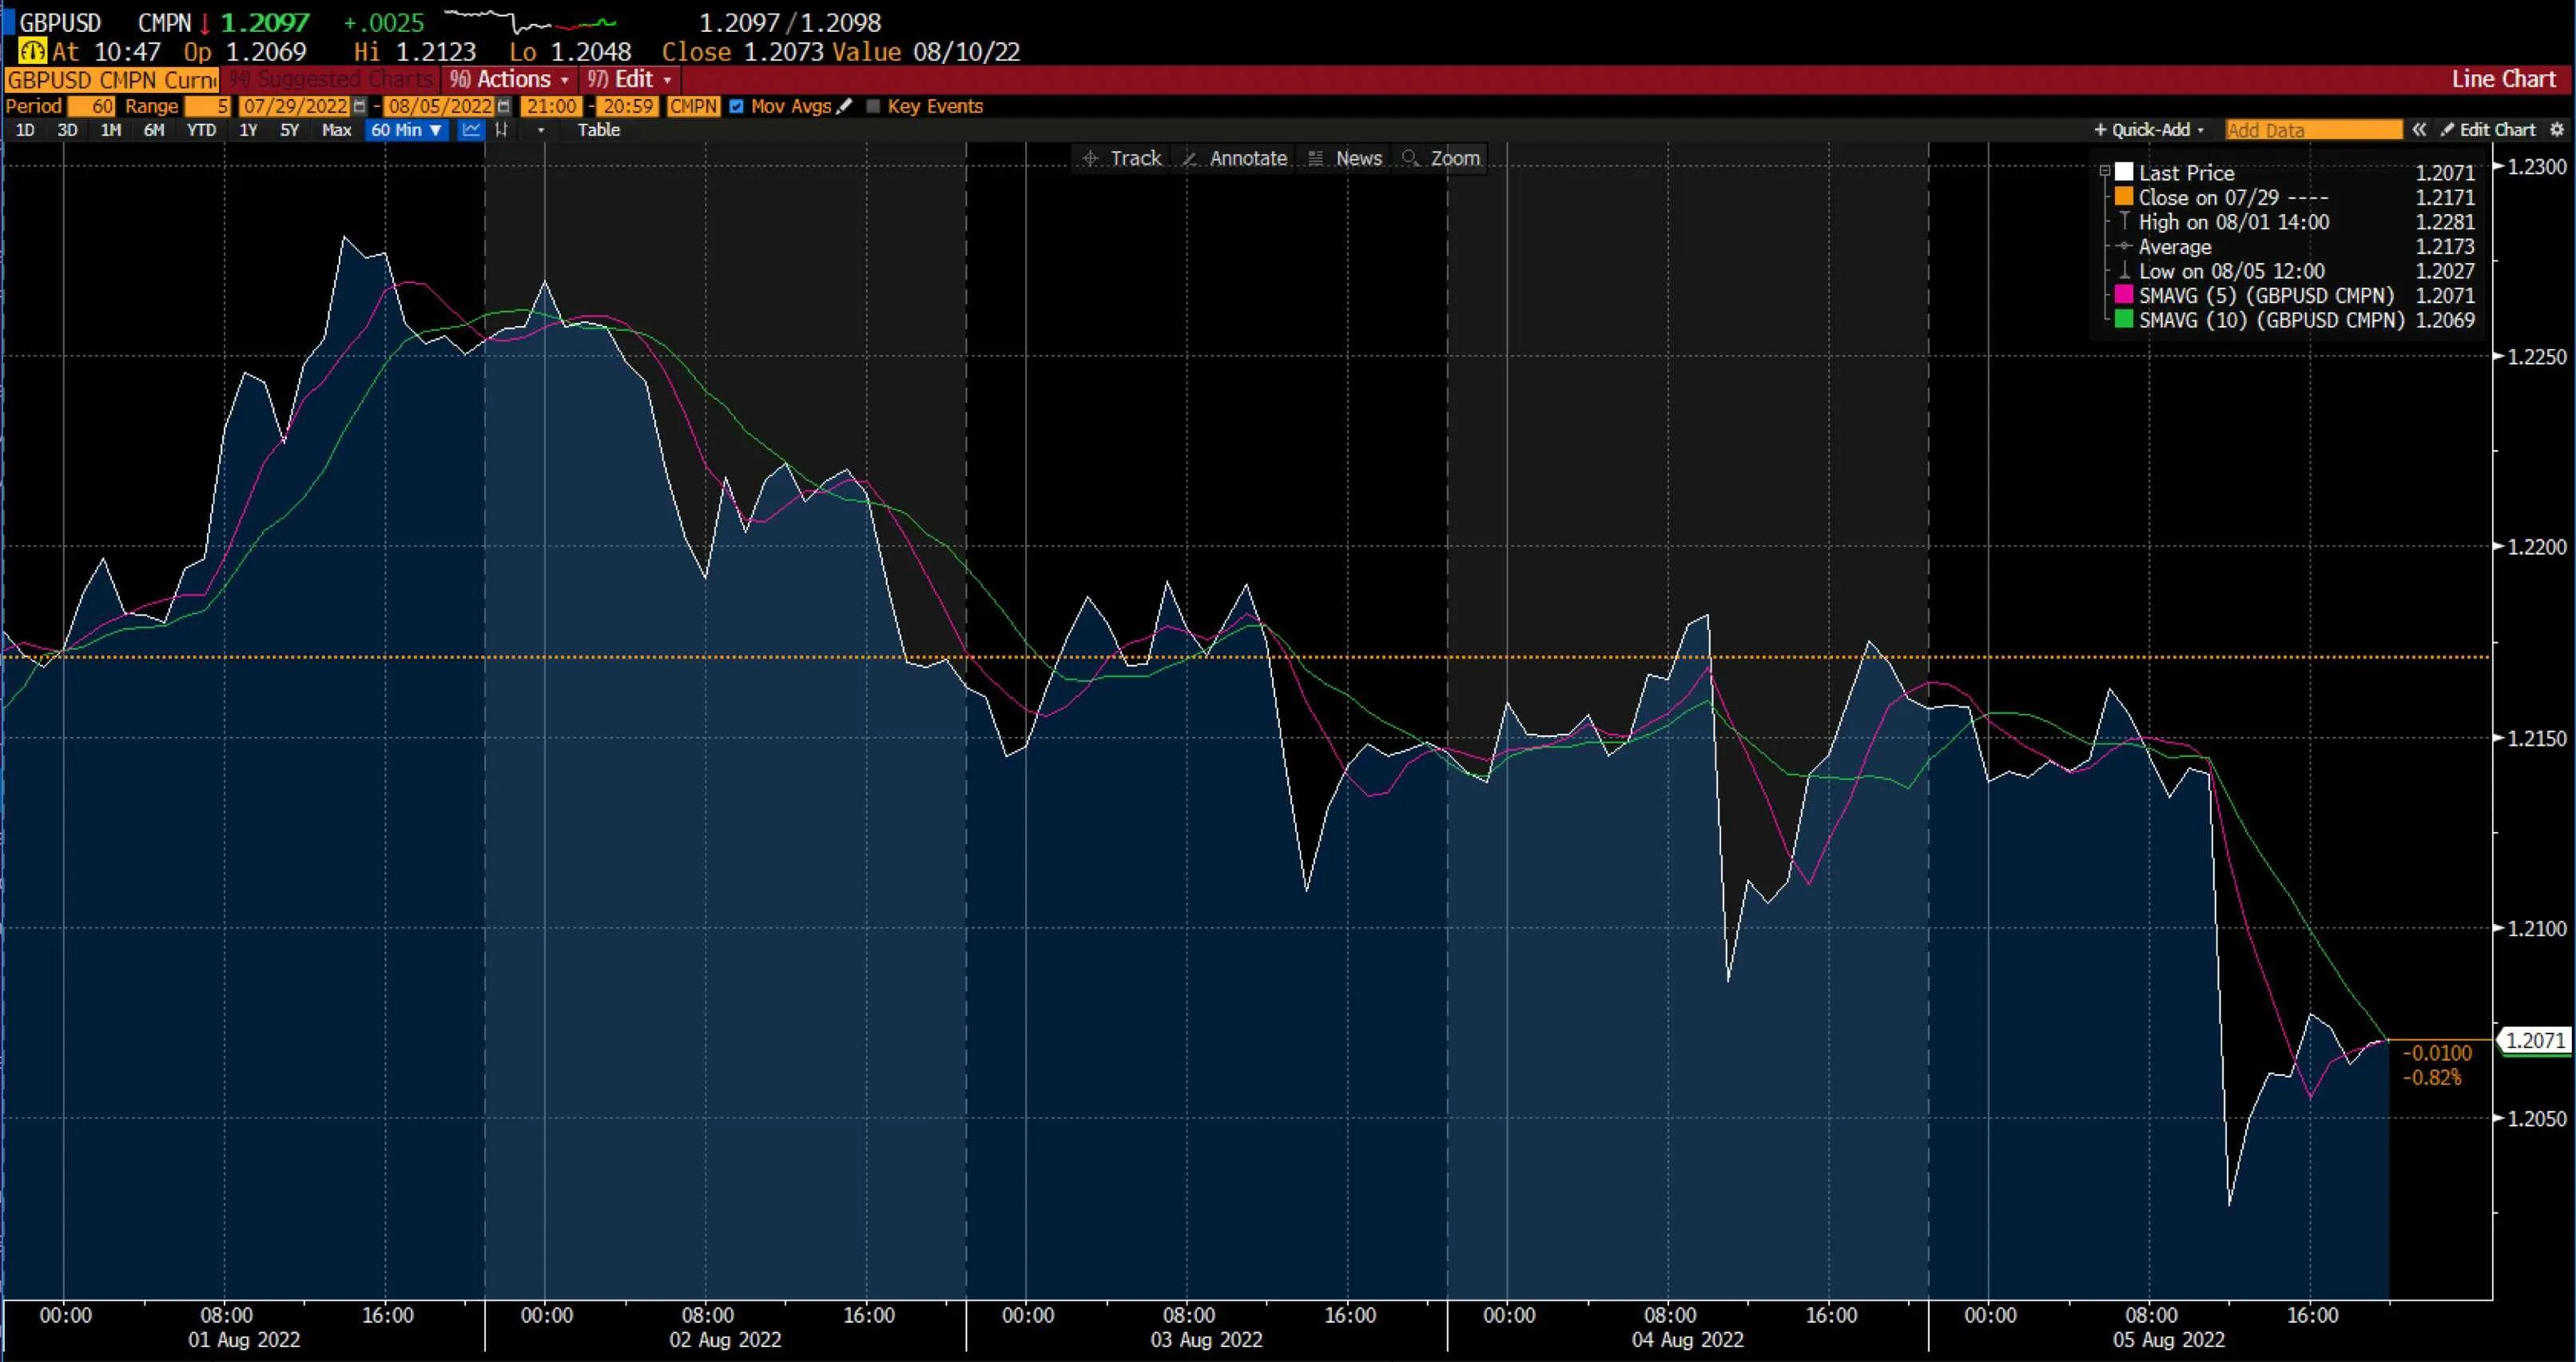
GBP
The GBP/USD exchange rate rebounded after softer-than-expected CPI figures. Inflation in the world's largest economy eased more than expected throughout the period, causing the dollar index to plunge in tandem with the yields. Inflation in the US CPI dropped from 9.1% to 8.5% YoY. However, the hawkish Fed commentary renewed US-China trade tensions, and China's Covid lockdown concerns capped GBP/USD's upward movement.
This week's focus will be on the release of the FOMC minutes, while the UK Retail Sales will also be released to highlight consumer spending.
Level up your trading strategy with the latest market news and trade CFDs on your Deriv X Financial account.
Commodities
Gold
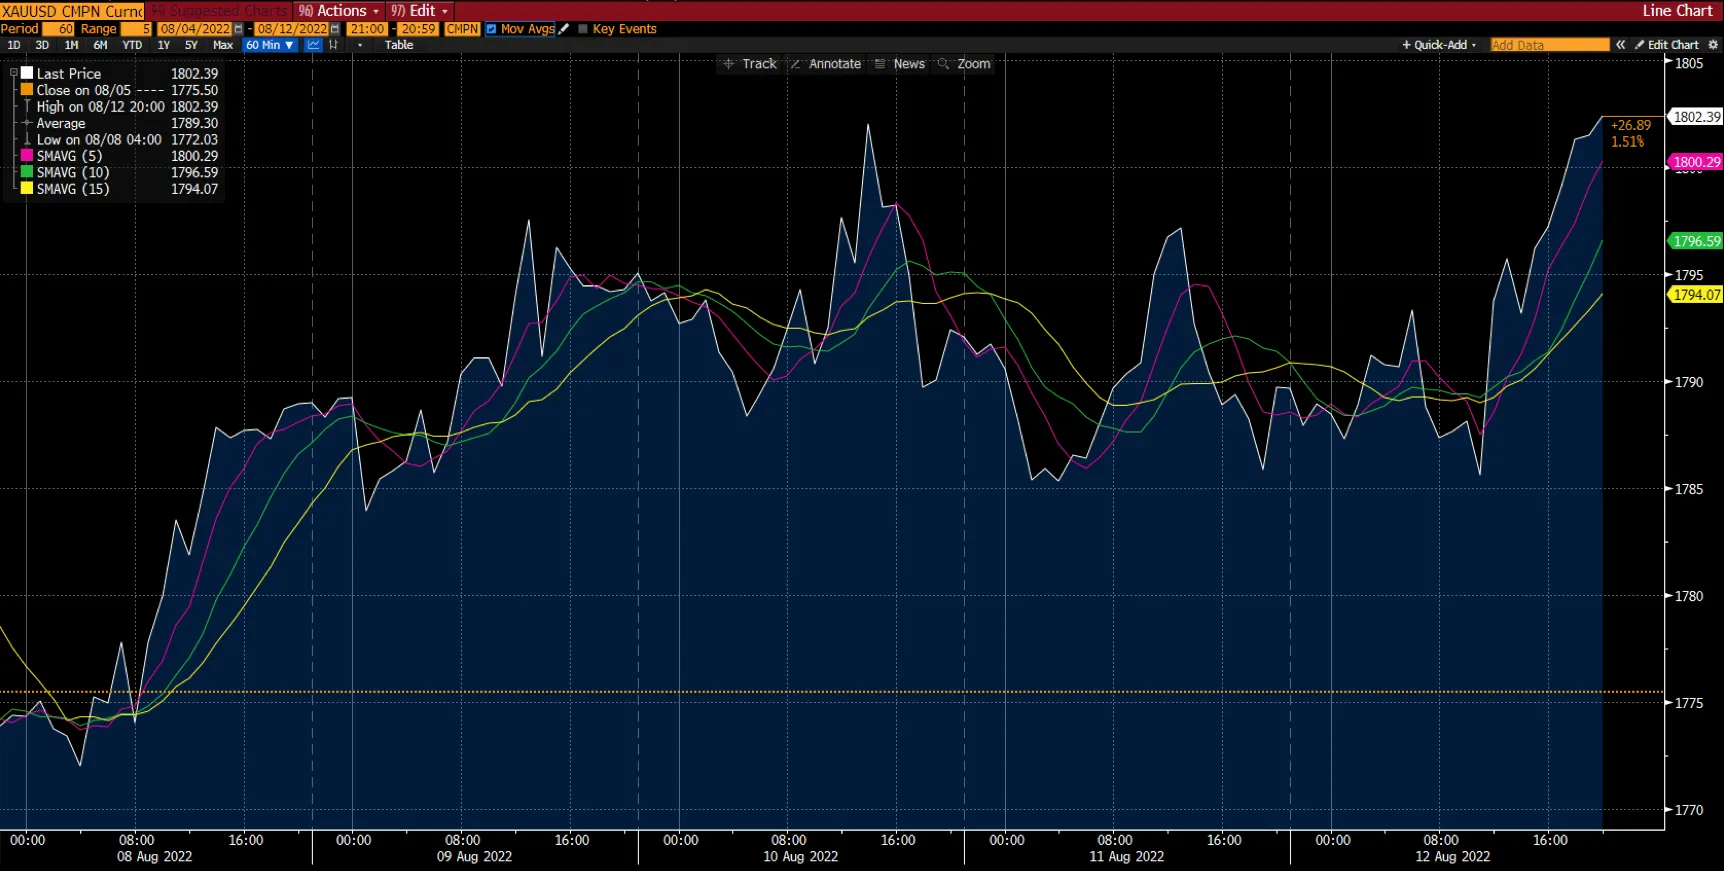
Gold ended its week at around $1,800.
The yellow metal soared to its fourth successive week of upswings with gains of 1.37%. There was a significant impact on the gold market last week due to the lower-than-expected US CPI and PPI which indicated slowed inflation, and the decline in the value of the US dollar.
This week, gold investors will have their eyes on the FOMC minutes and US retail sales data, which will provide insight into the US economy.
Oil
Meanwhile, WTI and Brent crude had gained 3.5% and 3.4%, respectively. Among the factors affecting the oil market were a reduction in US gasoline supplies, a decline in the US dollar index, and an increase in the International Energy Agency's forecast for global crude oil demand.
Cryptocurrencies

Source: Bloomberg. Click to see full size.
Last week, most of the leading cryptocurrencies experienced double-digit weekly percentage gains despite the cryptocurrency market being bearish. The coins experienced a minor drop mid-week and managed to recover without any significant movement towards the end of the week.
Bitcoin
Bitcoin started the week above the $23,000 level. However, as markets awaited the latest Consumer Price Index (CPI) reading, a bullish momentum had gained traction during mid-week, resulting in a risk-off mood among traders. Bitcoin had surpassed the $24,000 level.
The cryptocurrency closed the week with a $24,330 price, making it the third attempt to take the $24,000-ish level. As seen in the chart above, Bitcoin’s SMA 10 at $24,411.64 was leading its SMA 5 at $24,293.57.
Ethereum
Similarly, Ethereum followed an upward trend as the price has risen by 10.73% since last week, mostly due to the upcoming Ethereum Merge, which is scheduled to launch on 19 September. Ethereum showed a bullish trend over the week, finishing at $1,936.80.
Maximise market opportunities by sharpening your trading strategy and trading the financial markets with options and multipliers on DTrader.
US stock markets
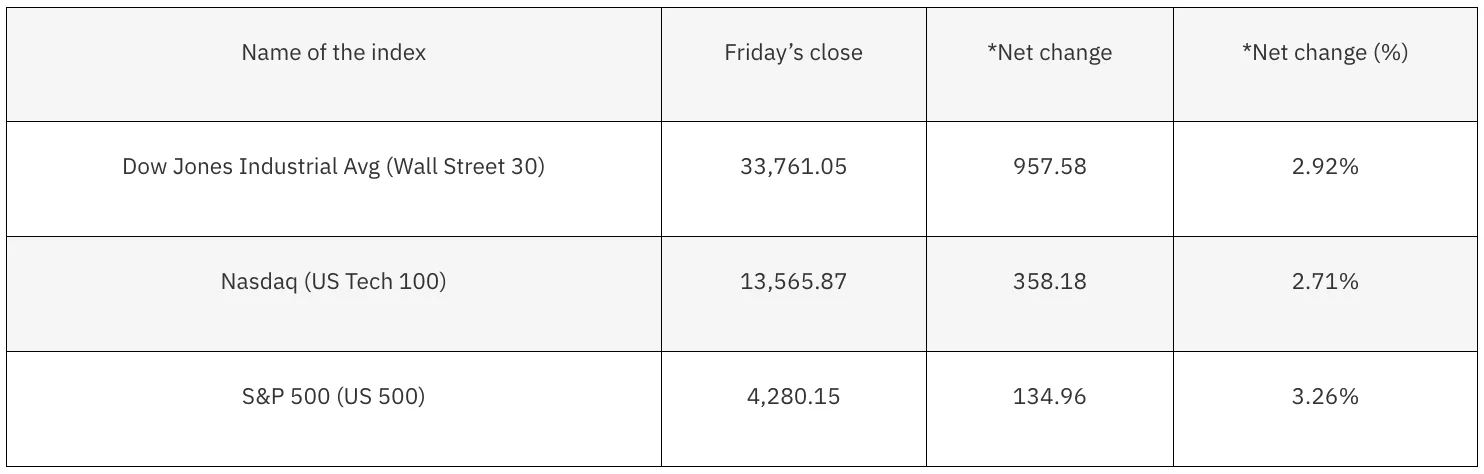
*Net change and net change (%) are based on the weekly closing price change from Friday to Friday.
With the Dow Jones up 2.92%, the S&P 500 up 3.26%, and the Nasdaq up 2.71%, the US stock market ended the week in the green. Both the Nasdaq and S&P 500 recorded their fourth consecutive positive week. Nasdaq was up over 20% from mid-June lows, indicating it has officially entered the bull market.
The indices have been driven upwards by positive inflation news. From June to July, the consumer price index remained flat, indicating that consumer prices didn't increase. It was mainly due to lower gas prices. It's still up 8.5% year over year, but it’s less than experts expected. The decline in producer prices was a surprise, as well as the unexpected drop in import prices.
Investors celebrated signs that inflation may be peaking with the lower-than-expected headlines and core readings, which are hopeful signs that the Fed's rate hikes are starting to take effect.
Next week, Walmart and Home Depot will release their earnings reports, and the Federal Reserve will release its July meeting minutes, which will provide additional insight into policymakers' decisions.
Now that you’re up-to-date on how the financial markets performed last week, you can improve your strategy and trade CFDs on Deriv MT5 Financial and Financial STP accounts.

How to set up advanced parameters for Deriv’s trading bot
Trading bot doesn’t need to be complicated. Upgrade your trading strategy by setting advanced instructions on your Deriv Bot with these 3 simple steps.
In our previous blog, we went through the Deriv Bot fundamentals, such as setting up mandatory blocks and running a simple strategy to trade options and multipliers with Deriv Bot.
Now let’s see how you can customise the mandatory blocks even further to upgrade your trading strategy.
Each block of your strategy has slots that can be filled with additional and more accurate instructions to your bot. Here are the three main actions that will help to add this information:
1. Set up your variables
In the trading automation world, variables are like boxes where important information is stored. For example, if you want to use your stake value somewhere else in the strategy, and not only in the ‘Trade parameters’ block, you can create your own block for it.
The first crucial thing to remember when working with variables is to name them properly and keep them organised because it makes it easier to find and place them correctly the next time you need them. It’s just like labelling the boxes when you are moving. Having all your books in the box that says ‘Books’ will save you lots of time when it comes to unpacking.
As English is a widely used language in programming, it’s a common practice to name the variables of trading bots in English too. Plus, if you ever need help from our customer service, it will be much easier to assist you if the details of your Deriv Bot strategy are easy to read and understand.
To create a variable, go to the ‘Utility’ tab on the left-hand side of the Deriv Bot’s dashboard, and click Variables. Type in the name of the variable you want to create, e.g. ‘Current stake’ and click Create.
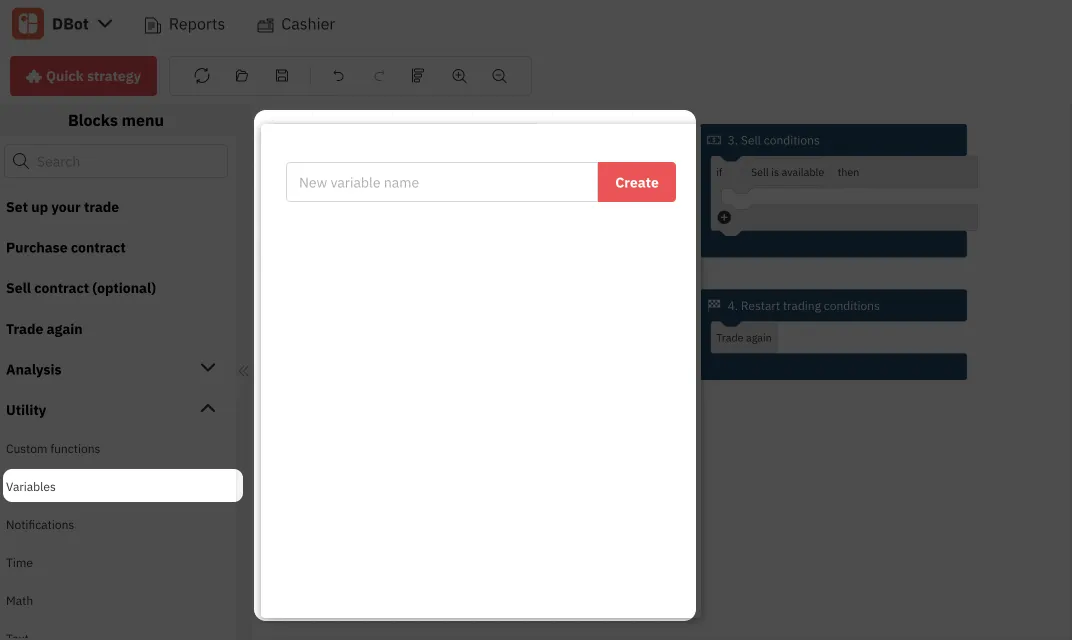
The new variable you have just created will appear in the same window and will be available in two versions:

The first one is used to define your preferred stake amount once, while the second one can be used at any other part of your strategy and will represent this amount.
So, if you use the ‘Current stake’ block in multiple places of your strategy, you don’t have to edit the number in every single place manually. For example, you can set a rule to sell your contract only if your profit is bigger than your stake, and this variable will tell your bot which number to use as your stake amount.
2. Assign a value to your variable
To tell your bot your stake amount, you need to assign a value to your ‘Current stake’ variable.
You can put different kinds of information into your variables, just like boxes can be filled with different items. The label you put on the box indicates what type of content is inside and how it should be handled. A box of china, for example, needs extra care, while a box of paperwork is not as fragile.
In trading, the process of putting information into variables is called assigning a value, and the labels are referred to as data types. Different fields require different data types, and when you assign a certain type to your variable, it tells your bot how to handle it. There are many varieties of data types, but with Deriv Bot, you will only use 3:
- Text – letters only
- Numbers – numeric symbols only
- Boolean – a logical value with true or false sequence
When you assign a specific data type to your variable, Deriv Bot identifies it implicitly. It means that if you try to enter numeric symbols into the text field or vice versa, it will trigger an error message.
To assign a value to your variable, you need to drag your newly created ‘Current stake’ variable that has the empty slot in it and drag it to your workspace.
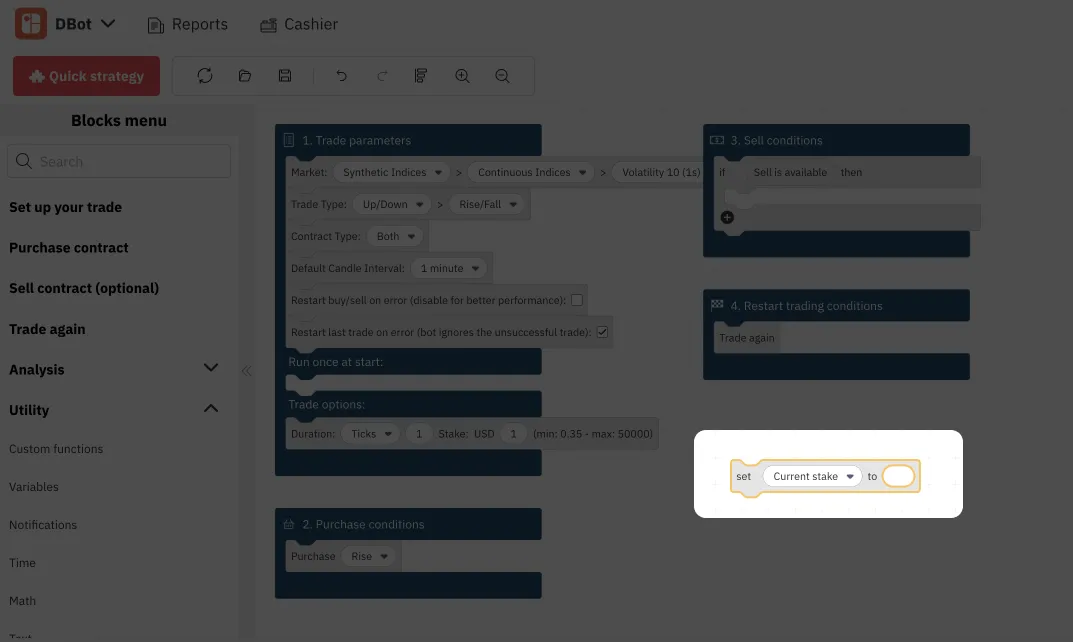
Since the ‘Current stake’ variable can only be defined by a number, you need to assign a numeric value to it.
Click the ‘Utility’ tab once again, and then click Math.
Select the block under the ‘Number’, and drag it to your ‘Current stake' block on the workspace, attaching it to the blank slot.
Your current stake now equals zero. You can change it to any number you want by typing it inside the block.

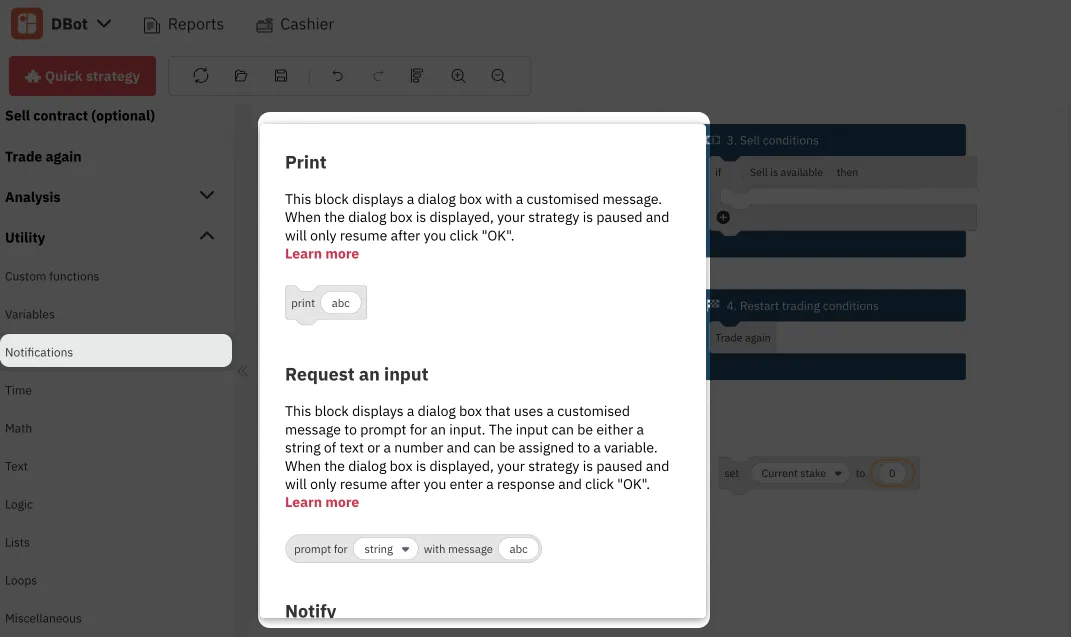
If you were to assign a text value to your variable, you would need to do the same thing, but choose the ‘Text’ tab instead of ‘Math’. With the help of text, you can create a custom notification for yourself, for example, notifying you that you gained profit.

And a variable with the boolean data type can be a part of more complex instructions for your bot:

3. Set up your operations
After creating your custom variables, you need to instruct your bot on what to do with them with the help of operations – the blocks that allow your trading bot to perform certain actions. Here are the main types of operations available on Deriv Bot:
Mathematical operations
This type of operation can be found under the same ‘Math’ tab. It performs different kinds of calculations, such as comparing numbers, sum, round, and other more complex actions.
Operations with text
These operations can be found under the ‘Text’ and ‘Notifications’ tabs and are mainly used to join text variables together. For example, you can set a custom notification that will pop up when you’ve gained profit.

Logical operations
Logical operations are one of the most commonly used blocks as they set the logic of the strategy. These blocks can be found under the ‘Logic’ tab and are usually based on the if/then pattern. The most popular logical operation is the Conditional block. You can set up your ‘Sell conditions’ block with the Conditional block, instructing your bot to sell the contract at a market price.
Regardless of its purpose, each operation block requires variables to function. You can create as many as you need, following our instructions above, and simply drag them into the block you are building.
Once you get more comfortable with the variables and operations, you can use them to customise your mandatory blocks or set up your optional blocks, which we will discuss in our How to set up optional parameters to enhance your Deriv Bot strategy blog.
For now, you can always practice on your risk-free demo account with 10,000 USD of virtual currency. But just like with trading on any other platform, the crucial part of any strategy is to understand when is the best time to buy or sell an asset.

4 features for better risk management on Deriv multipliers
Trading with multipliers is a great way to increase your potential profit. On Deriv’s trading platforms, you can also avoid increased losses when the market moves against you. In this blog post, we explain how the risk-management features on Deriv’s platforms make them excellent choices for trading multipliers.
This article was updated on 22 January 2024
Trading with multipliers is a great way to increase your potential profit. On Deriv’s trading platforms, you can also avoid increased losses when the market moves against you. In this blog post, we explain how the risk-management features on Deriv’s platforms make them excellent choices for trading multipliers.
4 ways Deriv gives you more control over your multipliers trade
Automatic stop out
When you trade with multipliers on Deriv, you can never lose more than your stake. With an automatic stop out feature, your positions are automatically closed as soon as your losses are equal to your stake amount.
Take profit
Usually, you will need to close your position manually to secure your profit.
The take profit feature allows you to automate this process. All you have to do is set a level of profit you’d be satisfied with. If your profit reaches or exceeds this amount, your position will be closed and your profit will be added to your account balance.
Stop loss
Stop loss lets you set exactly how much you are willing to risk. You can cut your losses before you lose your entire stake.
Whenever your loss equals or exceeds your stop loss amount, your trade will be closed automatically.
For example, you open a trade with a 10 USD stake. The automatic stop out will close your trade when your losses reach 10 USD. However, if you want to minimise losses even further, you can set a stop loss level of 5 USD. When your loss reaches this amount, your trade will automatically close.
Deal cancellation
Opened a trade, but having second thoughts? With deal cancellation, you have the option to cancel a trade within a selected time period (depending on the market and asset you’re trading) after opening it and reclaim your stake. Please note that Deriv charges a small fee for this service.
---
With these 4 risk-management features, trading multipliers on Deriv can help you avoid missing out on opportunities and prevent you from losing more than you're willing to lose. Log in or sign up for a free demo account to give Deriv multipliers a try.

Market news – Week 3, July 2022
The release of June’s Consumer Price Index data last week indicated that consumer inflation had accelerated to 9.1% in June – a pace not seen in more than 4 decades. Here’s how the markets reacted.
The release of June’s Consumer Price Index data last week indicated that consumer inflation had accelerated to 9.1% in June – a pace not seen in more than 4 decades. Here’s how the markets reacted.
Forex
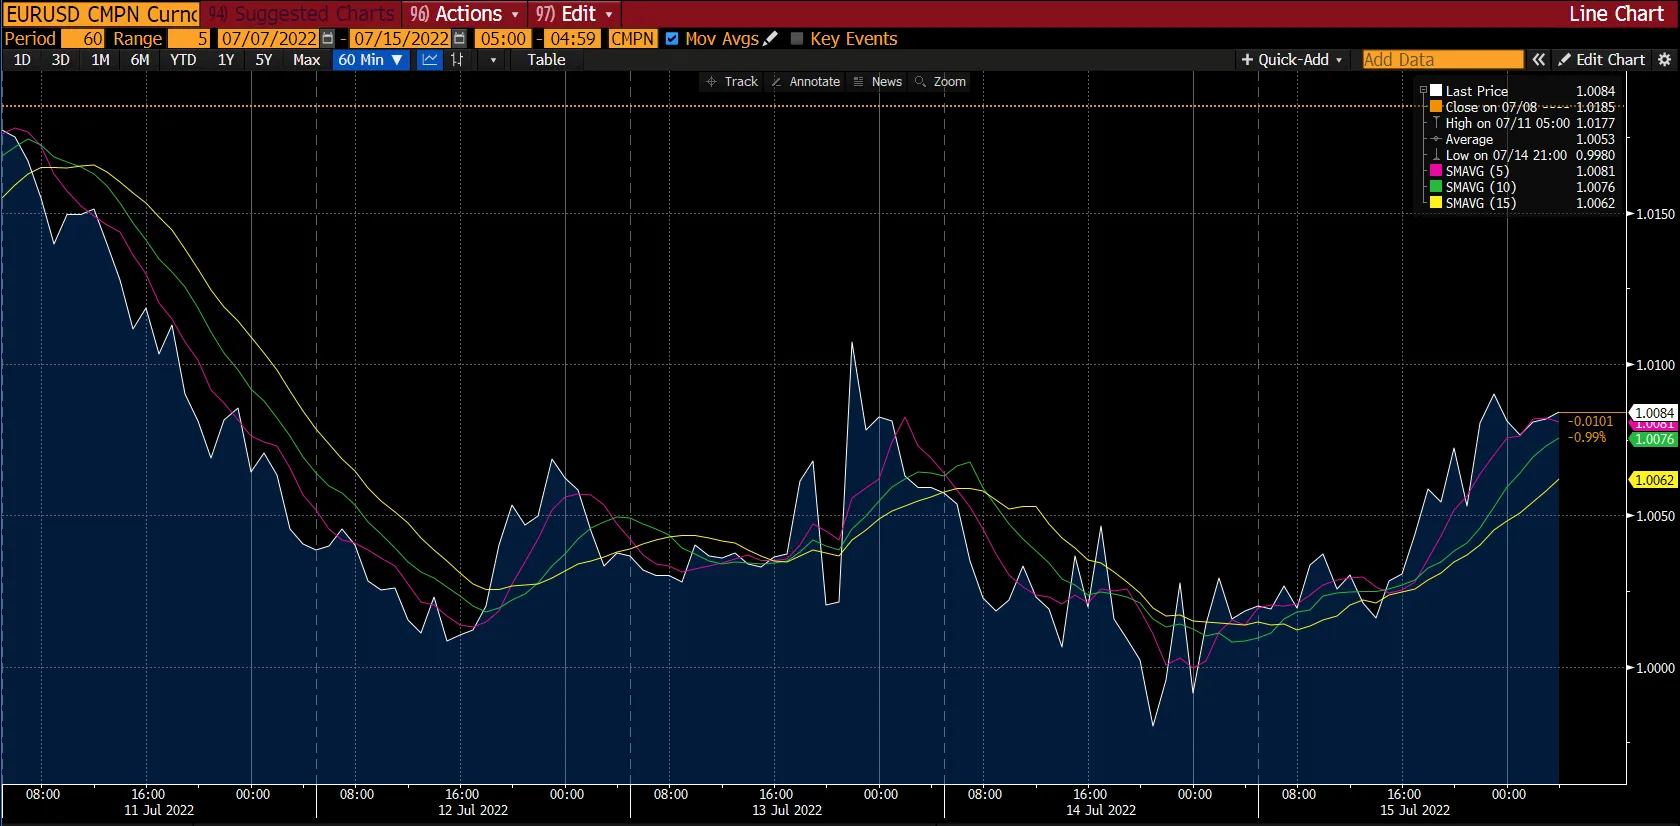
For the first time in 20 years, the euro plunged below parity against the US dollar on Wednesday, 13 July 2022. This fall was a result of an increase in June's US consumer prices, which reached a four-decade high, and concerns over Russian restrictions on Europe's energy supply.
Since the beginning of this year, the euro has dropped by almost 12% against the US dollar. European Central Bank (ECB) rates have lagged behind other central banks in raising interest rates, further weakening the euro. That being said, the US dollar has also been strong in recent months. With the US central bank raising its interest rates, traders have turned to US dollar assets as safe havens during uncertain times.
Meanwhile, EUR/USD ended the week trading around $1.0100 amid a broad US dollar retreat and Italian political uncertainty. As a result of easing fears over aggressive Fed tightening and China's policy support, the market has been in a positive mood. All eyes remain on this week's ECB rate hike as it is widely expected to raise its benchmark interest rate for the first time since 2011.
Although the GBP/USD rate touched new yearly lows, it followed other major currency pairs in hopes that the British public sector workers' wages would be significantly higher after Friday's US dollar retreat. This week, the UK Consumer Price Index (CPI) will be one of the most critical data points.
Level up your trading strategy with the latest market news and trade CFDs on your Deriv X Financial account.
Commodities

Gold started the week above the $1,740 level and went on a bearish run to end the week below the $1,710 level. The yellow metal experienced its longest stretch of declines in nearly 4 years as it entered its fifth straight week of losses.
Rising inflationary fears and an expensive US dollar were the main factors contributing to the ongoing decrease in gold prices. Moreover, on Wednesday, 13 July 2022, the US suffered its most significant annual gain in inflation at 9.1% – the highest since 1981. These circumstances contributed to this severe reaction in the gold market.
As seen in the chart, on Thursday, 14 July 2022, the precious metal almost fell to the $1,700 mark from the $1,735 level at the start of the day. The SMA5, SMA10, and SMA15 followed the same trend and converged at the end of the week at the $1,705 level.
This week will put gold at further risk as the US dollar strengthens against all competitors.
On the other hand, Brent broke beyond the $100 per barrel mark on Thursday, 14 July 2022, as traders weighed restricted supply against the possibility of a significant US rate hike that would stifle inflation and reduce demand for crude oil.
Cryptocurrencies
Over the past few weeks, major cryptocurrencies have seen a wave-like pattern. Most significant coins started the week in the negative but quickly reversed the trend and showed a steady climb.
Bitcoin fell below the $20,000 level at the start of the week. However, the largest cryptocurrency in the world by market capitalisation took an upward turn and breached the $21,000 level in a bullish run during the end of the week.
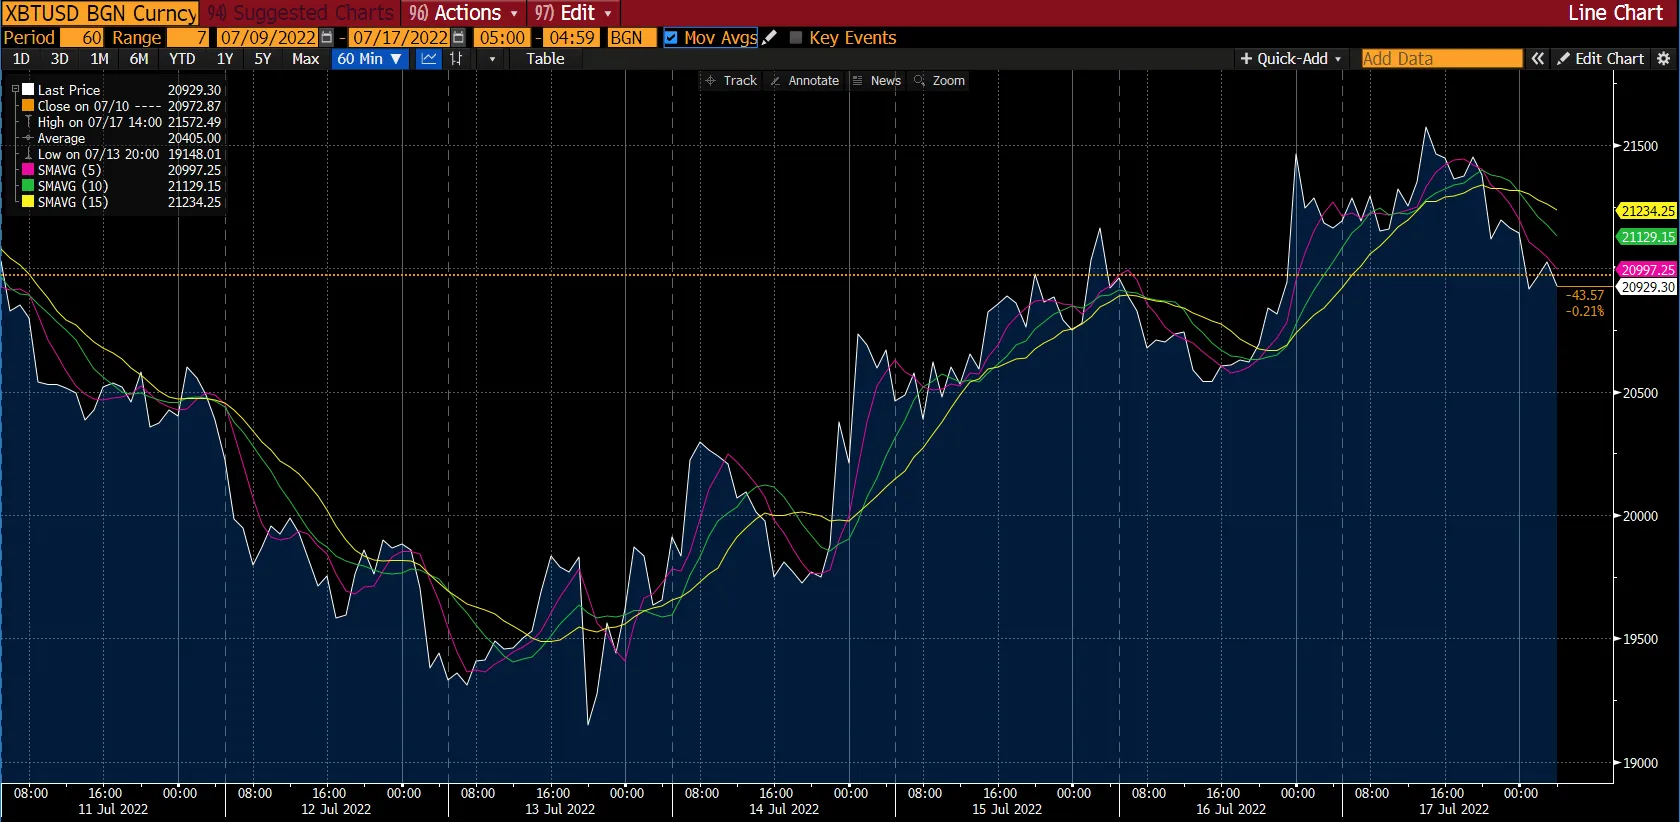
Bitcoin turned downwards after scaling the $21,500 level on Sunday, 17 July 2022. At the time of writing, Bitcoin is trading at the $20,929.30 mark, which is lower than its SMA5, SMA10, and SMA15 at $20,997.25, $21,129.15 and $21,234.25, respectively.
Moreover, recent data released by Bloomberg suggests that the Bitcoin-to-Nasdaq correlation is close to its lowest point this year. This point indicates that Bitcoin has endured more downward pressure than stocks.
Cryptocurrencies like Litecoin, Dash, and Dogecoin mirrored the movements of Bitcoin and ended the week with gains of 14.5%, 11%, and 1.6%, respectively.
While other major cryptocurrencies just managed to consolidate their losses, Ethereum prices increased by over 22%, surpassing the $1,300 level.
In other crypto-related news, the Financial Stability Board (FSB) announced that it would develop proposals to ensure cryptocurrencies are appropriately regulated and supervised.
Maximise market opportunities by sharpening your trading strategy and trading the financial markets with options and multipliers on DTrader.
US stock markets
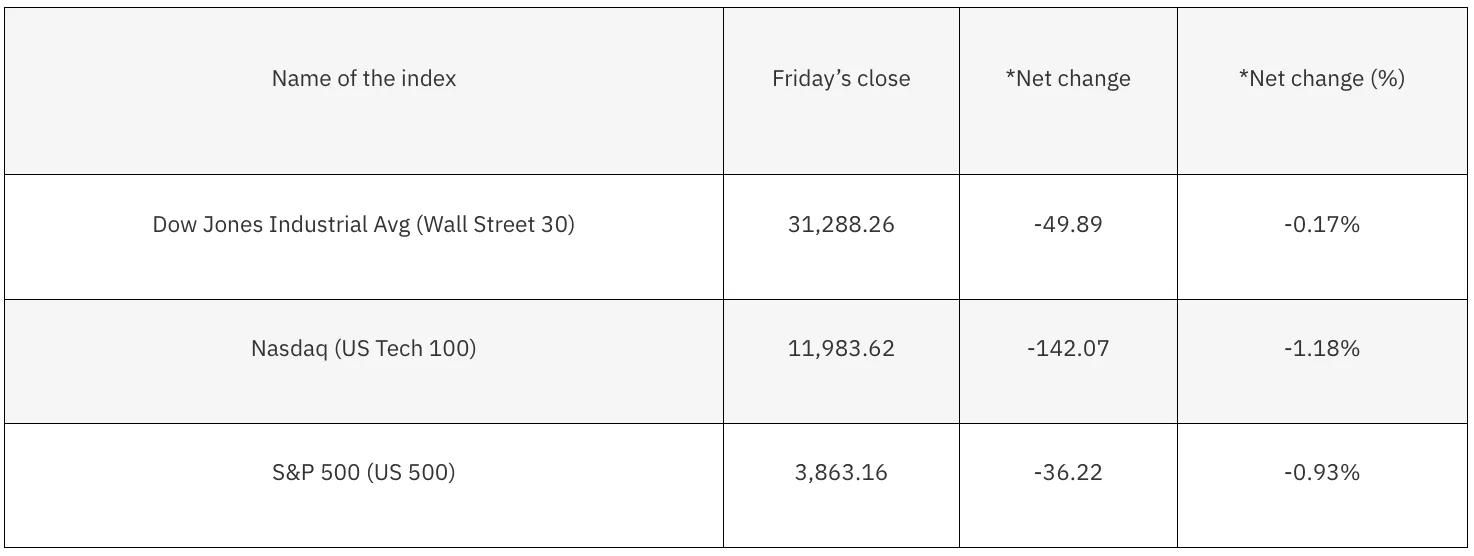
*Net change and net change (%) are based on the weekly closing price change from Friday to Friday.
It was a volatile week for stocks, leading to all the major averages ending the week in a loss. The Dow fell by almost 0.2%, while S&P and Nasdaq each fell by 0.9% and nearly 1.2%, respectively. As a result, the S&P 500 fell by roughly 19% of its highs accumulated from the beginning of the year.
According to the US Labor department, the Consumer Price Index (CPI) rose to 9.1% – the highest in 41 years. The prices increased by 1.3% in June alone.
However, on Friday, 15 July 2022, a surprise 1% gain in June's retail sales was reported, along with stronger data on consumer inflation expectations. The inflation data seemed optimistic, as the rise in import and export prices was less than anticipated. Due to this, the market rallied strongly to end the day.
This week, the release of earnings reports by various companies could set the tone for the market. These reports will include results by Bank of America, Goldman Sachs, IBM, Johnson & Johnson, Netflix, Tesla, and more.
Now that you’re up-to-date on how the financial markets performed last week, you can improve your strategy and trade CFDs on Deriv MT5 Financial and Financial STP accounts.

Top 5 tips and tricks for your Deriv Bot trading strategy
Learning a new skill is always about figuring out the basic functionality first. But once the basics are sorted, the next step is to discover shortcuts and additional features to upgrade your experience.
Learning a new skill is always about figuring out the basic functionality first. But once the basics are sorted, the next step is to discover shortcuts and additional features to upgrade your experience.
In this blog, we will go through the top 5 tips and tricks that can significantly improve your Deriv Bot journey.
1. Don’t miss the blocks’ context menu
When you attach different blocks with various functions together on Deriv Bot, they will work together to run your trading strategy. However, each block has its own context menu.
Get to the context menu by right-clicking on an individual block, and access the following functions:
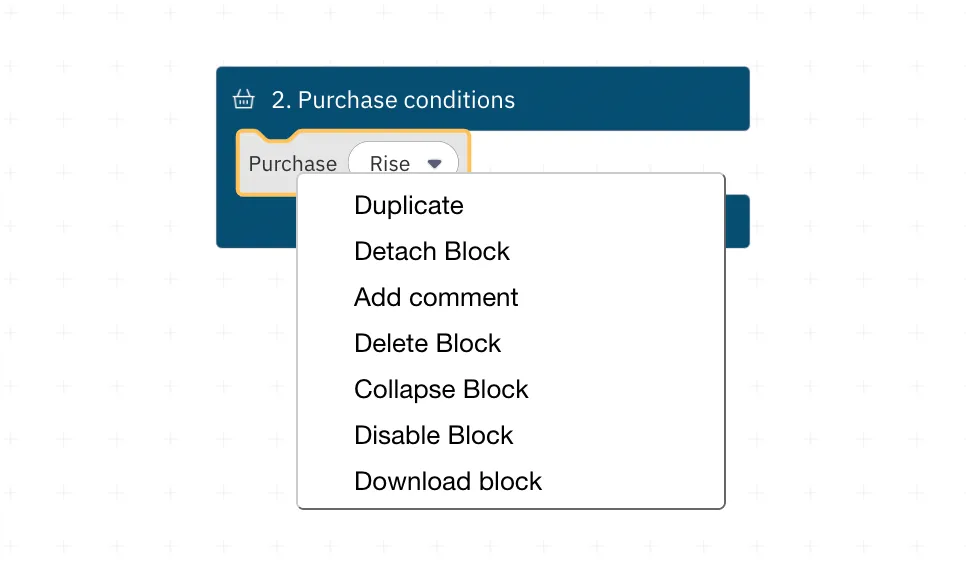
Each one of these functions is fairly self-explanatory and can be quite handy if you need to change specific blocks. Some functions are disabled for certain blocks due to their specifications. For example, you can’t duplicate the mandatory blocks because you can only use them once.
2. Take advantage of the Notify block
Placing the ‘Notify’ block with every significant step of your strategy will help you stay in touch with your trades. For example, you can get an instant notification when your trading bot buys a contract. You can also set notifications to inform you when your preferred market price is available or what price a contract was bought at.
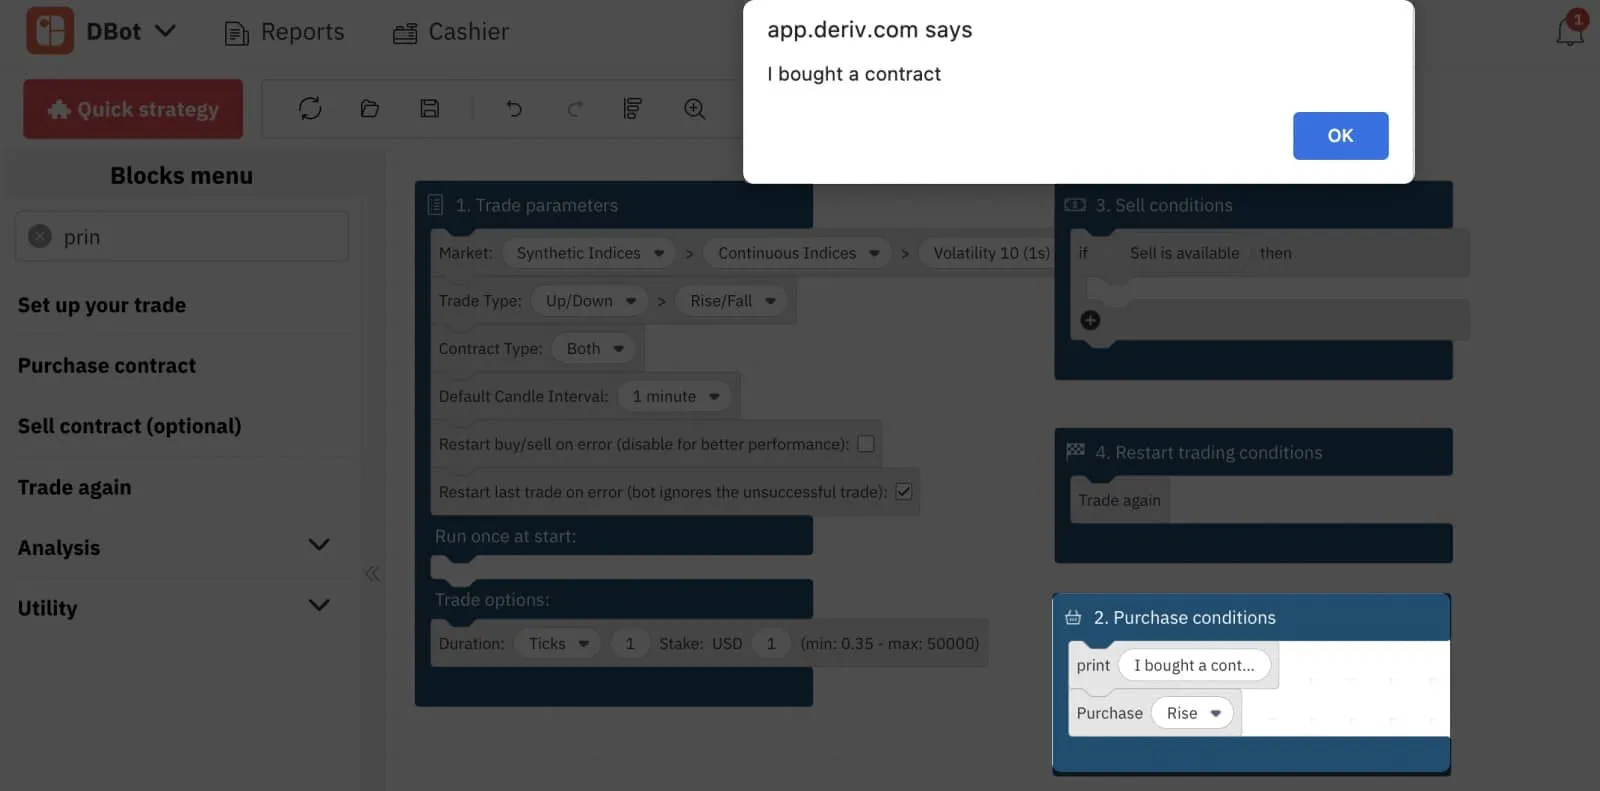
Moreover, this block leaves messages in your journal that can be very useful when you are debugging your strategy and looking for mistakes to correct. To make the debugging process even easier, you can filter the messages in your journal to notifications only.
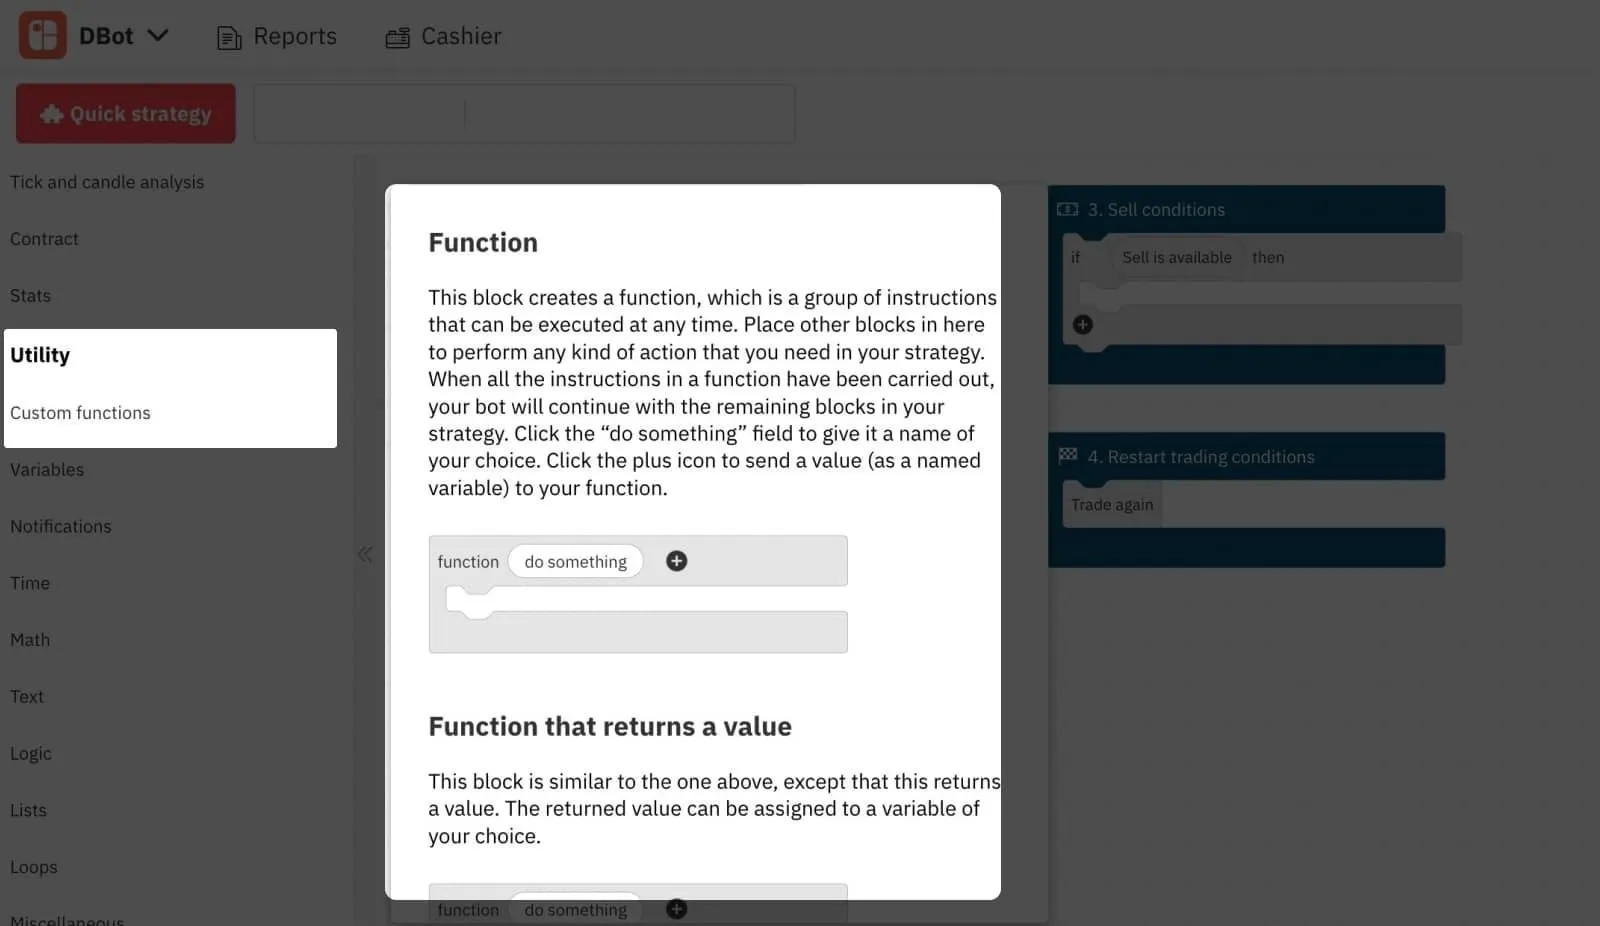
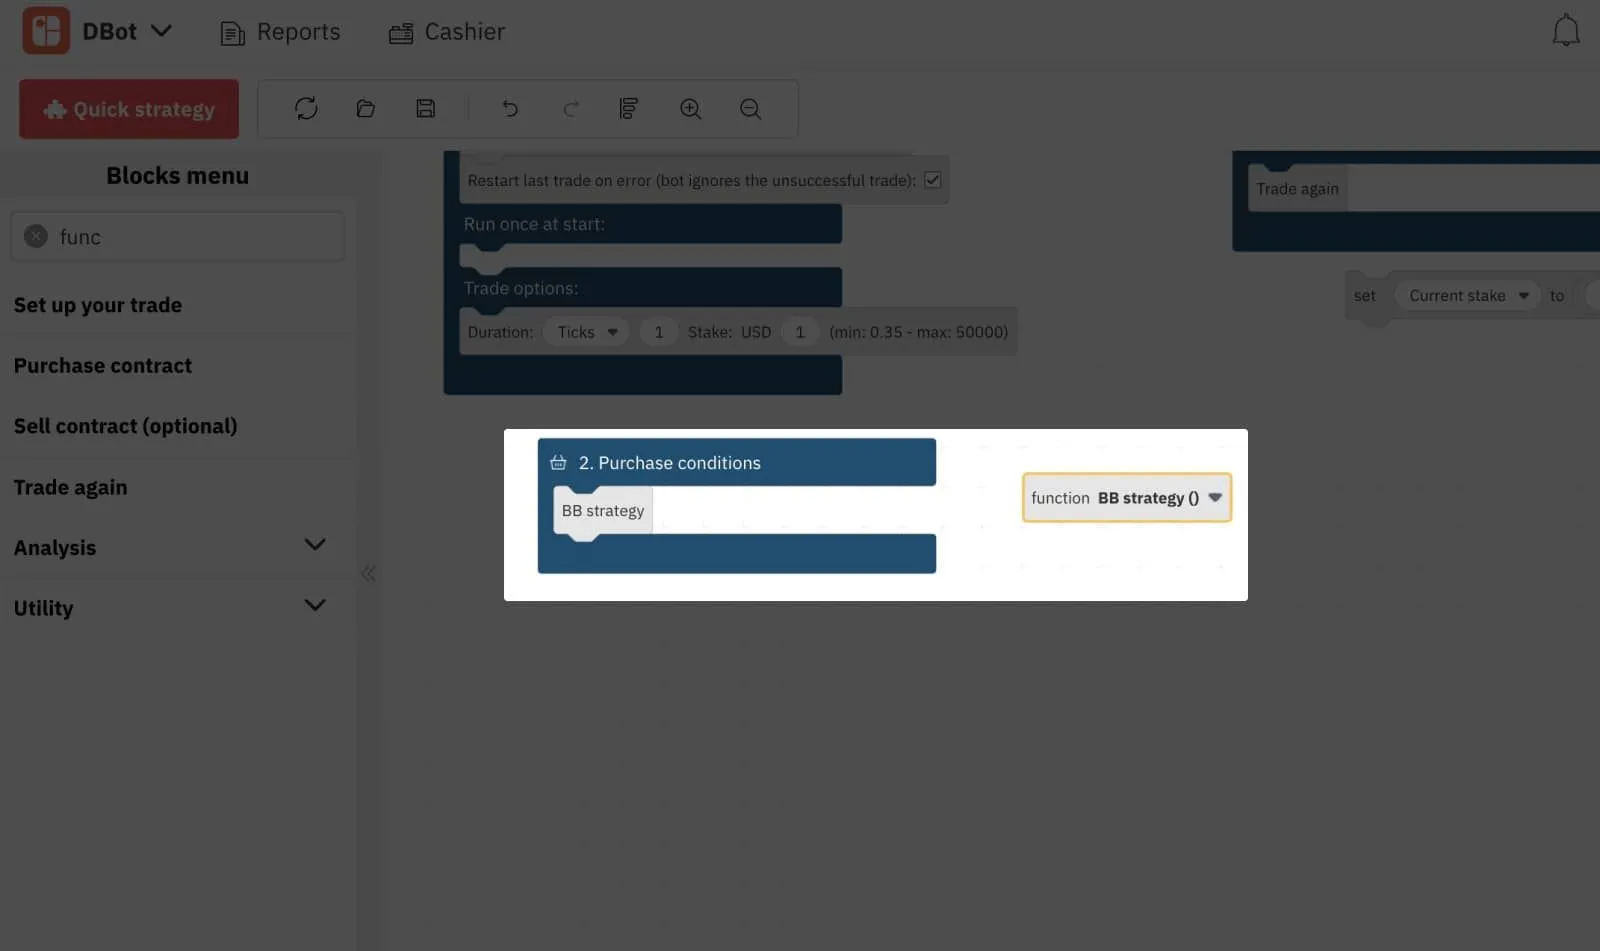
3. Clean up your workspace with the function block
The ‘Function’ block is a great way to clean up your workspace, as it serves as a placeholder for other blocks. For example, suppose you are setting up the Bollinger Bands strategy we discussed in our How to use technical analysis with Deriv’s trading bot blog post. With the ‘Function’ block, you can replace all the blocks under the Purchase conditions with just a single block.
Here is how you can do it:
1. Select the ‘Function’ block in the ‘Custom functions’ subtab of the ‘Utility’ tab and drag it to your workspace.
2. Assuming that you already have a Bollinger Bands strategy set up, take all the contents of the ‘Purchase conditions’ block and drag them into the ‘Function’ block. Rename ‘do something’ to ‘BB strategy’.
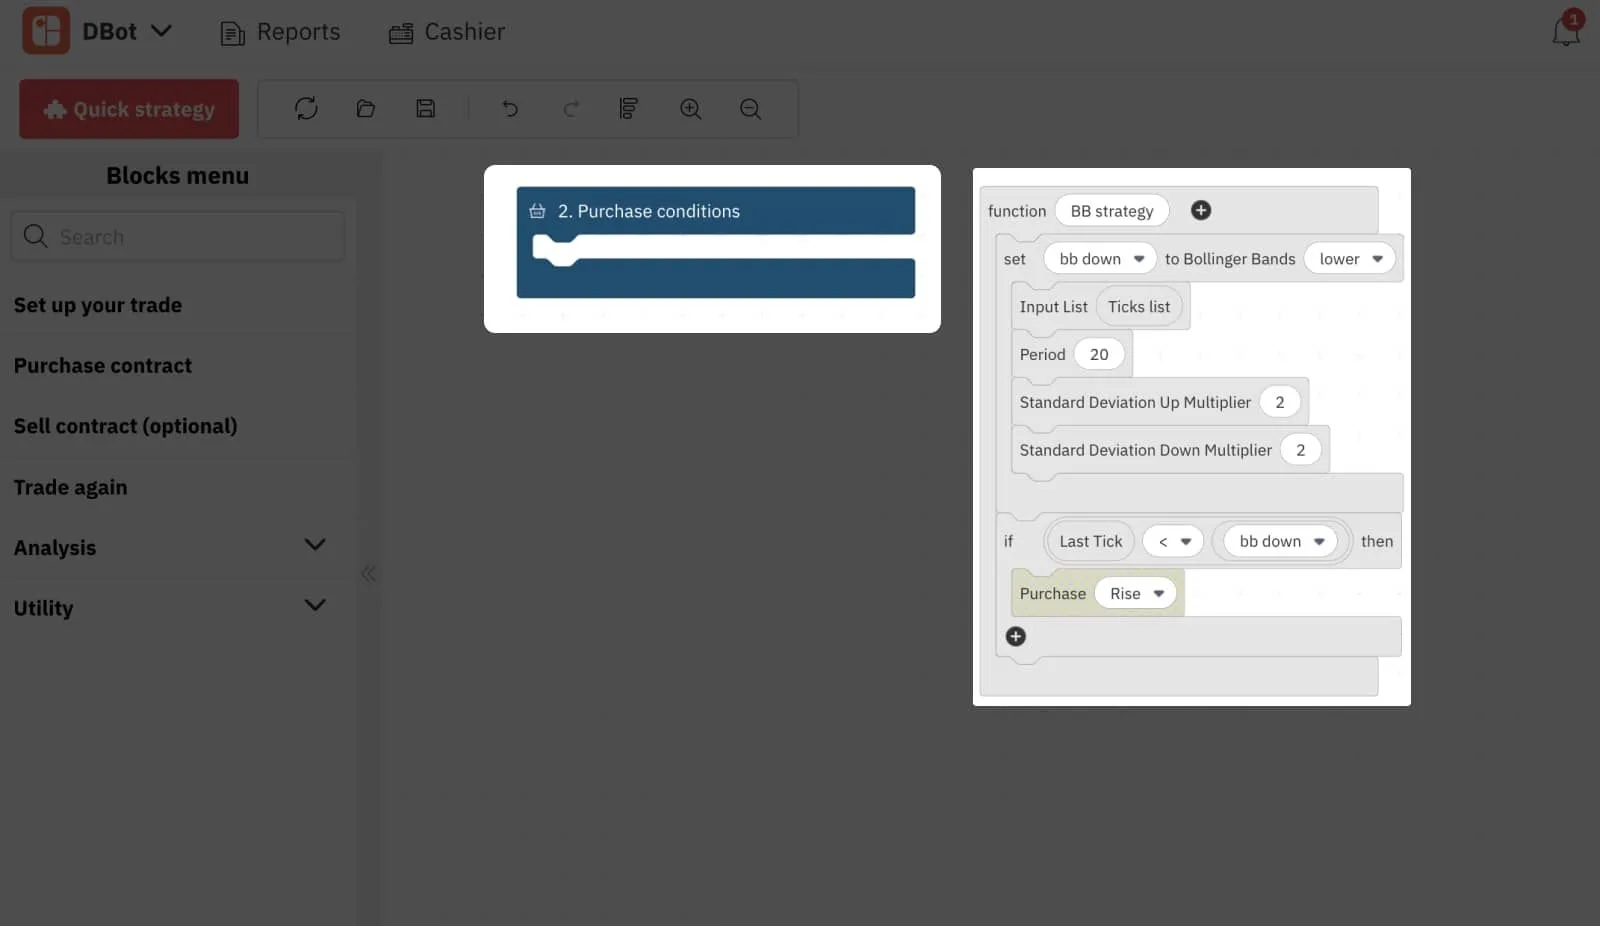
3. Go back to the ‘Custom functions’ subtab, where the new ‘BB strategy’ block has been created. This block will contain all the Purchase conditions contents that you have just inserted into the Function block.
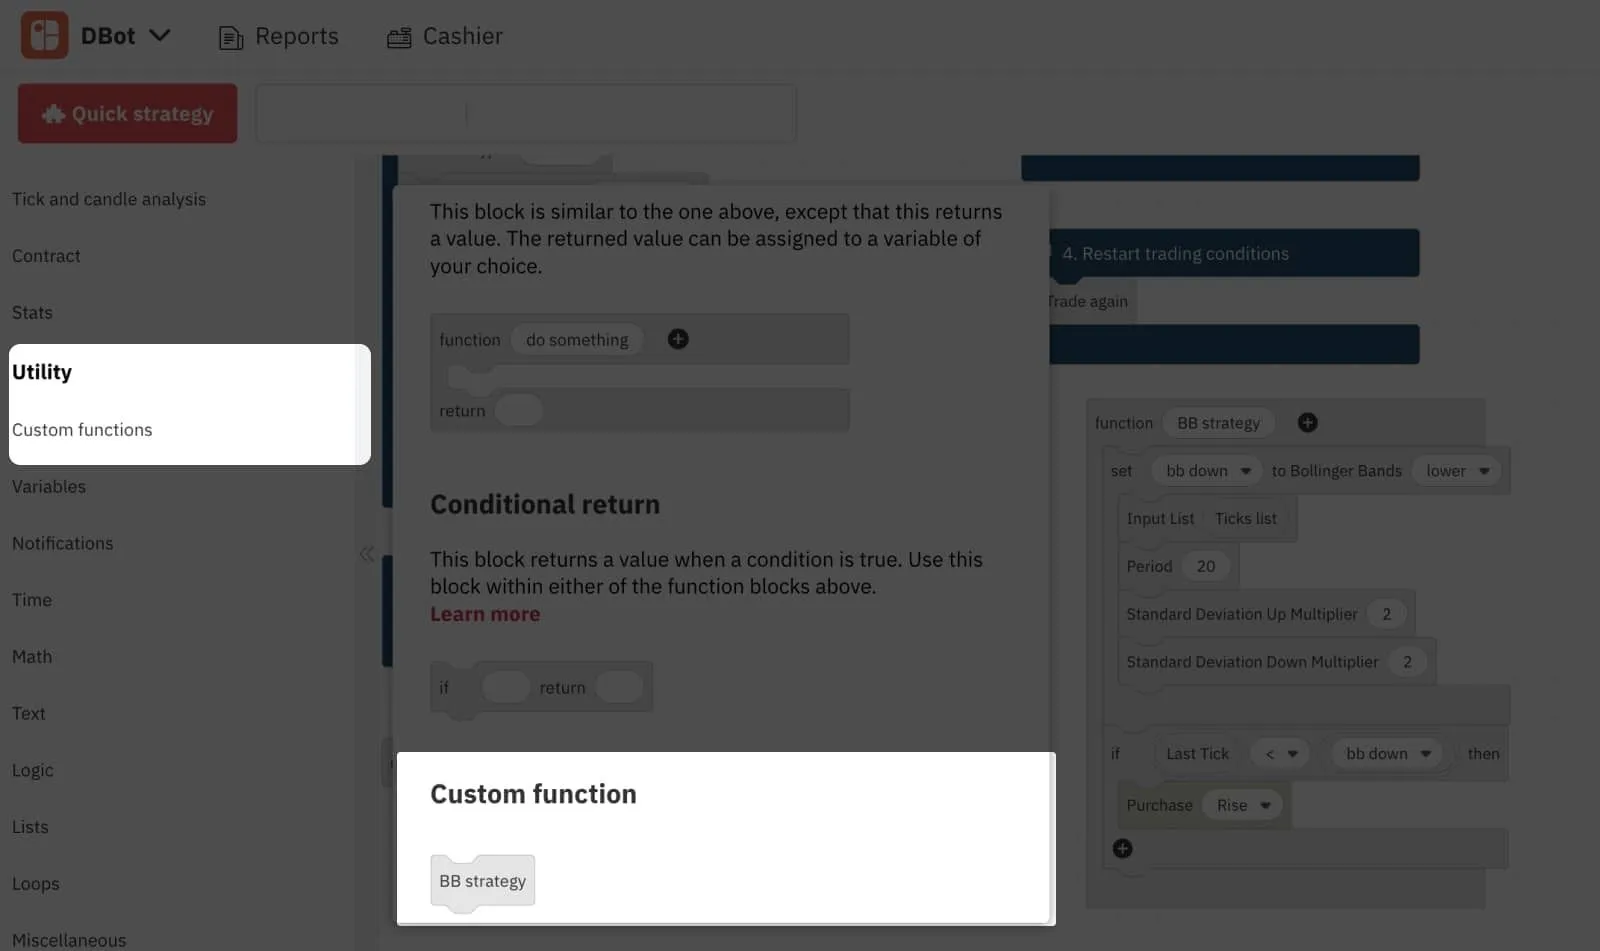
4. Select the new ‘BB strategy’ block, and drag it into your ‘Purchase conditions’ block and collapse the ‘Function’ block. Now, all you have left is 2 tiny blocks representing your entire Purchase conditions parameters:
4. Save and load your strategy
Whenever you are working on Deriv Bot, it automatically saves up to 10 strategies in temporary storage. To retrieve them, click the ‘Import’ icon in the top left corner menu and select the ‘Recent’ tab.
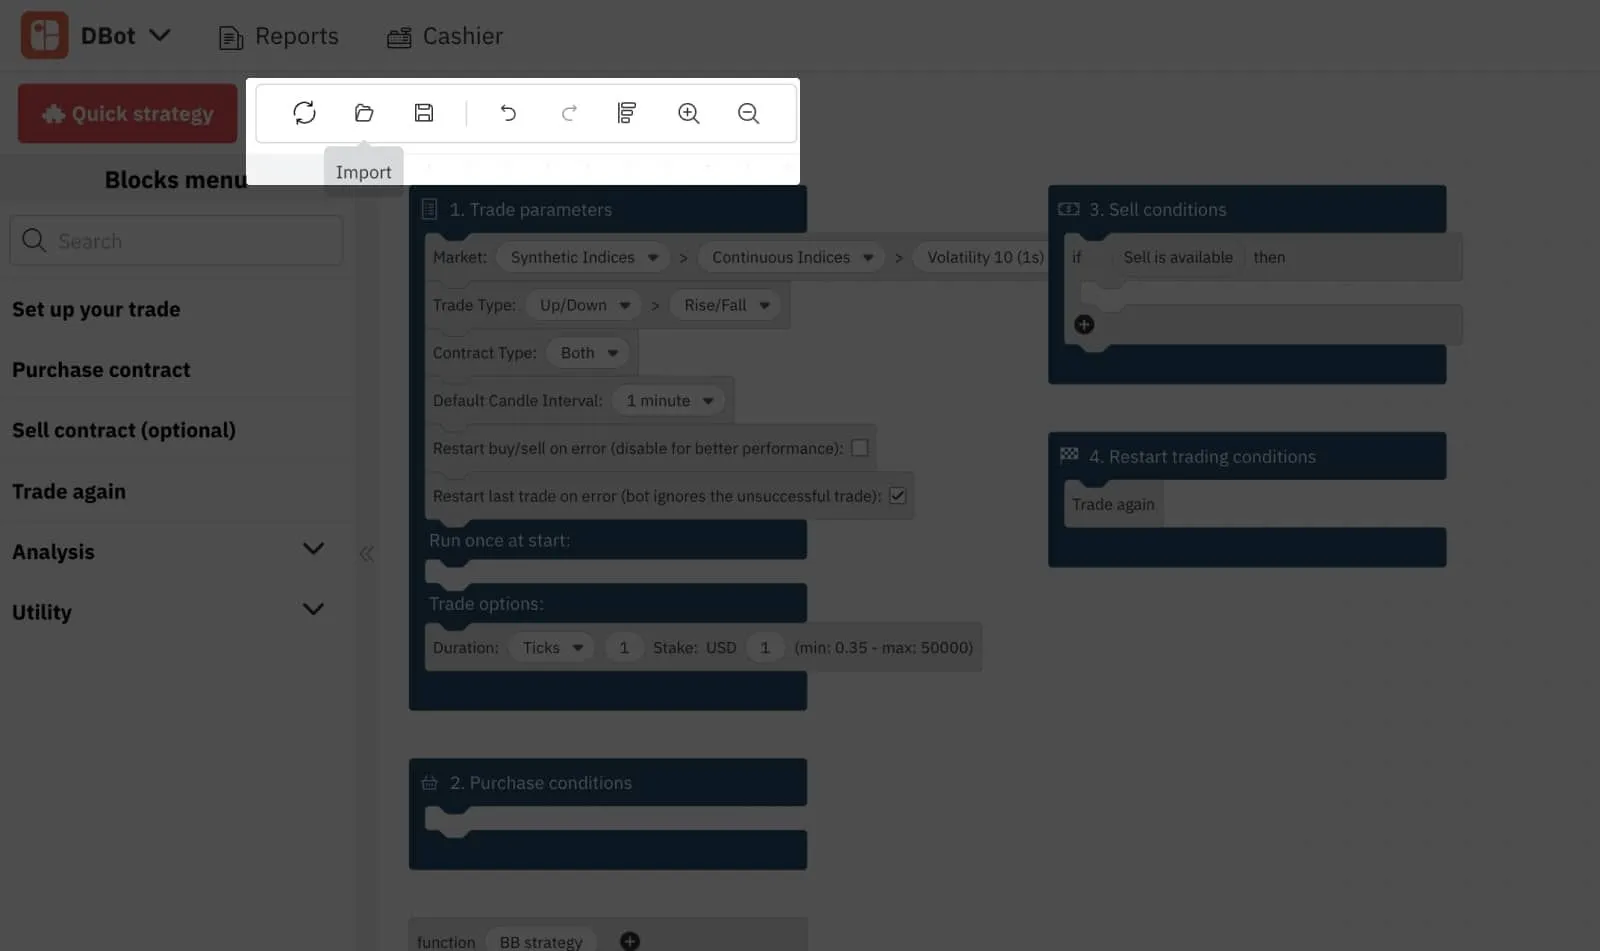
These strategies are accessible until you clear your browser’s cache or until the new ones replace them. To store your strategies permanently, you can save them on your local device or Google Drive by selecting the respective tabs.
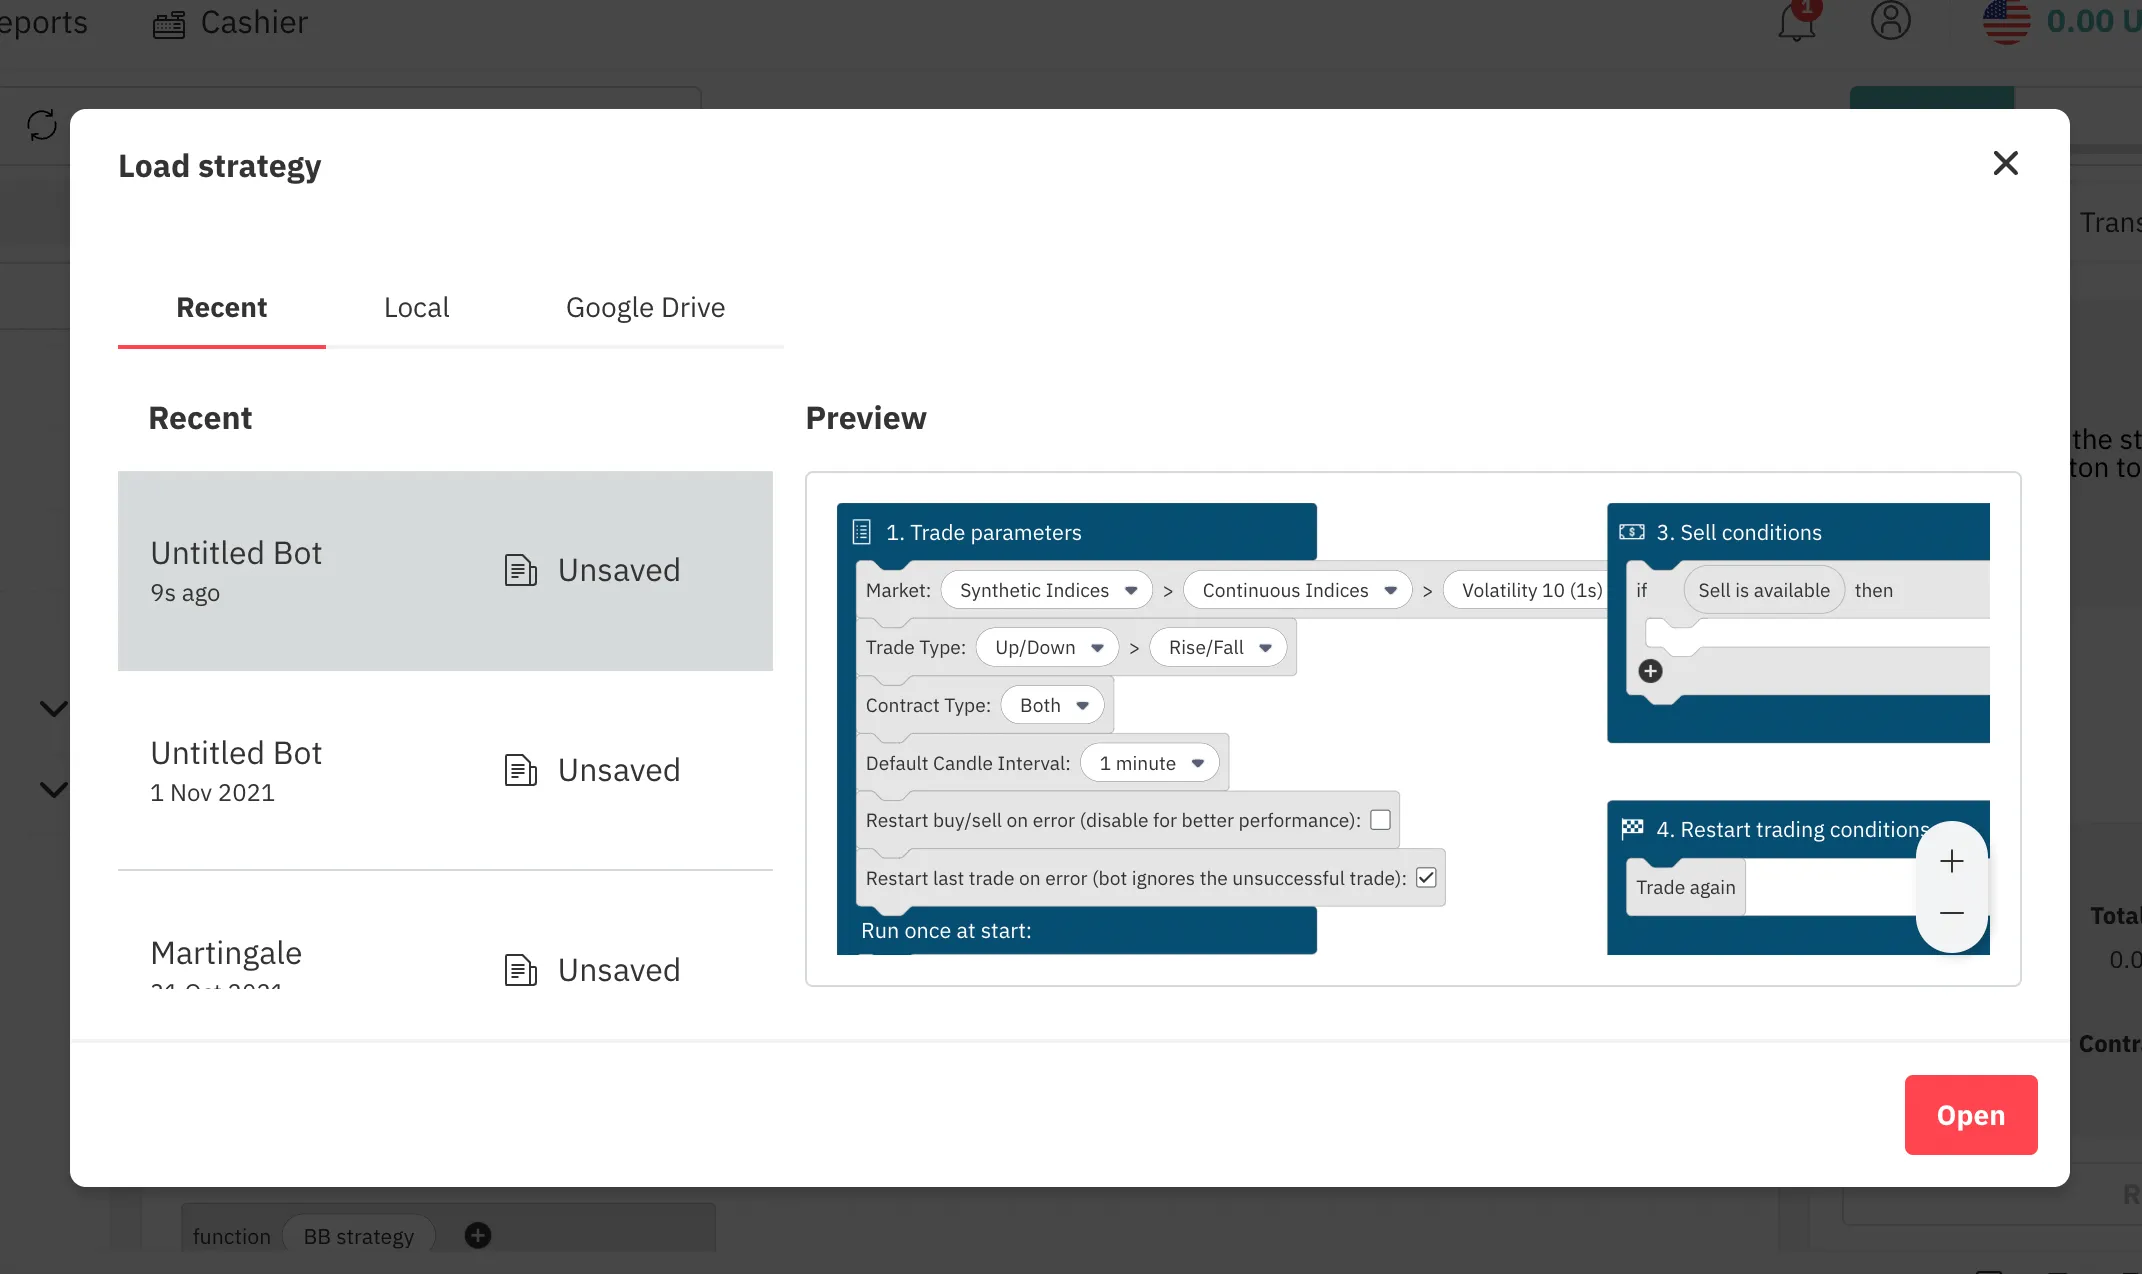
5. Use ready-made strategies
One of the easiest ways to start trading with Deriv Bot is to use a ready-made strategy. Deriv offers 3 pre-built strategies, all of which can be used for trading right away or customised according to your preference.
To access the strategies, click the ‘Quick strategy’ red button in the top left corner of your workspace, select the strategy you prefer, and set the required parameters.

Conclusion
The 5 tips we covered are the most common our traders use, but Deriv Bot offers many more blocks and features that you may find useful for your strategy.
Log into your demo account to discover them all and master your Deriv Bot skills with your own or pre-built strategy – the unlimited virtual funds give you plenty of room for practice.

Market news – Week 2, August 2022
The US non-farm payrolls report released last week was far better than predicted, driving the US dollar higher and relieving worries of a recession hitting the world’s largest economy.
The US non-farm payrolls report released last week was far better than predicted, driving the US dollar higher and relieving worries of a recession hitting the world’s largest economy.
Forex
Last week, EUR/USD was down, trading at around the $1.018 mark. This was because of a positive US employment report released on Friday, August 5 2022, that temporarily spooked the recession's ghost and boosted the US dollar. The data exceeded forecasts by showing that 528,000 new jobs were added in July and that the unemployment rate fell to 3.5%.
Meanwhile, the GBP/USD ended its week in the red after 2 weeks of consecutive gains. The pair struggled to build momentum after the Bank of England's (BoE) comments on the economy.
The BoE raised its policy rate by 50 basis points to 1.75% at its August meeting. However, even after this rate increase, the BoE governor commented that there was no predetermined path for raising rates by 50 basis points in every meeting and that all options would be considered at all future meetings. A combination of heavy pound selling during this BoE event and strong US jobs data led to the GBP/USD falling dramatically.
This week's focus would be the release of US inflation figures and the UK's Gross Domestic Product (GDP) data.
Level up your trading strategy with the latest market news and trade CFDs on your Deriv X Financial account.
Commodities
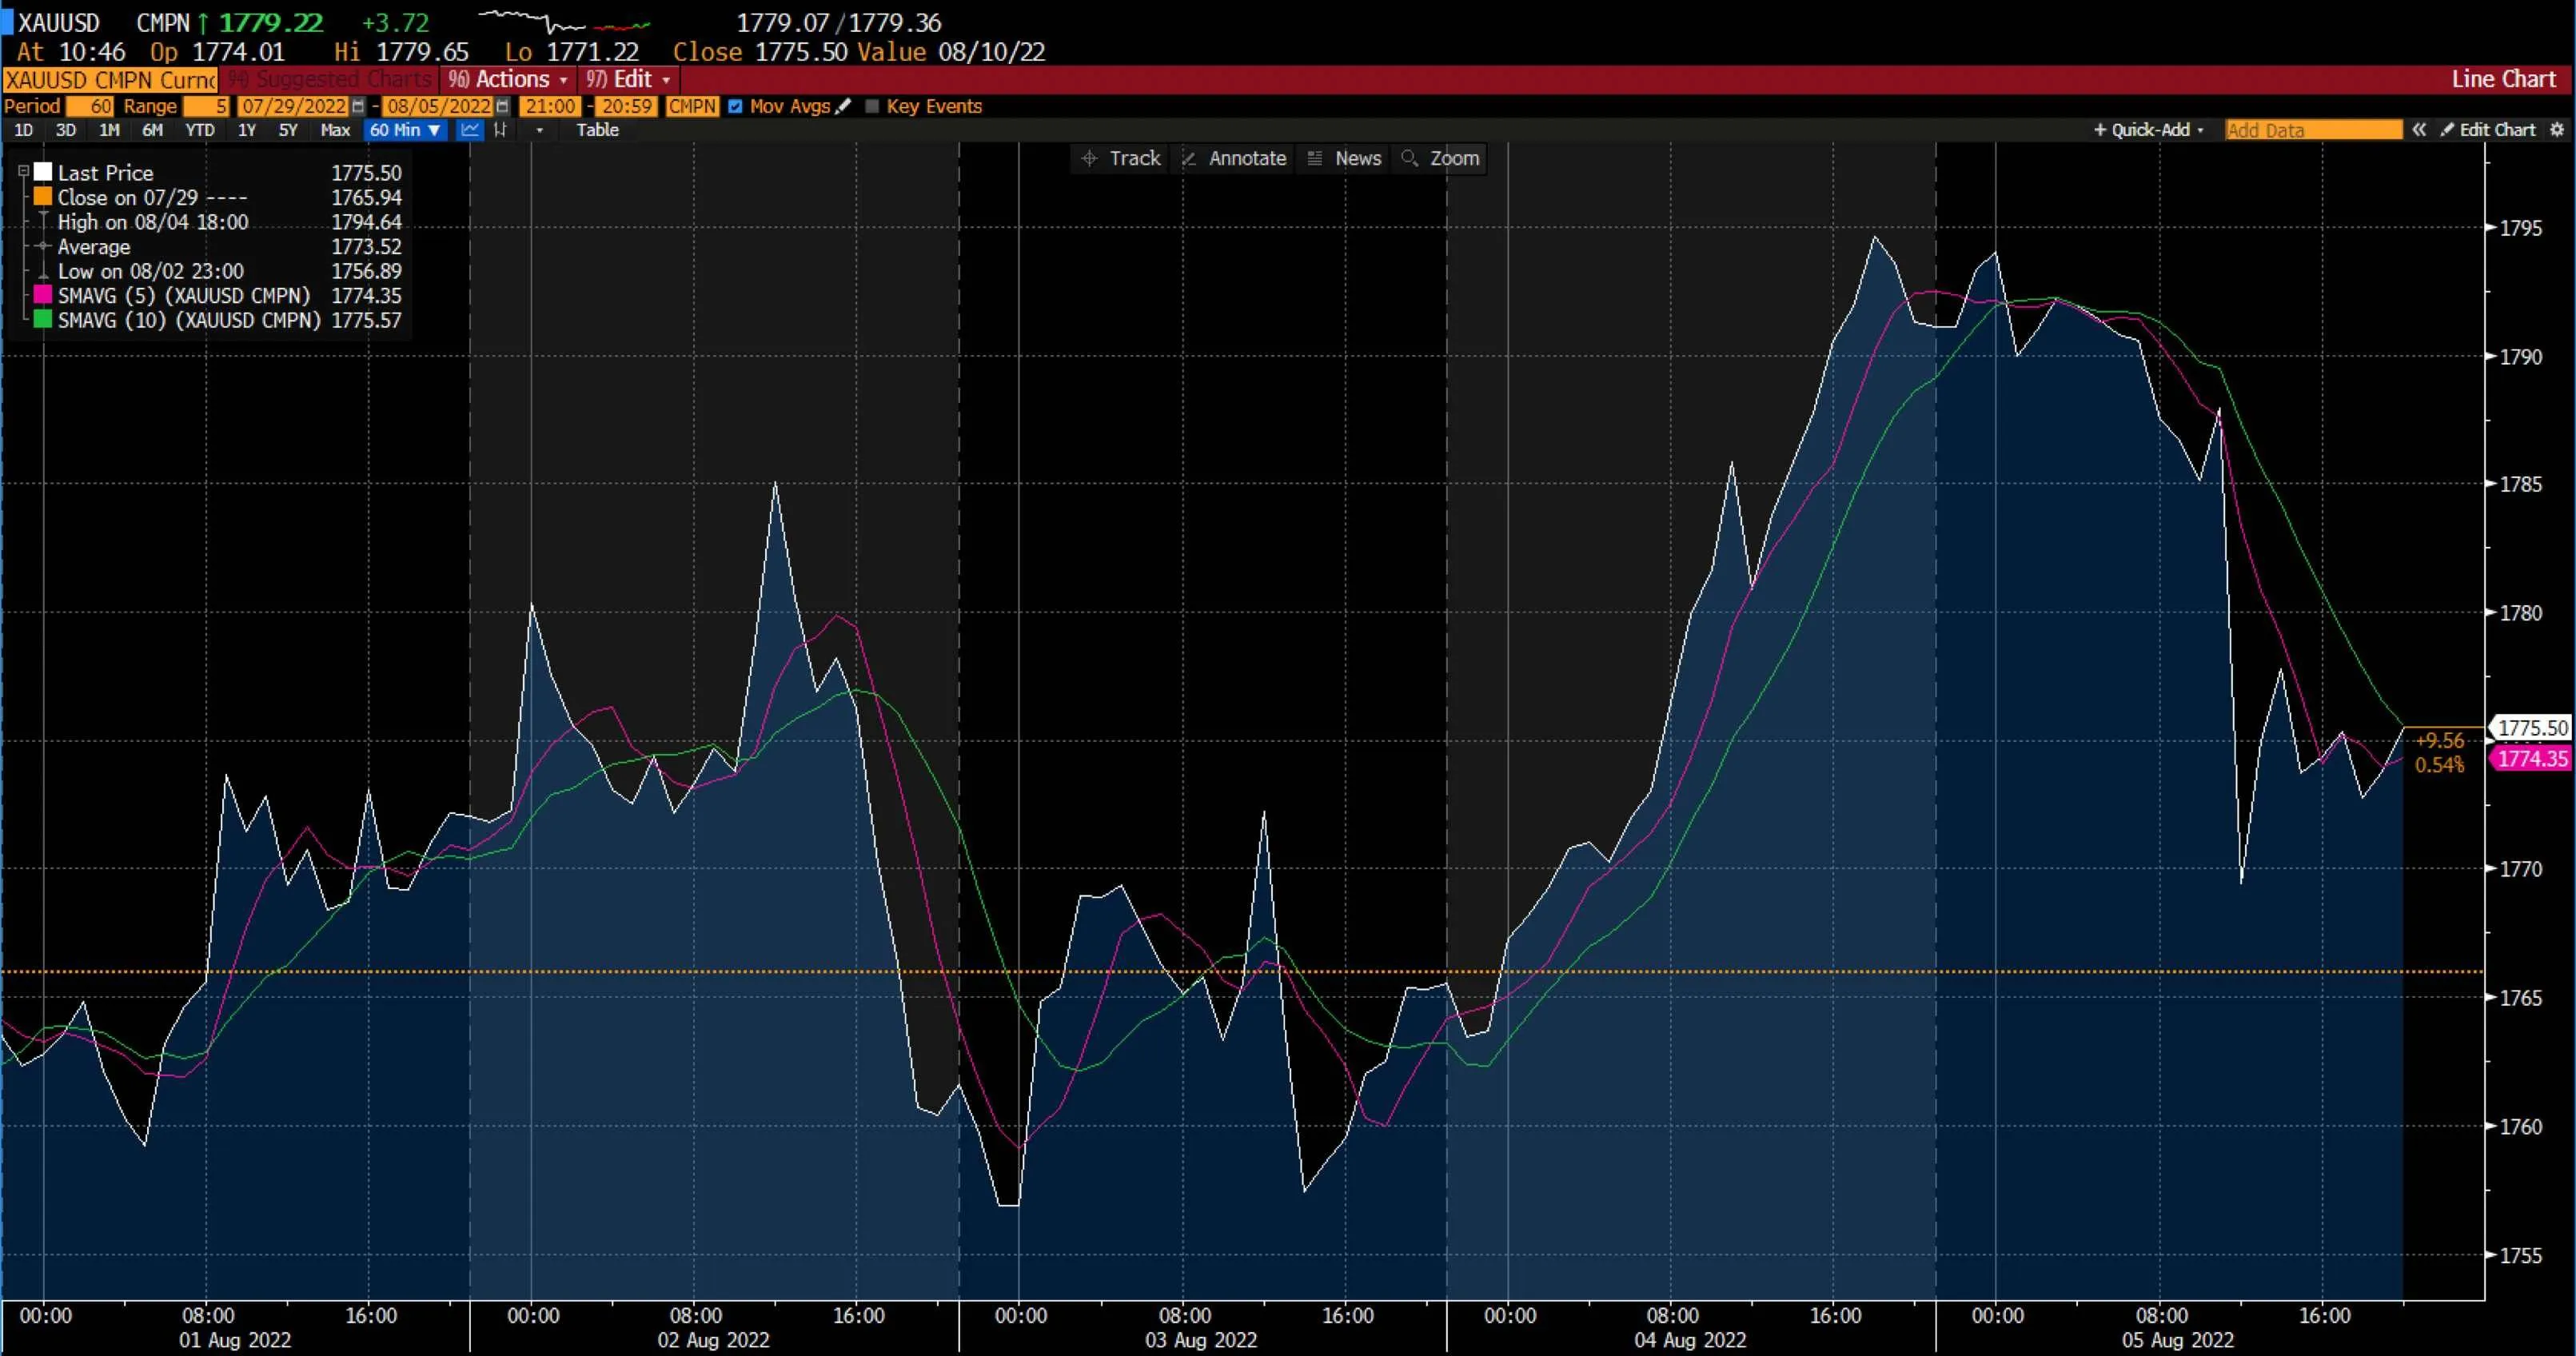
August began with gold climbing to reach near $1,800 before it reversed some of its weekly gains on Friday, 5 August 2022. Since the beginning of the week, XAU/USD gained more than 1%, thanks to the drop in US Treasury bond rates and the US dollar's lacklustre performance. However, following the US's positive July jobs data, gold reversed its course.
The US July inflation report is due this week and will be the next major driver for gold.
Meanwhile, oil fell for the first time in a week since early April. Although oil recovered some of its weekly losses as a result of solid US job growth figures, it ended the week at its lowest level since February, roiled by lingering fears that a recession would reduce fuel consumption.
Oil dealers have been concerned about inflation, economic growth, and demand, but indicators of constrained supply have kept prices stable.
Cryptocurrencies
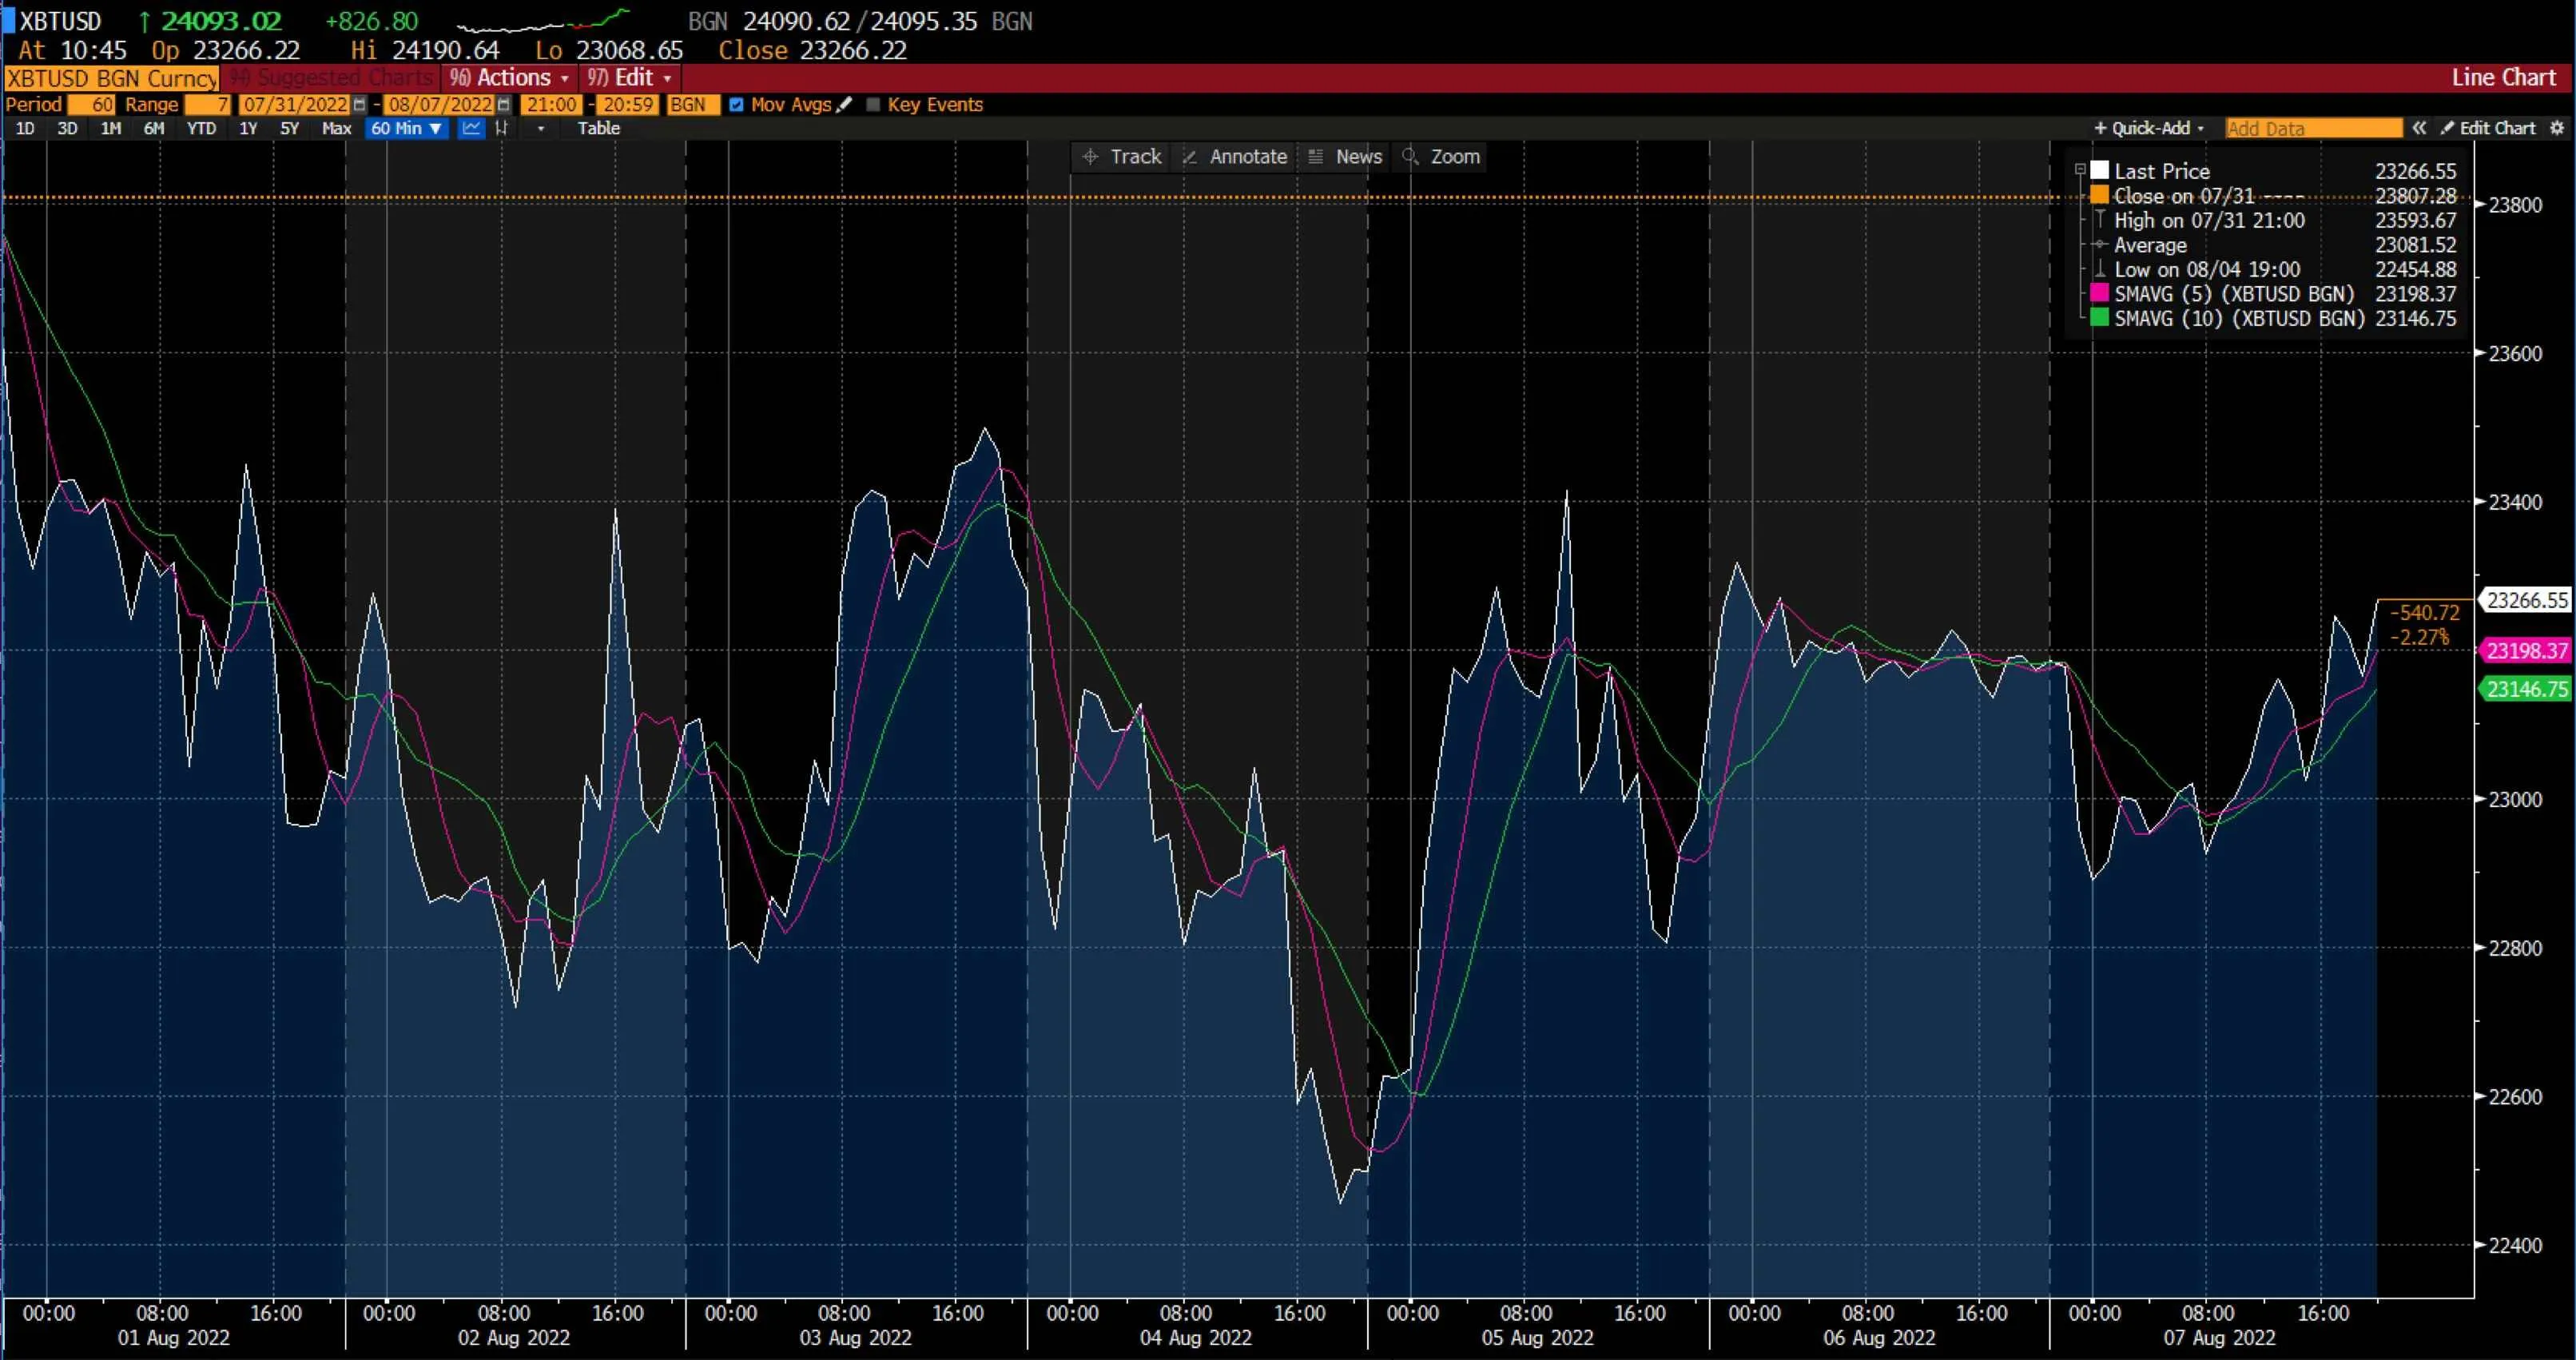
Last week, apart from minor fluctuations, major cryptocurrencies mostly traded sideways. Even though the coins saw a slight decline mid-week, they recovered towards the end of the week without sharp movements.
Bitcoin started the week above the $23,000 level. However, pressure mounted on the most popular cryptocurrency due to US central banks announcing their latest interest rate hike and increasing tension between China and Taiwan. As a result, Bitcoin fell to the mid-$22,000 level. Nevertheless, bulls returned to help Bitcoin climb and go above the $23,000 level.
Bitcoin prices were down by 2.27% at Sunday's close, and the cryptocurrency was trading at $23,266.55. As seen in the chart above, Bitcoin's SMA 5 at $23,198.37 was leading its SMA 10 at $23,146.75.
Ethereum, the second largest cryptocurrency in the world by market capitalisation, followed Bitcoin's footsteps and fell below the $1,500 level mid-week. However, the cryptocurrency recovered and regained the $1,700 threshold by the end of the week.
Maximise market opportunities by sharpening your trading strategy and trading the financial markets with options and multipliers on Deriv Trader.
US stock markets
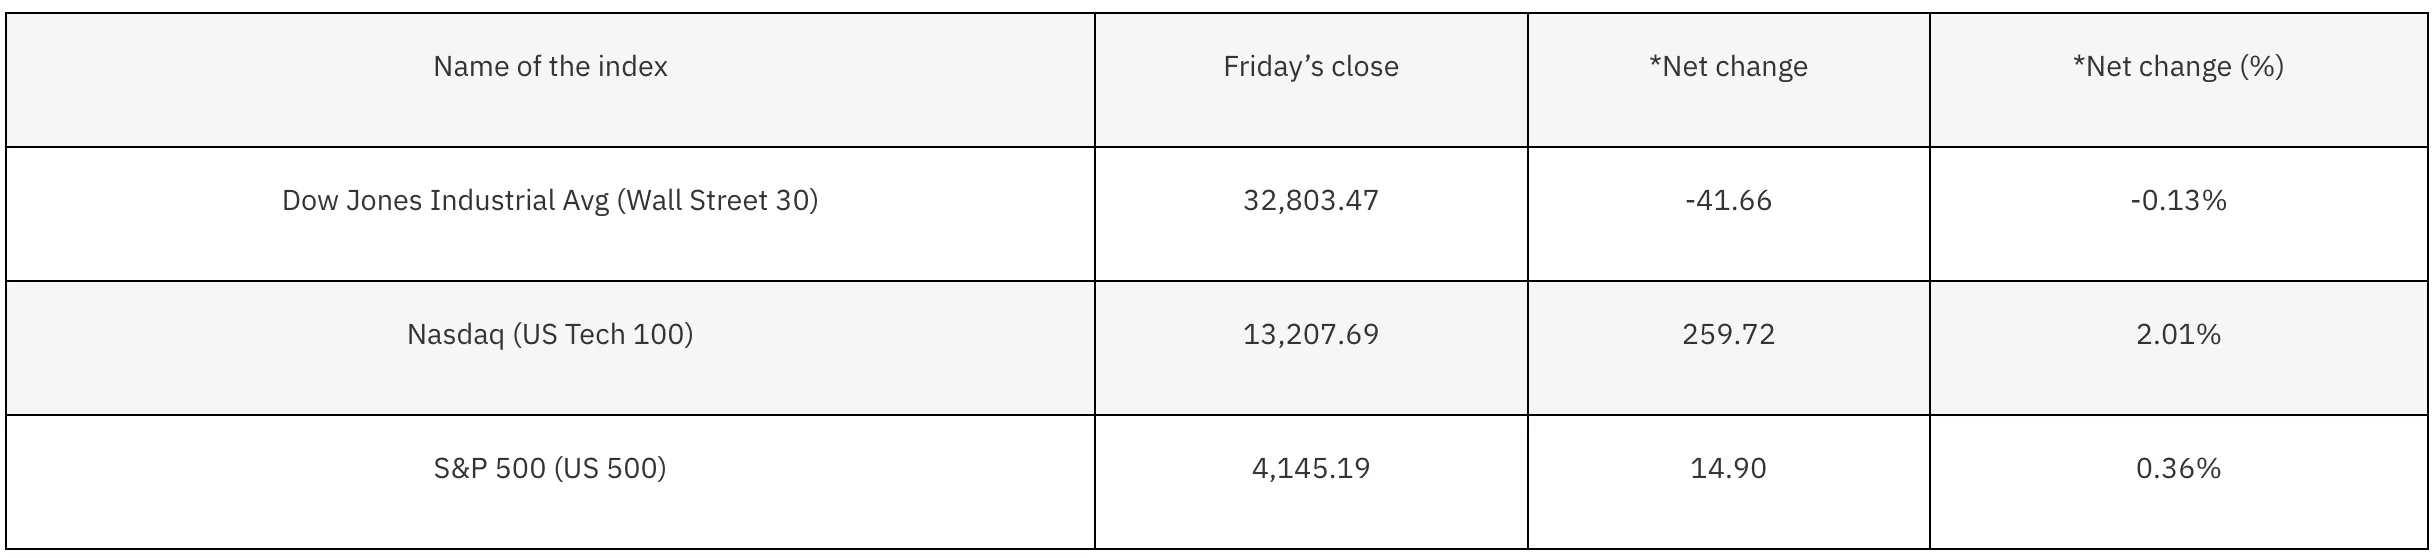
*Net change and net change (%) are based on the weekly closing price change from Friday to Friday.
The US stock market ended the week flat, with the Nasdaq gaining 2.01%, the S&P 500 increasing by 0.36%, and the Dow declining by 0.13%. This was due to impacts of the earnings report and the July non-farm payroll report.
According to non-farm payrolls, the unemployment rate is back to its pre-pandemic level and at its lowest level in 53 years. Despite what might seem like fantastic news, the Federal Reserve believes that job growth is a sign that inflation isn't under control. This has raised the prospect of more aggressive tightening by the Fed, and striking the right balance seems to be quite a challenge for them.
Since a majority of S&P 500 companies have already reported earnings over the last couple of weeks, we can expect a more passive week. An essential update on consumer inflation will be available on Wednesday, 10 August 2022, with the latest Consumer Price Index (CPI).
Now that you’re up-to-date on how the financial markets performed last week, you can improve your strategy and trade CFDs on Deriv MT5 Financial and Financial STP accounts.
Sorry, we couldn’t find any results matching .
Search tips:
- Check your spelling and try again
- Try another keyword