Results for
Guide to copy trading on Deriv cTrader
Discover the ins and outs of copy trading on our copy trading platform in this must-watch video!
Discover the ins and outs of copy trading on our copy trading platform in this must-watch video! Perfect for beginners, we'll walk you through the basics, from copy trading strategy providers to exploring cTrader's copy trading features. Join us for an in-depth exploration of techniques to enhance your copy trading experience on Deriv's cTrader platform.
🚀 Start your copy trading journey on Deriv cTrader: Deriv app
%252520(1).webp)
How to trade company earnings
Learn how to research earnings reports, identify trading opportunities before & after announcements, and avoid common mistakes while trading.
This post was originally published on 26 December, 2023.
Earnings season is a trader’s paradise, providing opportunities to profit from significant stock price movements based on company earnings reports. But it can also be a minefield if you don’t understand how to trade earnings properly.
In this article, we will go through:
- What are earnings reports?
- When is earnings season?
- Crafting an earnings trading strategy
What are earnings reports?
Public companies release quarterly earnings reports detailing their financial performance over the past quarter. These reports include key metrics like:
- EPS (earnings per share) – The total net income or profit earned per share of stock outstanding. This is a key measure of overall profitability.
- Revenue – Total sales/revenue generated by the company during the period. This shows the overall size and growth of the business.
- Operating income – Profit left over after deducting operating expenses, taxes, interest, etc. This is the bottom line earnings number.
- Gross margin – This is gross profit as a percentage of total revenue.
- EBITDA – Earning before interest, taxes, depreciation, and amortisation. This helps compare profit across companies.
- Forward guidance – Management’s forecasts for future quarters or fiscal years. This provides an outlook on growth expectations.
- Cash flow – Net change in cash generated/spent during the period, which is an important metric for liquidity.
- Balance sheet data – This is a snapshot of the company assets, liabilities, and shareholder equity which shows financial strength.
- Segment revenue – This is the revenue breakdown across business units/product lines. This reveals growth areas of the company.
EPS and revenue numbers are compared to analyst estimates, which are typically averages of projections made by market experts. If a company’s actual EPS or revenue exceeds the analyst estimates, it is seen as a positive earnings surprise. If the numbers fall below consensus estimates, it is an earnings miss.
Earnings reports also often include forward guidance from management about expectations for the next quarter or full year. Conference calls with executives discussing results may also influence stock prices based on the tone and outlook provided. Overall, earnings reports give crucial insights into the financial health and trajectory of a business, and major deviations from expectations frequently cause sharp revaluations in stock prices.
When is earnings season?
The earnings season generally occurs in the weeks following the end of each calendar quarter, which are the months of January, April, July, and October. Different markets and regions may have slightly different schedules for earnings season depending on their fiscal years. It's a good idea to check with financial news sources or the investor relations sections of company websites to find exact release dates.
Earnings announcements are scheduled outside regular trading hours to ensure broad dissemination without disrupting the trading day. This entails releasing reports either before the market opens or after it closes. This approach provides traders ample opportunity to absorb the information and decide on their subsequent actions.
Crafting an earnings trading strategy
Here are some tips for developing an effective approach to trading earnings announcements.
- Know key dates – Compile a watchlist ahead of time so you know which companies will be reporting earnings. Pay attention to when they will be announcing results so you are prepared to trade the initial volatility right after numbers are released.
- Use stops – Volatility and gaps can swing prices quickly after an earnings print. You can use stop loss to limit potential downside risk on any trades. However, bear in mind that tight stops may get triggered very quickly, so the optimal position sizing should be used instead.
- Evaluate analyst estimates – Examine the consensus EPS and revenue estimates closely heading into the announcement. Compare these estimates to the results of previous quarters to gauge how challenging it will be for the company to deliver another earnings beat. The higher the bar, the bigger the reaction could be if expectations are exceeded.
- Consider options prices – Options markets are typically forward-looking, so checking call/put prices for an expiry date immediately after earnings announcements may reveal some information about how the market is positioned. You can also use this information to trade the implied volatility if you think the reaction will be muted by selling “volatility”. Or you can buy the tail risk to benefit from outsized intraday volatility and limit downside risk.
- Plan entries and exits – Use technical analysis to identify key support and resistance levels to help time your entries and exits. Look at moving averages, past trading ranges, and volume patterns to pinpoint ideal buy and sell points.
- Use stops – Volatility and gaps can swing prices quickly after an earnings print. You can use stop loss to limit potential downside risk on any trades. However, bear in mind that tight stops may get triggered very quickly so the optimal position sizing should be used instead.
- Review your performance – Be sure to track your earnings trades to assess what worked and didn’t work. And make adjustments to improve over time.
While trading earnings announcements can be immensely profitable thanks to the pops in volatility, it's essential to note that these increased price swings also amplify the potential for losses. Doing your homework and planning ahead will help you make informed decisions during the earnings seasons.
You can open a demo or real trading account with Deriv and take advantage of the price movements happening during this exciting season.

Market recap: Week of 20–24 Nov 2023
Stay informed with our weekly market recap from 20th to 24th November, 2023. Get insights on the latest trends and developments in the financial world.
Japan’s economy
Forexlive: Bloomberg reports Pimco's strategic move, buying the yen and projecting Bank of Japan's potential monetary policy tightening amid quickening inflation. Pimco initiated a long yen position above 140 months ago.
Emmanuel Sharef, Pimco fund manager, notes the possibility of changes in yield-curve control policies and a potential hike. With US inflation decreasing and Japan's still elevated, Pimco sees a natural inclination for a yen long.
Gold economics
Kitco News: Gold's recent ascent, marked by steadier price movements post last month's volatility, draws attention. Kitco's weekly gold survey reveals retail investors' strong bullish stance, contrasting with market analysts who shift to a neutral outlook.
Darin Newsom of Barchart.com suggests this phase aligns with Wave 2 of a short-term uptrend, anticipating an eventual breach of Wave 1's high.
Tech stocks
Yahoo Finance and Reuters: Hedge funds globally swiftly reduced exposure to tech stocks, selling long positions and closing short bets at the fastest pace in seven months, per Goldman Sachs.
In the week from Nov. 10 to Nov. 16, traders shed positions in semiconductor and communications equipment makers, along with exiting long positions on software companies.
Concurrently, S&P 500 stock valuations reached a two-month high above the long-term average. Hedge funds also recorded the fastest selling pace of U.S. consumer staples since April 2020, as highlighted in Goldman Sachs' note. On Monday, 20 Nov, The S&P 500 closed up 0.7%.
Rate hikes update
FX Empire and the RBA: During the Australian Central Bank (RBA) meeting on Nov 7, 2023, chaired by Michele Bullock, the cash rate target was raised by 25 basis points to 4.35%. Minutes reveal concerns over high inflation in advanced economies, with increases in fuel prices impacting headline inflation. Output growth slowed due to monetary policy and cost-of-living pressures, but labor markets remained tight. Housing rent inflation was at 10%, driven by low vacancy rates and population growth.
The economic outlook in China remained uncertain, and in Australia, GDP per capita was expected to decline. RBA forecasts show inflation reaching the top of the target range in late 2025. The AUD/USD gained 0.65% on Monday, 20 Nov. Following a 0.71% rally on Friday, 17 Nov.
Earnings
CNBC, Tom’s Hardware and The Register: Nvidia shares dip 1% despite Q3 earnings beat due to export restrictions affecting sales to China and other countries.
Revenue grew 206% YoY, driven by strong demand for H100 GPUs and ChatGPT-related AI capabilities. Despite stockpiling by Chinese tech giants, export restrictions pose a significant challenge for Nvidia in the near term.
Inflation
Reuters: Fed minutes signal cautious approach to future rate hikes, leaving room for policy pause in the first half of 2024. Officials remain committed to controlling inflation but will proceed carefully to avoid overtightening.
Economists expect the Fed to hold rates steady through most of the first half of next year. U.S. stocks retreated on Tuesday, with the S&P 500 and Nasdaq snapping five-session winning streaks.
Hedge funds
Morning Star: According to Goldman Sachs Group's latest hedge-fund trend report, Tesla (TSLA) continues to be a favored short position for hedge funds, despite the broader popularity of the ‘Magnificent Seven’.
This remains true as of Oct. 31, even though Tesla's stock has seen a significant 90% year-to-date increase.
Economic analysis
Currency News, the Standard and IFS: Post-Autumn Statement analysis Public finances show limited improvement, a weakened growth outlook, and persistently high inflation. Chancellor opts for tax cuts, raising concerns about fiscal challenges.
Key moves include an immediate National Insurance cut, permanent full expensing for corporation tax, and a business rates freeze.
Concerns linger on sustainability and long-term planning. Work Capability Assessment reforms aim to save £1 billion/year.
FTSE100 remains steady; pub stocks rise, banks fall. GBP/USD slides on dollar revival and UK growth forecast disappointment.
Economic outlook
The Guardian: Leading economists caution that Rishi Sunak's government is steering towards a potentially more stringent austerity drive post the next general election than the past decade.
The Institute for Fiscal Studies notes tax cuts may be funded by significant public spending reductions from 2025. Despite national insurance cuts, overall taxation is anticipated to hit a 75-year high.
The Resolution Foundation predicts economic challenges, persistent inflation, and higher taxes could leave the average household £1,900 poorer by January 2025.
Energy news
The Wall Street Journal and Reuters: The latest EIA data reveals a notable increase in U.S. crude oil and gasoline inventories last week, exceeding expectations.
Refinery capacity use also rose to 87%. Commercial crude oil stockpiles, excluding the Strategic Petroleum Reserve, climbed by 8.7 million barrels.
Additionally, oil stored at Cushing, Okla., increased by 900,000 barrels.
Meanwhile, OPEC+ postponed the policy meeting to Nov 30, indicating differing views within the group, says UBS analyst Giovanni Staunovo.

Navigating year-end market dynamics: A comprehensive trader's toolkit
Gear up for year-end market dynamics in trading, with guidance on seasonal patterns and protecting profits as 2024 approaches.
As the calendar year winds down, traders often find themselves at the threshold of a potential market rally — a phenomenon often associated with the last week of December, known as the Santa Claus rally. This unique market trend unfolds over the last five trading days in December and the initial two trading days in the following January, usually contributing to a rise in stock prices.
What is the Santa Claus rally?
The Santa Claus rally is not merely a seasonal occurrence; it is a dynamic interplay of market forces influenced by various factors. For example, let’s take a look at how the Santa Claus rally affected the S&P 500 over the last few years.

Source: Deriv; info adapted from Yahoo Finance
For the past seven years, Santa has been a consistent visitor to Wall Street, bringing with him the gift of a Santa Claus rally in the S&P 500. This enchanting phenomenon has seen the index notch seven consecutive rallies during the festive season.
As we approach the close of another year, the question looms: will Santa keep his streak alive and deliver an eighth consecutive rally, or are we on the brink of a new market narrative?
What traders can look forward to
Traders frequently witness increased market activity during this period, attributed to heightened purchases in anticipation of the January effect. This anticipation, coupled with lighter trading volume due to holiday vacations, creates an environment where market movements can be more easily influenced, potentially leading to upward trends.
Additionally, the slowdown in tax-loss harvesting at the beginning of December plays a role in this market dynamic. As tax considerations become less pressing, the selling pressure that may have depressed prices earlier in the month eases, contributing to the rally. Furthermore, the tendency for short sellers and pessimistic investors to take vacations around the holidays can further amplify the upward movement.
Throughout the identified 7 trading days, stock values have historically experienced an increase about 71% of the time, surpassing the average performance observed during a standard 7-day period.

In this guide, we delve into a comprehensive set of strategic considerations to empower investors in navigating and capitalising on the impending year-end market rally.
From portfolio reviews to market sentiment and from investment strategies to disciplined approaches amid market volatility, this article provides a roadmap for traders seeking to position themselves advantageously as the year concludes, recognising the uncertainties inherent in market fluctuations.
Tips to navigate the year-end rally
Let's explore the key insights and actionable strategies to ensure a proactive and informed approach to the upcoming market dynamics.
1. Review your portfolio
- Assess your current contracts and identify underperforming assets.
- Consider rebalancing to optimise your portfolio based on market conditions.
- Evaluate the diversification of your trades to ensure a well-balanced and resilient portfolio.
- Weed out trades that no longer align with your financial goals.
2. Explore sector rotation strategies
- Analyse historical sector rotation patterns during year-end rallies.
- Adjust your portfolio to align with sectors that are expected to outperform.
- Be flexible in adapting to changing market dynamics and sector trends.
3. Keep an eye on market sentiment
- Monitor market sentiment indicators, such as investor surveys and sentiment indices.
- Be aware of potential market euphoria or panic and adjust your strategies accordingly.
- Consider contrarian approaches if the market appears overly optimistic or pessimistic.
4. Evaluate interest rates
- Keep an eye on interest rate movements as they can influence various asset classes.
- Understand the potential impact of rising or falling interest rates on your portfolio.
- Consider the prevailing interest rate environment and anticipate interest rate expectations for the next year — whether they are expected to rise, remain stable, or fall.
- Adjust your contracts based on a comprehensive understanding of both current interest rate conditions and future expectations.
5. Tax planning
- Evaluate the tax implications of your trade decisions.
- Harvest tax losses to offset gains and minimise tax liabilities.
- Leverage tax-advantaged accounts to optimise your overall tax position.
6. Evaluate liquidity of your trades
- Examine the liquidity of your trades, especially in volatile markets.
- Ensure that you can easily buy or sell assets without significant price impact.
- Be cautious of illiquid trades, and consider divesting if liquidity becomes a concern.
7. Reassess long-term trading strategies
- Reflect on your long-term financial goals.
- Consider whether your portfolio is aligned with your evolving financial objectives and risk tolerance.
- Explore opportunities for long-term growth and adjust your strategy accordingly.
8. Review contract costs
- Evaluate the fees and expenses associated with your contracts to optimise your overall costs.
- Consider low-cost options, such as index funds or exchange-traded funds (ETFs), to enhance potential returns.
9. Monitor technological advancements
- Stay informed about technological developments that may impact industries.
- Consider trades in sectors driven by emerging technologies.
- Be wary of companies that may face obsolescence due to technological shifts.
10. Stay disciplined amid market volatility
- Prepare mentally for market fluctuations and stay disciplined in your approach.
- Avoid making impulsive decisions based on short-term market movements.
- Stick to your long-term plan and objectives.
As the year draws to a close, navigating the potential opportunities and challenges of the year-end market rally requires a strategic and informed approach. This article outlines a comprehensive set of considerations, ranging from portfolio reviews to monitoring market sentiment, sector rotation, and interest rates.
Recognising the uncertainties inherent in market fluctuations, traders are urged to carefully evaluate their holdings and adapt their strategies to align with changing dynamics. As we step into the upcoming market dynamics, the key lies in remaining vigilant, disciplined, and adaptable — a formula for success in the ever-shifting landscape of the financial markets.
Log in to your Deriv account now to check on your positions before the year-end rally.
.webp)
10 factors driving stock and index price movements
Discover the 10 key factors behind stock and index price movements, enabling you to make informed trading decisions.
Stock prices don't move randomly. Here's what you need to know about the 10 fundamental factors that drive stock and index prices.
In financial markets, understanding the dynamics behind the movement of stock and index prices is crucial for investors, traders and analysts. These movements are not random; they are influenced by a multitude of factors ranging from macroeconomic indicators to company-specific events.
In this article, we delve into some of these key factors to provide a clearer picture of what drives stock and index price movements.
Economic indicators
Macroeconomic data plays a significant role.
Indicators like GDP growth, unemployment rates, inflation, and consumer confidence impact market sentiment. For instance, strong GDP growth can signal a robust economy, bolstering investor confidence and driving stock prices up.
Conversely, high inflation might prompt fears of economic slowdown, adversely affecting stock prices.
Interest rates
Central banks, such as the Federal Reserve in the US, influence stock prices through their monetary policy decisions, particularly interest rate changes.
Lower interest rates tend to make stocks more attractive, as bonds and savings accounts offer lower returns.
Conversely, when interest rates rise, stocks may become less appealing, and this can lead to a decline in stock prices.
Corporate earnings and financial performance
A company’s financial health is a critical driver of its stock price.
Earnings reports that exceed market expectations typically lead to a rise in the stock’s price, while disappointing earnings can lead to a decline.
Financial metrics like revenue growth, profit margins, debt levels, and cash flow are closely watched by investors as well as the company’s forward guidance.
Market sentiment
This encompasses the general mood or attitude of investors towards the market or a particular stock. Sentiment can be influenced by news, reports, geopolitical events, and even rumours. Positive sentiment can drive prices up, while negative sentiment can lead to sell-offs.
Political and geopolitical events
Political stability, elections, policy changes, and international events can have a profound impact on stock markets. For example, trade policies or sanctions can affect specific industries or the entire market.
Sector performance
Stocks are often influenced by the performance of the sector they belong to. For example, technological advancements can boost tech stocks, while regulatory changes can impact the financial sector.
Technological changes and innovation
Breakthroughs in technology or innovative business models can significantly alter industry landscapes, benefiting some companies while disadvantaging others. Companies at the forefront of innovation tend to attract investor interest, potentially driving their stock prices up.
Market liquidity
Liquidity, the ease with which stocks can be bought or sold without impacting their price, also affects stock movements. Higher liquidity generally allows for smoother price movements, while lower liquidity can lead to more volatile price changes.
Foreign exchange rates
For multinational companies, fluctuations in foreign exchange rates can impact earnings and, by extension, stock prices.
A stronger home currency can make exports more expensive and can even reduce the value of overseas earnings when converted back, potentially affecting the stock price.
Regulatory changes
Changes in regulations can have significant impacts, especially on certain sectors like healthcare, financial services, and energy.
Increased regulation might impose additional costs on companies, while deregulation might open up new opportunities.
Knowing these factors can help individuals gain a clearer picture of what affects stock and index prices. It's important to recognise that the list above isn’t exhaustive, and different factors often interact in unpredictable ways, making stock market analysis both challenging and fascinating. For investors and market participants, staying informed and adaptable is key to navigating this ever-evolving landscape.
Trade the world’s most popular stocks and global indices on Deriv. Start with a free demo account today, that comes with 10,000 USD in virtual funds, so you can practise trading risk-free before upgrading to real money.
%252520(1).webp)
A guide to Deriv cTrader
Welcome to our guide on the Deriv cTrader platform. If you’re new to the platform and eager to learn the fundamentals, this video is designed for you.
Welcome to our guide on the Deriv cTrader platform. If you’re new to the platform and eager to learn the fundamentals, this video is designed for you.
This video will address questions such as “What is Deriv cTrader?” and “How to use Deriv cTrader?” We will guide you through the necessary steps to set up your account, utilise tools effectively, and comprehend the various features available.
To begin your Deriv cTrader journey, click on the link below to create your account:
https://app.deriv.com
%25252520(1).webp)
Market Radar: Year-end recap on US interest rates, ECB, BOE, crypto and BOJ news
The year-end market radar features US interest rates, ECB and BOE data, crypto trends, and the latest news on the Bank of Japan (BOJ).
Here are the updates on the crucial financial events that unfolded during the final week of 2023.
Join us as we recap the year-end highlights, including updates on:
- US interest rates
- ECB and BOE data
- Crypto trends
- BOJ news
Stay informed with our weekly market analysis on Market Radar.

Deriv cTrader Volatility Indices explained
Volatility refers to the speed and magnitude of market movements. It shapes every trader’s perception of risk and reward.
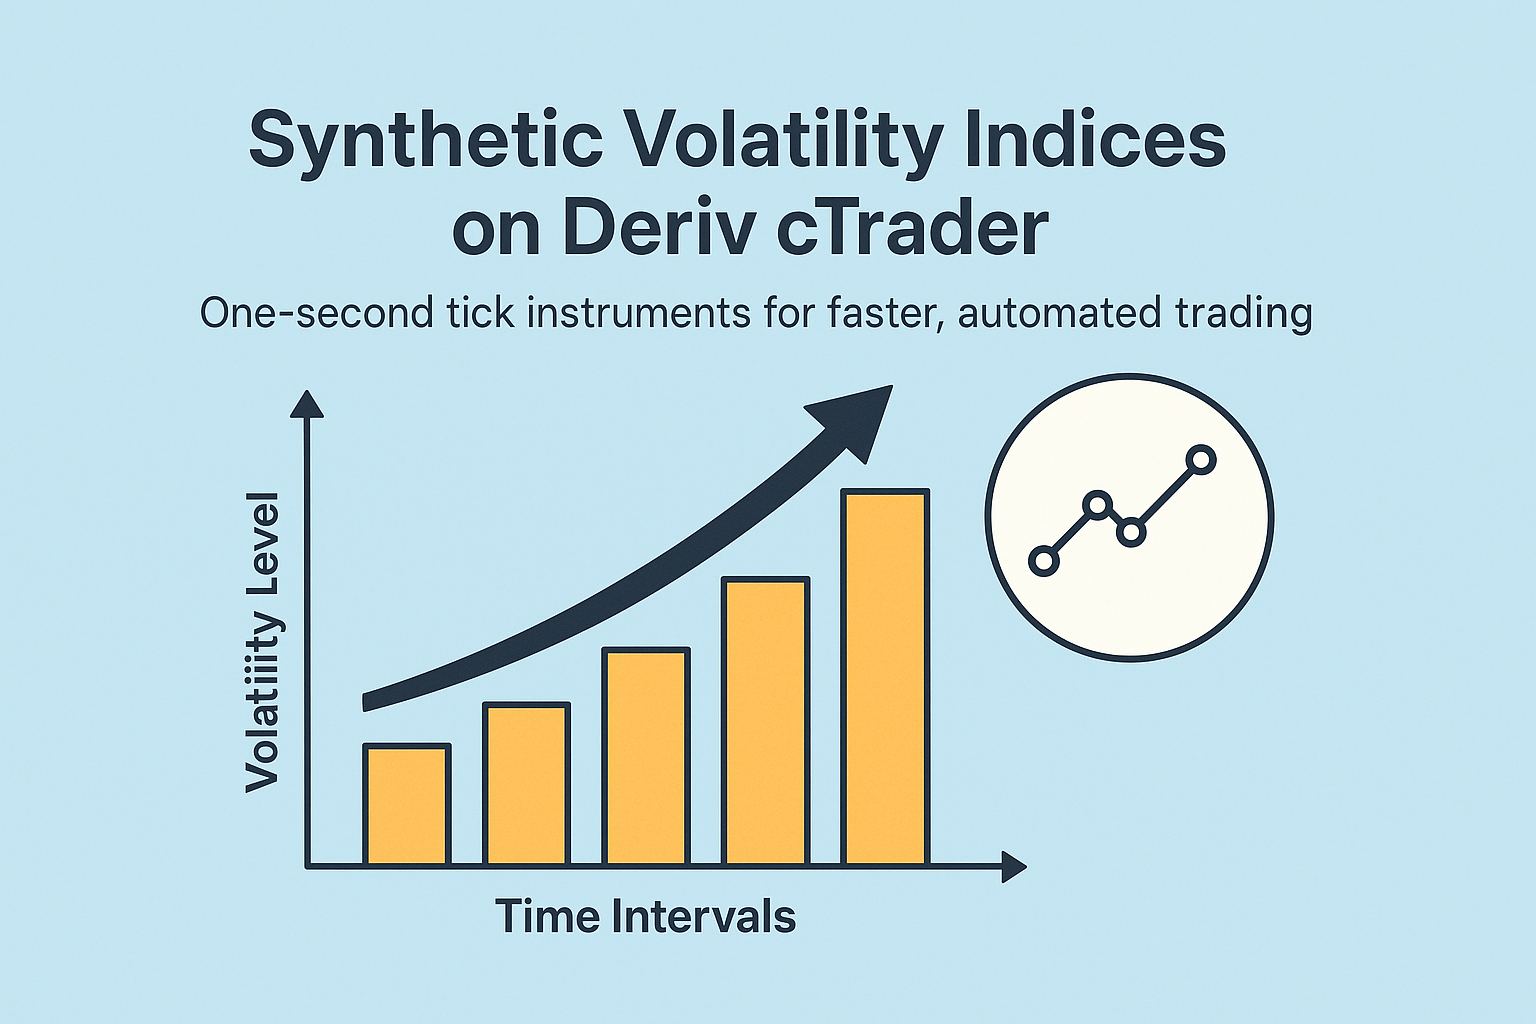
Volatility refers to the speed and magnitude of market movements. It shapes every trader’s perception of risk and reward. On Deriv, volatility takes a unique form through synthetic indices — algorithmically generated markets that mimic real-world price behaviour without being affected by macroeconomic news or liquidity shifts.
In 2025, Deriv extended its innovation with the launch of fifteen new volatility and Crash/Boom indices on Deriv cTrader. These one-second tick instruments enable faster execution, finer control over volatility regimes, and seamless integration with automated systems such as cBots and Expert Advisors (EAs). Together, they expand Deriv’s reputation as a trusted provider of transparent, data-driven synthetic markets.
These indices are designed for precision and consistency. They enable traders to test, refine, and automate strategies in a stable environment that operates 24/7, free from external disruptions — ideal for both educational purposes and testing automated strategies.
Quick summary
- Volatility indices replicate markets with fixed volatility levels (e.g., 15%, 30%, 90%) or defined event probabilities (e.g., one Boom or Crash every 600 ticks).
- They run continuously and are unaffected by real-world events, creating a controlled testing ground for traders and developers.
- Deriv launched seven new Deriv cTrader-exclusive indices: Volatility 15, 30, and 90 (1s), plus Boom 600, Crash 600, Boom 900, and Crash 900, offering faster tick speeds and broader volatility coverage.
- Demo access began 4 January 2024, with live trading available from 11 January 2024.
- The 1-second series bridges traditional volatility concepts such as the CBOE Volatility Index (VIX) with synthetic consistency, allowing traders to plan around predictable volatility “regimes.”
What are synthetic indices, and how can traders use them?
Deriv’s synthetic indices are markets generated by cryptographically-secure algorithms that produce consistent statistical characteristics. Each index either maintains a fixed volatility level or follows a stochastic pattern that defines the probability of sharp price events, such as spikes or drops.
They provide continuous data streams and are ideal for studying market behaviour, developing automated strategies, and teaching volatility management in isolation from real-world variables. A trader using Volatility 30 (1s) can receive approximately 86,400 ticks per day, allowing for precise backtesting and automation insights.
This reliability enables structured learning and automated strategy testing within controlled volatility regimes, which is a crucial component of Deriv’s synthetic markets ecosystem.
Why do volatility indices matter for Deriv traders?
Deriv’s latest expansion marks a key milestone in the evolution of synthetic trading. It extends the company’s vision of creating advanced tools for both discretionary and algorithmic traders.
According to Prakash Bhudia, Deriv’s Head of Product & Growth:
“The new indices amplify opportunities by giving traders faster, cleaner access to volatility patterns — without needing complex technical setups.”
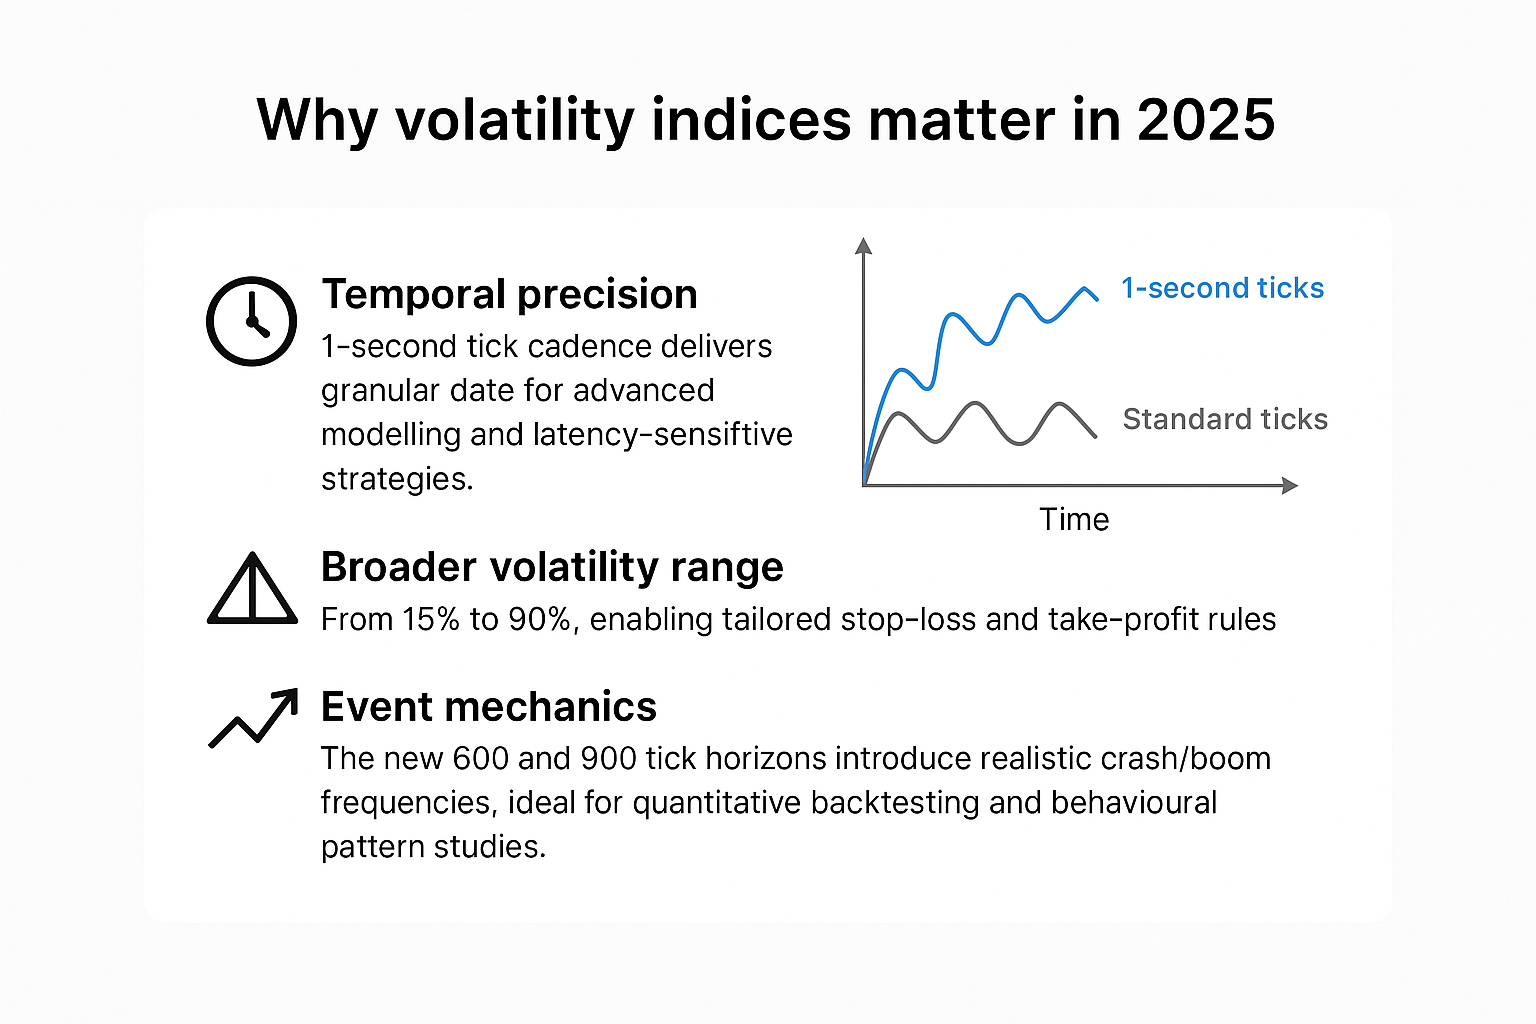
Three innovations define this release:
- Temporal precision: A one-second tick cadence delivers granular data for advanced modeling and latency-sensitive (ultra-fast execution) strategies.
- Broader volatility range: From 15% to 90%, enabling tailored stop-loss and take-profit rules.
- Event mechanics: The new 600 and 900 tick horizons introduce realistic crash/boom frequencies, ideal for quantitative backtesting and behavioural pattern studies.
Together, these indices demonstrate how Deriv continues to refine synthetic markets for diverse trading and educational use cases, enabling traders to master volatility with greater control and data transparency — a perspective also supported by the IMF’s Global Financial Stability Report.
How Deriv’s volatility and Crash/Boom indices compare
Notes: “σ” denotes volatility. “Avg event frequency” represents long-term statistical averages rather than fixed timing.
This comparison highlights how each instrument fits different volatility regimes and strategy objectives, helping traders align risk exposure with trading style.
How can traders use Crash and Boom indices effectively?
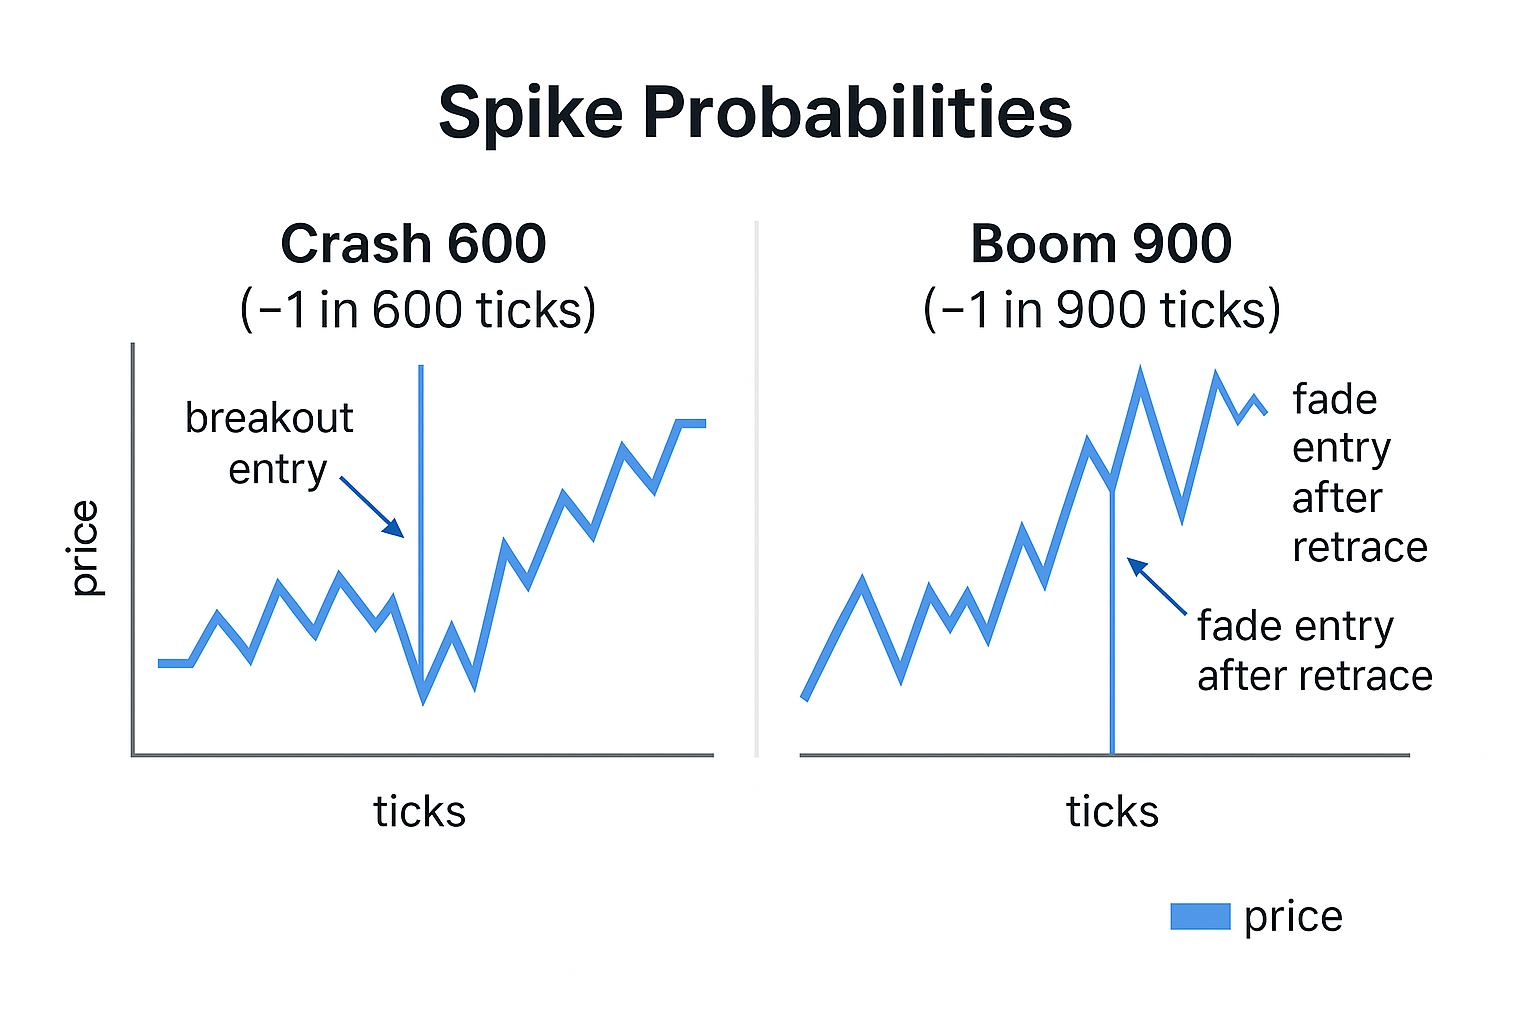
Crash and Boom indices are designed to replicate sudden price movements — upward “booms” or downward “crashes.” Every tick represents a small probability of a large move.
- Crash 600: Roughly one major drop every 600 ticks.
- Boom 900: Roughly one major spike every 900 ticks.
This stochastic design allows traders to test both breakout and fade strategies:
- Breakout strategies enter when a spike begins and trail the move.
- Fade strategies trade in the opposite direction after volatility normalises.
Monitoring spike frequency and magnitude helps define realistic stop-loss levels and manage drawdown. These dynamics demonstrate how volatility regimes within synthetic markets can be applied to both educational and live-trading scenarios.
To illustrate, a trader analysing Boom 900 might expect approximately 144 major spikes in a 24-hour session (given 86 400 ticks per day ÷ 900). This quantitative expectation helps in calibrating risk and timing automation logic.
Which Deriv platforms are best for volatility trading strategies?
Deriv offers multiple platforms for different trader profiles:
- Deriv cTrader: Advanced order management, Depth of Market, and cBots automation. Ideal for 1-second indices and 600/900 series.
- Deriv MT5: Multi-asset environment supporting EAs, hedging, and indicator libraries. Best for combining synthetics with forex, crypto, and stock Contract for Difference (CFDs).
- Deriv Trader: Home of multipliers and options, providing fixed-risk control for structured trades.
- Deriv GO: Mobile app for monitoring positions and managing exposure.
- Deriv Bot: No-code automation builder for designing and deploying basic strategies without programming.
Together, these platforms form an integrated ecosystem for automated strategy testing, enabling users to migrate smoothly between manual and algorithmic trading environments.

Each platform supports integration across Deriv’s ecosystem, allowing seamless strategy migration from education to live execution.
How do synthetic indices support automated trading systems?
Synthetic indices are well-suited for automation tools due to their consistent volatility and uninterrupted price data. Traders can build, test, and optimise algorithmic strategies without external disruptions.
Common tools include:
- cBots on Deriv cTrader for custom-coded execution.
- Expert Advisors (EAs) on Deriv MT5 for cross-asset automation.
- Deriv Bot for drag-and-drop logic creation without programming skills.
Each tool allows traders to monitor and manage volatility strategies efficiently in both demo and live environments. This connected design reinforces Deriv’s focus on precision, education, and accessibility across synthetic markets.
Furthermore, automation helps traders quantify outcomes — for instance, measuring how frequently an algorithm triggers entries per tick cycle — which is invaluable for data-driven performance reviews.
What are the most effective volatility trading strategies for different regimes?
- Volatility 15 (1s): Best for micro-scalping and mean reversion. Use moving averages, RSI, and Bollinger Bands with tight stops and quick exits.
- Volatility 30 (1s): Balanced for range trading and short-term momentum. Combine MA crossovers with ATR-based stops.
- Volatility 90 (1s): Ideal for breakout systems with wide stops and structured risk buffers. Use time-based exits to prevent churn.
- Crash/Boom 600–900: Best for event-driven tactics. Traders can follow spikes (breakout) or fade them (mean reversion) using ATR trails and structured stop-loss logic.
As Rakshit Choudhary, Deriv’s CEO, notes:
“Deriv’s focus remains on advancing AI-first trading technology and empowering traders with precision tools built for the next decade.”
Jean-Yves Sireau, Deriv’s Founder, adds:
“Our synthetic markets let traders experience volatility safely, transparently, and continuously — something no traditional market can provide.”
These combined perspectives underscore how Deriv leverages human expertise and algorithmic innovation to establish new benchmarks for volatility trading.
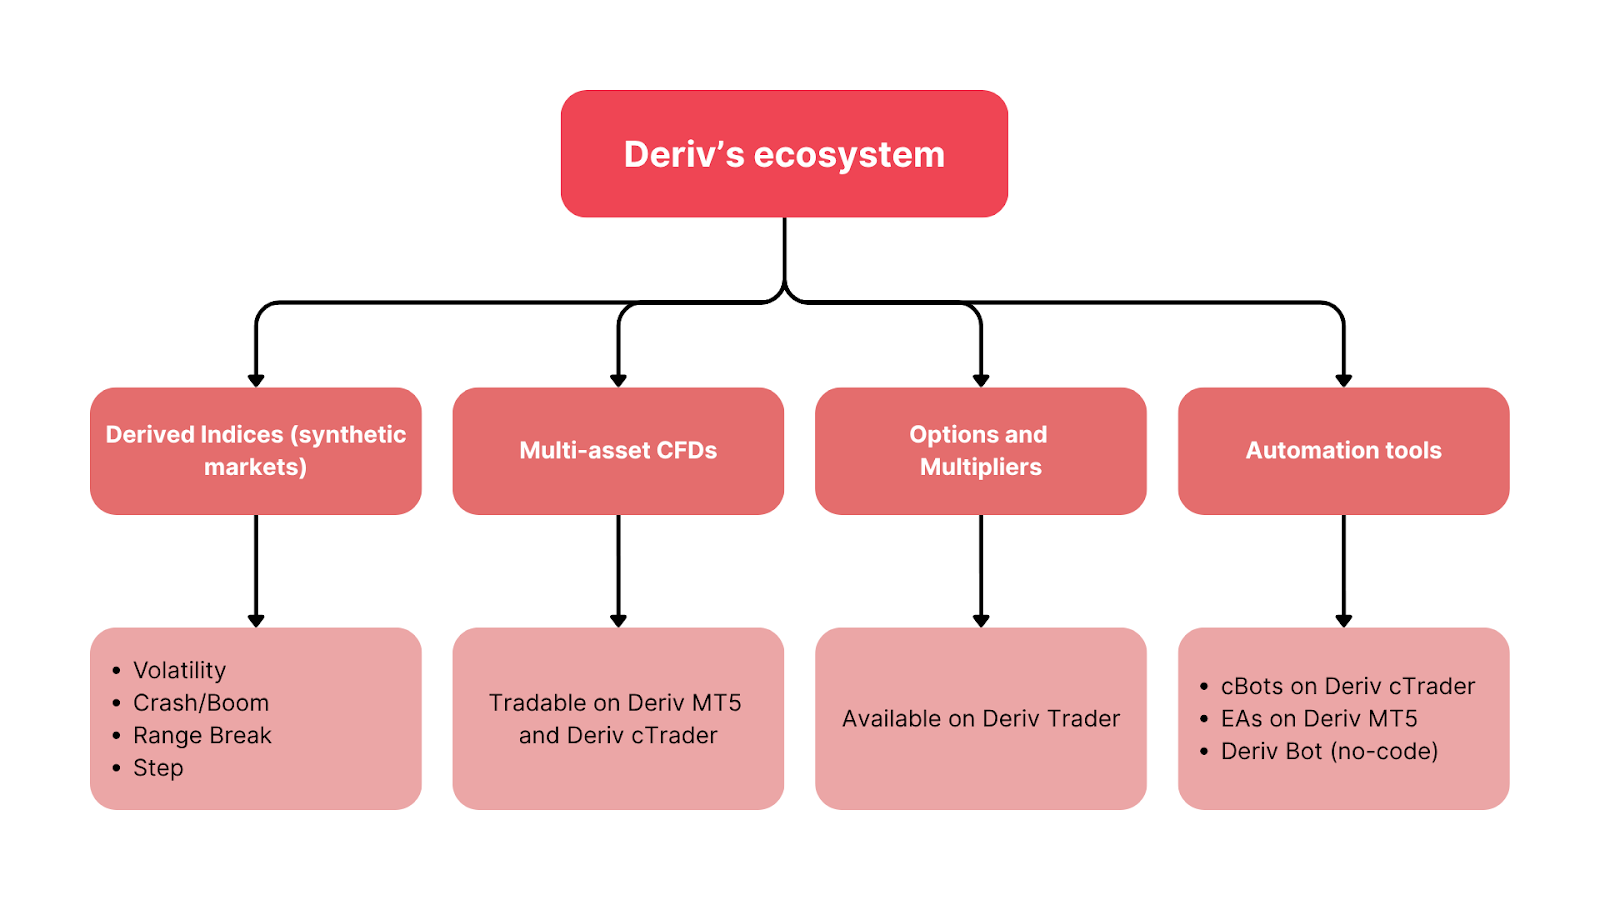
How do Deriv’s volatility indices connect across its trading ecosystem?
Deriv’s trading infrastructure links all synthetic and real-market products, creating a unified environment for experimentation, education, and automation.
- Derived Indices (synthetic markets):
- Spot Volatility
- Drift Switching
- DEX
- Volatility
- Crash/Boom
- Jump
- Step
- Range Break
- Daily Reset
- Multi Step
- Hybrid
- Skew Step
- Trek
- Volatility Switch
- Stable Spread Instruments
- Multi-asset CFDs: Tradable on Deriv MT5 and Deriv cTrader.
- Options and Multipliers: Available on Deriv Trader.
- Automation tools: cBots on Deriv cTrader, EAs on Deriv MT5, and Deriv Bot (no-code).
This structure enables traders to design, test, and scale strategies seamlessly between demo and live environments. Lessons learned on synthetics — about margin call, leverage, and drawdown — directly improve performance across asset classes.
According to independent quantitative analyst Sarah Langford, Deriv’s structured volatility ranges “simplify regime-based strategy design for retail quants.” This external validation underscores how Deriv’s synthetic markets promote analytical trading and consistent skill development.

Revolutionising your trading experience with new charts on the Deriv Trader app
Deriv Trader's app update - discover a new benchmark for mobile trading with revamped in-app charting, boosting convenience and flexibility.
In our commitment to offering advanced trading solutions, Deriv is excited to introduce an innovative addition to Deriv Trader — the newly integrated Deriv Trader Chart v2.0. These charts aim to transform your trading experience by providing enhanced visualisation and seamless integration, empowering you with valuable tools and insights.

Improved trading experience
The standout feature of the new charts is the improved smoothness they bring to your trading interface. Witness real-time market movements with fluidity, offering a dynamic representation of price action with smoother tick and blink animations. No matter the market you are trading, these charts ensure you stay informed about any movements precisely and effortlessly.
Enhanced integration
Deriv has seamlessly integrated charts into the Deriv Trader app, acknowledging the significance of an integrated trading platform. This integration ensures a cohesive experience, which will allow you to execute trades, analyse market trends, and manage portfolios within the same intuitive interface. Our frontend team developed the charts in-house, further enhancing the integration and simplifying the workflow so you can concentrate on making well-informed decisions.
Improved user experience
Beyond the visual and integration aspects, Chart v2.0 contributes to an overall enhanced user experience. You can engage in detailed technical analysis with advanced charting tools at your disposal. The new chart follows our initiative to evolve Deriv Trader into a fully responsive application, allowing easy one-finger scaling, scrolling, and the pinch-to-zoom feature on mobile touch screens. You can also personalise your charts to match your trading style and preferences, creating a workspace tailored to your needs.
Key features:
- Real-time market data with minimal latency.
- Advanced technical analysis tools for in-depth charting.
- User-friendly customisation options for personalised trading views.
- Seamless integration into the Deriv Trader app for a cohesive trading experience.
Elevate your trading journey
Embrace a platform that aligns with market dynamics and anticipates your needs. Explore the benefits of the new Chart v2.0 on Deriv Trader — where each chart tells a story, and every trade is a step towards more-informed financial decisions.
Log in to your Deriv account now and take advantage of all the enhanced benefits the Deriv Trader Chart v2.0 offers.
Sorry, we couldn’t find any results matching .
Search tips:
- Check your spelling and try again
- Try another keyword