Results for

Market recap: Week of 18–22 Dec 2023
Stay informed with our weekly market recap from 18–22 Dec, 2023. Get insights on the latest trends and developments in the financial world.
Gold trends
CNBC & World Gold Council: Costco CFO Richard Galanti revealed impressive sales figures, with over $100 million in gold bars sold in the latest quarter. This surge aligns with a 12% increase in spot gold prices this year.
JP Morgan anticipates a breakout rally in 2024, forecasting a peak of $2,300 per ounce amid expected interest rate declines, as outlined in their recent commodities outlook. November saw a notable slowdown in global gold ETF outflows, particularly in North America, which attracted net inflows of $659mn.
In contrast, Europe experienced outflows for the sixth consecutive month, shedding nearly $2bn in November.
Japan monetary policy
Reuters: In a recent Reuters poll, over 20% of economists anticipate the Bank of Japan (BOJ) will initiate a shift from ultra-loose monetary policies come January.
Meanwhile, central banks in other developed nations are more cautious, pausing rate hikes and contemplating cuts in the upcoming year.
It might be prudent for Governor Kazuo Ueda to prompt BOJ leadership to weigh the possibility of lifting the negative interest rate this month. The BOJ decision affects not only Japan's economy but also global dynamics.
Red Sea disruption
The Guardian, SP Global, GCaptain and Reuters: Oil prices rose 2% on Monday due to concerns over disruptions in maritime trade after Houthi attacks on Red Sea ships.
BP halts Red Sea oil and gas shipments amid increased Houthi strikes. The Suez Canal, crucial for global oil flow, sees challenges. Brent oil surges, eyeing $81.00, according to analysts. About 9% of global oil demand and 8% of LNG shipments pass through these critical routes.
UK wage inflation
The Guardian, Birmingham Mail and Economies.com: The Bank of England emphasises the need for sustained easing of pay growth to tackle wage inflation, signalling no immediate interest rate cuts. Six MPC members voted to maintain borrowing costs at 5.25%, while three favoured an increase to 5.5%.
Meanwhile, HSBC UK advises customers to save three months of living expenses for financial resilience. According to analysts, GBPUSD broke below 1.2720 in the currency market, setting the stage for potential declines to 1.2590-1.2560.
UK Economy
Financial Times and ExchangeRates.org: Concerns arise as Daniel Ivascyn, CIO at Pimco, expresses caution on the UK's economic outlook for next year. Larger bets on UK government bonds signal anticipation of heightened economic strain, with potential hard landing risks.
Recent data shows an unexpected 0.3% contraction in the UK economy for October. ING suggests a rise in global yields may impact GBP/USD, but envisions a rebound to 1.28/30 in 2024 amid a weak dollar. Economic indicators underscore the need for vigilance in navigating potential challenges ahead.
Japan currency trends
ING and Reuters: The Bank of Japan maintains ultra-loose policy, awaiting evidence on wage and price rises before considering stimulus shift. Yen falls 1.0% against the dollar post-announcement.
ING holds a bearish outlook on USD/JPY in 2024, citing oversold yen benefits from the end of negative rates in Japan. Gradual depreciation expected, with a decisive break below 140 in 2Q24.
Reuters poll: 80% of economists anticipate BOJ ending negative rate policy in 2023, with April seen as a likely timing. Some suggest a possible policy shift in January.
UK CPI
CNBC, FX Street, and Office of National Statistics: The GBP/USD struggles below 1.2680 post UK CPI data disappointment. November's UK inflation at 3.9%, lower than expected, impacting Pound Sterling against the USD.
Month-on-month CPI fell by 0.2%, contrary to the 0.1% forecast. Market reacts with increased speculation on a 2024 Bank of England rate cut, leading to a notable drop in British bond yields. Adding to concerns, the UK economy contracted by 0.3% in October.
EU fiscal policies
Reuters: EU finance ministers reach consensus on the latest reform of the bloc's fiscal rules. The agreement allows more flexibility in cutting public debt and encourages public investment during budget consolidation.
New rules establish minimum benchmarks for deficit and debt reduction, addressing concerns from frugal EU countries led by Germany.
Overall, the updated framework is more lenient, reflecting a victory for southern countries led by France. The gradual pace of deficit and debt reduction, spanning four to seven years from 2025, aims to strike a balance.
EU inflation
European Central Bank & FX Street: Vice-President of the ECB, Luis de Guindos, notes the recent inflation downturn due to fading negative impacts from supply and energy components, attributing it to effective monetary policy. Rising unit labour costs pose inflationary pressures.
ECB doesn't foresee a technical recession but closely monitors wage costs and profit margins, key factors influencing inflation return to the 2% target.
De Guindos deems it premature to discuss interest rate cuts. Advocates for completing the banking union, emphasizing the need for a European deposit insurance scheme.
EUR/USD rises to 1.1000 despite Dollar weakness and higher Treasury yields.
UK economy
Bloomberg: Europe’s largest asset manager, Amundi SA, takes a bearish stance on the pound, expecting a more than 4% decline against the dollar.
Anticipating Bank of England interest rate cuts in H1 2024, no Amundi cites slowing inflation and the economic impact of policy tightening as contributing factors.
Federico Cesarini, Head of Developed FX at Amundi Investment Institute, underscores these expectations.
A cautious outlook on the UK currency aligns with concerns about economic dynamics.

8 must-know tips to stay ahead of market shifts
Discover 8 go-to tips to stay informed on critical events and market news updates to navigate the dynamic landscape of the financial markets.
Navigating markets requires being informed. We share 8 go-to tips experts follow daily to stay updated on critical events.
In the ever-changing world of finance, staying informed is not just a habit; it's a strategic necessity. As we navigate the dynamic landscape of global markets, being on top of the latest news and events is crucial for making informed decisions. Here's a guide on how to efficiently monitor market developments to ensure you're always ahead of the curve.
Keeping up with market news updates
1. Establish your information sources
Begin by identifying reliable sources of information. These may include reputable financial news websites, market research reports, and official announcements from central banks and regulatory bodies. Make sure to diversify your sources to gain a well-rounded perspective.
2. Set up news alerts
Time is of the essence in finance, and news can break at any moment. Utilise news alert services or applications to receive real-time updates on topics relevant to your trades or sectors of interest. This proactive approach ensures you're the first to know about critical developments.
3. Follow key economic indicators
Understanding economic indicators is fundamental. Keep an eye on key reports such as GDP growth, unemployment rates, and inflation figures. These indicators provide insights into the overall health of an economy and can influence market trends.
4. Stay informed about corporate actions
Be aware of major corporate events, such as earnings releases, mergers, acquisitions, and product launches. These events can significantly impact stock prices and create trading opportunities.
5. Monitor geopolitical developments
Geopolitical events can have profound effects on financial markets. Stay informed about international relations, trade agreements, and geopolitical tensions as they can influence currency values, commodity prices, and overall market sentiment.
6. Utilise social media wisely
Social media platforms are valuable tools for staying updated on market sentiment and breaking news. Follow reputable financial analysts, organisations, and news outlets on platforms like X (formerly Twitter) and LinkedIn. However, exercise caution and verify information from multiple sources before acting on it.
7. Create a news routine
Establish a daily routine for staying informed. Whether it's dedicating the first 30 minutes of your day to market news or setting aside specific times for updates, consistency is key. This routine helps you build a comprehensive understanding of ongoing developments.
8. Adapt and learn
Financial markets are constantly evolving, and it's crucial to adapt your information-gathering strategies. Learn from past events, refine your sources, and stay curious about emerging trends and technologies that can enhance your monitoring capabilities.
In conclusion, effective monitoring of market news and events is an integral part of success in the financial world. By combining a diverse set of information sources with proactive tools and a disciplined routine, you can confidently navigate the complexities of global markets and make well-informed decisions.
Put these tips into practice with a Deriv demo account, which comes with 10,000 USD in virtual funds. You’ll be able to test them out on your trading strategies risk-free before upgrading and trading with real money.
%252520(1).webp)
Market Radar: BOJ rate decision, UK CPI and US Core PCE data
This week's market radar features the Bank of Japan's policy meeting on interest rate decisions, the UK CPI data release, and US Core PCE data.
Join us in this week's Market Radar as we delve into the critical decisions and data releases driving market sentiments.
This week, we explore:
- BOJ negative-interest rate policy
- UK CPI data release
- US core PCE data
Stay informed with our weekly market analysis on Market Radar.

How to identify and trade popular candlestick patterns
Candlestick patterns are powerful tools for traders. Learn the most common candlestick patterns like doji, hammer, shooting star, and more.
Candlestick charts are one of the most popular tools used in technical analysis. By condensing price data into an easy-to-read format, candlestick charts help traders visualise the battle between buyers and sellers in a market.
When used properly, candlesticks can reveal powerful insights into market psychology and identify potential trading opportunities.
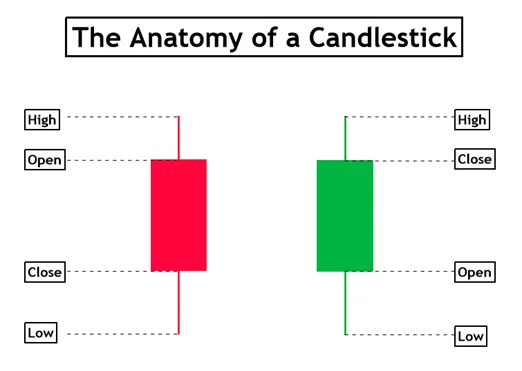
The anatomy of a candlestick
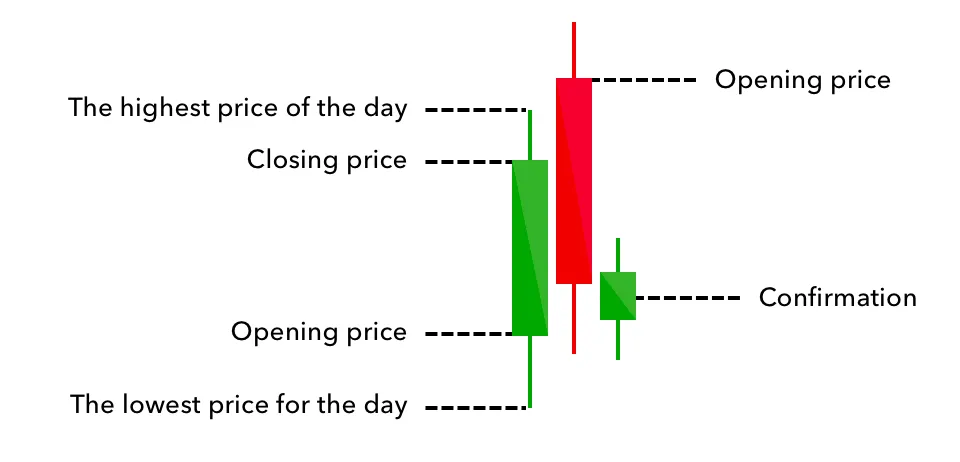
Candlesticks have three main components:
- The body, representing the price range between the opening and closing prices.
- The wicks or shadows, showing the highest and lowest prices reached.
- The colour, indicating whether the sentiment of the candles are bullish (positive, often green) or bearish (negative, often red).
A long body suggests stronger conviction, while long wicks show rejection by either buyers or sellers. The relationship between the body, wick, and colour offers clues into the supply and demand dynamics in the market.
Major candlestick pattern types
There are 3 major candlestick pattern types:
- Reversal patterns indicate potential trend reversals and shifts in momentum.
- Indecisiveness patterns demonstrate a struggle between buyers and sellers with no clear control.
- Continuation patterns suggest a pause or consolidation within an overall trend.
Within these broad categories, there are dozens of uniquely named candlestick patterns, each offering its own nuanced interpretation and potential trading signal.
Deeper insights into specific patterns
Bullish trend reversal patterns
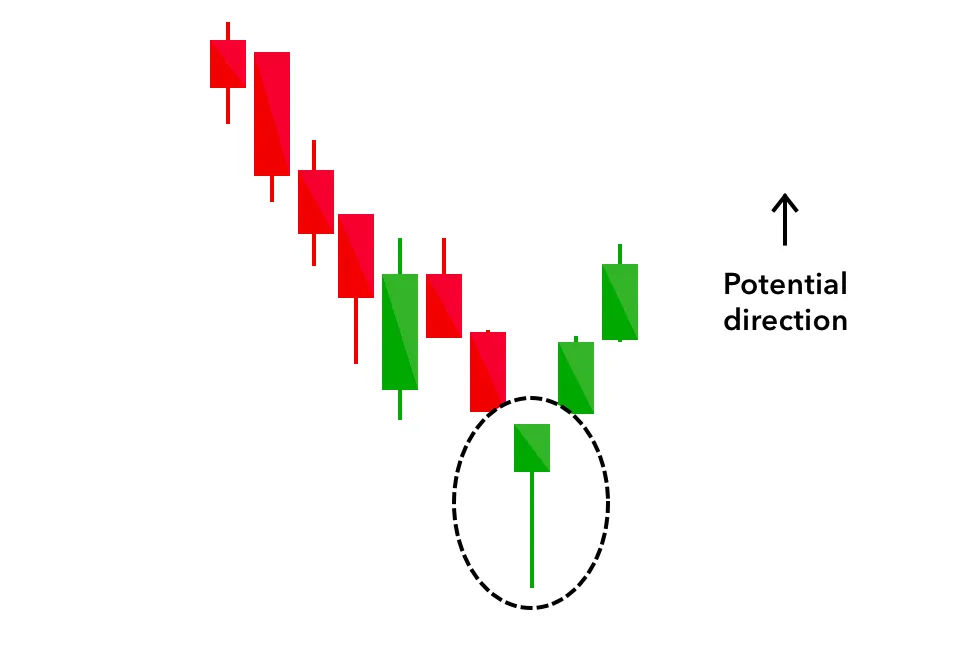
Hammer: This consists of a small body at the top of the candlestick and a long lower wick. It suggests a potential bullish reversal, indicating that buyers are stepping in after a downtrend. While the hammers body’s colour may differ, green tends to be a stronger bullish market indicator than red.
Inverted Hammer: This features a small body at the bottom of the price range, a long upper shadow. It potentially signals a reversal to an uptrend, suggesting that buying interest is increasing after a period of selling pressure.
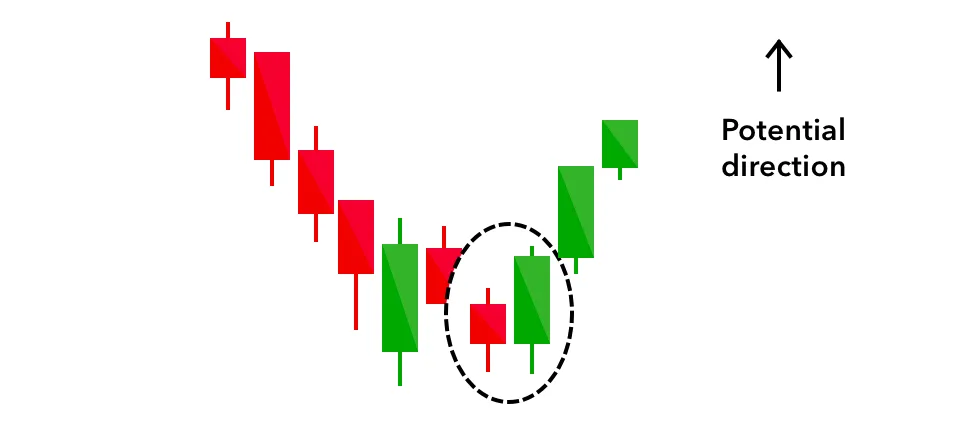
Bullish Engulfing: This occurs when a smaller, bearish candlestick is followed by a larger, bullish candlestick that completely ‘engulfs’ the previous one. It indicates a shift from selling to buying pressure and suggests a possible trend reversal.
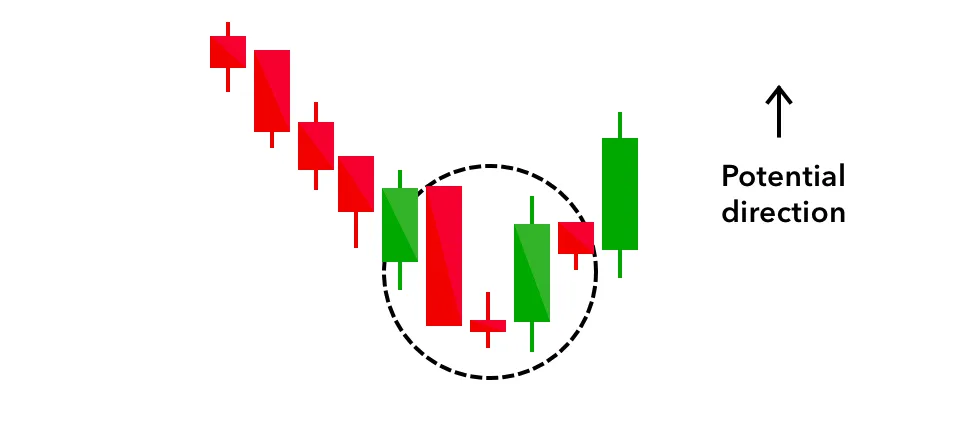
Morning Star: This appears during a downtrend and consists of three candles; one long red candle, one small-bodied red candle with a lower range, and one larger bullish candle that closes above the midpoint of the first candle. It is viewed as a glimmer of hope during a downtrend, suggesting a bullish reversal may occur.
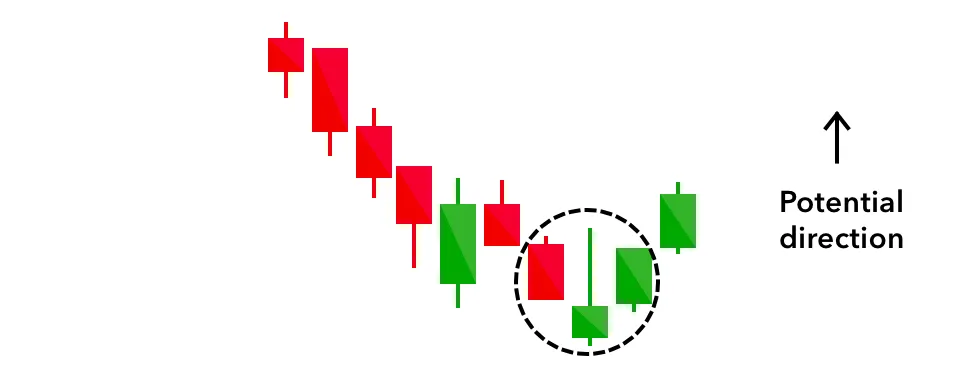
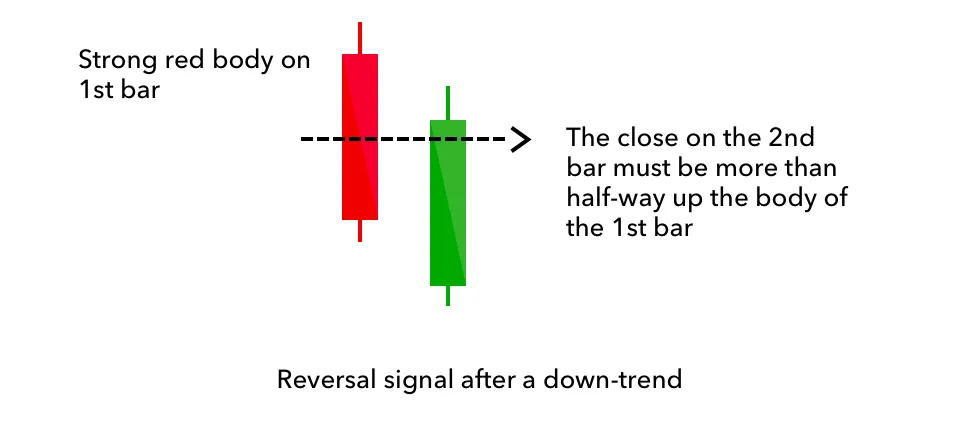
Piercing Line: This occurs when a bearish candle is followed by a bullish candle. The bullish candle opens below the previous candle’s low but closes above its midpoint. It indicates potential buying pressure and a possible trend reversal.
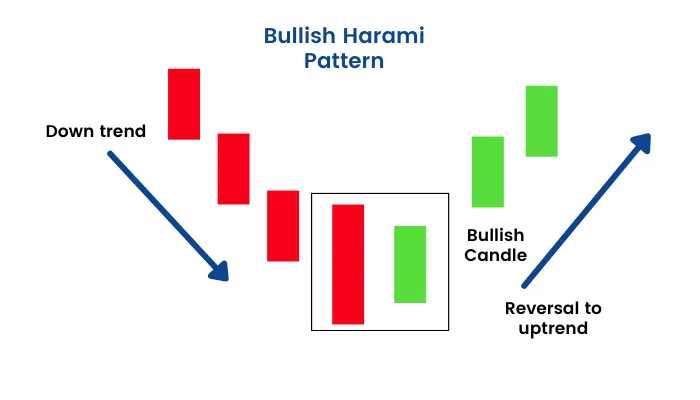
Bullish Harami: This involves a long bearish candle followed by a smaller bullish candle that is contained within the range of the previous candle. The reliability of the pattern is higher when the second candle opens with an upward gap. It suggests a potential bullish reversal.
Bearish trend reversal patterns
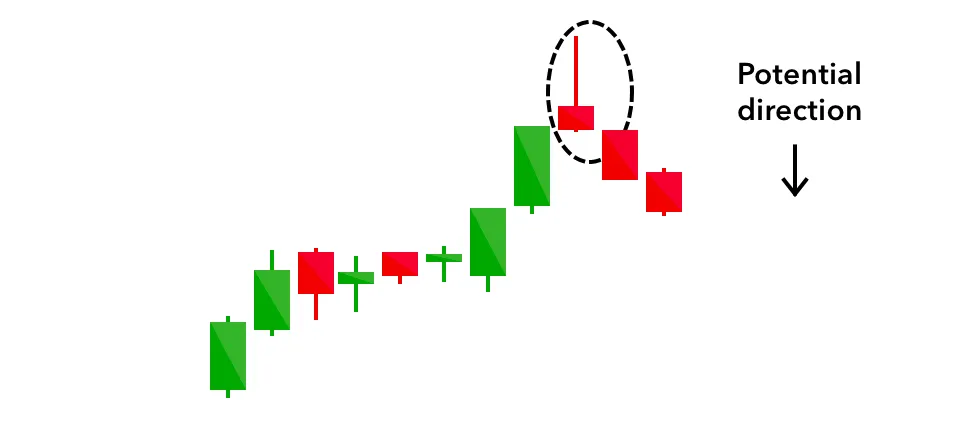
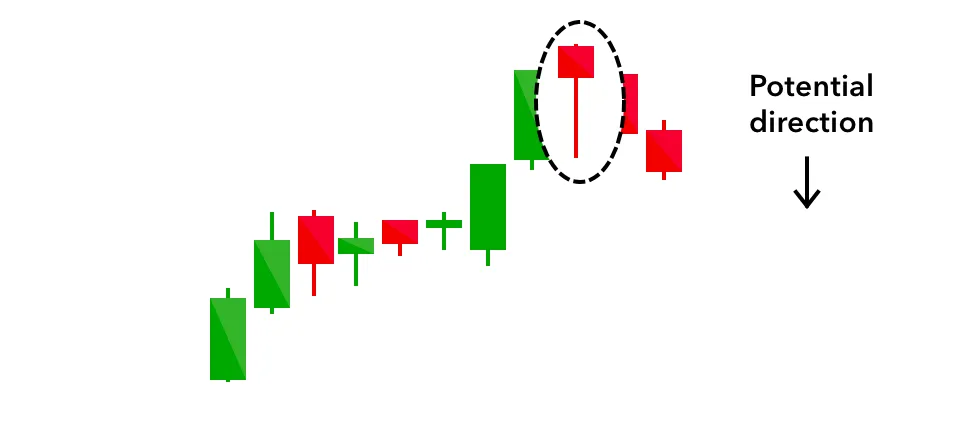
Shooting Star: This has a small body near the bottom of the candlestick and a long upper wick. Typically, the opening price will have an upward gap, then rise to reach a high during the day before closing near or below the opening price. This movement resembles a star descending to the ground, suggesting a potential bearish reversal, indicating that sellers are stepping in after an uptrend.
Bearish Engulfing: This occurs when a smaller bullish candlestick is followed by a larger bearish candlestick that completely engulfs the previous one. It signifies a shift from buying pressure to selling pressure and suggests a possible trend reversal.
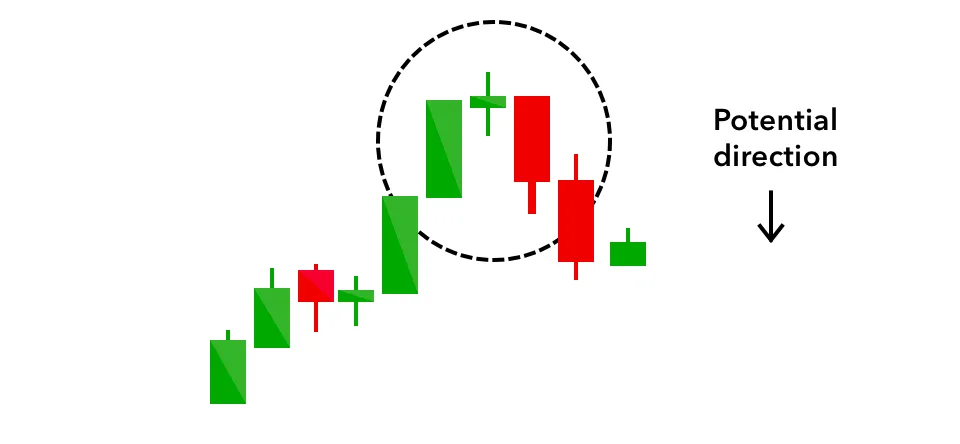
Evening Star: This appears during an uptrend and consists of three candles. The first is a long bullish candle, followed by a small-bodied candle with a higher range. The third candle is a larger, bearish candle that closes below the midpoint of the first candle. This pattern suggests a bearish reversal is likely and is typically stronger when the third candlestick nullifies the gains of the first candle.
Dark Cloud Cover: This occurs when a bullish candle is followed by a bearish candle that opens above the previous candle’s high but closes below its midpoint. It indicates a possible trend reversal due to increased selling pressure.
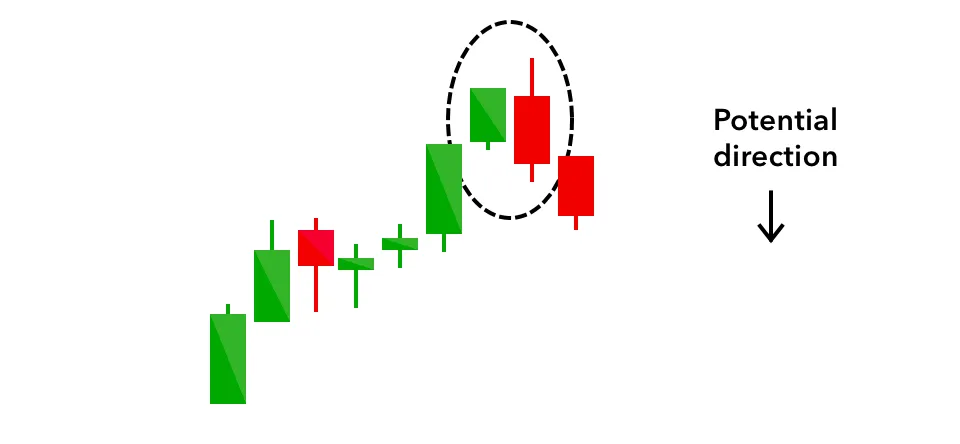
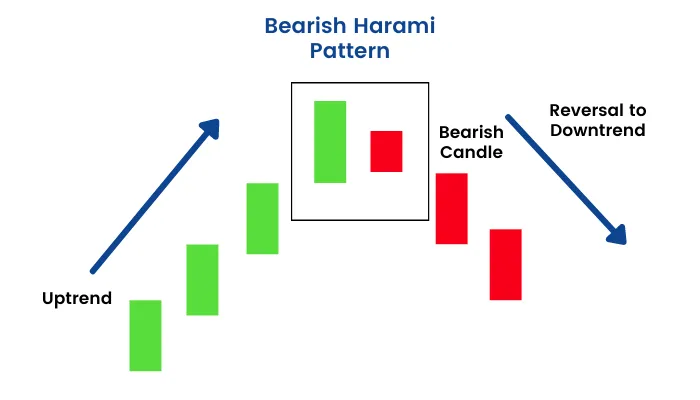
Bearish Harami: This involves a larger, bullish candle followed by a smaller, bearish candle that is contained within the range of the previous candle. It suggests a potential reversal due to weakening buying momentum.
Hanging Man: This consists of a small-bodied candle with a long lower shadow. This pattern suggests potential weakness in the uptrend, signalling a possible trend reversal.
Indecisive patterns
Doji: This occurs when the opening and closing prices of an asset are very close or almost equal. It typically has a small body and upper and lower wicks. The doji pattern indicates that neither buyers nor sellers have control.

Spinning Top: This is characterised by a small body and long upper and lower wicks of equal length. It indicates a balance between buyers and sellers.

Continuation patterns
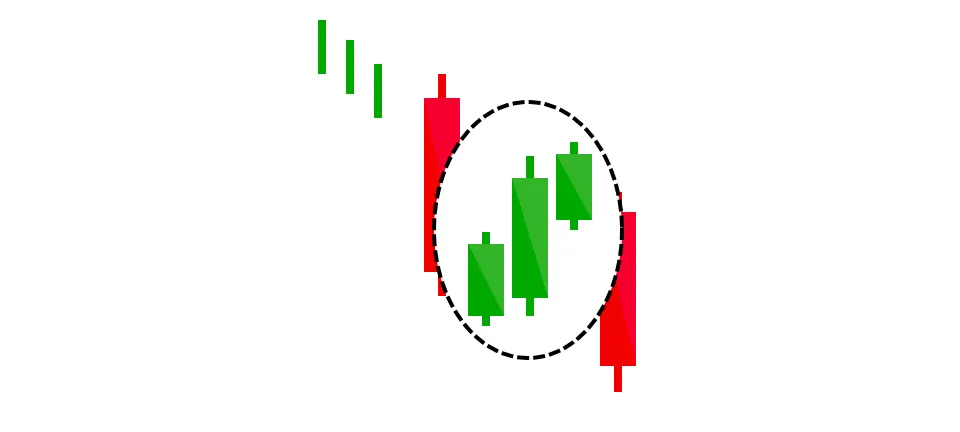
Rising Three Methods: This involves three short red bodies nestled between two lengthy green bodies, conveying to traders that buyers are still in command of the market.

Falling Three Methods: This has three small green bodies sandwiched between two longer red bodies, signaling to traders that the overall trend’s downward momentum is too strong to reverse.
Trading candlestick signals
When trading candlestick patterns, it is important to confirm signals with other indicators like volume and moving averages. Traders should focus on patterns forming at key support and resistance levels. Candlestick signals can be traded by taking positions on breakouts and breakdowns.
Some further tips for improving candlestick analysis include:
- Considering the previous price action context
- Identifying patterns within broader technical structures
- Focusing on quality over quantity of signals
- Combining candlesticks with other forms of analysis
- Practicing regularly to gain experience.
Appropriate stop-loss and risk management strategies should always be utilised.
The time frame dimension
Beyond individual candlestick patterns, it is crucial to analyse price action across different time frames. What may appear as an indecisive pattern on a 5-minute chart could be a continuation pattern on a daily view. Shorter time frames reveal more detailed price action, while longer time frames provide broader context. Many traders use multiple time frames in their analysis to gain a more complete perspective. Identifying alignment between candlestick signals across different time frames can increase conviction for potential trades.
Conclusion
In summary, candlestick charts condense price data into an easy-to-decipher visual format that reveals insights into market psychology. Each pattern offers a nuanced interpretation of supply/demand dynamics. However, candlestick analysis is most effective when combined with other indicators and techniques. Traders should focus on high-quality signals forming at key support/resistance levels across multiple timeframes.
With practice, candlestick patterns can help traders make informed decisions, manage risk, and develop strategies aligned with market conditions.
Open a demo or live trading account with Deriv and start trading with candlestick charts.

Holiday trading hours: Master the year-end schedule
Stay prepared when exchanges like NYSE and FTSE close, and markets with holiday openings may see lower volume or higher volatility.
Can you believe the end of 2023 is already here? With the holiday season approaching, markets often settle into distinct seasonal patterns. Trading typically slows down in December as traders close positions and portfolios before going on vacation and shifting focus.
End-of-year position adjustments tend to increase short-term volatility across the stocks, forex, and commodities markets. Forex and commodities may also see exaggerated price swings from thinner year-end liquidity even as overall trading slows down.
As the year wraps up and we relish our days off, it pays to mark our calendar to account for holiday market trends. So, let’s take a look at the expected trading hours and market closures over the upcoming holidays.
Stocks and indices
The approaching season often brings shifts in stock market activity that we should note. Specifically, trading volumes tend to decrease with more market participants away. Ideally, we can adapt our trading strategy by monitoring changes in daily volumes and liquidity conditions during stock market hours for the holiday.
Stock markets are only open for trading on normal business days — Monday to Friday. Listed below are the holiday schedules of all of the major stock indices that we offer.
.png)
.png)
Forex
During the holidays, the forex market tends to experience reduced volatility and liquidity and limited market hours.
With less economic data being released and lower trading volumes as participants take time off, currency pairs often trade in ranges and see more consolidative price action. Listed below are the holiday schedules of all the forex pairs that we offer.
.png)
Commodities
During the holiday stretch, trading activity and volume in commodities markets drop significantly. This can mean prices get extra sensitive to any little blips in supply and demand.
Listed below are the holiday schedules of all the commodities that we offer.
.png)
Derived FX
Derived FX are usually available for trading on all weekdays. However, they will be closed on Christmas Day as well as New Year’s Day.
.png)
Basket
Basket indices can usually be traded 24/5. However, they’re closed on Christmas and New Year’s.
.png)
Cryptocurrencies and synthetic indices
On Deriv, cryptocurrencies and synthetic indices are available to trade 24/7, even throughout the holiday seasons and on public holidays.
Trade around market closures
Staying informed on adjusted hours will ensure your portfolio plans aren’t upended while still allowing you to unwind during the season. With a balanced approach, you can make the most of celebrations without taking your eye off dynamic markets. Wherever the holidays take you this month, may your trades be merry and bright right into 2024!

Costco's countdown: Decoding earnings and deciphering consumer sentiment
With its Q4 earnings due on Dec 14, we analyse Costco's recent performance and what it indicates about consumer spending amid high inflation.
Throughout the pandemic, Costco garnered momentum as an increasing number of Americans turned to home cooking while being stuck at home. At the same time, rising inflation also prompted shoppers to migrate from traditional supermarkets to cost-effective alternatives. Costco was one of these alternatives.
The retail giant’s upcoming earnings report, scheduled for release at 4:00 pm New York time on Tuesday, 14 December, is poised to provide critical insights into the company’s performance and the broader trajectory of consumer spending.
What to expect from the upcoming earnings report?
According to Bloomberg, Costco’s third-quarter revenue is expected to come in at 57.7 billion USD, while earnings per share (EPS) is expected to be 3.40 USD.
Commentary on what to expect over the next 12 months will have a significant impact on the company’s stock price, particularly as the alleviation of inflationary pressures plays a vital role in this projection.
Costco earnings in the previous quarters
Costco surpassed earnings estimates in the last two quarters with notable figures. For the fourth quarter, they reported:
- Earnings per share: 4.86 USD vs the expected 4.78 USD
- Revenue: 78.9 billion USD vs the expected 77.7 billion USD
Costco experienced notable growth, ending the period with 71 million paid household members, up 8% from the previous year. Executive memberships rose by almost a million to 32.3 million, constituting 45% of total memberships and nearly three-quarters of global sales.
Chief Financial Officer Richard Galanti noted increased in-store visits despite reduced spending. Consumer trends revealed a pullback in big-ticket and discretionary items, impacting digital sales. However, certain discretionary items, like appliances, saw a significant uptick.
Costco share price dynamics and company health
Shares of Costco have climbed over 30% so far this year, outperforming the approximate 20% gains of the S&P 500. The stock is trading at its all-time highs above 620 USD.

Looking at the company’s fundamentals, the stock has an annual dividend yield of 0.65%, which may be considered quite low in comparison to the S&P 500’s dividend yield of around 1.49%. Furthermore, with a relatively high price-to-earnings ratio of 42.9, coupled with a high price-earnings-to-growth ratio of 4.44, traders are urged to carefully consider the various factors influencing the stock’s performance.
Costco’s earnings report will likely offer insights into the company’s trajectory and the broader retail sector. Traders should keep an eye on key indicators, including whether Costco exceeds market expectations in EPS and revenue and the guidance provided for future growth, particularly in the retail space.

Uncovering the impact of a potential 2024 interest rate cut by Bank of England
Discover the potential effects of a 2024 Bank of England rate cut on the UK economy, currency, property market, & employment landscape.
The financial landscape is ever-changing. One significant contributor to these changes is the fluctuation of interest rates set by central banks. In 2024, the Bank of England (BoE) is projected to cut interest rates, a move that could significantly impact the UK's economic environment, the stock market, and the value of the British pound.
This article explores the potential implications of such a shift, examining the technical standpoint, the political landscape, the economic growth forecast, the government's debt, the property market, and the labour market, among other areas.
Technical analysis - Currency & stock market
- GBP/USD pair
The GBP/USD pair's weekly chart indicates overbought conditions, with the 60-week moving average providing support around 1.2350. Interestingly, this moving average has been largely flat since November 2022, hinting at limited potential for further GBP gains. Instead, the market could shift towards safe-haven currencies like the USD, possibly leading to its resurgence.

- FTSE100
In terms of the stock market, the FTSE100 (UK_100) has been undergoing a period of sideways movement. Although the Stochastic indicator isn't currently in an overbought zone, it's rather close, suggesting the possibility of a breakout. However, given the somewhat uncertain economic conditions in the UK, a downward breakout might be more likely in the event of further economic deterioration.

Political landscape and GBP
Politics often play a significant role in shaping a country's economic outlook and, by extension, its currency value. In the case of the UK, Prime Minister Boris Johnson has seen a decline in his approval rating, as per Conservative Home, putting significant pressure on Chancellor Rishi Sunak.
In the past, significant fluctuations in the GBP/USD pair have been noted ahead of changes in the Prime Minister's office. With an election due no later than January 2025, political uncertainties could have a substantial impact on the GBP's trajectory.
UK economic outlook
Given the political situation, the economic outlook for the UK is of paramount importance. As of the third quarter of 2023, the UK economy has experienced stagnant growth, with a GDP increase of 0%. Inflation stands at 4.6%, and the BoE benchmark rate is at 5.25%.
The manufacturing and service sectors, traditionally strong contributors to the UK economy, show mixed figures. The S&P Global/CIPS UK Manufacturing PMI for November 2023 was revised upward to 47.2, surpassing the initial estimate of 46.7 and October's 44.8. However, the S&P Global/CIPS UK Services PMI was only slightly revised upward to 50.9 in November 2023, compared to the preliminary estimate of 50.5 and October's 49.5.
Government debt
The UK government's debt-to-GDP ratio has reached 100.1%, necessitating serious considerations for austerity measures, tax increases, or cuts in social expenditures. A sluggish economic growth could result in an increase in this ratio and lead to further debt accumulation.
Property market
The property market is showing signs of slowing down, with transaction estimate volume down 15% from the average. If high-interest expenses start impacting the housing market, it could destabilise the UK banking sector, resulting in an increase in non-performing loans, stricter lending policies, and potential repercussions on house prices and overall bank asset quality.

Labour market
Since 2011, the UK has seen a steady increase in the employment rate until the onset of the COVID-19 pandemic. However, during the May-July quarter, the unemployment rate rose to 4.3%, up from 4.2% the previous month and 3.8% in the preceding quarter.

In conclusion, the potential interest rate decrease by the BoE in 2024 could have profound implications. While it might ease some debt burdens, it could also negatively impact the FTSE100 and the GBP. Further, political uncertainties could potentially weaken the GBP even further. It is essential for investors and market participants to keep a close eye on these developments.
%252520(1).webp)
Market Radar: FOMC rate decision, the US CPI and PPI data
Discover this week's Market Radar, which covers the FOMC's rate decisions as well as central bank decisions that impact inflation trends.
From crucial data releases and central bank decisions to inflation trends, we unravel market complexities, providing you with insights for informed trading decisions.
This week, we explore:
- US CPI and PPI reports,
- The last FOMC rate decision of 2023, and
- ECB & BOE decisions, affecting the currencies.
Stay informed with our weekly market analysis on Market Radar.

Central banks stand firm amid economic flux
As central banks navigate economic uncertainty, the RBA pauses rate hikes while attention turns to the BoC and BOJ decisions this week.
RBA pauses rate hikes, all eyes on BoC and BOJ ahead of US jobs report
RBA holds rates steady (5 Dec)
The Reserve Bank of Australia (RBA) kept its official cash rate (OCR) unchanged at 4.35%, signalling a potential pause in its aggressive tightening cycle.
RBA Governor Michele Bullock acknowledged that inflation has eased from its peak but noted that it remains above the RBA's target of 2-3%. She emphasised that the bank will continue to monitor economic conditions closely and adjust policy as necessary to bring inflation back to target.
The decision to hold rates steady comes as economic data suggests that Australia's economy is starting to cool. Retail sales fell in October, and the labour market is showing signs of softening. These developments may have given the RBA pause for thought as it weighs the need to combat inflation against the risk of stifling economic growth.
The RBA's next policy meeting is scheduled for 7 February 2024.


The AUD/USD pair failed to break above the resistance of the downward channel this week, indicating no reversal of the downtrend. This is further supported by the overbought condition of the stochastic indicator, which suggests that the pair may be due for a pullback.
Bank of Canada’s interest rate decision (7 Dec)
Annualised GDP growth in Canada contracted by 1.1% in the third quarter of 2023. A number of factors contributed to the contraction, including weaker consumer spending and business investment.
As a result, market analysts expect the Bank of Canada (BoC) to keep the rate unchanged at 5%.

Japan’s GDP (7 Dec)
Japan's GDP numbers for Quarter 3 will be released on Thursday, 7 December. A preliminary report on 15 November indicated a 2.1% annualised contraction in the Japanese economy. The weak reading was due to a decline in exports and private consumption, suggesting that accelerating inflation and weakening demand in China are taking a toll on a fragile economic recovery.
The weak GDP reading could change the Bank of Japan's (BOJ) calculus. The decision of whether to maintain or abandon its negative rate policy will have a substantial impact on the value of the Japanese yen.

US non-farm payroll (8 Dec)
The US November employment report will be released on Friday, 8 December. This closely watched economic indicator will provide crucial insights into the health of the US labour market and will likely influence the Federal Open Market Committee's (FOMC) upcoming policy decision in their meeting on 12-13 December.
Market analysts expect the report to show a modest increase of 180,000 non-farm payrolls in November, slightly higher than the 150,000 jobs added in October.
The FOMC will be closely scrutinising the employment report as the results will impact decisions on monetary policy adjustments and whether there will be a need to further tighten policy to combat inflation against the risk of slowing economic growth. A strong jobs report could reinforce the FOMC's hawkish stance, while a weaker-than-expected reading could signal a pause or even a pivot towards a more dovish policy stance.
Other reports that will be closely watched include the unemployment rate, wage growth, and labour force participation rate. These metrics provide a more comprehensive picture of the overall health of the labour market.
The release of the US November employment report is one of the most significant economic events of the month. It will have a profound impact on financial markets and will shape the FOMC's policy outlook for the near future.

The prospect of lower interest rates can exert a dual positive influence on stock prices. Firstly, it alleviates the financial burden on businesses by reducing the cost of capital. This enables them to allocate more resources towards expansion, investments, and, ultimately, generating higher profits.
Secondly, it lowers the discount rate used to value future earnings, making stocks appear more attractive relative to fixed-income investments. In essence, lower interest rates make businesses more profitable and stocks more valuable.

The Fed's policy trajectory and US Treasury yields are shaped by a complex interplay of domestic and global factors. The relative yield differentials between US Treasuries and sovereign debt from other major economies, along with the shifting policy stances of foreign central banks, can significantly influence the broader impact of the Fed policy on the US economy. Additionally, fiscal fundamentals, such as the US government's budget deficit and debt levels, can introduce countervailing forces on yield movements.
Stay tuned for an eventful week in the financial markets.
Sorry, we couldn’t find any results matching .
Search tips:
- Check your spelling and try again
- Try another keyword