Results for

To the moon? Exploring the potential of Ethereum’s rally
In this crypto market analysis, we explore the potential of Ethereum’s rally and factors that appear to be boosting its sustained uptrend.
It’s only early March and Ethereum is already up more than 40 percent year-to-date! Ether’s staggering rally has come on the backdrop of a 2023 that saw the coin close the year with an 80% gain. Even with the strong gains, 2023 was seen as a slow year for Ethereum, considering Bitcoin closed the year with a 151% gain.
Despite Bitcoin’s dominance, analysts such as ETC group head of research Andre Dragosch believe that Ethereum could replicate its performance in 2021 and take the spotlight away from Bitcoin.
So will Ethereum rally?
Let’s look at some of the fundamentals that back a possible longer-term rally for the world’s second largest cryptocurrency by market capitalisation.
Potential Spot Ether ETFs on the horizon?
The SEC’s approval of Spot Bitcoin ETFs back in January led to murmurs of a possible Spot Ether ETF. The murmurs manifested a new round of applications with Blackrock and Grayscale filing for the approval of Spot Ether ETFs.
With some analysts predicting that the SEC will give the all clear in May, this could see increased interest in Ethereum from institutional players — just like we’ve seen with Bitcoin.
The Ethereum ETF buzz coincides with the upcoming BTC halving event and this sets up an interesting scenario. Bitcoin prices tend to jump after a halving event and this up move has historically had a bullish effect on major altcoins. This plausible twin effect could see strong bullish sentiment for Ethereum.
NFT hype slowly returning
In the frenzy of the 2022 NFT boom, anonymous collectors, like “Seedphrase” who raked in a staggering $4.4 million for a single token, struck gold. However, the crypto winter’s icy grip swiftly brought the NFT market to a halt. During this period, sales on NFT marketplace OpenSea plummeted by a shocking 98%, and media coverage of NFTs dwindled significantly. Despite the downturn, a glimmer of hope emerges with the rise of BRC-20 NFTs, slowly reigniting excitement in the market.

Source: OpenSea
The BRC-20 — a Bitcoin standard created to rival Ethereum’s ERC-20 — can successfully deploy NFTs through an inscription method. With BRC-20 gaining traction, some analysts believe this excitement will trickle back to Ethereum since it still is the most robust blockchain for NFTs.
Ethereum also has upgrades of its own such as the ERC- 4883 and the EIP-6561, which mean advanced capabilities for NFTs beyond just multimedia representations of real-world assets. Such developments could see the Ethereum network retain market leadership in the NFT space despite competition from the Bitcoin standard, leading to potential positive implications for the price of ETH.
The Ethereum dencun upgrade
The upcoming Ethereum upgrade on 13 March is the most talked about event in the ETH community. Improvements to the network are expected, including one anchored by Proto-Danksharding which will increase the network’s data throughput while reducing its storage burden.
Other features will include the improvement of the EIP-4788 standard to improve smart contract security, and the EIP-7044 and EIP-7045 for a better staking experience. The most impactful upgrade proposal will probably be to the EIP-5656 and EIP-1153 standards, which will lead to cost efficiency and potentially lower gas fees for traders on the network.
This upgrade will only mark the second era of “The Surge”, of the Ethereum road map as articulated by Ethereum Co-founder Vitalik Buterin.

Source: Vitalik Buterin/X
By the end of this phase, the network could have the capacity to process 100,000 transactions per second for layer 2 rollups - and see an even more robust Ethereum network. Optimism around this upgrade could provide more impetus for a sustained Ethereum uptrend into the future.
Ethereum’s price analysis
The price looks poised to touch the 4,000 USD mark soon, with the 50-day Simple Moving Average (SMA) edging upwards above a 200 Simple Moving Average (SMA) that appears flat. This indicates an uptrend that could lose momentum in the longer term. The RSI supports the case for a possible slowdown in momentum as it has been oscillating around the 90 overbought region since early February.

Source: Deriv
Traders should be on the lookout for other signs of trend exhaustion. Deriv MT5 offers a list of technical indicators that can be used to analyse prices. Log in now to take advantage of the indicators, or sign up for a free demo account. The demo account comes with virtual funds so you can practise analysing trends risk-free.
.webp)
Will the Fed signal rate cuts this week?
In this latest Market Radar, we explore key financial insights on the FOMC interest rate decision, US manufacturing PMI data, Gold market movements and S&P 500 rally.
In this latest Market Radar, we explore the latest market drivers affecting our trades this week:
- FOMC interest rate decisions
- US manufacturing PMI data
- US services PMI data
Stay informed with our weekly market analysis on Market Radar.

Leverage on Deriv for Synthetic Indices explained
Deriv MT5 platform introduces new leverages for synthetic indices, giving you more flexibility and reduced margin requirements.
Many traders struggle with finding the right leverage balance: too little restricts opportunities, too much increases risk. Deriv’s Synthetic Indices help address this problem by offering tailored, instrument-specific leverage that adjusts to volatility. The result? Traders on Deriv MT5 and Deriv Trader can take advantage of precise exposure control without unnecessary risk. This article explains how Deriv’s leverage model works, how it compares to other brokers, and what traders can do to use it responsibly..
Quick summary
- Deriv provides symbol-specific leverage across its platforms, helping traders manage capital efficiently.
- The April 2024 Deriv MT5 update boosted leverage on most indices but tightened it for Jump 100 to stabilise volatility.
- The model aligns with global transparency trends, using data-driven margin logic and built-in safety features.
- Smart use of leverage, combined with good position sizing and stop-losses, can drive sustainable results.
Here’s how Deriv’s leverage structure stands out in today’s trading landscape.
How does Deriv lead today in synthetic-index leverage?
Deriv has spent over two decades refining its synthetic-index model. Indices like Volatility 75, Crash 500, Boom 1000, and Step Index are powered by audited random number engines that mimic real-market behaviour without outside influence.
Leverage on Deriv isn’t uniform. It’s tailored per instrument:
- Higher leverage on steady indices (Volatility 25, 50)
- Moderate leverage on mid-volatility markets (Crash/Boom)
- Lower leverage on jump-heavy assets (Jump indices)
According to Deriv’s Q1 2025 data:
- 68% of traders use less than 1:500
- 24% trade between 1:500 and 1:1000
- Only 8% exceed 1:1000
“Leverage is not a power tool. It’s a precision instrument. Traders who stay under a 1:500 leverage tend to grow their equity more steadily. It’s not about size. It’s discipline.” - Wafaa Elashry, Senior Product Analyst at Deriv.
In short, Deriv’s flexible leverage structure gives traders precise control without compromising safety.
Table 1 – Comparison of Deriv and global brokers
How does Deriv's leverage compare globally?
Most brokers are restricted to a 1:30 leverage ratio in the EU/UK and a 1:100 leverage ratio in Australia.
Deriv, operating under its Derived account model, allows leverage to vary by symbol. It offers flexibility aligned with each index’s volatility.
“Our flexibility comes with constant monitoring. Each index is continuously reviewed to keep leverage safe and proportional.” - Syed Mustafa Imam, Data Engineering specialist
Deriv MT5 and Deriv Trader each apply this logic in real-time, showing traders the exact margin requirements before placing orders.
How does Deriv MT5 leverage work across different synthetic index types?
A Volatility 100 Index at 1:1000 requires just 10 USD margin for a 10,000 USD position. That’s a 0.1% margin requirement.
A Jump 100 Index at 1:250 needs a 40 USD margin for the same exposure, or a 0.4% margin, reflecting higher volatility.
“Margin efficiency keeps you in the game. Plan margin ahead so volatility doesn’t force liquidation.” - Prince Coching, Senior Trading Specialist
Table 2 – Leverage ranges by synthetic index type
In short, Deriv’s leverage-to-margin ratios are engineered to align with each index’s volatility, ensuring stability and opportunity coexist.
How can you maange leverage risks when trading synthetic indices on Deriv?
Leverage amplifies both potential profit and loss, so control matters. Deriv’s safety features help, but smart habits are the key to longevity.
In-platform safeguards
- Stop-out triggers: Auto-close positions if equity falls below ~50%.
- Negative balance protection: Losses never exceed deposits.
- Margin call alerts: Warnings before critical levels.
Deriv data (Q1 2025)
- Average margin level before stop-out: 68%
- Stop-loss use: 82% of traders
- Median drawdown for over-leveraged accounts: 23%
Best practices
- Keep margin level > 300%.
- Limit leverage to ≤ 1:500 for long trades.
- Avoid correlated high-leverage positions (e.g., Vol 75 + Boom 1000).
“Risk isn’t just leverage. It’s attention. Those who track margin and diversify last longer.” - Felicia Tanwijaya, Risk Analytics specialist
Deriv MT5 and Deriv Trader all display live margin data, making it easy for traders to stay within safe limits.
In short, Deriv’s ecosystem combines automation with awareness — the best mix for risk management.
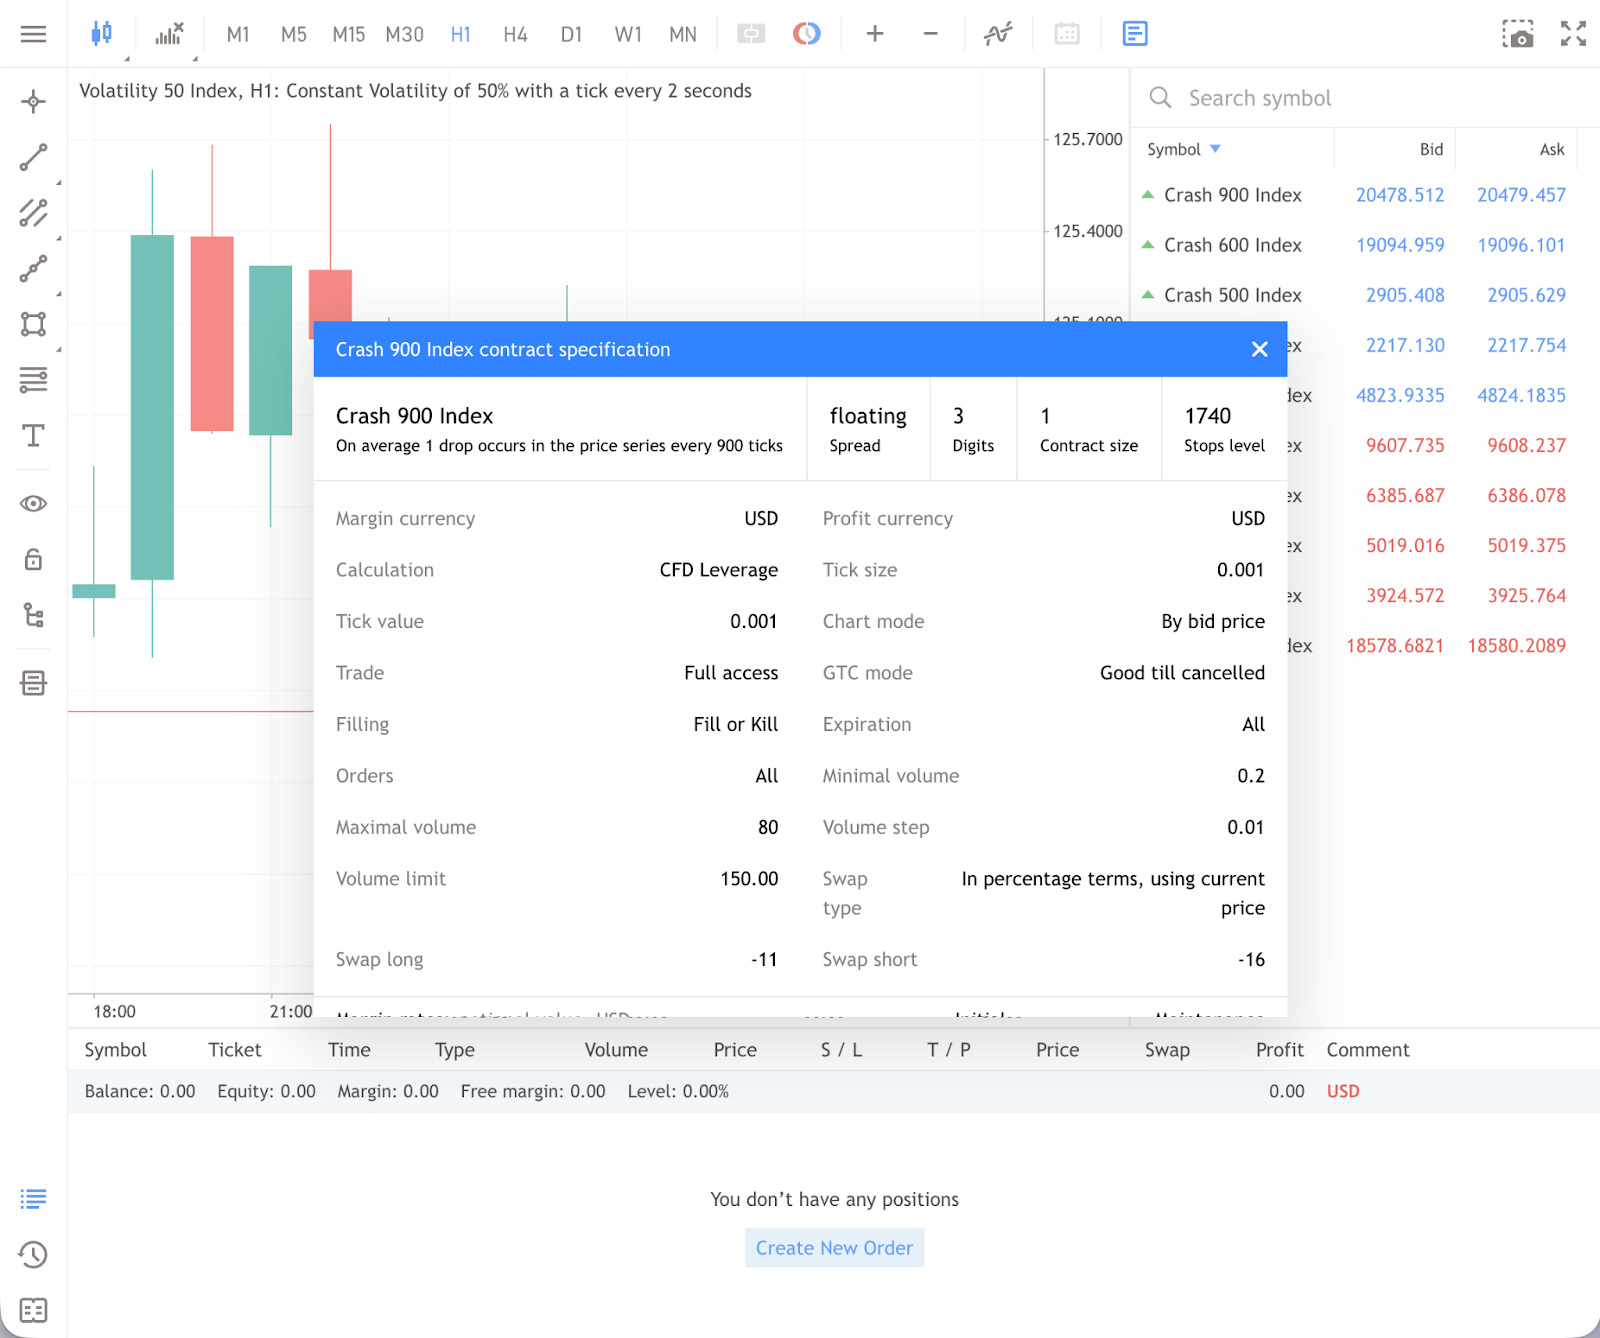
How do margin requirements and exporsure levels work on Deriv?
On Deriv MT5
- Market Watch → Specification shows contract size, margin %, and stop-out.
- Order Window displays required margin before execution.
- Terminal → Trade tab shows live margin levels and alerts.

On Deriv Trader
- Tap (ℹ️) beside a contract to view leverage and payout details.
- Demo accounts mirror real specs—ideal for practice.
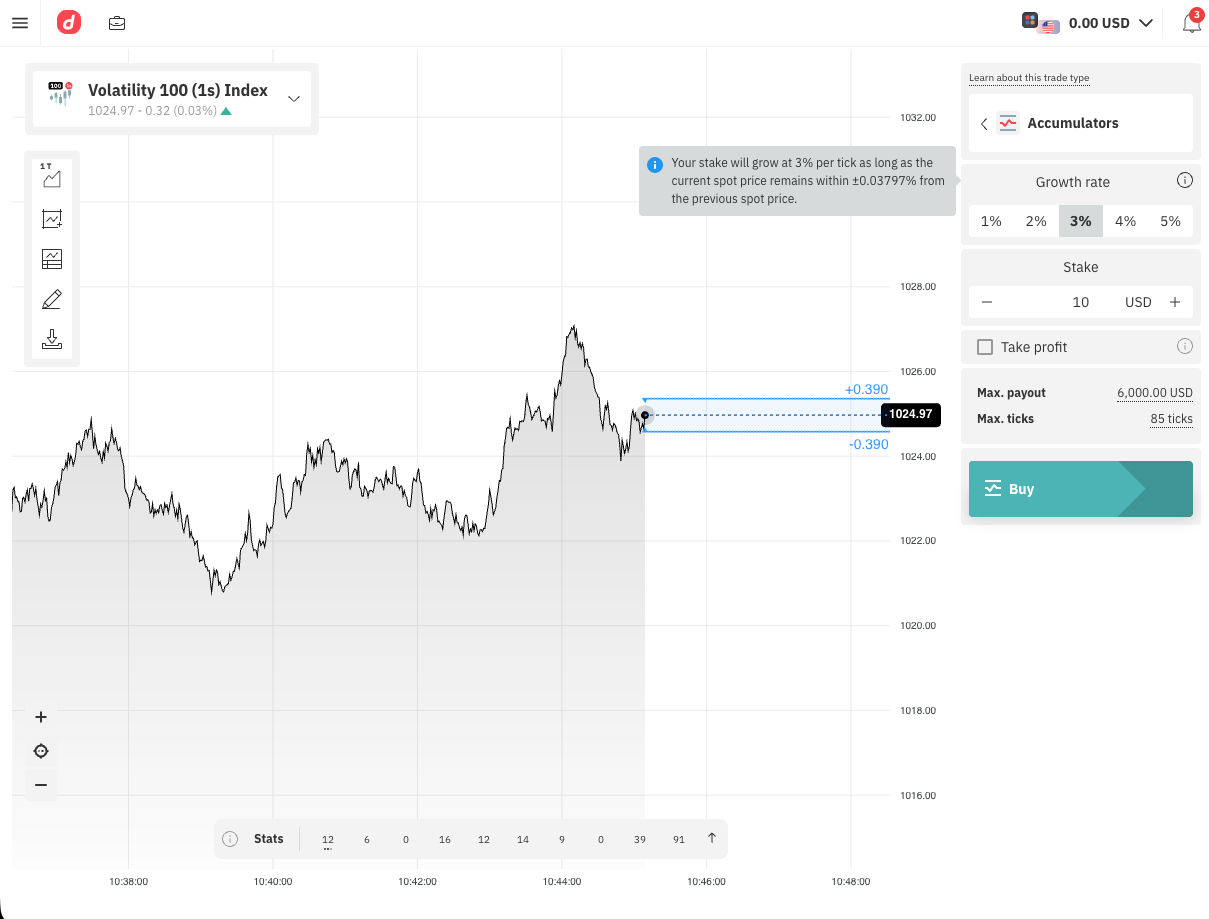
Table 3 – Practical margin calculation examples
What can traders learn from these simulated case studies?
Case 1: Balanced use
- Lena, Southeast Asia – Vol 50, 1:2500 leverage, 1:3 risk–reward, stop-loss always on.
- Result: +18% in 3 months, minimal drawdown.
Case 2: Over-leverage
- Ray, Latin America – Boom 1000, 1:600, no stop-loss, 3 positions.
- Result: Auto stop-out at 65% margin; –25% equity in one session.
Case 3: Smart diversification
- Aisha, Middle East – Vol 10, 75 & Step Index at 1:500 each, 1% risk per trade.
- Result: Consistent monthly growth, low drawdown.
In short, disciplined margin management leads to consistent long-term performance.
What's next for Deriv's leverage system in 2025–2026?
As part of Deriv’s 2025–2026 roadmap, the company is refining its leverage engine to match modern market dynamics and risk calibration standards.
Coming updates:
- Dynamic tiers: Leverage adjusts automatically by trade volume and volatility.
- Real-time margin dashboards: Exposure heatmaps by index family.
- AI-based prompts: Warn when portfolio leverage exceeds safe limits.
- New indices: “Macro Volatility” and “Energy Volatility” (in testing).
“Leverage will become adaptive,” predicts Priyanka Shrivastava, Product Owner. “Ratios will reflect each trader’s history and risk profile.”

How far will Gold and S&P 500 climb as inflation eases?
Learn how the S&P 500 and gold’s bullish trend are influenced by the US CPI & PPI data, and what these economic indicators mean for inflation.
In this latest Market Radar, we spotlight the impact of US economic data on inflation and the impressive S&P 500 and gold bullish rally. We cover the following economic indicators:
- US Consumer Price Index (CPI) data
- US Producers Price Index (PPI) data
Stay informed with our weekly market analysis on Market Radar.

Bitcoin vs Ethereum: The great crypto race
This latest market radar shows Bitcoin surging past $67K, and Ethereum's Dencun upgrade marks an exciting week. Learn what these events mean for the future of cryptocurrency!
In this latest Market Radar, we spotlight the major developments that are set to reshape the landscape of cryptocurrencies. We cover the following news:
- Bitcoin’s surge to $67K
- Potential price of Bitcoin after halving event
- Ethereum’s Dencun upgrade
Stay informed with our weekly market analysis on Market Radar.

A bullish case for Bitcoin: Are we on the road to 60k?
What’s fueling Bitcoin’s potential rise to $60K? Explore the latest insights on Bitcoin ETF developments, halving event, and crypto market trends.
Thursday, 15 February, saw Bitcoin rise shattering expectations by crossing the $52,000 mark for the first time in 2 years. This wasn’t an isolated milestone, with altcoins also posting significant gains — Ethereum surged over 6%, pushing the global crypto market cap to clock $2.04 trillion in 24 hours.
The uptrend was long time coming
Analysts at CoinDCX are among those who are bullish on cryptocurrencies, remarking "The crypto market continues to rise with Bitcoin and Ethereum hitting their highest points of the year. This growth is fueled by increased investments in Bitcoin Spot ETFs and positive sentiment about the upcoming halving event."
Bitcoin’s recent up moves have come after a winter period that saw the coin struggle to breach the $30,000 mark for most of 2023. After a challenging year and a 15-month consolidation period, the stage is set for potentially higher valuations.
Rising Bitcoin ETF demand
As we noted in our Market Radar, January’s crypto watershed moment saw the SEC approve 11 applications by top firms to offer Bitcoin ETFs. This meant companies like BlackRock, Fidelity and VanEck would make a grand entry into the crypto space.
Financial behemoths entering the fray prompted expectations for large-cap institutional money to follow, and it did. Last week saw record capital inflows into Bitcoin ETFs, pushing it to the $2.4 billion mark, with Blackrock’s IBIT and Fidelity’s FBTC receiving inflows of $1.6 billion and $648 million respectively.
Data shared by CoinShares shows the rising interest in crypto ETFs and the massive capital inflows injected in last week.

Analysts expect more inflows as the Bitcoin ETF buzz remains alive.
Evolving industry sentiment
We’ve gone from top financial players wanting to ban Bitcoin, to talk of heavy regulation, and now Spot BTC ETFs are available in the open market. Bitcoin’s story indicates that industry sentiment even among OG investors and analysts has been evolving.
Last week’s huge institutional capital inflows suggest that digital assets are no longer seen as speculative intangibles championed by millennials, but as serious additions to wealth portfolios.
Large cap investors are not just buying into ETFs, but also the coins directly. Bitcoin’s rise also carried altcoins right up with it, with institutional money pumping in. This is exemplified by a transaction that saw $86.5 million USDC moved from Circle to Binance through GSR and Falcon X on Friday, February 16. Analysts see this event as confirmation that digital assets are on the road to full acceptance by institutional finance.
Anticipation ahead of Bitcoin halving event
Bitcoin’s upcoming halving event could also explain BTC’s recent price action, with speculators keeping a watchful eye. The event happens every four years (the next one is scheduled for April) and the reward for successfully mining new blocks is halved. This in turn slows down the supply of new BTC entering the market each day.
With halving events decelerating the number of new coins available, it's reasonable for analysts to expect heightened demand, which could reflect on price. There is also a documented history of prices edging higher after a halving event.

Whether BTC hits 60K by April could depend on how much more institutional pumps will happen as well as how the market reacts to the halving event. Some analysts such as Blockstream CEO Adam Back are predicting that BTC could reach six figures before the halving event.
Bitcoin price analysis: Navigating technical indicators and market trends
Bitcoin is currently testing a resistance reminiscent of December 2021, situated around $51,800. A breakthrough above this level could potentially pave the way for a move towards $59,400.
At present, the 50 simple moving average is holding well above the 200 simple moving average, underscoring Bitcoin’s ongoing upward trend. However, the Relative Strength Index (RSI), hovering near the 70 mark, suggests caution to traders, indicating potential overbought conditions and signaling a possible correction in the near term.

In light of the many forecasts surrounding Bitcoin, it's clear that Bitcoin's resilience persists. The upcoming halving event and the growing acceptance of Bitcoin ETFs are driving its upward trajectory.
However, whether Bitcoin ascends to $60,000 heights or faces downturns remains uncertain. Traders should note that engaging in Bitcoin trading warrants careful consideration and risk management.

CRM earnings preview: Will Salesforce steal Nvidia’s shine?
Will Salesforce's Q4 earnings outshine Nvidia's remarkable success? Dive into our analysis for insights into the tech giants' AI race for supremacy.
As the earnings season nears a close, Salesforce is set to announce its Q4 earnings on Wednesday, 28 February. Tech companies have been in the spotlight the last few weeks, with giants like Microsoft and Amazon beating Wall Street’s earnings estimates. Salesforce Q4 results will be an interesting watch, marking the culmination of a busy 2023.
Salesforce in 2023
The year 2023 was a year of tough decisions for the company. CEO Marc Benioff acknowledged over-expansion during the pandemic. “As our revenue accelerated through the pandemic, we hired too many people leading into this economic downturn we’re now facing, and I take responsibility for that.”
This led to Salesforce trimming 10% of its staff and disbanding its mergers and acquisitions committee to ensure leaner overheads. Despite these measures, the company’s bill was still high after announcing plans to acquire Airkit.ai and Spiff. This topped up a year that had seen the company spend $13.5 billion in marketing and sales.
During the fiscal third quarter, Salesforce announced revenue of $8.72 billion, which met projections. Sales from previous acquisitions, specifically Tableau and MuleSoft, surged in the third quarter, offsetting core sales slowdowns.
Anticipating Salesforce Q4 earnings
The company’s austerity measures seemingly paid off after recording strong Q3 earnings that beat industry estimates. The Q4 report card is expected to surpass Q3’s with analysts from Factset predicting earnings per share of $2.27 on revenue of $9.2 billion.
With profits and margins being the focus in 2023, Salesforce could see Q4 numbers grab headlines in a manner reminiscent of Nvidia’s Q4 earnings call on Wednesday, 21 February.
Salesforce and Nvidia in AI Race
With tech stocks dominating earnings season headlines, Nvidia has been the crown jewel of the industry. They managed to triple their stock price in 2023. Conversely, Salesforce’s growth in 2023 did not attract as much buzz, even with its share price growing more than 80% to almost reach its 2021 all-time high.
Salesforce and Nvidia may not be in the same business — with one being a SaaS leader and the other a chip maker pioneer — but their AI ambitions place them in competition, with products in ‘Nvidia deep learning’ and ‘Salesforce Einstein' competing for corporate and government clients. This comes against a backdrop of AI becoming the decade’s main player in the tech world.
Though Nvidia has enjoyed runaway success thanks to its ‘Gold standard’ AI chips, Salesforce is chasing similar success by acquiring AI companies such as Airkit.ai. The company is also reportedly planning to invest in Nvidia’s chip reseller Together AI. They are looking to stride into the burgeoning AI environment.
Navigating Salesforce share price dynamics
CRM’s stock price at the moment is slightly above the $290 mark. This also appears to be on the road to its all time high of $309.96. If the bulls reach that mark like they did in the fourth quarter of 2021 and push through without being rebuffed, we could see a new all time high for CRM.

The 50-day simple moving average (SMA) is significantly higher than the 200-day SMA, signalling strong short-term bullish sentiment. Traders should however take note of the Relative Strength Index (RSI) which is approaching the overbought threshold of 70.
Analysts are keen on key indicators as well as the much awaited earnings call. This is to get a better idea of the company’s trajectory in the tech space.

Analysing US economic data as the S&P 500 continues its momentum
In this latest Market Radar, we spotlight the economic data shaping the S&P 500 momentum.
In this latest Market Radar, we spotlight the economic data shaping the S&P 500 momentum. We cover the following economic indicators -
- US ISM Non-Manufacturing PMI
- US ADP Employment Change
- US Nonfarm Payrolls
- US Unemployment Rate
Find out how these updates can change the stock market and what they might mean for future interest rates. Will the S&P 500 keep going up with these reports?
Stay informed with our market updates.
For further trading news and financial insights, follow our blog.

FOMC minutes decoded: How the latest FOMC reading impacts your trades
Explore our guide on leveraging FOMC minutes to navigate through monetary policy changes and optimise your trading strategy in 2024.
The Federal Open Market Committee (FOMC) plays a crucial role in shaping monetary policy in the United States. As an investor or trader, staying informed about the FOMC's decisions and understanding their implications is essential for optimising your trading strategies.
One valuable resource for gaining insights into the FOMC's thinking is releasing the FOMC minutes. This comprehensive guide will explore how you can effectively use the FOMC minutes to enhance your trading strategies in 2024.
Understanding the FOMC minutes
The FOMC minutes provide a detailed summary of the committee’s discussions and decision-making process during their meetings. These minutes are released approximately three weeks after each meeting and offer valuable insights into the committee members’ views on the economy, inflation, and future monetary policy actions. By analysing the FOMC minutes, traders can better understand the factors driving the committee’s decisions and position themselves strategically in the market.
Key insights from the FOMC minutes
Assessing the possibility of interest rate cuts
One of the most closely watched aspects of the FOMC minutes is the committee's stance on interest rates. In the last January 2024 meeting, the FOMC acknowledged that rate cuts were not imminent. The minutes revealed that the committee is cautious about easing the stance of policy too quickly and emphasised the importance of carefully assessing incoming data to determine if inflation is moving sustainably towards the 2% target. This cautious approach suggests that rate cuts may not occur until there is greater confidence that inflation is under control.
The peak of the tightening cycle
The FOMC minutes also shed light on the committee's perspective on the tightening cycle. After implementing 11 successive rate hikes since 2022, the committee believes that the tightening cycle has reached its peak. However, the minutes indicate that the committee is still waiting for more evidence of a sustained decline in inflation before considering a rate cut. This insight can help traders gauge the potential direction of interest rates and adjust their strategies accordingly.
Impact on currency market movements
The release of the FOMC minutes often leads to movements in currency markets, particularly the US dollar. Traders closely analyse the minutes for indications of the committee's future policy actions, which can influence the value of the dollar against other currencies. For example, if the minutes suggest a dovish stance, indicating a higher likelihood of future rate cuts, the dollar may weaken. On the other hand, a hawkish tone suggesting a more cautious approach to rate cuts can strengthen the dollar. Keeping a close eye on the FOMC minutes can help traders capitalise on these currency fluctuations.
Incorporating FOMC minutes into your trading strategy
Now that we've explored the key insights from the FOMC minutes, let's discuss how you can effectively incorporate this information into your trading strategy.
Stay informed and plan ahead
Mark the release dates of the FOMC minutes on your calendar (or follow Market News on Deriv Blog) and make it a priority to review them as soon as they become available. By staying informed, you can plan ahead and position yourself strategically in the market. Additionally, be aware of any economic indicators or events that may impact the committee's decision-making process, as these can provide valuable context when analysing the minutes.
Analyse the committee's sentiment
Pay close attention to the tone and sentiment expressed in the FOMC minutes. Look for any hints or indications of the committee's future policy actions. For example, if the minutes suggest concerns about inflation or economic slowdown, it may signal a higher likelihood of rate cuts in the future. Understanding the committee's sentiment can help you anticipate market movements and adjust your positions accordingly.
Monitor currency markets
As mentioned earlier, the release of the FOMC minutes can have a significant impact on currency markets. Keep a close eye on the reaction of the US dollar and other major currencies to the minutes' release. Look for trends or patterns that can inform your currency trading decisions. Consider using technical analysis tools and indicators to identify potential entry and exit points based on the currency market's reaction to the minutes.
Consider the implications for other asset classes
While the FOMC minutes primarily impact interest rates and currency markets, they can also have implications for other asset classes such as stocks, bonds, and commodities. For example, if the minutes indicate a dovish stance, it may lead to increased demand for equities as investors anticipate lower borrowing costs. Conversely, a hawkish tone may prompt investors to seek safer assets like bonds. Keep to date of how the market reacts to the minutes across different asset classes to identify potential trading opportunities.
Combine FOMC minutes with other fundamental and technical analysis
To form a well-rounded trading strategy, it's crucial to combine the insights from the FOMC minutes with other fundamental and technical analysis. Consider incorporating economic indicators, earnings reports, technical indicators, and market trends into your analysis. Using a multi-dimensional approach, you can make more informed trading decisions and increase the likelihood of success.
The FOMC minutes provide valuable insights into the Federal Reserve's thinking and future policy actions. By analysing the minutes and incorporating the information into your trading strategies, you can position yourself strategically in the market and take advantage of potential opportunities.
Remember to stay informed, monitor currency markets, consider the implications for other asset classes, and combine the FOMC minutes with other forms of analysis to optimise your trading strategy in 2024.
Sorry, we couldn’t find any results matching .
Search tips:
- Check your spelling and try again
- Try another keyword