Results for

BTC holds below 70K after CPI data: Is this a pause before a rally?
Bitcoin struggles below $70K after CPI data: Is a rally imminent? Discover how Bitcoin’s price reacted to easing U.S. inflation data, the Federal Reserve’s interest rate stance, and market expectations for potential rate cuts.
Bitcoin rallied back on Wednesday, June 12, recovering from the drawdowns occasioned by weak U.S. employment data. The snap surge to $69,636 on Bitstamp after May’s Consumer Price Index (CPI) data showed inflation had eased faster than expected. The Consumer Price Index (CPI) remained flat compared to the previous month, while the annual inflation rate was 3.3% – both figures falling 0.1% below market expectations.
Despite the Federal Reserve keeping interest rates steady at the current range of 5.25% to 5.5%, analysts now predict a rate cut as early as September. This is a sharp turnaround from last week’s expectations, which dismissed any potential cuts following a surprisingly strong U.S. jobs report. The report exceeded analyst forecasts, showing a 272,000 increase in nonfarm payrolls compared to the anticipated 190,000 increase.
News of easing inflation sent markets rallying, with the S&P 500 and Nasdaq composite climbing 0.3% and 0.7%, respectively, in early Thursday trading. This could be a good sign for Bitcoin since its price movements have been correlated with stock market movements. However, at the time of writing, Bitcoin is struggling to break past $68,000 in what some analysts see as range-bound movement — as buyers remain averse due to the Fed’s continued hawkish stance on interest rates
Is this a consolidation before a BTC uptrend?
Some analysts expect BTC to stay in a holding pattern, as several policymakers call for no rate cuts this year with inflation yet to be subdued to a desirable level. Furthermore, the Fed hiked its Core PCE inflation forecast from 2.6% to 2.8% for this year, meaning a rate cut could be off the table for longer — not great news for Bitcoin holders.
History demonstrates why the Fed maintaining higher interest rates for an extended period is not good news for Bitcoin holders. In 2022 and 2023, the Federal Reserve’s aggressive interest rate hikes, culminating in a 5.25% – 5.50% target range by 23 July 2023, coincided with a depressed period for Bitcoin.
The cryptocurrency struggled to regain its previous highs, only managing a gradual recovery from a low of around $15,000 after the FTX collapse to around $30,000 by the end of the Fed’s tightening cycle. This highlighted Bitcoin’s historical difficulty in thriving during periods of rising interest rates.
There is, however, hope for some respite. Most retail investors on Binance are still bullish on the digital asset with crypto tracker Hyblock, noting that the number of accounts holding a net long position in Bitcoin has surged to 70.25%, marking a significant increase from 57% just 24 hours ago.
High-profile traders such as Daan Crypto Trades, are also bullish on the asset, but according to him, the asset needs a liquidity boost in the short-term to see a rebound. This boost might come soon enough for Bitcoin bulls, as Microstrategy, the largest corporate BTC holder, revealed a proposed $500 million convertible senior note offering, with the proceeds intended primarily for the acquisition of additional Bitcoin.
Analysts also see ETF inflows as another possible catalyst for BTC’s upside. With $100 million worth of inflows witnessed on Wednesday, 12 June, and a possible $500 million Microstrategy pump, BTC could be set for a major rebound.
Technical analysis: Is a price bounce imminent?
At the time of writing, BTC is stuck in a holding range, struggling to decisively break through the $67,000 mark. If a significant rebound is witnessed, bulls might struggle to breach the $68,665 mark, a level that has held before. A further slide though would likely see the $66,127 mark, an area of previous support.
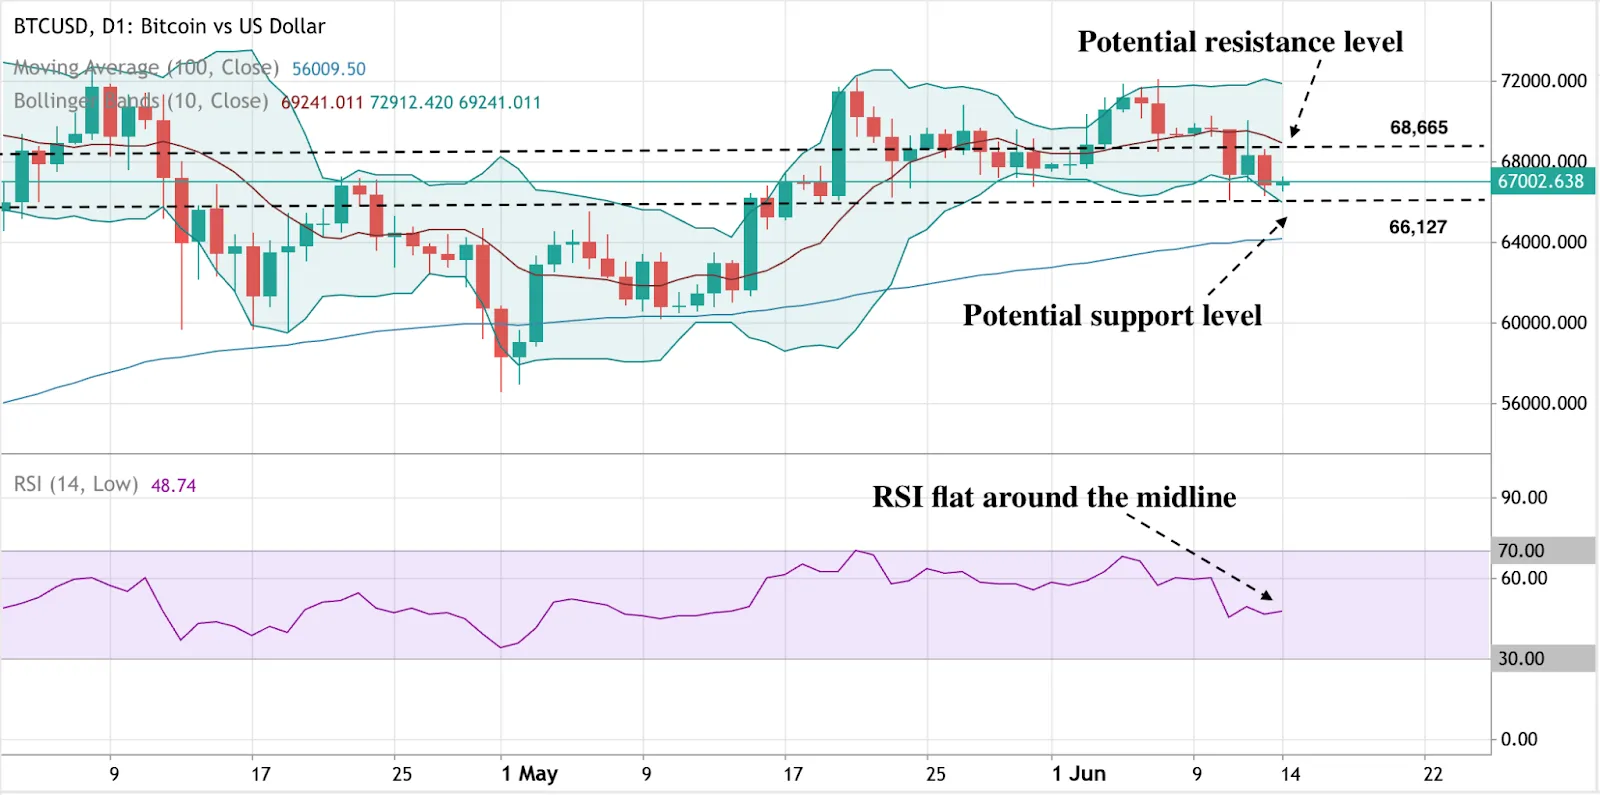
Analysts also note that the RSI is holding flat close to the 50 midline, and prices are almost touching the lower boundary of the Bollinger Bands, an indicator of oversold conditions — meaning that prices could rally albeit at a soft pace.

Here are 5 reasons why gold is a guard
Discover why gold is a reliable hedge against inflation and market instability. Learn the benefits of trading gold on Deriv’s trading platforms.
Tired of watching inflation chip away at your savings? Looking for stability in uncertain markets? It might be worth considering the lasting appeal of gold. Trading gold online offers a unique combination of potential gains, portfolio protection, and remarkable convenience.
Why gold shines bright for Deriv’s traders
- An inflation hedge:
People’s understanding of money affects how they save. Some keep cash at home, risking theft and losing value to inflation. Others buy gold, which usually increases in value over time, despite occasional drops. This is safer than keeping money in currencies, which can lose value quickly due to inflation. Gold’s history proves its resilience against rising prices. Unlike currencies, its limited supply helps it hold value over time.
- A safe harbour:
Economic and geopolitical instability causes investors to seek safe-haven assets to protect their wealth. Gold is a classic safe haven because it tends to maintain or increase its value when other markets, such as stocks or currencies, decline. For example, during the 2008 financial crisis, gold prices rose significantly as investors sought refuge from market volatility. This surge in investor demand naturally leads to a rise in gold prices.

- Potential rate cut:
The Federal Reserve’s plans to cut interest rates could weaken the US dollar. As the dollar weakens, other currencies gain purchasing power. This makes gold more affordable for international investors, potentially fueling increased global demand and pushing gold prices higher.
- Diversification power:
Adding gold to your investment mix can be a genius move. Despite experiencing short-term price fluctuations, gold consistently demonstrates long-term stability compared to stocks or bonds. This serves as a crucial hedge against market volatility.
- Conveniently accessible
Deriv makes gold trading easy from anywhere in the world. With Deriv MT5, you can trade gold CFDs, and with Deriv Bot, you can engage in gold trading using digital options. These tools provide easy access to the gold market from anywhere, using just a computer or mobile device.
Our platforms are designed to be easily accessible with low latency, requiring less initial investment and tight spreads. You won’t own physical gold; instead, you’ll analyse and act on gold price trends. Whether gold prices go up or down, you can position yourself to benefit. Plus, you can better manage risks and lock in your gains with stop-loss and take-profit orders.
Ready to transform your approach to investment?
With advancements in technology, Deriv offers automated trading. One of our platforms, Deriv Bot, enables seamless 24/7 automation, which is particularly advantageous for online gold trading. Automated trading enhances trade volume and ensures timely execution by analysing vast amounts of data and real-time information. This capability can potentially help traders capture the current market value of gold, thereby reinforcing its role as a safe haven during economic uncertainties.
You can also visit the Deriv blog for insights into trading strategies and terminologies that will empower your gold trading journey. Our support team is available 24/7, ensuring you have the assistance you need, anytime, anywhere. Step into the world of gold trading with Deriv and unlock your potential for success.

What happens to your money during a decline in the stock market?
A decline in the stock market may not always be a bad thing. Learn what happens to your money and how you can benefit from this dip.
Have you ever found yourself mesmerised by watching stock prices engage in a constant tug-of-war on the screen? It’s like witnessing a live-action thriller where the plot unfolds in real-time, and every uptick and downtick adds a new twist. In that dynamic environment, a question lingers: What happens to your finances when the once-soaring stock prices enter a decline in the stock market?
Ever since the inception of stock markets, they have gone through ups and downs, often called booms and busts. These shifts happen because of various reasons. Understanding stocks and the stock market patterns and what causes them can give us useful insights, acting like a compass that guides us in navigating potential future economic landscapes.
Before we delve into the intriguing world of what happens to your money when stock prices take a dip, let’s take a moment to unravel the mystery of why stock prices go on this rollercoaster ride in the first place.
The dance of demand and supply in the stock market
In the world of stocks, the forces of supply and demand play a pivotal role in determining prices. Simply put, stock prices reflect how many people are eager to buy or sell a particular stock and the available quantity in the market.
Consider Tesla (TSLA) on a typical trading day. Let’s say that on Monday, Tesla’s shares traded at $250 apiece. The next day, an influential analyst released a groundbreaking report highlighting Tesla’s innovative strides in the electric vehicle industry. Investors, fueled by this optimistic outlook, rushed to buy Tesla shares. With the increased demand, the stock price surged to $280 per share within a day, marking an impressive 12% increase.
Conversely, take a look at Johnson & Johnson (JNJ), a renowned healthcare company. On a Wednesday, its stock might be valued at $140 per share. However, news emerges on Thursday suggesting potential regulatory hurdles for one of its major drugs. This unsettling information prompts several investors to offload their Johnson & Johnson shares. The increased supply and reduced demand caused the stock price to plummet to $119 per share within a day, marking a notable 15% decline.
This phenomenon demonstrates the immediate impact that varying levels of demand and supply can exert on stock prices. When demand surpasses supply, prices soar. Conversely, if supply outstrips demand, prices tend to decrease. The delicate balance between these forces continuously shapes the ever-changing landscape of stock markets.
Interest rate and stocks
Interest rates influence how much it costs companies to borrow money. High rates can increase borrowing costs, affecting corporate earnings and causing stock prices to fall.
Conversely, lower interest rates might boost corporate earnings and make stocks more attractive compared to other investments, causing stock prices to rise.
Economics and stock market
The health of the economy has a big say in stock prices. Good news, like a drop in unemployment and more jobs, can boost investor confidence and consumer spending, causing stock prices to rise.
Conversely, bad news might make investors nervous, leading to a sell-off and a drop in stock prices. Overall, stocks tend to rise when people feel optimistic about economic growth and fall when there’s fear of a recession.
Innovation impact and stock prices
Innovations and technological breakthroughs can significantly affect certain industries. Companies that lead in innovation might experience a surge in demand for their products, positively impacting their stock prices.
Regulations influencing stock prices
Changes in government regulations can impact various industries. Stricter regulations may lead to increased costs for companies, affecting their profitability and potentially causing stock prices to decline.
Stock prices in the wake of inflation
When the cost of goods and services goes up (inflation), it can worry investors. Rising inflation may lead to a stock sell-off, as it reduces the buying power of businesses and consumers.
On the flip side, if inflation is going down, investors may feel more positive about the economy and increase their stock buying. High inflation can also hurt a company’s profits, making its stock less appealing and causing its price to fall.
Consumer spending and stock prices
Healthy consumer spending is great for many companies. It can boost sales, earnings, and stock prices. On the flip side, if consumers aren’t spending much, it can hurt corporate sales, earnings, and stock prices.
How world events echo in stock prices
World events like wars or a global financial crisis can create unrest not only in nations but also in the stock market. For instance, during major crises like 9/11 or the COVID-19 pandemic, stock prices experienced an initial downturn, but in many instances, they eventually recovered over time.
Market maestros: How big players steer stock prices
Big players, like mutual funds and hedge funds, can cause shifts in stock prices. Their massive buying or selling activities have a significant impact on stock prices. When these investors make moves, it’s like a ripple effect that others notice and follow, affecting the overall market.
What happens to your money when stock prices decline?
Investing in the stock market is akin to embarking on a thrilling roller coaster ride. As prices soar to exhilarating heights, there inevitably comes a time when they take a stomach-churning plunge.
While the descent may initially seem daunting, understanding the nuances of these moments can transform perceived losses into strategic opportunities.
Your portfolio value drops:
When stock prices decline, the overall value of your investment portfolio decreases.
Let’s say you own 100 shares of Apple Inc., and the stock price drops from $190 to $170. Your investment was initially worth $19,000 (100 shares x $190). With the decline in stock price to $170, the value of your investment now stands at $17,000 (100 shares x $170).
Potential paper losses:
The term “paper loss” comes into play during a decline. This means that while the value of your investment has decreased on paper, you haven’t actually lost money unless you decide to sell the stocks at a lower price.
Despite the $2,000 decrease in your portfolio value, it’s considered a paper loss until you sell the shares of Apple Inc. at the current lower price.
Long-term perspective matters:
It’s crucial to maintain a long-term perspective when facing stock price declines. As Warren Buffett famously said, “The stock market is a device for transferring money from the impatient to the patient.” This wisdom holds true, as markets have historically shown resilience and the ability to recover over time.
Picture the scenario in 2020 when the stock prices of various companies plummeted amid the pandemic-induced economic downturn. Instead of succumbing to panic and selling, those who held onto their investments witnessed a substantial rebound in the following months as markets displayed their inherent ability to recover. This resilience underscores the importance of weathering short-term storms for potential long-term gains.
In navigating the volatile nature of the stock market, it is paramount to complement a long-term perspective with a well-thought-out trading plan that incorporates robust risk-management strategies. Having a plan in place not only helps investors stay disciplined during market downturns but also mitigates the risk of impulsive decisions, such as panic selling, ensuring a more secure path towards long-term financial goals.
Opportunities for buying low:
During a decline in stock prices, astute investors recognise the chance to implement the strategy coined by Warren Buffett: “Be fearful when others are greedy, and greedy when others are fearful.” This approach, commonly known as “buying the dip,” involves seizing opportunities when market sentiment is at its lowest.
In the aftermath of the 2007-2008 financial crisis, a time when fear permeated the market due to the collapse of the U.S. subprime mortgage market, Warren Buffett exemplified his wisdom. While others hesitated, Buffett saw the potential for gains by buying low. His strategic investments during this tumultuous period contributed to his ability to amass billions, showcasing how profound gains can result from investing courageously when others are apprehensive.
Regular monitoring and adjustments:
It’s important to regularly monitor your investment portfolio and be willing to make adjustments based on your financial goals and risk tolerance. This could involve rebalancing your portfolio or reassessing your investment strategy.
If the decline in stock prices is part of a broader market trend, you might consider rebalancing your portfolio by adjusting the allocation of assets to align with your risk tolerance and financial objectives.
Consider tax-loss harvesting:
During a market downturn, investors can explore tax-loss harvesting as a strategy. This involves selling investments at a loss to offset gains and potentially reduce taxable income.
Suppose you have investments that experienced a decline. Strategically selling these assets at a loss can provide tax benefits, allowing you to use those losses to offset gains and potentially lower your overall tax liability.
Hedging against downward moves:
In times of market uncertainty and downward trends, savvy investors may explore hedging strategies to mitigate potential losses and protect their core long positions. One effective approach is considering shorting through Contracts for Difference (CFDs).
By short-selling assets, investors can offset losses in their long-term investments when markets move downward. This hedging strategy serves as a protective measure, allowing investors to navigate volatile periods with greater resilience.
Conclusion
In the dynamic world of stock markets, where prices can be as unpredictable as the weather, facing a decline is not so much a storm to weather as it is a course correction in the journey of investing. As an investor, it’s crucial to recognise that the road to financial success is seldom a straight line; it’s a series of twists and turns with occasional dips.
While a dip in stock prices may initially appear as a setback, it’s essential to approach it with a mindset grounded in patience and a commitment to the long term.
As we navigate the undulating landscape of financial markets, the key takeaway is this: each downturn is not a conclusion but a transition, an inevitable part of the ebb and flow of market dynamics. Armed with knowledge, resilience, and a forward-thinking approach, investors can confidently embrace the ever-changing nature of the stock market, knowing that each decline is an opportunity for growth and each recovery a testament to the enduring resilience of financial markets.

Decoding financial market whispers: Unveiling signals pointing to the start of rate cuts
Identify signs of a potential rate cut and its economic impact. Get insights and make informed decisions for your trades.
The financial markets offer various signals and indicators along the process of rate cuts. Central banks typically cut interest rates to stimulate economic growth or counteract a downturn. When markets expect the start of rate cuts, it often signifies the belief that the central bank is shifting to a more accommodative policy stance due to economic conditions warranting lower interest rates. Here are some financial market signals that might indicate the start of rate cuts:
Inverted yield curve
An inverted yield curve, where short-term rates exceed long-term rates, traditionally signals an economic slowdown. This suggests that investors believe future interest rates will decline due to slower economic growth and reduced inflation, prompting the Fed to lower rates to stimulate the economy and avoid a recession. However, the current inversion, the longest in history, hasn’t led to immediate rate cuts. Recent economic resilience indicates that the impact of rate hikes may be slower than usual. Despite this uncertainty, a prolonged inversion is a key signal, suggesting the market expects the Fed to eventually cut rates to avert a slowdown.

Increasing market volatility
The anticipation of rate cuts might lead to heightened uncertainty in the markets, resulting in increased volatility across various asset classes like stocks, bonds, and currencies. Investors may adjust their portfolios in response to the expected policy changes.

Strengthening stock prices
If investors believe interest rates will be cut, the potential returns from stocks can look relatively more appealing than fixed-income assets. This shift can lead investors to move their investments from bonds to stocks, driving up stock prices. The increased demand for equities stems from the pursuit of higher returns in a lower interest-rate environment.

Currency movements
If the market expects rate cuts in a specific country, its domestic currency might weaken against foreign currencies. Lower interest rates are less attractive to foreign capital seeking higher yields. The anticipation of lower rates can reduce the inflow of foreign capital and depreciate the value of the domestic currency.
For example, the EU has recently cut interest rates. The chart illustrates the EUR/USD exchange rate on an hourly basis, revealing a sharp decline in the value of the Euro (EUR) against the US Dollar (USD). This downward trend corresponds with the European Central Bank (ECB) cutting interest rates, which typically results in the depreciation of the Euro.

Commodity prices
The start of rate cuts might lead to economic recovery and growth expectations , which can positively affect commodity prices. In such a scenario, basic materials and industrial commodities might see increased demand and higher prices. Additionally, rising gold prices often signal a market anticipation of declining interest rates, as gold becomes more attractive when the opportunity cost of holding a non-interest-bearing asset decreases.
The chart below shows the price of gold (XAU/USD) daily, highlighting a significant upward trend that coincides with recent market developments and economic forecasts.

Inflation data
Declining inflation data, signalling effective inflation control by the central bank, could indicate the start of rate cuts. Falling prices suggest that there is room to lower interest rates to support economic activity without stoking inflation.

Central Bank communications
Central bank communications are pivotal in influencing market outlooks. When central bank officials hint at potential shifts in their policy, markets tend to respond. A dovish stance suggests a likelihood of interest rate cuts, signalling a more accommodative monetary policy. These statements guide market expectations and can prompt corresponding market movements.
Options market activity
The activity in options markets can offer clues about market expectations. Reduced demand for call options (which bet on higher rates) and increased demand for put options (which bet on lower rates) can indicate an expectation of upcoming rate cuts.
It's important to note that financial markets can be complex and influenced by a multitude of factors, including economic data releases, geopolitical events, and unexpected news. As such, market signals are not always straightforward. For those looking to capitalise on these signals, Deriv's trading platforms offer excellent opportunities. Start with Deriv Trader, a seamless, user-friendly platform for trading options and multipliers. For more advanced trading, explore the potential of CFDs on Deriv MT5, leveraging the platform's sophisticated tools and features.

Understanding the effect of interest rates on the stock market
When you start investing, it’s important to understand what guides the stock market. One key factor is the effect of interest rates on the stock market.
When you start investing, it’s important to understand what guides the stock market. One key factor is the effect of interest rates on the stock market. A country’s central bank sets these rates, which affect how much it costs to borrow money. This, in turn, impacts businesses, investors, and the whole economy.
Knowing how interest rates affect stocks isn’t just helpful—it’s key to making smart financial choices. Think of interest rates as the heartbeat of finance. They affect how easily businesses can borrow money, which in turn affects their ability to grow, create new things, and make profits.
For investors, changes in interest rates often lead to changes in stock prices. As rates go up or down, so do many stocks, reflecting the ups and downs of the economy.
In this article, we’ll break down the impact of interest rates on the stock market in a simple and accessible way, using real-world examples to enhance understanding.
Summary highlights:
- The central bank’s benchmark interest rate, guided by the central banking authority of a country, holds a pivotal role in influencing interest rates and subsequently impacting the stock market.
- Rising interest rates can increase borrowing costs for businesses, potentially affecting their profits and stock values.
- Conversely, falling interest rates can stimulate economic activity, benefiting businesses and contributing to higher stock prices.
- Different sectors respond uniquely to interest rate changes, with the financial industry often benefiting from higher rates.
- Bond prices and interest rates maintain an inverse relationship: as rates rise, bond prices tend to fall, and vice versa.
The central bank’s benchmark interest rate:
At the heart of this relationship is the central bank’s benchmark interest rate. This rate influences how much banks charge each other for short-term loans, and when adjusted, it affects the entire economy and the stock market.
When the central bank raises its benchmark rate, it aims to reduce the money supply, making borrowing more expensive. Conversely, lowering the rate increases the money supply, encouraging spending by making borrowing cheaper.
The manipulation of interest rates is a delicate tool used by central banks to strike a balance between promoting economic growth and controlling the effect of interest rates on inflation. However, this strategy comes with its own challenges, as raising rates too much can slow economic activity, while keeping rates low for too long can cause inflation.
Additionally, the global economy is interconnected, so changes in one country’s interest rates can affect international currency values, trade balances, and investments. This underscores the complex web of global economic relationships.
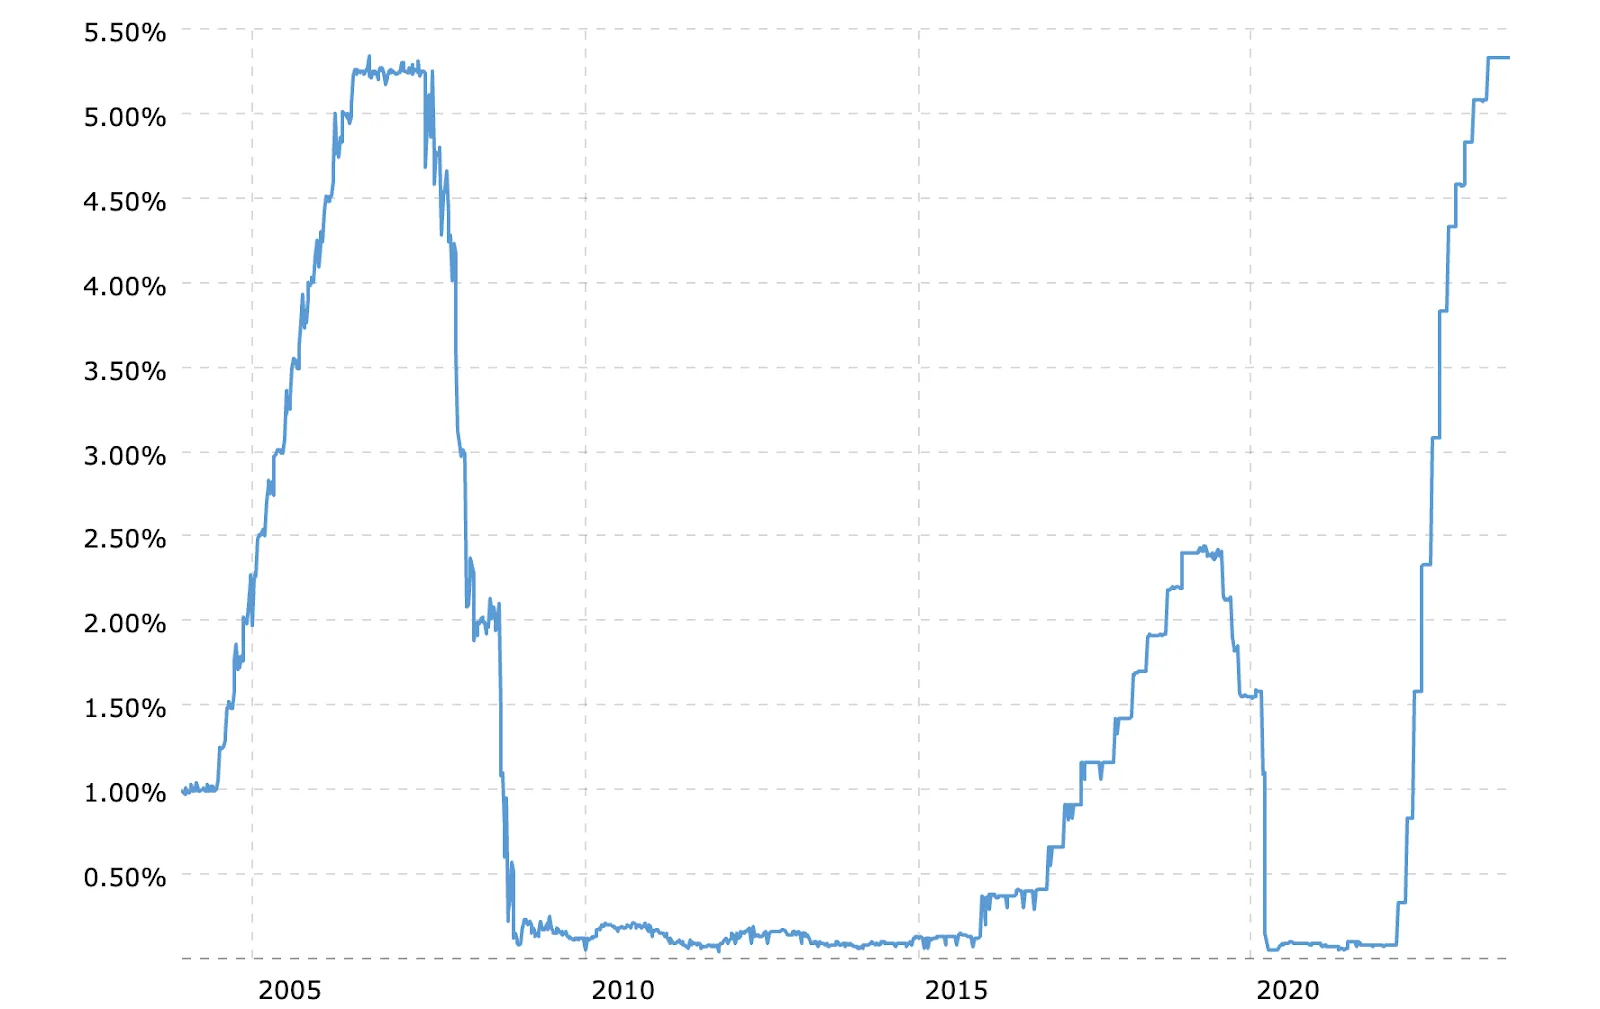
Federal funds rate – 20 year historical chart
Did you know?
Starting from March 2022, the Federal Open Market Committee (FOMC) gradually raised the Fed funds rate, moving it from near zero to 5.33% by July 2023, as part of efforts to address elevated inflationary pressures.
Although it typically requires a year for a shift in interest rates to exert a broad economic influence, the stock market tends to react more promptly. Markets frequently endeavour to factor in future anticipations of rate hikes and forecast the actions of the FOMC.
How interest rates affect stock markets
Rising interest rates
When a central bank raises interest rates, it becomes more expensive for companies to borrow money. This leads to higher costs for businesses, impacting their profits.
Meet Baker’s Delight: Imagine Baker’s Delight, a small bakery chain with dreams of expanding. When the central bank raises interest rates, borrowing becomes pricier for businesses like Baker’s Delight. The increased cost of funds for expansion could potentially squeeze the company’s profits and impact the value of its stocks on the market.
Consumers also bear the brunt when financial institutions grappling with higher borrowing costs pass on the burden to borrowers. As interest rates climb, especially on variable-rate loans like credit cards and mortgages, individuals face the heat with increased monthly payments, leaving them with less money to spend. Moreover, while the goal is to discourage borrowing, higher rates also aim to encourage saving.
While consumers grapple with mounting bills, businesses, too, are caught in the crossfire. As households trim discretionary spending due to higher expenses, businesses witness a decline in revenues and profits. This interplay creates a challenging cycle: reduced consumer spending triggers a downturn for businesses, leading them to curtail expansion plans and further exacerbating the economic strain.
Falling interest rates
Conversely, when interest rates fall, borrowing becomes cheaper. This stimulates economic activity as businesses benefit from more cost-effective financing options for operations, acquisitions, and expansions, ultimately bolstering their potential for future earnings growth.
Consumers may find themselves more inclined to increase spending, perceiving greater affordability for significant investments like buying a new home or enrolling their children in private education. Consequently, this positive economic cycle tends to drive stock prices higher.
The Johnsons’ Dream Home: Now, consider the Johnson family. With lower interest rates, they find it more affordable to buy their dream home. This not only boosts the housing market but also benefits companies in construction and real estate, amongst others.
How do interest rates affect different types of stocks?
When interest rates rise or decline, certain types of stocks tend to perform well. Here are some categories of stocks that are generally considered to benefit or be adversely affected by changes in interest rates.
Growth stocks
Firstly, growth stocks, which belong to rapidly expanding industries driven by innovation, are heavily influenced by rising interest rates. These companies prioritise revenue growth over immediate profitability, making them more sensitive to higher rates.
Since they depend on future cash flows discounted heavily, their valuations are more impacted by rising interest rates. Additionally, these early-stage firms often rely on credit, so increased borrowing costs can hinder their growth. Higher interest rates may also lead to a decline in economic growth, affecting returns for these companies.
Technology giant Tesla Inc. (TSLA) began its journey as a growth stock. Over the past few years, Tesla has concentrated on expanding its market share and investing heavily in innovative technologies, marking it as a prime example of a company that initially embraced a growth-oriented strategy.
Value stocks
Value stocks, known for their stable business models generating steady revenue and earnings, experience less volatility during rising rates. Many value stocks pay dividends, making them attractive to investors seeking income stability during turbulent times.
Similarly, when interest rates are low, these stocks paying consistent dividends become relatively more attractive. Investors seeking income may turn to dividend-paying stocks as an alternative to fixed-income investments.
An additional characteristic of value stocks is that they typically trade at a lower price relative to their fundamental metrics, including dividends, earnings, and sales. This valuation aspect further underscores the appeal of value stocks, offering investors the potential for both income and the opportunity for capital appreciation based on solid fundamentals.
Procter & Gamble (PG) is often regarded as a value stock. It’s a stable consumer goods company with predictable cash flows and dividends. During times of economic uncertainty, investors often turn to such stocks for their reliability.
Cyclical stocks
The third category includes cyclical companies, such as restaurants and retail businesses, thriving during economic expansions but suffering when spending diminishes due to reduced money supply.
Marriott International (MAR), a hotel chain, exemplifies a cyclical stock. During periods of economic expansion, people tend to travel more, benefiting hotel chains. Conversely, during economic downturns, travel decreases, impacting the earnings of companies like Marriott.
Defensive stocks
Defensive stocks, like utilities and pharmaceuticals, are favoured during falling, stable and rising rates. These companies provide products essential to consumers regardless of economic conditions, making them less sensitive to economic cycles.
Johnson & Johnson (JNJ) is a classic defensive stock in the pharmaceutical sector. Regardless of economic conditions, the demand for healthcare products remains relatively stable. Johnson & Johnson is known for its resilience during economic downturns, making it a defensive stock.
Real Estate Investment Trusts (REITs)
REITs, especially those focused on income-producing properties like residential or commercial real estate, often benefit from lower interest rates. As borrowing costs decrease, REITs can refinance debt at more favourable terms.
Simon Property Group (SPG), specialising in retail real estate, is a REIT that may benefit from lower interest rates. As borrowing becomes more affordable, Simon Property Group could seize opportunities for favourable refinancing, contributing to its overall financial well-being.
The interplay between interest rates, bonds, and stocks
Changes in interest rates, bonds, and stock prices all affect each other. When interest rates go up, older bonds usually lose value. Why? Because new bonds start offering higher returns to match the higher rates. This makes older bonds with lower returns less appealing. As these older bonds lose value, they start offering better returns, which can make some investors prefer them over stocks.
Moreover, the impact of interest rates extends to the stock market. The risk-free rate serves as a benchmark, typically reflecting the yield on government bonds considered to have minimal default risk.
As the risk-free rate climbs, the total return expected for investing in stocks also increases. Consequently, if the required risk premium decreases and the potential return on stocks remains static or declines, investors may perceive equities as riskier.
This shift in perception prompts investors to reevaluate their portfolio allocations, leading them to redirect funds to alternative assets deemed less risky in the changing interest rate landscape. In this delicate balance, the ebb and flow of interest rates play a pivotal role in shaping investor sentiment and influencing both bond and stock markets.
Conclusion
Understanding the relationship between interest rates and the stock market is fundamental for anyone navigating the world of investments. Whether rates are rising or falling, their impact is far-reaching, influencing the decisions of businesses, consumers, and investors alike.
By considering these dynamics and examples, beginners can make more informed choices in their investment journey.

EUR/USD holds strong ahead of key ECB meeting
Poor economic data pushed the euro higher against a weakening dollar ahead of a crucial ECB meeting. Learn more about the pair’s performance
The euro asserted its dominance in Tuesday’s European session, surging past the 1.0900 mark against a faltering US dollar ahead of a key ECB meeting on June 6 – that will give monetary policy direction. Analysts attribute this robust ascent to a notable downturn in the greenback following the release of lacklustre US economic indicators.
Why is the USD weakening?
The US Dollar Index (DXY) has plummeted to a near two-month low, primarily due to the disappointing May ISM Manufacturing PMI report. This report reveals a second consecutive month of contraction in the manufacturing sector, with the PMI down 0.5 percentage point from the 49.2 percent recorded in April. This decline is raising concerns about a possible economic slowdown and a potential easing of inflationary pressures. These worries are further exacerbated by the recent downward revision of Q1 GDP growth.
This economic slowdown could bring back talk of earlier-than-expected interest rate cuts by the Federal Reserve, according to analysts. Traders are now eagerly anticipating upcoming economic data releases, such as the ISM Services PMI, ADP Employment Change, and Nonfarm Payrolls, which will be crucial in either validating or refuting these expectations.
While the market absorbs these developments, the euro stands strong, showcasing its resilience and potential for continued appreciation against a weakened US dollar.
EUR/USD technical analysis: Will prices rebound or keep sliding?
At the time of writing, analysts note that EUR/USD has seen a brief retracement — currently hovering around 1.086. Prices are presently touching the upper boundary of the Bollinger band, which is an indicator of overbought conditions — hinting at a possible significant retracement.
The 14-period Relative Strength Index (RSI) edging up at around 64 suggests that some bullish pressure exists. If the retracement materialises, we could see a slide towards the 1.080 mark. Sellers could find some difficulty pushing through the 1.084 mark, an area that has held sellers before.
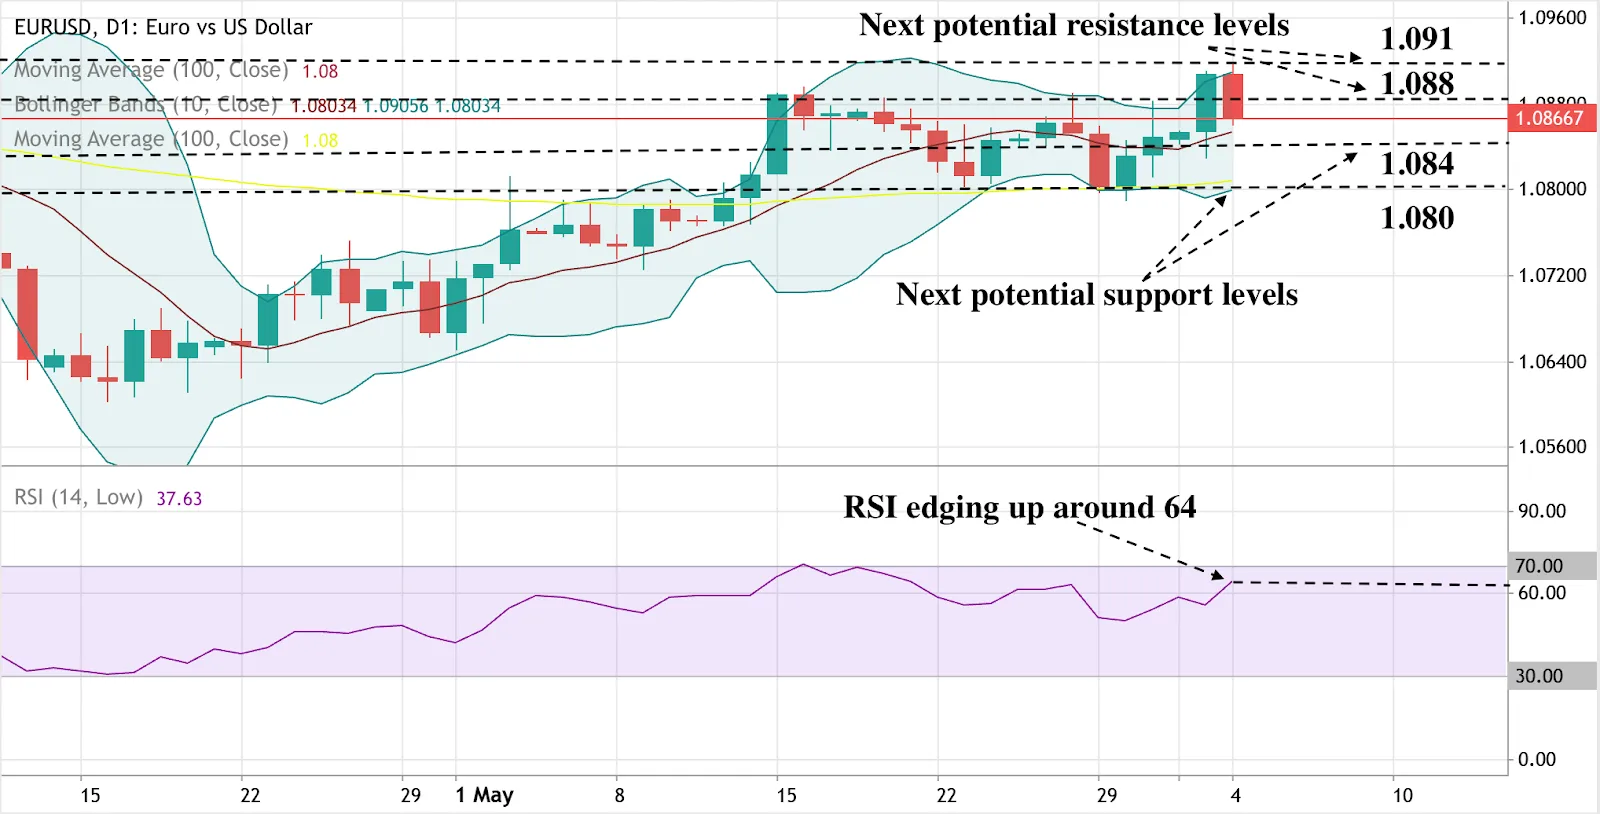
If upside pressure resumes, bulls could face resistance around the 1.088 mark, an area sellers have defended before. A decisive breach past that price point could see the price resume earlier highs of 1.091.
Conclusion
The euro is capitalising on a weakened US dollar, driven by lacklustre economic data and expectations of an earlier Federal Reserve rate cut. However, the recent retracement in EUR/USD and overbought technical indicators suggest a possible consolidation or pullback before further gains, according to analysts. Traders should closely monitor upcoming economic releases, as they will be pivotal in determining the pair’s future direction.
You can get involved and speculate on the price movement of EUR/USD with a Deriv MT5 account. It offers a list of technical indicators that can be employed to analyse prices. Log in now to take advantage of the indicators, or sign up for a free demo account. The demo account comes with virtual funds so you can practise analysing trends risk-free.

Gold prices rise amid geopolitical tensions and Fed uncertainty
Despite geopolitical unrest and hawkish remarks from the Fed, gold prices soared. Discover the driving forces behind this surge and more.
Gold prices rallied on Monday, recovering from a two-week low, as investors grappled with escalating geopolitical tensions in the Middle East and diminishing expectations of US interest rate cuts.
Recent hawkish comments from Federal Reserve officials and better-than-expected US economic data have dampened expectations of interest rate cuts, reducing gold’s appeal as an inflation hedge. Despite this, Spot gold climbed nearly 1.0% to $2,356.37 per ounce, while gold futures in New York mirrored this gain with a 0.9% increase.
This upward movement was primarily driven by heightened demand for gold as a safe-haven asset due to the escalating tensions in the Middle East, marked by reports of casualties from Israeli air attacks.
Investors are now keenly awaiting the release of the April personal consumption expenditures (PCE) price index, the Fed’s preferred inflation gauge, later this week, which could provide further clues on the future direction of monetary policy.
Gold rallies amid economic shifts
Gold’s allure as a safe-haven asset continues to shine brightly amid growing geopolitical tensions and economic uncertainties, according to analysts. Recent events in the Middle East, such as the reported casualties from Israeli air attacks in Gaza, have underscored gold’s appeal in times of crisis. This heightened demand has contributed to gold’s impressive performance this year, with prices surging over 16% year-to-date and reaching a record high of over $2,400 per ounce in May.
Further bolstering gold’s prospects is the positive economic data emerging from the US. The unexpected rise in Durable Goods Orders and the higher-than-expected University of Michigan Consumer Sentiment Index indicate a resilient economy, which could potentially fuel inflationary pressures. This, coupled with the slight uptick in one-year inflation expectations, could reinforce gold’s traditional role as a hedge against inflation.
Investor confidence in gold’s future remains strong, as evidenced by bullish predictions from leading financial institutions. UBS analysts recently raised their gold price forecast to $2,600 for the end of 2024, while Citi analysts boldly predict that gold could hit $3,000 per ounce in the next six to 18 months.
Technical analysis: Will gold prices continue to rise?
At the time of writing, the price is holding above the $2,300 mark, with bullish sentiment present as the yellow metal remains above the 100-day EMA on the daily chart. However, analysts note that the 14-day Relative Strength Index (RSI) stands around the 50 mid-line – indicating that a consolidation or a pull back cannot be ruled out.
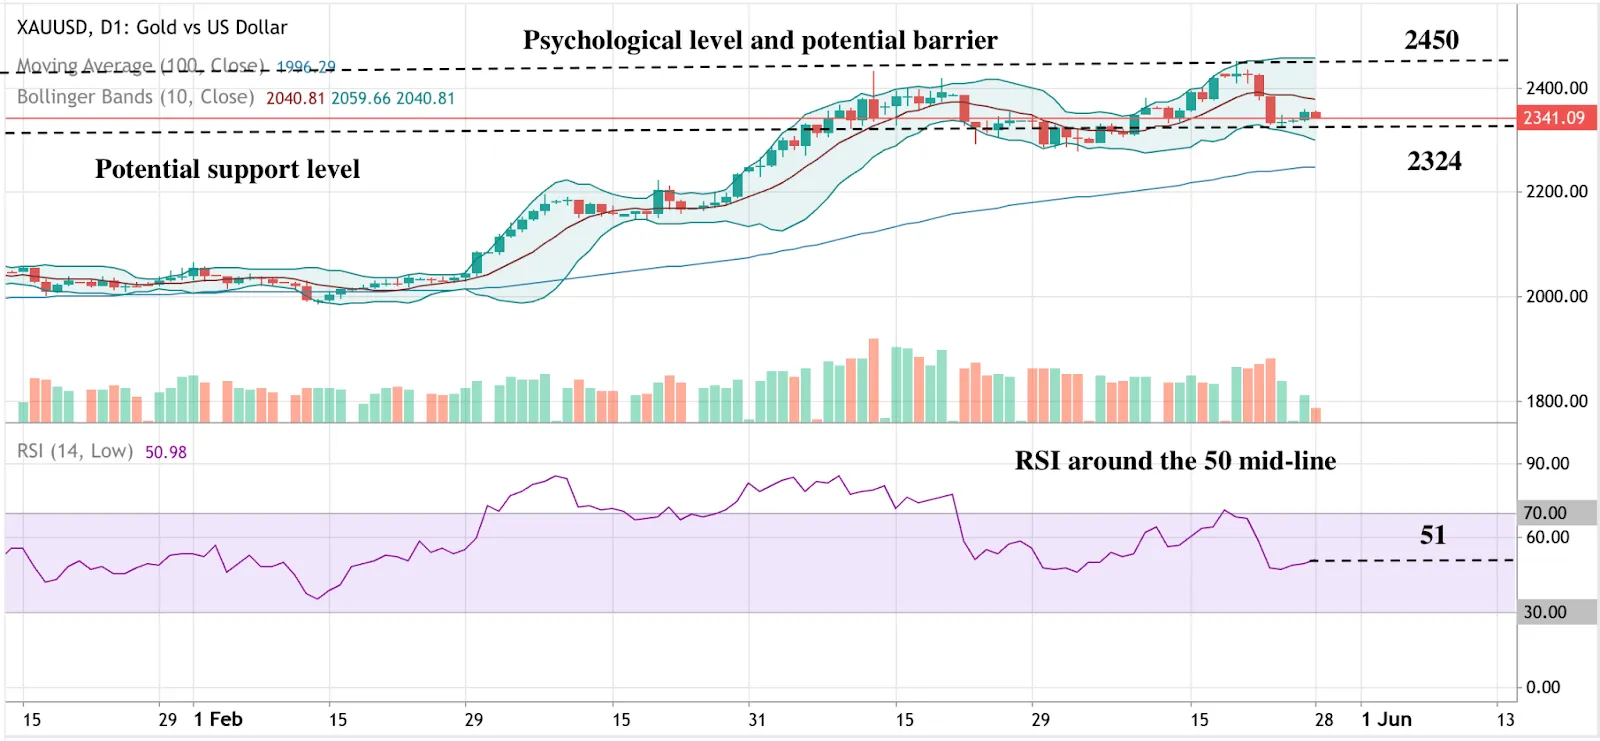
If a slide in prices were to materialise, XAUUSD could find support near the lower boundary of the Bollinger Band at $2,324. Further selling could see prices test a previous support price at $2,289. On the upside, a decisive move up could face resistance close to the upper boundary of the Bollinger Band at the $2,424 price level. A breach above that level could set the stage for an advance towards the $2,450 psychological level, according to analysts.
With Gold’s volatility remaining a hot topic, you can get involved and speculate on the price of the yellow metal with a Deriv MT5 account. It offers a list of technical indicators that can be employed to analyse prices. Log in now to take advantage of the indicators, or sign up for a free demo account. The demo account comes with virtual funds so you can practise analysing trends risk-free.

Salesforce earnings preview: Strong financial performance amid market speculation
Preview Salesforce earnings report, stock trends, strategic plans, and market expectations. Learn what it means for your portfolio.
Whispers of Salesforce potentially acquiring data management firm Informatica sent ripples through the market and saw the stock slide 7% last month, according to analysts. This speculation came at a pivotal moment for Salesforce, fresh off a turbulent 2022 marked by activist investor pressure and a renewed focus on profitability.
In response to activist pressure, the company dissolved its mergers and acquisitions committee in early 2023, signalling a pause on major spending. However, the meteoric rise of generative AI has reshaped the strategic landscape, potentially reawakening Salesforce’s appetite for acquisitions like Informatica.
Salesforce shrugged off market turbulence, delivering a robust fourth-quarter earnings report that surpassed Wall Street’s expectations. The company also surprised investors by announcing its first dividend of 40 cents per share and a $10 billion boost to its share buyback program, bringing the total repurchase amount to roughly $12 billion since August 2022. These moves signal Salesforce’s financial strength and dedication to rewarding shareholders. However, the company’s revenue forecast for fiscal 2025 fell short of analyst predictions, somewhat dampening the initial market enthusiasm.
Facing pressure from activist investors, Salesforce has shifted its focus to enhancing profitability, implementing cost-cutting measures like the elimination of 700 jobs announced in late January. Despite the company’s stock surging nearly 98% in 2023 and an additional 12% in 2024, some analysts caution that solely focusing on margin improvement may not be enough to propel the stock further. They emphasise the need for Salesforce to reignite its revenue growth to maintain its upward trajectory.
Salesforce earnings report
At its Dreamforce conference in September, Salesforce highlighted its increased focus on generative AI, launching the Einstein 1 platform and the Einstein Copilot feature. Salesforce’s strategic initiatives in AI are expected to play a key role in driving future growth, alongside its continued investments in digital transformation projects.
Salesforce’s Q4 earnings showed significant growth, with earnings rising 36% to $2.29 per share on an adjusted basis and revenue climbing 11% to $9.29 billion. Analysts had expected earnings of $2.27 per share on sales of $9.22 billion. Additionally, current remaining performance obligations (RPO) bookings rose 12% to $27.6 billion, surpassing estimates of $27.09 billion.
For the current quarter ending in April, Salesforce projected revenue in the range of $9.12 billion to $9.17 billion, aligning with analysts’ estimates of $9.14 billion. For full-year 2025, Salesforce expects revenue in the range of $37.7 billion to $38 billion, with growth of 9%, slightly below the estimates of $38.57 billion or 11% growth.
Technical analysis and market sentiment
Analysts note that technical indicators paint a picture of strong bullish momentum for Salesforce this year, with CRM stock surging nearly 12% since January. However, the stock’s current position touching the upper Bollinger Band is perceived to signal potential overbought conditions, hinting at a possible slowdown or reversal in the near future.

The Relative Strength Index (RSI) displays flat at around 58, indicating potential exhaustion of the up move in the short term. Analysts say traders may expect key support levels to be identified at $272 and $268 should these overbought conditions lead to a price slide.
Salesforce’s Q4 earnings, dividend announcement, and share buybacks showcase its strength amidst market volatility. However, the company’s cautious revenue outlook and potential overbought stock conditions suggest that its path forward may not be entirely smooth. The company’s ability to re-accelerate growth while managing margins will be key as it navigates activist investors, AI advancements, and acquisition speculation. Traders will undoubtedly be watching closely as the CRM giant continues to evolve and adapt in this dynamic environment.

Nvidia earnings expectations: Will the earnings report push the stock higher?
Analysts are optimistic about NVDIA’s expected earnings. Learn what the release could mean for the AI chipmaker’s stock uptrend.
Nvidia is poised to release its quarterly earnings on Wednesday, 22nd May, amid a surge in success driven by the booming artificial intelligence sector. As the chipmaker rides this wave, all eyes are on the financial impact of these advancements. What will the figures reveal about the tech landscape?
In the current scenario, more than four mega-cap tech giants, including Microsoft, Alphabet, Amazon, and Meta, are investing billions in AI infrastructure. Analysts see this as big business for Nvidia, the dominant player in AI chips.
Nvidia AI chips in high demand
At recent earnings calls, “AI infrastructure” and “generative AI” were all the buzz, echoing a massive surge in spending directed toward Nvidia’s incredibly popular H100 GPU chip. This powerful chip costs north of $40,000 and is the backbone of the AI systems running current platforms, including ChatGPT, among others.
Nvidia could hog the spotlight in the AI space for even longer as the company is set to release its next-generation AI chip, Blackwell. Some analysts see this as a game changer that could further solidify the company’s position, as the go-to choice for AI innovation.
Perhaps the most resounding endorsement for Nvidia came from Tesla’s Elon Musk, who announced plans to more than double the company’s H100 GPU usage by the end of the year. “We expect that to be probably 85,000 or thereabouts,” Musk said, highlighting the H100’s critical role in improving Tesla’s Full Self-Driving software.
Meta Platforms is also betting big on AI, increasing its forecasted 2024 capital expenditures to support its “AI roadmap.” Meta’s recent massive purchase of H100 GPUs – now totalling a whopping 1 million units – underscores just how integral Nvidia’s technology is to the social media giant’s ambitions.
According to many industry analysts, the trend is clear – Microsoft, Alphabet, and Amazon are all significantly ramping up their AI investment. With a projected combined capex of $205 billion this year, Nvidia is poised to capture a substantial share of this spending as tech giants race to build their AI capabilities.
While rivals like AMD and Intel are vying for a slice of the AI chip market, Nvidia’s current dominance looks secure. Analysts expect Nvidia’s revenue to hit $100 billion this fiscal year, dwarfing the projected sales of its competitors.
Next Nvidia earnings report in focus
Nvidia’s first-quarter results this year have been stellar, and the company’s deep ties to the surging AI sector suggest continued momentum. With tech leaders firmly committed to Nvidia’s AI hardware, traders may want to keep a close eye on the company’s upcoming earnings report.
Analysts expect the high flier stock to report growth in earnings, with a consensus figure of around USD 24.17 billion in revenue and USD 5.49 in earnings per share.
At the time of writing, the bullish outlook for the stock remains intact as it stays above the 100-day Exponential Moving average on the daily chart. The price has been within a descending trend channel since Mid-March that it now appears to be breaking out of, suggesting that a rally could ensue if price decisively breaks above.
Additionally, the RSI is edging up towards the 60 mark, indicating that buyers are still strong and could push the stock closer to the USD 950 mark.

If prices retreat below the 870 level, a short-term consolidation within the descending trend channel cannot be ruled out.
With analysts expecting a positive earnings call, will the report add fuel to its AI-driven momentum, sending the stock to higher highs?
Ready to participate in Nvidia’s potential growth? Trade on its stock price with a Deriv MT5 account. Access a range of technical indicators for in-depth analysis, or practise risk-free with a free demo account and virtual funds.
Sorry, we couldn’t find any results matching .
Search tips:
- Check your spelling and try again
- Try another keyword