Results for

Gold holds firmly above $2600, clear path to $3,000?
Gold continues to trade above the $2,600 mark, hitting new highs at $2,635.05 during Tuesday’s Asian session, as investors anticipate further federal reserve rate cuts.
Gold continues to trade above the $2,600 mark, hitting new highs at $2,635.05 during Tuesday’s Asian session, as investors anticipate further federal reserve rate cuts. Economic concerns and geopolitical tensions are bolstering demand for the yellow metal as a safe-haven asset.
Monetary influence: With Fed officials signalling smaller rate cuts in upcoming meetings, gold remains attractive compared to yield-bearing assets. Strong central bank buying and rising demand from tech industries further support the bullish outlook for gold.
Technical outlook: Analysts note that Gold is holding steady at $2,628, with upward momentum pointing towards the next target of $2,700. Immediate support lies at $2,580 and $2,550. If geopolitical risks and rate cuts continue, gold may find a clear path to the $3,000 milestone.
Read the full article here: https://www.finextra.com/blogposting/26867/gold-holds-firmly-above-2600-clear-path-to-3000

Bitcoin surges past 60K, will FOMC meeting and US politics cause more volatility?
Bitcoin surged to $61,337 on Tuesday, its largest intraday gain since early August, as speculation grew that the Federal Open Market Committee (FOMC) could cut interest rates by 50 basis points in its Wednesday meeting.
Bitcoin surged to $61,337 on Tuesday, its largest intraday gain since early August, as speculation grew that the Federal Open Market Committee (FOMC) could cut interest rates by 50 basis points in its Wednesday meeting. The CME FedWatch Tool shows a 62.0% chance of a 50-basis-point cut, up from 50.0% a day earlier, while the odds of a smaller 25-basis-point cut are at 38.0%, according to FXStreet analyst Akhtar Faruqui.
A 25-basis-point cut would be the biggest surprise from the Fed since 2008, and a 50-basis-point cut would be the largest unexpected move since 2009, per Kobeissi Letter’s analysis.
The Fed rate decision is vital because Bitcoin and other cryptocurrencies, like tech stocks, have historically benefited from low interest rates as "risk-on" assets, known for their volatility. This can be partly explained by the increasing correlation between Bitcoin and the S&P 500.
According to K33 Research, the 30-day correlation between Bitcoin and the S&P 500 is now at levels not seen since October 2022.

This means that cryptos have become increasingly sensitive to Fed policy, which is why the crypto market is why Wednesday's Fed decision could cause significant volatility for BTC. Lower rates typically boost cryptos like BTC by encouraging higher-risk, higher-reward opportunities.
Beyond the fed rate decision, analysts foresee Bitcoin's volatility rising as the U.S. election approaches, with Kamala Harris and Donald Trump in a closely contested race.
Bitcoin price as we build up to US polls
Analysts foresee Former President Trump’s shift toward supporting the cryptocurrency sector could make Bitcoin prices more sensitive to his campaign’s progress. His team has actively targeted crypto enthusiasts, promising to turn the U.S. into the “crypto capital of the world.” If his campaign gains momentum, market optimism could lift Bitcoin, as investors view his policies as favourable for the industry.
Trump's acceptance of crypto donations and pro-crypto stance has already fueled speculation of a “Trump trade,” where his electoral gains drive Bitcoin higher. However, the path to election day remains uncertain. Shifts in polling or debate performances could introduce short-term volatility, creating opportunities for traders.
On the other hand, Vice President Harris has yet to make her position on cryptocurrency explicitly clear, though her campaign has engaged with industry stakeholders. Harris’ presidency might be perceived as a continuation of the Biden administration’s cautious approach to crypto, which included tighter regulatory scrutiny. Her administration is expected to introduce anxiety among crypto investors, especially startups and smaller players in the market, who worry that further cryptocurrency regulation could slow innovation and limit the industry's growth.
However, concerns about a Harris presidency driving Bitcoin lower might be overstated. Some experts argue that Bitcoin’s global nature and increasing institutional adoption will ensure its resilience, regardless of who wins the election. With Harris showing signs of a more engaged stance toward crypto, there’s potential for clearer regulations, which could provide much-needed stability for the sector.
Market sentiment and technical outlook
In recent months, Bitcoin’s price has largely traded within a range of $55,000 to $70,000, with macroeconomic data and political news contributing to price swings. While the election cycle has added a new layer of complexity, Bitcoin’s price is still heavily influenced by broader economic trends such as inflation, interest rates, and institutional adoption.
The recent debate between Harris and Trump saw Bitcoin briefly dip by 3%, though this was more due to interest rate updates from Japan and U.S. inflation data rather than the debate itself. Investors continue to watch these macroeconomic factors as well as Fed moves, knowing that both the election and monetary policy will play significant roles in shaping Bitcoin’s path forward.
At the time of writing, BTCUSD is holding just above $60,000 with a bearish bias on the daily chart, as prices stay below the 100-day moving average. However, RSI rising past the midline indicates rising momentum, possibly hinting at a further move up. Buyers could encounter resistance around the $60,800 price level, with a further move up likely to hold around the $62,000 psychological level. On the downside, prices could find support at the $59,000 and $58,000 support levels.


Gold surges past $2500: Is more upside ahead?
Gold prices jumped past $2500 temporarily, in London trading, driven by anticipation of a US Federal reserve rate cut.
Gold prices jumped past $2500 temporarily, in London trading, driven by anticipation of a US Federal reserve rate cut. The market is now pricing in a 45% chance of a 50 basis points cut in September, up from 31% earlier in the week. This shift comes amid signs of a cooling U.S. economy and dovish comments from the San Francisco Fed President.
Political heat: The upcoming U.S. election is also influencing gold's rally. Kamala Harris's edge in the polls suggests continued fiscal stimulus and dovish monetary policy, which boosts gold's appeal. However, a Trump victory could introduce volatility, with his proposed tariffs and potential changes to Fed leadership impacting gold prices in unpredictable ways.
Technical picture: At the time of writing, analysts note that gold is touching highs of $2,515, potentially on the road to unprecedented levels. The daily chart shows a clear bullish bias, with prices surging past $2,500 and remaining well above the 100-day moving average. The RSI is also edging up sharply toward 60, reinforcing the bullish narrative. Buyers might face resistance around $2,518 and $2,520, while support levels are seen at $2,490 and $2,479 in case of a pullback.
Outlook: Market participants are closely watching Friday's Nonfarm Payrolls and wage inflation data, which could further solidify rate cut expectations and push gold even higher.
Read the full article on Gold's performance.
For more insights on Gold Price Forecast 2024
.webp)
Nvidia's shares stumble: A temporary setback or a sign of things to come?
Nvidia's shares took a 6% hit after its recent earnings report, despite exceeding Wall Street's expectations.
Nvidia's shares took a 6% hit after its recent earnings report, despite exceeding Wall Street's expectations. While the company posted strong numbers, the deceleration in year-on-year revenue growth, combined with uncertainties about the AI boom's longevity, has left investors concerned. Delays in the launch of Nvidia's much-anticipated Blackwell chips and increasing competition further add to the unease.
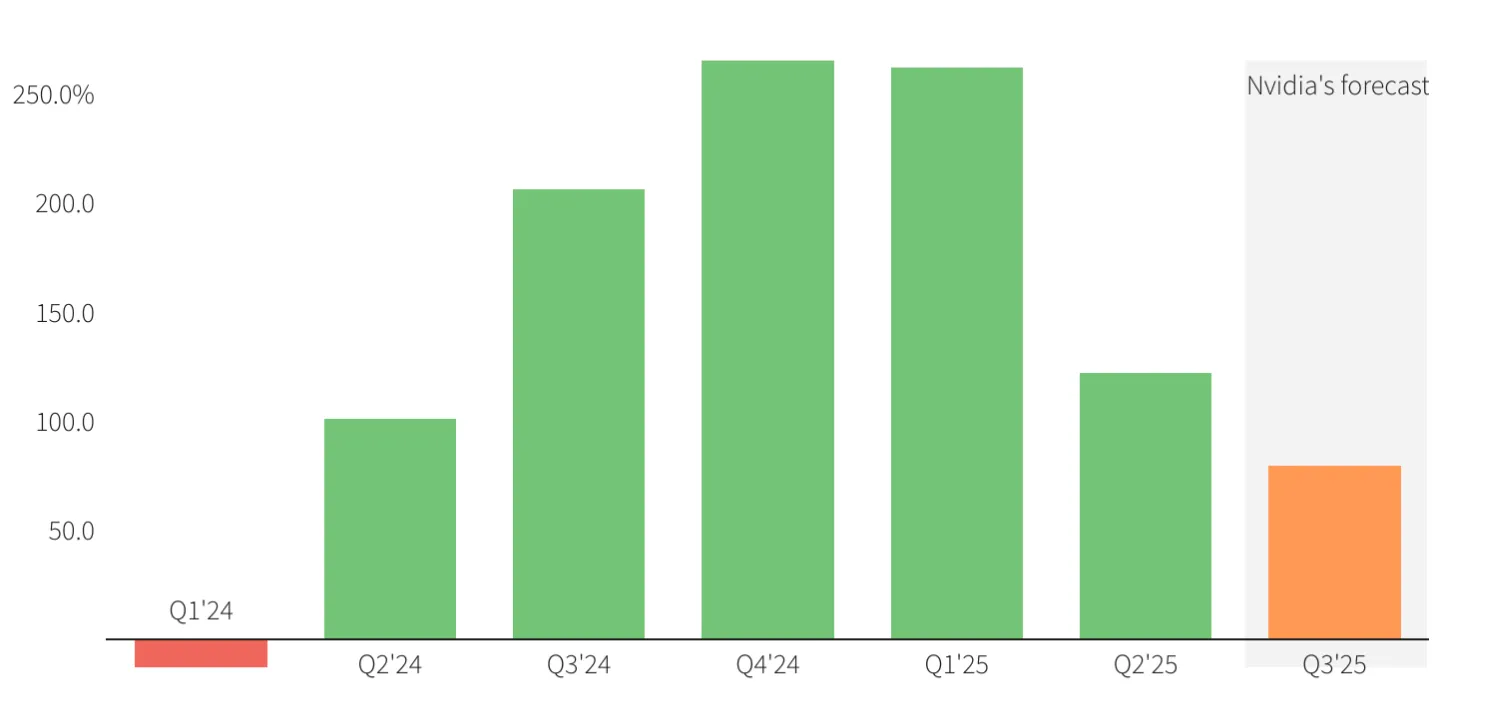
Nvidia's growth at risk?
Nvidia's current challenges raise questions about the sustainability of its growth trajectory. The company, although a dominant player in the AI chip market, faces a growing competitive landscape.
Rivals like AMD are making strategic moves to strengthen their position in the AI chip market, while new entrants like D-Matrix are introducing innovative alternatives to GPU-based chips, aiming to disrupt Nvidia's dominance with cost-effective solutions. Although Nvidia currently holds a commanding position in the market, the intensifying competition could gradually erode its market share and squeeze profit margins over time.
Nvidia's future looks bright
Despite the challenges, Nvidia still stands as a leader in the chip market and remains at the forefront of AI innovation, consistently delivering strong quarterly revenues. Nvidia's future prospects continue to look promising, suggesting that a significant stock bounce may be on the horizon.
Nvidia's data center business, the powerhouse behind its success, is experiencing robust growth, driven by the widespread adoption of AI across various industries. The company also expects strong demand for its upcoming Blackwell chip, which is anticipated to drive substantial revenue in the coming quarters.
Strategically, Nvidia is reinforcing its long-term growth potential through initiatives such as a substantial share buyback programme and a focus on optimising production efficiency. Additionally, the ongoing investments in AI infrastructure by major tech companies further bolster the sustained demand for Nvidia's cutting-edge GPUs.
CEO Jensen Huang remains optimistic about Nvidia's future, highlighting the diverse applications of its chips beyond AI chatbots. He envisions a broader role for GPUs in powering data centres, supporting everything from ad targeting and search engines to robotics and recommendation algorithms.
Innovation remains a cornerstone of Nvidia's strategy. The company has committed to an accelerated release schedule for its AI chip architecture, aiming for annual updates—a significant shift from its previous two-year cadence. This rapid pace of innovation, combined with the introduction of new software designed to deepen the integration of its chips into AI systems, positions Nvidia to maintain its technological edge and outpace the competition.
This move to a one-year release cycle could present a formidable challenge for rivals like AMD and Intel, who currently operate on a slower two-year cycle. While competitors have made strides in performance, Nvidia's accelerated innovation and comprehensive software ecosystem offer a significant competitive advantage.
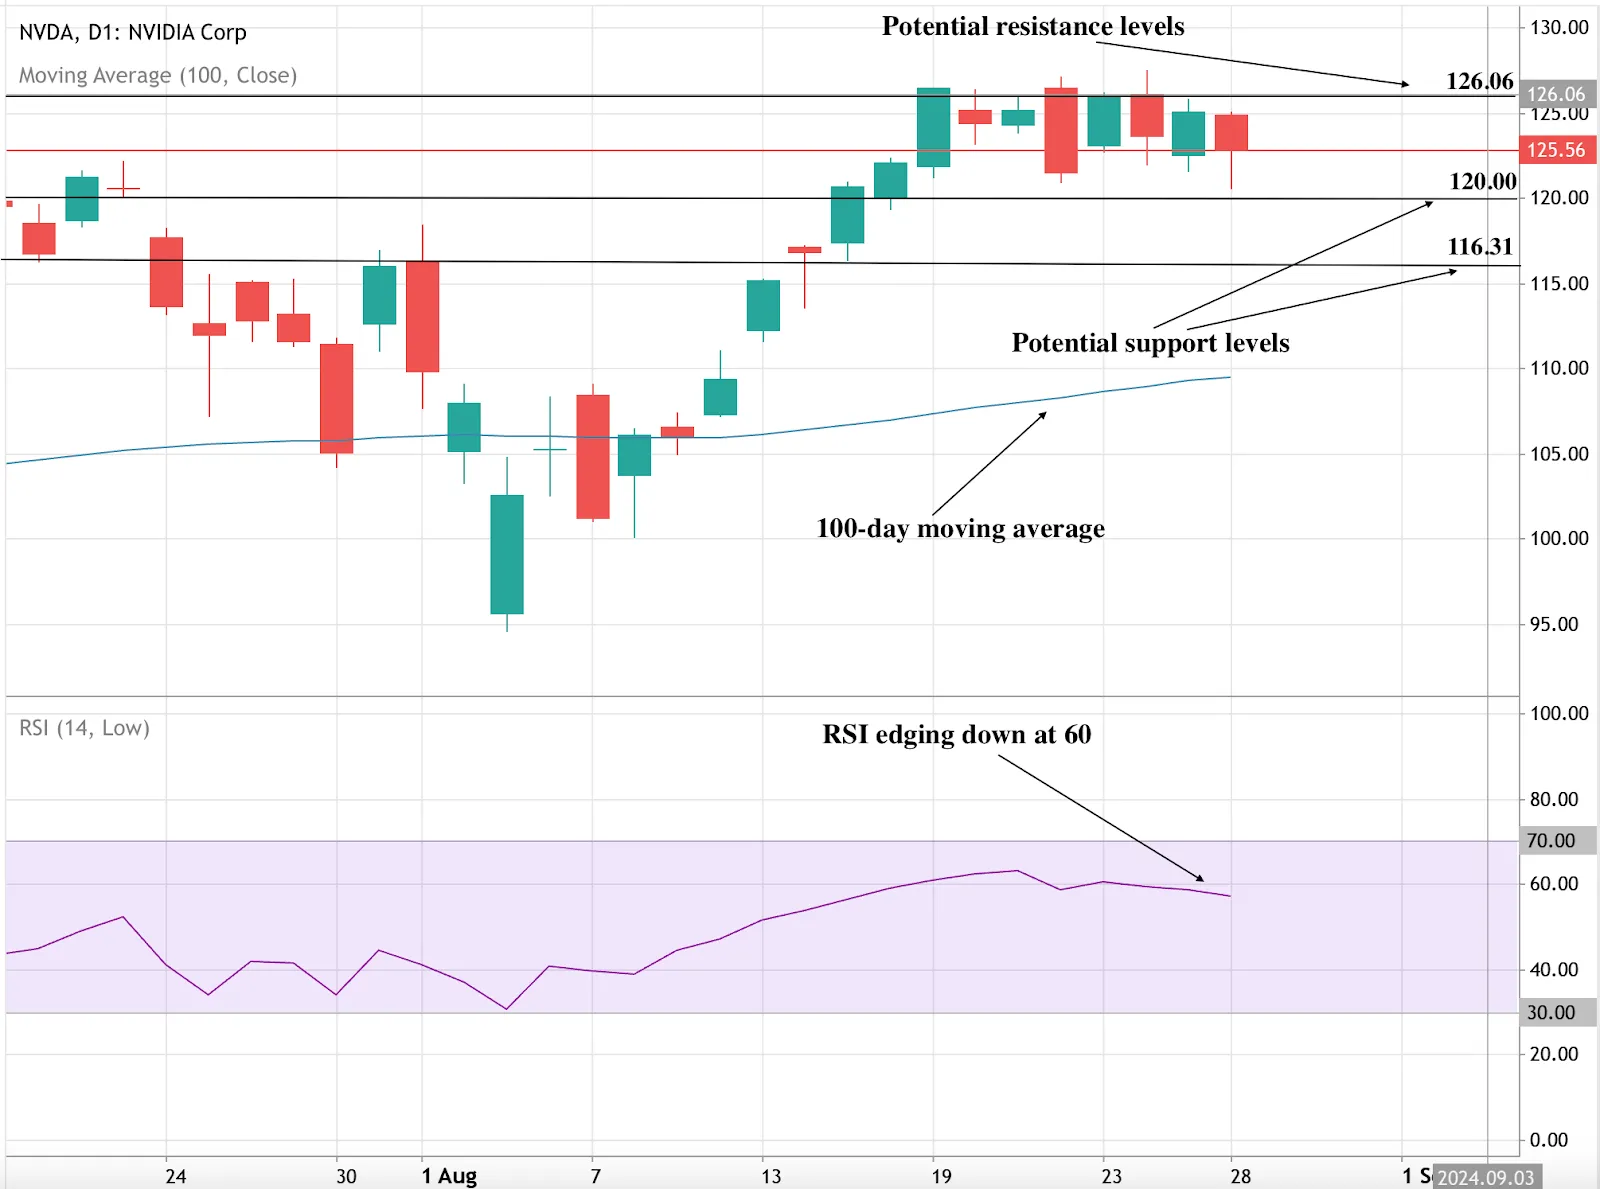
What to watch as Nvidia stock prices slow down?
At the time of writing, Nvidia’s stock is trading around $125.56, having recently moved within a consolidating range. After opening lower, traders will be watching for signs of a rebound as the daily chart continues to show a bullish outlook, with prices remaining well above the 100-day moving average. However, the Relative Strength Index (RSI) is gently declining near 60, indicating a potential slowdown in upward momentum, possibly due to profit-taking.
If Nvidia’s stock manages to push higher, it may encounter resistance at the $126 level. A decisive move past this point could see the price climb towards $130 before facing another potential pause. Conversely, if the stock weakens further, the $120 level may provide some support. Should this level be breached, the next support zone to watch is around $116.31.

Gold’s safe haven status under scrutiny amidst shifting market dynamics
Gold, traditionally viewed as a safe haven during turbulent times, has been experiencing an unexpected downturn in recent days, raising questions about its reliability as a refuge for investors in times of uncertainty.
Gold, traditionally viewed as a safe haven during turbulent times, has been experiencing an unexpected downturn in recent days, raising questions about its reliability as a refuge for investors in times of uncertainty. Despite escalating geopolitical tensions in the Middle East, triggered by the recent conflict between Hezbollah and Israel, gold prices have dipped below $2,400, defying expectations of a potential surge in demand.
A confluence of factors is contributing to this surprising trend. Although the US dollar had previously weakened along with the broader market, it has recently regained strength due to
positive economic data such as the better-than-expected ISM Services PMI. As the dollar regains value, gold becomes more expensive for holders of other currencies. This, coupled with rising US Treasury yields, has attracted investors towards dollar-denominated assets, further diminishing gold’s appeal with the dollar index seeing a significant bounce.

Meanwhile, recovering global stock markets, particularly in Japan and Europe, have boosted investor confidence and risk appetite, leading to a shift away from safe-haven assets like gold towards riskier assets like equities. Even expectations of a potential interest rate cut by the Federal Reserve in September have not been enough to offset these pressures on gold prices.
In the central bank space, comments from Federal Reserve officials, including San Francisco Fed President Mary Daly, hint at a potential reduction in borrowing costs in upcoming meetings. This speculation of a September rate cut could, in the future, support gold prices. However, current market dynamics are dominated by the dollar’s resilience and improved market sentiment.
Geopolitical risks, however, remain a wild card. The escalating conflict in the Middle East could potentially reignite demand for gold if the situation worsens. A conflict escalation could bolster gold’s prospects and even pave the way for reclaiming the $2,400 level. Nevertheless, for now, the interplay of various factors, including the strengthening dollar, rising yields, and recovering markets, continues to shape the gold market, leaving its future trajectory uncertain.
The recent performance of gold serves as a reminder that the dynamics of the precious metals market are complex and influenced by a multitude of factors. While gold has historically served as a safe haven, its appeal is not absolute and can be challenged by shifting market forces.
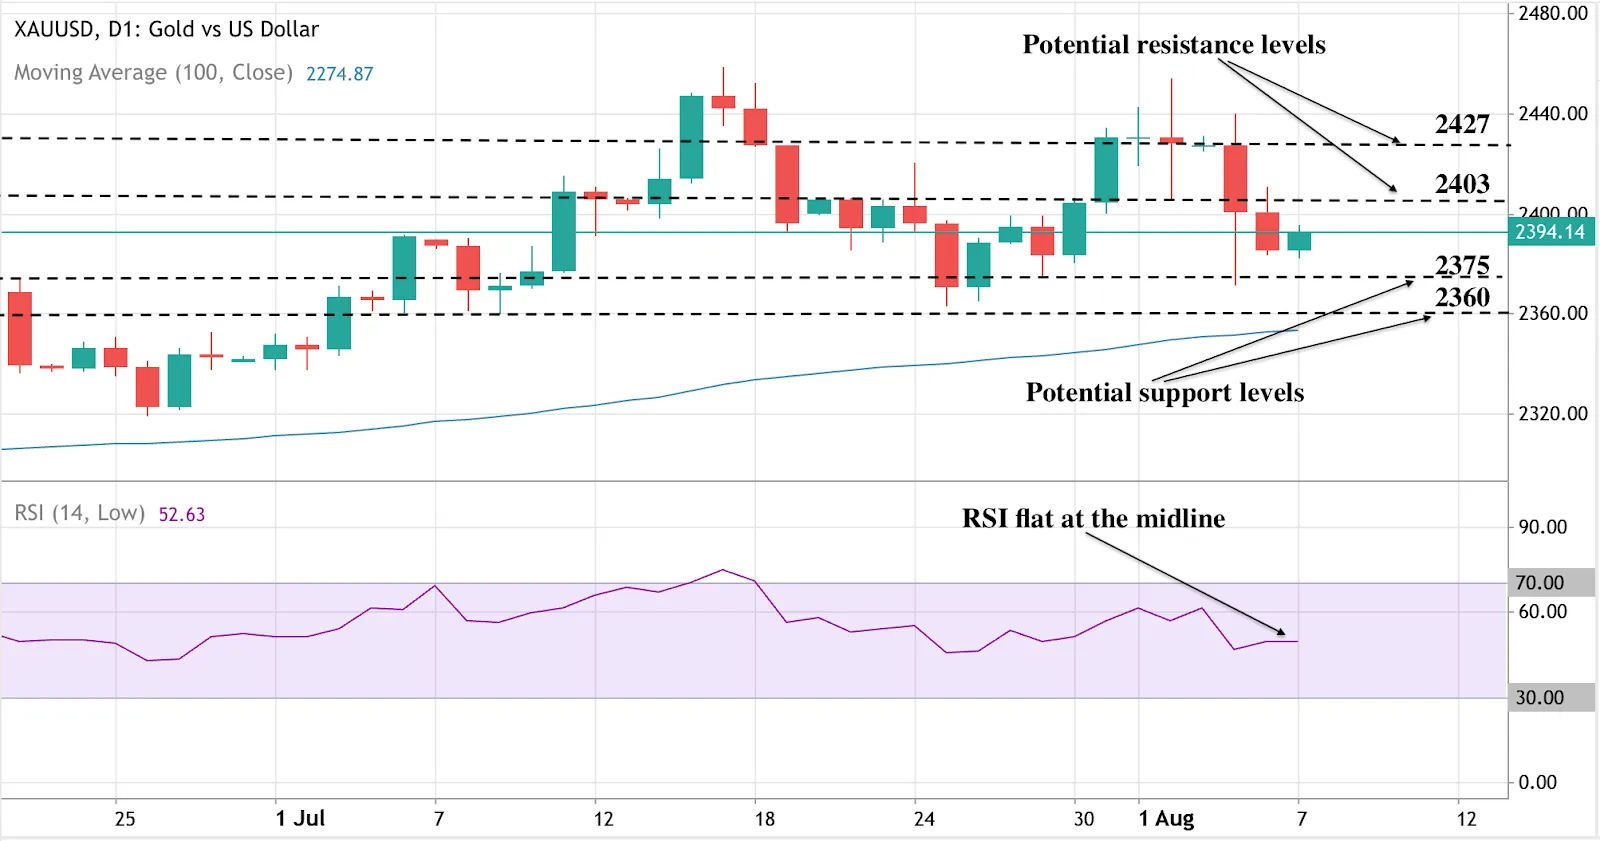
Gold price analysis: Hovers around $2,390
Gold holding below $2,400 could trigger a break below key support levels, potentially pushing prices down to the 3 May low of $2,277. There are indicators that bullish momentum still exists, with prices remaining elevated above the 100-day moving average and upward pressure evident towards $2,400. The RSI flat at the midline, however, hints that momentum could be fading and we could soon see a slowdown.
If the price breaches $2,400, bulls could find resistance at the $2,403 mark before a decisive move past that level is potentially halted at the $2,427 mark. On the downside, sellers could find support at the $2,375 mark, with a further move down likely to be held at the $2,360 psychological support.
As for now, you can get involved and speculate XAUUSD on CFDs with a Deriv MT5 account. It offers a list of technical indicators that can be employed to analyse prices. Log in now to take advantage of the indicators, or sign up for a free demo account. The demo account comes with virtual funds so you can practise analysing trends risk-free.

Introducing Accumulator Options on Deriv Bot – Maximise small market movements
Ever wondered how to turn small market movements into potential gains?
Ever wondered how to turn small market movements into potential gains? Dive into the world of Accumulators on Deriv Bot, an innovative trade type that could revolutionise your automation experience. Accumulators allow you to grow your stake through small gains from minor price fluctuations. They offer potentially high returns with manageable risk limited to your stake. In this article, we’ll break down how you can harness this innovative option to optimise your trading performance, customise your growth rates, and navigate market dynamics like a pro. Ready to explore a smarter way to trade? Let’s get started.
What are Accumulator options?

Accumulators allow you to speculate a view on the range of movement of an index and grow your stake exponentially at a fixed growth rate. They let buyers participate in small movements of an asset’s spot price, offering an opportunity to earn returns based on a chosen growth rate.
Here’s how they work:
- Initial setup: Select a growth rate. This sets two price ranges based on the previous tick of the asset’s spot price.
- Participation: If the asset’s spot price stays within these ranges, your stake grows by the predetermined growth rate. The ranges are recalculated for the next tick based on the current spot price and initial growth rate.
- Compounding: The returns are compounded with each tick, meaning that your payout grows exponentially as long as the spot price remains within the defined ranges.
- Risk of knockout: If the asset’s spot price touches or breaches either range, the Accumulator becomes worthless, and you lose your stake.
Accumulators offer the potential for high returns through compounding, but they also come with significant risk if the price moves outside the predetermined ranges.
Why use Accumulators on Deriv Bot?
- Exponential growth potential: Achieve exponential growth on your stake if the asset’s spot price remains within the predetermined ranges. This compounding effect can enhance returns over multiple ticks.
- Participation in small market movements: Potentially profit from small fluctuations in the asset’s spot price, providing opportunities for gains even in low volatility conditions.
- Customisable growth rate: Choose your desired growth rate for personalised risk management and potential returns tailored to your trading strategies.
How to set up Accumulators to trade on Deriv Bot?
Ready to set up your Accumulators on Deriv Bot? Here’s a step-by-step guide:
Step 1: Access Deriv Bot
- Log in to your Deriv account.
- Navigate to Deriv Bot from the main menu.
Step 2: Set your trading parameters
- Asset: Choose the volatility index you want to trade (e.g., Volatility 10 Index).
- Trade and contract type: Select an option with Accumulators.
- Stake: Decide the initial amount for your Accumulators contract.
- Growth rate: This will determine the size of the price ranges and influence both the potential payout and the risk of the contract being knocked out. For instance, a 5% growth rate means that for each tick (time increment) that the spot price remains within the specified upper and lower ranges, the stake grows by 5%.
- Take profit levels: Decide the amount you want to achieve before closing the contract.
Step 3: Monitor and adjust
The contract continues to grow exponentially as long as the spot price stays within the defined ranges. The value of the contract increases with each tick without breaching the ranges. Keep an eye on the performance and make adjustments for your future trades when necessary.
Tips for using Accumulators on Deriv bot
- Customise stake size: Adjust the stake to manage your risk and trading strategy.
- Set limits: Use reasonable stake sizes, growth rates, and take profit levels to avoid extreme losses or gains.
- Regular review: Regularly review your trade settings and their impact on your trading performance. Adjust them based on your trading goals.
Accumulators are a valuable addition to your trading strategy on Deriv Bot. By adjusting your stakes based on suitable growth rates, you can potentially increase your profits.
Don’t miss out on the benefits of automated trading with Accumulators. Sign up now and elevate your trading experience with Deriv Bot. Start trading smarter today!

Microsoft’s post earnings beat: Can the Cloud giant deliver on its AI ambitions?
Microsoft’s stock experienced a surprising 7% drop in after-hours trading following its fiscal fourth quarter 2024 earnings report.
Microsoft’s stock experienced a surprising 7% drop in after-hours trading following its fiscal fourth quarter 2024 earnings report. This downturn came despite the company surpassing analysts’ estimates for both earnings per share (EPS) and revenue. The culprit? A miss on cloud revenue expectations, particularly within the Microsoft Azure segment.
Earnings report
- Earnings per share (EPS): Microsoft EPS was reported at $2.95, beating analysts’ expectations of $2.94.
- Revenue: The company posted $64.7 billion in revenue, exceeding the anticipated $64.5 billion.
- Microsoft’s net profit : Net profit was $22.04 billion, or $2.69 per share, up from $20.08 billion, or $2.69 per share, in the year-ago quarter.
This stumble in the cloud arena, a key growth driver for Microsoft, triggered concerns among investors and sent ripples through the AI sector, with other AI-heavy companies like Meta experiencing a similar drop in after-hours trading.
Pockets of strength: Microsoft productivity and business processes
Despite the cloud concerns, Microsoft’s Q4 report wasn’t all doom and gloom. The company’s overall revenue grew 21% year-over-year, fueled partly by the growing demand for AI services, which contributed a significant 8 percentage points to Azure’s 29% growth. Additionally, GitHub, Microsoft’s subsidiary for software development, reached an impressive annual revenue run rate exceeding $2 billion, showcasing its robust growth.
Microsoft’s Productivity and Business Processes unit, home to Office software and LinkedIn, also exceeded expectations with an 11% revenue growth. Similarly, the More Personal Computing unit, encompassing Windows, gaming, devices, and search advertising, outperformed forecasts with a 14% increase in revenue. These successes highlight the resilience of Microsoft’s diverse portfolio.
Competition and future outlook on Microsoft cloud growth
The mixed report inevitably sparked comparisons with competitor Alphabet, which recently announced its own cloud revenue uptick driven by AI products. However, unlike Microsoft, Alphabet did not quantify AI’s precise impact, leaving analysts to speculate that significant revenue benefits from AI investments may not materialise until the first half of 2025.
Despite the challenges, Microsoft remains optimistic. The company expects accelerated cloud growth in the first half of fiscal 2025 and continues to invest heavily in AI capabilities and infrastructure. Microsoft executives emphasised their confidence in the company’s ability to meet the escalating demand for AI services, although capacity constraints for Azure AI remain a challenge in the near term.
As Microsoft navigates the rapidly evolving AI landscape and grapples with capacity constraints, the question remains, will the company achieve its ambitious goals for FY25?
With its robust portfolio of products and services, its aggressive investments in AI, and its optimistic outlook, Microsoft is certainly positioning itself for success. However, the cloud revenue miss serves as a reminder that the path to AI-powered growth may not be without some knocks and bumps. As the tech giant continues to scale its AI infrastructure and fine-tune its strategy, the coming quarters will be critical in determining whether it can fully capitalise on the AI revolution and deliver on its promises.
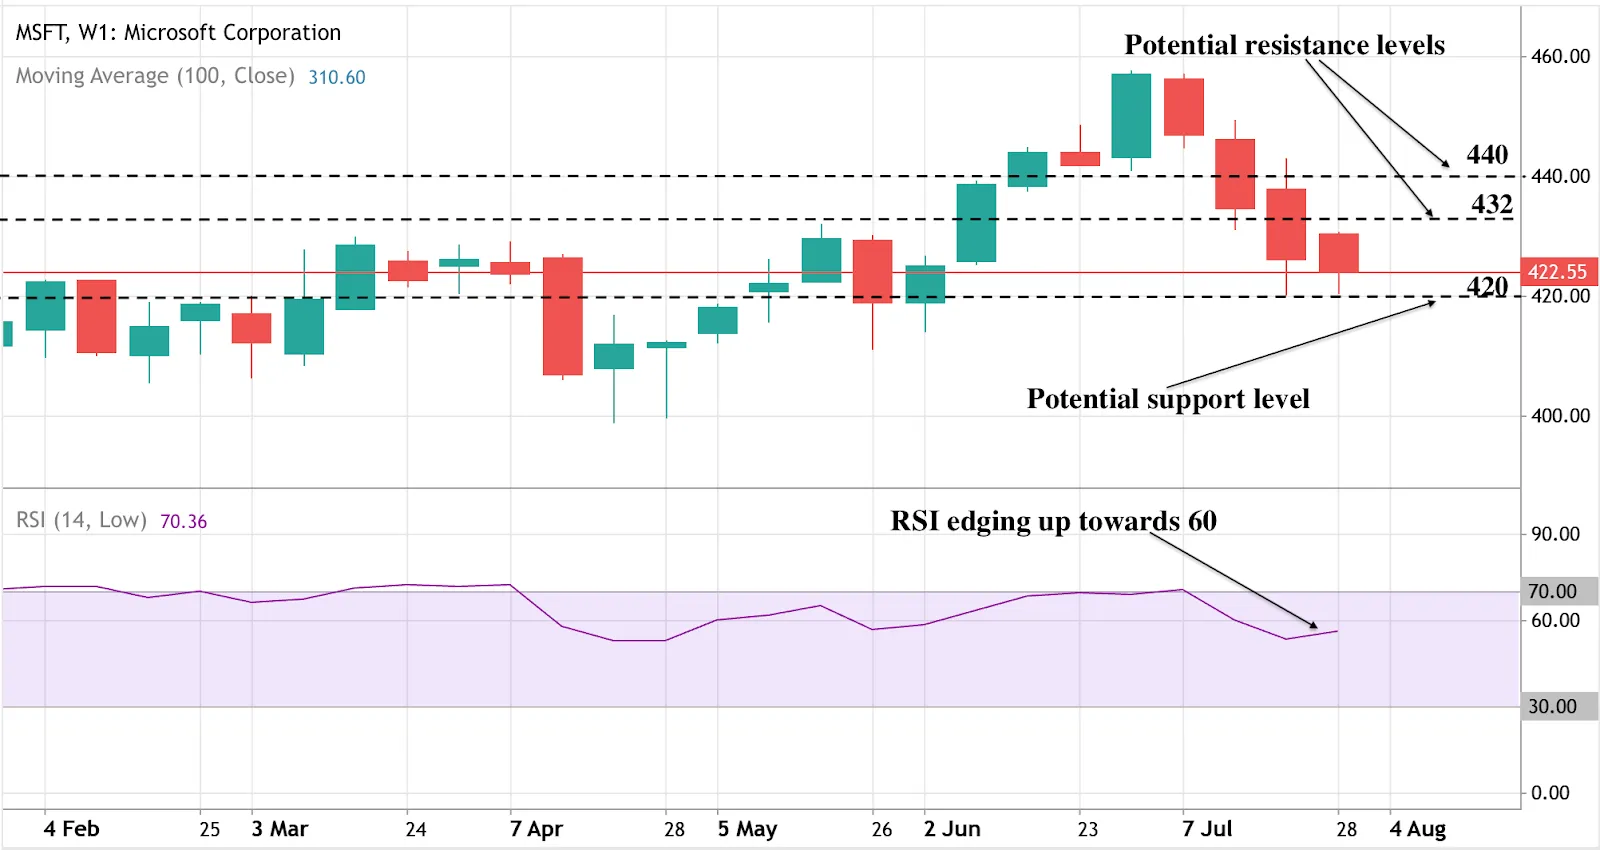
MSFT technical outlook: Poised for a rebound?
With several tech stocks experiencing drawdowns at the moment, we could see some more selloffs in what AJ Bell analyst Dan Coatsworth referred to as a “necessary correction”.
At the time of writing, MSFT stock appears to be edging down around the $422 mark. A further move down could find support at the $420 support level. On the upside, buyers could find resistance at the $432 mark, with a further upward movement potentially facing a more significant challenge at the psychological $440 level.
Technicals indicate some downward bias with prices remaining below the 100 EMA, while the RSI edging down from the 70 level suggests a shift from overbought conditions, signalling a potential period of consolidation or a mild pullback.
As for now, you can get involved and speculate on CFDs with a Deriv MT5 account. It offers a list of technical indicators that can be employed to analyse prices. Log in now to take advantage of the indicators, or sign up for a free demo account. The demo account comes with virtual funds so you can practise analysing trends risk-free.
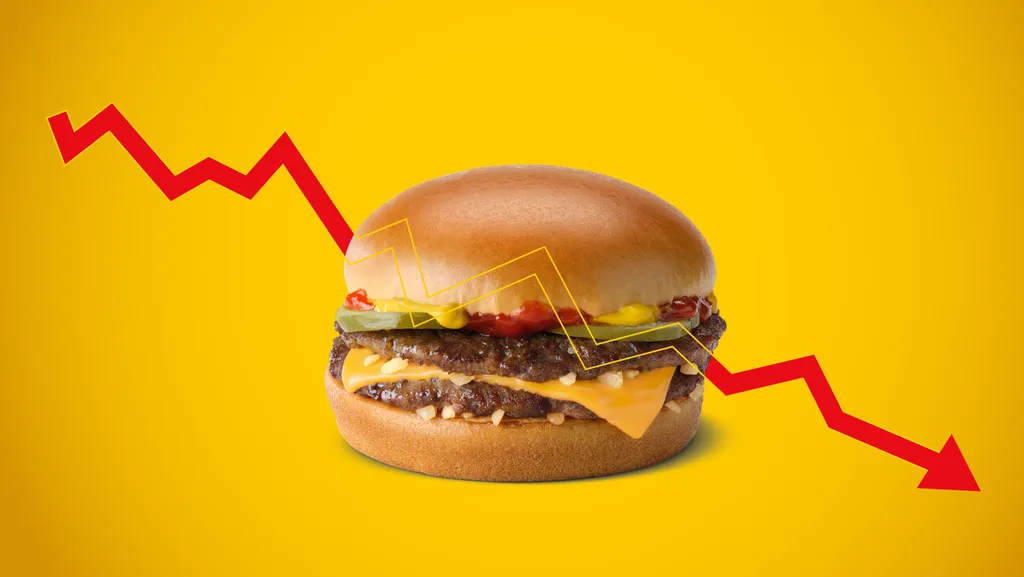
McDonald’s share price: Will value meals inspire a turnaround?
McDonald’s (MCD.N) recently reported its Q2 earnings, revealing a surprising decline in global sales, marking its first drop since the fourth quarter of 2020.
McDonald’s (MCD.N) recently reported its Q2 earnings, revealing a surprising decline in global sales, marking its first drop since the fourth quarter of 2020. As the fast-food giant faces mounting pressures from inflation and shifting consumer behaviours, the company’s strategic response, particularly its value meal promotions, will be crucial in navigating these challenges.
Earnings report highlights
- Earnings per Share (EPS): McDonald’s reported an adjusted EPS of $2.97, falling short of analysts’ expectations of $3.07.
- Revenue: The company posted $6.49 billion in revenue, slightly below the anticipated $6.61 billion but still marking a 1% increase from the previous year.
- Net Income: Net income stood at $2.02 billion, or $2.80 per share, down from $2.31 billion, or $3.15 per share, a year earlier.
McDonald’s sales slump and regional challenges
The quarter saw McDonald’s face significant challenges in its sales performance across various regions. Global comparable sales fell by 1%, a notable miss against the expected 0.5% growth. In the U.S., comparable sales decreased by 0.7%, a stark contrast to the robust 10.3% growth reported in the same quarter last year. This decline in the U.S. market is particularly concerning given the previous year’s success, largely attributed to popular promotions such as the Grimace Birthday Meal.
Internationally, McDonald’s also experienced a downturn. Sales in its international markets division dropped by 1.1%, with France emerging as a particularly weak spot. The company attributed part of this decline to increased pricing competition and consumer boycotts linked to the ongoing conflict in Gaza. Furthermore, sales in China and the Middle East, part of the company’s international developmental licensed markets, fell by 1.3%. This segment struggled with a slower-than-expected recovery in China and the adverse impacts of regional conflicts, which compounded the challenges in maintaining sales growth.
Strategic shifts and McDonald’s value meal strategy
Amidst these financial pressures, McDonald’s has leaned heavily on its value meal strategy to attract budget-conscious consumers. The $5 value meal promotion, launched in late June, has shown promising early results, prompting the company to extend the promotion beyond its initial four-week schedule into August.
Chris Kempczinski, McDonald’s CEO, highlighted the increasing trend of consumers becoming “very discriminating” due to economic pressures, stating, “Consumer sentiment in most of our major markets remains low.” This sentiment was echoed by Edward Jones analyst Brian Yarbrough, who noted a significant decline in visits from lower-income consumers, affecting overall sales.
Analyst perspectives on Mcdonald’s share price
Despite the challenges, analysts remain cautiously optimistic about McDonald’s. UBS analysts, while adjusting their price target from $335 to $305 due to inflation’s impact on Q2 earnings, maintain a “buy” rating, anticipating improved performance in the latter half of the year fueled by value promotions.”
Baird analysts also expressed confidence in McDonald’s value-focused advertising strategy, believing it will improve consumer perception and drive traffic back to stores. “History suggests McDonald’s can gain significant share when emphasising value-oriented price points with its substantial advertising budget,” the Baird analysts noted.
McDonald’s remains optimistic about its strategic shifts, maintaining its capital expenditure budget of up to $2.7 billion, with a significant portion allocated to opening new restaurants domestically and internationally. Brian Mulberry, client portfolio manager at Zacks Investment Management, is hopeful about the future, stating, “Even though things are soft now, they should be getting better in the back half of the year with better value on the menu.”
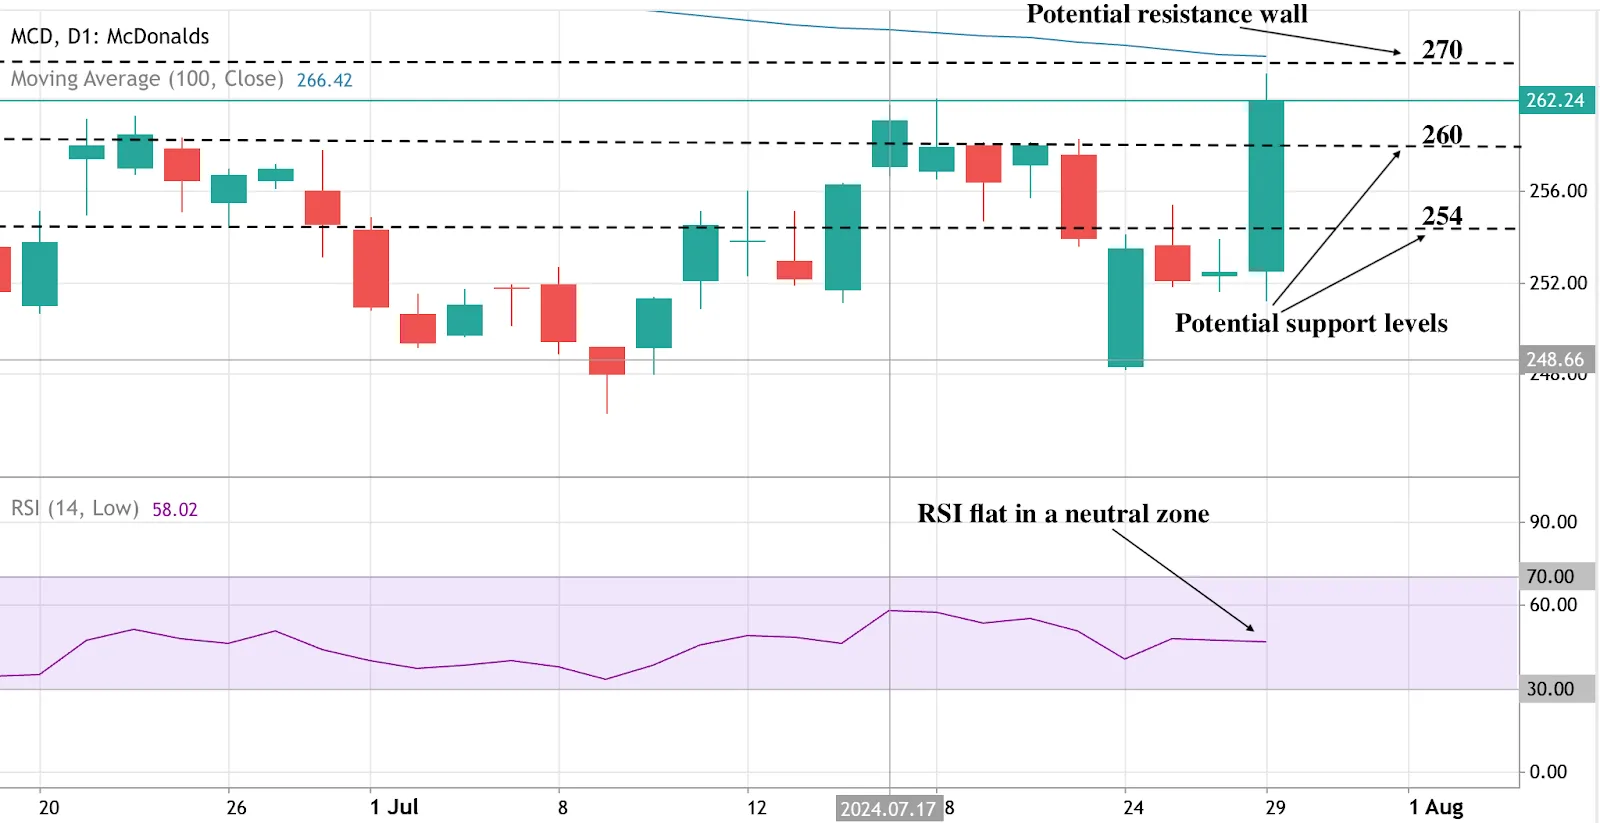
Technical outlook for Mcdonald’s stock price
At the time of writing, MCD is hovering around the $262 mark, a level that has acted as resistance three times since early June. If the price breaks above this level, buyers could face a hurdle at the 100-EMA, around $270. On the downside, the $260 level serves as psychological support. If the price continues to decline, a more significant support level is likely around $254.
Prices remain below the 100 EMA, indicating that sellers are present despite some recent strong green bars. However, the RSI is flat in a neutral zone, suggesting that selling pressure is gradually easing.
McDonald’s Q2 earnings impact
McDonald’s Q2 earnings report underscores the significant impact of inflation and changing consumer behaviours on its financial performance. The company’s strategic focus on value meals and selective price increases aims to counter these pressures and attract more customers. As McDonald’s navigates these turbulent times, its ability to adapt and innovate will be key to driving a turnaround in the coming quarters.
As for now, you can get involved and speculate on CFDs with a Deriv MT5 account. It offers a list of technical indicators that can be employed to analyse prices. Log in now to take advantage of the indicators, or sign up for a free demo account. The demo account comes with virtual funds so you can practise analysing trends risk-free.

Strong debut for Spot Ethereum ETFs: A step forward after SEC ETF approval
The newly launched spot Ethereum (ETH) exchange-traded funds (ETFs) made a significant impact on their first trading day, signalling another milestone for cryptocurrency’s mainstream acceptance.
The newly launched spot Ethereum (ETH) exchange-traded funds (ETFs) made a significant impact on their first trading day, signalling another milestone for cryptocurrency’s mainstream acceptance. According to Bloomberg, these ETFs saw nearly $600 million in trading volume during the first half of the day and closed with over $1 billion worth of shares traded, demonstrating strong investor interest.
Ethereum ETFs performance after launch
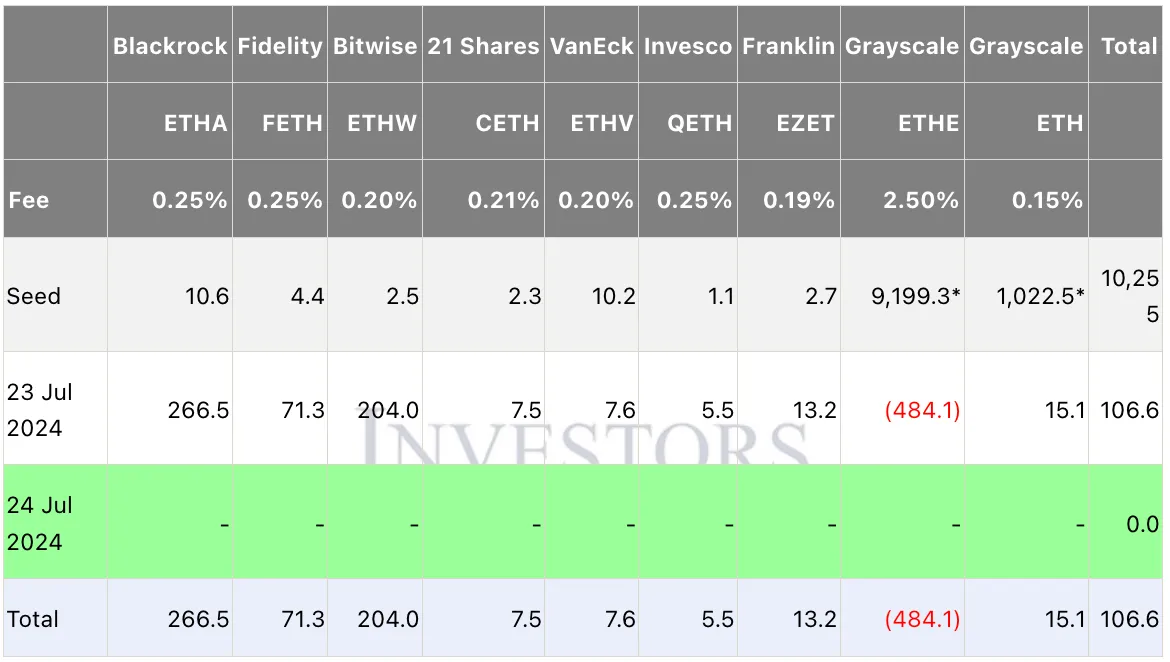
BlackRock’s iShares Ethereum Trust ETF (ETHA) emerged as the ETF frontrunners, with $266.5 million worth of shares traded. This was followed by Bitwise’s Ethereum ETF (ETHW) at $204 million. Fidelity Ethereum Fund ETF (FETH) also performed well, with $71.3 million in trade volume.
Understanding the numbers
Eric Balchunas, a senior ETF analyst at Bloomberg Intelligence, noted that the high trading volume for Grayscale’s ETHE might be largely due to outflows, as it entered the market with over $9 billion in assets. This mirrors the strategy seen with Grayscale’s Bitcoin Trust (GBTC), indicating significant investor activity focused on repositioning assets.
On the lower end, ETFs from Invesco and 21 Shares struggled to reach the $10 million mark in trading volume within the first four hours, highlighting a varied landscape of investor interest.
ETH spot ETF analyst projections
James Seyffart, another analyst from Bloomberg Intelligence,also made his ETH ETFs projections, predicting they could reach around $940 million in trading volume by the end of the first day (a figure that has now been surpassed). While impressive, that figure was only about 20% of the volume that spot Bitcoin ETFs saw on their debut day. Analysts have long anticipated that Ethereum ETFs would attract less interest than Bitcoin ETFs, attributing this to factors such as lower name recognition and the inability to stake the cryptocurrency through these funds.
Markus Thielen, founder of 10x Research, emphasised the importance of the funding rate in this context. When Bitcoin ETFs launched, Bitcoin’s funding rate was around 15% and surged to 70% in February, attracting institutional arbitrage funds that bought ETFs and shorted futures to profit from the spread. This activity drove a bullish sentiment. In contrast, Ethereum’s current funding rate is significantly lower at 7% to 9%, which, combined with current interest rates at 5%, makes it less attractive for similar arbitrage investments.
A significant milestone for the crypto market
Despite these challenges, analysts foresee the launch of spot Ethereum ETFs marks a significant step forward for the cryptocurrency market. It enhances the market’s legitimacy and contributes to its stability. Cristiano Ventricelli, senior analyst of digital assets at Moody’s Ratings, highlighted that these ETFs would help reduce volatility and provide a more stable investment environment.
Grzegorz Drozdz, a market analyst at investment firm Conotoxia Ltd., noted that while the inflows might not match those of Bitcoin ETFs, the introduction of Ethereum ETFs represents crucial progress in developing the cryptocurrency market . This sentiment was echoed by many industry experts who view the classification of ether as a commodity—rather than a security—as a positive development especially for etf trading.
According to experts, the long-term success of Ethereum ETFs could hinge on various factors, including investor demand and regulatory developments. Matteo Greco, research analyst at Fineqia International, pointed out that the demand for these ETFs would be essential in gauging investor appetite for digital assets beyond Bitcoin.
Analysts also note that one major issue for potential traders is the SEC’s exclusion of the staking mechanism in these ETFs — a critical feature of the Ethereum blockchain that allows users to lock up their tokens for a certain period to earn a yield. As currently constructed, the ETFs can only hold regular, unstaked ether, which may limit their appeal.
The approval process for these ETFs began in September, with issuers initially uncertain about SEC approval. However, the agency’s unexpected decision in May, influenced by a court ruling in favour of Grayscale, paved the way for these products. SEC Chair Gary Gensler mentioned that the ruling had impacted his thinking regarding the approval of Ethereum ETFs, noting similar underlying market conditions.
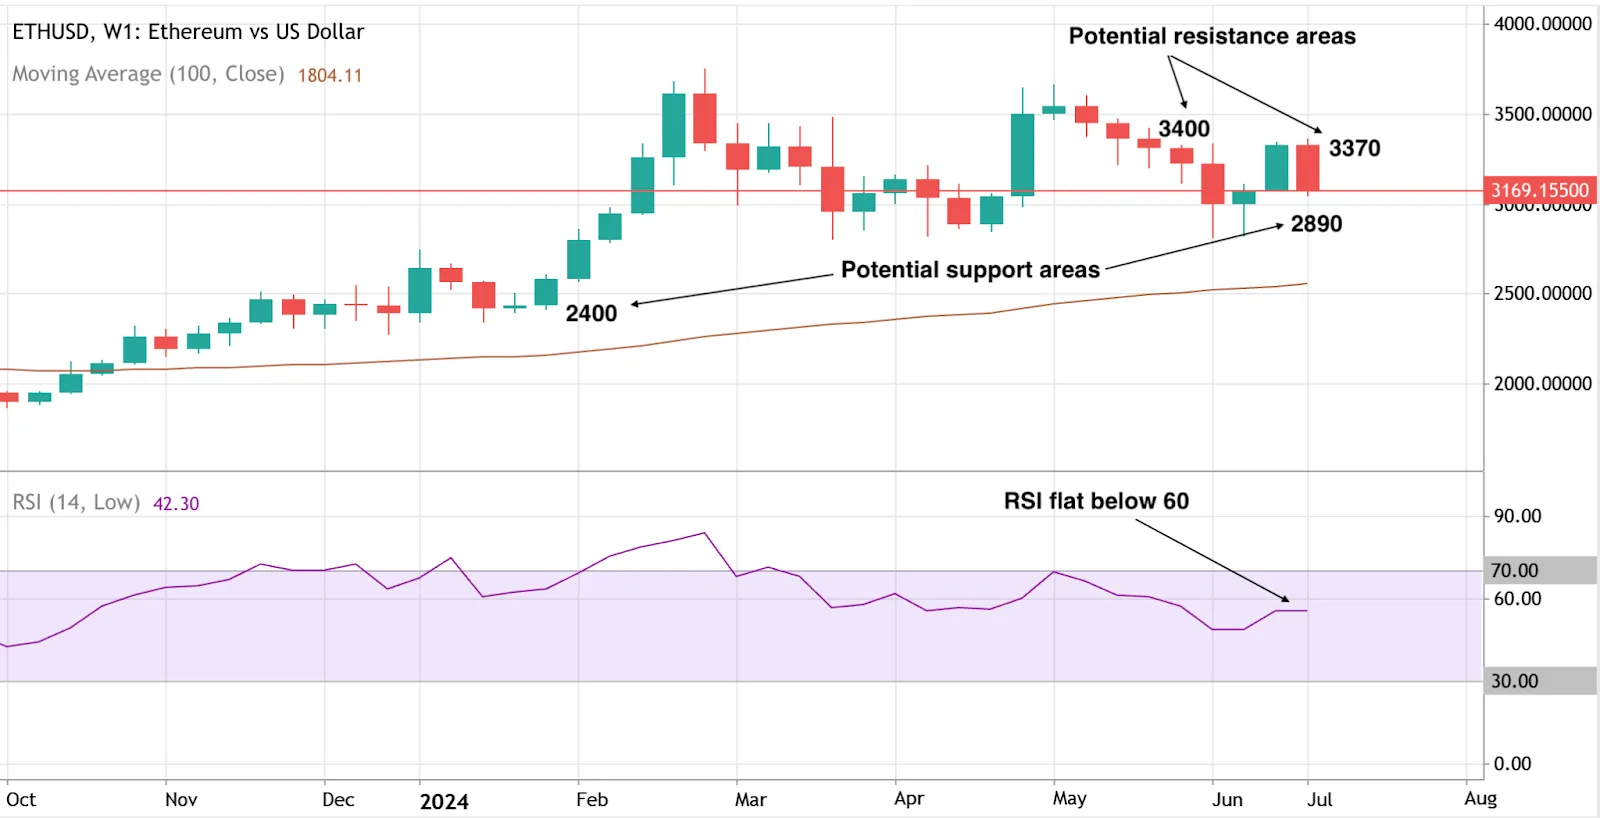
Technical outlook for ETH/USD: Could a rebound be in the offing?
At the time of writing, sellers appear to be vying for control as ETH/USD prices hover around the $3,170 mark. The weekly chart shows that bulls remain active, with prices still above the 100 EMA. The RSI is flat, just below 60, suggesting that the bullish pressure observed in previous weeks could be pausing. Sellers may find support at the $2,890 psychological level, an area that has held before, as seen on the weekly chart, with a significant drop likely finding support at the $2,400 mark. Conversely, a rebound could face resistance at $3,370, with further upward movement likely capped at $3,400.
Spot ETF approval: A step in the right direction
Investors and traders alike note that the debut of spot Ethereum ETFs represents a critical advancement for the cryptocurrency market, underscoring the growing acceptance and integration of digital assets into mainstream financial markets. While they may not replicate the immediate success of Bitcoin ETFs, these products signify an important step in the evolution and legitimacy of the cryptocurrency industry. As the market continues to develop, the performance and adoption of these ETFs will be closely watched by investors and analysts alike.
As for now, you can get involved and speculate on CFDs with a Deriv MT5 account. It offers a list of technical indicators that can be employed to analyse prices. Log in now to take advantage of the indicators, or sign up for a free demo account. The demo account comes with virtual funds so you can practise analysing trends risk-free.
Sorry, we couldn’t find any results matching .
Search tips:
- Check your spelling and try again
- Try another keyword