Results for

2025 Ripple XRP price prediction: What lies ahead?
Ripple Labs, the driving force behind XRP, stands on the precipice of what could be its most transformative year yet.
Ripple Labs, the driving force behind XRP, stands on the precipice of what could be its most transformative year yet. The dawn of 2025 brings with it an air of cautious optimism for Ripple, fueled by shifting regulatory dynamics and bold strategic moves. Could this year mark a turning point for Ripple and its cryptocurrency?
A new dawn in cryptocurrency regulation
The election of President Donald Trump has sparked speculation about a more crypto-friendly regulatory environment in the United States. For Ripple, this potential shift comes as a welcome change following years of navigating stringent measures under the previous administration. The anticipated appointment of Paul Atkins as SEC Chair has further stoked hopes of clearer guidelines and reduced enforcement actions against blockchain companies.
Ripple’s leadership has shown signs of renewed confidence. CEO Brad Garlinghouse’s recent statements underscore a belief that the winds of change may finally align with Ripple’s ambitions. The company’s proactive engagement with policymakers signals its intent to play a significant role in shaping the future of crypto regulation.
Ripple’s 2025 strategic moves
Beyond regulatory shifts, Ripple has been laying the groundwork for sustained growth. The launch of RLUSD, a stablecoin pegged to the U.S. Dollar, marks a significant milestone. Approved by the New York Department of Financial Services, RLUSD is set to enhance liquidity and expand XRP’s utility within Ripple’s ecosystem. Coupled with acquisitions like Metaco and Standard Custody, Ripple’s investment in tokenisation and custody solutions reflects its vision for the future.
Ripple’s focus on interoperability and tokenisation extends beyond the XRP Ledger. By exploring solutions that enable asset tokenisation across multiple blockchains, Ripple is positioning itself as a leader in the evolving financial landscape. These efforts align with the company’s broader strategy to redefine the role of digital assets in global markets.
XRP’s market performance
XRP has demonstrated resilience amid market fluctuations, with its value rising significantly in recent months. The cryptocurrency’s liquidity and trading volumes have surged, reflecting growing investor interest. Market analysts have noted that this momentum, combined with a favorable regulatory outlook, and alignment with broader cryptocurrency trends could position XRP for further growth in 2025.
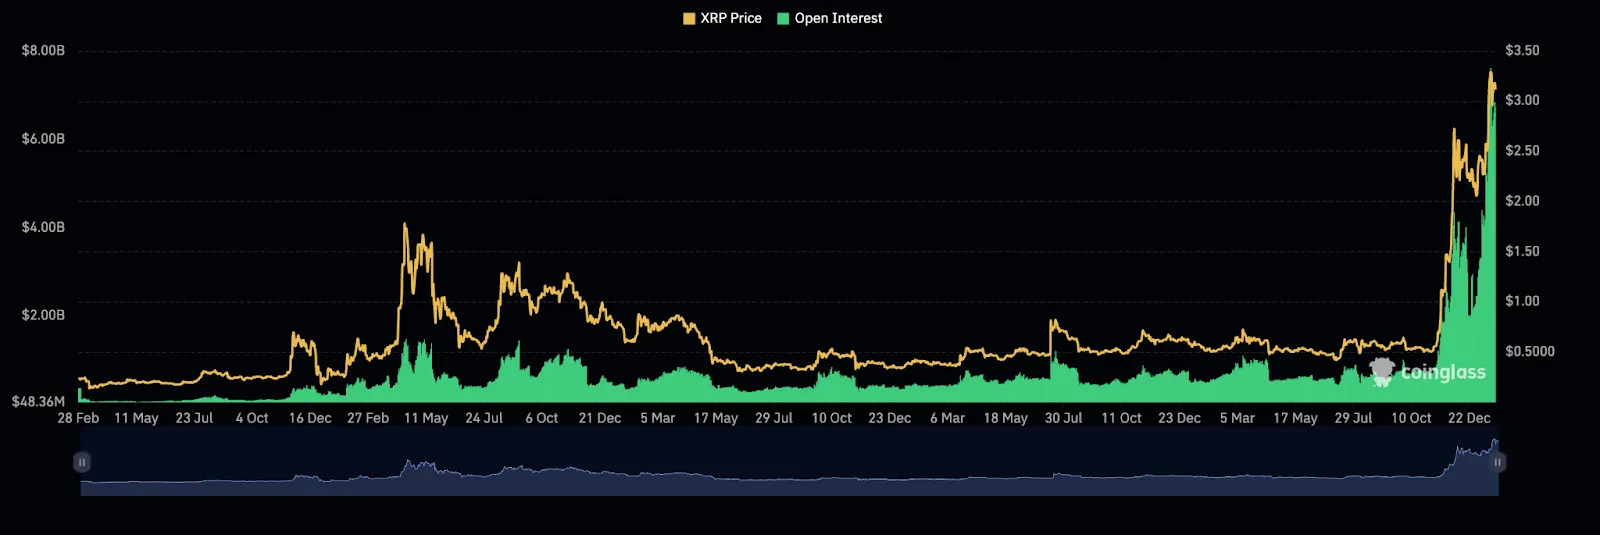
Bolstering this optimistic outlook, XRP’s open interest (OI) has hit an all-time high of $7.9 billion, marking a 27.34% increase over the past 24 hours alone. During the same period, futures volume has doubled to an impressive $42.87 billion, according to CoinGlass data. Since the start of the year, XRP’s open interest has skyrocketed by 300%, climbing from $1.92 billion in early January 2025. Notably, this parabolic rise is not primarily driven by the futures market, as commonly assumed.
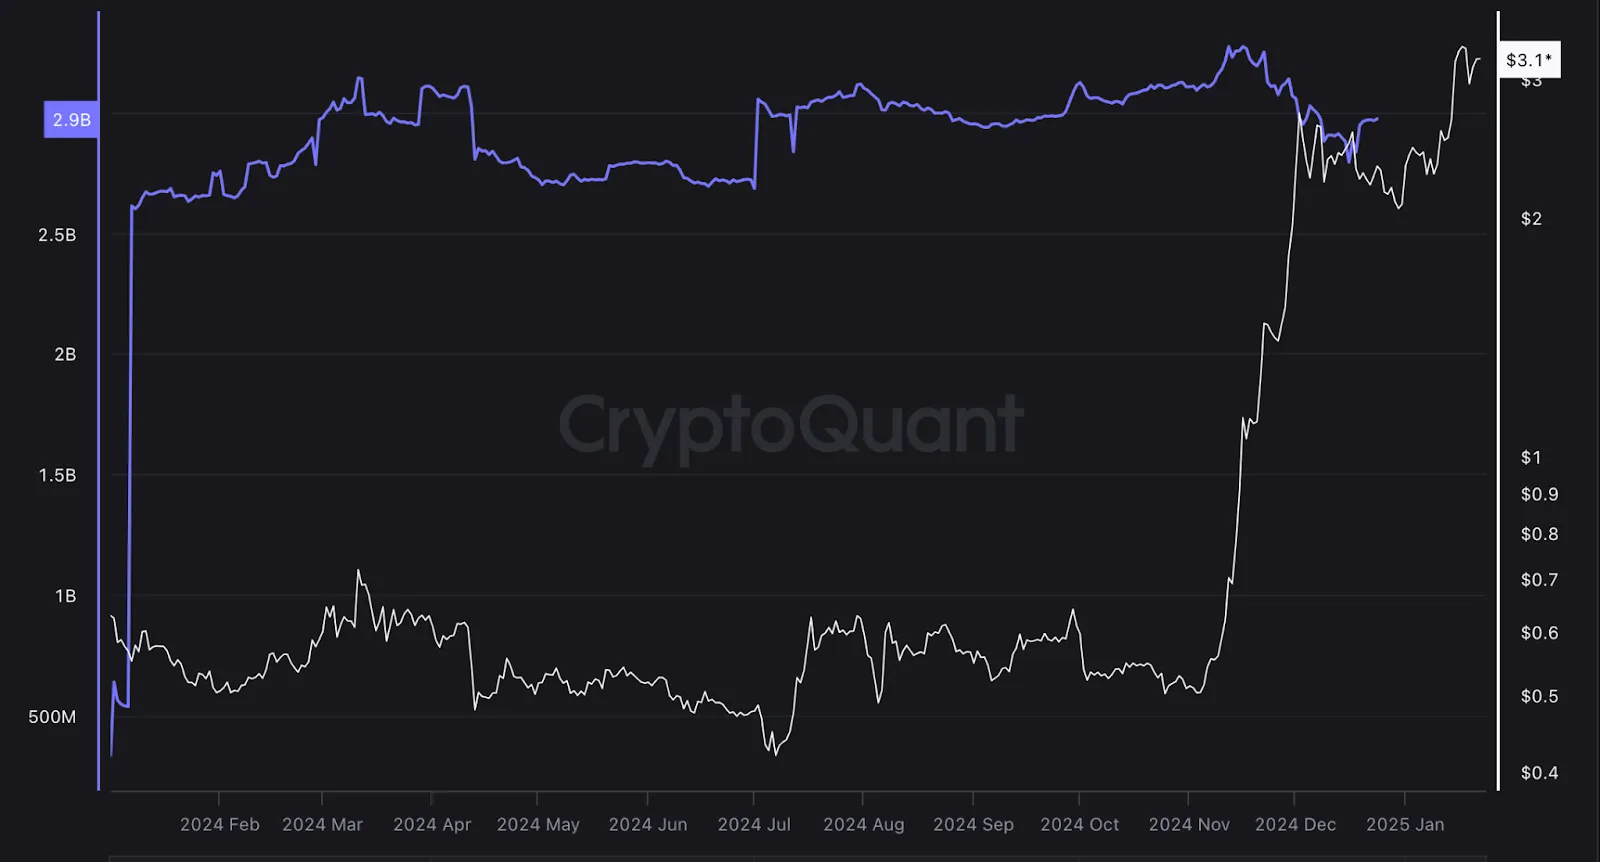
At the same time, XRP’s exchange reserves have undergone significant changes. CryptoQuant data indicates that reserves on Binance have risen by 10% since December 16, reflecting some level of profit-taking among investors. However, these reserves remain below the 2024 yearly average, underscoring continued market optimism.
Additionally, whale activity has surged, with Santiment reporting the highest level of XRP whale transactions in six weeks. Together, these developments signal heightened interest from both institutional and retail investors, further amplifying XRP’s momentum.
Despite these promising signs, Ripple and XRP face a complex and unpredictable environment. The company’s ability to adapt to changing conditions and deliver on its strategic initiatives will play a critical role in shaping its trajectory.
Ripple forecast 2025: Will this year see unprecedented highs?
As 2025 unfolds, Ripple finds itself at a pivotal juncture. The company’s bold moves, coupled with evolving market and regulatory dynamics, present an opportunity to redefine its place in the cryptocurrency ecosystem. While challenges remain, the potential for transformation is undeniable.
Could this be the year Ripple turns its vision into reality? Only time will tell, but the steps taken in the months ahead will undoubtedly shape the company’s future and its impact on the broader digital asset landscape.
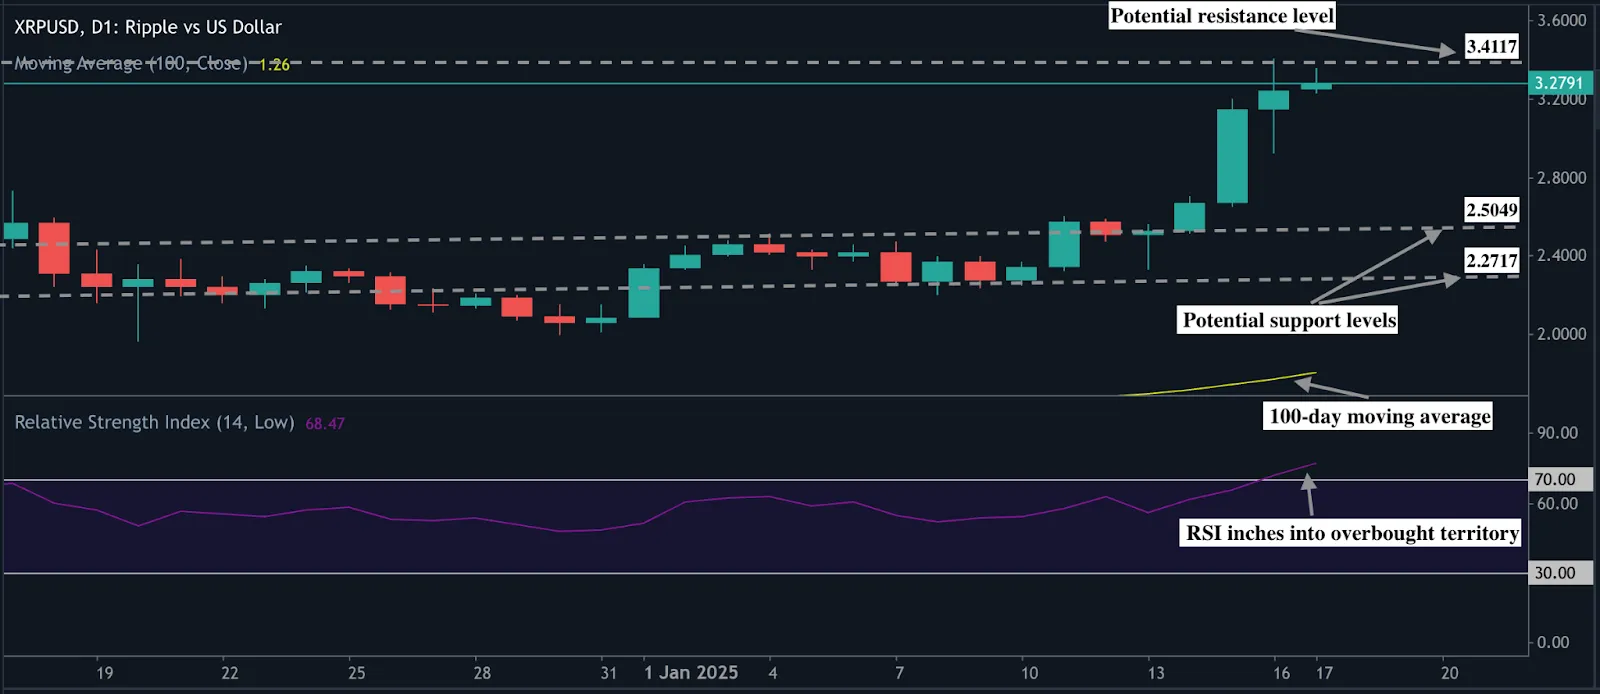
At the time of writing, prices are hovering just above the $3.2700 mark. There is a clear upside bias on the daily chart as bullish candlestick patterns dominate with prices staying above the 100-day moving average. However, RSI towering into overbought territory hints at a potential slowdown in upward momentum.
Buyers could face a hurdle at the $3.4117 mark as they target the $3.6000 price level. On the downside, sellers could be held at the $2.5049 and $2.2717 price levels.
You can get ahead of the curve by speculating on the price of XRP with a Deriv MT5 account. It offers a list of technical indicators that can be employed to analyse prices. Log in now to take advantage of the indicators, or sign up for a free demo account. The demo account comes with virtual funds so you can practise analysing trends risk-free.

Melania and Trump coins now available on Deriv trading platforms
Deriv launches TRU and MLN crypto coins. Discover the hype, market volatility, and how these coins are attracting new investors to the crypto space.
Deriv has made the much hyped TRU and MLN crypto coins available for trading, just days after former President Donald Trump's second inauguration. Named after President Donald Trump and First Lady Melania Trump, these coins are part of the broader wave of Trump-branded crypto ventures that have captured attention and pulled in traders.
Trump coin surge amidst hype and anticipation
Trump has been vocal about his commitment to promoting a "golden age" for digital assets, and these meme-inspired tokens have become part of that narrative. Initially, both coins saw a sharp increase in value, drawing attention from investors eager to capitalize on the excitement. With social media buzz and heightened media coverage, the market responded, pushing the coins to impressive highs. These gains, while not unprecedented in the meme coin world, were certainly noteworthy.
However, as with any high-profile launch, volatility quickly followed. The value of TRU and MLN experienced fluctuations typical of meme coins. While the coins have not crashed completely, some analysts have expressed caution, warning potential investors about the risks of buying into such hype-driven assets.
Analysts caution market volatility of meme coins
While the initial excitement was undeniable, analysts have been quick to point out the risks associated with meme coins like TRU and MLN. These coins, while potentially profitable in the short term, do not carry the same underlying value or investment potential as more established cryptocurrencies. Critics argue that the volatility and speculative nature of meme coins could lead to significant losses for those who do not fully understand the risks involved.
Notably, TRU’s price has already dropped by about 50% from its peak, and MLN has also seen its value fluctuate. Many analysts are cautioning that the hype surrounding these coins may not be sustainable in the long run, and investors should be mindful of the potential for sudden price corrections.
The $Trump frenzy
Despite the cautionary language from analysts, one of the most interesting aspects of the TRU and MLN launch is the influx of new, non-crypto people into the space according to Axios. The meme coin phenomenon has long been known for attracting a diverse range of investors, and the launch of TRU and MLN is no exception. Many of the early buyers are newcomers to the crypto world, drawn in by the excitement surrounding these new coins.
In fact, data from blockchain analytics firm Chainalysis shows that a significant portion of the wallets holding TRU and MLN coins belong to small investors, many of whom are engaging with cryptocurrency for the first time. These buyers are likely motivated by the potential for short-term gains, and their interest could represent a shift in how people view digital assets.

For those new to the space, the initial success of TRU and MLN may offer a glimpse into the broader potential of cryptocurrencies. The ease of entry and the prospect of financial rewards could encourage further exploration into other digital assets, even beyond meme coins.
TRU and MLN coins drive new crypto interest
While the cautionary language around TRU and MLN is well-founded, there are also significant potential benefits for investors, especially those new to the crypto space. For many non-crypto individuals, the opportunity to make money from these coins, even if it’s in small amounts, has been a gateway to understanding the world of digital assets.
The launch of TRU and MLN has significantly raised awareness of cryptocurrency among the general public. Sarah Jones, a well-known crypto enthusiast and educator, noted that even individuals who previously showed little interest in digital assets are now starting to explore the space.
Moreover, the ability to make small profits, with 77% of TRU and MLN holders having earned a small amount, according to Chainalysis-demonstrates that even in a volatile market, there is room for newcomers to experience some success.
While not every buyer will walk away with gains, the education and exposure to cryptocurrency can be a valuable stepping stone for those looking for trading opportunities.
As for now, you can get involved and speculate on the price of these two assets with a Deriv MT5 account or a Deriv X account.

How Deriv’s Tactical Indices help silver traders in volatile markets
Silver’s volatility often reflects sudden shifts in trader sentiment — momentum builds quickly, then reverses just as fast.
Silver’s volatility often reflects sudden shifts in trader sentiment — momentum builds quickly, then reverses just as fast. The Relative Strength Index (RSI) tracks these changes by showing when momentum is stretching or fading. By linking RSI behaviour to automated trading rules, Deriv’s Tactical Indices turn unpredictable swings into structured opportunities, helping traders act consistently rather than react impulsively.
Quick summary
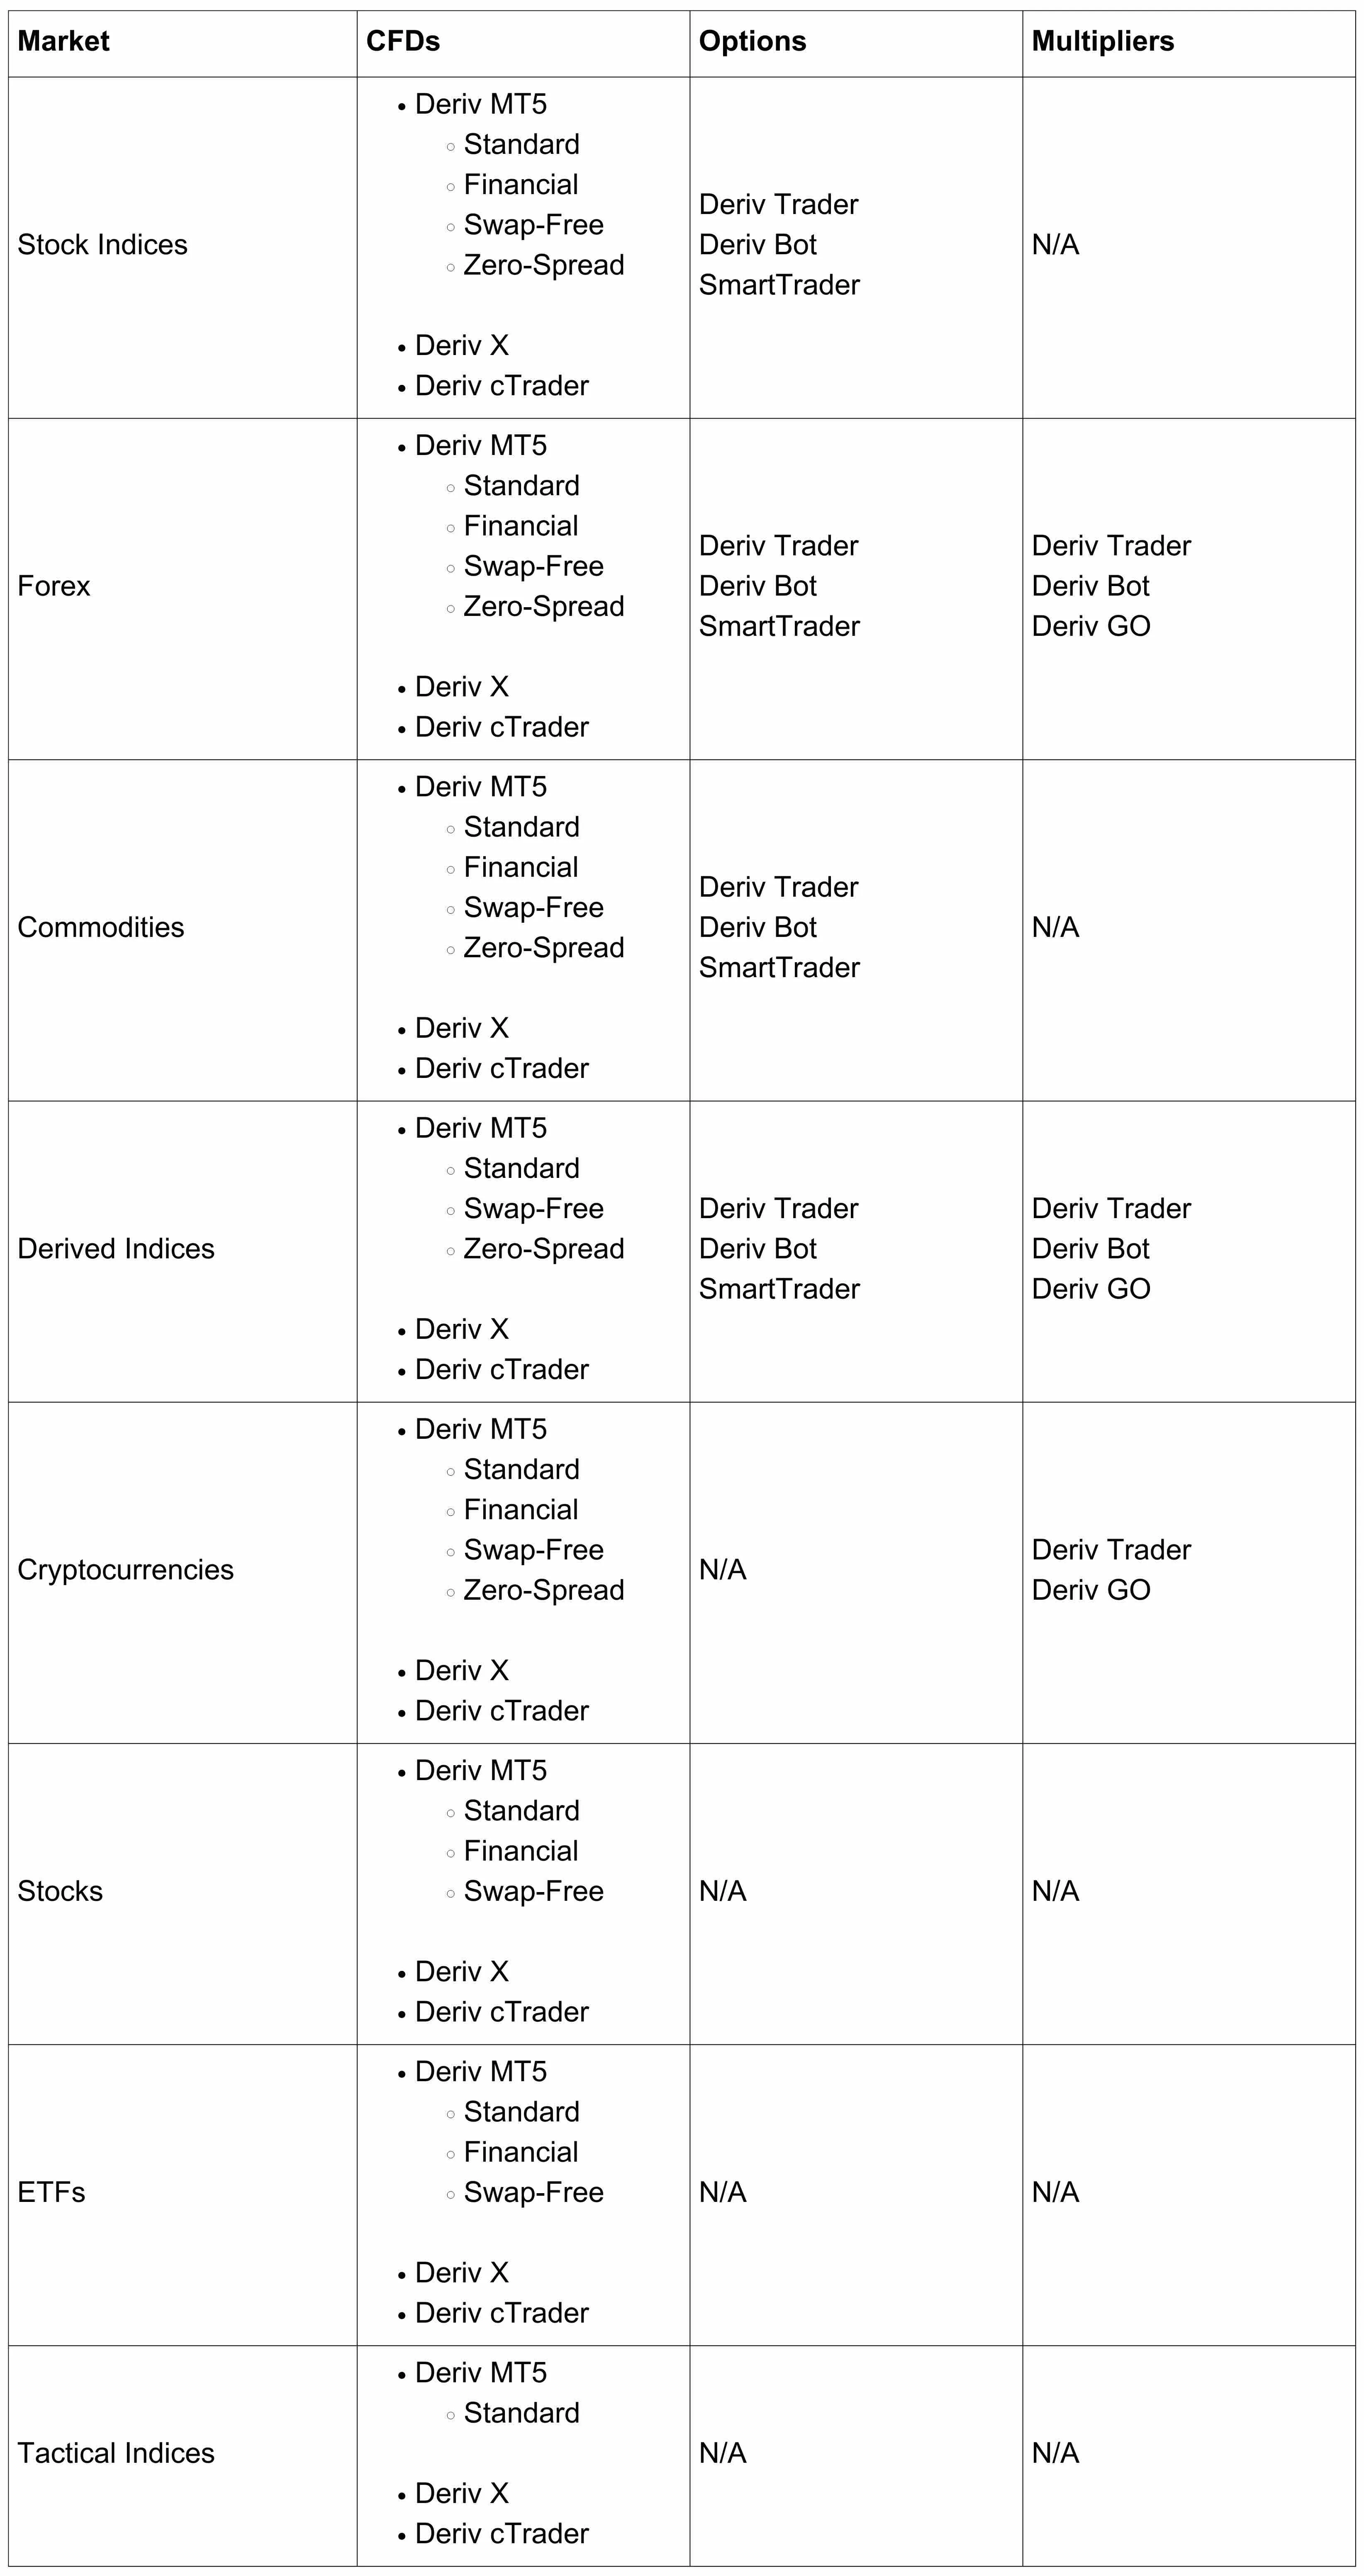
- What Deriv is today: Multi-platform provider (Deriv MT5, Deriv cTrader) with long experience in Derived and Synthetic markets.
- What Tactical Indices do: Four RSI-based strategies — Trend Up, Trend Down, Pullback, Rebound — automate exposure to momentum and reversals.
- Why it matters: Silver’s extreme volatility rewards systematic execution over ad-hoc timing.
- How to start safely: Trade first in demo on Deriv MT5 or Deriv cTrader; go live with position sizing, diversification, and equity caps.
- What’s next (planned): MACD/Bollinger variants, broader assets, and in-platform analytics (drawdowns, Sharpe).
How does an RSI strategy support silver trading in volatile markets?
Silver has repeatedly swung between multi-decade highs and sharp corrections driven by shifting inflation, interest-rate expectations, and global demand.
Reacting fast and consistently is hard; Deriv Tactical Indices automate key RSI-based decisions, allowing traders to engage with silver’s momentum systematically.
What makes Deriv’s RSI trading strategies different from others?
Founded in 1999, Deriv built its reputation on Derived and Synthetic markets available via Deriv MT5 and Deriv cTrader.
Silver’s range expansions and reversions make manual timing unreliable, so Deriv embeds trading rules inside indices, allowing consistent execution without constant chart-watching.
How can automated trading improve silver CFD performance?
Deriv Tactical Indices belong to the Derived Indices family and automate RSI-based signals for silver CFDs. Traders choose an index type and size; the system manages timing, entries, and rebalancing.
Silver often reacts violently to macro triggers such as CPI data, dollar moves, or central-bank news. Manual traders may hesitate under pressure, while automated indices act instantly when RSI confirms a trend or reversal, reducing emotional bias and delay.
This helps traders capture large moves without constant monitoring. Automated execution also maintains discipline, aligns exposure with set risk limits, and supports steadier performance — key benefits for silver CFD trading as volatility persists.
Where do Deriv’s Tactical Indices fit within the Derived Indices family?
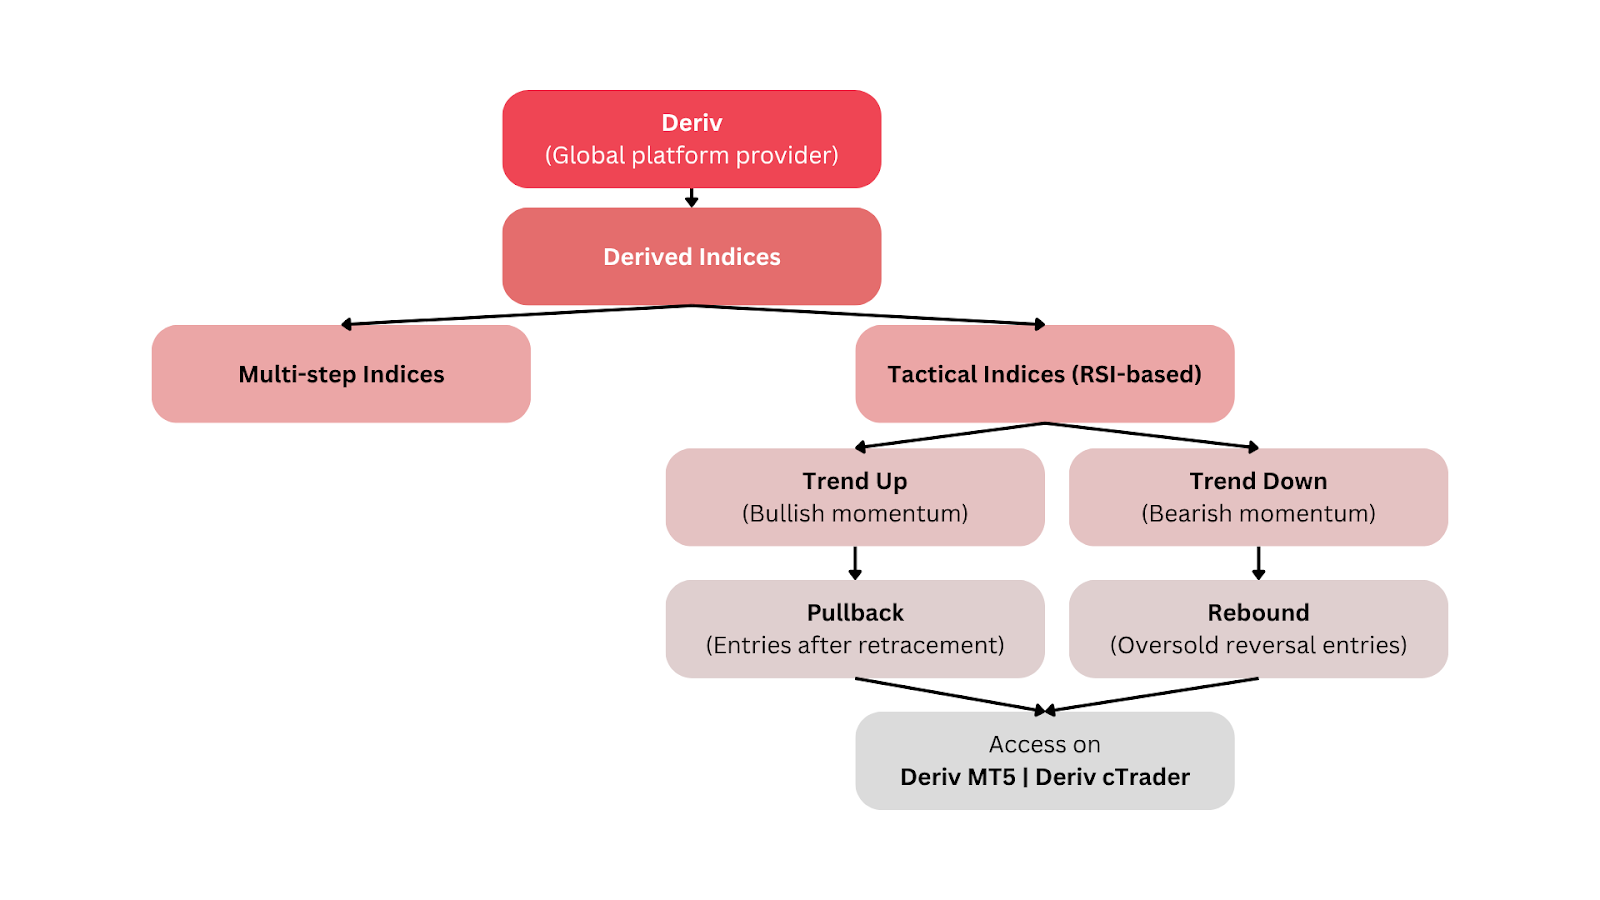
Deriv is the platform provider at the centre of this system. Within Deriv, Derived Indices simulate or mirror real-market behaviour. Tactical Indices are one subset — using RSI rules to automate silver trading decisions.
Available on Deriv MT5 and Deriv cTrader, they include four ready-made types:
- Trend Up – follows bullish momentum
- Trend Down – tracks bearish momentum
- Pullback – buys dips within an uptrend
- Rebound – captures recovery after oversold phases
Together, these tools give traders structured, ready-to-use automation without needing to code strategies.
How does the RSI strategy power each tactical index?
RSI converts recent average gains and losses into a 0–100 oscillator (typical 14 periods). ‘Overbought’ and ‘oversold’ usually sit near 70/30. In strong trends, RSI holds a zone instead of flipping extremes — the basis of Deriv’s indices.
In recent internal testing, Deriv’s strategists found that when silver’s RSI stayed above 50 for three sessions, Trend Up captured a larger share of the next move than discretionary entries.
“This validates disciplined, zone-based engagement over one-off threshold hits.” -Aisha Rahman, Senior Market Strategist
Index behaviours (compressed phrasing for clarity):
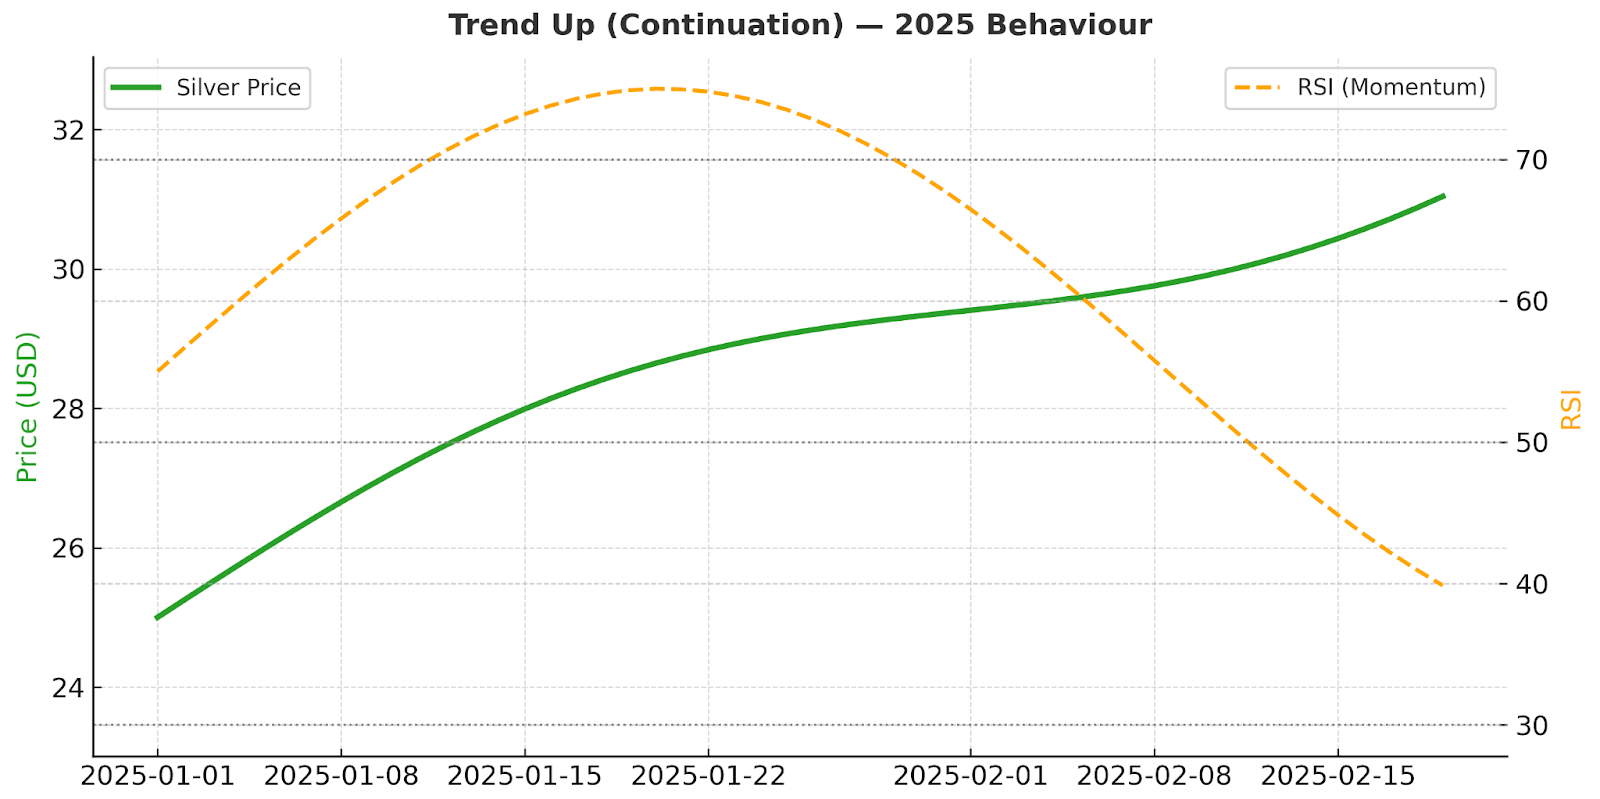
- Trend Up (continuation):
- Signal intent: Upside continuation when RSI >50 → 70 zone persists during bull legs.
- Confirmation: Higher highs/higher lows; pullbacks shallow; RSI dips hold above ~50.
- Hold/scale: Stay engaged while momentum holds; scale down if RSI slips towards ~50 and structure weakens.
- 2025 use: Trend days around CPI/NFP; more fragile in range-bound sessions.
- Trend Down (continuation):
- Signal intent: Downside continuation when RSI <50 → 30 zone persists in risk-off bursts.
- Confirmation: Lower highs/lower lows; failed rallies capped below ~50 RSI.
- Hold/cover: Maintain short until RSI reclaims ~50 with price strength.
- 2025 use: Dollar strength spikes, real-rate jumps, position de-risking.

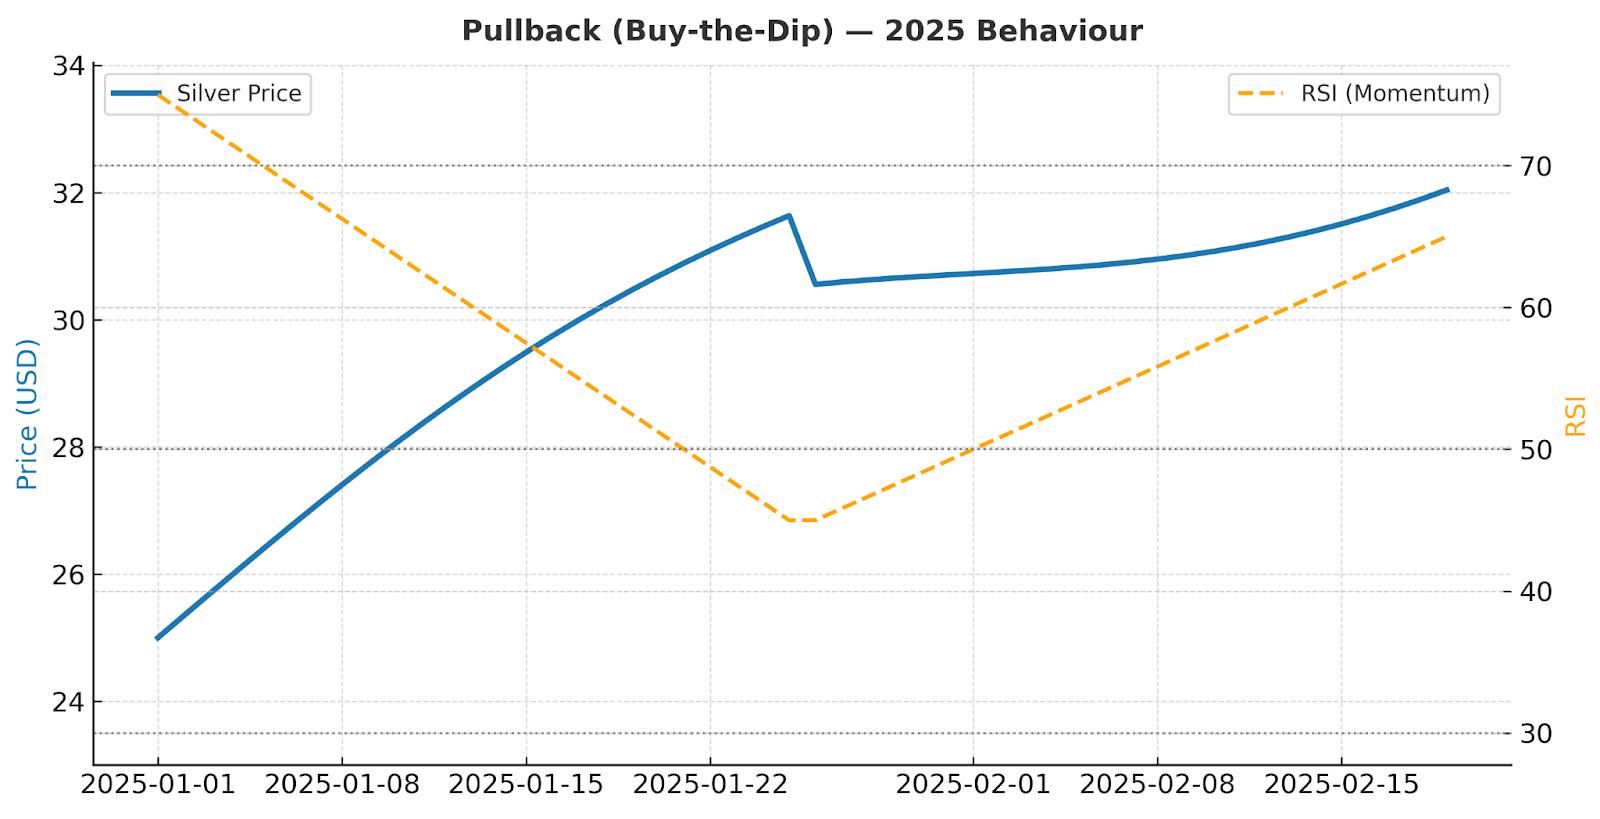
- Pullback (buy-the-dip):
- Signal intent: Overbought → neutral cooling (RSI 70 → 40–50), then re-engage long when momentum stabilises.
- Confirmation: Ends near prior breakouts/rising MAs; RSI turns up without losing the bullish range floor.
- Exit cues: RSI fails back to <50–60 or key supports give way.
- 2025 use: After extended rallies that often over-shoot then stabilise.
- Rebound (mean reversion):
- Signal intent: Washout to recovery (RSI <30 → 50), targeting early snapbacks.
- Confirmation: RSI crossbacks 30→40→50 with capitulation candles; price reclaims a short MA.
- Exit cues: RSI stalls below 50 or fresh lows print.
- 2025 use: Post-headline flushes; less effective if trend pressure persists.

Takeaway for 2025: Silver’s 30-day volatility has remained ≈34.7% in recent periods. Because swings are larger, zone-based RSI engagement tends to outperform isolated threshold hits; therefore, choose indices by regime, not by a single line-in-the-sand reading.
What past silver market moves reveal about volatility trading?
- 6 Nov 2024 – Post-election drop: Silver −5%; Trend Down +15%.
- 30–31 Oct 2024 – Data pullback: Silver −5.8%; Pullback +16%.
- 2–3 Dec 2024 – Rebound: Silver +3.5%; Rebound +12.7%.
- 9 Dec 2024 – Bullish run: Silver +4.5%; Trend Up +12.9%.
- Oct 2025 – Record highs: Silver ≈ $49.5/oz, RSI 82; Pullback likely as RSI cools to 60.
When silver trends, Trend indices capture continuation; after overshoots, Reversal indices often re-engage earlier than manual traders.
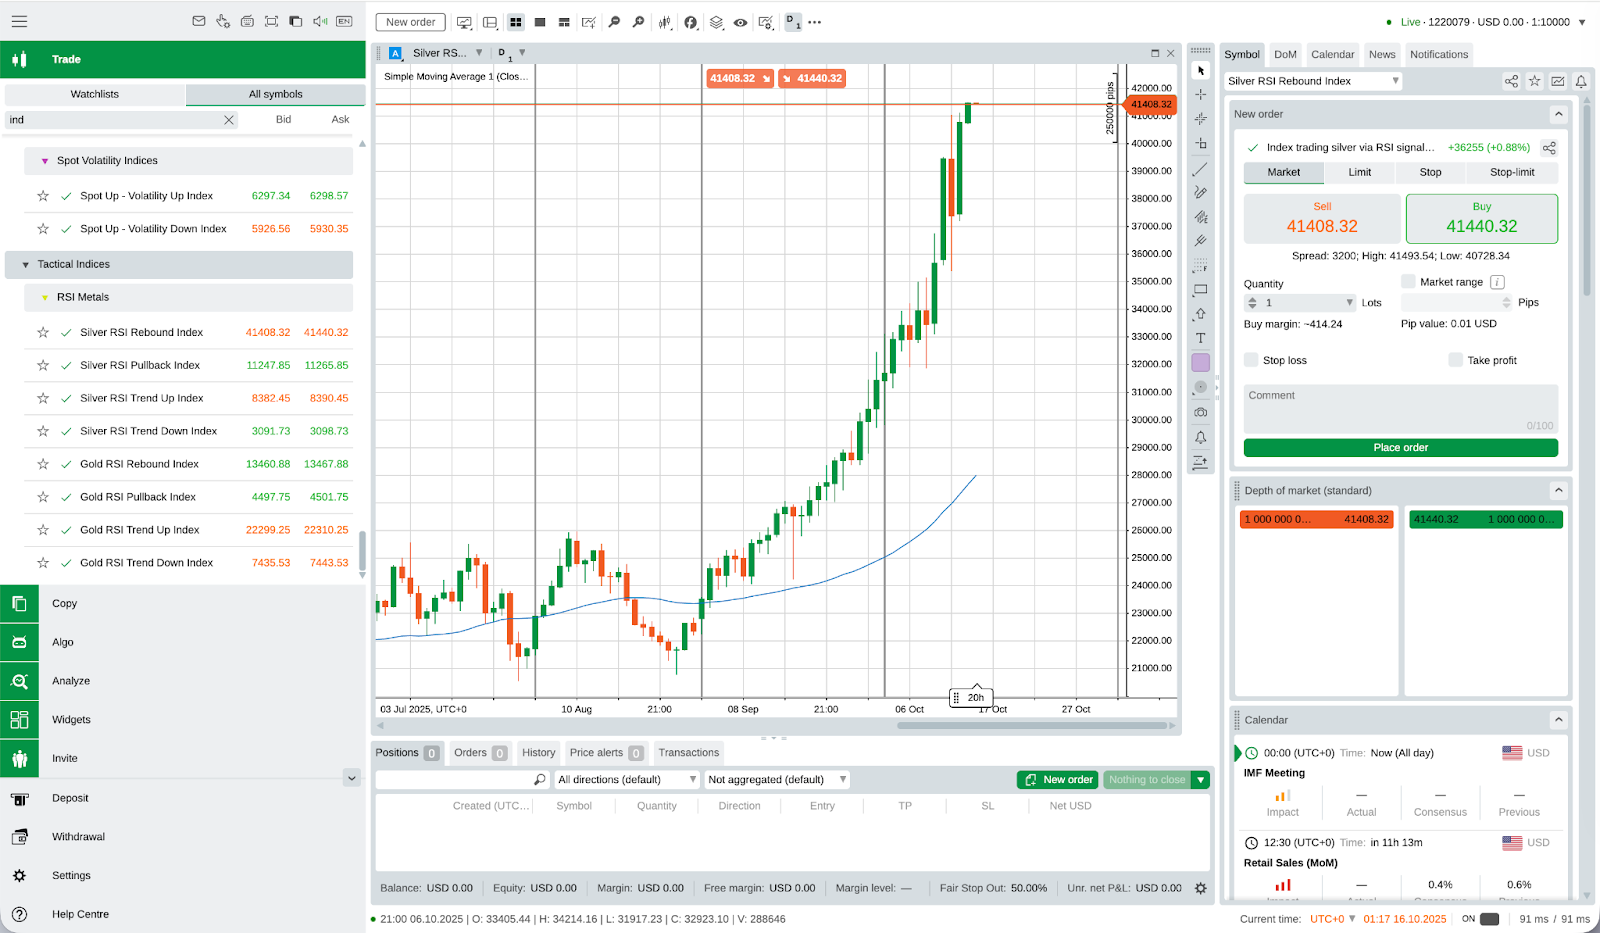
How do I access and use Tactical Indices on Deriv?
- Log in → Trader’s Hub.
- Choose Deriv MT5 or Deriv cTrader.
- Go Markets → Derived Indices → Tactical Indices.
- Select Trend Up/Down, Pullback, or Rebound.
- Review contract specs and set volume + optional stops/targets.
- Place order — note that rebalancing is built in.
- Keep a weekly log (moves captured vs spot, drawdown, hit rate by regime).
What are the key risk management practices in volatile markets?
- Position sizing: With $1,000 equity, risk 1–2% per trade; scale only after stable results.
- Leverage awareness: Silver CFDs (1:100) can magnify outcomes; reduce size near CPI/NFP/FOMC events.
- Equity caps: Set ≈ –3% daily stop to control shocks.
- Diversification: Mix Trend and Reversal indices; avoid single-strategy exposure.
- Process discipline: Review weekly (logs, RSI state, performance) to refine sizing and timing.
How does Deriv’s automated trading compare with IG and eToro?
Deriv targets active short-term silver trading via RSI automation, while IG and eToro focus on long-term investing.
What’s next for RSI trading strategies and volatility tools?
What’s planned next:
- New indicators: MACD (momentum), Bollinger Bands (volatility).
- More markets: Gold, FX pairs, equity indices.
- Analytics: Sharpe ratio & drawdown dashboards.
- Education: Deeper Deriv Academy integration for ‘learn → demo → live’.
How can traders start trading silver CFDs with Deriv’s Tactical Indices?
To deepen your knowledge, Derived Indices, and practical risk management.
If recent silver volatility has tested your discipline, try a systematic approach. Deriv’s Tactical Indices combine RSI logic with transparent automation so you can trade confidently without relying solely on instinct.
Start in demo on Deriv MT5 or Deriv cTrader, then move to live once you understand each index’s behaviour.
For deeper learning, visit the Deriv Academy for lessons on RSI, Derived Indices, and risk management.
BTC price surge: Will inflation relief keep Bitcoin above $90K?
Bitcoin (BTC) has staged a dramatic recovery, climbing back above the $90,000 mark after a volatile start to the year.
Bitcoin (BTC) has staged a dramatic recovery, climbing back above the $90,000 mark after a volatile start to the year. On Tuesday, the flagship cryptocurrency surged 3% to $96,452.34, according to Coin Metrics, reversing its earlier slide below $90,000. The broader cryptocurrency market mirrored this momentum, with stocks tied to crypto, including Coinbase and MicroStrategy, rose 1% and 4%, respectively, though they trimmed their gains later in the day.
Inflation relief bitcoin recovery
Bitcoin’s recent rebound coincided with encouraging news on inflation. The Bureau of Labor Statistics reported that the producer price index (PPI), a key measure of wholesale inflation, increased by only 0.2% in December-half the 0.4% rise economists had anticipated.
Monthly change in US Producer Price Index
Input prices rose 0.2% in December
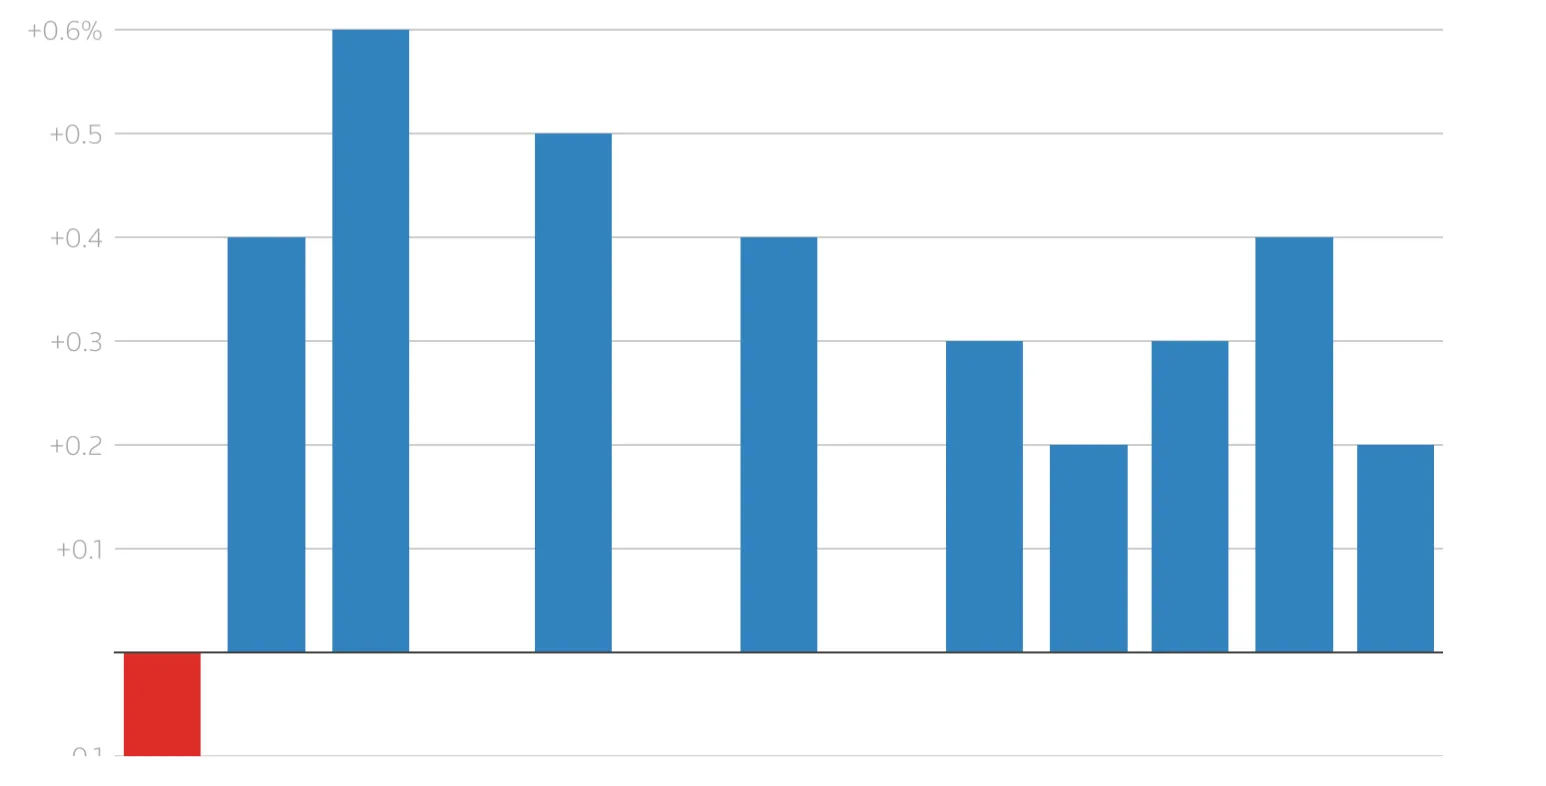
This lower-than-expected inflation reading eased fears of aggressive monetary tightening, spurring a renewed appetite for risk assets, including cryptocurrencies. Despite the BTC price recovery, the cryptocurrency market remains in a precarious position.
Investors are balancing optimism about pro-crypto leadership under the incoming Trump administration with concerns about inflationary pressures. January has already proven more turbulent than expected, and analysts predict this volatility could persist through the first quarter.
Last week, Bitcoin’s drop below $90,000 was fueled by unexpectedly strong payroll data, which pushed bond yields higher and led to a sell-off in risk assets. Meanwhile, proposed tariffs by President Trump unsettled markets, strengthening the U.S. dollar-an outcome that typically weighs on Bitcoin given its inverse correlation with the dollar.
Institutional investors stay in despite bitcoin’s volatility
Institutional investors continue to play a pivotal role in Bitcoin’s market dynamics. MicroStrategy, a corporate giant in Bitcoin investments, recently added 2,530 BTC to its holdings, bringing its total to 450,000 BTC-valued at approximately $43 billion. This steadfast accumulation underscores the confidence institutional players have in Bitcoin’s long-term potential, even in the face of short-term market pressures.
Fundstrat’s Tom Lee has suggested that Bitcoin could see a temporary correction to $70,000 before reaching new record highs later in the year. Lee’s optimistic year-end forecast of $200,000 to $250,000 highlights the cryptocurrency’s characteristic volatility during bull runs.
Derivatives signal bullish bitcoin sentiment
In the derivatives market, signs of optimism abound. Bitcoin futures contracts are trading with an annualized premium of 11%, well above the neutral 5%-10% range, indicating strong institutional demand. Meanwhile, retail investors are also showing confidence, as evidenced by positive funding rates for perpetual Bitcoin contracts. These metrics suggest that both institutional and retail traders remain committed to Bitcoin, despite macroeconomic uncertainties.
BTC’s technical outlook: Challenges loom ahead
While Bitcoin’s recovery is promising, analysts note that it faces significant headwinds. According to analysts, macroeconomic factors, including inflation, geopolitical risks, and potential policy changes under the Trump administration, will continue to influence market sentiment. Adding to this complexity, the U.S. Department of Justice plans to sell $6.5 billion worth of Bitcoin seized from the Silk Road, a move that could temporarily increase market supply and exert downward pressure on prices.
As Bitcoin hovers near $96,000, traders are closely monitoring its ability to maintain this momentum. The cryptocurrency has risen 3% year-to-date but remains 10% below its December 17 all-time high. The interplay of macroeconomic pressures, institutional confidence, and policy developments will be pivotal in shaping Bitcoin’s trajectory in 2025.
Despite the challenges, Bitcoin’s long-term potential remains compelling. The battle to stay above $90,000 encapsulates the broader market forces at play, highlighting both the opportunities and obstacles in Bitcoin’s ongoing evolution.
At the time of writing, analysts note that BTC is hovering around $96,000 as markets remain volatile. The buy narrative is supported by RSI slowly up above the mid-line as prices stay above the 100-day moving average. Prices rising towards a recent sell zone however could hinder the continuation of the rally. Buyers could be held at the $97,683 and $99,904 resistance levels, while on the other hand, sellers could find support at the $94,450 and $92,530 support levels.

You can get involved and speculate on the BTC price with a Deriv MT5 account. It offers a list of technical indicators that can be employed to analyse prices. Log in now to take advantage of the indicators, or sign up for a free demo account. The demo account comes with virtual funds so you can practise analysing trends risk-free.

XRP price prediction 2025: Can XRP ride the Trump effect to $50?
Ripple, the San Francisco-based global payments technology firm, has made a dramatic pivot that could define its future in the cryptocurrency space.
Ripple, the San Francisco-based global payments technology firm, has made a dramatic pivot that could define its future in the cryptocurrency space. Once hindered by regulatory hurdles in the United States, Ripple is now gearing up for an ambitious U.S. expansion, signaling a potential shift in its strategy. With a pro-crypto administration led by former President Donald Trump set to take office in January 2025, Ripple’s bold moves and XRP’s future price potential have investors asking a critical question: Can Ripple’s strategic shift and the “Trump effect” push XRP to an ambitious $50 target?
Ripple’s strategic U.S. comeback
For years, Ripple appeared ready to abandon the U.S. market due to the regulatory battles that culminated in a high-profile lawsuit with the Securities and Exchange Commission (SEC). Under former SEC Chair Gary Gensler’s leadership, Ripple faced immense scrutiny, with XRP’s status as a security hotly contested. At the height of this regulatory uncertainty, Ripple was mulling relocating its global headquarters to more crypto-friendly jurisdictions, with 95% of its customers already operating outside the United States.
Fast-forward to late 2024, and Ripple’s narrative has taken a dramatic turn. CEO Brad Garlinghouse announced that 75% of Ripple’s new job listings are now targeted at U.S.-based recruits, marking a clear shift in strategy. These positions, largely focused on engineering and product development, underscore Ripple’s commitment to scaling innovation on American soil. This pivot isn’t just about jobs; it’s about staking a claim in what could become a more crypto-friendly U.S. market.
Adding to the intrigue, Garlinghouse recently dined with President Donald Trump and Ripple’s Chief Legal Officer, Stuart Alderoty. In a post on social media platform X, Garlinghouse credited the incoming administration as a game-changer for the crypto industry, coining the term “Trump effect.” He emphasized that Trump’s policies are already jumpstarting innovation and job growth in the U.S., signaling a dramatic departure from the regulatory freeze that Ripple faced in the past.
The “Trump effect” and XRP’s prospects
Trump’s pro-crypto stance has created a wave of optimism across the cryptocurrency landscape. Analysts believe that his administration’s regulatory clarity could be a catalyst for institutional investors to enter the XRP market. Ripple’s U.S. expansion is poised to take advantage of this shift, especially with the prospect of an XRP-focused exchange-traded fund (ETF) on the horizon.
Historically, ETF approvals have been transformative for cryptocurrency markets. Bitcoin, for instance, saw a significant rally after the approval of its first ETFs in 2021 and 2024. Similarly, rumors are circulating that BlackRock, the world’s largest asset manager with $12 trillion under management, may allocate a portion of its portfolio to XRP. Even a small investment from such a financial behemoth could send XRP prices soaring.
At least four firms, including WisdomTree and Bitwise, have already filed applications for XRP ETFs, and analysts are optimistic about their approval under a pro-crypto SEC led by Paul Atkins, Trump’s pick for SEC Chair. If approved, these ETFs could provide institutional investors with a seamless entry point into the XRP market, further boosting demand and legitimacy.
XRP as a bridge for CBDCs
Another factor fueling optimism for XRP is its potential role in the global financial system. Central banks worldwide are racing to develop Central Bank Digital Currencies (CBDCs), and Ripple’s XRP Ledger could serve as the perfect bridge between these currencies. XRP’s fast transaction speeds, low costs, and scalability make it a prime candidate for cross-border payments in the decentralized finance (DeFi) era.
According to analysts, if Ripple succeeds in positioning XRP as the backbone of CBDC interoperability, the token’s utility and demand could skyrocket. This foundational use case aligns with Ripple’s long-standing mission of facilitating efficient global payments and could serve as a critical driver for its ambitious $50 price target.
Price headwinds on the horizon
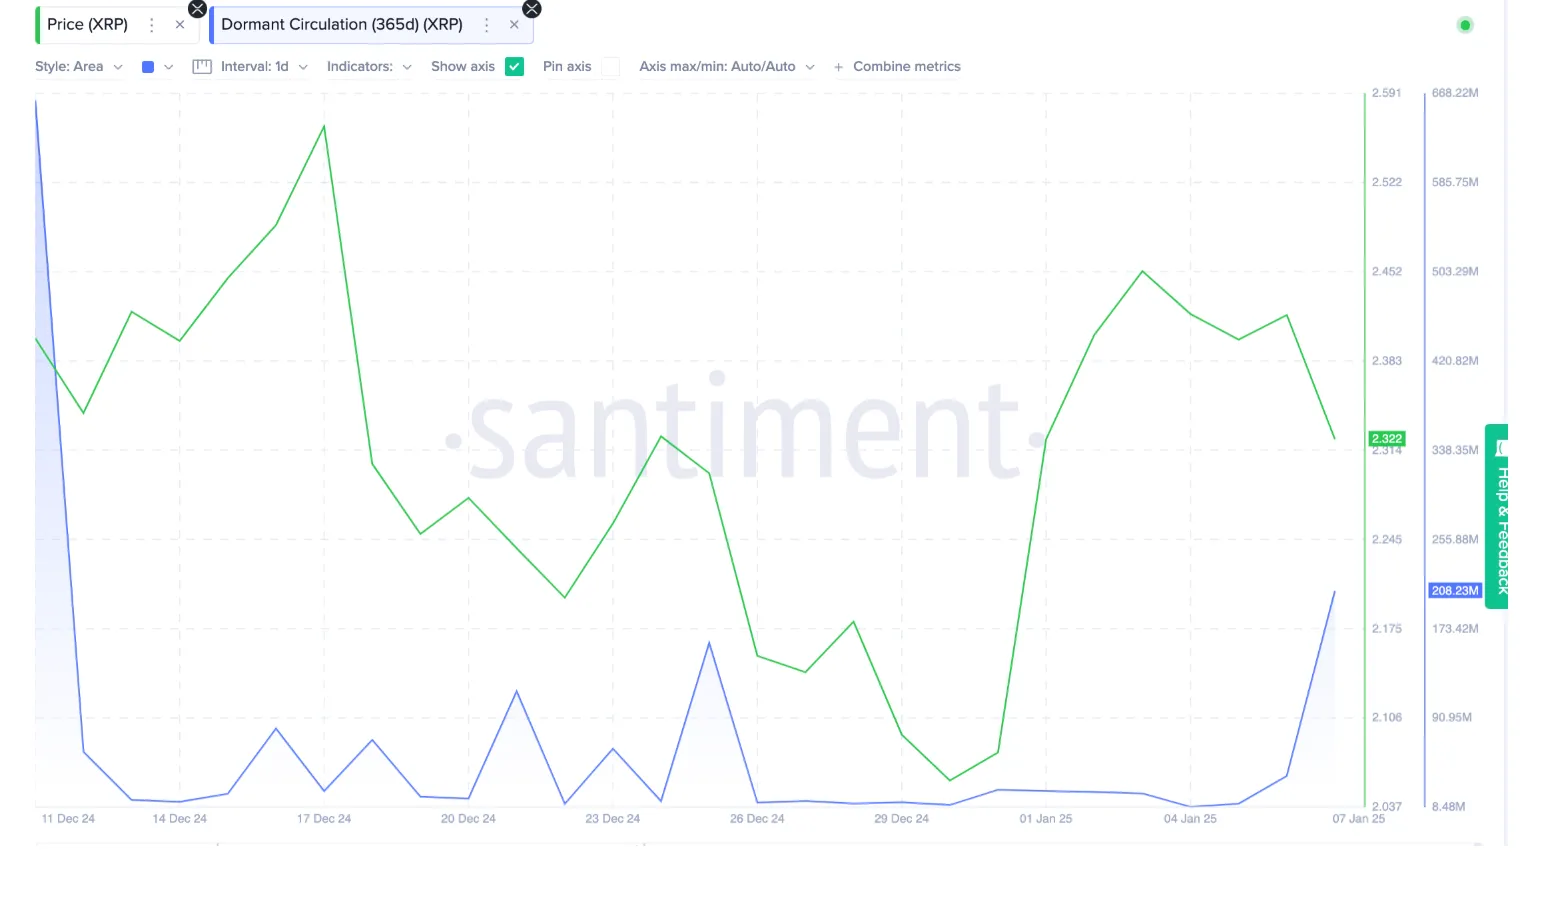
While the outlook for Ripple and XRP appears promising, it’s essential to temper optimism with caution. The cryptocurrency market is notoriously volatile, and XRP’s price movements have historically been subject to significant fluctuations. For instance, long-term investors offloaded over $467 million worth of XRP in early January 2025, as tracked by the Dormant Circulation Supply chart from Santiment. Such sell-offs can dilute market supply and create downward pressure on prices.
Moreover, XRP’s ambitious $50 target hinges on multiple factors aligning seamlessly:
- The successful approval and adoption of XRP ETFs.
- Institutional investment from major players like BlackRock.
- Ripple’s ability to capitalize on CBDC opportunities.
- A consistently pro-crypto regulatory environment under Trump’s administration.
Any deviation from these factors could impact XRP’s trajectory, reminding investors that nothing in the crypto market is guaranteed.
2025: A make-or-break year for XRP?
As Ripple doubles down on its U.S. strategy and prepares to leverage the Trump administration’s pro-crypto policies, the stakes for XRP have never been higher. The combination of ETF approvals, institutional interest, and CBDC integration could propel XRP into uncharted territory. However, the journey to $50 will be anything but smooth, with market volatility and execution risks looming large.
For XRP holders, the “Trump effect” represents a unique opportunity to ride a potential wave of regulatory clarity and institutional adoption. As 2025 unfolds, all eyes will be on Ripple’s roadmap and its ability to deliver on its ambitious vision. One thing is certain: Ripple’s big U.S. bet has made XRP one of the most closely watched cryptocurrencies of the year.
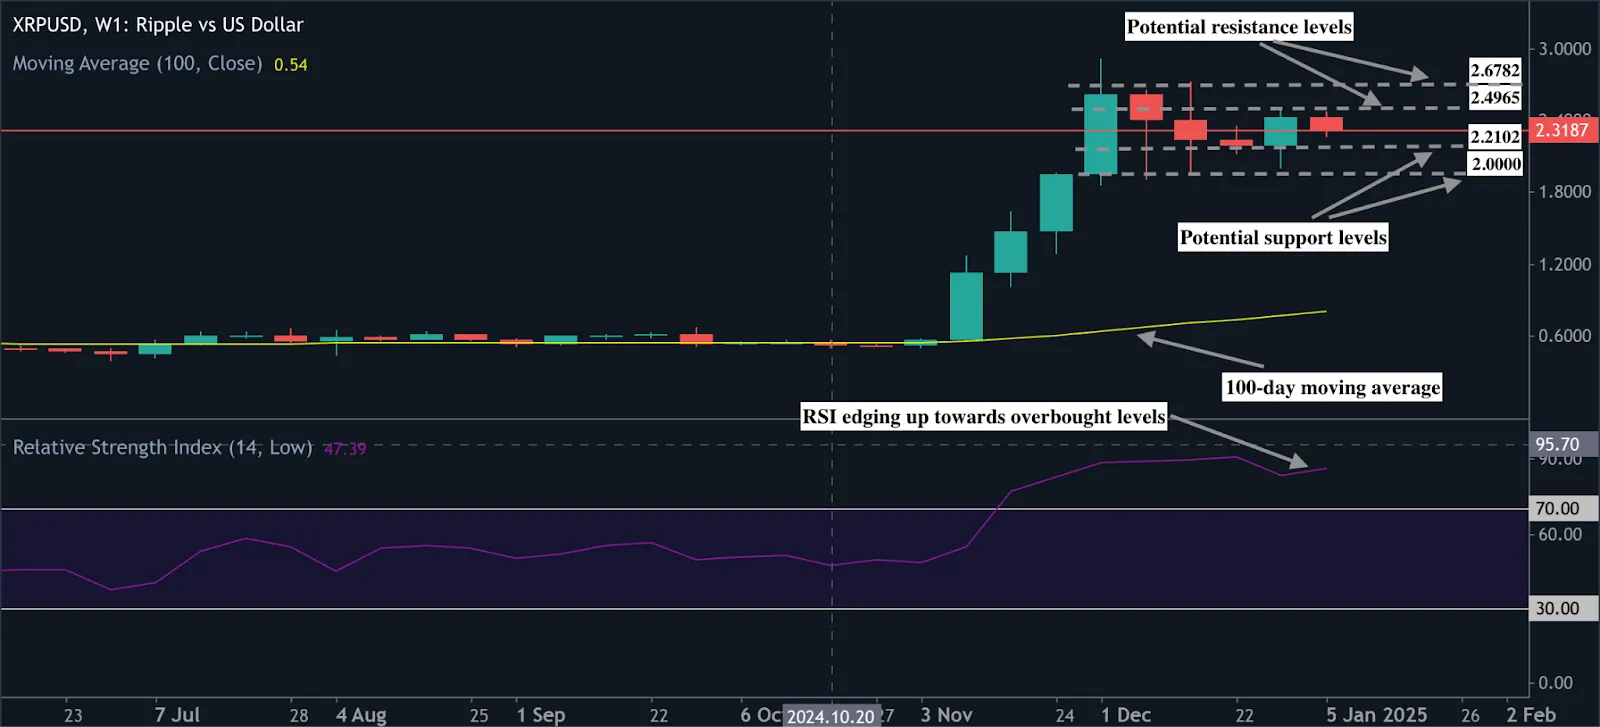
At the time of writing, XRP is hovering just below $2.5000. Buy pressure appears dominant on the weekly chart, though the last few weeks have produced sell candles that hint at upward momentum slowdown. Prices staying elevated above the 100-day moving average hint at possible further buy pressure, however RSI edging towards the overbought territory hints at potential easing.
Buyers could find resistance at the $2.4965 and $2.6782 price levels. On the downside, sellers could be held at the $2.2102 and $2.0000 price levels.
You can trade XRP today with a Deriv MT5 account. It offers a list of technical indicators that can be employed to analyse prices. Log in now to take advantage of the indicators, or sign p for a free demo account. The demo account comes with virtual funds so you can practise analysing trends risk-free.

Natural gas surges as January turns frigid: Will the rally continue?
Natural gas prices hit a 52-week high of $4.201 per thousand cubic feet as frigid weather grips the Eastern U.S. Forecasts predict colder-than-average temperatures and snowstorms through mid-January, driving up heating demand.
Natural gas prices hit a 52-week high of $4.201 per thousand cubic feet as frigid weather grips the Eastern U.S. Forecasts predict colder-than-average temperatures and snowstorms through mid-January, driving up heating demand. The surge comes alongside concerns over potential supply disruptions, including freeze-offs in the Marcellus Shale, and strong export demand for LNG.
Bullish sentiment dominates
Year-to-date, natural gas prices are up 58%, with a 15% spike in February futures on Monday alone. Algorithmic funds have shifted to net long positions, reflecting growing confidence in further price increases.
Key technical levels for natural gas
Resistance lies at $4.176 and $4.363, with support at $3.852 and $3.614. The trajectory hinges on whether frigid weather persists into late January or eases, leaving traders on edge as the market watches every shift.
Read the full article here: https://www.fxstreet.com/analysis/natural-gas-how-high-can-prices-go-as-january-turns-frigid-202501020908
Stock market 2024: The year’s stock winners and losers
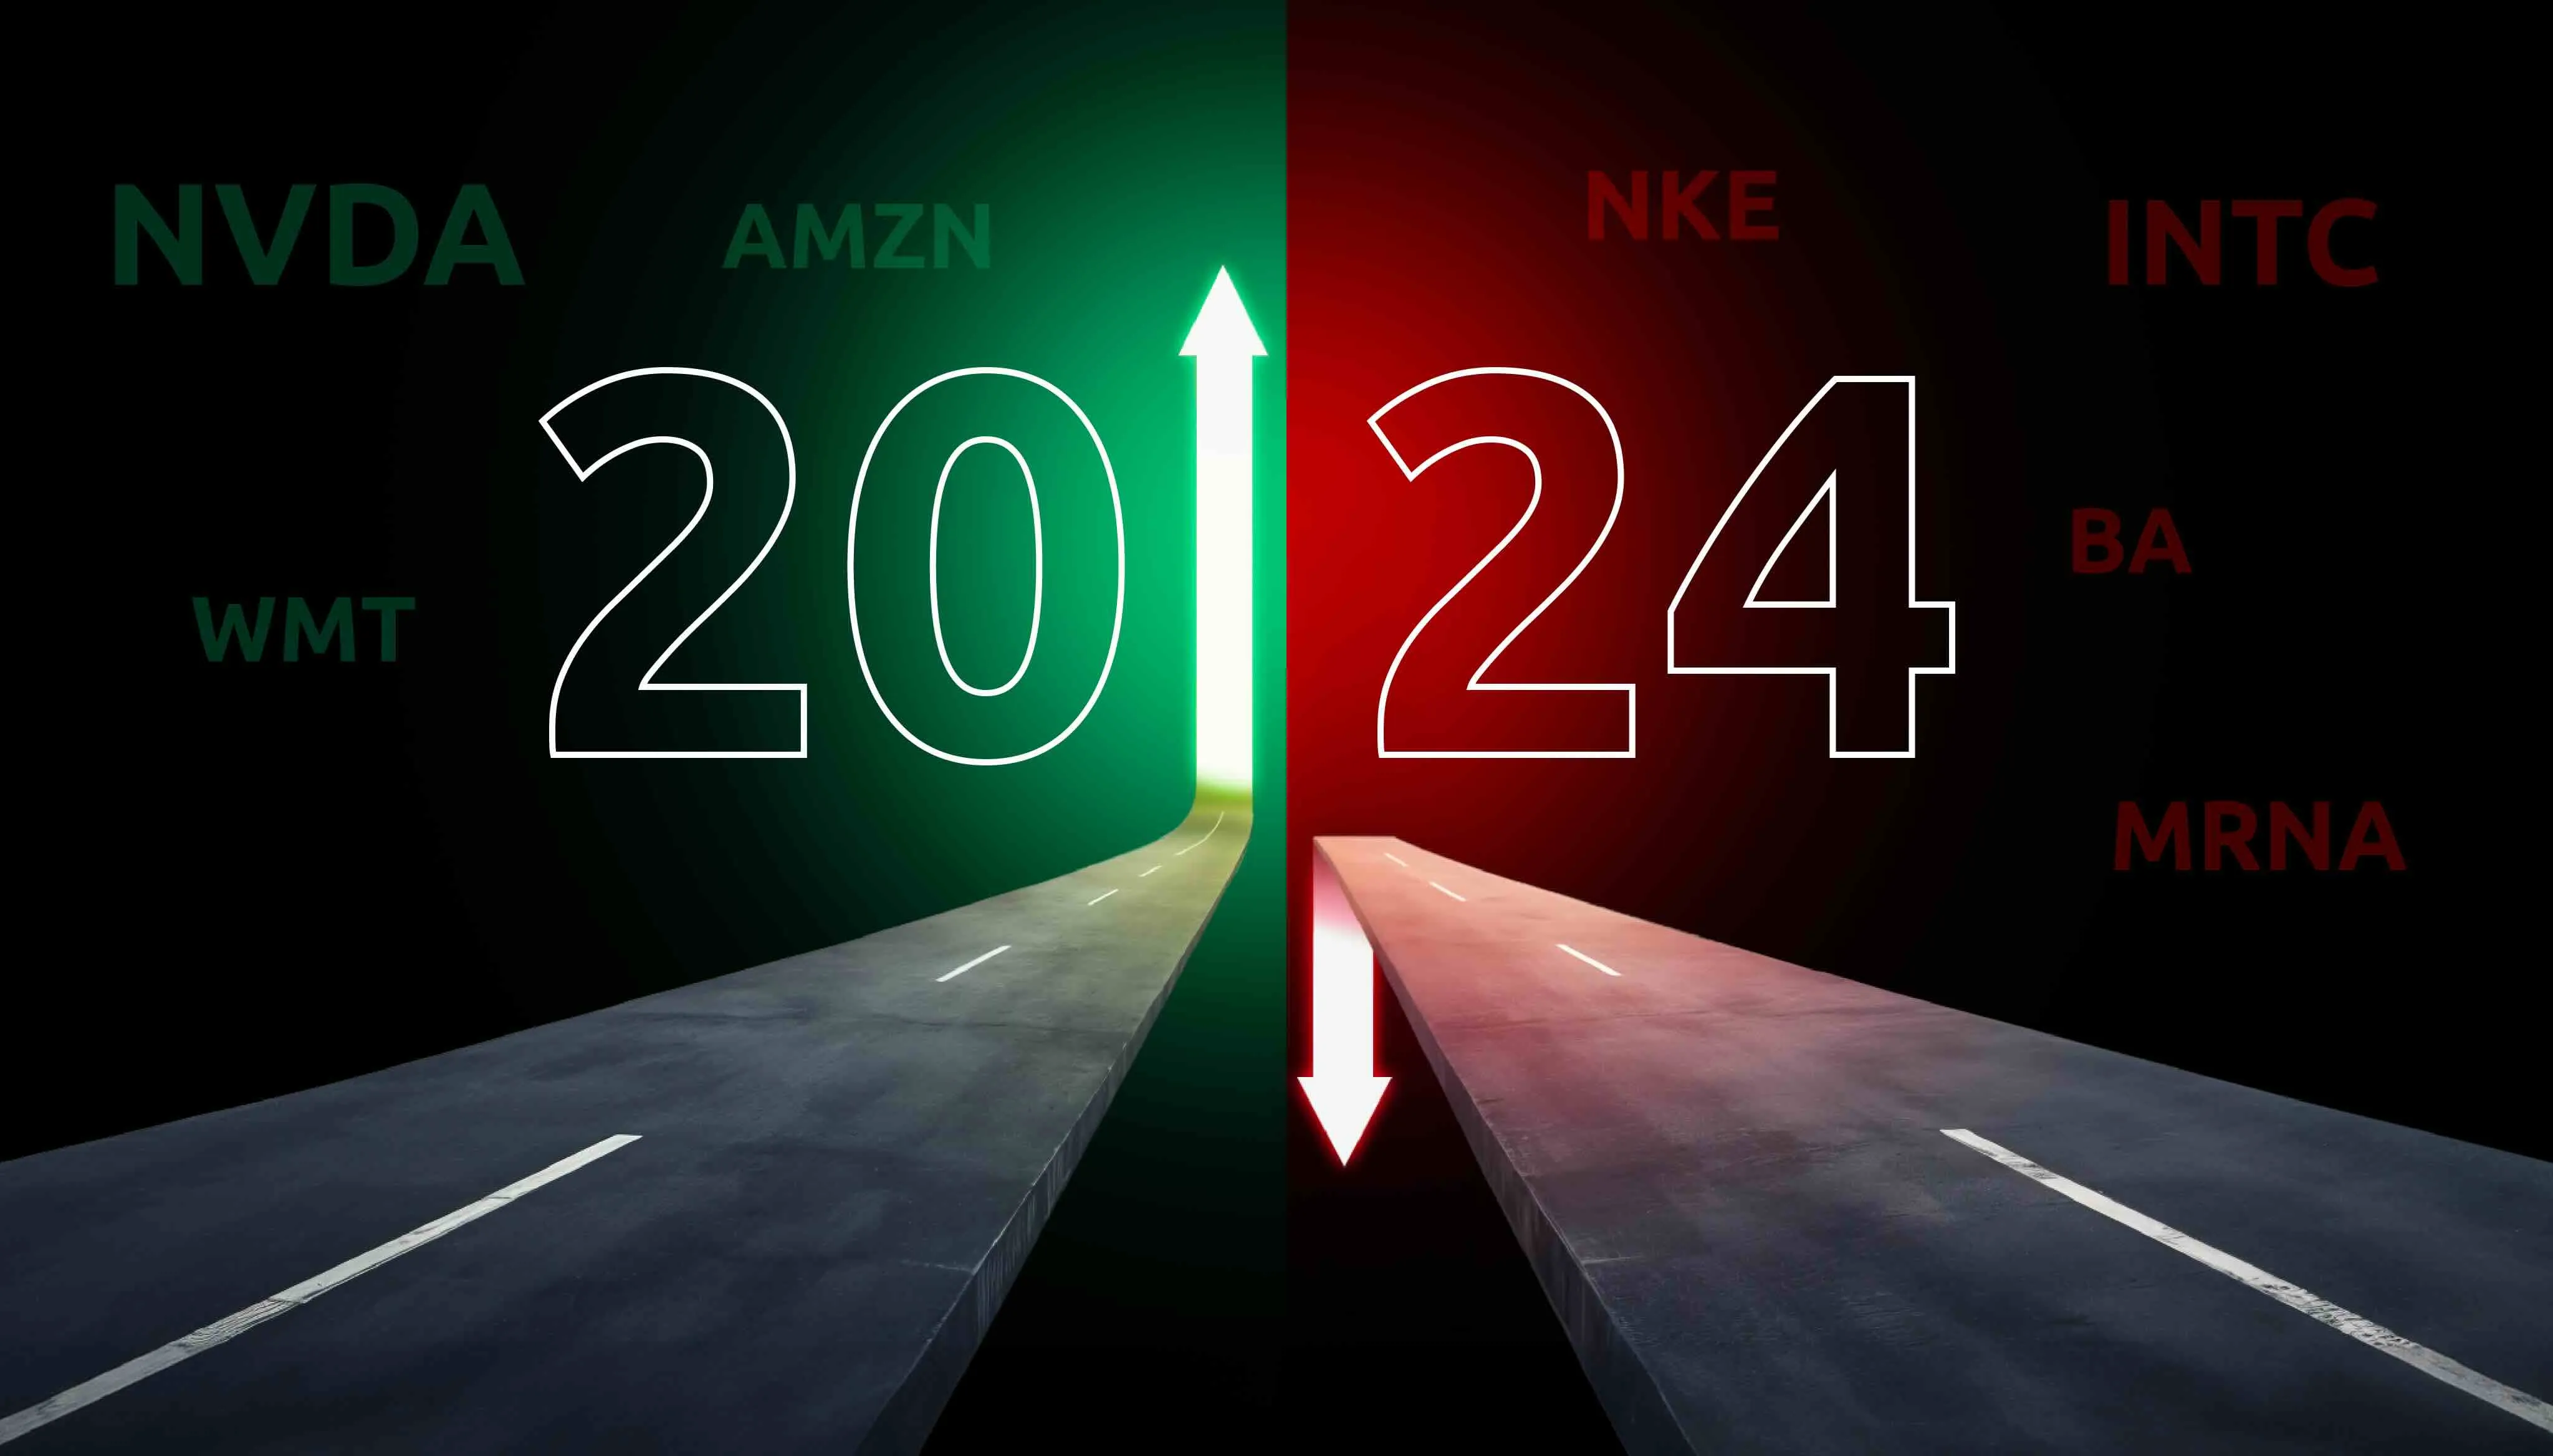
The stock market in 2024 painted a vivid picture of extremes. While a handful of companies soared to dazzling heights, delivering record-breaking gains, others faltered, their value eroded in a challenging economic landscape.
The stock market in 2024 painted a vivid picture of extremes. While a handful of companies soared to dazzling heights, delivering record-breaking gains, others faltered, their value eroded in a challenging economic landscape.
A recent IBD analysis reveals that eight S&P 500 companies drove over $6 trillion in market value, accounting for more than half of this year’s $11.8 trillion index gain. Giants like Nvidia, Amazon, Apple, and Walmart were the heroes of 2024, while others like Intel, Nike, Boeing, and Moderna struggled to stay afloat.
Here’s a closer look at the winners and losers that defined the year.
Stock market winners of 2024
Nvidia stock 2024: The AI frontrunner

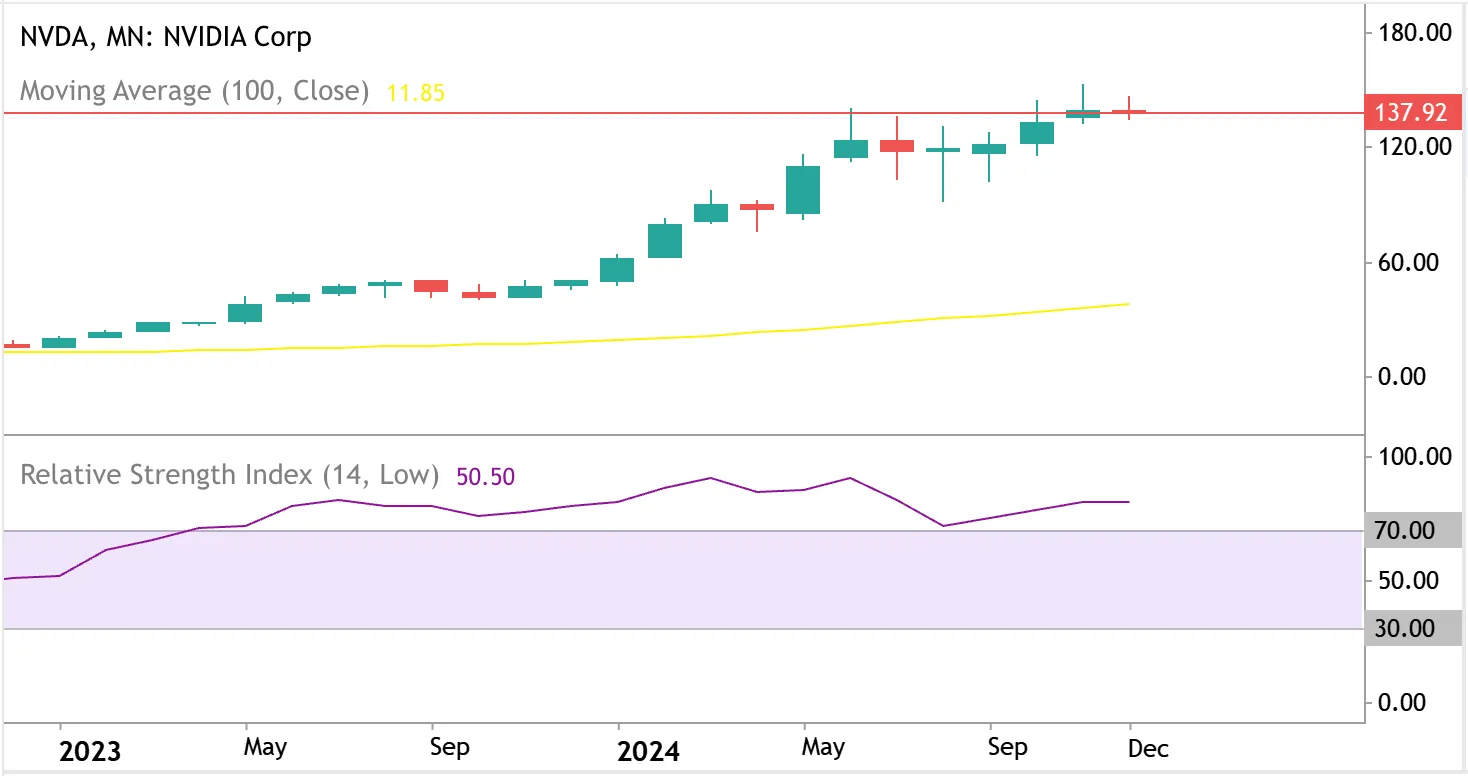
No stock better encapsulates 2024’s market success than Nvidia. Riding the AI boom, Nvidia’s stock surged 180%, adding an eye-popping $2.3 trillion in market value. To put this into perspective, Nvidia alone accounted for 20% of the S&P 500’s total gains this year- an achievement unmatched by any other company.
With a stellar Relative Strength (RS) Rating of 96, Nvidia’s growth trajectory remains compelling. Analysts project its profit to climb nearly $300b in 2024 and a further 127% in 2025, solidifying its dominance in the AI semiconductor space.
Amazon stock 2024: An e-commerce powerhouse

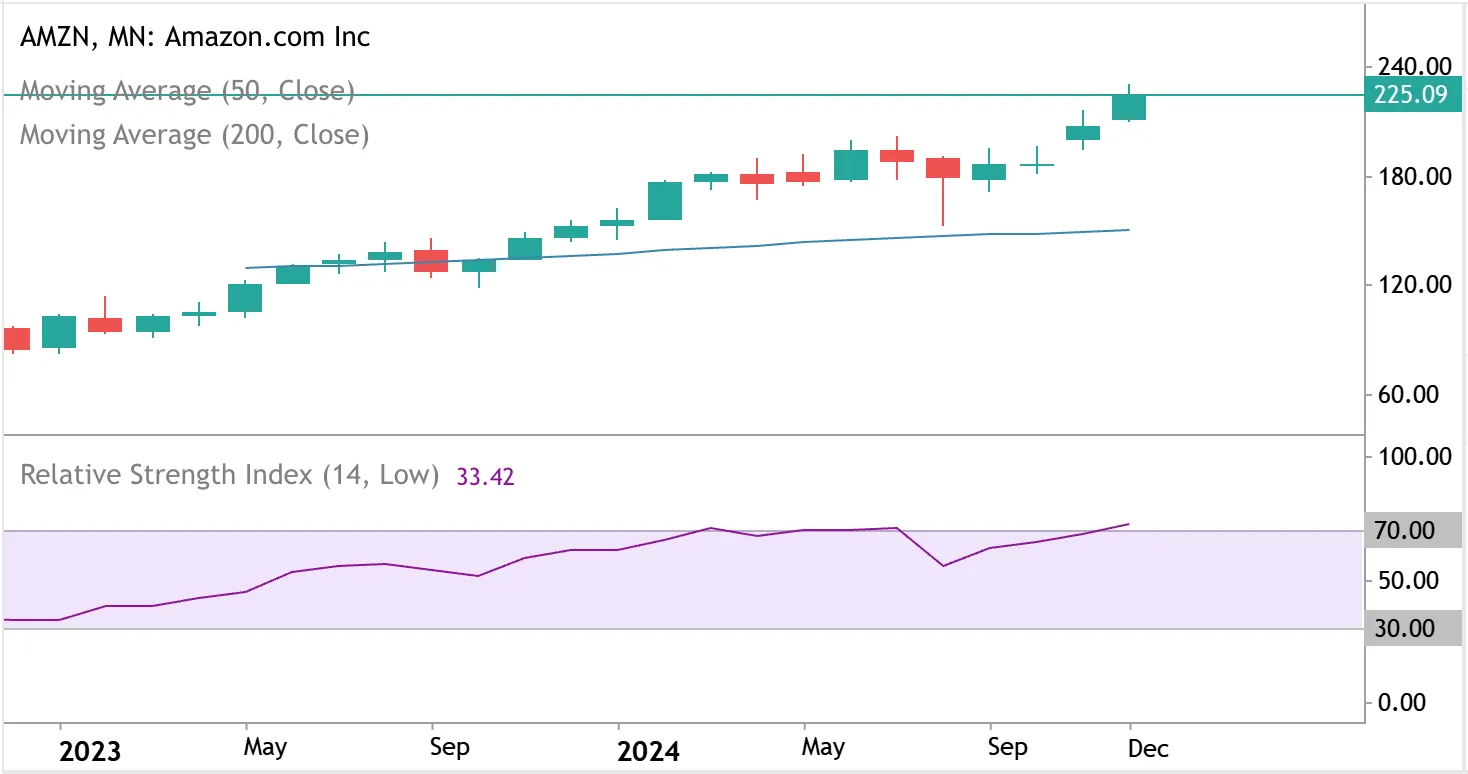
Amazon took the runner-up spot, delivering a 50% stock gain in 2024 and adding $753 billion in market value. The e-commerce and cloud computing titan contributed 6.4% of the S&P 500’s total gains. Analysts forecast profit growth of 77% this year and another 21% in 2025, further cementing Amazon’s status as a cornerstone of the modern economy.
Apple stock 2024: Driving innovation and revenue

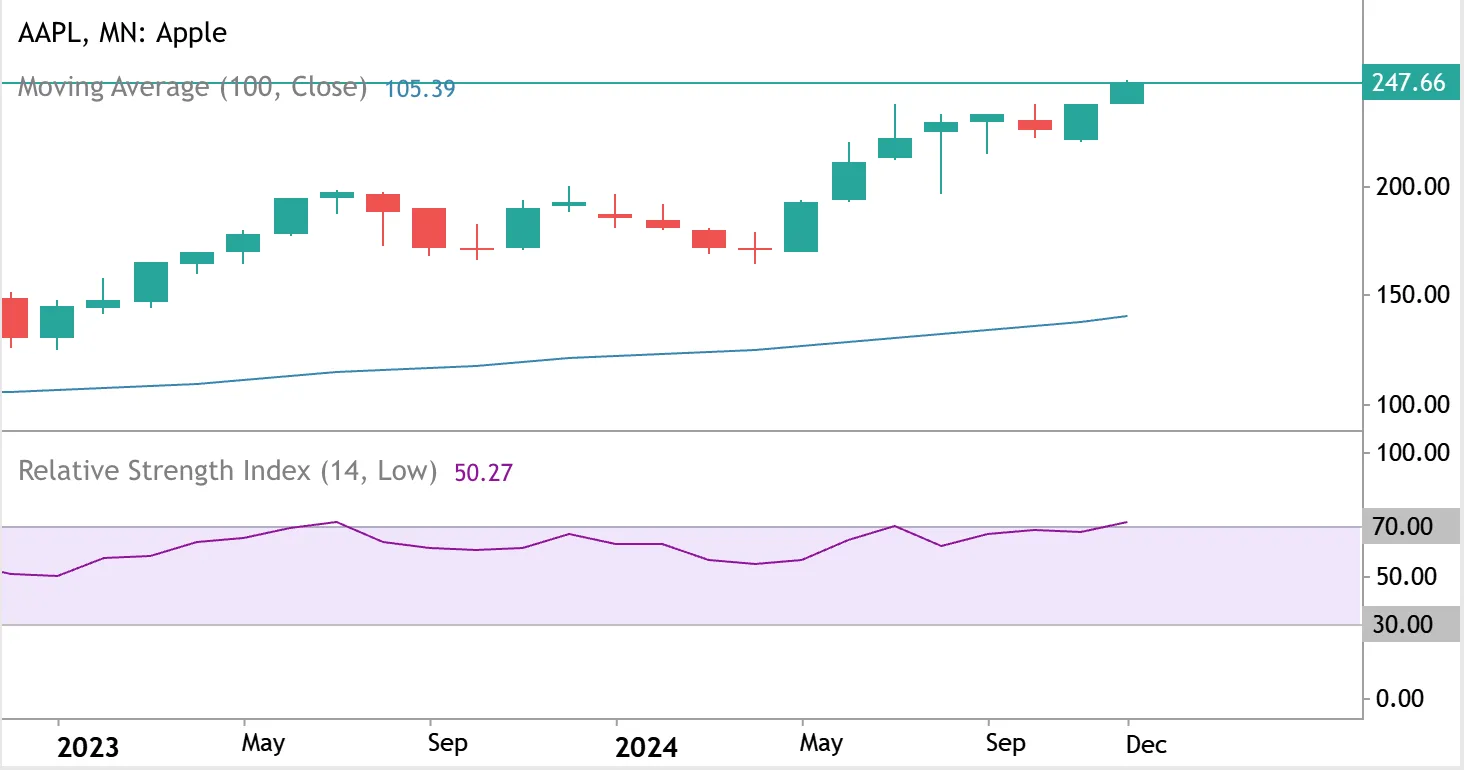
Apple’s 33% stock gain in 2024 showcased the company’s continued ability to innovate and deliver value. Strong iPhone sales and services revenue drove its performance, with Q4 earnings beating expectations at $1.64 per share, a 12% year-over-year increase. Revenue reached $94.93 billion. The iPhone 16, featuring AI-powered innovations, signals strong momentum for further growth.
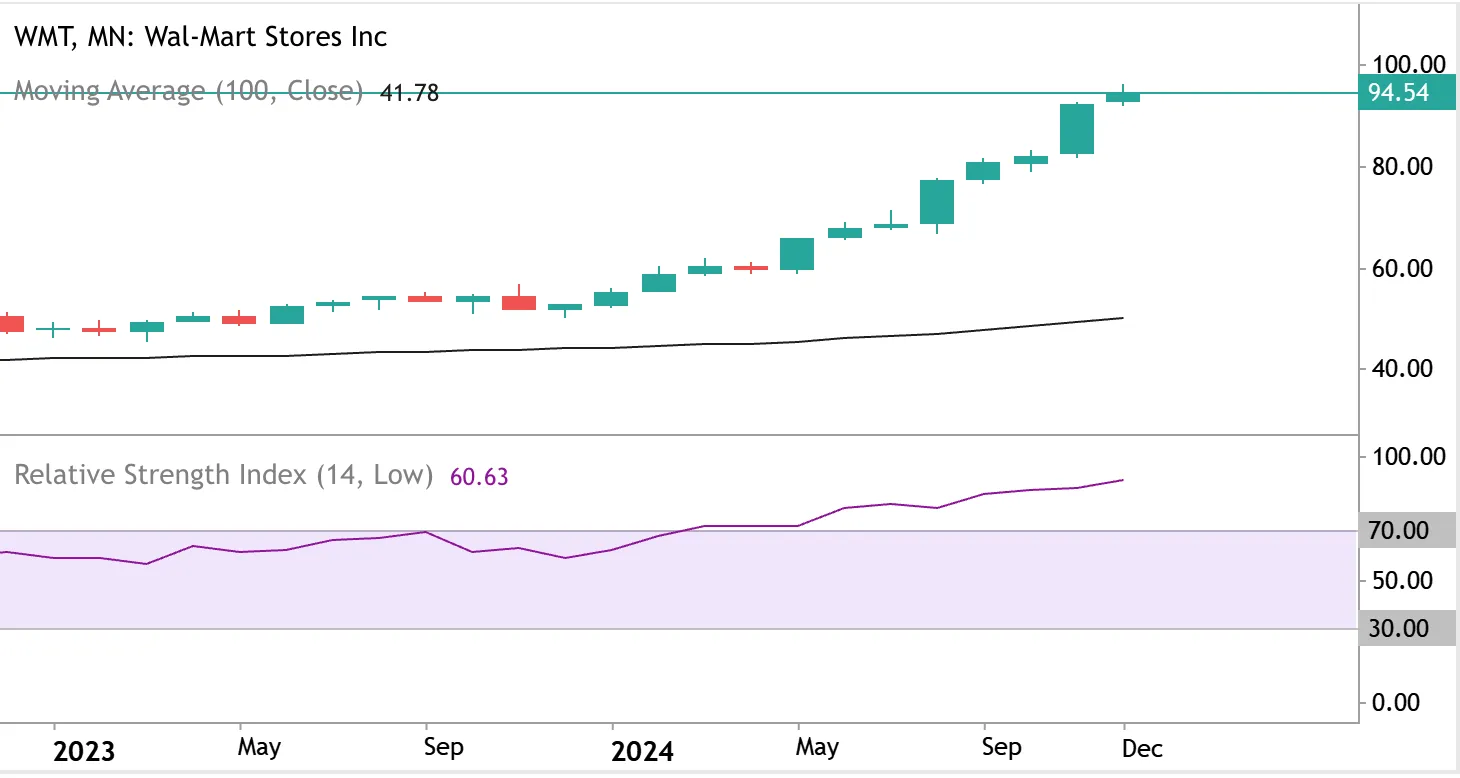
Walmart stock 2024: A resilient retail story
Proving that retail isn’t dead, Walmart surprised investors by soaring 78% this year, adding $342 billion in market value and accounting for roughly 3% of the S&P 500’s total gains. With a CS Rating of 91 and robust profit growth expected in fiscal 2025 and 2026, Walmart demonstrated that traditional retail can thrive in a tech-driven world.

The Stock market losers of 2024
While some stocks soared, other stocks fell, dragging down the market's overall momentum. Ten companies, including Intel, Nike, Boeing, and Moderna shed a combined $383.2 billion in value this year, underscoring the volatility and challenges some sectors faced.
Intel stock 2024: Missing the AI wave

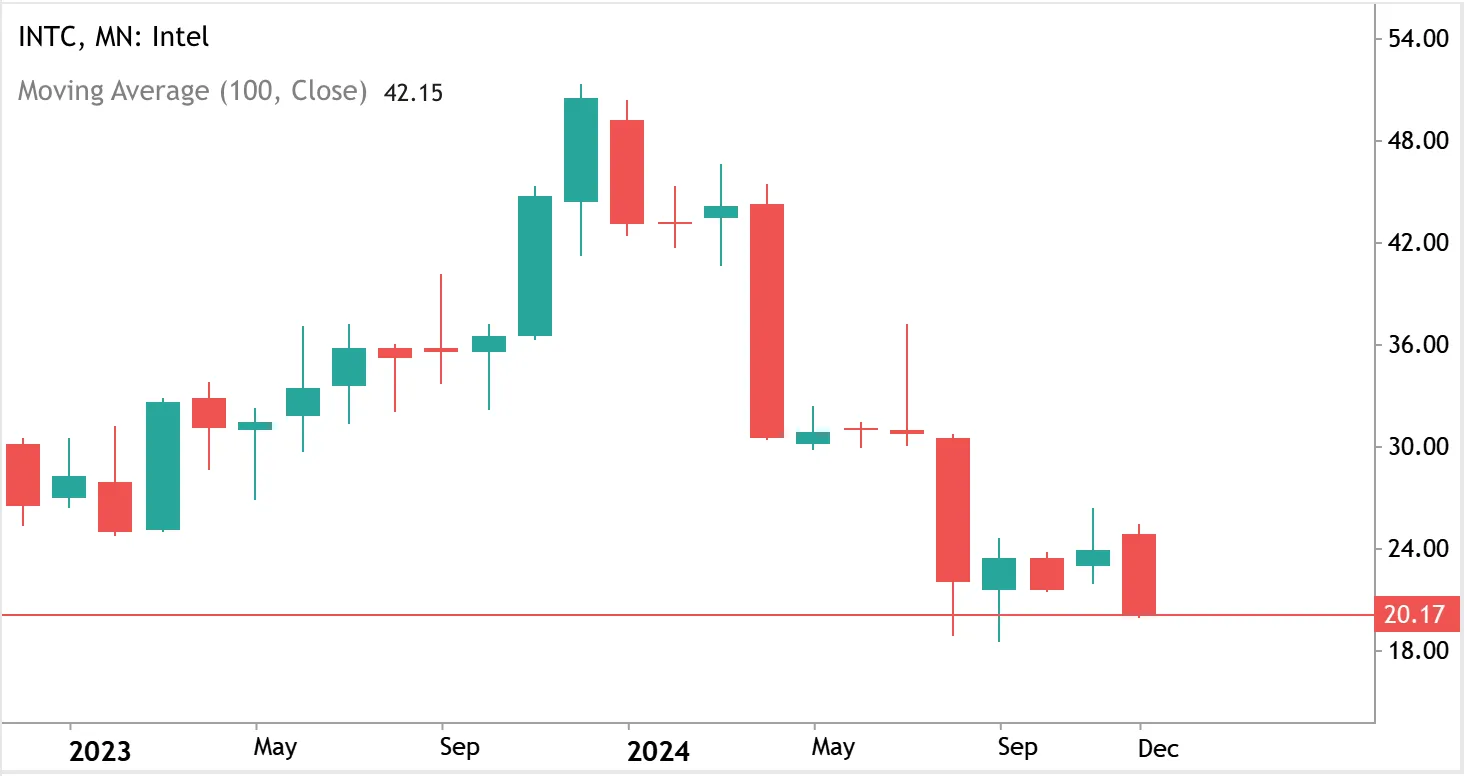
At the top of the loser’s list is Intel, whose market value plummeted by $117.1 billion, marking a 58% drop in its stock price. Struggling to capitalize on the AI boom, Intel’s performance was the antithesis of Nvidia’s meteoric rise. With a dismal RS Rating of 12 and a forecasted profit decline of 112%, Intel’s challenges reflect a broader struggle to remain relevant in a rapidly evolving semiconductor market.
Nike stock 2024: Losing ground to rivals
Nike saw its value shrink by $48.5 billion this year, with shares falling 28%. This decline highlights a shift in consumer preferences toward competitors like Deckers and On Holding. With an RS Rating of 15 compared to On Holding’s 94, Nike struggled to regain its footing in a competitive landscape.


Boeing stock 2024: Struggles continued in 2024

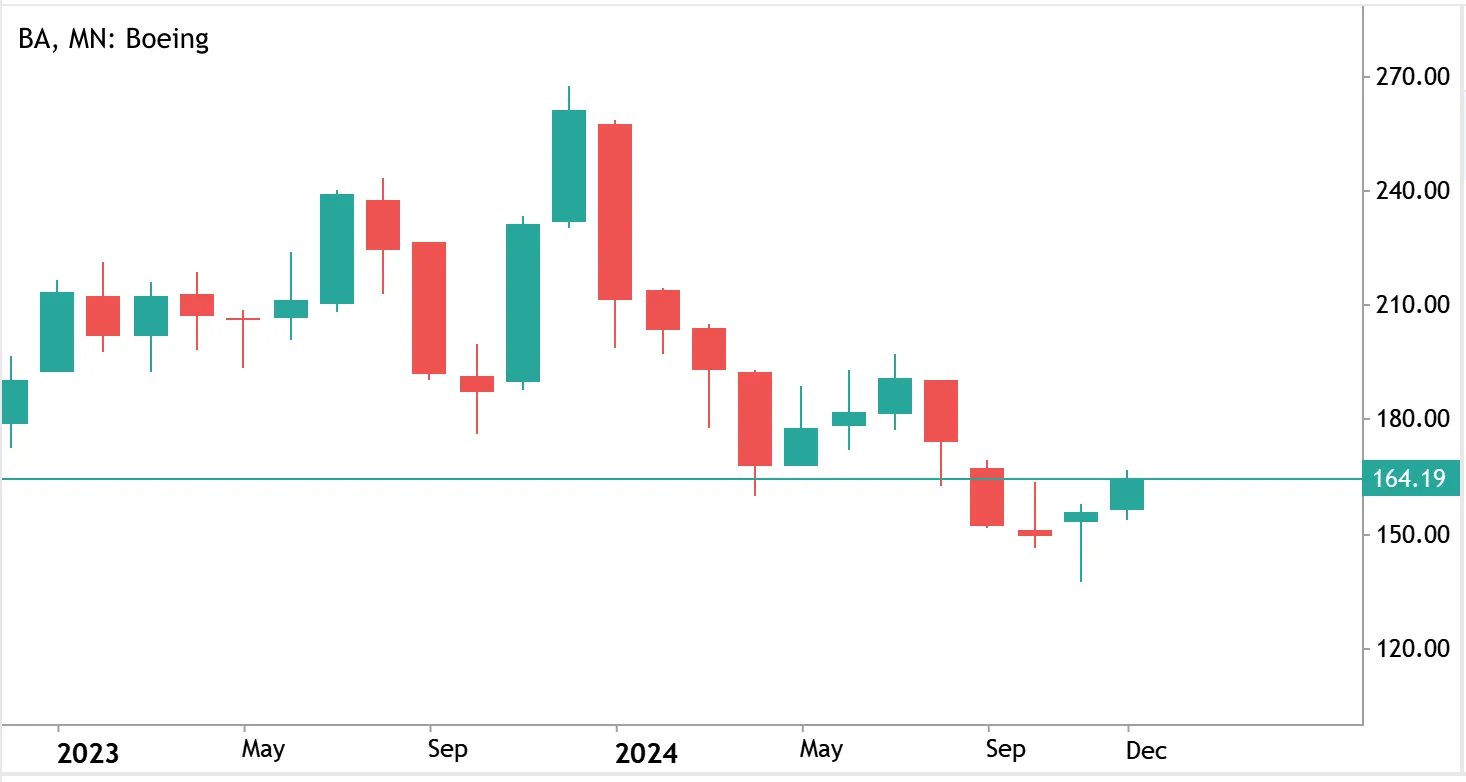
Despite its dominance in aerospace, Boeing’s woes persisted in 2024, with shares tumbling 35% and wiping out $39.4 billion in market value. Plagued by a bloated cost structure and persistent quality control issues, Boeing faced a forecasted profit decline of 176%, further eroding investor confidence.
Moderna stock 2024: Post-pandemic pain
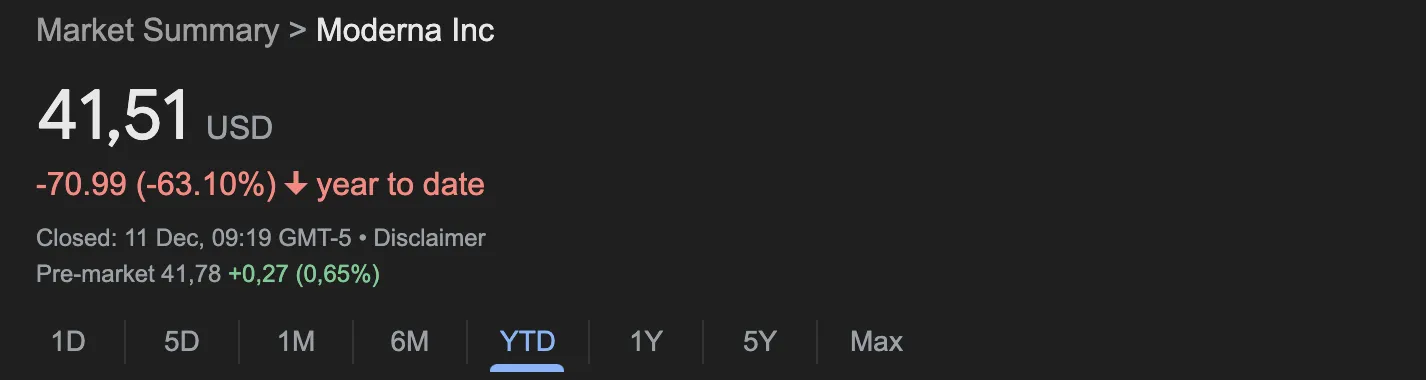
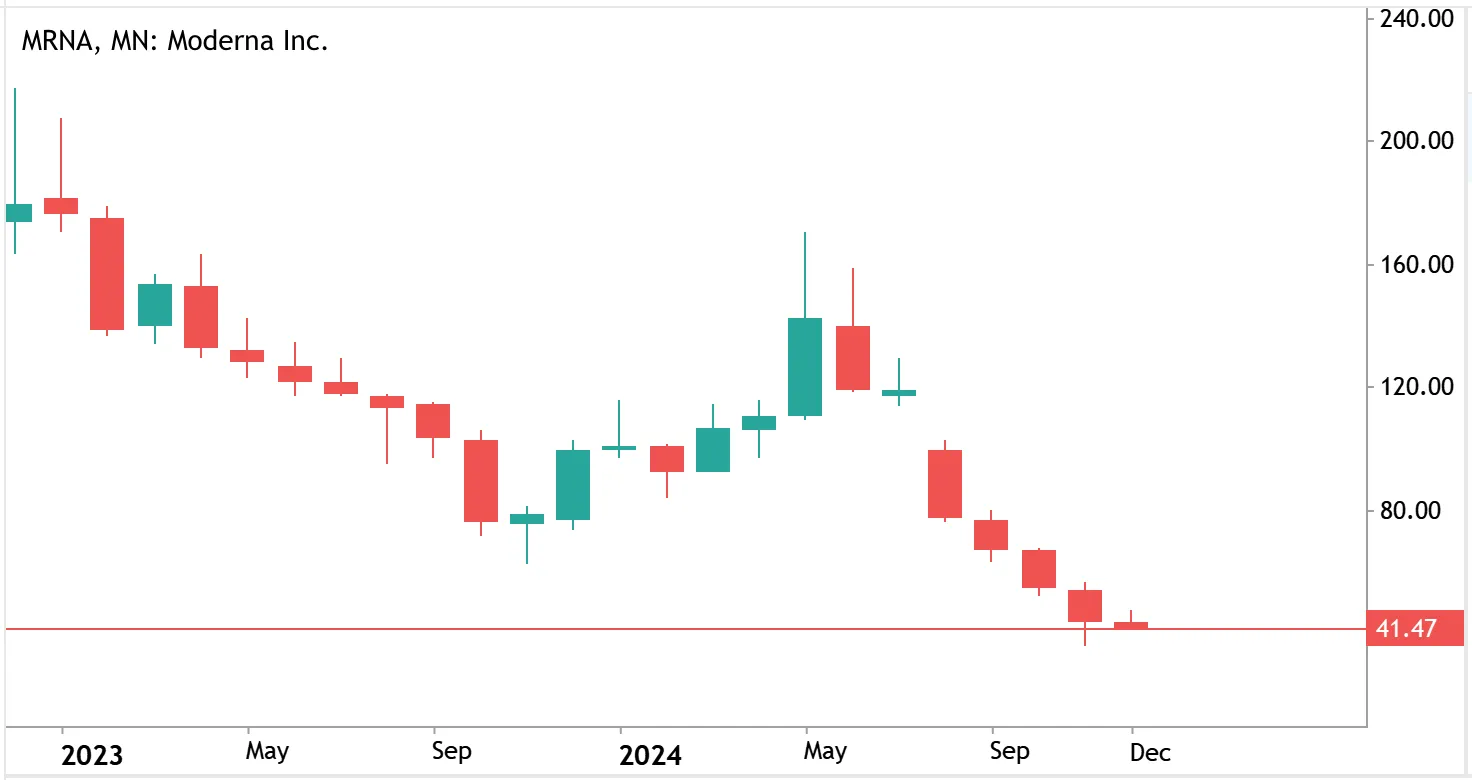
Moderna’s 63% drop this year reflects the challenges biotech firms face in a post-pandemic world. Once a hero of the COVID-19 vaccine race, Moderna hit a 52-week low of $41.52 amid concerns over vaccine demand sustainability and high cash burn. Despite advancing its mRNA technology and gaining regulatory approvals for its RSV vaccine, the company struggled to regain momentum. Analysts’ revised price targets signal lingering uncertainty about its future growth.
A year of contrasts for stocks
2024 was a year defined by extremes. The staggering gains of Nvidia, Amazon, Apple, and Walmart stood in stark contrast to the sharp declines of Intel, Nike, Boeing, and Moderna. These polarising performances highlight the importance of adaptability, innovation, and execution in navigating an ever-changing market. You can monitor the winners for what’s left of 2024, and into 2025 with a Deriv MT5 account. Log in now to take advantage of the indicators, or sign up for a free demo account.

2024 year-end holiday trading blog (holiday calendar)
As we approach the end of 2024, it’s hard to believe another year has flown by. With the holiday season in full swing, markets often settle into predictable seasonal rhythms.
Disclaimer: Trading hours during the holiday season are not final and may change a few days prior.
As we approach the end of 2024, it’s hard to believe another year has flown by. With the holiday season in full swing, markets often settle into predictable seasonal rhythms. December typically sees a slowdown in trading as investors wind down their portfolios, lock in profits, and prepare for a well-deserved break.
Year-end portfolio adjustments can create short bursts of volatility across stocks, forex, and commodities. In forex and commodities markets, thinner holiday liquidity often amplifies price swings, even as overall market activity declines.
While we take time to unwind and recharge, it’s essential to stay mindful of holiday market trends and closures. Let’s dive into the adjusted trading hours and key market schedules for the festive season, so you’re fully prepared as 2024 comes to a close.
Crypto market hours and synthetic indices
On Deriv, you can trade cryptocurrencies and synthetic indices 24/7, even during holidays and public holidays. With heightened volatility in the crypto market, including Bitcoin recently reaching a historic $100,000 milestone, now is a great time to explore these exciting opportunities.
Basket indices market hours
Basket indices are typically available for trading 24/5, but they remain closed on Christmas and New Year’s holidays.

Note: Only Basket Indices for zero spread have the same regular trading hours as the Gold Basket Index, while their holiday status follows that of the standard Basket Indices symbols.
Derived FX market hours
Derived FX are usually available for trading on all weekdays. This year, they will be open for trading at 22:00 GMT on Christmas and New Year’s day, and there will be an early close on Christmas and New Year's eve.

Tactical Indices
Our tactical indices will be available for trading on weekdays within these times. There will be an early 18.45 GMT close on Christmas Eve and an early 23.00 GMT on Christmas and New Year’s day.

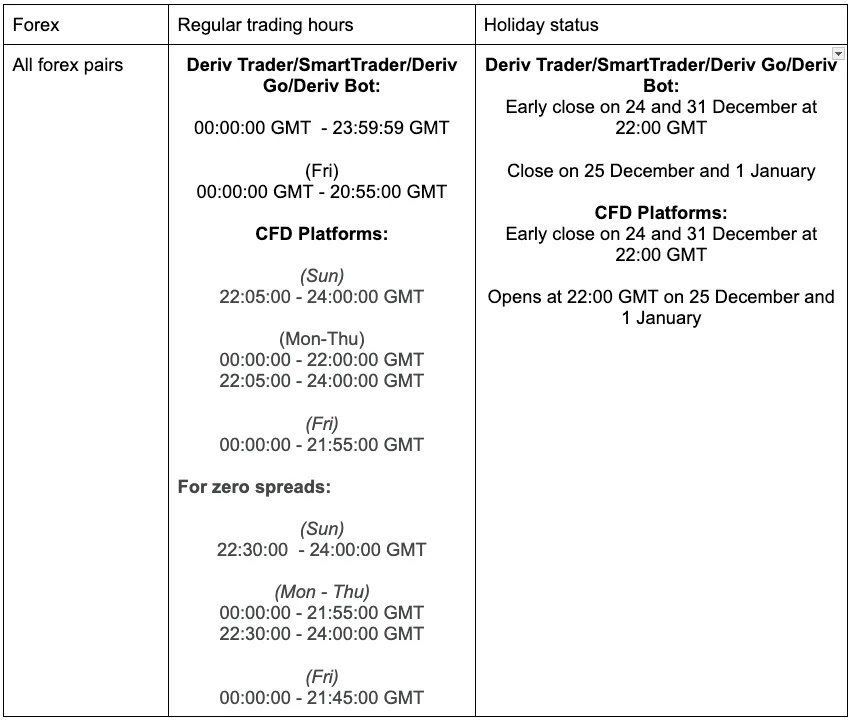
Forex trading market hours
Forex trading is available 24 hours a day, five days a week, making it one of the most accessible and liquid financial markets globally. However, during the holidays, the market often experiences reduced volatility, lower liquidity, and limited trading hours. With fewer economic data releases and decreased activity as participants take time off, currency pairs tend to trade within tighter ranges, showing more consolidative price action. Below is the holiday schedule for all the forex pairs we offer.
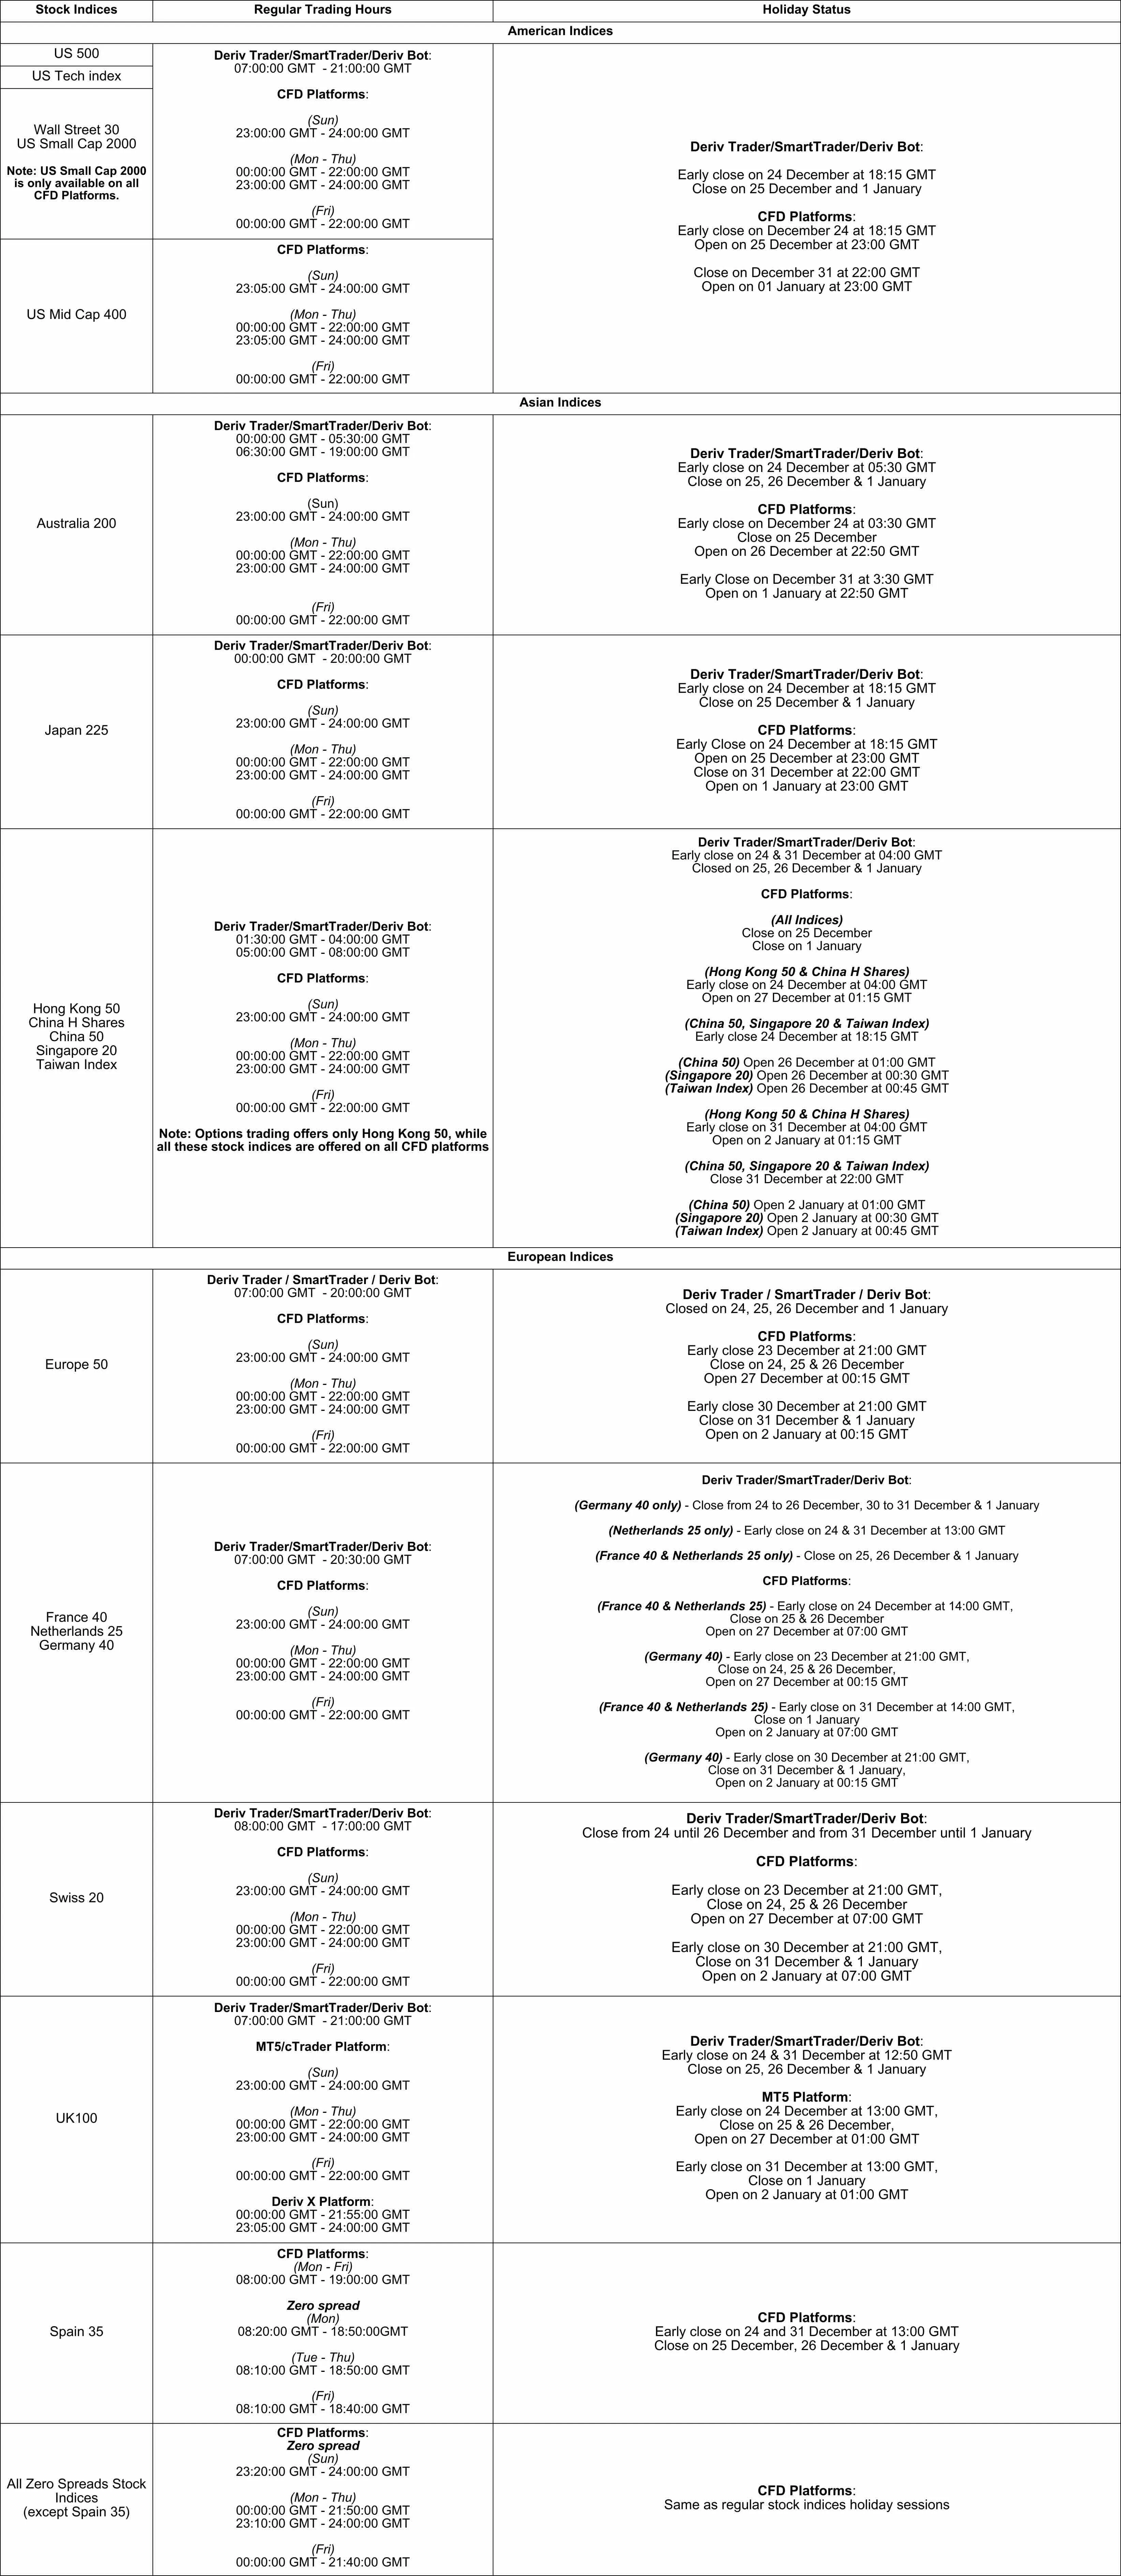
Stock indices market hours
The holiday season often sees lower trading volumes as participants step away. Adapting your strategy by tracking daily volumes and liquidity during market hours is key.
Stock markets operate Monday through Friday on regular business days. During the holiday season, trading schedules may vary. Below are the holiday schedules for some of our major stock indices.
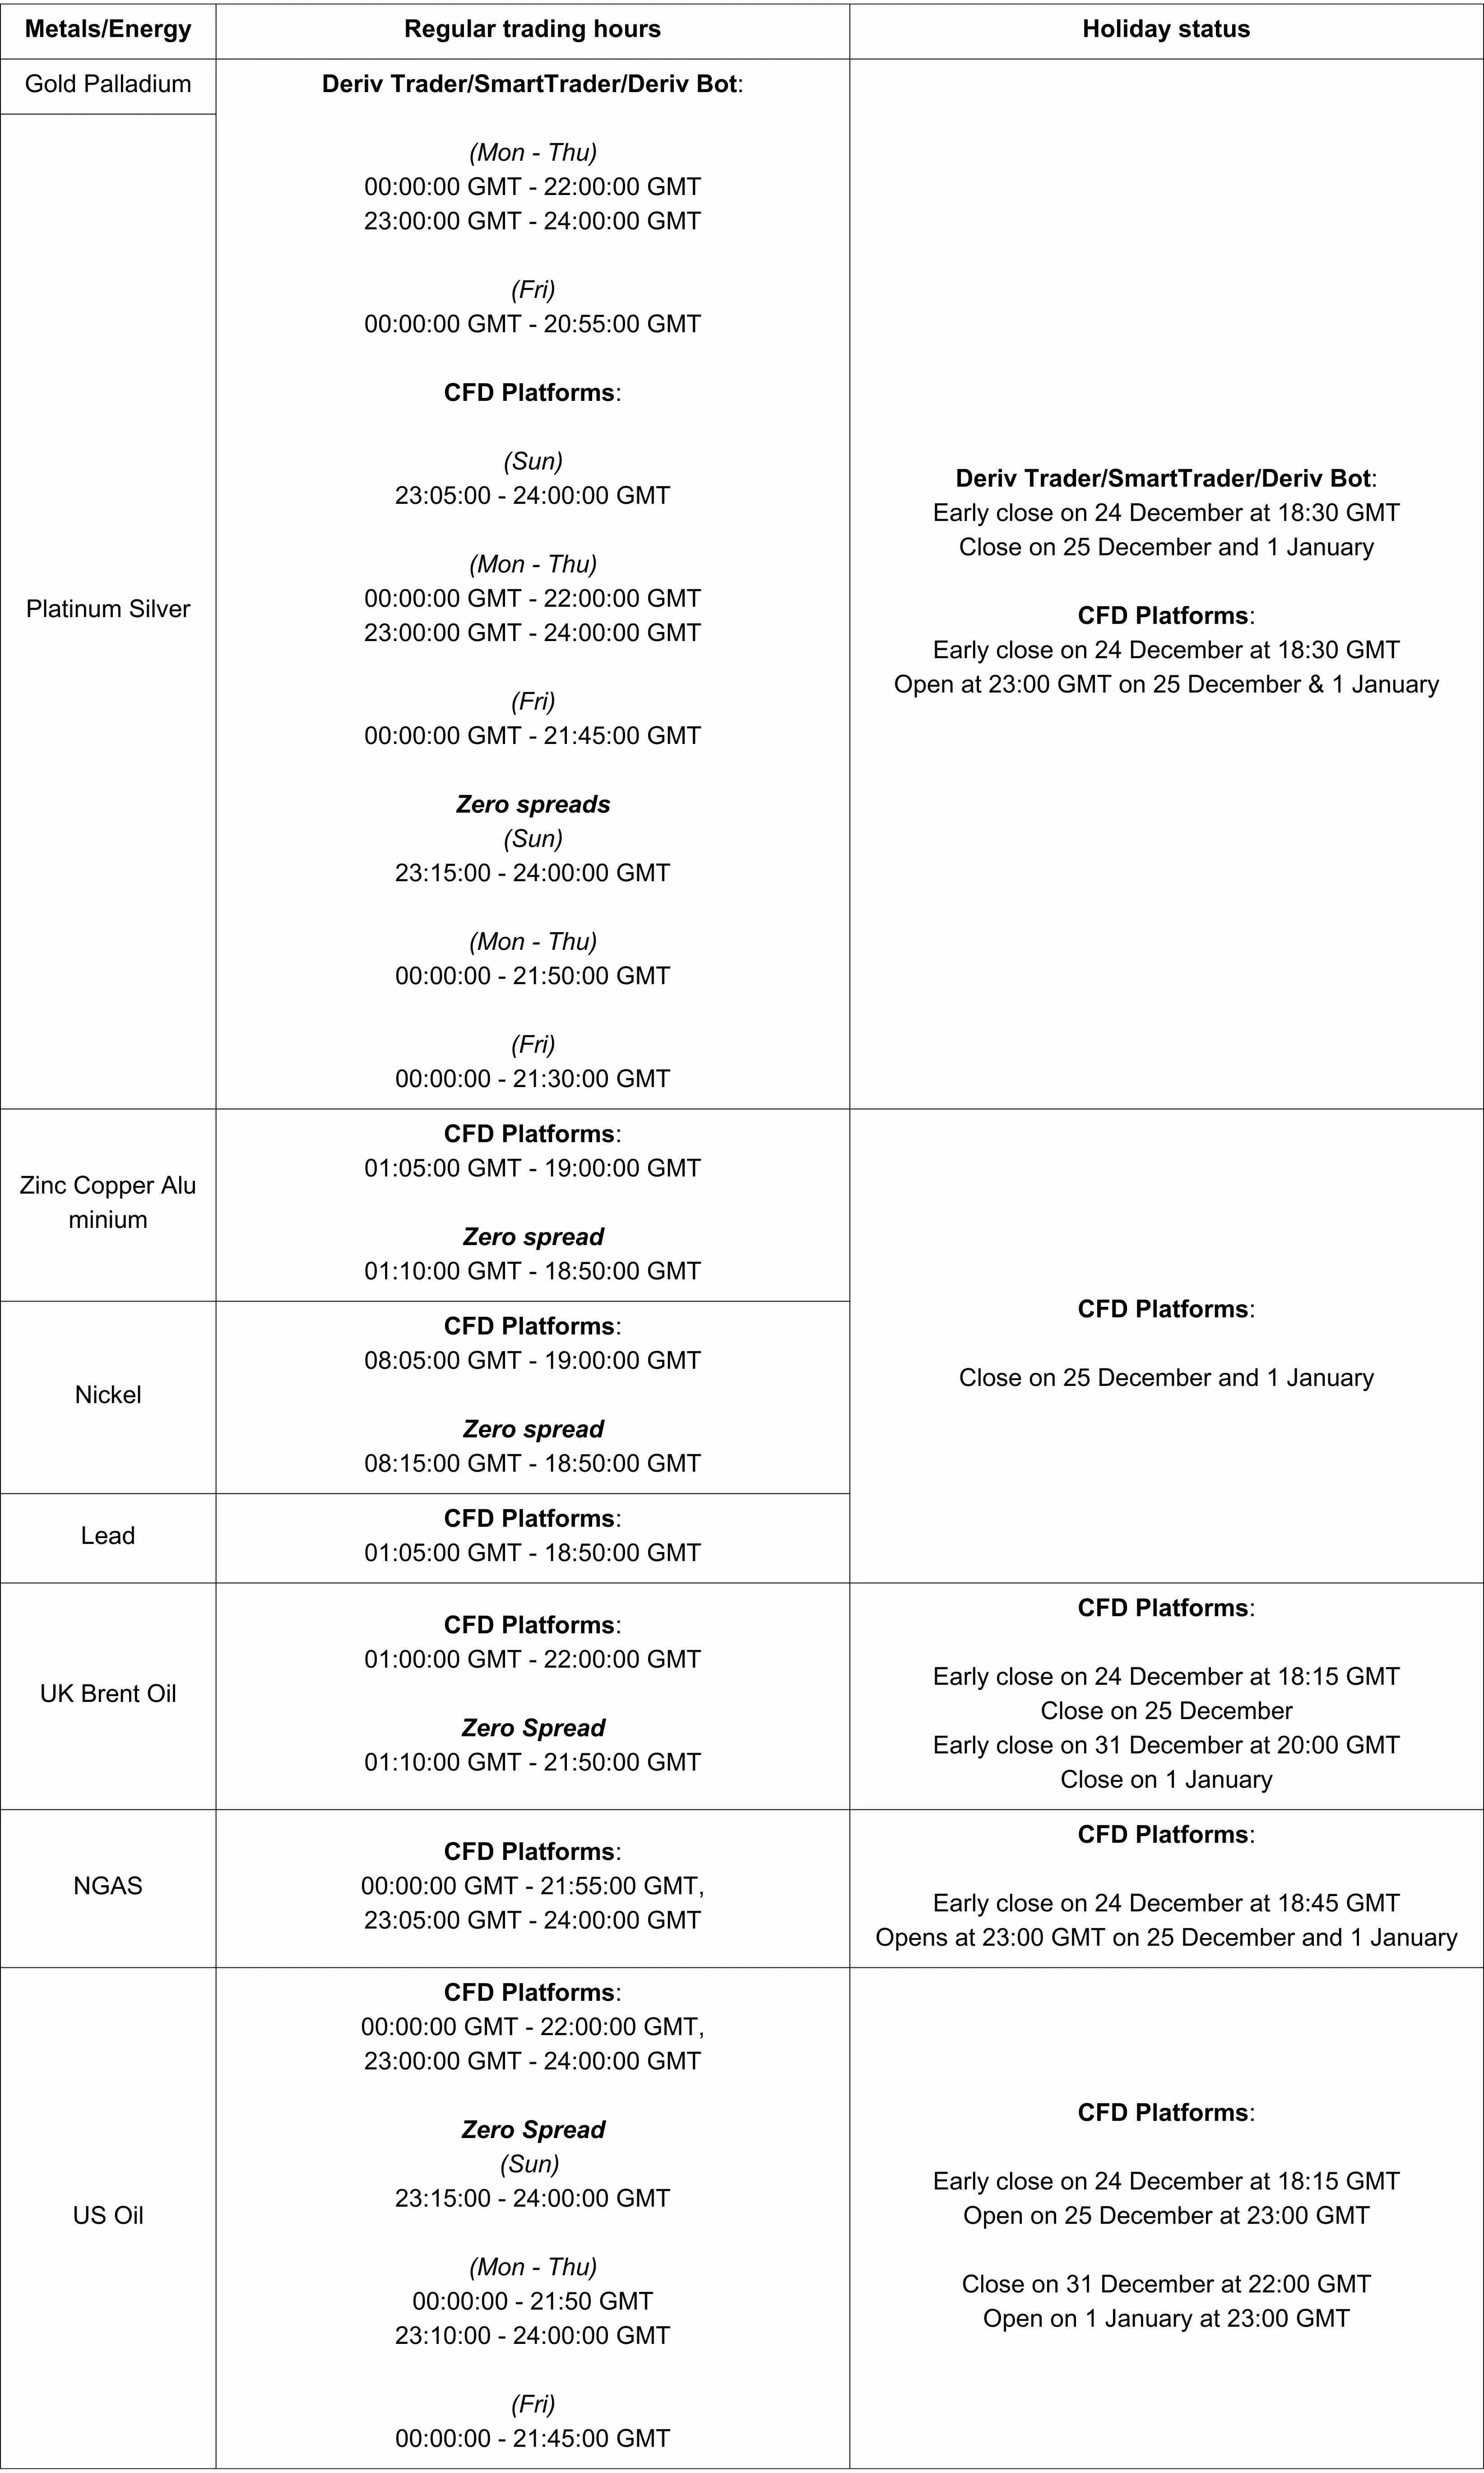
Commodities trading market hours
During the holiday season, trading activity and volumes in commodity markets often decline significantly, making prices more sensitive to even minor fluctuations in supply and demand.
Below is the holiday schedule for all the commodities we offer.
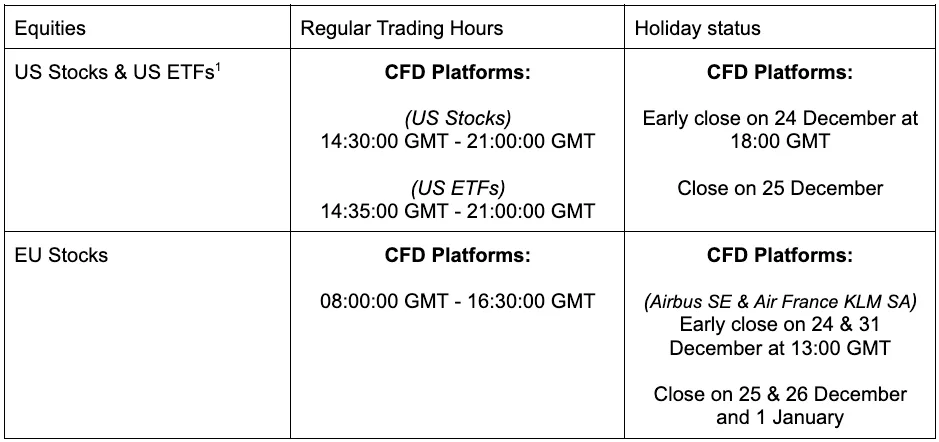
ETFs and Stock market hours
Our stock and ETF offerings will be open to trade on regular trading hours. However, there will be an early close on Christmas eve on regular CFD platforms. Trading will be closed on Christmas day.
For CFD platforms on Airbus SE & Air France KLM SA) there will be an early close on Christmas and New Year’s eve. Trading will remain closed on Christmas, Boxing and New Year’s day.
Platform Market Accessibility
On Deriv, cryptocurrencies and synthetic indices (excluding Forex Synthetic, Basket, and Tactical Indices) are available for trading 24/7, ensuring uninterrupted access even during holidays and public holidays. Stay connected to the markets whenever it suits you!
Trade around market closures as we close 2024
Keep an eye on adjusted trading hours to stay on top of your portfolio while still enjoying some well-deserved downtime this holiday season. With a little balance, you can make the most of the celebrations without losing track of the markets. Here’s to a merry and bright holiday season and smooth trades heading into 2025!

Ethereum’s price drop: Exhaustion or setup for new highs?
Ethereum (ETH) recently experienced a slight pullback, reflecting a common cooling-off period for the crypto market after a week of bullish rallies.
Ethereum (ETH) recently experienced a slight pullback, reflecting a common cooling-off period for the crypto market after a week of bullish rallies. As Bitcoin (BTC) hit a new all-time high of $90,000, many saw it as a catalyst for further gains across the digital asset space. However, Tuesday’s U.S. market session brought a modest cooldown: BTC dipped by 2%, with ETH following at a 3.5% decline.
Despite this temporary setback, many analysts view it as a setup for ETH’s next leg upward, aligning with the pattern of BTC-ETH correlation observed during the 2021 bull cycle. ETH’s ability to mirror BTC’s price action highlights the deep connection between these two leading cryptocurrencies in driving new all-time highs (ATHs) and signalling broader market trends. The co-relation between the two assets has also been rising, turning around the steep drop in January.

Institutional interest boosts Ethereum’s bullish sentiment
Recent inflows into Ethereum spot ETFs highlight rising institutional interest, helping offset some of the effects of the Ethereum Foundation’s ETH selling. On November 11, we saw an impressive $295 million in daily ETF inflows as noted by ETF Store’s CEO Nate Geraci, marking a new milestone. Led by major financial players like Fidelity, BlackRock, and Grayscale, these ETFs attracted over $500 million in total inflows over just four days, showcasing rising confidence among institutional investors.
This wave of capital into Ethereum ETFs has further strengthened ETH’s bullish sentiment and provided added liquidity. Market observers believe that as institutional support for Ethereum deepens, it will become easier for ETH to test and possibly surpass key resistance levels, such as $3,500. Moreover, this robust inflow suggests a positive outlook for ETH in the eyes of institutional players, which may ultimately support a more sustained upward trajectory.
Ethereum price forecast: Higher targets for Ethereum
Several well-regarded analysts are predicting that ETH’s current rally is just the beginning. Seasoned crypto analyst Captain Faibik has shared an optimistic view, noting that ETH is trading within a Broadening Wedge Pattern that could soon see a breakout. He predicts a midterm target of $5,450, a 68% increase from ETH’s recent trading range, which, if achieved, would signify a strong continuation of the current bull run.
Similarly, analyst Ali Martinez expects ETH to rise even further, projecting a price of $6,000 based on ETH’s ability to hold above critical support levels. Martinez points to $2,400 as a key support, and as long as ETH defends this level, it shows strong buying pressure that could propel it toward $6,000. Holding these support levels is often a signal of investor confidence, which can inspire a self-reinforcing cycle of optimism as more buyers enter the market.
FreeDum Fighters (DUM): A rising alternative in the crypto space
In addition to the bullish sentiment surrounding ETH, new projects like FreeDum Fighters (DUM) are making a mark in the cryptocurrency landscape, offering a unique value proposition by tapping into the PoliFi space. FreeDum Fighters weaves together politics and crypto, presenting users with the option to bet on satirical candidates Kamacop and MAGATRON, capturing the attention of investors looking to capitalise on the growing intersection of politics and digital assets.
With a presale funding of over $420,000 and a current token price of just $0.000065, FreeDum Fighters has quickly built a strong community following, attracting over 1,800 Twitter followers and 1,500 Telegram members. The project’s roadmap includes staking pools, weekly debates with rewards, and two completed security audits, all aimed at fostering engagement and trust among investors.
Ethereum technical analysis: A launchpad for further gains?
Ethereum’s recent pullback may only be a temporary pause in a broader upward trend. With institutional inflows into Ethereum ETFs and technical indicators signalling strong bullish momentum, ETH appears poised for continued growth. Analysts are optimistic, with some forecasting price targets as high as $6,000 in the medium term.
At the time of writing, ETH is hovering around $3,150 with bullish indicators still present on the daily chart despite the recent pullback. RSI dipping from the overbought area while price retreats from the upper Bollinger band, hints that upward momentum may take a significant pause before further lows, or new breakout highs.
Buyers could face a hurdle at the $3,370 area, an area that held last time, with a further move likely to face resistance at the $3,500 mark. On the downside, price could find support at the $3,116 level, with a further slump likely finding support at the 100-day moving average.

As for now, you can get involved and speculate on the price of these two incredible assets with a Deriv MT5 account. It offers a list of technical indicators that can be employed to analyse prices. Log in now to take advantage of the indicators, or sign up for a free demo account. The demo account comes with virtual funds so you can practise analysing trends risk-free.
Sorry, we couldn’t find any results matching .
Search tips:
- Check your spelling and try again
- Try another keyword