Results for

Trump tariff impact on currencies: Will his strategy backfire?
According to analysts, the Japanese Yen has hit a two-week low against the US dollar, with USD/JPY climbing above 149.50 during Tuesday's Asian session.
According to analysts, the Japanese Yen has hit a two-week low against the US dollar, with USD/JPY climbing above 149.50 during Tuesday's Asian session. This marks the third straight day of losses for the Yen, as global risk appetite improves on the back of China's economic stimulus efforts and hopes for progress in Ukraine peace talks.
Trump’s trade policies and global currency shifts
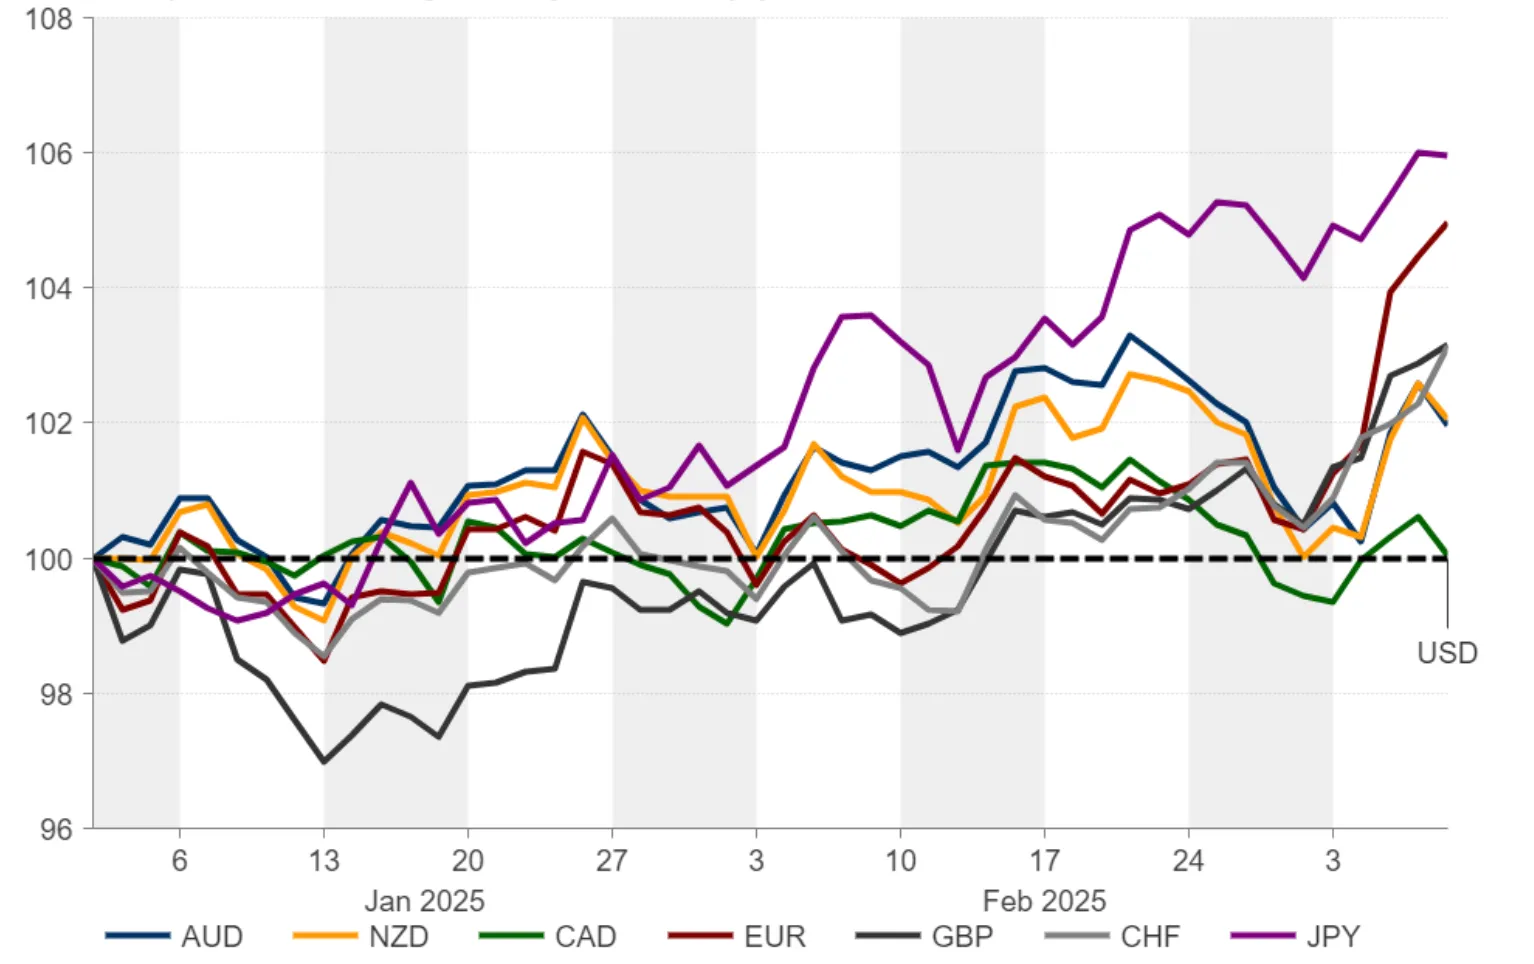
Analysts also note that Donald Trump's second presidency is having a dramatic impact on global currencies-though not in the way investors initially expected. The U.S. dollar has weakened this year against most major developed market currencies, with the exception of the Canadian dollar, as concerns grow that tariff uncertainty is harming the U.S. economy.
Tariffs are often expected to strengthen the dollar, but when imposed on close trading partners, they can weaken confidence in the U.S. economy. As recession risks in the U.S. increase, investors are shifting their focus to alternatives like the euro, Swedish crown, and Japanese yen.

Risk-on mood pressures safe-haven Yen
Markets have been lifted by China's latest push to boost domestic spending, an initiative aimed at strengthening household incomes and consumption. Adding to the optimism is growing speculation about potential Ukraine peace talks involving US President Donald Trump and Russian President Vladimir Putin. With investors feeling more confident, traditional safe-haven assets like the Japanese Yen are losing some appeal.
At the same time, traders are repositioning ahead of a crucial week for central banks. Both the Bank of Japan (BoJ) and the US Federal Reserve (Fed) are set to announce policy decisions on Wednesday, making this a key moment for currency markets.
Despite its current slide, the Yen may not have much further to fall. Japan's annual Shunto wage negotiations have yielded positive results, fueling expectations that the BoJ will stay on its slow but steady path toward tightening monetary policy. Higher wages are expected to boost consumer spending and inflation, giving the central bank more room to continue shifting away from its ultra-loose stance.
Fed vs. BoJ: Rate divergence in play
One factor that could limit further Yen weakness is the narrowing interest rate gap between Japan and the U.S. Traders are now pricing in multiple Fed rate cuts this year, with reductions expected in June, July, and October. Concerns about a U.S. economic slowdown-driven by potential tariff risks, a cooling labor market, and easing inflation-are fueling expectations that the Fed will start cutting sooner rather than later.
Monday’s U.S. retail sales data reinforced these concerns, with February figures rising just 0.2%-far below the expected 0.7%. This underwhelming consumer spending data strengthens the case for the Fed to pivot toward rate cuts.

Meanwhile, Japan's Finance Minister Katsunobu Kato signalled a more hands-off approach to bond markets on Tuesday, stating that yields should move according to market forces. This follows a record spike in Japan’s 40-year government bond yield, hinting that policymakers may be growing more comfortable with a gradual shift away from extreme monetary easing.
Currency movers: Yen and Euro take the lead
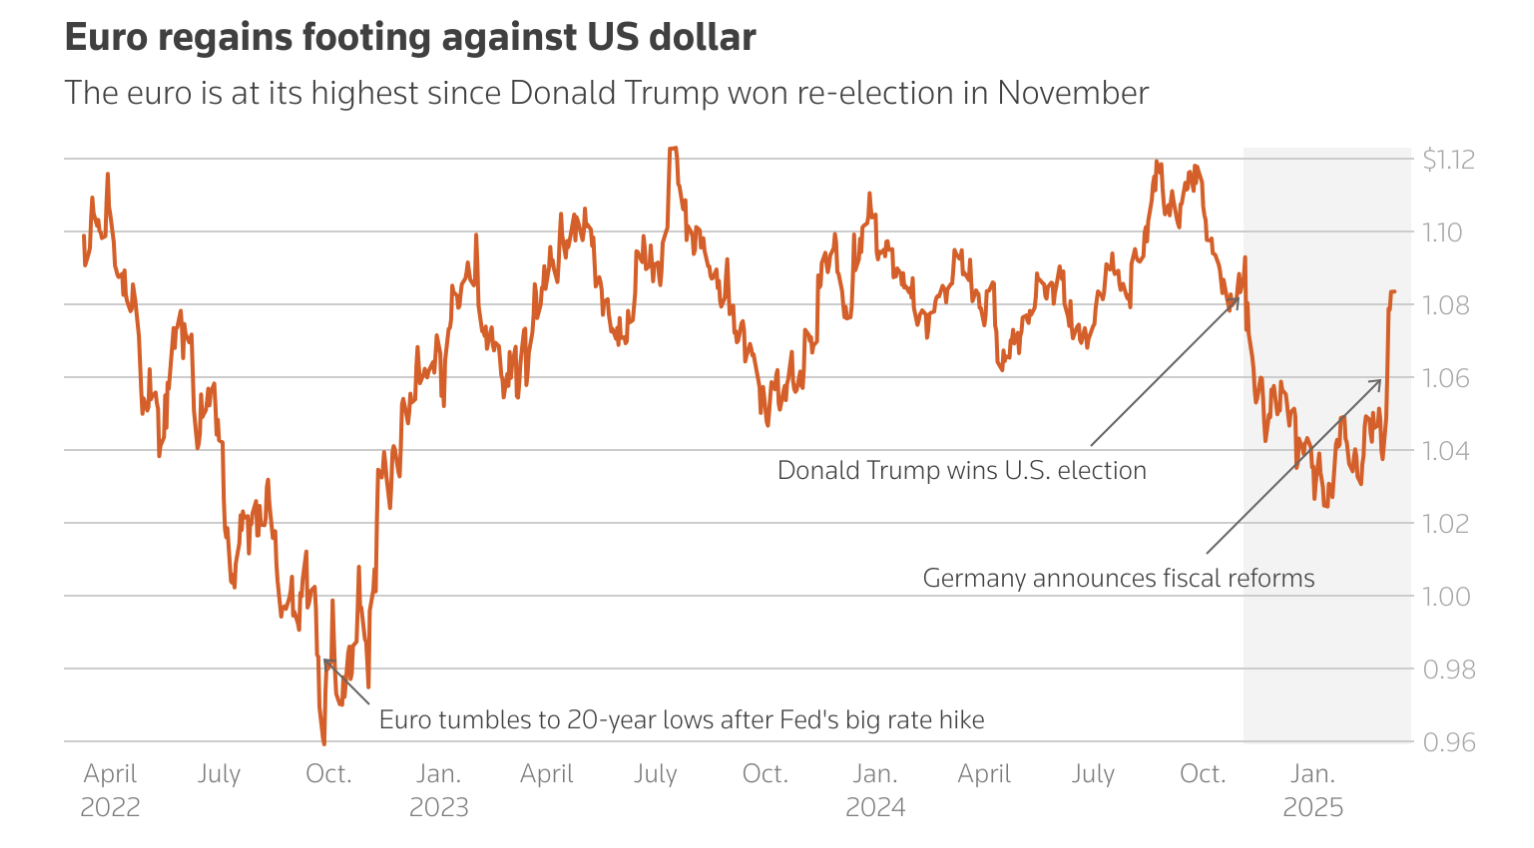
The Euro has also been a standout performer in the global currency market. Germany's historic proposal to ramp up defense and infrastructure spending has propelled the euro to its highest level since the U.S. election, posting its biggest weekly gain versus the dollar since 2009 according to analysts..
With the European Central Bank nearing the end of its easing cycle and European defense spending rising, analysts see further gains ahead, with BofA predicting the euro could reach $1.15 by the end of 2025.
The Japanese yen has been another major gainer, strengthening by approximately 6% against the dollar so far this year. This surge is driven by higher Japanese interest rates and safe-haven demand amid global uncertainty. Investors looking to hedge against a potential U.S. slowdown are turning to Japan due to the likelihood of lower U.S. Treasury yields.
Yen-positive developments at home-including companies meeting union demands for substantial wage increases-could push the BoJ to accelerate rate hikes, further lifting the yen's appeal after four straight years of declines. Speculators have placed their largest-ever bets on the yen continuing to rise.

China’s yuan, despite facing significant tariffs under Trump’s trade policies, has also strengthened this year, trading around 7.25 yuan per dollar. Some expected Beijing to allow its currency to weaken to counteract tariff impacts, as it did during the 2018-2019 trade war. However, China has still managed a relative trade-weighted depreciation against key trading partners, supporting its exporters.
With both the BoJ and the Fed set to take center stage, the USD/JPY pair is in a wait-and-see mode. The direction of the Yen in the coming days will largely depend on the outcome of these central bank decisions-along with any major developments in Ukraine peace negotiations and the evolving impact of Trump’s tariff policies.


Gold price hits $3,000 as stocks rebound: Is there more upside ahead?
Gold made history, breaking past the $3,000 per ounce mark for the first time ever, before a marginal retreat.
Gold made history, breaking past the $3,000 per ounce mark for the first time ever, before a marginal retreat.
Investors continue to turn to the precious metal amid economic uncertainty, while stock markets found some relief on news that a U.S. government shutdown has been averted. This rally, which has seen gold climb nearly 14% since the start of 2025, highlights its status as a go-to safe-haven asset in volatile times. Heightened global risks, including trade tensions and geopolitical instability, are further fueling demand.
The ongoing trade war between the U.S. and key partners is unsettling markets according to analysts. President Trump recently threatened a 200% tariff on European alcohol imports in response to the EU’s planned levies on American whiskey-retaliation for Trump’s newly imposed 25% tariffs on steel and aluminum.
A weaker U.S. dollar is also boosting gold’s appeal. The University of Michigan’s Consumer Sentiment Index dropped to 57.9-its lowest since November 2022-falling short of expectations and signaling declining consumer confidence.
Geopolitical tensions are adding to the uncertainty. The Houthis claimed responsibility for an attack on the USS Harry S Truman and its escort vessels in the northern Red Sea, escalating concerns in the region. "With ongoing geopolitical risks and trade disputes, gold demand remains strong," said Suki Cooper, a precious metals analyst at Standard Chartered.
However, easing tensions between Russia and Ukraine could weigh on gold prices. The U.S. and Ukraine have proposed a 30-day ceasefire to Russia, and Trump’s envoy, Steve Witkoff, suggested that a direct conversation between Trump and Putin is likely, with Putin open to discussing peace terms.
Despite potential diplomatic breakthroughs, gold’s strong momentum reflects continued investor caution amid trade conflicts, a weaker dollar, and geopolitical instability.
Nvidia bounces back as AI optimism stays strong
While gold shines, Nvidia is making moves of its own. The tech giant saw a 3.2% jump to $119.32 in Friday trading, fueled by growing excitement around AI. The boost came after Foxconn, the Taiwanese electronics powerhouse, projected that its AI server revenue would cross NT$1 trillion ($30 billion) in 2025.
Foxconn Chairman Young Liu’s forecast of AI server revenue doubling quarter-over-quarter and year-over-year signals that demand for AI products-especially Nvidia’s GPUs-remains robust, despite broader economic concerns. Inflation and fresh tariff policies from President Trump have stirred market uncertainty, but the AI sector continues to show resilience.
Investors are also eyeing Nvidia’s upcoming GPU Technology Conference next week, where CEO Jensen Huang will take the stage on March 18. Analysts expect big announcements on future AI chip developments, possibly setting the stage for a broader tech rebound. Wedbush analyst Dan Ives even called it a potential “turning point for tech stocks.”
Central bank stockpiling adds to appeal
Another key factor behind gold’s surge? Central banks aren’t slowing down their gold purchases. According to AJ Bell investment director Russ Mould, central banks snapped up around 1,045 tonnes of gold last year-marking the third consecutive year of buying above the 1,000-tonne mark.

China, in particular, has been aggressively adding to its bullion reserves for four straight months as of February. This trend highlights a broader move among central banks to reduce their dependence on the U.S. dollar, especially after the freezing of Russian central bank reserves in 2022. As GoldCore CEO David Russell put it, “Central banks are making record-level gold acquisitions, seeking to diversify away from an increasingly volatile U.S. dollar.”
What’s next? more upside or a cooling-off period?
Goldman Sachs thinks there’s still room for gold to climb beyond its $3,100 year-end target. The bank points to ongoing U.S. policy uncertainty and strong central bank demand as key drivers. Even if geopolitical tensions ease-such as a potential Russia-Ukraine ceasefire—gold buying is expected to stay higher than pre-2022 levels.
The World Gold Council’s global head of research, Juan Carlos Artigas, sees several factors supporting gold demand: “heightened geopolitical and geo-economic risk, higher inflation expectations, potentially lower rates, and the uncertainty that markets are feeling.”
On the stock market side, things are looking slightly brighter for now. The risk of a U.S. government shutdown is fading, with S&P 500 futures climbing 1% after Senate Democratic leader Chuck Schumer backed a stopgap funding bill. That’s given markets a bit of breathing room, though broader concerns about tariffs and economic policy remain in play.
Technical insights: What investors should watch next
With gold in uncharted territory above $3,000, investors are weighing whether the rally has more legs or if a pullback is coming. Central bank buying, global tensions, and economic uncertainty all suggest there’s still strong support for higher prices.
For tech investors, all eyes are on Nvidia’s GPU Technology Conference, which could be a major catalyst for AI stocks. If Nvidia delivers big updates on its next-gen chips, it could spark renewed momentum for the sector.
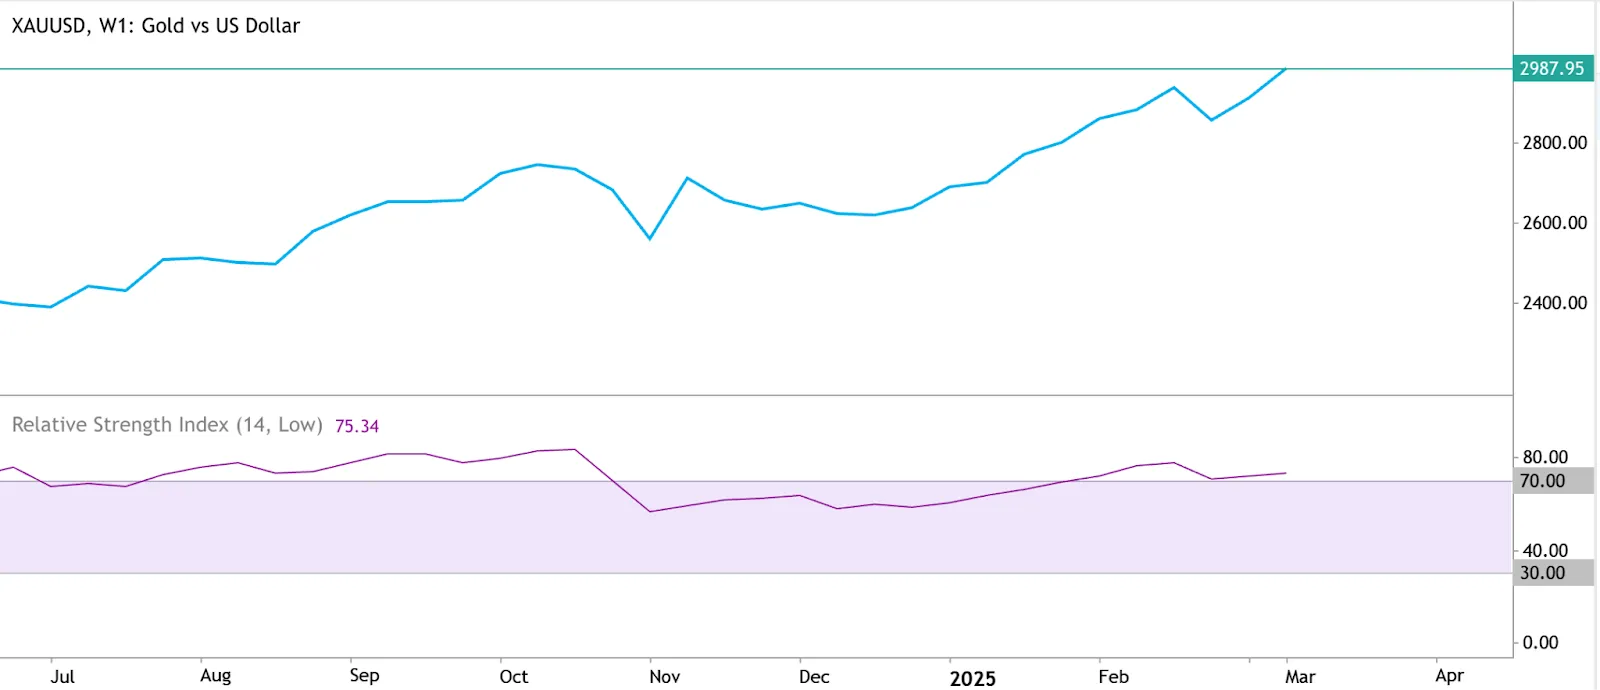
Key levels to watch out for are the $3,000 and $3,005 mark on the upside and the $2,860 mark on the downside. A significant dump could see prices collapse and gain some support at the $2,620 mark. Though a strong upward bias remains, RSI towering past 70 hints at overbought conditions- signalling a potential slowdown.

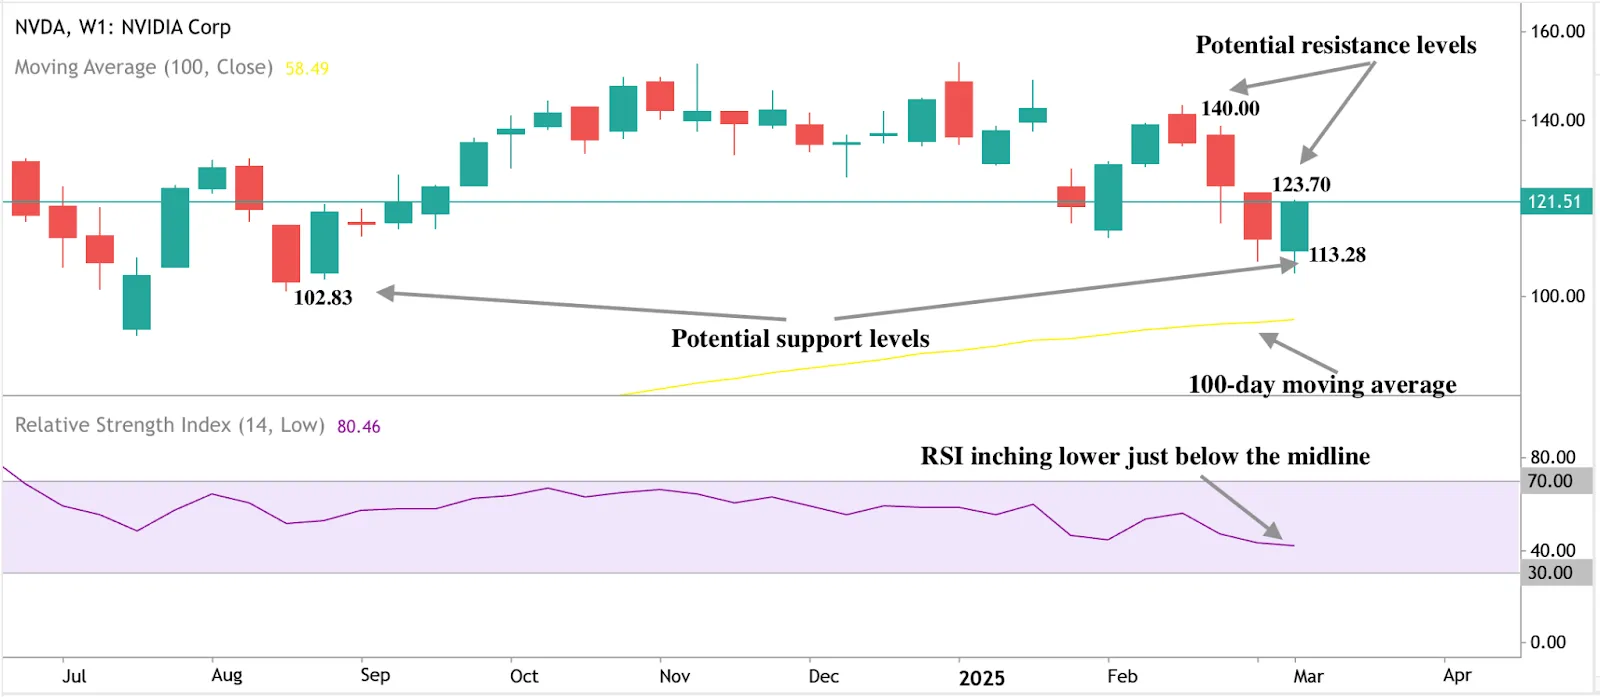
As for Nvidia, the key levels to watch on the upside are $123.70 and $140.00, while on the downside, key levels to watch are $113.28 and $102.83.
You can get involved and speculate on the price of these two incredible assets with a Deriv MT5 account and a Deriv X account.

Gold price prediction 2025: How high can precious metals rally?
Gold is on a roll, inching closer to the highly anticipated $3,000 per ounce milestone.
Gold is on a roll, inching closer to the highly anticipated $3,000 per ounce milestone. In early U.S. trading on Thursday, gold climbed another $9.50 to hit $2,955.30, supported by yet another mild U.S. inflation report. Meanwhile, silver took a slight step back, slipping $0.083 to after making impressive gains earlier in the week.
Inflation slows, precious metals rally
Inflation data out this week has made a compelling case for the Federal Reserve to start cutting interest rates sooner rather than later. The latest Producer Price Index (PPI) report revealed that wholesale inflation remained flat in February-a far cry from the expected 0.3% increase and a sharp drop from January’s 0.4% rise. Even more surprising? The "core" PPI, which strips out food and energy prices, actually declined by 0.1% when analysts were bracing for a 0.3% gain.
This follows Wednesday’s Consumer Price Index (CPI) report, which also came in below expectations. Year-over-year, the headline CPI rose 2.8% in February, while core CPI ticked up 3.1%-both cooling from previous months.
So, what does this all mean? Lower inflation strengthens the argument for the Fed to cut interest rates in the coming months, possibly as soon as June. And that’s good news for gold and silver, which tend to do well when interest rates drop. Why? Because lower rates make non-yielding assets like precious metals more attractive compared to interest-bearing investments.
Trade worries stoke safe-haven demand
Beyond inflation and interest rates, geopolitical and trade tensions are adding more fuel to gold and silver’s rally. The latest concern? Rising friction between the U.S. and its major trading partners.
U.S. Commerce Secretary Howard Lutnick recently stirred the pot, saying a recession would be "worth it" to implement President Trump’s economic policies. Meanwhile, Trump has made it clear he plans to hit back against the European Union’s counter-tariffs, raising fears of an all-out U.S.-EU trade war.
John Ciampaglia, CEO of Sprott Asset Management, summed it up well: "The potential impact of the tariff and trade threats are impossible to model, forcing the Fed to gauge economic data to help it determine its next move."
With so much uncertainty in the air, investors are increasingly turning to gold and silver as safe-haven assets to protect their portfolios.
Gold at $3000 per ounce?
Market experts remain bullish on precious metals, especially gold. Alex Ebkarian, chief operating officer at Allegiance Gold, didn’t mince words: "Gold is in a secular bull market. We forecast prices to trade between $3,000-$3,200 this year."
Standard Chartered analyst Suki Cooper pointed to strong ETF (exchange-traded fund) demand and continued central bank buying as major forces driving the rally. "Geopolitical uncertainty and the continued uncertainty created by tariff changes have really continued to stoke appetite for gold," she explained.
What’s next for Gold and Silver?
The spotlight is now on the Federal Reserve’s monetary policy meeting next Wednesday. While no immediate changes are expected to interest rates-currently at 4.25%-4.50%-investors will be hanging on every word from Fed officials for clues about potential rate cuts.
The Fed has already lowered rates by 100 basis points since September but hit the pause button in January. Many traders now believe June could be when the easing cycle resumes, giving another boost to precious metals.

As for silver, despite Thursday’s minor dip, the metal remains near its monthly high of $33.40. Given the current economic backdrop, silver continues to benefit from both monetary policy expectations and safe-haven demand.
Gold and Silver 2025 insights: Key trading levels to watch
Gold shows clear bullish bias on the daily chart, however prices towering past the upper bollinger band as well RSI breaching the 70 mark hints at overbought conditions. A further push up could see Gold hit the $3,000 all-time high. If gold slides on the other hand, the key levels to watch will be $2,880 and $2,835.

Silver is also seeing significant upside with clear bullish bias evident. However, prices are inching past the upper bollinger band as RSI towers slightly past 70- all signs of overbought conditions. Key levels to watch are the $34.000 target on the upside and on the downside, $32.528, and $32.000.

As for now, you can get involved and speculate on the price of these two precious metals with a Deriv MT5 account or Deriv X account.

Tariffs and Inflation: Will these be the biggest market movers of 2025?
The financial markets are currently navigating through turbulent waters as two powerful forces-tariffs and inflation-create a complex economic landscape.
The financial markets are currently navigating through turbulent waters as two powerful forces-tariffs and inflation-create a complex economic landscape. Recent developments in gold and copper markets illustrate how these dynamics are shaping investor behaviour and commodity prices. But which will ultimately drive more market volatility?
Let's explore the interplay between these economic factors.
Gold rises as tariffs and rate cut expectations converge
Safe-haven gold has been on an upward trajectory, recently trading at $2,933 with gains of 0.63%. This rise comes despite higher US Treasury yields and a stronger US Dollar-typically factors that would pressure gold prices downward.
The latest US inflation data showed consumer prices increasing by just 0.2% in February, a welcome cooldown after January's 0.5% surge. This softer inflation report has reinforced market expectations that the Federal Reserve might implement interest rate cuts in the near future.

However, market analysts caution that this inflation improvement could be short-lived. President Trump's aggressive tariff policy, which saw 25% duties on all US steel and aluminum imports take effect recently, threatens to trigger a second wave of inflation as import costs rise across the board.
"Lower US inflation may give the Fed more leeway to cut interest rates," noted industry experts, highlighting how non-yielding gold typically thrives in low-interest environments and during periods of economic uncertainty.
Copper markets brace for Tariff impact
Meanwhile, the copper market is experiencing its own tariff-driven dynamics. Despite a recent 0.8% decline to $4.67 per pound for May delivery, copper prices remain 16% higher year-to-date in 2025.
President Trump's executive order initiating a Section 232 review of copper imports has created significant market anticipation. Major traders like Glencore and Trafigura are reportedly rushing to ship copper to the US ahead of potential tariff announcements, creating an interesting market arbitrage.
With tariffs not yet in place, there is a strong incentive to send metal to the U.S., which is tightening markets in other regions, according to a recent analysis by Morgan Stanley. The bank remains optimistic about copper, calling it their preferred base metal despite potential concerns about future demand.
This tariff anticipation has created a notable price gap between the London Metal Exchange (LME) and Comex prices, with US copper prices trading at premiums of up to $1,300 per tonne. Consequently, US copper inventories have surged to their highest levels in over six years.

Inflation vs tariffs: The dual threat to market stability
The convergence of tariff policies and inflation concerns creates a particularly volatile environment for investors. On one hand, aggressive tariffs on imports are expected to raise costs across the economy, potentially reigniting inflation that had begun to cool. On the other hand, existing inflation pressures continue to influence central bank policy and market sentiment.
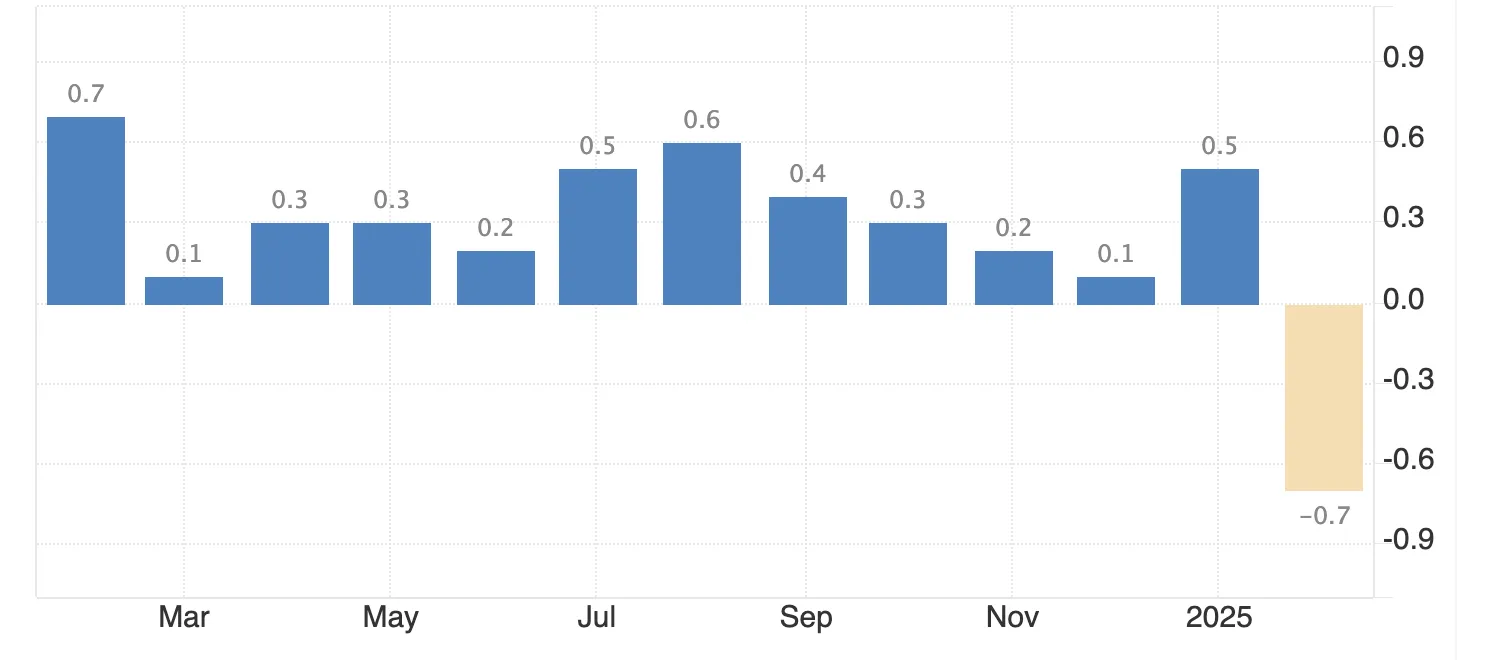
Adding to these concerns, recession fears have resurfaced in the US, with President Trump acknowledging the country is in "a period of transition." Meanwhile, China continues to battle deflation, with its Consumer Price Index falling 0.7% year-over-year in February-its fastest decline in 13 months.
Central bank gold reserves surge
Amidst this uncertainty, central banks globally continue to accumulate gold reserves. The World Gold Council revealed that the People's Bank of China and the National Bank of Poland added 10 and 29 tonnes respectively in the first two months of 2025. This ongoing institutional demand provides further support for gold prices, which analysts suggest could test the $2,950 mark soon.
The question remains: Will tariffs and inflation be the biggest market movers of 2025?
Their combined impact will depend on how they evolve. If tariffs drive a new wave of inflation, markets could face heightened volatility. However, if inflation stabilises despite trade pressures, other forces may take the lead in shaping market trends this year.
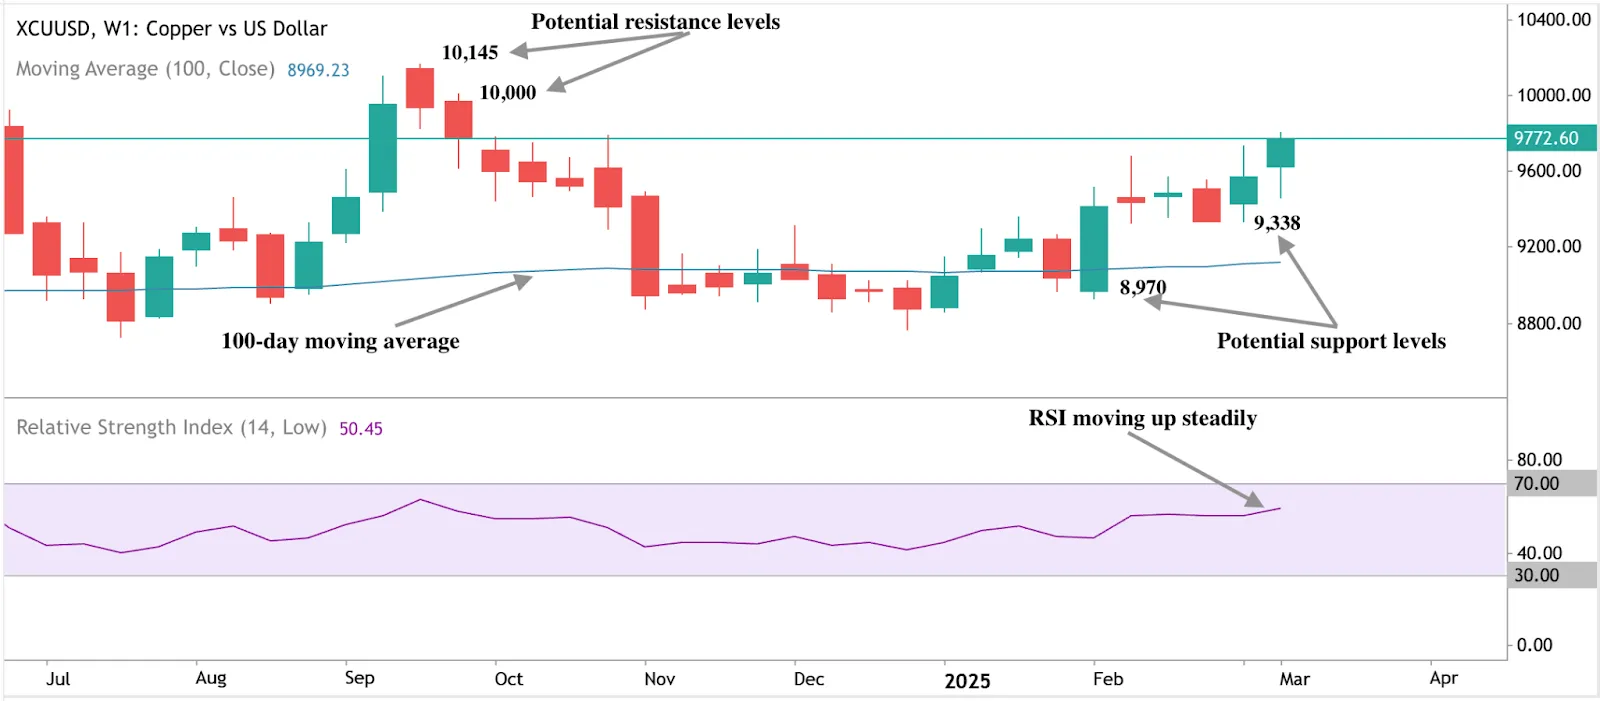
Technical analysis: Key levels to watch
At the time of writing, Copper is rising with bullish signals evident as prices remain above the moving average with RSI rising steadily. Key levels to watch on the upside are $10,000 and $10,145. On the downside, key levels to watch are $9,338 and $8,970.
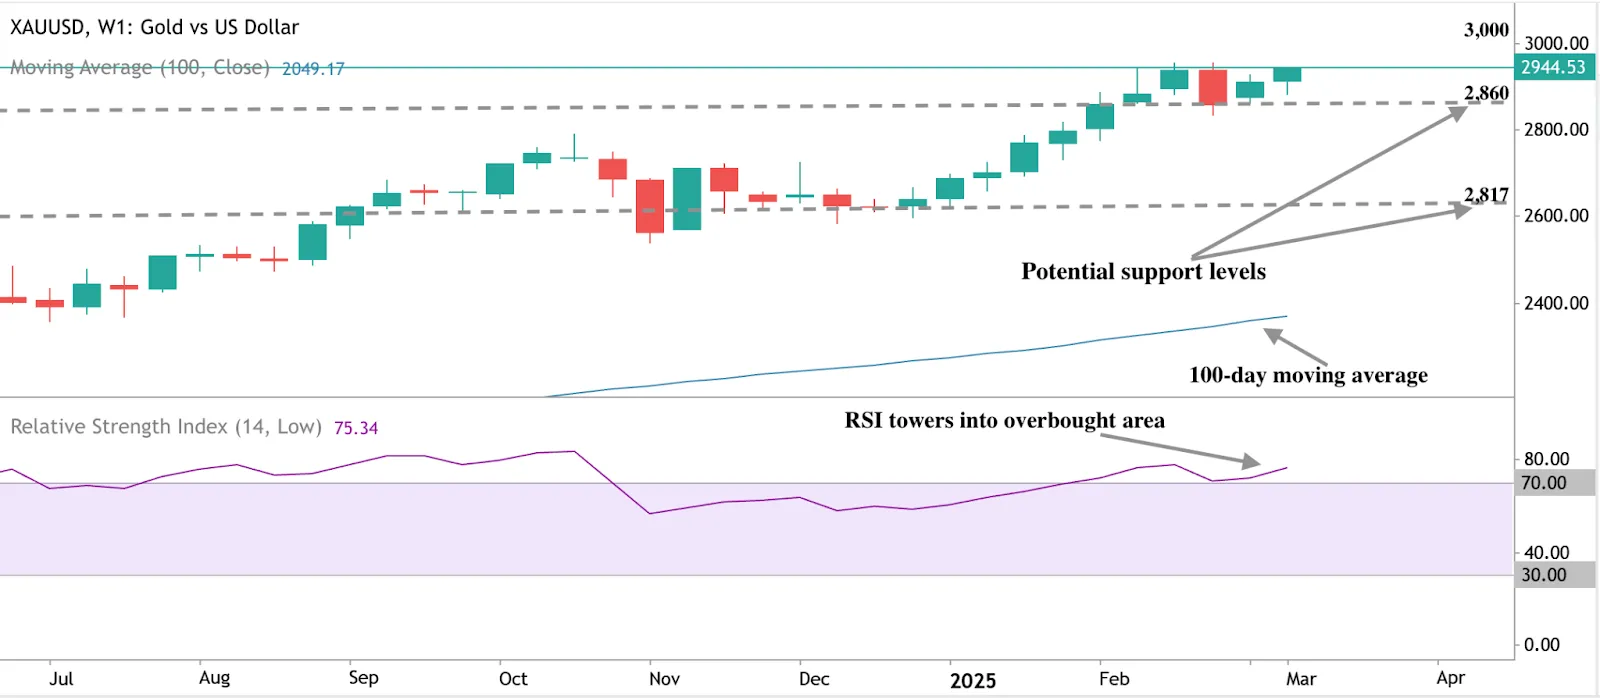
Gold is also surging within striking range of $3,000. Despite clear bullish signs, RSI towering past 70 hints at overbought conditions and a potential reversal.
Key levels to watch are the $3,000 target on the upside, and on the downside $2,860 and $2,817.
Source: Deriv MT5
You can get involved and speculate on the price of these two incredible assets with a Deriv MT5 account and Deriv X accounts.
Bitcoin vs Gold: The battle for safe haven status in 2025
In a week where Bitcoin stabilised at $81,000 after a 2.6% slide, the age-old debate between digital and physical gold has resurfaced with renewed intensity.
In a week where Bitcoin stabilised at $81,000 after a 2.6% slide, the age-old debate between digital and physical gold has resurfaced with renewed intensity. As economic uncertainties loom with President Trump's trade wars and recession fears, investors and traders are questioning which asset truly deserves the safe haven crown.
Current market dynamics: A tale of two assets
Bitcoin has shed a quarter of its value since Trump's January inauguration, despite the administration's efforts to establish Trump’s strategic reserve and ease regulatory pressures. Meanwhile, gold rallied, climbing to $2,917 on Tuesday - up over 1% as investors seek shelter from economic turbulence.

This divergence highlights a fundamental market truth according to experts: Bitcoin isn't yet the hedge many hoped it would be.
"Bitcoin is moving with equities, an example of its role as a macro-sensitive asset rather than a pure hedge," notes Mena Theodorou, Co-founder at crypto exchange Coinstash.
Indeed, while Bitcoin enthusiasts have long promoted it as "digital gold," its price movements continue to mirror risk assets like tech stocks rather than traditional safe havens.
The safe haven question: Bitcoin as digital Gold?
The short answer according to experts is no – at least not in 2025. Gold's historical reliability during crises remains unmatched, while Bitcoin's volatility continues to raise eyebrows among conservative investors.
During the COVID-19 pandemic, gold reached an all-time high around $2,070 per ounce, providing stability when markets collapsed. Bitcoin, by contrast, plunged nearly 50% in a single day in March 2020 before staging a dramatic recovery.
Gold vs BTC investment: what separates these assets fundamentally?
Gold: Tangible, requires physical storage, universally accepted, and has thousands of years of proven reliability.
Bitcoin: Digital, decentralised, allows seamless global transactions, but faces regulatory uncertainties and technological vulnerabilities.
Mark Hiriart of Zerocap sees opportunity in this distinction: "Bitcoin's dips have historically been 'golden buying opportunities'," he notes. "Weathering this storm with patience could pay off, especially if $75,000 holds as a floor."
Expert predictions: Bitcoin’s market volatility
Market analysts remain cautious about Bitcoin's immediate prospects, especially given its correlation with traditional markets.
Theodorou predicts Bitcoin could slide below $70,000, potentially retesting "its next major support level, around $69k, which also marks [a] previous all-time high."
Chris Mills and David Brickell of London Crypto Club agree that Bitcoin's tendency to track the stock market doesn't bode well in the coming months. "Bitcoin's short-term correlation to risk looks set to keep volatility high," they warn, though they view the Trump administration's Bitcoin strategic reserve as a positive long-term development that "validates Bitcoin as an asset class."
The future relationship: Complementary rather than competitive
Looking ahead to 2025, the relationship between Bitcoin and gold may evolve into something more complementary than competitive. Bitcoin's fixed supply of 21 million coins offers protection against inflation – a trait it shares with gold – while its digital nature appeals to those seeking borderless value transfers.
According to experts, as institutional adoption continues and regulatory frameworks mature, Bitcoin's volatility could decrease, potentially strengthening its credentials as a store of value. However, gold's established role in central bank reserves and its proven crisis performance suggest it will remain the premier safe haven asset for the foreseeable future.
Bitcoin price prediction 2025: Key levels to watch
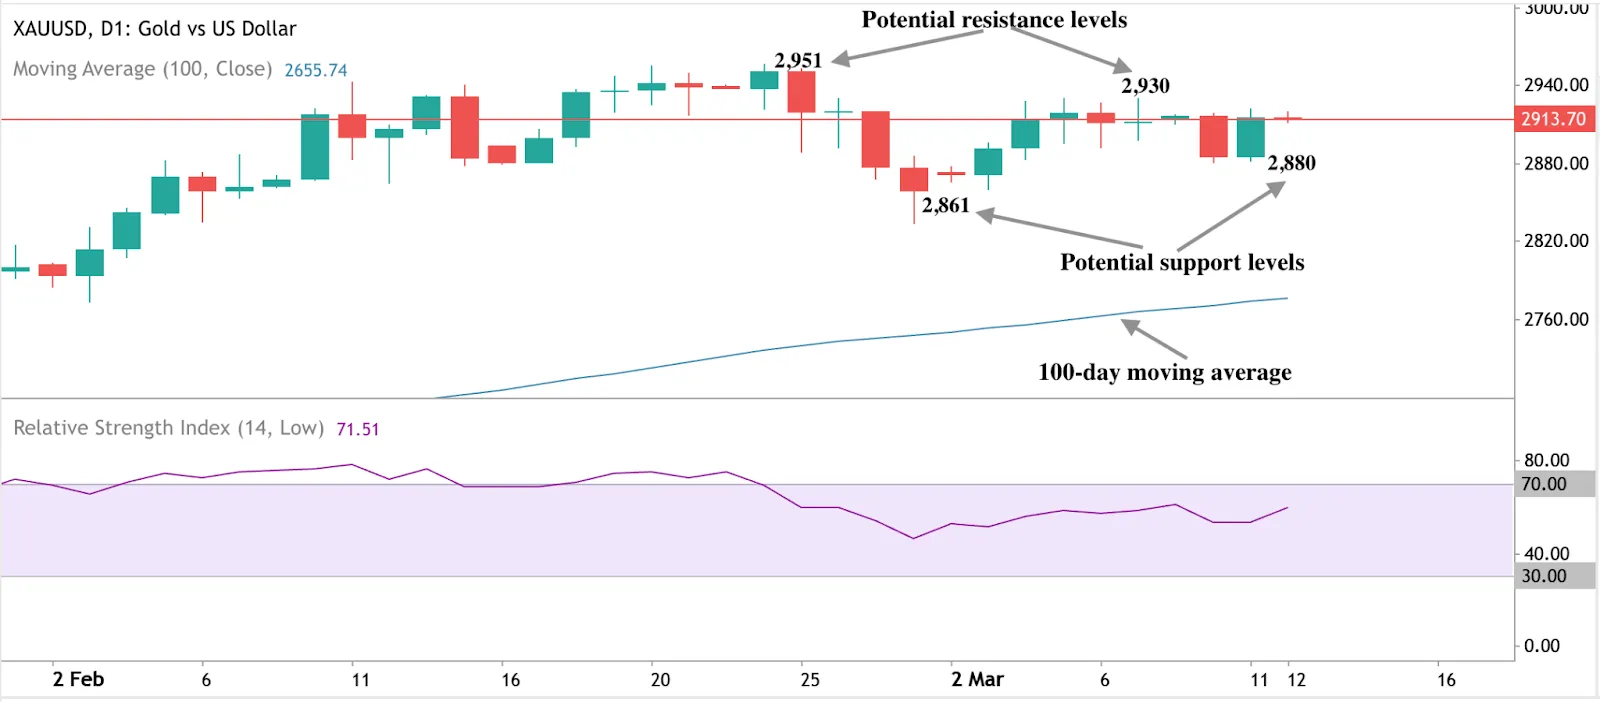
On the daily chart, Gold is showing bullish signs as prices remain well above the moving average, as RSI rises steadily. Key levels to watch on the upside are $2,930 and $2,951. On the downside, key levels to watch on the downside are $2,880 and $2,861.
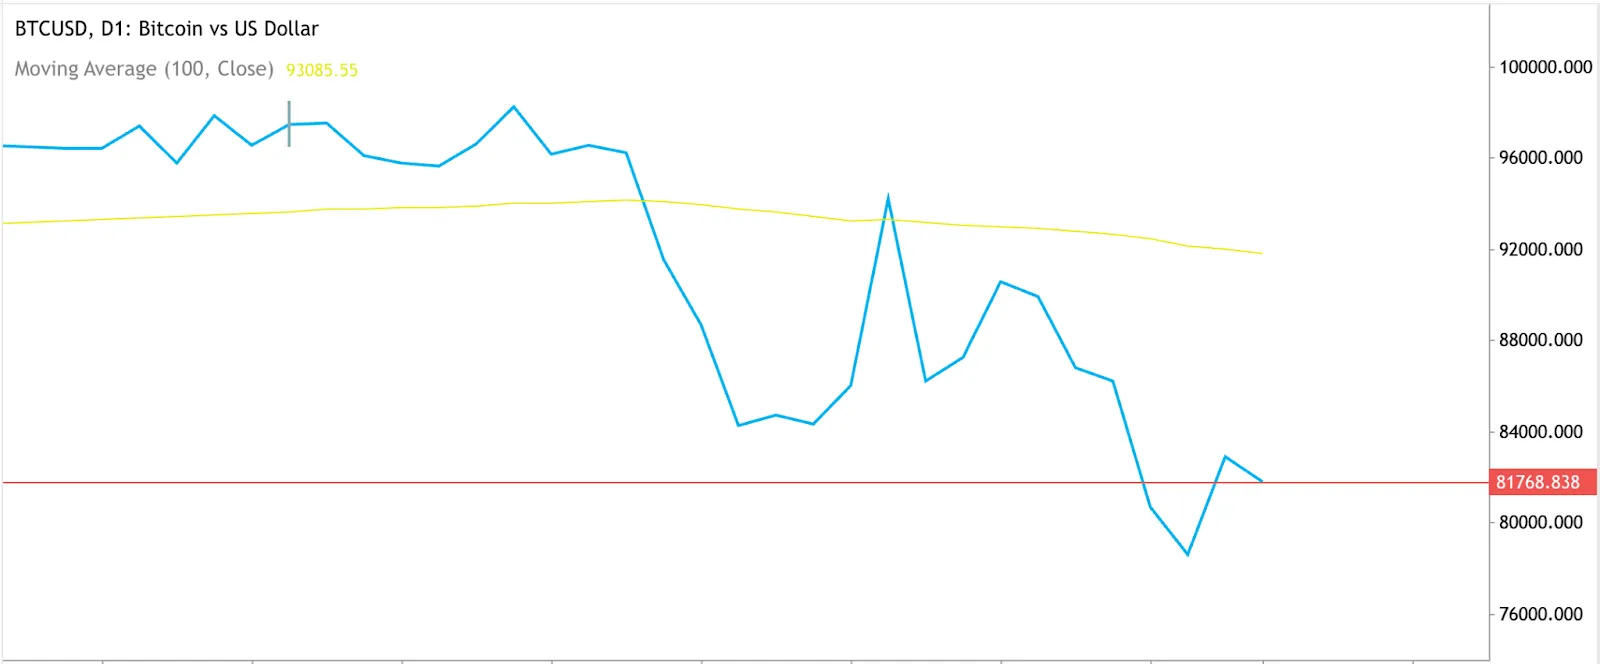
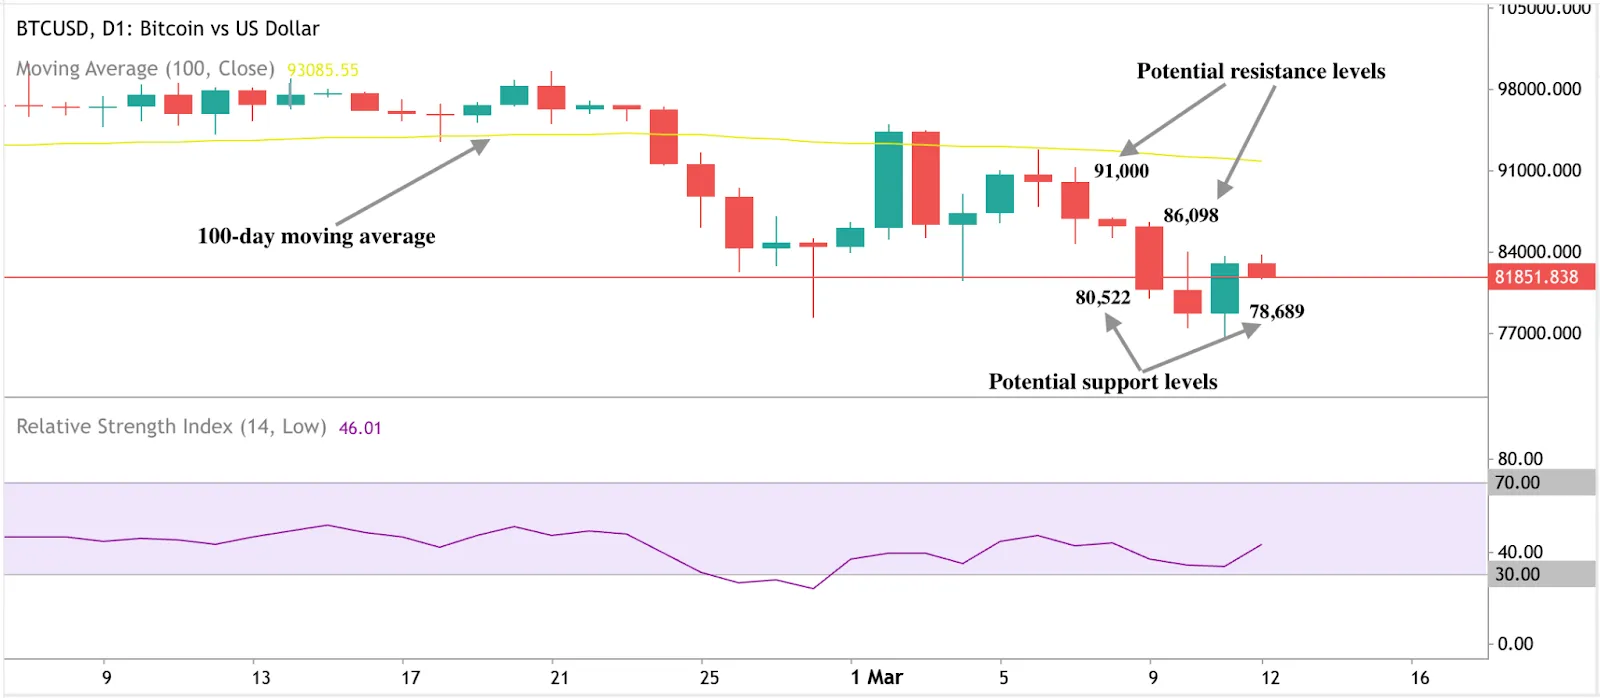
Bitcoin, on the other hand, is stabilising at around $81,000. Bearish conditions are evident for BTC, as prices remain below the moving average. RSI rising steadily towards the midline hints at some upside momentum building. Key levels to watch on the upside are $86,098 and $91,000. On the downside, levels to watch are $80,522 and $78,689.
You can get involved and speculate on the price of these two incredible assets with a Deriv MT5 account or a Deriv X account.
Dollar Yen exchange rate 2025: Fed weakness vs BOJ strength reshaping currency markets
As global markets brace for the US February inflation data release on 12 March, currency traders are closely monitoring the evolving monetary policy landscapes in both the United States and Japan.
As global markets brace for the US February inflation data release on 12 March, currency traders are closely monitoring the evolving monetary policy landscapes in both the United States and Japan. The diverging paths of the Federal Reserve and Bank of Japan are creating compelling narratives for the dollar and yen in 2025, with significant implications for investors and economic stakeholders.
US inflation impact on dollar: A crucial turning point?
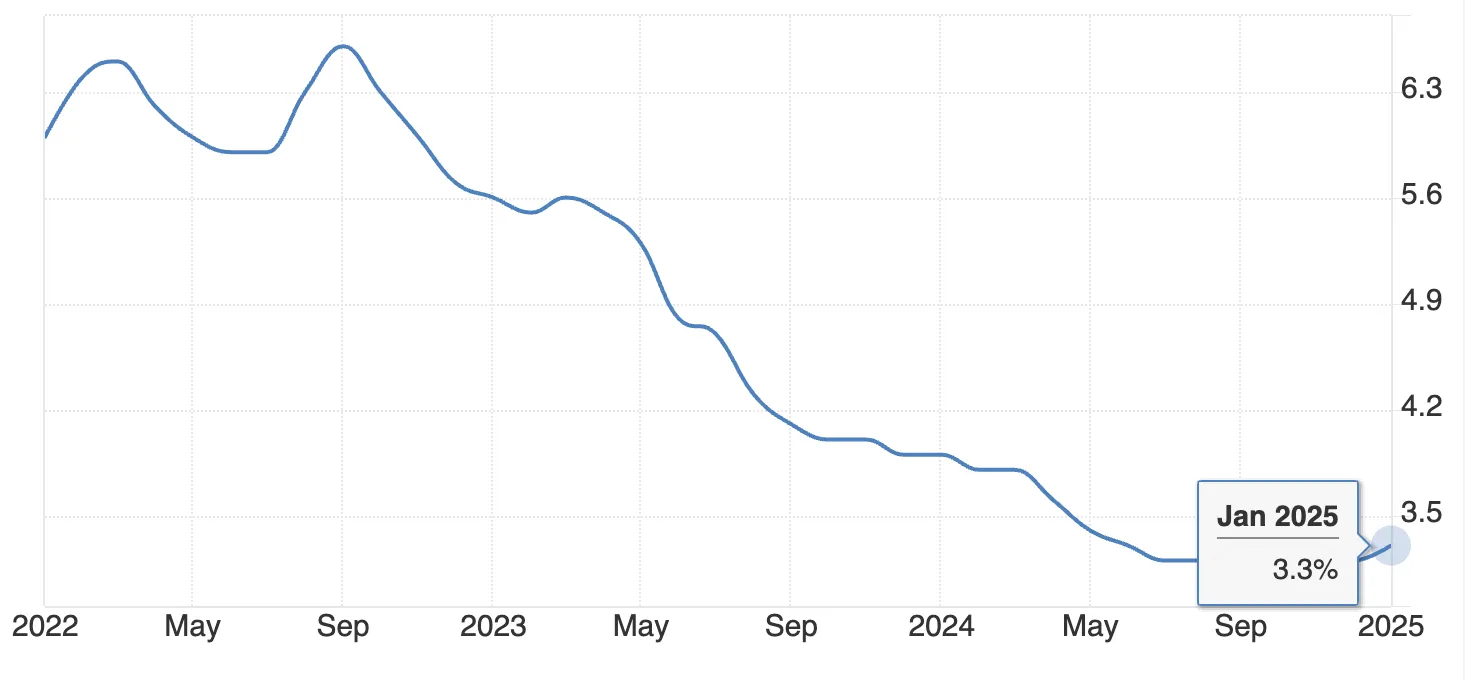
Economists anticipate February's Consumer Price Index (CPI) will show a 0.3% month-on-month increase, a welcome deceleration from January's concerning 0.5% jump. If forecasts prove accurate, annual headline inflation would cool to 2.9%, down from 3% in January.
This data release comes at a critical juncture for the Fed's policy normalisation process.
While inflation has dominated monetary policy discussions, the dollar's recent weakness reflects growing concerns about US economic growth.
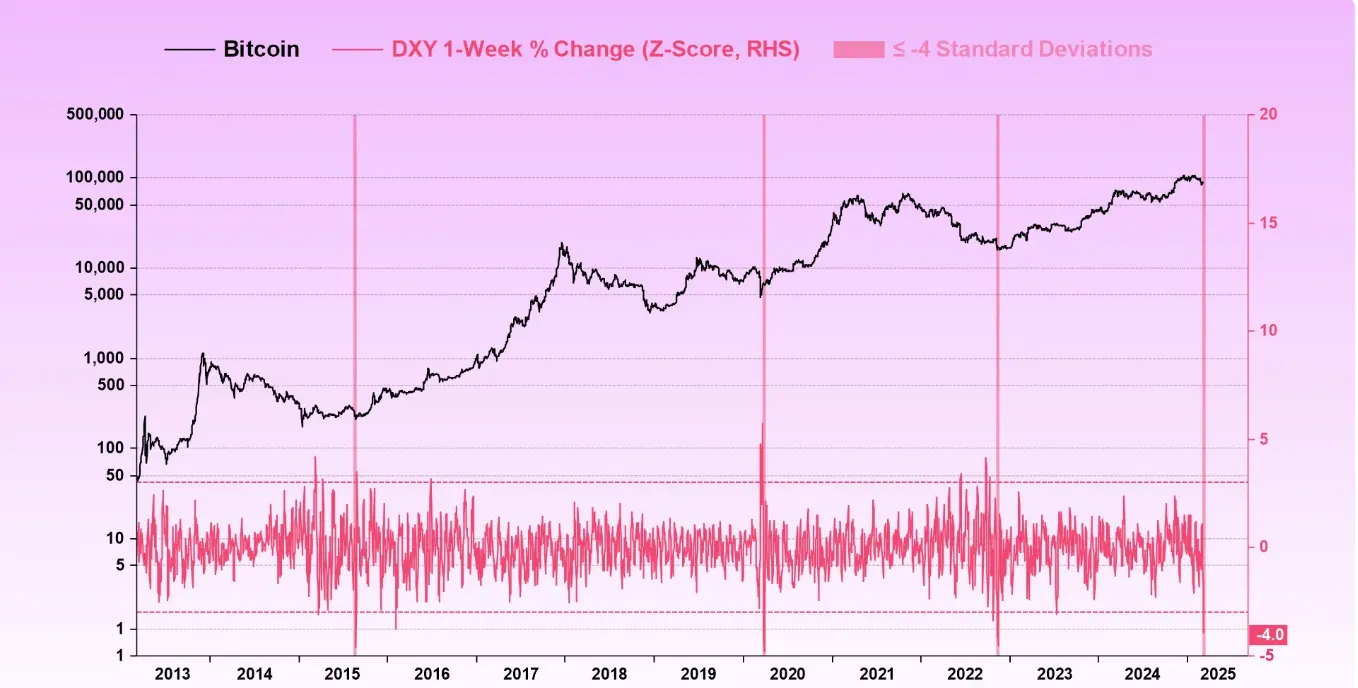
The Dollar Index (DXY) experienced its largest weekly drop in over two years recently, tracking falling US bond yields as markets increasingly question the resilience of the American economy. Additionally, CoinDesk research reveals that the DXY Index is falling faster than it did during President Trump's first term. A declining DXY Index typically benefits risk assets, which could be a positive for Bitcoin traders.
President Trump's recent comments have only intensified these concerns. In a Fox News interview, he described the US economy as being in a "period of transition" that comes with "a little bit of pain," fuelling speculation about a potential recession on the horizon.
The implementation of 25% tariffs on imports from Canada and Mexico, alongside increased duties on Chinese goods, has created a complex economic outlook. While these measures could potentially fuel inflation, markets appear more concerned about their impact on growth-a sentiment that continues to weigh on the dollar.
Chris Weston, head of research at broker Pepperstone, explained that while the dollar historically strengthens during periods of rising volatility, its appeal is now limited as concerns center around the US economy and equity market.
Yen's strength against the dollar
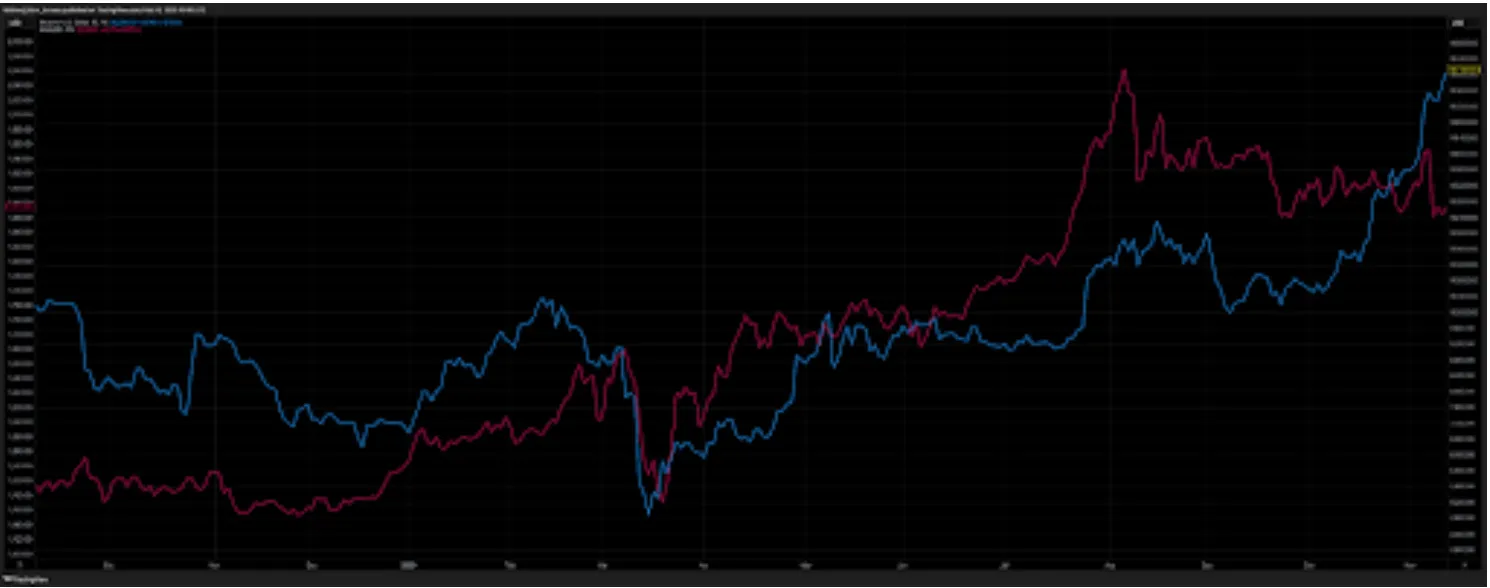
In stark contrast to the dollar's struggles, the Japanese yen has emerged as a standout performer, gaining approximately 6% against the US currency since the beginning of the year. This strength extends beyond dollar weakness, as the yen has been shining against all major peers.
The Bank of Japan's January decision to raise its key interest rate by 25 basis points to 0.5%-its first hike in 17 years-marked a significant policy shift. Governor Ueda has consistently signalled that additional hikes will likely be needed if economic conditions evolve as projected.
Recent economic indicators support this hawkish stance. Despite a slight moderation in nominal cash earnings growth in January to 2.8% year-on-year, base pay rose by 3.1%-the largest increase since October 1992.
According to analysts, the contrasting monetary policy trajectories between the Fed and BoJ are creating a compelling narrative for currency markets throughout 2025. While the Fed is expected to embark on an easing cycle, investors are fully pricing in the BoJ's next 25 basis point rate increase by September, with a strong 80% probability for a July hike.
Looking ahead: Currency implications for 2025
As we navigate through 2025, several factors will influence the dollar-yen relationship according to analysts:
- US Inflation impact on the dollar: The speed at which US inflation moderates toward the Fed's 2% target will determine the pace of rate cuts, directly impacting the dollar's strength.
- Trade tensions: The evolution of US trade policies could exacerbate growth concerns while potentially creating new inflationary pressures, presenting a challenging environment for the Fed.
- Labour market dynamics: With US unemployment hovering near historic lows at 3.8% and Japan facing demographic challenges, wage pressures in both economies will influence central bank decisions.
- Safe-haven currency investment: If global economic uncertainties persist, the yen may continue to attract additional flows due to its safe-haven status, particularly if concerns about US growth intensify.
The upcoming CPI release will provide valuable insights into these dynamics, but the broader narrative of dollar vulnerability and yen strength appears poised to extend well beyond a single data point.
Want to be in on the action? You can get involved and speculate on the price trajectories of these two currency pairs with a Deriv MT5 account or a Deriv X account.

Trump tariffs: How high can metal prices go in 2025?
As President Trump reimposes and expands tariffs on imported steel and aluminium, markets are already responding with significant price movements.
As President Trump reimposes and expands tariffs on imported steel and aluminum, markets are already responding with significant price movements. The announcement of a 25% tariff on all imported steel and aluminum-up from the previous 10% on aluminum-has sent ripples through various industries, particularly affecting food and beverage manufacturers who rely heavily on these materials for packaging.
The policy shift comes at a challenging economic moment, with inflation having risen 3% year-over-year in January, putting additional pressure on consumers already dealing with elevated prices across various sectors.
What's particularly noteworthy is that these tariffs aren't new-they represent an expansion of policies first implemented during Trump's initial term, but with fewer exemptions and higher rates.
Aluminium surges to record highs
The market's reaction has been swift and dramatic. US Midwest duty-paid aluminum premiums have skyrocketed to over 40 cents per pound (nearly $900 per metric ton)-representing an astonishing 60% increase since the beginning of 2025. This surge reflects the market's anticipation of supply constraints and higher costs.

Industry experts point to a fundamental issue: the United States remains a net importer of aluminium, with domestic production capacity insufficient to meet demand. Canadian smelters, which accounted for approximately 70% of the 3.92 million tons of primary and alloyed aluminium exported to the US last year, will be subject to these tariffs despite their critical role in the supply chain.
Steel tariffs 2025: The Can industry's vulnerability
The impact on the can manufacturing sector could be particularly severe. The US produces approximately 135 billion metal cans annually, including 115 billion aluminium beverage cans and 20 billion steel cans for food and other products. While imports account for only about 10% of the aluminium used by American can-makers, roughly 70% of the tin mill steel used for food cans comes from foreign sources.

What makes this situation more precarious is the diminished domestic production capacity. Following Trump's initial steel tariffs in 2018, nine American tin mill steel producers shut down, leaving only three production lines operational in the US today. This limited domestic capacity means manufacturers have little choice but to pay the higher prices for imported materials or pass costs on to consumers.
Gold prices 2025: beneficiary of trade tensions?
While industrial metals face price pressures from tariffs, gold has been attracting buyers amid the growing uncertainty. Trading around $2,915 per ounce in early 2025, gold has benefited from its traditional role as a safe-haven asset during periods of economic and geopolitical uncertainty.
Analysts note that historically, gold prices have risen alongside inflation-when the Consumer Price Index began its steep ascent in August 2020, it coincided with gold reaching then-record highs. Similarly, during the high inflation period of 1980 when rates hit 13.5%, gold surged to record levels that weren't surpassed until 2006.
The combination of tariff-induced inflation and geopolitical tensions under Trump's second term could continue to support gold prices throughout 2025. Trump's positions on NATO, Ukraine-Russia relations, and the Middle East conflict have created additional uncertainty in global markets, typically a favourable environment for precious metals.
Looking ahead: metal price forecasts for 2025
For metals markets, the outlook for 2025 suggests continued volatility. Aluminium premiums could remain elevated as supply chains adjust to the new tariff regime. Steel prices, particularly for specialty products like tin mill steel, may see sustained increases due to limited domestic production capacity.
Meanwhile, gold could continue its upward trajectory if inflation accelerates and geopolitical tensions persist, potentially testing new record highs later in the year.
Key levels to watch on the Aluminium chart are $2,712 on the upside and $2,646 on the downside.

Key levels to watch on the gold chart are $2,931 and $2,948 on the upside and $2,890 and $2,873 on the downside.


Trump's executive order fails to boost BTC as Nvidia leads tech sell-off
In a week of significant market movements, President Donald Trump's executive order establishing a strategic Bitcoin reserve failed to boost cryptocurrency prices, while the tech sector faced mounting pressure with Nvidia leading a substantial sell-off.
In a week of significant market movements, President Donald Trump's executive order establishing a strategic Bitcoin reserve failed to boost cryptocurrency prices, while the tech sector faced mounting pressure with Nvidia leading a substantial sell-off.
Strategic Bitcoin reserve: not what investors expected
Bitcoin fell sharply on Friday despite what initially seemed like positive news - US President Donald Trump signing an executive order to establish a strategic Bitcoin reserve. The cryptocurrency's decline came as investors digested the fine print of the White House order, which clarified that no taxpayer money would be used to acquire digital assets.
Instead, the reserve will be funded exclusively with Bitcoin confiscated through criminal and civil forfeiture proceedings. This revelation disappointed investors who had hoped for direct government purchases of Bitcoin on the open market.
"BTC reacted to Trump's executive order to create a strategic Bitcoin reserve funded solely from assets seized by the government, raising concerns that the government wouldn't be a buyer of crypto," explained Edul Patel, CEO and co-founder of Mudrex.
While Bitcoin found support at $84,700 and rebounded to $87,600, the market's initial reaction was negative. CoinSwitch Market Desk noted, "The market reaction to this news was slightly negative as investors expected the US to deploy fresh capital into Bitcoin. However, despite calling it digital gold, the White House will not buy fresh BTC."
Tech stocks decline
Simultaneously, the broader US stock market experienced significant turbulence, with approximately $1.15 trillion wiped from market value in a single day according to analysts. This massive sell-off has raised concerns about potential spillover effects on Bitcoin and the cryptocurrency market.
Leading the tech decline was Nvidia (NVDA), whose shares fell 5.7% on Thursday, bringing its year-to-date losses to nearly 18%. The AI chipmaking giant is experiencing its worst monthly performance since June 2022, as fears over AI demand continue to weigh on the semiconductor sector.
The sentiment shift became even more apparent after Marvell Technology's earnings report. Despite beating Wall Street expectations with non-GAAP earnings of $0.60 per share and sales of $1.82 billion, investors weren't satisfied with the growth rates. This triggered a broader sell-off across AI and semiconductor stocks.
The BTC sentiment shift is real!
The dual market movements have created a notable shift in investor sentiment. Bitcoin's Fear and Greed Index plummeted from 62 (Greed) to 34 (Fear), reflecting rapidly changing market psychology.

Meanwhile, the tech sector is facing what Futurum Group analyst David Nicholson described as a reality check: "Wall Street is catching up to the reality that Nvidia will not create a decades-long dynasty like Intel once did. Competition is hitting them from dozens of directions."
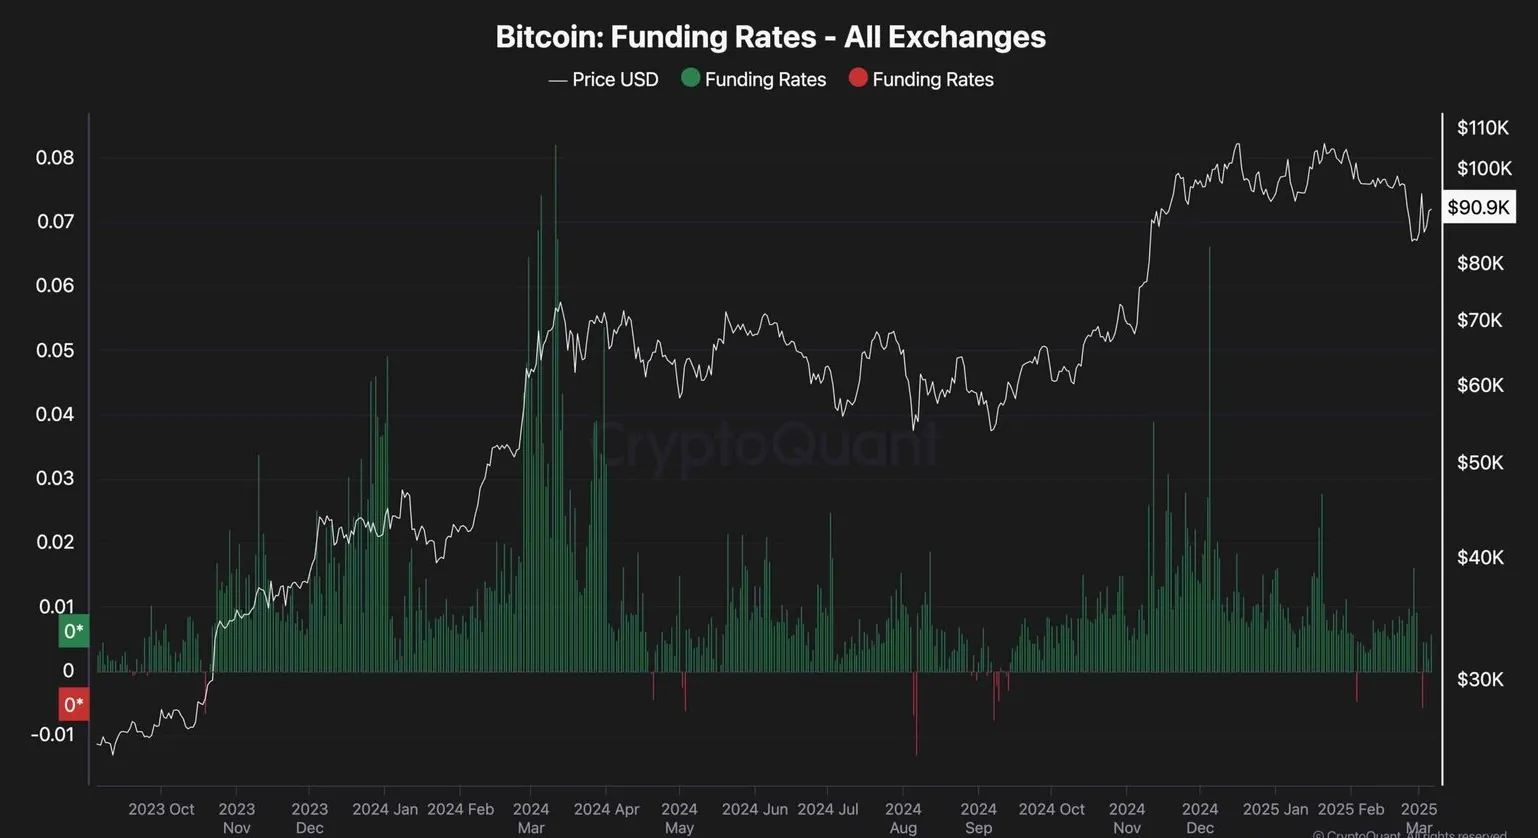
On-chain data for Bitcoin shows declining funding rates with sellers dominating the futures market, though analysts suggest a potential bullish reversal could lead to short liquidation and drive prices higher in coming days.
These parallel market developments highlight the interconnected nature of traditional and cryptocurrency markets. While Trump's executive order symbolically recognizes Bitcoin's importance by creating a strategic reserve, the implementation details have tempered immediate enthusiasm.
For traders in both markets, the current environment calls for increased caution and robust risk management strategies. As the Crypto Summit approaches, market participants will be watching closely for signals about the future direction of both Bitcoin and technology stocks.
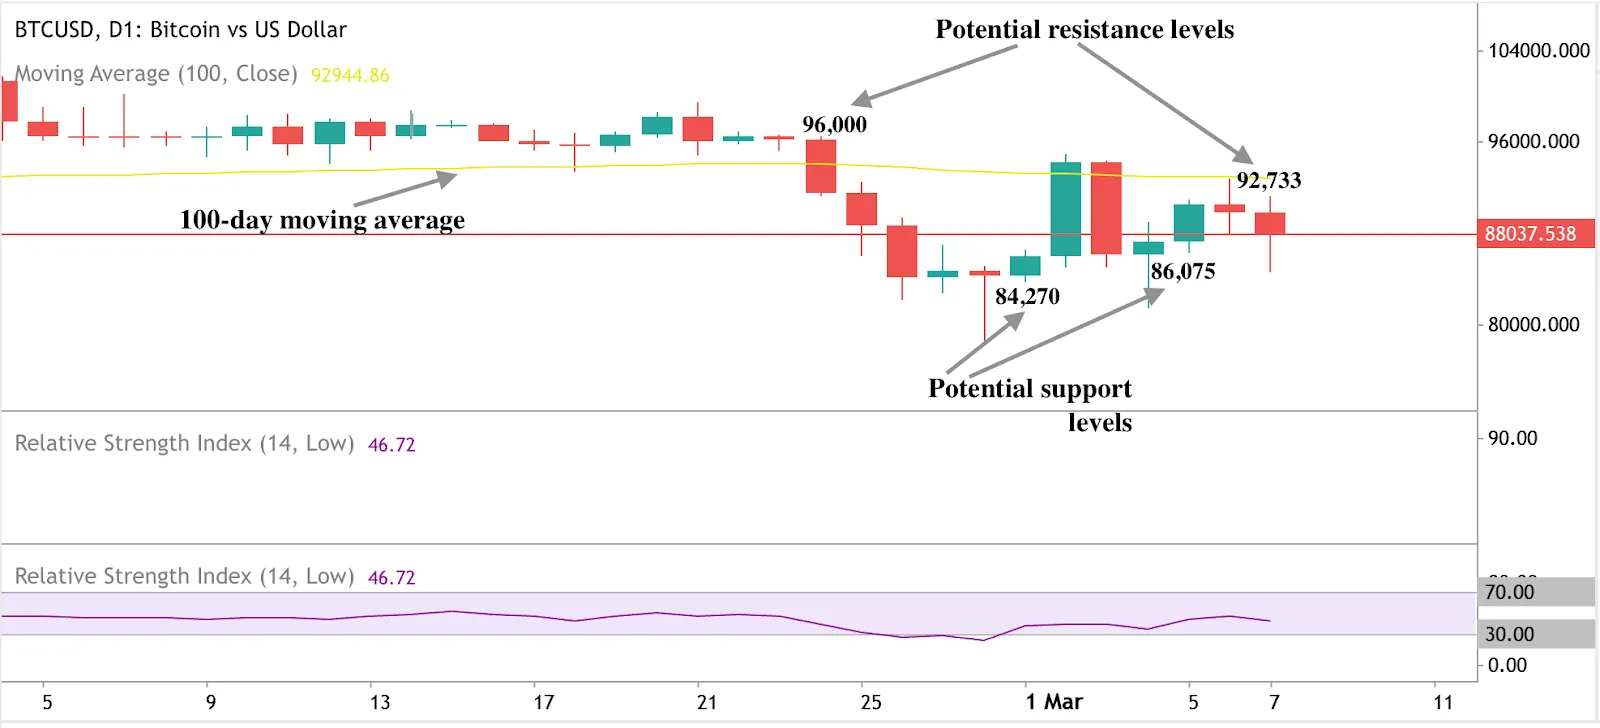
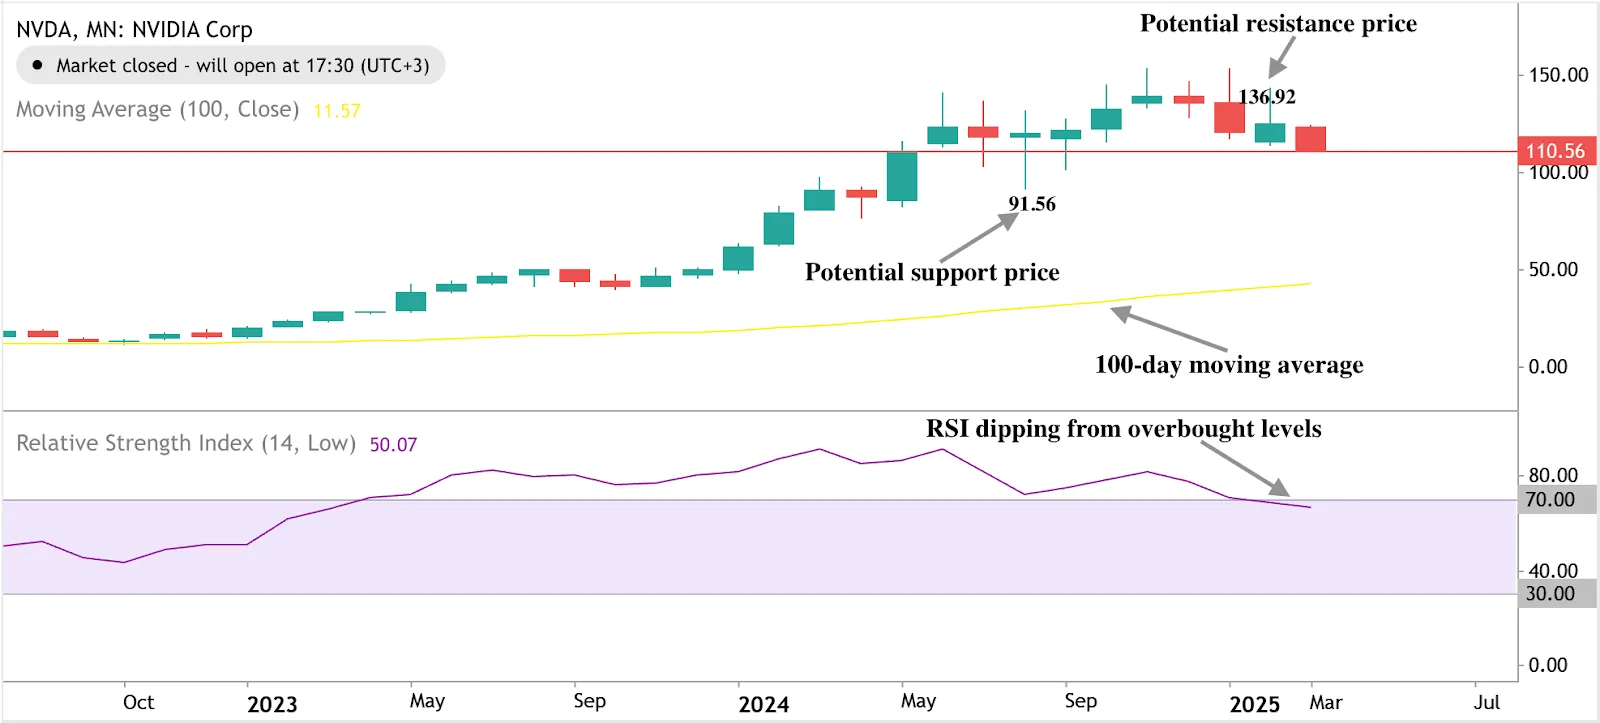
BTC/NVDA key levels to watch
At the time of writing, BTC is hovering around $88,000. Key levels to watch are $92,733 and $96,000 on the upside. On the downside, key levels to watch are $86,075 and $84,270. Current sentiment is bearish supported by prices remaining just below the moving average. RSI sluggish at the midline also suggests waning momentum.
For Nvidia, Key levels to watch are $136.92 on the upside and $91.56 on the downside. RSI dipping from overbought conditions hints at a further slide, though prices remaining elevated above the moving average, suggests that overall sentiment is still bullish.

Toncoin’s price prediction 2025: How high can it go?
The world of cryptocurrency is never dull, as coins like Toncoin (TON) show significant volatility.
The world of cryptocurrency is never dull, as coins like Toncoin (TON) show significant volatility. Originally launched from Telegram, this digital asset has been on a ride full of highs, lows, and unexpected turns. If you’ve been following its journey, you know it’s been anything but predictable. With its unique origins and growing adoption, Toncoin has drawn interest from both retail investors and large-scale holders alike, making its trajectory a topic of much debate.
Toncoin’s sharp drop and whale activity
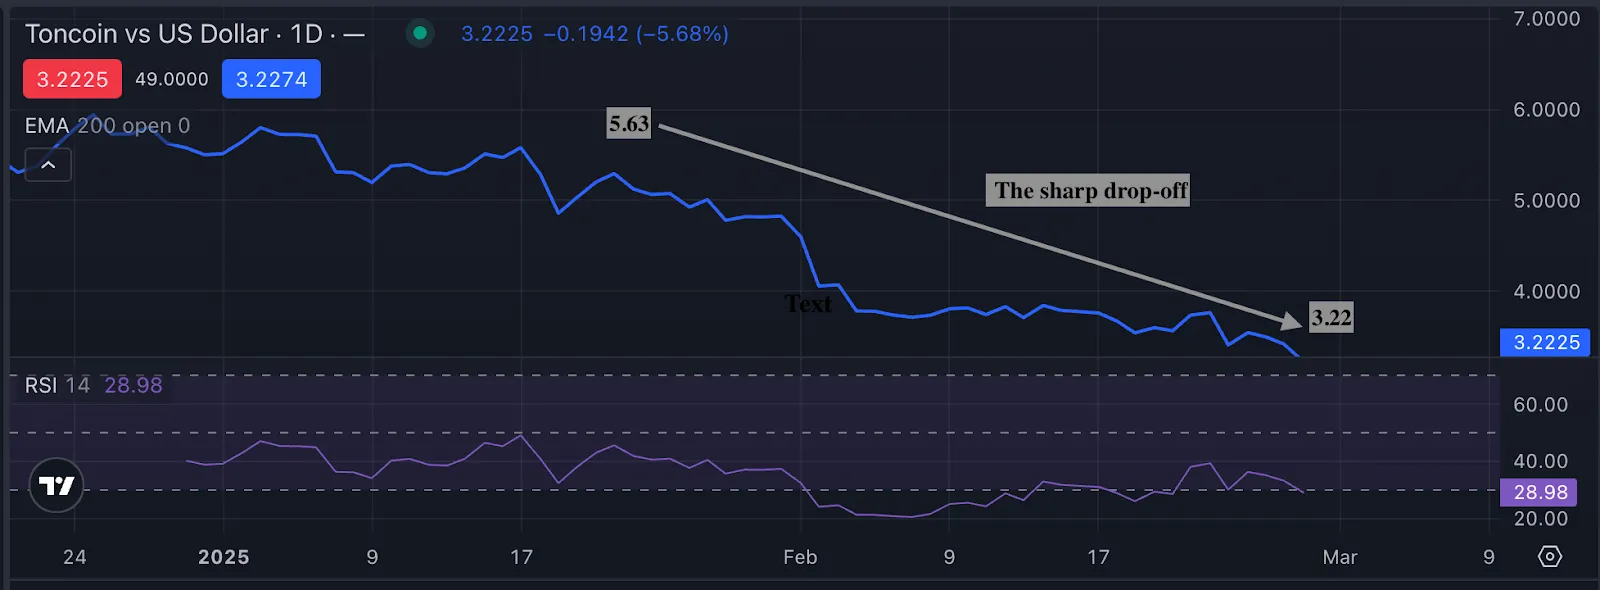
Last week, Toncoin took a hit, in mid-January dropping from highs of $5.63, to current lows of around $3.22. For those who enjoyed the surge just months ago, the recent dip has been a reality check.
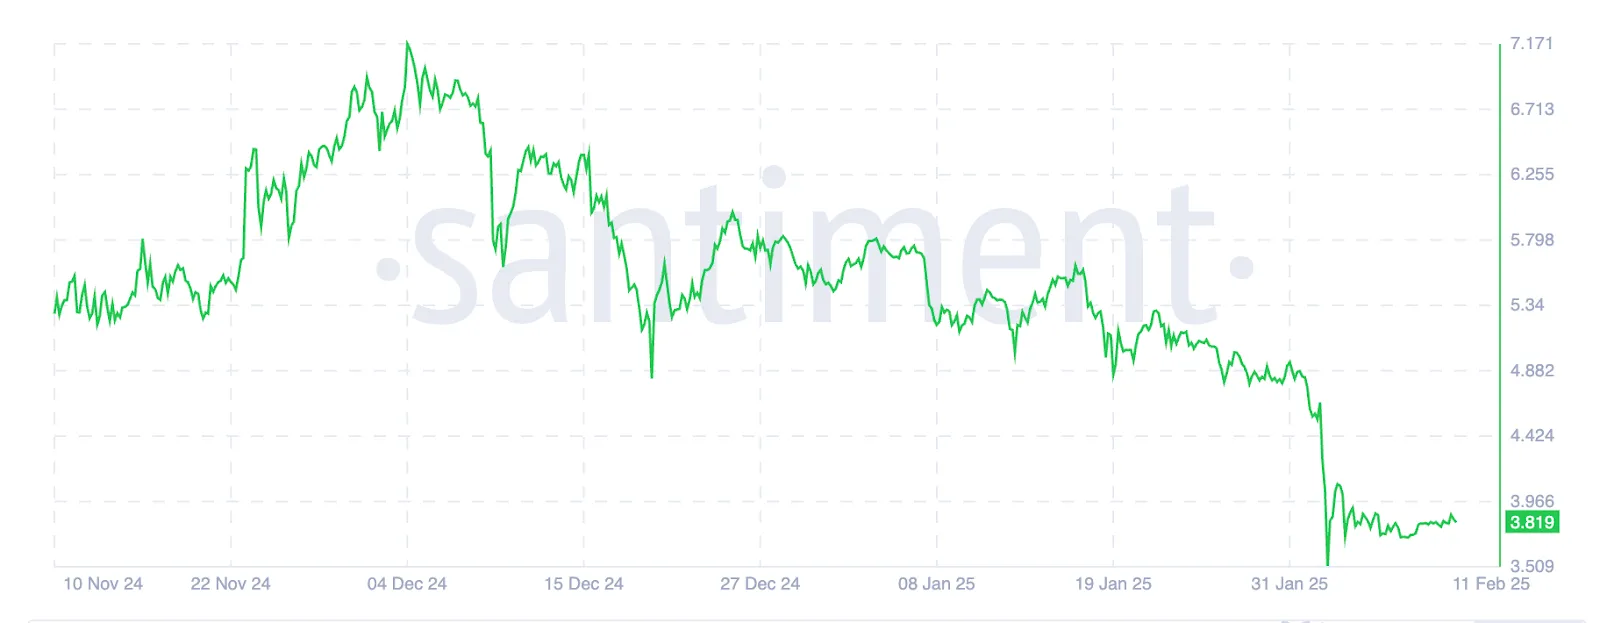
But what’s behind this sudden shift? Large holders, known as “whales,” moved 1.43 million TON tokens out of their wallets in early February, shaking up the market. Whether this signals a deeper trend or just regular trading activity remains to be seen, but investors are paying close attention.
Some speculate that these movements could be linked to liquidity management strategies, while others fear that major players are offloading their holdings ahead of a potential market downturn.
At the moment, Toncoin hovers around $3.22, with a daily trading volume of $263.82 million and a market cap of $8.07B billion. These figures show that despite the turbulence, the market remains active and engaged. The question now is whether Toncoin will stabilize or face further declines as market sentiment continues to evolve.
Toncoin forecast: Uncertain future or a strong comeback?
Opinions are split. Some analysts predict a strong rebound, with forecasts of potential gains exceeding 90%. They argue that Toncoin’s fundamentals, including its strong association with Telegram, give it a unique advantage in the competitive crypto landscape. With the messaging app boasting millions of active users, integration with Telegram’s ecosystem could provide Toncoin with an organic user base and real-world utility, driving long-term adoption.
On the other hand, skeptics urge caution. Crypto markets are notoriously unpredictable-much like a surprise message from an old contact that leaves you wondering what’s next. They argue that without clear utility and consistent demand, Toncoin could struggle to maintain momentum. If you’re considering an investment, it’s always wise to weigh the risks alongside the potential rewards.
Several key factors will determine Toncoin’s fate. Whale movements continue to influence market trends, while overall sentiment in the crypto community plays a crucial role in price stability. Telegram, as the platform behind Toncoin, could also impact its value with any major announcements regarding partnerships, integrations, or new use cases for the token. Additionally, broader market trends and macroeconomic conditions will play a role. If risk appetite in the crypto space declines due to external factors such as interest rate hikes or regulatory crackdowns, Toncoin may face additional headwinds.
So, is Toncoin out of the game? Not necessarily. Despite recent turbulence, its fundamentals suggest it’s still a contender according to experts. Like any good comeback story, the next chapter could depend on how the market reacts and whether investors stay the course. If Telegram continues to integrate Toncoin into its ecosystem, there’s a strong case to be made for long-term growth.
At the time of writing, TONUSD is hovering around the $3.22 mark after a sharp price decline. Bearish bias is evident as prices remain below the moving average suggesting that the longer-term trend is still going south. However, prices being close to the lower bollinger band at the RSI hint at oversold conditions-suggesting that a bounce could be in the offing. RSI edging down towards oversold levels, also adds to the narrative.
Buyers could face a hurdle at the $3.600 and the $3.892 price levels. On the downside, sellers could be held at the $3.000 price level.

TONCOIN’s price action will be interesting to follow over the coming weeks. You can follow all the action with a Deriv MT5, Deriv cTrader, or a Deriv X account. Log in now to take advantage of the indicators, or sign up for a free demo account. The demo account comes with virtual funds so you can practise analysing trends risk-free
Sorry, we couldn’t find any results matching .
Search tips:
- Check your spelling and try again
- Try another keyword