Results for

How trade risks and BoJ shape USD/JPY analysis
The Japanese Yen lost some ground on Thursday, with USDJPY climbing over 100 pips from recent lows as risk sentiment improved across Asia.
The Japanese Yen lost some ground on Thursday, with USDJPY climbing over 100 pips from recent lows as risk sentiment improved across Asia. But while the move looks decisive on the surface, the bigger picture is far murkier. Between mounting trade tensions and a cautious Bank of Japan, the path ahead for USDJPY is anything but straightforward.
Japanese yen forecast: A risk-on rebound, but the Yen isn’t out
Asian equity markets bounced back, lifting spirits and nudging traders away from safe-haven plays like the Yen. The US Dollar, too, found support on the back of stronger retail sales, helping USDJPY catch a short-term bid.
Still, this isn’t a clean break higher. The Yen’s losses remain contained, with investors wary of pressing shorts in an environment riddled with geopolitical landmines, economic uncertainty, and central bank divergence.
Trade tensions: Tariffs complicate the outlook
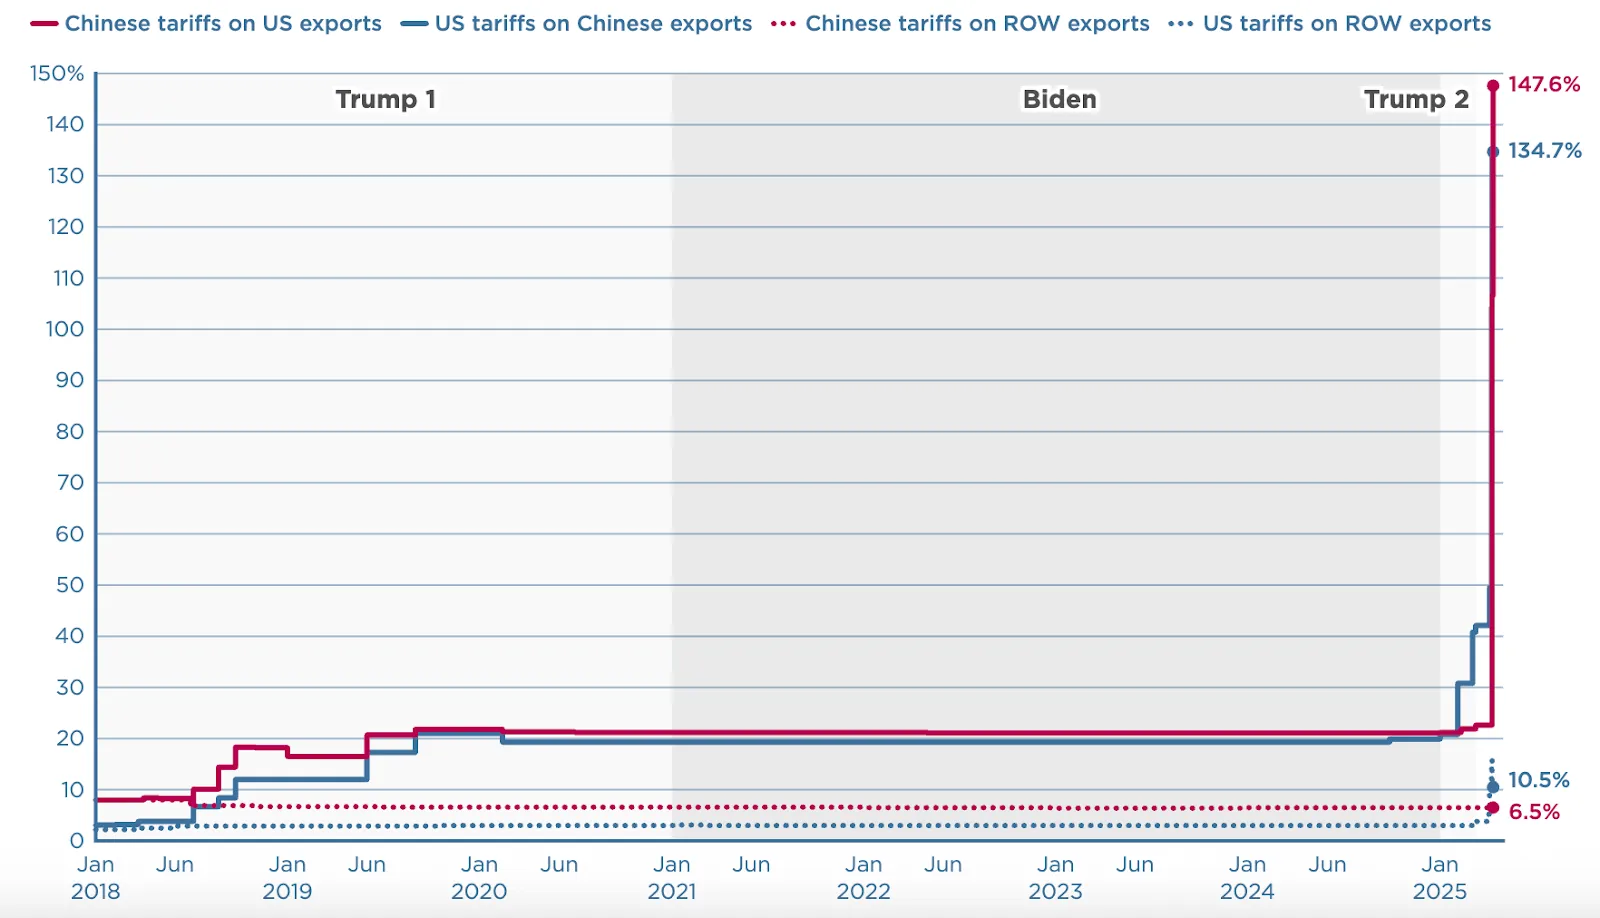
Trade tensions are re-emerging as a major market driver. The US has tightened restrictions on AI chip exports to China, prompting Beijing to retaliate with a sharp hike in tariffs on US goods - some as high as 125%. While not directly aimed at Japan, the knock-on effects could ripple across Asia, adding pressure on regional trade flows and sentiment.
At the same time, US President Donald Trump is touting “big progress” in trade talks with Japan. Whether this signals a breakthrough or political posturing is unclear, but any signs of a deal could offer temporary relief for the Yen.
BoJ caution persists despite Bank of Japan rate hike talk
The Bank of Japan’s tone is noticeably cautious. Governor Kazuo Ueda has suggested the central bank could hold off on further rate hikes if trade-related headwinds intensify. With Japan’s recovery still fragile, the BoJ is clearly in no rush to tighten.
Adding to the dovish undertone, reports suggest the BoJ may lower its growth forecasts at the upcoming April 30 - May 1 policy meeting. But it’s not all retreat: BoJ board member Junko Nakagawa has signalled that rate hikes are still on the table if the economic outlook stabilizes. That’s a notable shift for a central bank long known for ultra-loose policy.
Meanwhile, in dollar land
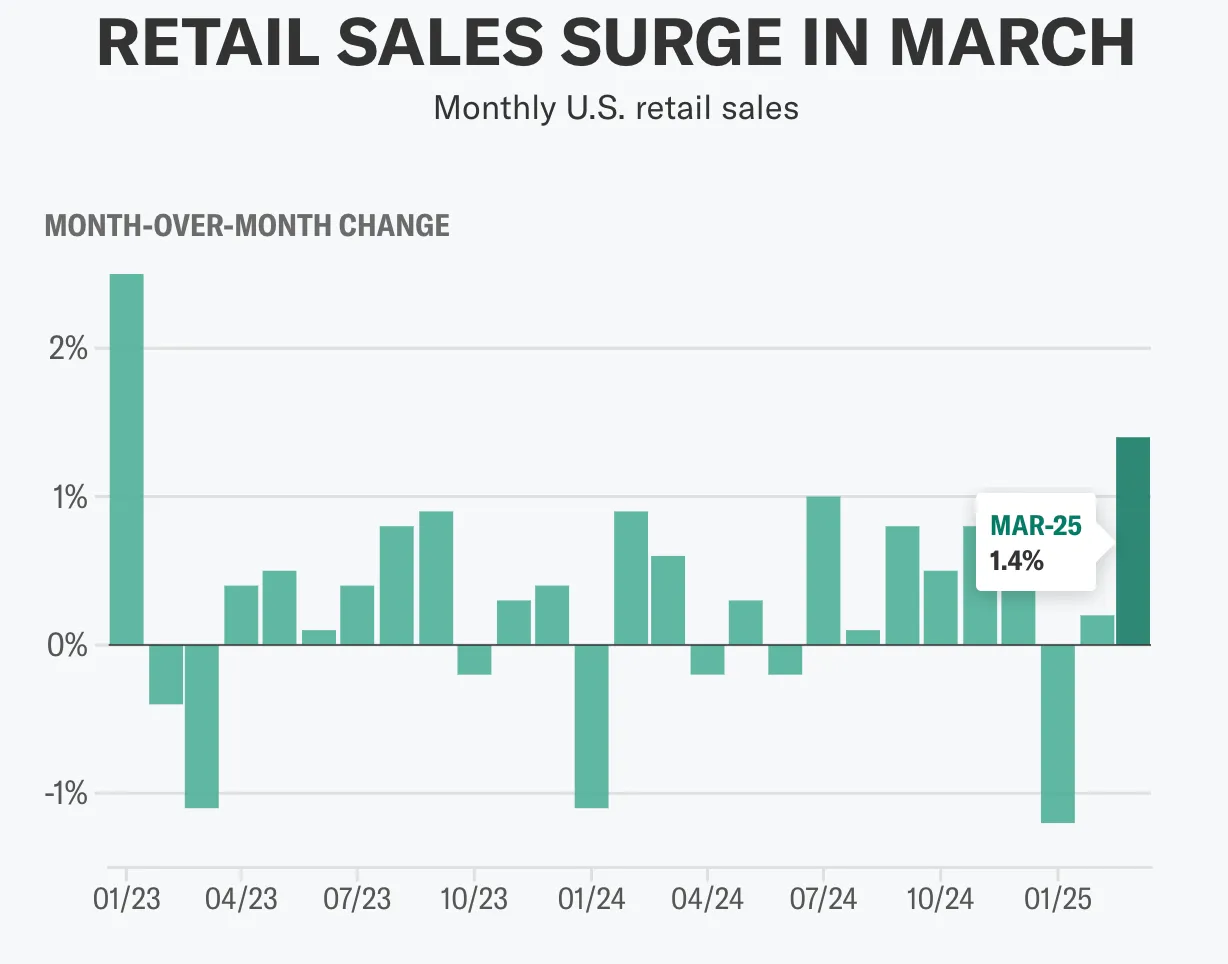
The US Dollar is finding its feet again, thanks to some surprisingly strong retail sales data (+1.4% in March!) and a big reality check from Fed Chair Jerome Powell. His message? Don’t count on rate cuts just yet.
Inflation’s still sticky, and Powell isn’t keen on adding more fuel to the fire - especially with Trump’s tariffs muddying the waters. The market, however, is still betting on three cuts this year, arguing that trade tensions could choke off growth. That disconnect? It’s adding volatility to the USD/JPY equation.
USD/JPY technical outlook: Japanese yen forecast?
The Yen’s short-term dip may not tell the whole story. This currency pair could experience more turbulence due to trade war drama, BoJ uncertainty, and diverging Fed-BoJ paths.
The bottom line is that the 100+ pip bounce in USD/JPY might be more of a breather than a breakout. The next move will depend on who blinks first - the Fed, the BoJ, or the markets themselves.
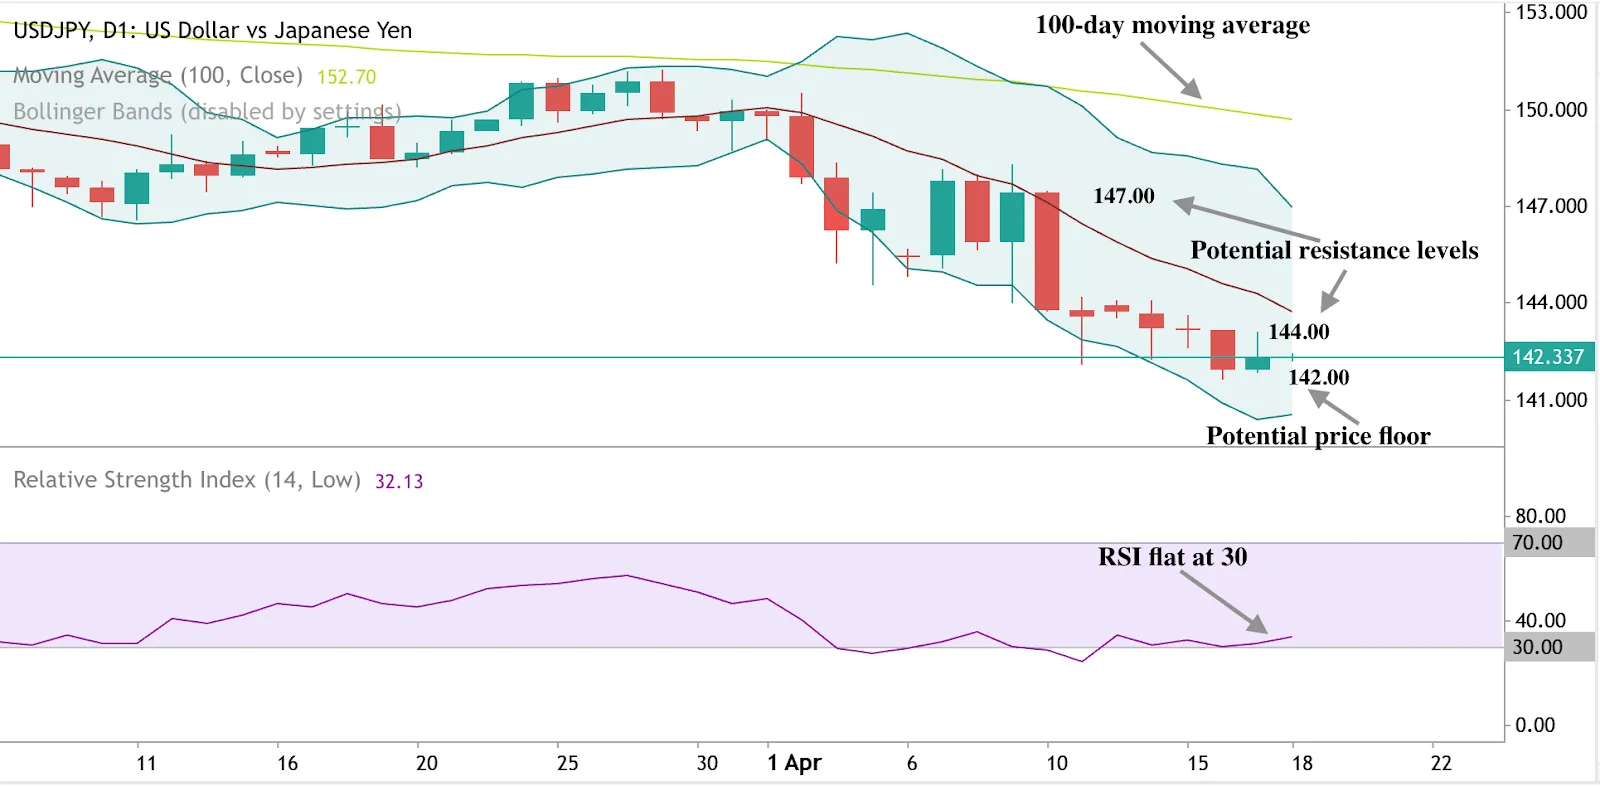
The USD/JPY pair is seeing some downward pressure. Prices below the moving average indicate that the overall trend is still downward. The RSI holding flat at 30 indicates that the momentum to the downturn has slowed. The market is pausing near the bottom, indicating that it is waiting for a new catalyst. We could see a price uptick if prices inch down, touching the lower Bollinger band. If we see an uptick, prices could find a resistance wall at the $144.00 and $147.00 price levels. If we see a slide, prices could find a floor at the $142.00 price level.
Ready to position yourself in this changing landscape? You can speculate on the price trajectory of the USD/JPY currency pair with a Deriv MT5 or Deriv X account.

Is Gold’s surge the start of a changing safe-haven landscape?
As Gold hits record highs amid geopolitical tensions and Fed hawkishness, Bitcoin lags behind. Is the safe-haven landscape changing for investors?
Gold is back in the spotlight. After notching three record highs in one week, the yellow metal is trading at $3,342, up over 3.5% in just days. It’s not just the price action grabbing attention - it’s the timing. Gold’s surge is against heightened geopolitical tensions, a hawkish Federal Reserve, and market-wide nervousness.
Meanwhile, Bitcoin, often dubbed digital gold, is moving in the opposite direction - or barely moving. So, what’s shifting beneath the surface? Are we entering a new era in the world of safe havens?
Let’s take a look.
Gold’s price surge
The latest rally in gold has come when investors are actively looking for stability. Tensions between the U.S. and China flared again after President Donald Trump launched an investigation into rare earth imports from China. These materials are vital to electronics and defense industries, and China controls the lion’s share of global supply.
This move was widely interpreted as more than a trade tiff - it was a strategic escalation. As a result, markets reacted predictably: risk-off sentiment kicked in, and gold became the go-to refuge.
Gold’s breakout wasn’t just symbolic. It came alongside a dip in the U.S. dollar and a pullback in Treasury yields, both of which historically boost gold’s appeal.
The Fed hits pause on the easing narrative
While geopolitical headlines stirred the pot, the Federal Reserve added weight to gold’s climb. During a speech this week, Chair Jerome Powell struck a firm tone, emphasising that the Fed’s top priority remains managing inflation - even if the economy starts to wobble.
The message was clear: rate cuts aren’t happening anytime soon.
That recalibration hit markets hard. Investors who had priced in aggressive easing were forced to reassess. Now, the first rate cut isn't expected until July, and even that’s tentative.
In the bond market, 10-year Treasury yields dropped to 4.281%, and real yields followed suit before an uptick to 4.315. These falling real rates are one of the strongest fundamental drivers of gold's recent strength - lower real yields make non-yielding assets like gold much more attractive by comparison, but will the yield recovery change gold’s trajectory?

The return of stagflation fears
The backdrop of economic uncertainty makes gold’s run even more interesting. Powell alluded to the risk that the Fed’s dual mandate - supporting growth while controlling inflation - might be under strain. And there’s data to back that up.
- Retail sales were strong overall, up 1.4% month-over-month in March. However, the control group, a more precise measure used for GDP calculations, only rose 0.4%, below expectations.
- At the same time, industrial production slipped 0.3%, reversing the gains from February and highlighting weakness in manufacturing.
This uneven data raises the possibility of a stagflation-like environment - sluggish growth and persistent inflation - traditionally favouring gold.
Bitcoin holds its ground but trails gold
While gold has soared, Bitcoin has had a much quieter week. Prices are hovering just above $84,000, up barely 0.25% over the past 24 hours. That’s a sharp contrast to gold’s double-digit weekly rally.
Since its all-time high above $109,000, Bitcoin has declined more than 22%, and has struggled to break above the $88,000 resistance level. Volatility remains a concern: BTC traded across a wide range this week, from $83,185 to $85,332, which doesn’t inspire the same confidence that gold currently commands.
Despite this, Bitcoin hasn’t collapsed under the pressure. It’s held up amid Fed hawkishness, rising global tariffs, and even fresh news from China. One factor adding subtle pressure to the crypto market is coming out of China. Local governments there are reportedly selling off seized Bitcoin holdings - as much as 15,000 BTC - to raise funds in the face of budget shortfalls.
This liquidation hasn’t caused a major selloff, suggesting the market may be absorbing the supply relatively easily. Still, it underscores how Bitcoin is still exposed to sudden, headline-driven risk.
Gold vs Bitcoin: Safe-haven identity crisis?
The diverging paths of gold and Bitcoin have brought back a familiar question: Which is the true safe haven? Right now, gold appears to be winning that contest. It has history on its side, benefits directly from falling yields, and is gaining traction as the economic backdrop grows more uncertain.
Bitcoin is evolving. Its price action shows stability, not panic. It’s also no longer moving in lockstep with risk assets like tech stocks - which dropped hard this week - suggesting a slow decoupling may be in progress.
Some analysts argue that Bitcoin is maturing into a longer-term store of value, but it hasn’t yet proven it can outperform during periods of global risk-off sentiment. For now, it remains more of a speculative asset than a true hedge.
What’s next for both assets?
Looking ahead, both gold and Bitcoin will remain highly sensitive to macro developments:
- Gold is technically set up to challenge the $3,400 level, especially if real yields continue falling and geopolitical stress remains elevated.
- Bitcoin needs to break decisively above $88,000 to regain momentum and silence short-term bearish voices.
- Economic data, including housing stats and jobless claims, will influence how markets perceive growth and inflation.
- The Fed’s tone will stay focused, with any hint of a policy shift likely to affect both assets - but especially Bitcoin, which thrives in high-liquidity environments.
Gold technical analysis: A shifting landscape?
Gold and Bitcoin may no longer be moving in sync, but that’s not necessarily a bad thing. It reflects the changing roles these assets play in a more complex financial landscape.
Gold is thriving in the here and now - feeding off fear, falling yields, and a cautious Fed.
Bitcoin is biding its time, building resilience, and slowly earning its place in the long-term safe-haven conversation.
This divergence may not be temporary - it could signal the start of a redefined safe haven landscape, one where traditional and digital assets coexist but don’t necessarily react to the same forces simultaneously.
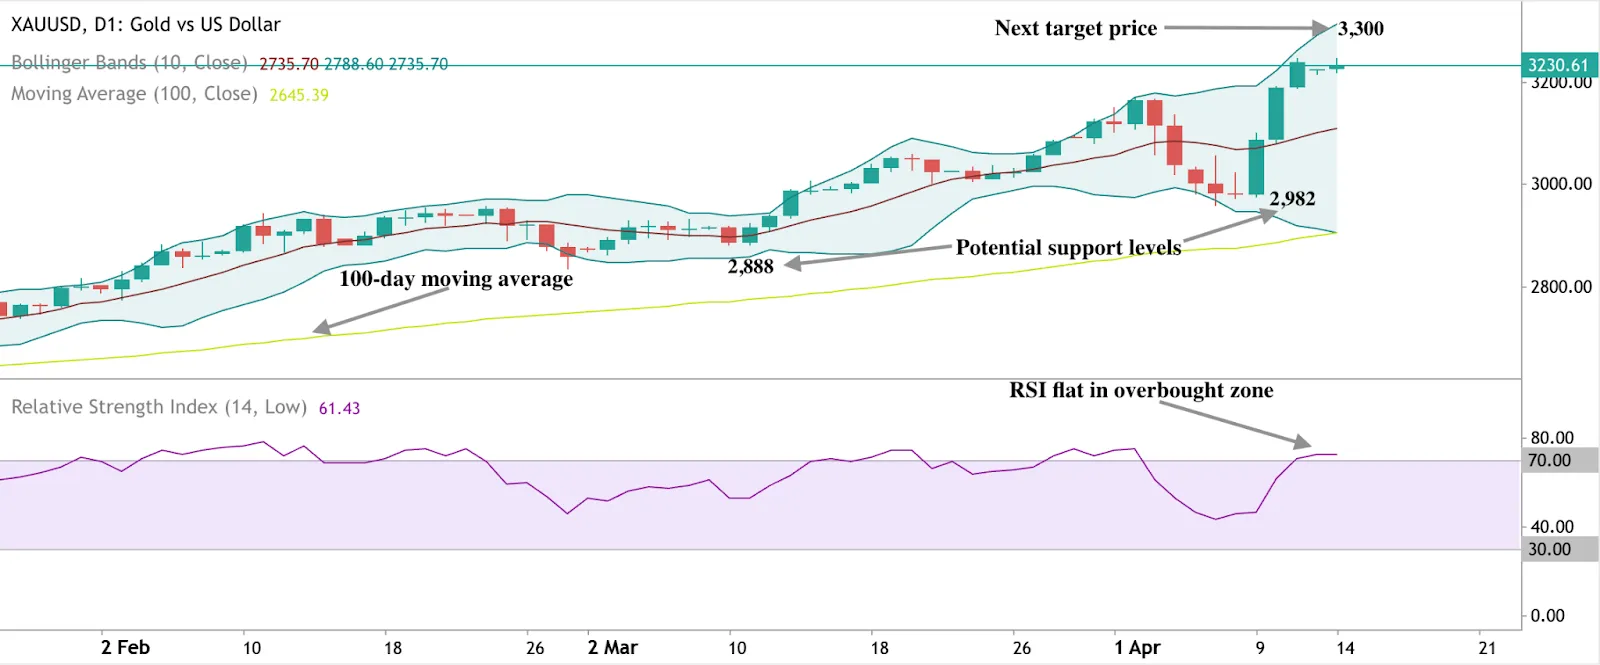
At the time of writing, Gold is showing some slight retreat despite surging upward pressure. RSI towering into overbought levels as prices inch towards the Bollinger band - is an indicator of overbought levels. If a price slide materialises, psychological price floors to watch are $3,200 and $3,000. Should the uptick resume, the psychological target to watch is $3,400.

Ready to position yourself in this changing landscape? You can speculate on Gold’s and BTC price with a Deriv MT5 or Deriv X account.

Trading multipliers on Volatility Indices: Complete guide
Multipliers on Deriv let you adjust exposure precisely on every trade while keeping your maximum loss capped at your stake.
Multipliers on Deriv let you adjust exposure precisely on every trade while keeping your maximum loss capped at your stake. On Synthetic (Volatility) Indices, this gives you leverage-style upside with a simple, transparent loss ceiling and no margin calls or overnight financing.
In 2025, Deriv expanded its multiplier ranges and added clearer in-platform guidance, allowing you to match exposure to current volatility and conviction with less friction. These improvements, along with built-in analytics and educational deep-links, make multiplier trading more accessible for both new and experienced traders.
Quick summary
- What multipliers do: Scale your position’s sensitivity to price moves while capping downside at the stake.
- Why traders use them: No margin calls, no swap fees, linear and predictable P/L.
- What’s new in 2025: Finer multiplier steps, clearer sensitivity prompts, and education deep-links.
- When they shine: 24/7 Synthetic Indices let you tune exposure without news/calendar risk.
- How to start: Align multiplier with volatility; keep stake ≤1–2% of equity; review outcomes by multiplier band.
What are Deriv multipliers and how do they work?
A multiplier is a setting you choose before placing a trade that scales how much your stake gains or loses for each percentage move in the underlying index.
Core formula:
P/L = Stake × Multiplier × % price move
Your loss is hard-capped at the stake because the contract auto-closes when unrealised loss equals your stake. There are no margin calls, no liquidation risk beyond your stake, and no overnight swap charges on multiplier contracts.
This is different from traditional leveraged products such as CFDs, where exposure is borrowed against margin and can result in losses exceeding available funds. Multipliers simplify this by defining the worst-case loss upfront, making them inherently suitable for retail traders focused on transparency and capped risk.
Leanne Smith, Deriv Education Lead, elaborates:
“Multipliers simplify exposure control. You always know your maximum loss before entering the trade, which makes disciplined risk management far easier than with margin products.”
Because sensitivity is linear in the multiplier (double the multiplier → double per-tick impact), your exposure is easier to plan. You can predict profit and loss directly from price movement, supporting consistent risk planning and clear visualisation of outcomes.
How do trading multipliers affect Volatility Indices?
Synthetic (Volatility) Indices are designed to trade 24/7, unaffected by real-world news or macroeconomic data. This means traders can focus purely on technical signals and volatility conditions.
That consistency makes Synthetic Indices ideal for multiplier trading: you can set precise exposure levels without worrying about overnight headlines or liquidity gaps. It also enables weekend testing, strategy iteration, and routine-based trading—activities that are difficult to sustain in traditional markets.
First-principles: sensitivity, tick effects, and the cap
- Per-tick impact (approx): Stake × Multiplier × TickSize.
Example: TickSize 0.01%, Stake USD 10, Multiplier 150× → each tick ≈ USD 0.15 P/L.
- Distance to the cap: the adverse percentage move that would exhaust your stake is about 1 ÷ Multiplier.
Example: at 200×, ≈ 0.50% adverse move hits the cap; at 80×, ≈ 1.25%.
Treat the multiplier as the slope of your payoff line: higher slopes magnify reward potential, while lower slopes provide more “runway” before hitting the stop-out.
Worked mini-scenarios (illustrative numbers)
- Calm probe: Stake USD 8, 60× → per tick ≈ USD 0.048. A ±0.40% move ≈ ±USD 1.92; the worst case is capped at −USD 8.
- Confirmed breakout: Stake USD 12, 200× → per tick ≈ USD 0.24. A +1.2% impulse ≈ +USD 28.80; worst case capped at −USD 12.
These simple, rule-based outcomes make multipliers easier to model, journal, and refine.
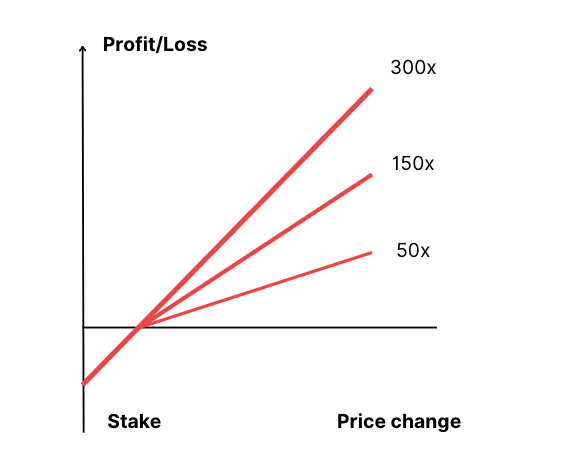
Line chart showing profit and loss against price change for 50×, 150×, and 300× multipliers with capped downside
Which multiplier level suits your capped-risk trading style?
Table 1: Multiplier bands by situation
Edge cases to plan for:
- Volatility clustering: When Average True Range (ATR) rises, step the multiplier down to extend survival time.
- Continuity vs gaps: Synthetic Indices trade continuously, so multiplier stop-outs occur on a smooth price series, not through overnight jumps.
- Financing: Positions are swap-free, allowing you to hold tactical setups longer without incurring interest costs.
What are the best multiplier strategies on Synthetic Indices?
1. Scalping (precision in micro-moves)
Focus on Volatility 25/50/75 with moderate multipliers (50×–120×). Use 1–5 minute charts, RSI or EMA signals, and tight exit criteria.
- Goal: Capture small, frequent moves while keeping drawdowns minimal.
- Why it works: Frequent repetition builds compounding potential, and capped loss allows disciplined iteration.
2. Momentum (after confirmation)
Trade directional continuations on Volatility 75/100 or Crash/Boom indices. Start near 150×, scaling to 250×–300× after confirmation.
- Why it works: Multipliers amplify trend phases linearly, letting you capitalise on clear market structure without excessive capital lock-up.
- Tip: Use smaller stakes for higher multipliers; effective exposure rises quickly above 200×.
According to Amir Rahman, Deriv Product Manager:
“Momentum strategies benefit most from linear payoff instruments. Capped downside gives traders the confidence to stay with a strong move without worrying about margin pressure.”
3. Hedging and offsets
Run opposing trades with different multipliers to stabilise portfolio variance.
- Example: Long Boom, short Crash with smaller counter-exposure.
- Benefit: Smooths account equity and helps maintain exposure balance during volatility bursts.
4. Swing trading (multi-session patterns)
For traders preferring longer holds (1–3 days), focus on Volatility 25/50 or Step Index.
- Use 100×–200× multipliers.
- Swap-free structure makes extended holding cost-efficient.
- Combine with ATR filters to adapt exposure dynamically.
5. Laddered scaling (“test and prove”)
Layer positions sequentially as confirmation builds.
- Open an initial probe at 60×.
- Add a second at 120× after +0.5% favourable move.
- Add a third at 180×–200× after +1.0%.
Each ticket has its own cap, maintaining clear risk isolation.
6. Rule-based and automated trading
Build logic in Deriv Bot or API to adjust multipliers in real time.
- Example logic:
if ATR < 0.3%: multiplier = 150
elif ATR < 0.6%: multiplier = 100
else: multiplier = 60
Automation keeps consistency and reduces emotional decision-making, especially useful in volatile environments.
How can you improve risk management for multipliers?
Position sizing
Follow the 1–2% stake rule per trade. If account equity is USD 1,000, never risk more than USD 10–20 on a single position.
This ensures controlled exposure and smooth equity progression even across a losing streak.
Align exposure with volatility
- If volatility expands, reduce the multiplier; if it contracts, raise moderately.
- Example bands by ATR% (indicative):
- <0.3%: 150×–300×
- 0.3–0.6%: 100×–200×
- >0.6%: 50×–100×

Diversify across indices
Each Synthetic Index has a unique volatility fingerprint.
Combine Volatility 50, Volatility 75, and Crash/Boom indices to diversify exposure without overextending margin.
Diversification smooths profit and loss (P/L) swings and creates a more statistically consistent edge.
Routine and behaviour
Trade in set windows (for instance, two 90-minute sessions per day).
Limit the number of setups and use a “three-loss pause rule” — stop trading after three consecutive stake hits.

Keep a trade journal logging index, multiplier, ATR, stake, and result. Over time, patterns emerge showing your most profitable volatility zones. This data defines your personal efficiency zone, the range where you perform best and should focus your trading activity.
Jason Tan, Deriv Quant Analyst, elaborates:
“Traders who journal multiplier performance by volatility regime tend to evolve faster. You can’t optimise what you don’t measure.”
What’s new in 2025
- Expanded multiplier steps across major indices for finer precision.
- In-platform context prompts (e.g., “At 300×, a 0.30% adverse move consumes your stake”).
- Education is deeply linked to Deriv Academy tutorials and product explainers.
- Updated documentation linking volatility families to recommended multiplier bands.
Together, these updates make it easier to learn, test, and apply multipliers dynamically — improving both user experience and trading safety.
Table 2: Multipliers vs CFDs (margin)
Multipliers give traders the flexibility of leverage without the complexity of margin management or financing costs. CFDs, while powerful, require deeper capital and risk infrastructure, making multipliers the more transparent retail-friendly choice.
How do Deriv platforms support capped-risk trading?
Deriv’s ecosystem ensures that multiplier trading fits seamlessly into both manual and automated workflows.
- Deriv Trader: The primary platform for multipliers, offering real-time cap visibility and interactive sensitivity sliders.
- Deriv GO: Mobile-native parity for monitoring and adjusting exposure, with alerts when volatility conditions shift.
- Deriv Bot: Enables rule-based trading automation. You can define volatility triggers, assign multiplier responses, and record results for review.
- Deriv MT5 (CFDs): Complements multipliers by enabling advanced hedging and cross-asset exposure management in a single portfolio.
All platforms connect through the Deriv Wallet, ensuring unified fund management and seamless trade synchronisation.


Deriv slashes costs on gold and Crash/Boom trading
With more than $10 billion in trading volume recorded, C/B 150 indices are rapidly becoming a cornerstone of Deriv’s synthetic ecosystem.
Crash/Boom indices have long been a favourite among Deriv traders for their unique volatility patterns and consistent market availability. In 2025, the Crash/Boom (C/B) family expanded with the launch of C/B 150 indices launch, offering traders even more diversity in leverage, volatility, and trade frequency. These synthetic indices continue to attract active traders thanks to their 24/7 operation, mathematical transparency, and consistent volatility bursts.
Crash/Boom indices form part of Deriv’s broader synthetic suite, which also includes Volatility and Range Break indices. Together, they create a seamless volatility trading environment that allows traders to study market momentum without real-world disruptions.
Recent client insights and product performance data show that traders are increasingly focusing on C/B instruments rather than broader market correlations. With more than $10 billion in trading volume recorded within the first month of the C/B 150 launch, these new indices are rapidly becoming a cornerstone of Deriv’s synthetic ecosystem.
Quick summary
- The C/B 150 indices join Deriv’s lineup, expanding trader choice and volatility control.
- Choose from C/B 150, 300, 600, 900, and 1000 to match risk, leverage, and frequency preferences.
- C/B 150 indices reached 10 billion USD in trading volume within their first month, showing strong adoption.
- Crash/Boom indices operate continuously, unaffected by real-world liquidity or macro events.
- Explore the new indices to build diversified volatility strategies tailored to your trading style.
Why do Crash/Boom indices remain central to Deriv’s ecosystem?
Because Crash/Boom indices replicate market momentum without real-world noise, traders can study volatility behaviour more predictably. These indices simulate price spikes and momentum bursts, providing a unique way for traders to participate in volatility trading without exposure to real-world news or liquidity gaps. They are algorithm-driven and designed for fairness and transparency, with every movement generated through a random number engine.
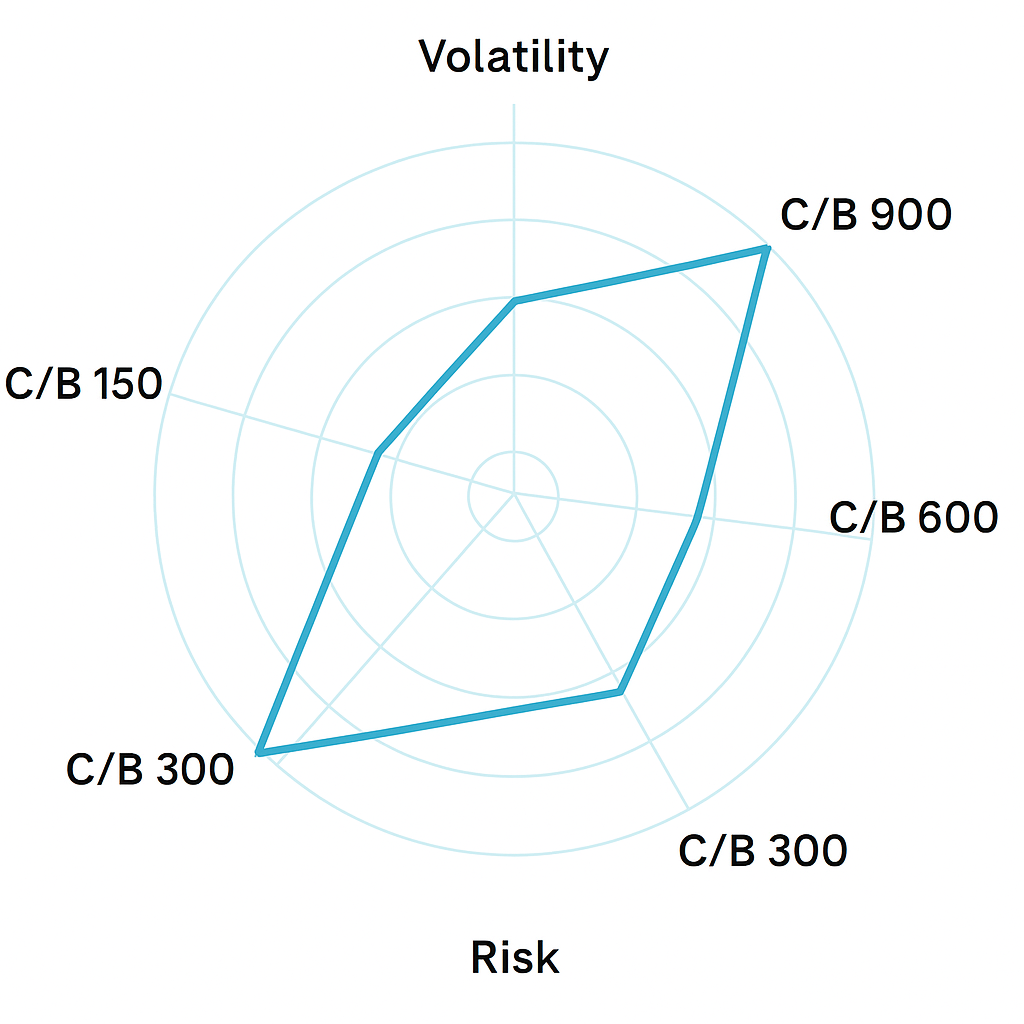
Each index offers a distinctive volatility frequency and spike pattern:
- C/B 150: Shorter cycle spikes, moderate volatility, ideal for frequent short-term setups.
- C/B 300: Balanced volatility, suited for traders seeking controlled risk.
- C/B 600: Higher volatility, greater opportunity for larger moves.
- C/B 900: Advanced traders’ choice for managing sharper swings and leverage exposure.
- C/B 1000: Highest volatility and potential reward, recommended for seasoned traders.
This range empowers traders to customise their strategies based on volatility tolerance, leverage preference, and trading duration. The latest addition, C/B 150, fills the gap for traders who want faster cycles without the extremes of C/B 1000.
Industry sources such as Investopedia note that synthetic indices built on random number generation engines can simulate real market behaviour without being affected by liquidity or external economic events. This design allows traders to test and refine strategies in a stable, data-driven environment—precisely what Crash/Boom indices aim to deliver.
What makes the C/B 150 launch stand out?
The C/B 150 launch has been one of the most successful in Deriv’s synthetic product history. Within its first month, the index family achieved over $10 billion in trading volume, highlighting strong client interest and adoption across platforms.
Hari Vilasini, Product Manager at Deriv, explains:
“Crash/Boom indices have evolved from niche volatility products into core instruments for both manual and automated traders. The C/B 150 launch is proof that structured volatility can drive innovation.”
The C/B 150 indices were designed in response to trader demand for shorter-duration volatility bursts and more frequent spike opportunities. They bridge the gap between slower, high-volatility symbols like Boom 1000 and faster, tighter instruments like Crash 300. Early trade data shows that C/B 150 records spike intervals roughly one-third shorter than C/B 300, delivering faster trading cycles and higher engagement from short-term traders.
For algorithmic trading enthusiasts, this consistent volatility cycle allows more reliable parameter testing and high-frequency calibration. The data-driven structure behind C/B 150 supports tighter precision in order management, making it an appealing tool for traders optimising both execution and timing.

How can traders choose the right Crash/Boom index for their strategy?
Selecting the right C/B index depends on trading style and risk appetite. Deriv’s range now covers every major volatility profile, ensuring that each trader can align their system with an index that fits their goals.
By matching volatility to strategy, traders can create balanced portfolios that reflect personal tolerance and expected trade frequency. For example, a trader might pair C/B 150 for active sessions with C/B 600 for longer-term setups. Once strategies are defined, applying consistent risk metrics helps maintain volatility exposure proportional across indices.
What platforms and tools support Crash/Boom indices trading?
Crash/Boom indices are available across Deriv MT5 and Deriv Trader, ensuring accessibility for both manual and automated trading styles.
- Deriv MT5: Ideal for algorithmic systems, EAs, and detailed data testing.
- Deriv Trader: Simplified trading experience for those managing shorter trades or testing new setups.
While spreads on C/B indices may vary and are not always the lowest in the industry, Deriv focuses on pricing stability and transparency, helping traders evaluate costs. Spreads and swaps can be monitored directly in Trading specifications or within each platform’s Contract specs panel.
According to Finance Magnates’ 2025 Retail Report, Deriv’s focus on pricing stability over sheer spread competition aligns with a wider industry move toward transparent cost models. The report highlights that consistency and platform parity often matter more to traders than marginal spread differences, particularly in synthetic markets.
What strategies work best for trading the new C/B 150 indices?
The C/B 150 indices’ shorter cycles create fertile ground for strategies that combine volatility anticipation with risk control.
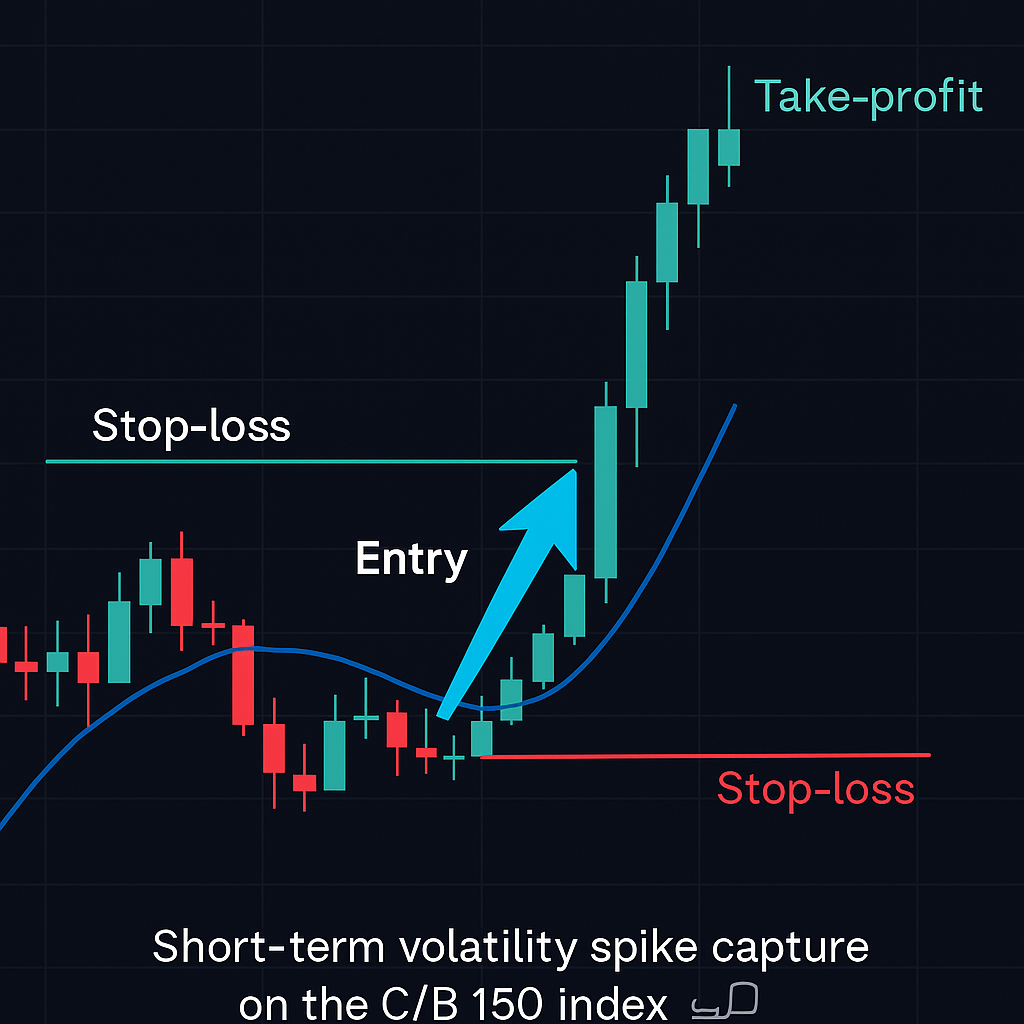
Approach 1 – Short-term spike capture:
- Identify low-volatility periods preceding spikes.
- Enter near moving average consolidations using tight stop-loss levels.
- Target small, consistent profits to exploit frequency over magnitude.
Approach 2 – Algorithmic volatility modelling:
- Use historical volatility cycles to estimate spike intervals.
- Backtest EA parameters for optimal entry timing and trailing logic.
- Re-optimise weekly as synthetic market conditions evolve.
Approach 3 – Multi-index diversification:
- Combine C/B 150 and C/B 600 to balance speed and payout size.
- Adjust trade sizes dynamically to maintain consistent risk-per-trade exposure.
For more in-depth techniques, visit the Crash/Boom strategies guide for step-by-step examples.
How can traders manage risk across diverse C/B instruments?
Volatility can be both an opportunity and a threat. Because each C/B index has its own pattern and leverage model, traders should adapt position sizing accordingly.
Key principles:
- Use smaller lot sizes on higher-volatility symbols (C/B 900–1000).
- Apply a fixed percentage risk (0.5–1%) per trade across all indices.
- Reassess stop-loss distances when switching between indices.
- Monitor swaps and rollover conditions for longer-term setups.
Risk-adjusted trading ensures that even with synthetic volatility, performance remains consistent and drawdowns are controlled.
How is synthetic volatility evolving at Deriv?
The expansion of the Crash/Boom family underscores Deriv’s commitment to providing continuous innovation in synthetic trading. While traditional assets such as Gold CFDs remain vital, synthetic indices cater to traders seeking structured, data-driven volatility exposure.
Clara Martinex, Senior Analyst at Finance Magnates, adds:
“Deriv’s synthetic indices continue to set a benchmark for algorithmic-friendly markets — transparent, data-driven, and unaffected by real-world liquidity shocks.”
Deriv’s future roadmap includes:
- Further optimisation of synthetic pricing structures.
- Continuous refinement of volatility algorithms to ensure fairness and transparency.
- Educational initiatives through Deriv Academy to help traders master volatility trading and platform tools.
- Cross-referencing tools within the volatility trading guide for further learning.
Insights from the CFA Institute’s 2025 research on algorithmic trading suggest that structured volatility models, like those used in Deriv’s synthetic indices, are well-suited for algorithmic testing and education. By integrating analytics and educational tools through Deriv Academy, the company supports traders in applying these global best practices to real strategies.
Why is diversity the new edge?
The Crash/Boom indices family now offers traders an unprecedented range of volatility and leverage options, from moderate to extreme. With the addition of the C/B 150 indices, Deriv provides a finely tuned environment for every trading style. Whether you prefer quick, repetitive setups or long-hold volatility strategies, the C/B ecosystem allows you to tailor your experience.
As synthetic indices continue to evolve, diversity becomes the trader’s greatest advantage. It helps you stay adaptable, data-driven, and ready for the next wave of opportunity on Deriv.
.webp)
Can Nvidia’s AI chips withstand trade policy headwinds?
Nvidia faces $5.5B hit from H20 China ban while reshaping semiconductor trade policy with $500B US investment. Will NVDA stock recover from the dip?
The global semiconductor sector surged into 2025 with renewed momentum, as Gartner reported a record $656 billion in chip revenues for 2024 - marking a 21% year-over-year jump. But even amid this broad growth, Nvidia is commanding the spotlight.

The AI powerhouse recently revealed a $5.5 billion charge tied to new U.S. export restrictions on its high-demand H20 chips destined for China - a move that rattled tech investors but may ultimately reinforce Nvidia’s grip on AI infrastructure.
Nvidia’s challenge: Semiconductor trade policy and a $5.5 billion charge
Nvidia’s shares dropped 6% in aftermarket trading after the company disclosed it would need a license to export its H20 chips - its most popular AI chip in China. The U.S. government’s decision to impose this requirement indefinitely stems from national security concerns around Chinese access to high-performance computing for military or supercomputing applications.
The result: Nvidia anticipates a $5.5 billion hit in the current quarter related to inventory, purchase commitments, and associated reserves. This is a stark reminder of how geopolitical forces - particularly under a Trump-influenced trade narrative -are increasingly shaping the fate of even the most advanced tech firms.
Still, Nvidia isn’t slowing down. The company recently announced a $500 billion investment to build AI supercomputers entirely in the U.S. - a move that aligns with reshoring trends and reinforces its leadership in the AI acceleration race. While near-term revenue may take a hit, Nvidia’s position as the cornerstone of global AI infrastructure seems only more entrenched.
Intel’s Altera deal and Foundry focus
Meanwhile, Intel is attempting its comeback. The company recently sold a 51% stake in Altera, its programmable chip unit, to investment firm Silver Lake in a deal that values the business at $8.75 billion. The move allows Altera to become a standalone FPGA leader while Intel retains a 49% stake - freeing itself to focus more sharply on its foundry ambitions.
Altera, once a flagship acquisition, had underperformed expectations. Analysts see offloading majority control as a strategic reset, giving Intel breathing room to streamline operations and concentrate on core manufacturing services.
Trade turbulence in a Trump-led narrative
Both Nvidia and Intel are navigating a volatile trade environment shaped by a resurgent Trump-era strategy. The U.S. recently delayed tariffs on consumer electronics, including smartphones and computers, sparking a brief rally in tech stocks. Intel’s shares rose 5% following the announcement. However, tensions quickly escalated: China responded with plans to raise tariffs on U.S. imports to as much as 125%, amplifying the conflict.
Despite this volatility, AI remains a resilient force. Oppenheimer analyst Rick Schafer recently described AI as the "best and safest growth vector" in today’s macro climate. While chipmakers may enjoy short-term boosts from "tariff-induced pull-ins," long-term guidance remains cautious.
Importantly, AI-related chip demand continues to grow. Nvidia’s export setback may hurt near-term sales, but the broader global AI adoption curve is steepening - especially in edge computing, robotics, and next-gen communications.
Semiconductor industry forecast: Resilience in the age of disruption
Looking forward, the semiconductor sector is at a crossroads. Nvidia’s temporary stumble may ultimately strengthen its position, thanks to massive U.S.-based investment and unrelenting demand for its AI chips. Intel, meanwhile, is refocusing and restructuring, showing signs of strategic clarity that could pay off in the medium term.
As earnings season kicks off - with Taiwan Semiconductor (TSMC), Intel, and others reporting - the contrast between resilience and reinvention will take center stage. Nvidia leads the pack but navigates a minefield of export controls and policy risk. Intel is rebuilding its foundation, betting on foundry services and streamlined operations.
In a market where Trump’s trade tactics and global AI ambitions collide, the chip industry’s next chapter hinges on more than just innovation. Strategic flexibility, geopolitical awareness, and timing may determine who dominates the era of intelligent machines.
Technical analysis: Buying the dips?
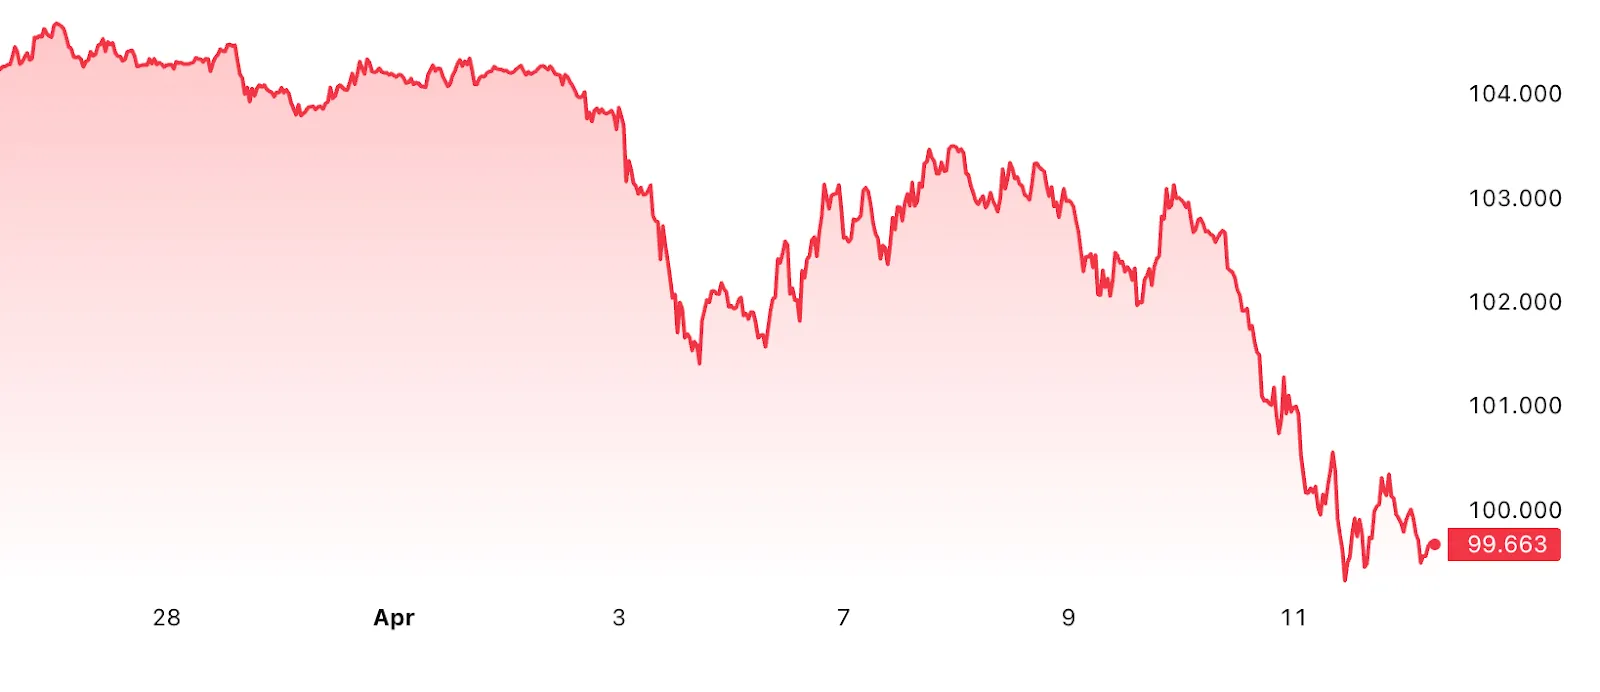
Nvidia’s stock is hovering around the $112 mark, with signs of recovery evident on the daily chart. The RSI flatlining at the midline suggests low momentum, hinting that we might see some consolidation. Prices remaining below the moving average suggest the major trend is still downward unless there is a significant uptick below the moving average.
Should prices slide, a potential price floor is at the $104.10 level. Should we see a significant uptick, we could see resistance at $120.00, with a potential price target at $130.00.

After a significant uptick last week, Intel is seeing considerable sell pressure around the $19.83 price level. Prices below the moving average could signal that the latest down move could continue the larger trend. RSI pointing downwards adds to this narrative. Should prices continue the slump, $19.25 is the key price level to watch. Should we see a bounce, prices could be held at $21.00 and $22.40.

Are you bullish on chips? You can speculate on the price trajectories of NVDA and INTC, with a Deriv MT5 or Deriv X account.

Swap-free weekends on Synthetic Indices
Deriv’s swap-free weekend lets traders hold Synthetic Index positions from Friday to Monday without paying overnight funding.
Deriv’s swap-free weekend lets traders hold Synthetic Index positions from Friday to Monday without paying overnight funding. The pause removes two days of financing while markets stay open 24/7, improving cost efficiency and strategy consistency across Deriv MT5 (Standard and Zero-spread).
It helps traders reduce costs while maintaining active strategies during continuous Synthetic Index trading.
This guide explains how the swap-free weekend works, why it matters in today’s CFD landscape, and how Deriv traders can use it to refine weekend strategies.
Quick summary
- Meaning: Weekend pause in overnight funding from the last Friday rollover to the first Monday rollover.
- Value: Synthetic Indices trade continuously; the pause cuts carry costs without interrupting strategies.
- How it works: Covers all Synthetic Indices on Deriv MT5 automatically.
- Effect: Better back-test parity, lower drag on expectancy, and uninterrupted automation.
Weekend funding used to be a predictable cost line for 24/7 markets. By removing it, Deriv gives active traders a small but consistent efficiency gain that compounds over time.
What is a swap-free weekend, and how does it work?
A swap (also known as overnight funding or rollover) is the financing adjustment applied to leveraged CFD positions held past the broker’s daily cut-off. During Deriv’s swap-free weekend, the accrual pauses from Friday’s final rollover to Monday’s first.
In practice:
- Pause starts: After the Friday 21:59 GMT rollover each week.
- Resumes: At the Monday 21:59 GMT rollover.
- Applies to: All long and short Synthetic Index trades on Deriv MT5.
Any positions open between Friday 21:59 GMT and Monday 21:59 GMT are held swap-free.

CFD funding reflects the cost of leverage: a principle defined by regulators such as the FCA and ESMA. The weekend pause simply suspends that cost, keeping statements transparent while reducing total charges.
For traders running automated systems or grid strategies, the absence of weekend swaps prevents performance distortions between live and back-tested data.
Why are Deriv synthetic indices ideal for swap-free weekends?
Synthetic Indices operate continuously and are unaffected by macroeconomic events or real-world news. This stability makes them ideal for around-the-clock strategies.
The swap-free window enables traders to hold weekend positions without incurring funding drag while maintaining their exposure.
This is especially beneficial for swing, grid, and algorithmic trading on Deriv, where uninterrupted data flow and price consistency are crucial for reliable automation and optimisation.
Deriv’s Synthetic Indices also come in distinct volatility families, from Vol 10 to Vol 250, enabling traders to choose exposure suited to their risk appetite. The swap-free pause ensures all of these remain efficient to hold through weekends.
How do swap-free weekends interact with leverage and margin?
Leverage and margin determine how efficiently traders deploy capital. During the swap-free window, equity remains stable since no financing is deducted, which improves compounding and frees up margin for tactical adjustments.
For instance, a trader using 1:500 leverage on a USD 10,000 notional position saves the equivalent of two days’ funding each weekend. Over months, these small gains support better capital retention and smoother equity curves.
Maintaining a free-margin buffer of 300–500% is advisable, ensuring that weekend volatility in 24/7 markets never threatens open positions.
Harolyn Medina Calderon, Risk Specialist at Deriv, elaborates:
“Maintaining a strong free margin during the weekend window remains essential. It ensures traders aren’t penalised for holding when Synthetic Indices stay open 24/7.”
How do swap-free weekends connect within Deriv’s ecosystem?
Since synthetic indices trade 24/7, Deriv MT5 can maintain uninterrupted automation for users.
The feature integrates Deriv’s entire trading infrastructure into a cost-efficient ecosystem that combines pricing, risk management, and transparency.
Table 1 – Deriv swap-free weekend ecosystem overview
Together, these relationships make swap-free weekends a transparent, 24/7 cost solution within Deriv’s ecosystem.
How do swap-free weekends affect CFD funding costs?
The primary advantage is that CFD funding costs are eliminated for two full days. Traders still experience price movement and margin variation, but no interest accrues.
Table 2 – Trading behaviour comparison: with swaps vs swap-free weekends
Most brokers apply daily or “triple-swap” adjustments mid-week; Deriv’s approach removes weekend accrual entirely, creating a cost-efficient structure for Synthetic Indices.
What are the benefits of weekend trading strategies?
Weekend traders can maintain open positions, automation, and analytics without funding erosion.
For weekend trading strategies, such as trend-following or grid systems, the pause improves back-test alignment and stabilizes compounded results.
It also enables strategy developers to run weekend tests continuously without compensating for variable financing inputs, enhancing model reliability.
What benefits do Deriv MT5 users gain?
- Markets covered: All Synthetic Indices (Volatility, Crash/Boom, Step, Jump, and more).
- Platforms: Deriv MT5 (Standard, Zero-spread).
- Conditions: No swaps accrue during the weekend; spreads, margin, and execution remain normal.
- Not an Islamic account: The pause is time-based, not eligibility-based.
- Platform details:
- Deriv MT5: “Swap” fields show 0.00 over weekends; statements confirm no funding.
The platform thereby maintain identical weekend conditions, giving quants and discretionary traders full consistency across systems.
“For most traders, the weekend swap pause is invisible — yet it directly improves strategy accuracy,” explains Muhammad Hamza Akram, Deriv Platform Product Manager.
“Automation tools on Deriv MT5 perform closer to theoretical models because there’s no overnight cost distortion.”
How can traders integrate swap-free weekends into their workflow?
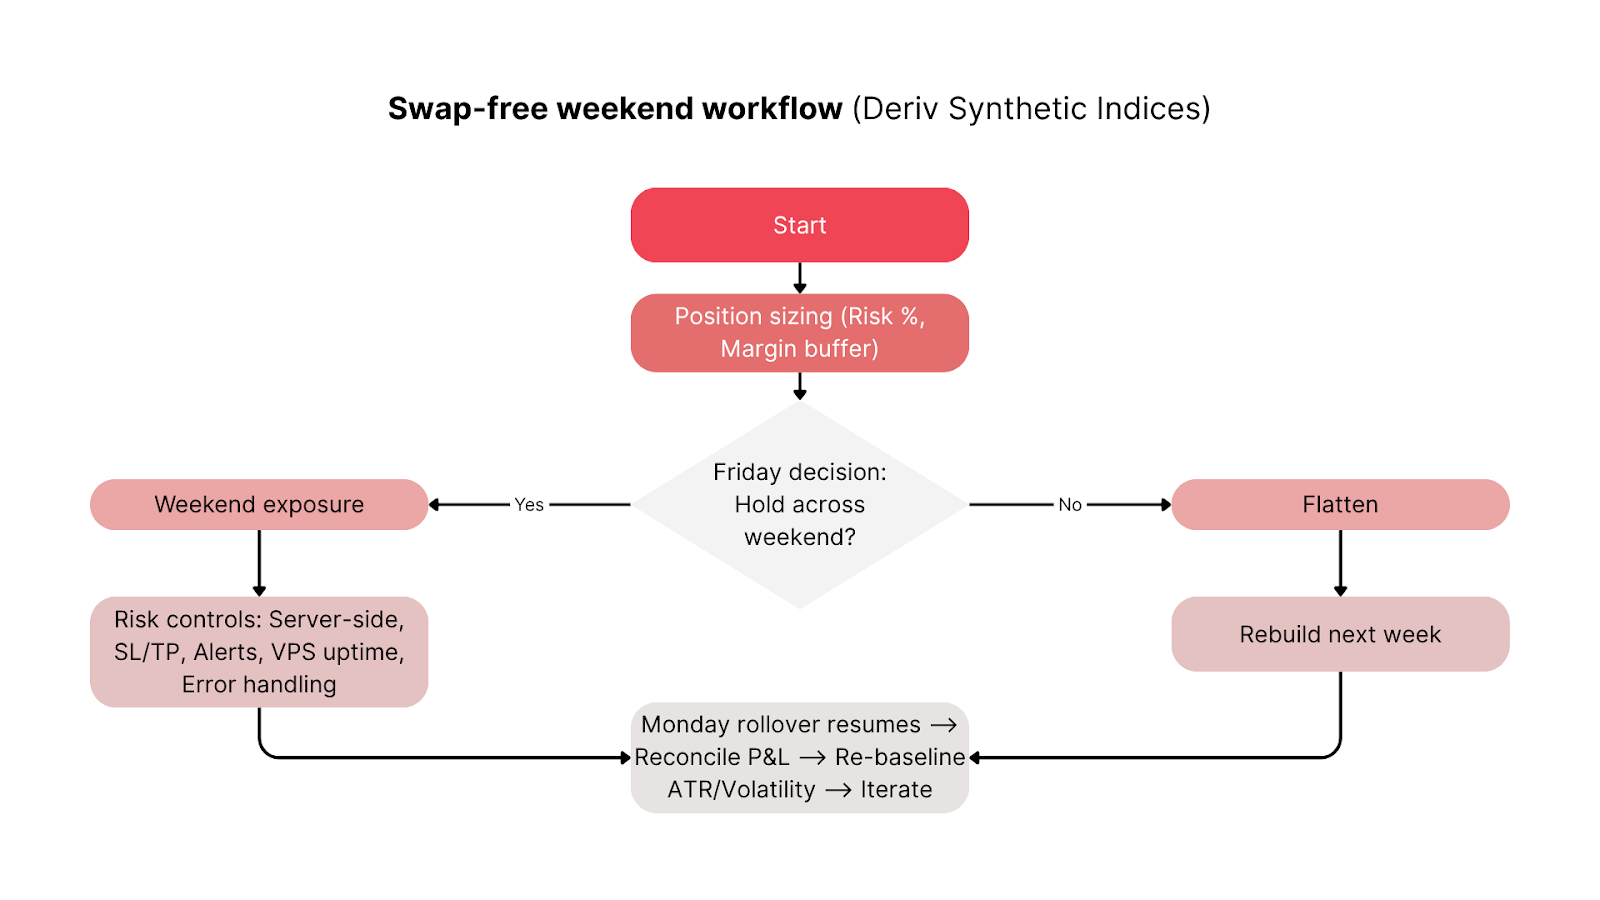
To benefit fully, align capital, execution, and monitoring routines with Deriv’s weekend window.
Pre-Friday checklist:
- Maintain a free margin of 300–500% to absorb variance.
- Place server-side stops and limits.
- Confirm VPS stability and alert timings for automated strategies.
- Diversify index exposure (e.g., combine Vol 25 with Vol 75).
During the weekend:
- Monitor positions periodically; prices move 24/7 even without swaps.
- Avoid manual intervention unless volatility spikes.
Monday reconciliation:
- Verify no weekend funding entries in statements.
- Adjust stops or scaling if volatility changes after the Monday roll.
This simple routine turns a passive weekend into a controlled, data-driven trading window.
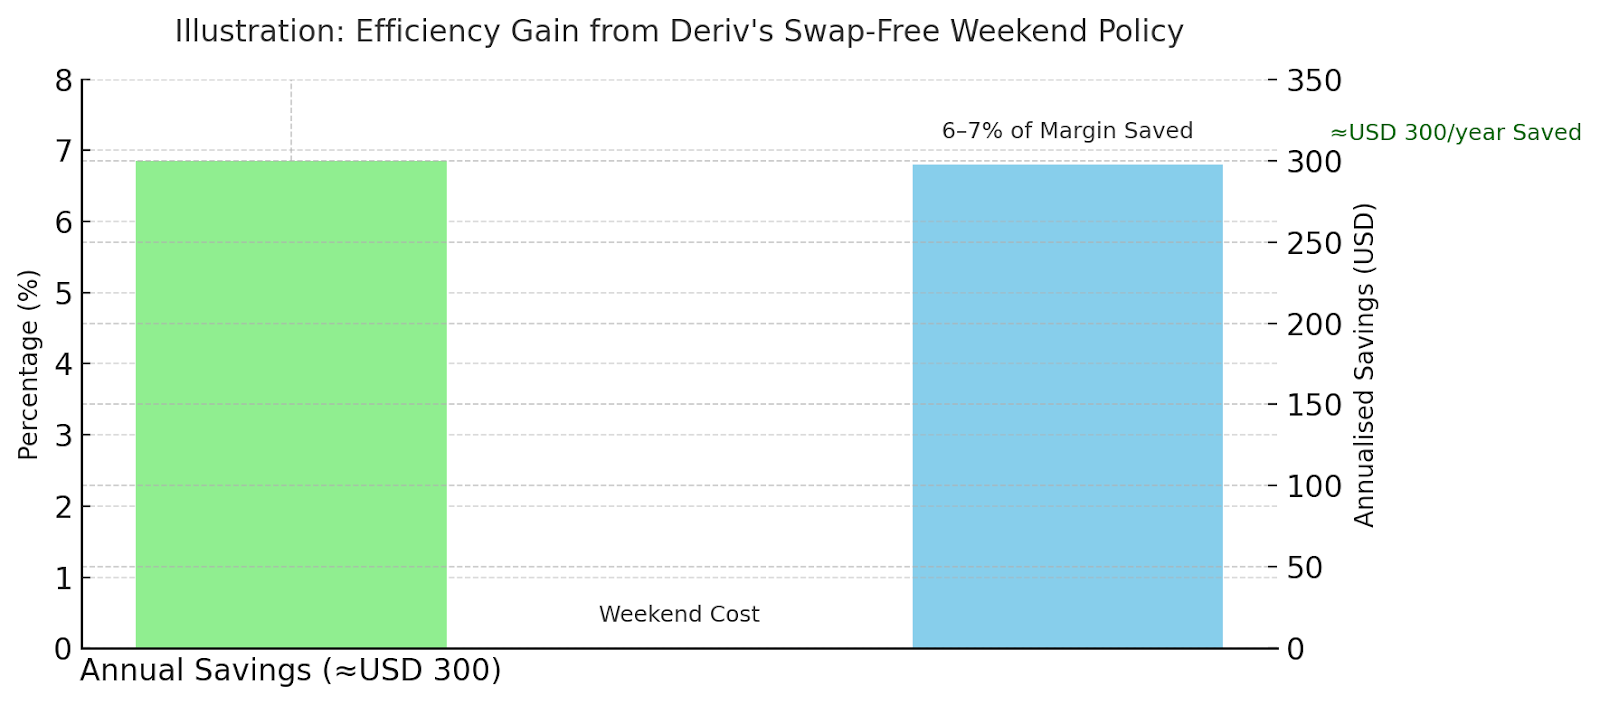
How much can traders save each year?
Assume a 2.5% annualised funding rate. Two weekend days equal roughly 0.014% of notional.
At 1:500 leverage, that’s about 6–7% of the posted margin saved each weekend. Over a year, frequent weekend positions can reduce total funding by hundreds of USD.
For example:
- Scenario A: USD 20,000 notional swing position → ≈ USD 120 annual savings.
- Scenario B: automated grid of USD 50,000 aggregate notional → ≈ USD 300 saving.
These differences compound for active systems trading 40–45 weekends per year.
“Weekend funding has always been a small but compounding cost for leveraged traders,” says Alassana Kane, Senior Trading Analyst at Deriv.
He goes on: “By removing this element for Synthetic Indices, we give traders more predictable performance metrics and closer alignment between live data and algorithmic testing results.”
How do other brokers handle weekend swaps under FCA and ESMA rules?
Most brokers apply rollover charges continuously, whereas Deriv uniquely removes them across the weekend window.
Table 3 – Broker weekend policy comparison
This policy complies with FCA and ESMA rules on cost transparency and client protection, ensuring that weekend financing is clearly disclosed and applied fairly.
Deriv Compliance team, Rose Tanya, mentions:
“The swap-free weekend aligns perfectly with global CFD cost-disclosure standards. It reflects our broader commitment to transparency under FCA and ESMA supervision.”
How does Deriv’s swap-free weekends redefine 24/7 trading?
Deriv’s swap-free weekend policy transforms how traders manage exposure on Synthetic Indices. It lowers CFD funding costs, supports continuous automation on Deriv MT5, and complies with FCA and ESMA transparency standards.
For traders aiming to refine weekend trading strategies or optimise leverage and margin use, this feature offers measurable efficiency without additional complexity.
So if you’re wondering how to lower weekend trading costs on Synthetic Indices, Deriv’s swap-free feature gives you that flexibility automatically.
It reduces CFD funding costs, supports continuous automation, and aligns fully with regulatory best practice, which is a clear edge for Deriv traders in 2025 and beyond.

Bitcoin price breaches $85,000 as crypto enters a new phase
Bitcoin just hit $85,000, and the crypto world is buzzing with bullish energy.
Bitcoin just hit $85,000, and the crypto world is buzzing with bullish energy. It’s not just a number-it’s a signal. A signal that momentum is building, whales are stirring, and the crypto market might be stepping into a new era.
But with all this hype, we’ve got to ask: is this a breakout or a bluff?
Bitcoin leads the charge
Bitcoin’s recent surge to $85K marks one of its most significant price moves. That puts it up 13.4% from its monthly low, even as it trades just shy of the key resistance level at $85,000. Yet, despite the excitement, BTC remains under its 50-day moving average - a sign that not everyone’s convinced this rally has legs.
Market mood? Still cautious. The crypto Fear & Greed Index is parked at 38, firmly in the “fear” zone.
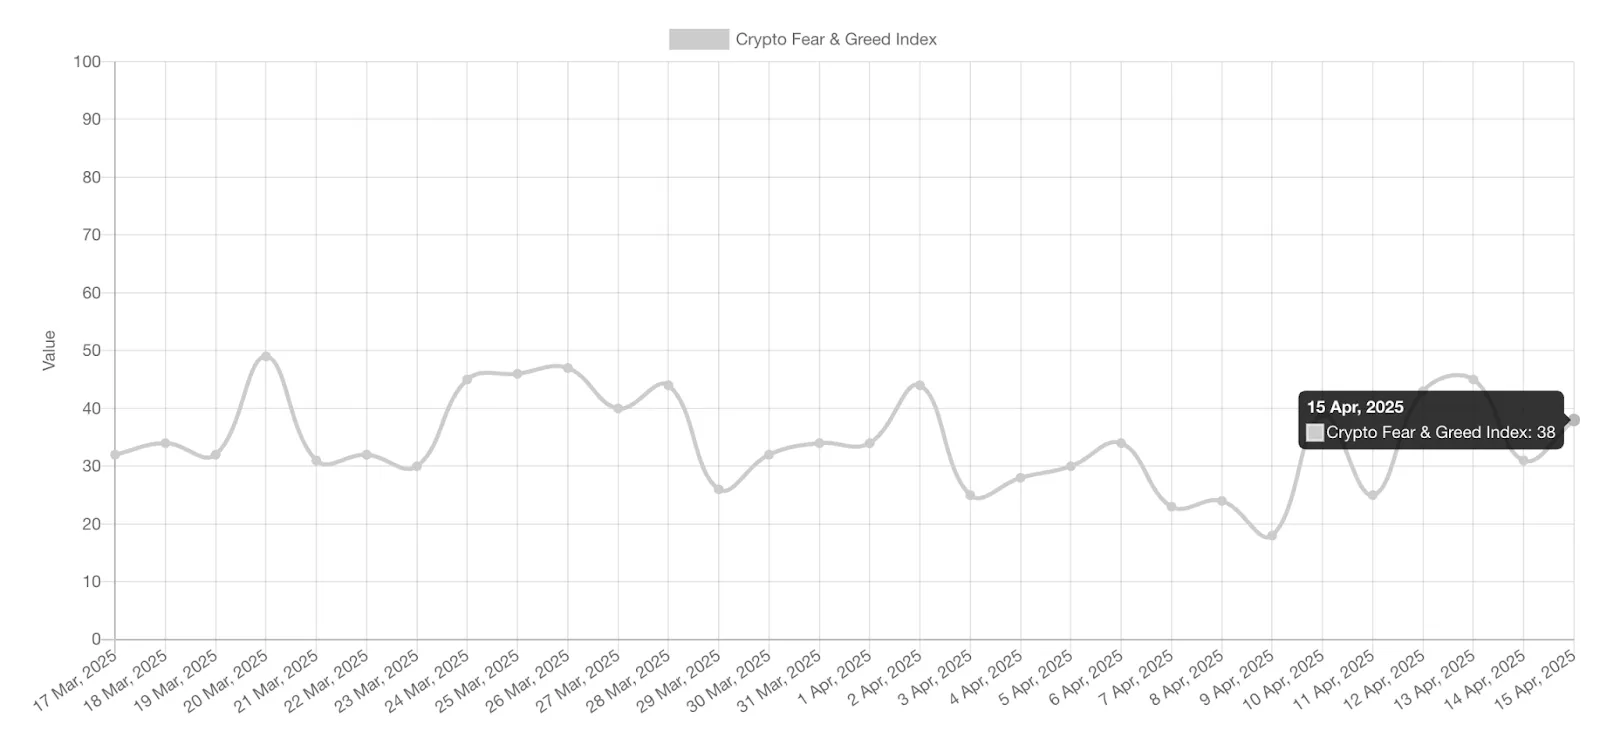
CNN’s version takes it further, clocking in at 21 "extreme fear."
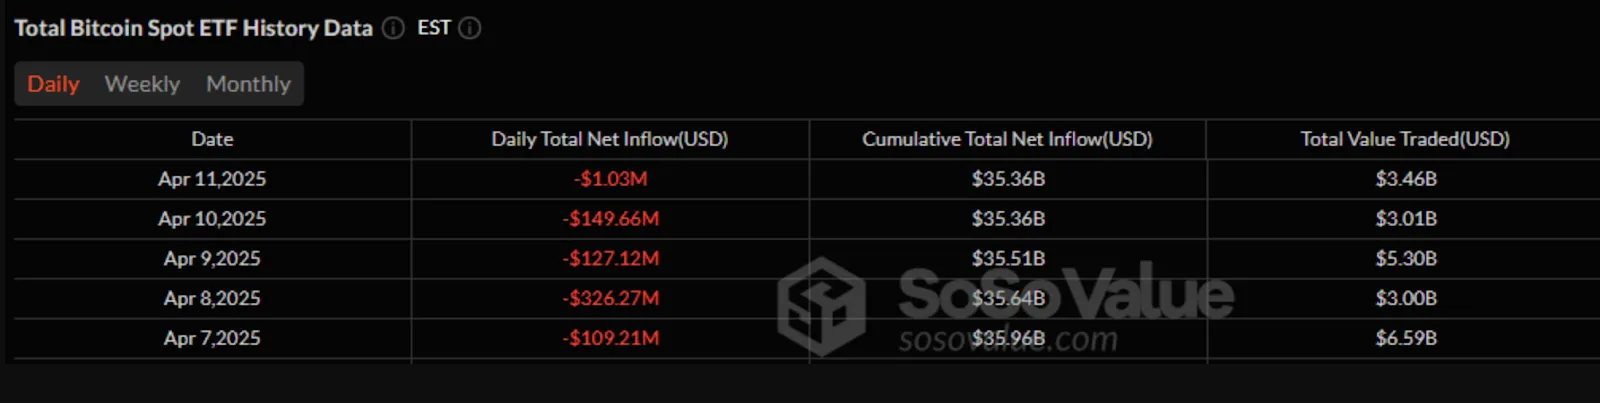
Spot Bitcoin ETFs haven’t helped, logging $713 million in outflows last week and $172 million the week before.
Traders are sitting on the sidelines, waiting for clearer skies.
So why the surge?
Thank the macro drama. President Trump recently announced a 90-day suspension on certain tariffs, sparing smartphones, semiconductors, and other tech gear. The Nasdaq 100 jumped on the news - then cooled off. Still, crypto liked what it saw. Liquidity came back, and risk appetite started to rise.
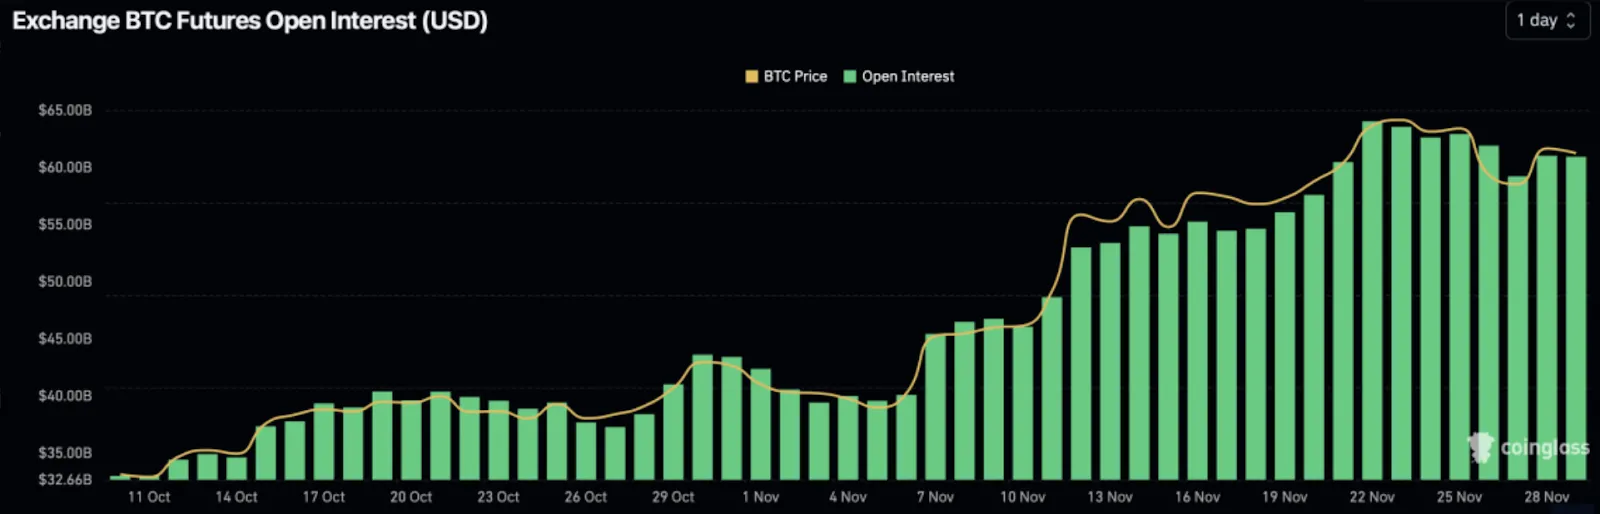
Open interest in Bitcoin futures remains flat at $60 billion, signalling a bit of hesitation among derivatives traders. But whales? They’re paying attention. Market watchers saw increased wallet activity around the $84K mark, with some big players possibly accumulating BTC in anticipation of further gains.
Ripple Hidden Road acquisition
While Bitcoin was grabbing headlines, Ripple decided to steal a little spotlight. The crypto firm is acquiring Hidden Road - a major brokerage that processed $3 trillion in transfers last year - for a staggering $1.25 billion. The deal will close by Q3 2025 and includes a clever twist: it’s being paid for with cash, Ripple equity, and XRP tokens.
That’s right. XRP isn’t just along for the ride - it’s part of the engine.
XRP whale accumulation
XRP has been moving too, rising to $2.15 during Monday’s early European session. With $2.00 acting as a strong support level, whales have been taking advantage of recent dips. Santiment reports wallets holding between 1 million and 100 million XRP now control over 20% of the total supply. That’s not just noise - that’s conviction.
The big driver? Again, it’s the U.S. tariff saga. Trump's 90-day pause on new duties boosted sentiment across markets. Even though the exemptions aren’t permanent and fentanyl-related tariffs are still in place; the temporary relief gave crypto whales a reason to start buying again.
Ripple’s acquisition isn’t just about buying a brokerage - it’s about planting a flag in institutional finance. Coin Bureau CEO Nic Puckrin calls it a "watershed moment," when crypto stops knocking on TradFi’s door and starts owning the building.
Hidden Road’s infrastructure gives Ripple a fast track into the institutional plumbing that runs global finance. The use of XRP in the deal sends a message too: this isn’t just about tokenomics; it’s about trust.
Legal win in sight?
Ripple is also nearing the end of its years-long legal clash with the SEC. Both sides filed to dismiss remaining appeals, and a $50 million settlement is on the table - down from the original $125 million. Ripple CEO Brad Garlinghouse framed it as a victory, signaling a more favourable regulatory landscape ahead.
Technical outlook: Crypto market in a new phase?
Bitcoin’s breakout and Ripple’s institutional push paint a clear picture: crypto is no longer just a fringe experiment. With whales accumulating, macro conditions shifting, and major players like Ripple executing billion-dollar deals, this market matures quickly.
Whether you’re a trader, an investor, or just crypto-curious, the question now is what’s next. Could Bitcoin push beyond $90K? Will XRP’s ecosystem become an essential infrastructure for TradFi? And how will regulation continue to shape the path forward?
At the time of writing, BTC is hovering around the $85,500 price level with some bullish indicators present, as the RSI mildly rises just above the midline. However, prices remain below the moving average as they tower towards the upper Bollinger band - an indicator of overbought conditions.
Key levels to watch on the upside are $87,400 and $91,000, and on the downside, the key levels are $81,800 and $78,800.

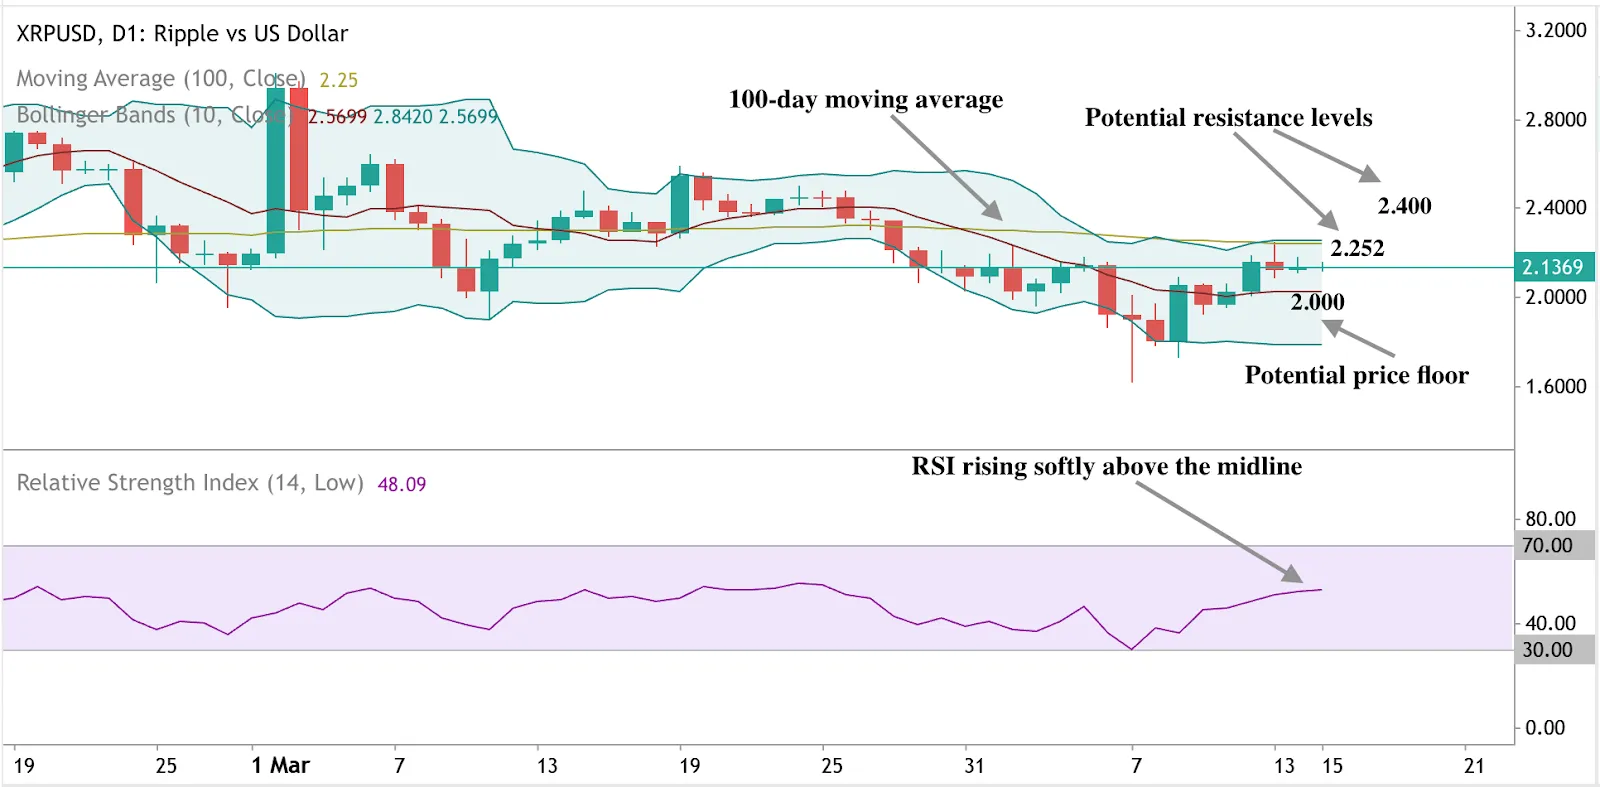
XRP has also been on the rise, though it is currently flat-lining. Prices remaining below the moving average suggest that the overall trend is still downwards unless we see significant momentum building. Should we see a surge, key levels to watch are $2.252 and $2.400. If we see a significant slide, prices could find support at the $2.000 mark.
Ready to position yourself in this changing landscape? You can speculate on BTC and XRP with a Deriv MT5 or Deriv X account.

Dollar is losing ground to gold as the safe-haven
Gold hits record $3,245 as Dollar Index crashes below 100 for the first time in three years.
Gold hits record $3,245 as Dollar Index crashes below 100 for the first time in three years. Goldman Sachs now predicts gold will reach $3,700 by 2025.
The dollar’s identity crisis
Something unthinkable is happening in global markets. The US dollar is losing its status as the world’s financial refuge.
With the Dollar Index (DXY) now below 100- its lowest point in three years- investors aren’t rushing to the greenback during market turmoil. Instead, they’re buying gold at a record pace.
Deriv expert Prakash Bhudia attributes this to more than just typical market volatility. "What we're witnessing here is the 'Triffin Dilemma' in action," Bhudia explains, referring to the paradox of the United States needing to run trade deficits to supply the world with dollars. "The tariffs fundamentally misinterpret how global flows work. The global demand for dollars keeps the currency artificially strong, naturally creating trade deficits."
Trade war impact on gold prices
The US-China trade relationship has deteriorated to levels not seen in decades. Recent events tell a dramatic story:
- US imposed massive 145% tariffs on Chinese imports
- China retaliated with 125% tariffs on American goods
- Financial markets reacted with immediate volatility
Bhudia expresses profound concern about these tariffs. "They are not only misaligned with economic realities but could trigger deeper financial instability. Reducing the trade deficit substantially risks global dollar shortages, potentially triggering international financial instability similar to the dollar funding crisis we saw in March 2020."
Investors are behaving differently this time, abandoning the dollar alongside US stocks and bonds- a triple exodus Deutsche Bank analyst George Saravelos calls “uncharted territory.” Even Stephen Miran from the White House Council of Economic Advisers acknowledged that a weaker dollar might boost competitiveness- a rare admission signalling a major policy shift.
Dollar losing safe-haven status while Europe stabilises
Amid this chaos, gold has emerged as the clear winner, reaching an unprecedented $3,245 per ounce. According to Bhudia, the recent dip in gold prices is not a failure but a "classic liquidity unwind." He explains, "In moments of stress, gold often gets sold not because it's weak but because it's liquid-essentially the ATM traders use during margin calls."
Goldman Sachs remains bullish, projecting gold to hit $3,700 per ounce by the end of 2025, with potential for $4,500 in a worst-case scenario. The drivers behind this bullish outlook include heightened recession fears, massive institutional investment in ETFs and physical gold, and aggressive central bank purchasing, particularly in Asia.
Gold vs US dollar battle for safe-haven supremacy
Amid this chaos, gold has emerged as the clear winner, reaching an unprecedented $3,245 per ounce. According to Bhudia, the recent dip in gold prices is not a failure but a "classic liquidity unwind." He explains, "In moments of stress, gold often gets sold not because it's weak but because it's liquid-essentially the ATM traders use during margin calls."
Goldman Sachs remains bullish, projecting gold to hit $3,700 per ounce by the end of 2025, with potential for $4,500 in a worst-case scenario. The drivers behind this bullish outlook include heightened recession fears, massive institutional investment in ETFs and physical gold, and aggressive central bank purchasing, particularly in Asia.
Though prices pulled back slightly after Trump moderated some tariff proposals (targeting Chinese electronics with 20% levies instead of broader measures), Goldman Sachs believes this is merely a pause in gold’s ascent. The investment giant has raised its gold forecast for the third time this year, projecting:
- $3,700 per ounce by the end of 2025 (base case)
- Potential for $4,500 per ounce in a “worst-case scenario”
What are the drivers behind this bullish outlook? According to experts, heightened recession fears tied to ongoing trade disputes, massive institutional investment in ETFs and physical gold, and aggressive purchasing by central banks, particularly across Asia.
Market calm or deeper financial transformation
While the dollar briefly recovered as markets stabilised, Bhudia warns investors to remain cautious. The recent sell-off across nearly every asset class is not merely profit-taking. Instead, Bhudia sees a deeper reassessment of markets, where previous narratives of AI-driven productivity, soft landings, and geopolitical calm have rapidly broken down.
"The recent volatility spike across traditionally uncorrelated assets- Bitcoin, gold, tech stocks-is not rotation but liquidity stress," Bhudia emphasizes. This introduces significant tail risks, widening uncertainty, and fragile investor confidence.
He highlights the potential real-economy contagion, noting that small businesses, in particular, could face severe impacts. "Some smaller firms are already freezing orders due to new customs costs. If that spills over into labor markets or retail consumption, we could see a broader economic slowdown."
Analysts like Tony Sycamore from IG, on the other hand, warn that market volatility is just beginning. Trump’s inconsistent tariff policies create perpetual uncertainty, and Gary Schlossberg at Wells Fargo Investment Institute notes that even if the dollar remains dominant by default, investor unease continues to grow.
Gold price forecast and technical analysis
Currently trading around $3,231, gold shows predominantly bullish signals on daily charts. However, technical indicators suggest potential consolidation ahead:
- RSI holding flat in overbought territory
- Prices approaching the upper Bollinger band
- Key support levels at $2,982 and $2,888 if a correction occurs
- Psychological target of $3,300 if the rally resumes
Why this shift from dollar to gold matters now
Understanding the deeper implications of this shift is critical for your financial decisions. Bhudia sees gold as essential for navigating persistent uncertainty, particularly as global central banks increasingly diversify away from the dollar.
"If protectionism escalates," Bhudia says, "gold’s role as neutral collateral in a multipolar world will only grow."
Whether you're an investor seeking portfolio protection, a trader exploring opportunities, or simply concerned about economic stability, gold's ascent signals a fundamental realignment that could redefine global markets for years.
Ready to position yourself in this changing landscape? You can speculate on Gold’s price and dollar strength with a Deriv MT5 or Deriv X account.

EUR/USD forecast shifts as traders eye a weaker dollar
EUR/USD surges 2.5% as cooling inflation weakens the dollar. Will consumer sentiment data reverse the euro dollar exchange rate momentum?
The euro just made a bold move as EUR/USD surged over 2.5% on Thursday, breaking past the 1.1200 mark and closing at its highest level in nearly two years. For traders watching this pair stagnate for months, it was the breakout they’d been waiting for.
But now that the euro is climbing, the real question is: Where does the dollar go from here?
Inflation cools, tariff tensions ease, dollar takes the hit
Two key catalysts lit the fuse under EUR/USD. First, the Trump administration backed away from its latest tariff threats, calming nerves across risk markets. It’s a playbook we’ve seen: throw out significant trade threats, watch markets tremble, and then dial it back just enough to stabilize sentiment. But this time, the dollar was especially vulnerable.
That’s because March inflation data delivered a shocker. Core CPI fell to 2.8% year-over-year, the lowest since 2020, after sticking above 3% for nearly eight months. Headline inflation dropped to 2.4%, adding fuel to the fire. For investors and the Fed, it was the first real sign that inflation might be cooling meaningfully.

The result? A broad pullback in dollar demand and a wave of strength for euro and pound bulls.
All eyes on consumer sentiment and inflation expectations
But before we get too carried away, there’s still one big test coming: Friday’s University of Michigan Consumer Sentiment Index. Expectations are grim. The index is forecast to fall to 54.5, a nearly three-year low.

Consumers feel the weight of policy uncertainty, even with inflation easing on paper.
Consumer inflation expectations, which remain sticky, will be even more critical. Last month, Americans expected 5% inflation over the next year and 4.1% over five years, above what the Fed wants. If those expectations don’t budge, the Fed might stay hawkish longer than markets hope.
So, where does the Euro dollar exchange rate go from here?
According to analysts, the dollar's weakness could deepen if sentiment rebounds and inflation expectations fall. That opens the door for continued gains in EUR/USD and GBP/USD. But if Friday’s data suggests the public still expects stubborn inflation, if risk sentiment takes another dive, the greenback could fight back hard.
Dollar technical analysis: Will the USD fall further?
At the time of writing, buy pressure is dominant on the daily chart as prices stay above the moving average. However, prices slightly breaching the upper Bollinger band is an indicator of overbought conditions. RSI deep in overbought territory adds to the narrative.
Key levels to watch should the dollar strengthen are $1.0949 and $1.0798. Should the dollar weaken further, a likely target would be the $1.3190 price level.

You can speculate on dollar strength by trading dollar currency pairs with a Deriv MT5 or Deriv X account.
Sorry, we couldn’t find any results matching .
Search tips:
- Check your spelling and try again
- Try another keyword