Results for

Gold and oil are splitting, and the NFP report could decide what’s next
Gold is nervous. Oil is bleeding. And with the US non-farm payrolls (NFP) report landing, both markets are bracing for impact.
Note: As of August 2025, we no longer offer the Deriv X platform.
Gold is nervous. Oil is bleeding. And with the US non-farm payrolls (NFP) report landing, both markets are bracing for impact.
Gold, the go-to safe haven in shaky times, has struggled to shine, dragged down by a dollar that just won’t back off. Oil’s been hit even harder, plunging to a four-year low near $60.
What's behind these slides, and could Friday's critical NFP report turn things around?
Gold still under pressure, but hopeful
Gold’s recent quiet spell can largely be attributed to a strengthening dollar, which makes the precious metal pricier and less attractive for investors holding other currencies. Additionally, recent optimism over easing trade tensions - especially the U.S. administration’s decision to delay auto tariffs by two years - briefly dampened gold's safe-haven appeal, prompting investors to shift towards riskier assets.
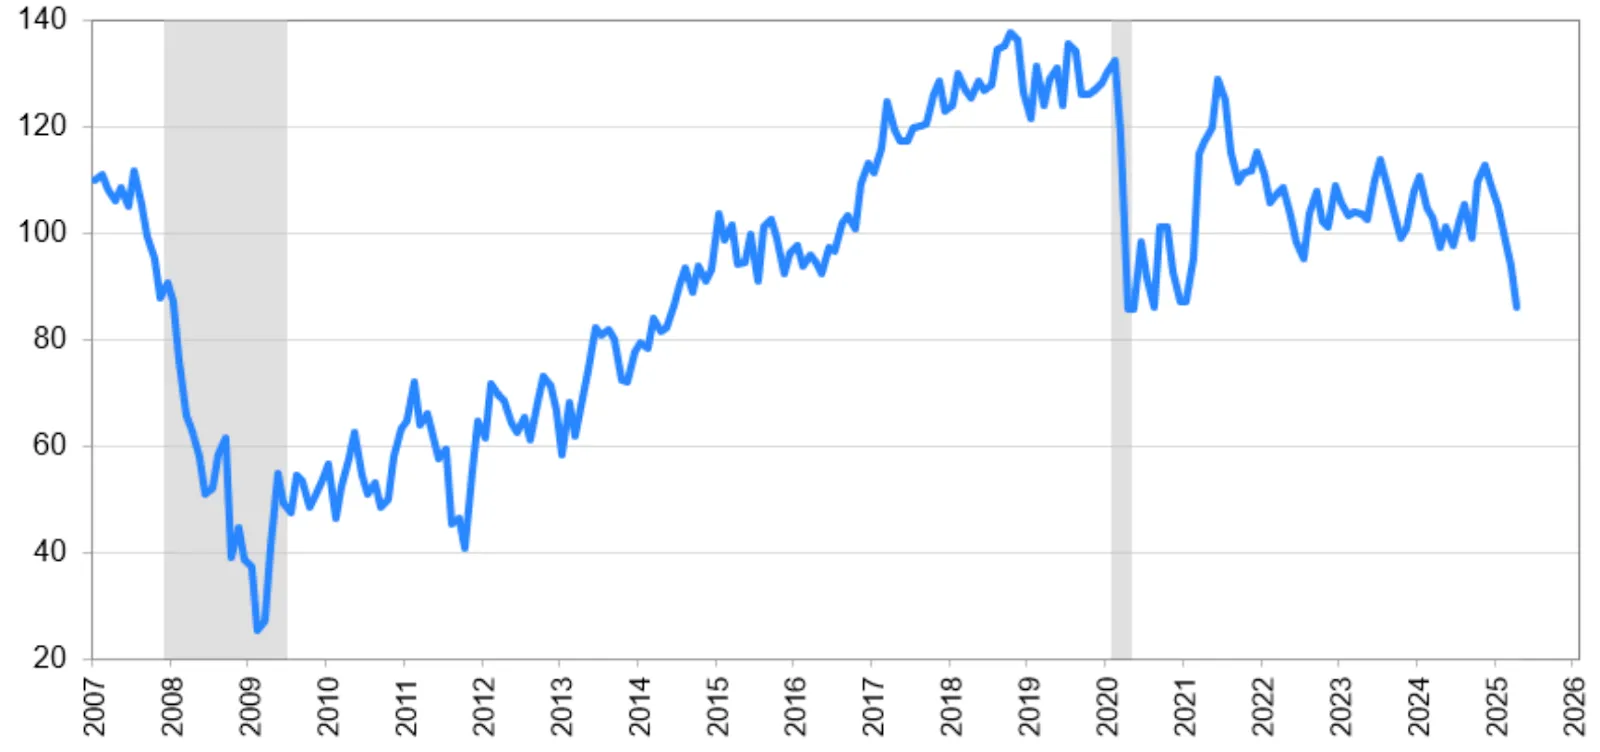
However, gold remains supported by mounting expectations of the Federal Reserve's rate cuts. Economic data has raised red flags: consumer confidence plunged to 86.0, its weakest reading in nearly five years, while U.S. job openings fell to their lowest level since September 2024.
Markets are now pricing in a nearly 60% chance of a Fed rate cut, typically beneficial for non-yielding assets like gold, which thrive during periods of economic uncertainty and low interest rates.

Saudi Arabia's oil strategy shakes up Oil markets
Over in the oil market, Saudi Arabia has shaken things up by shifting its traditional strategy. Usually, the guardian of higher oil prices through production cuts, the kingdom now seems content to tolerate lower prices to regain market share. Frustrated with OPEC+ partners who exceed their quotas, Saudi Arabia is signalling it won't cut supply anytime soon, increasing bearish pressure on prices.
However, oil prices briefly bounced nearly 2% higher recently after President Donald Trump threatened secondary sanctions on Iran, demanding that all purchases of Iranian oil or petrochemical products cease immediately. Trump's move came after the postponement of the fourth round of U.S.-Iran nuclear talks initially scheduled for Saturday.
According to Andrew Lipow of Lipow Oil Associates, enforcing these sanctions could potentially reduce global oil supply by about 1.5 million barrels per day, temporarily supporting prices.
Still, with OPEC+ discussions approaching next week, further output increases seem likely, as several members plan to suggest accelerating production hikes in June. Analysts like Dennis Kissler from BOK Financial warn this could add even more downside risks.
Economic clouds gather
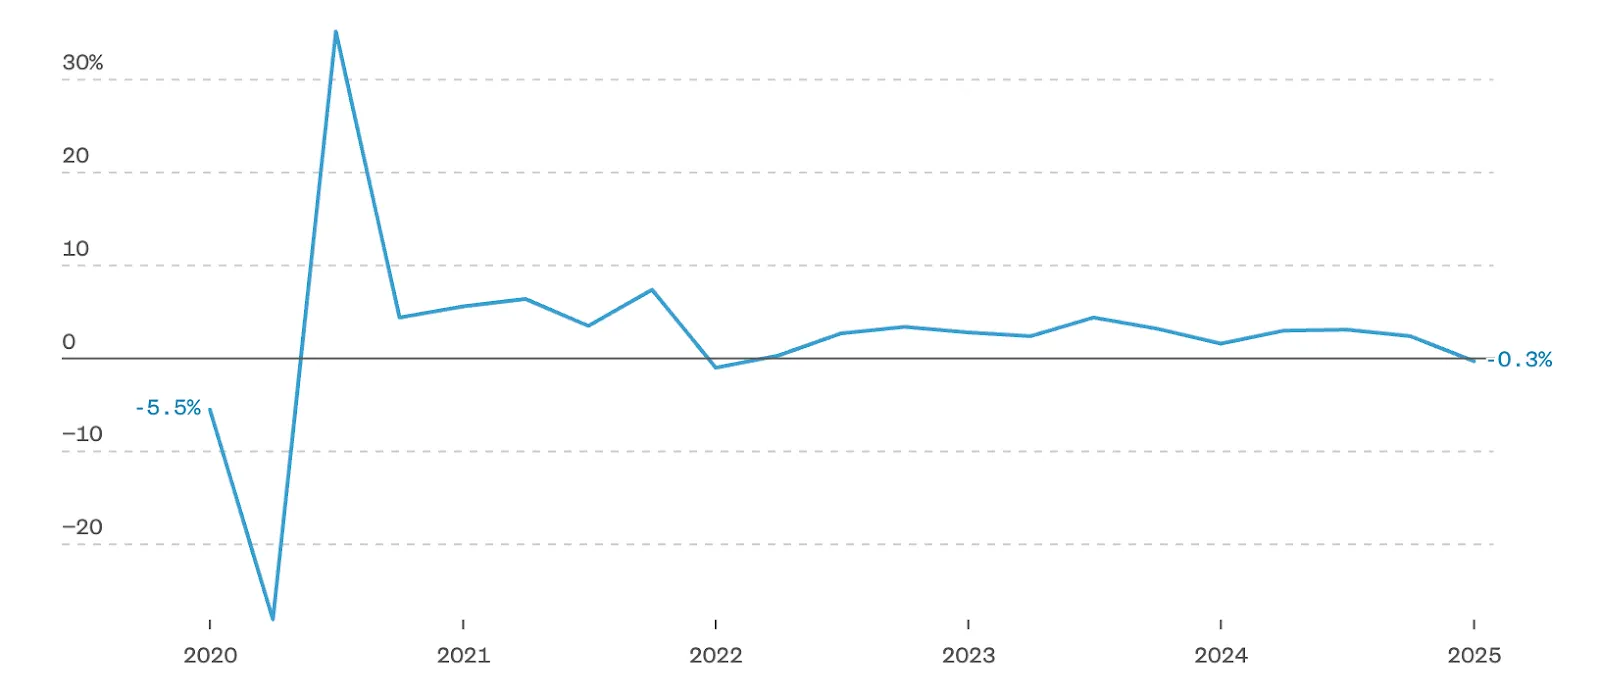
Adding to commodity woes are fears about slowing global economic growth. The U.S. economy contracted unexpectedly in Q1 by 0.3%, driven by heavy import activity ahead of Trump's tariffs. China and Europe are also facing economic slowdowns, dampening global demand for both oil and gold.
All eyes on Non-farm payrolls
The NFP report set for release this Friday could be pivotal. Expectations suggest slower hiring but stable unemployment at 4.2%. A weaker-than-expected report could heighten recession fears, potentially boosting gold prices as investors seek safety. For oil, weak employment data might mean lower demand prospects, but a potential rate cut weakening the dollar could offer short-term support.
Can tech stocks save the day?
Interestingly, solid earnings from tech giants Meta and Microsoft recently boosted investor sentiment, briefly stabilising oil prices and improving overall market confidence. But tech earnings alone probably won't be enough to permanently lift commodities out of their slump.
Commodity market technical analysis
Both gold and oil markets currently feel like they're on uncertain ground, balancing economic fears against potential policy interventions. Hedge funds have reduced bullish bets, and market volatility is rising. With Friday’s payroll numbers around the corner, investors are holding their breath.
Will gold regain its sparkle? Can oil prices stabilise? Keep your eyes peeled - this week’s economic data might just set the tone for commodities in the weeks to come.
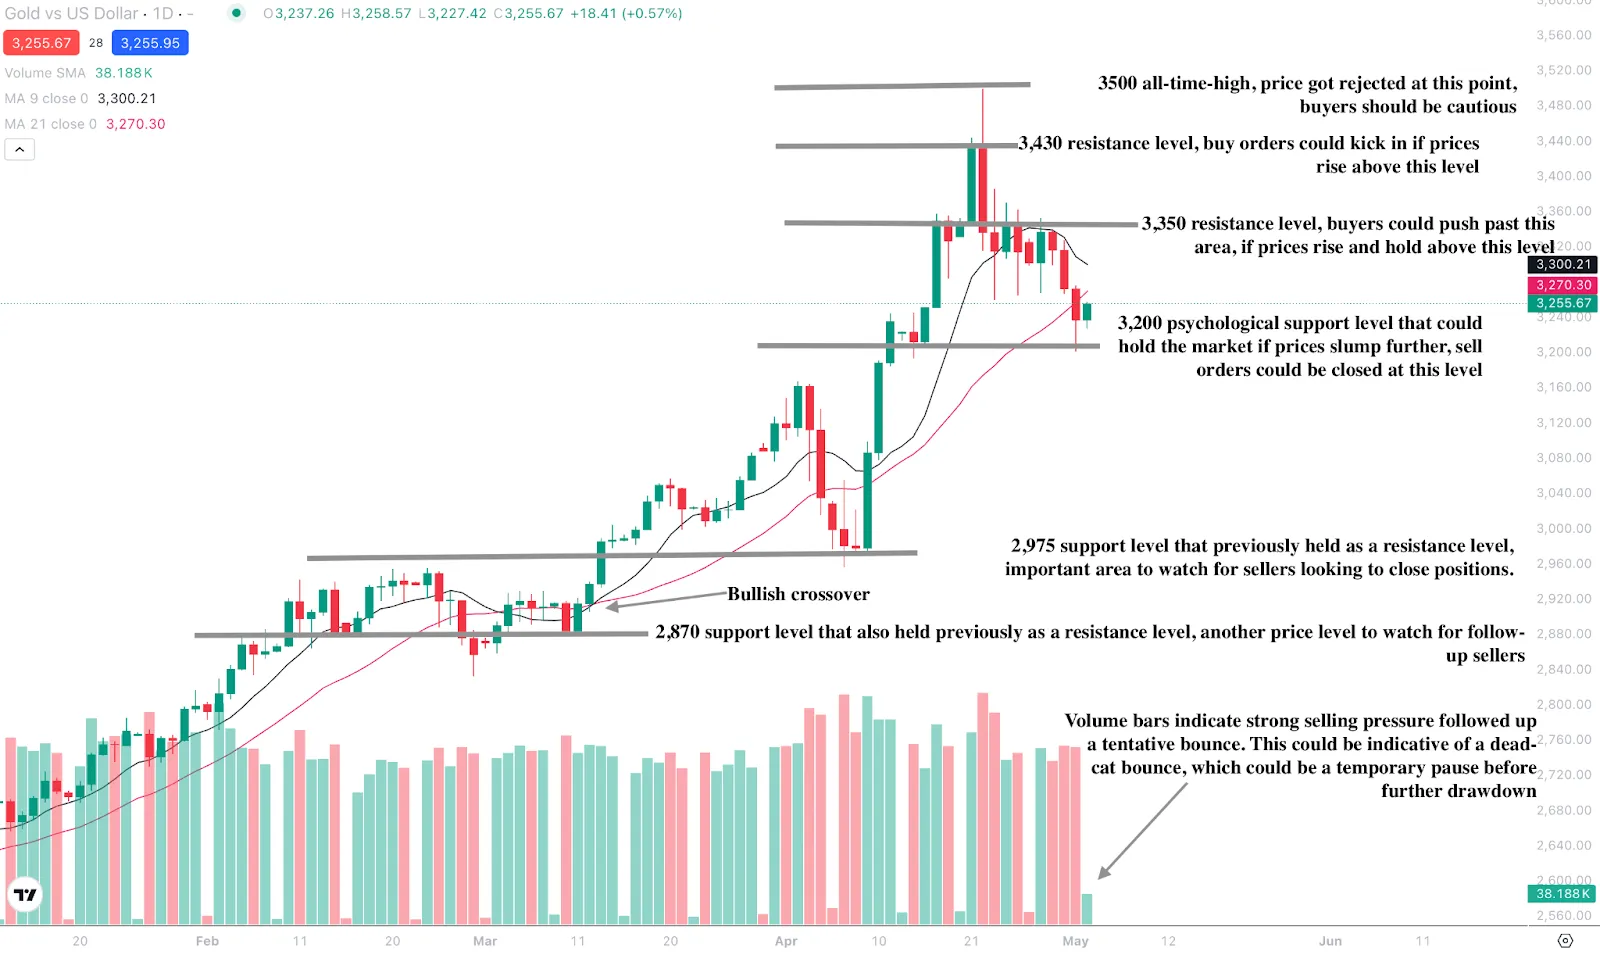
Gold price forecast
At the time of writing, Gold is seeing a slight uptick after heavy sell pressure. A previous bullish crossover painted a picture of prices within a major uptrend. At the same time, the volume bars indicate a potential dead cat bounce, where we see some follow-up sells. Should prices see further upmoves, we could see resistance at the $3,350, $3,430, and $3,500 resistance levels. Should prices see a slump, prices could find support at the $3,200, $2,975, and $2,870 support levels.
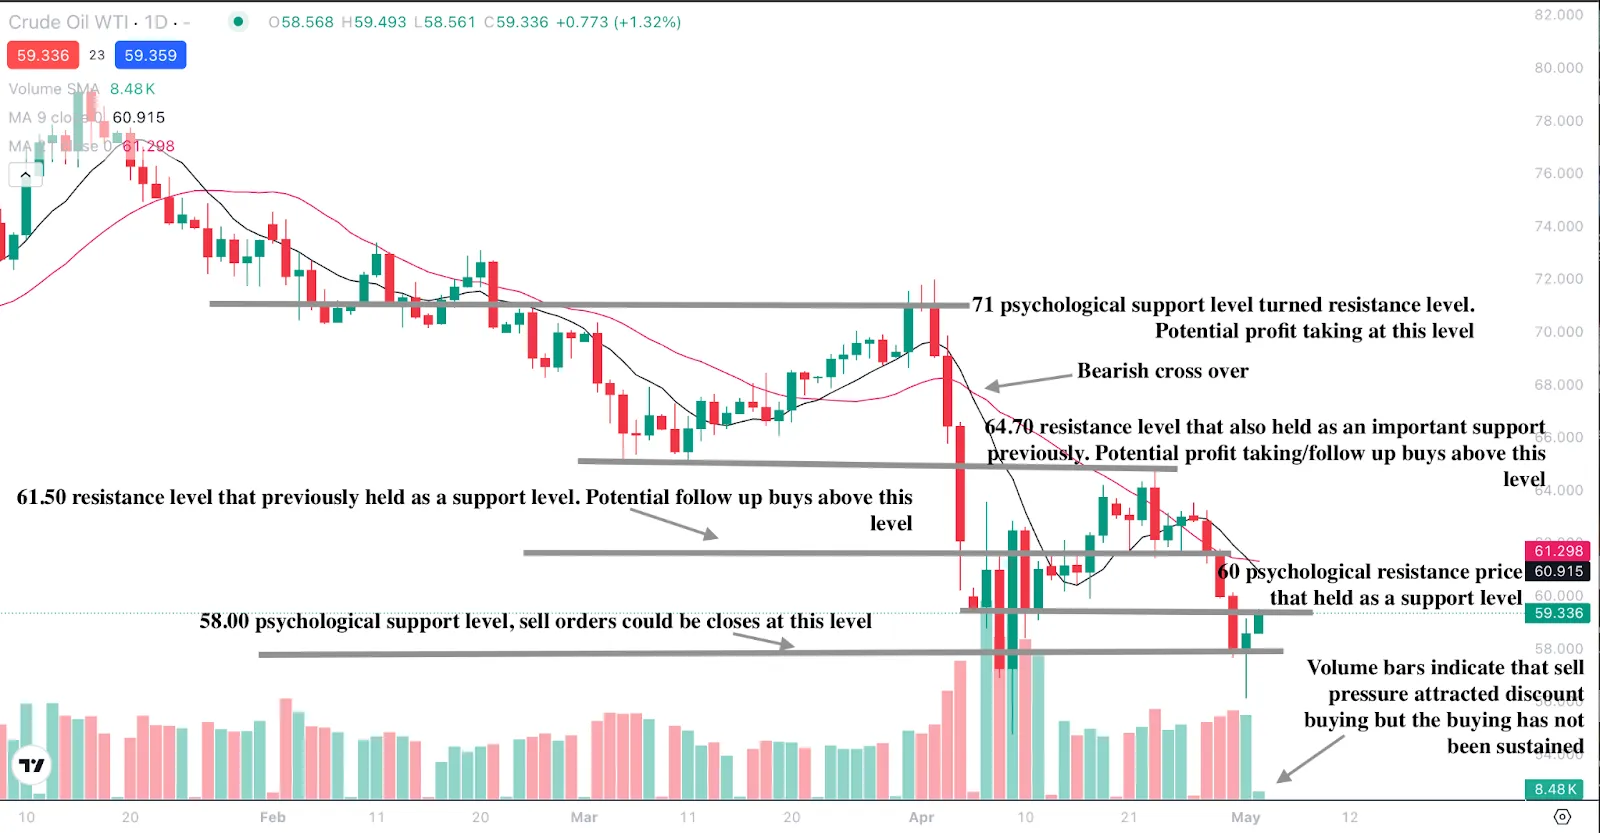
Oil price analysis
Oil prices, on the other hand, are still touching lows of $60. A previous bearish crossover gave indicators that prices were entering a sell zone, and prices are still in that zone. The bearish narrative is supported further by the volume bullish bars declining – which is indicative of buy pressure declining. Should prices slump, the $58 psychological support level will be an important price to watch. If we see a bounce, prices could encounter resistance at the $61.50, $64.70, and $71.00 resistance levels.
Are you watching commodities in these volatile times? You can speculate on Gold and Oil with a Deriv MT5 or Deriv X account.

Is Monero’s price surge a sign of growing privacy needs or market manipulation?
Monero (XMR), crypto’s favourite mystery coin, gave traders a heart attack (or a thrill, depending on their positions) on Monday with a jaw-dropping 50% price surge - rocketing 21% in just one hour.
Monero (XMR), crypto’s favourite mystery coin, gave traders a heart attack (or a thrill, depending on their positions) on Monday with a jaw-dropping 50% price surge - rocketing 21% in just one hour.
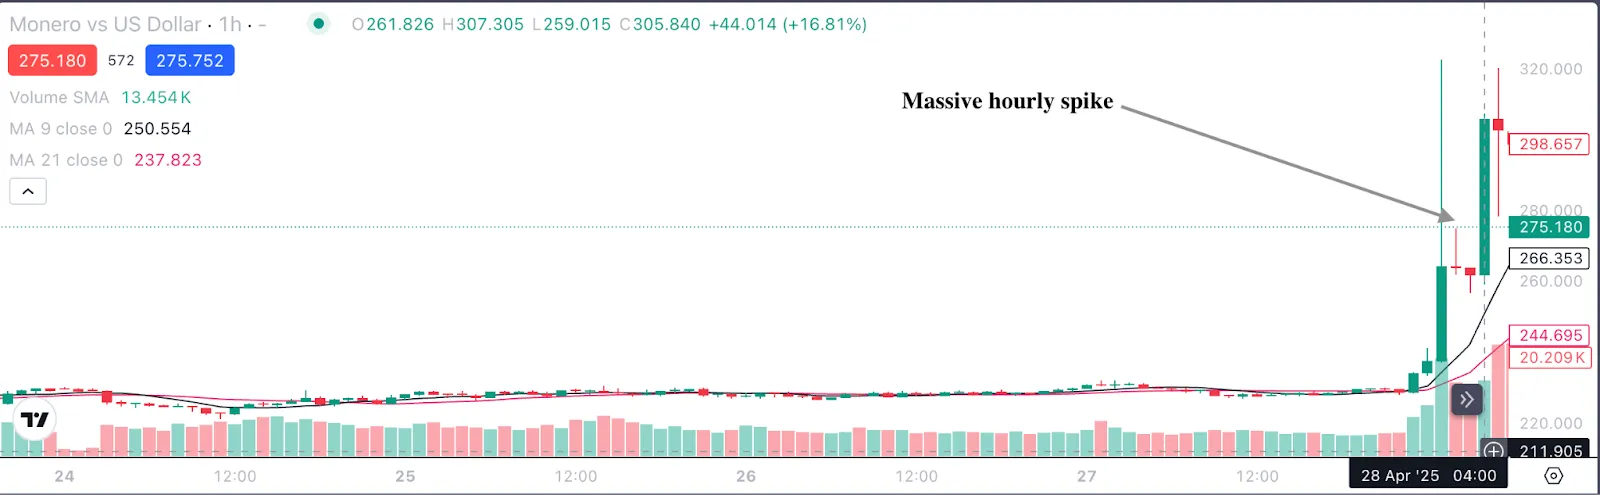
Analysts and traders scrambled to figure out what triggered this sudden crypto drama, but social media was quicker, flooding Twitter with polls, wild theories, and humorous memes. Was it institutional FOMO, everyday investors panicking about privacy, or something shadier?
A Bitcoin heist and some slippery moves
Adding spice to the story, blockchain sleuth ZachXBT dropped a bombshell, revealing a suspicious move involving more than 3,520 Bitcoin (BTC) - about $330.7 million - that ended up converted into Monero through six instant crypto exchanges. Monero’s notorious privacy features made the currency an obvious (though expensive) choice for hackers wanting to cover their digital tracks.
But here’s the funny part: converting that massive chunk of Bitcoin into XMR likely caused major "slippage," which is trader-speak for a not-so-fun scenario where the market moves against you during your transaction. The hackers might have lost as much as $66 million just by choosing Monero over something more liquid. Ouch!
The plot thickens: Derivatives market shenanigans
But wait, there’s more. At the same moment, the futures market went bananas. XMR’s open interest - basically, bets placed by traders on the coin’s future price - exploded to $35.1 million, way higher than expected.
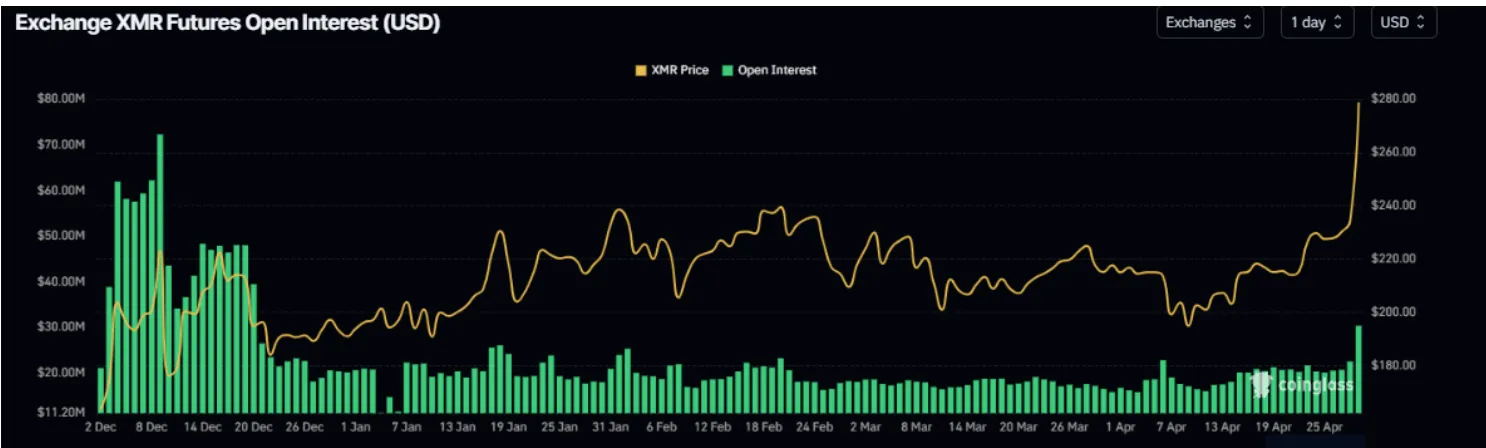
It seems someone already had around $11 million riding on Monero’s sudden pump, raising suspicions that this wasn't spontaneous.
Crypto veterans noted similarities with past exploits, like the infamous Mango Markets hack, where clever (and unethical) traders manipulated prices for profit. Crypto can't resist a good drama.
Privacy coins: Monero vs. Zcash - New crypto trend or risky business?
Despite all the drama, privacy coins like Monero and Zcash (ZEC) are increasingly popular with investors who value anonymity. Monero offers hardcore, mandatory privacy for those who want zero digital footprints, while Zcash offers optional anonymity, appealing to those who prefer flexibility.
Looking ahead, experts are optimistic. Changelly predictions for Monero’s price suggest a potential climb over $500 by 2027 - up a juicy 167% from its current $194 level. Zcash, recovering nicely, could more than triple in value, As per CoinCodex’s Zcash crypto price prediction for 2030, ZEC’s price could vary between $7.26 and $39.38., boosted by fresh upgrades and market optimism.
Monero technical outlook: Ready to jump into privacy coins?
Suppose this rollercoaster has you thinking about joining the privacy crypto bandwagon.
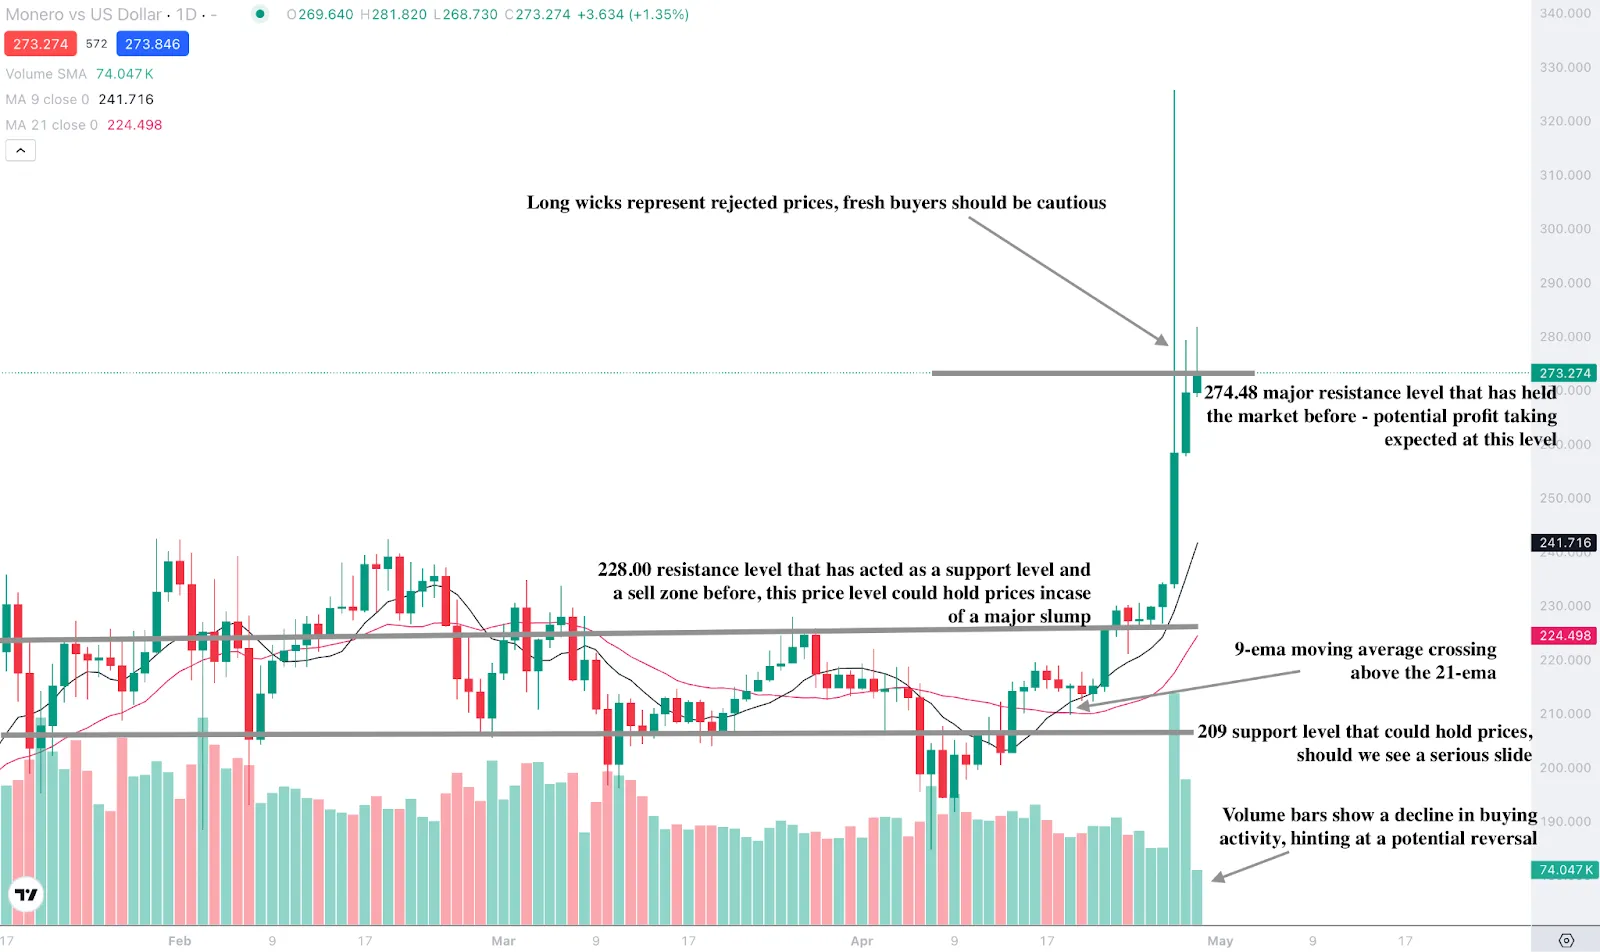
At the time of writing, XMR is holding at a critical resistance level of $274.48, and the daily chart shows a bullish bias. The 9-ema moving average crossing above the 21-ema moving average adds to the bullish narrative. However, the volume bars contracting indicates that the buying pressure is waning - hinting at a potential reversal.
Do privacy coins poke your interest? You can speculate on XMR/USD pair with a Deriv MT5 or Deriv X account.

Will the Dollar lose the battle against the Yen this week?
Buckle up, traders! The Dollar and Yen are set to battle it out in a pivotal week that could set the tone for months ahead.
Buckle up, traders! The Dollar and Yen are set to battle it out in a pivotal week that could set the tone for months ahead.
Imagine a high-stakes boxing match: in one corner, the US Dollar hovers around the shaky 99.33 level, tangled in tariff drama, trade policy confusion, and surging inflation worries. In the opposite corner, the Japanese Yen is cautiously optimistic, balancing hopes of trade agreements with a watchful eye on central bank moves.
Let's examine each currency's strengths and weaknesses and consider the factors likely to influence this showdown.
Round 1: Dollar’s growing tariff and inflation woes
The US Dollar started this crucial week on the back foot. Despite optimistic claims from US officials about "daily conversations" with China and other Asian trade partners, China quickly contradicted these assertions, flatly denying any ongoing negotiations.
This confusion has led analysts, including those from Standard Chartered, to warn that expectations for reduced global tariffs under the current US administration might be overly optimistic. They point to the sidelined World Trade Organisation and stalled free trade agreements.
Adding tangible pressure, popular Chinese e-commerce sites Temu and Shein have dramatically increased their prices - by as much as 300% for US consumers - highlighting the immediate and personal costs of unresolved tariff disputes.
Traders are closely watching key economic data releases this week, including US GDP figures and April’s Nonfarm Payrolls, to gauge the Federal Reserve’s next moves amid soaring inflation expectations.
Round 2: Yen’s delicate balance: BOJ policy impact on Yen
In contrast, the Japanese Yen enters this week with cautious movements, influenced by mixed market signals. While easing tensions between the US and China weakened safe-haven demand, geopolitical risks, including North Korea’s involvement in the Russia-Ukraine conflict, help maintain the Yen’s appeal as a safer asset.
This week's pivotal event for the Yen is Thursday’s Bank of Japan (BoJ) policy meeting. Although the BoJ is expected to keep interest rates unchanged, ongoing inflation pressures in Japan could pave the way for future rate hikes.
Additionally, expectations of a potential US-Japan trade deal might support the Yen. Yet traders remain wary, waiting for clearer signals from BoJ Governor Kazuo Ueda on Japan’s economic outlook and inflation trajectory.
Round 3: US Inflation expectations - impact on the dollar
Adding complexity to this currency clash is the intensifying problem of US inflation. Recent surveys by the University of Michigan have shown sharp increases in long-term inflation expectations, contradicting earlier reassurances by Fed Chair Jay Powell that these were temporary anomalies.
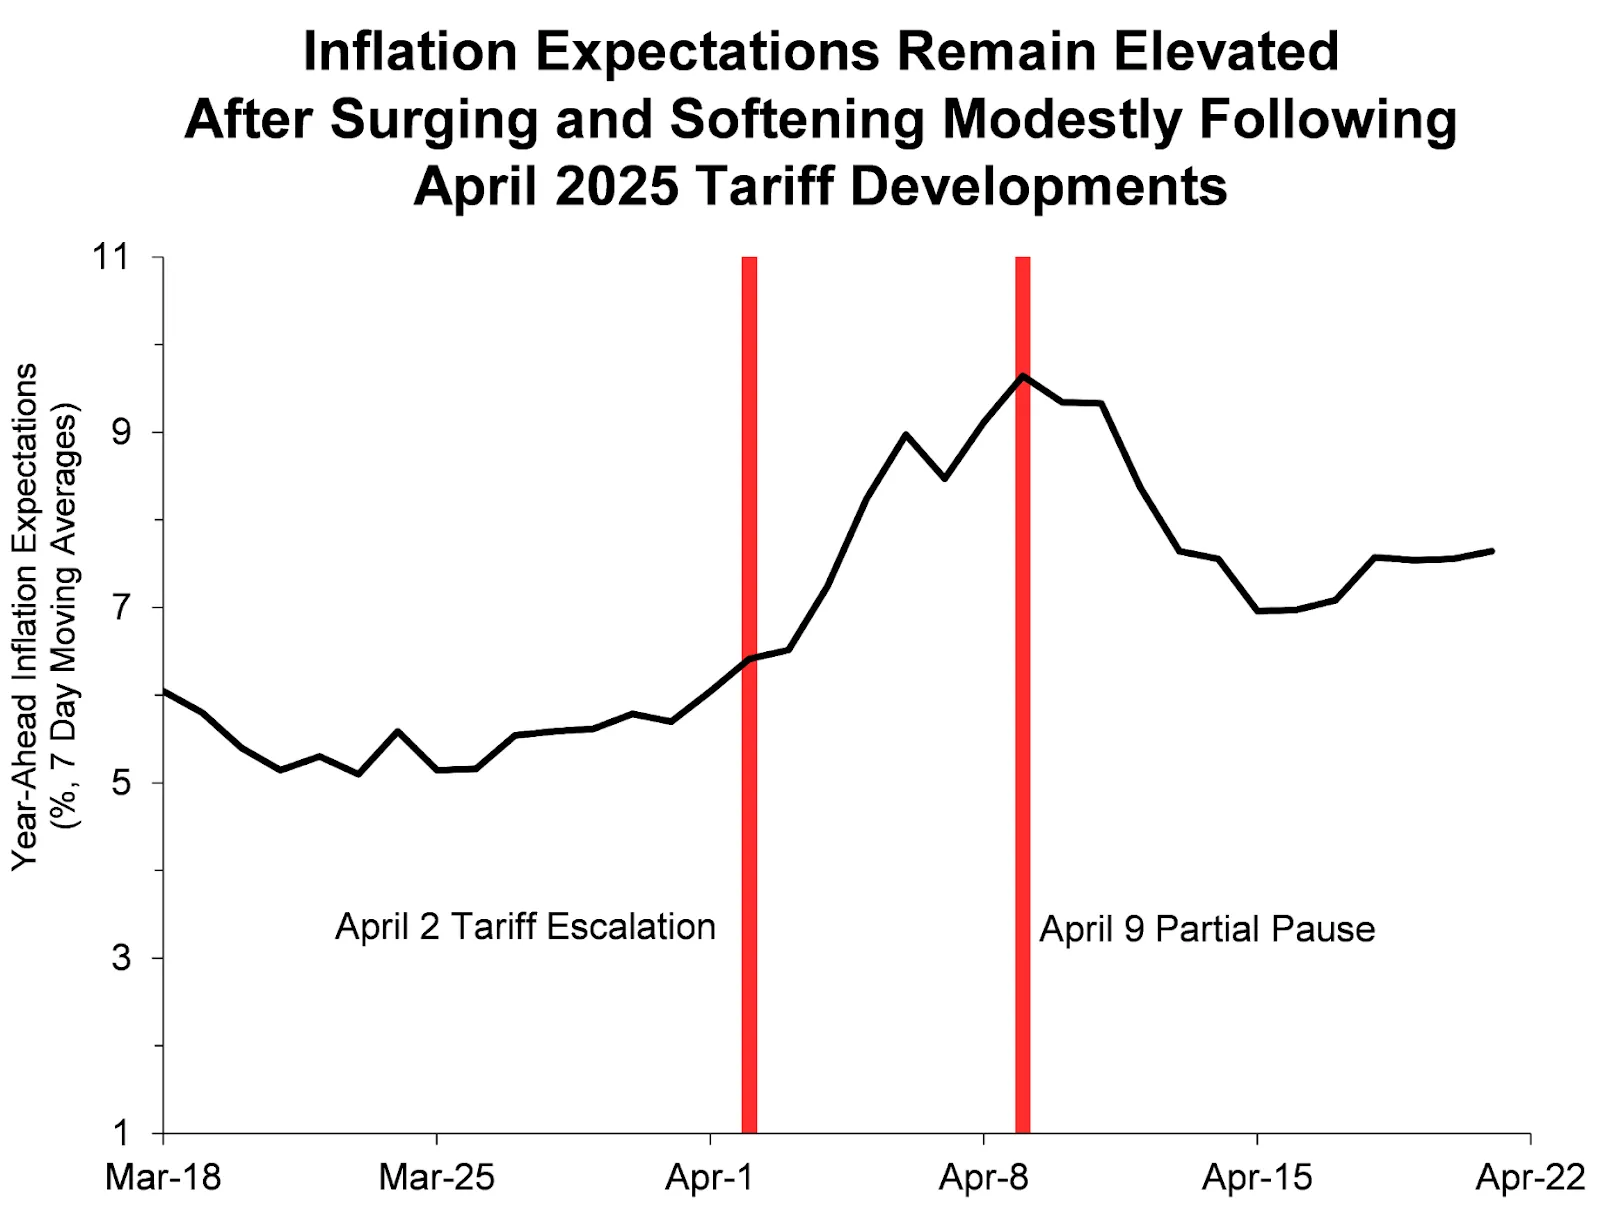
Commerzbank’s Head of FX and Commodity Research, Ulrich Leuchtmann, emphasises that rising inflation expectations put the Fed in a precarious position: either tackle inflation aggressively and risk unemployment spikes or delay intervention and risk runaway inflation.
Fed Governor Christopher Waller’s recent suggestion of possible rate cuts to counter rising unemployment from tariff-induced economic stress faces stiff challenges if inflation expectations remain elevated. This conflict leaves the Fed - and consequently, the Dollar -in a precarious position.
Currency pair technical analysis: Which currency emerges victorious?
Both currencies are navigating treacherous paths this week, with significant implications for investors and traders worldwide. The Dollar faces daunting challenges from trade policy uncertainty, rising consumer costs, and inflation pressures, while the Yen must carefully navigate geopolitical complexities and cautious economic policy.
By the end of this critical week, we'll see clearly which currency withstands these tests better. Will the Dollar rebound, or will the Yen’s cautious strategy pay off?
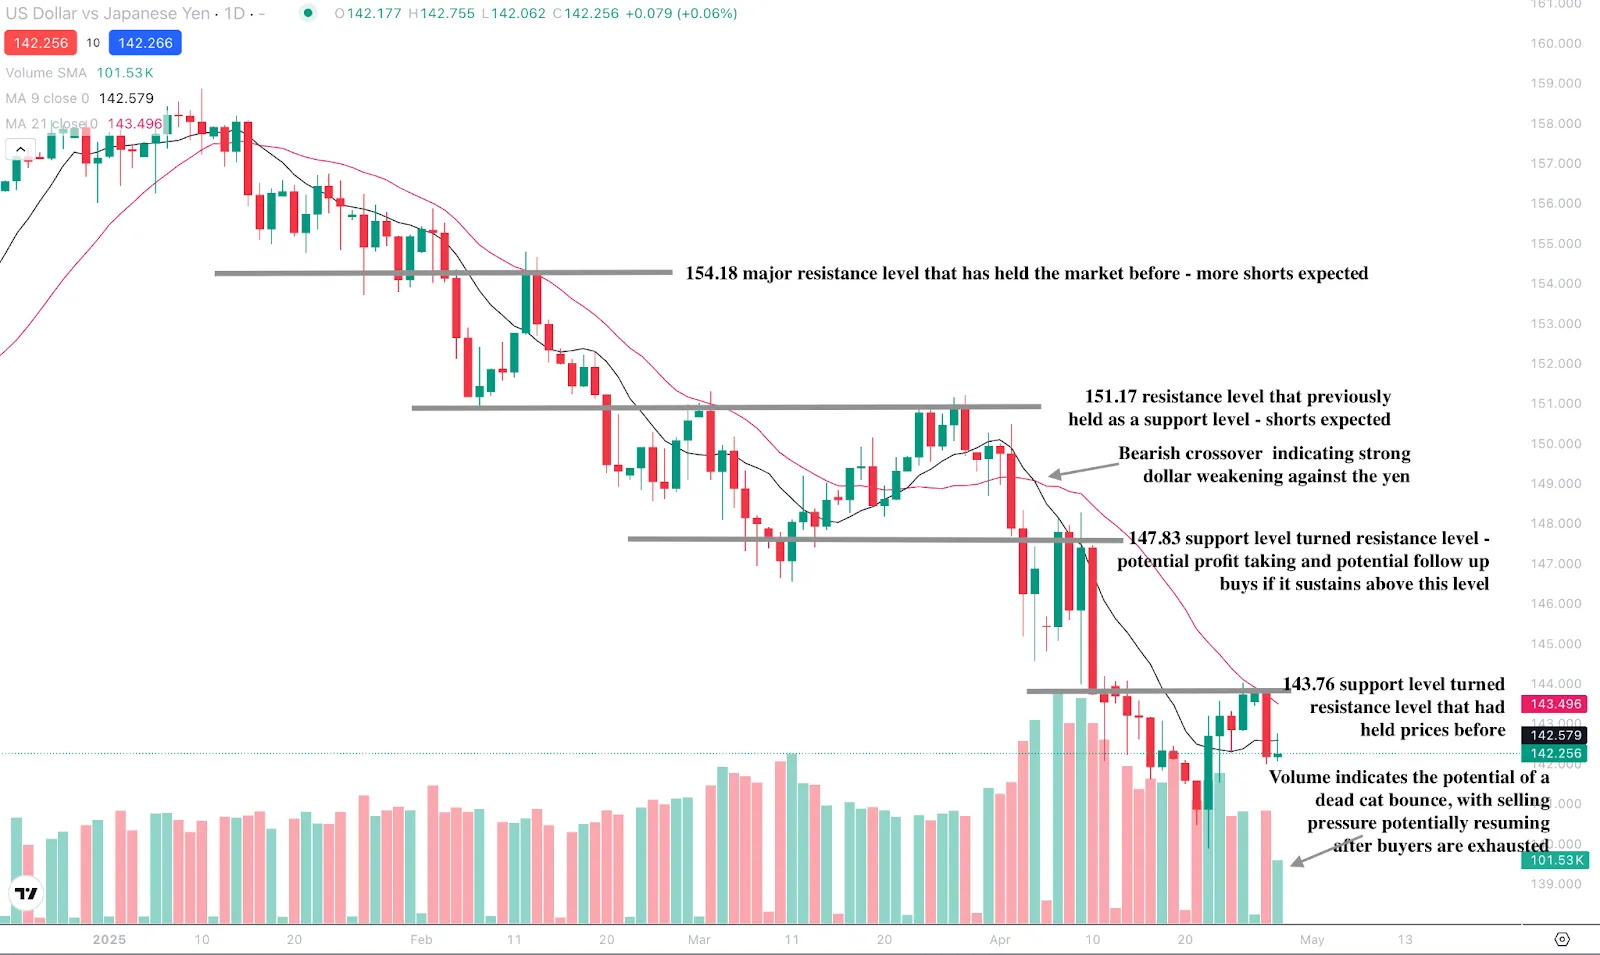
At the time of writing, the dollar shows some strength after a steep slide against the yen. A recent bearish crossover suggests that more dollar weakness could be in the offing, and the pair could resume the downward trajectory. The volume bars also show that a dead cat bounce situation could be seen if the dollar succumbs to sell-side pressure. Key levels to watch should the dollar bounce back should be the $143.76, $147.83, $151.17, and the $154.18 resistance levels.
Are you looking forward to this week’s crucial data? You can speculate on USD/JPY pair with a Deriv MT5 or Deriv X account.

Is Bitcoin quietly starting a new bull market?
Bitcoin is stirring. There's no screaming headline, no viral frenzy - but savvy traders sense the shift.
Bitcoin is stirring. There's no screaming headline, no viral frenzy - but savvy traders sense the shift. Amid geopolitical tensions and economic uncertainty, Bitcoin is quietly but decisively flipping the script.
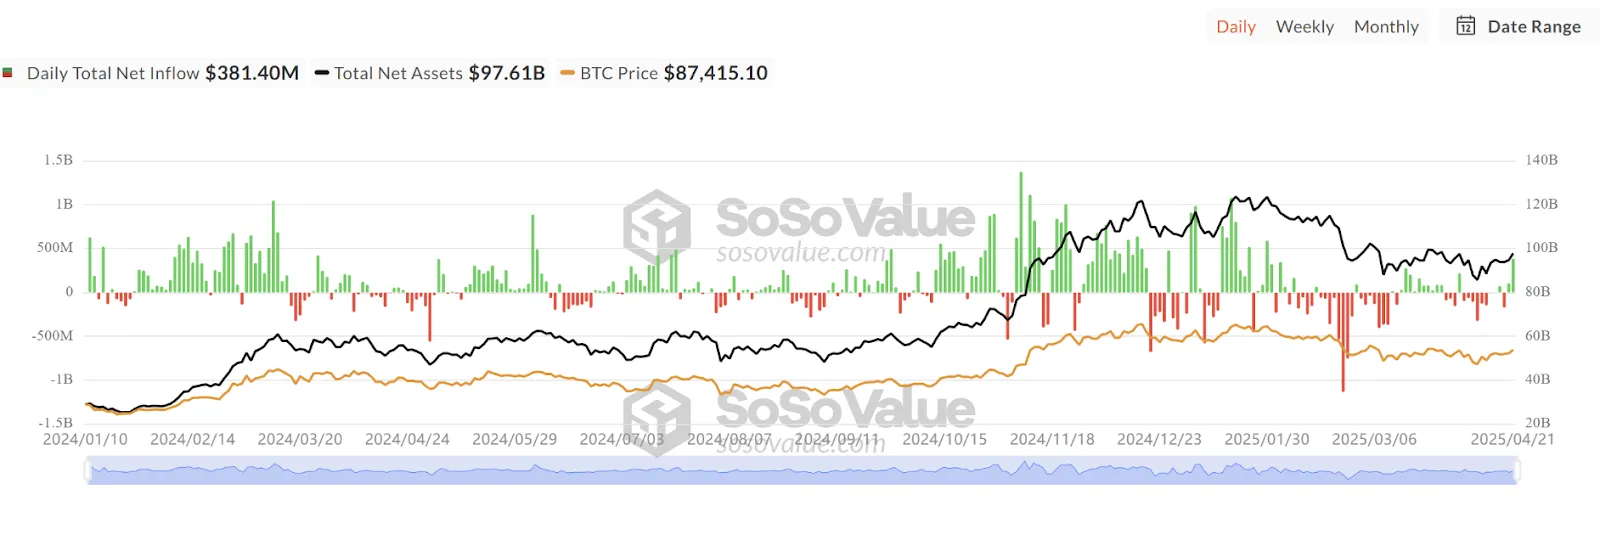
On 22 April, Bitcoin burst past $91,000, snapping a stubborn downward trend for the first time this year. The spark? President Trump’s surprising hint at softer tariffs against China injected fresh optimism into the markets. But just as quickly as hope surged, China doused expectations, publicly denying any tariff negotiations and sending uncertainty rippling back through markets.
Bitcoin’s Institutional investors step up - retail Investors wait
Despite the macroeconomic confusion, institutional investors have boldly returned to the market. US Bitcoin ETFs recorded an impressive $381 million inflows, the highest levels since January, signaling robust institutional backing and confidence in Bitcoin's longer-term outlook.
In contrast, retail investors remain cautious, notably absent from recent market moves. Historical data suggests retail typically arrives after sustained momentum, meaning their current hesitance leaves Bitcoin more dependent on leveraged traders and speculative futures markets - introducing a heightened risk of volatility.
Bitcoin price resistance: Quiet bullish signals beneath the surface
Bitcoin faces critical resistance around $94,000, where bullish momentum has notably slowed. Recent market activity reflects substantial profit-taking, evidenced by nearly 90,998 BTC in spot market outflows, while outflows stood at $56,981 BTC.
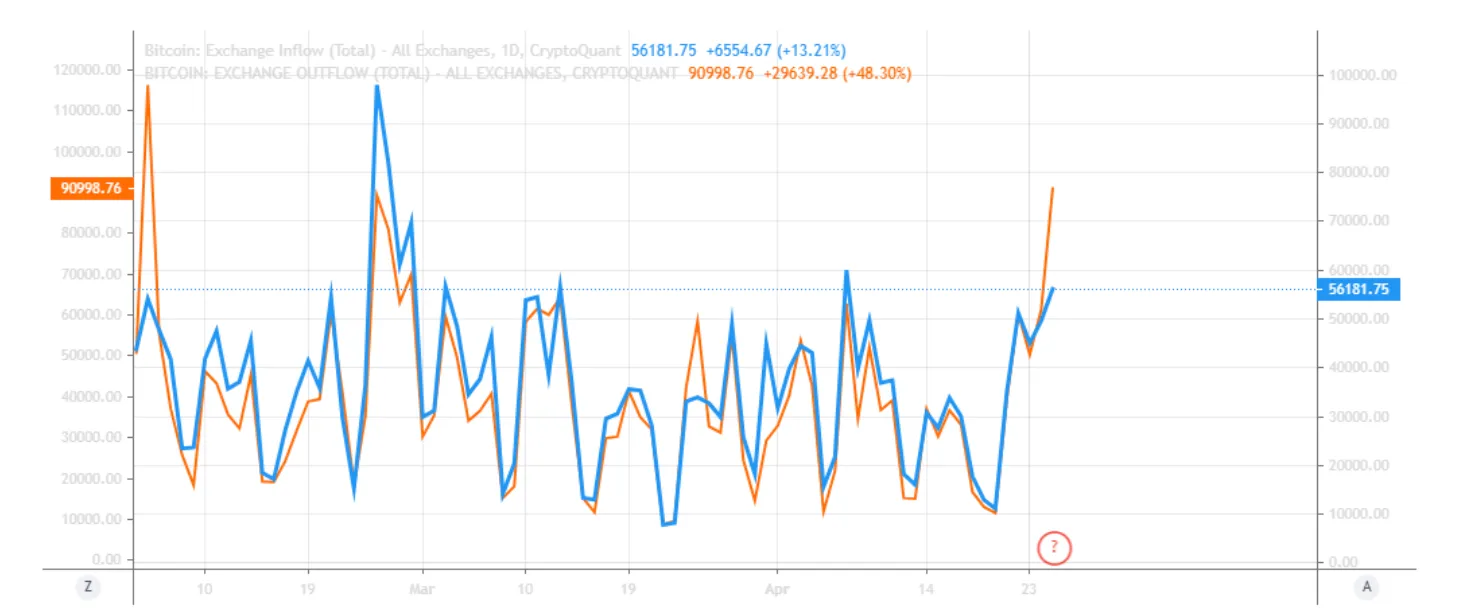
Despite this, underlying data from exchanges reveals an important bullish indicator: significantly more Bitcoin is leaving exchanges than entering. High outflows typically signal that investors - particularly large-scale holders and whales - are accumulating and withdrawing to long-term holdings.
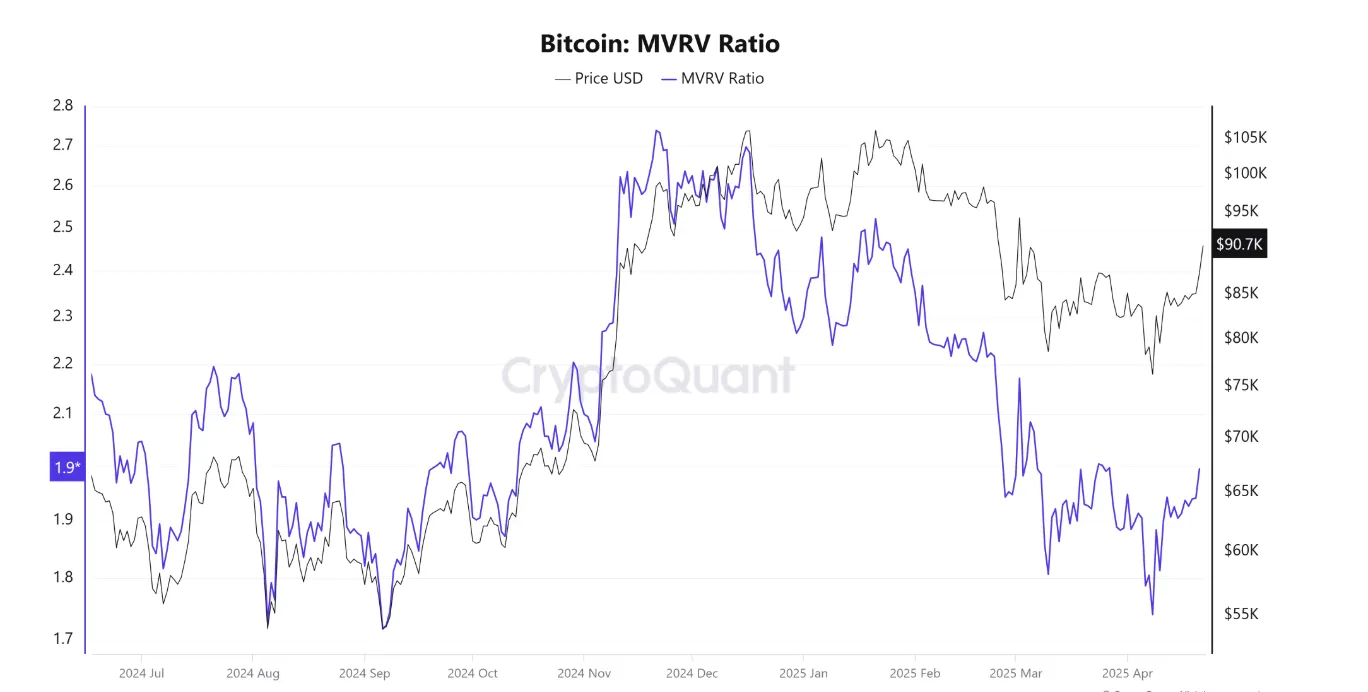
Additionally, Bitcoin’s market-value-to-realized-value (MVRV) metric recently approached a key level of 2, historically associated with intense bullish phases. Reclaiming this level could further solidify confidence in a sustained uptrend.
ETH’s quiet moves: Ethereum zkVM upgrade
While Bitcoin commands the most attention, Ethereum has quietly announced a promising scalability upgrade through its co-founder, Vitalik Buterin. The transition toward a highly efficient zkVM system promises substantial efficiency improvements, potentially reshaping Ethereum's scalability narrative. Although less visible amid Bitcoin's drama, Ethereum’s quiet evolution could significantly impact its competitive standing over the long term.
Despite strong institutional backing, Bitcoin’s near-term trajectory remains uncertain and heavily influenced by external factors. The ongoing US-China trade tensions and geopolitical developments continue to pose substantial risks. Additionally, the cryptocurrency faces competition from faster and cheaper blockchains, such as Solana, which occasionally surpass Bitcoin and Ethereum in transaction volumes during peak market activity.
Technical outlook: The quiet before the storm?
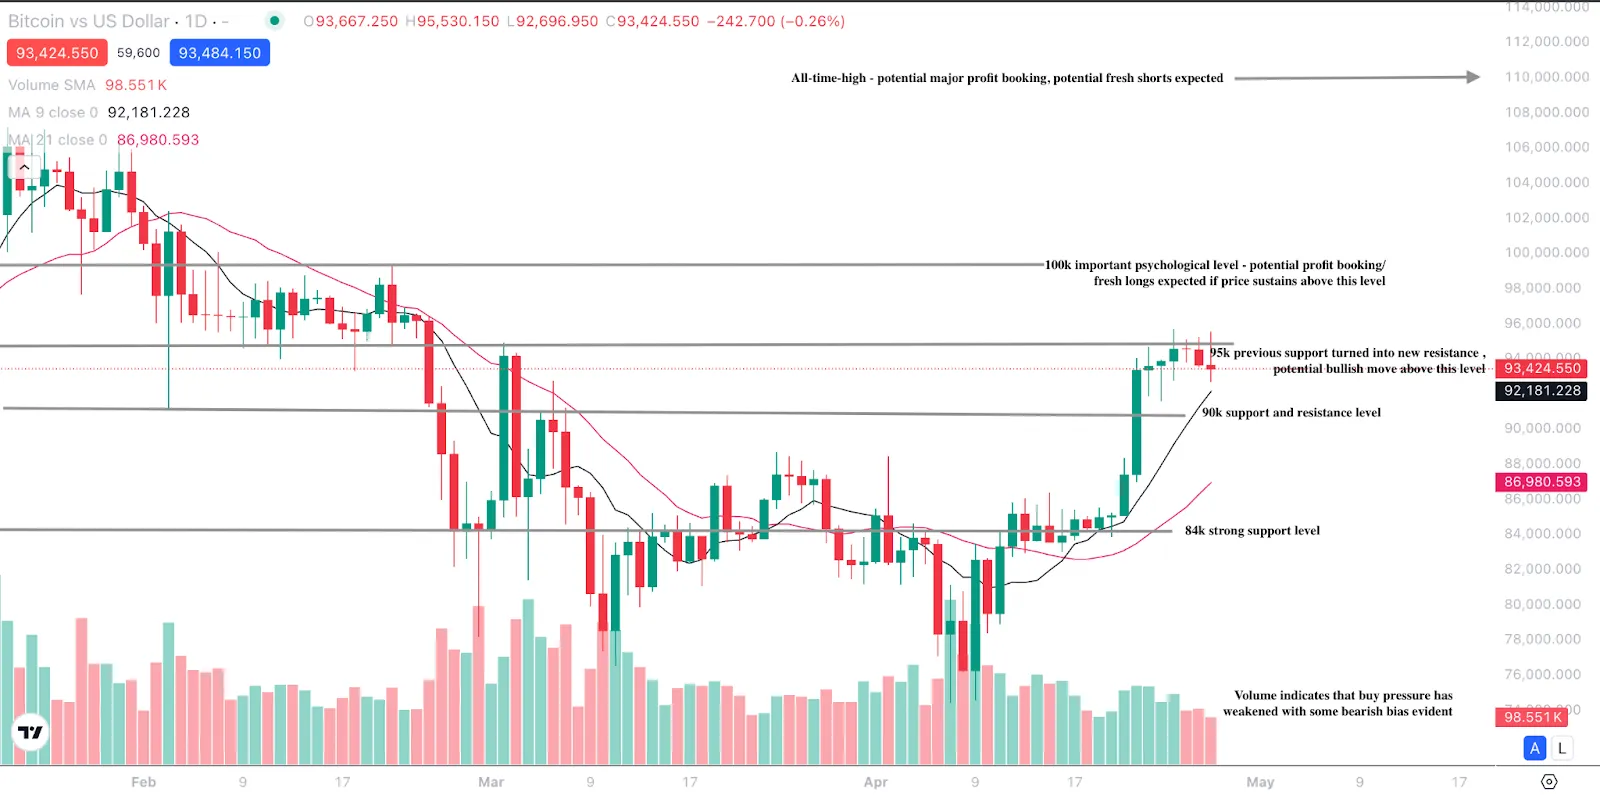
Bitcoin currently sits at a pivotal crossroads, supported by substantial institutional investment but held back by cautious retail sentiment and macroeconomic uncertainties. At the time of writing, BTC is touching highs of $95,000 with bullish bias dominant despite some selling pressure.
Last week’s bullish cross-over indicates that the shorter trend is looking up. The cup and handle formation on the daily chart adds to the bullish narrative. However, volume indicates that buying pressure has significantly weakened after a strong buying streak. Should prices retreat, key psychological support levels to watch are the $90,000 and $84,000 psychological support levels. If we see further upside, bulls could rally to regain the $100,000 and $110,000 mark.
Is a new Bullish leg coming up for Bitcoin? You can speculate on BTC with a Deriv MT5 or Deriv X account.

Did altcoin season just quietly kick-off?
Is altcoin season finally here? ETH jumps 10%, SOL up 20%, and whale activity signals a major market rotation.
There was no massive breakout, no meme coin mania - but the signs are there.
Ethereum is surging, Solana is gaining institutional traction, and the usual altcoin suspects are following suit. It’s not loud. It’s not hyped. But traders are seeing patterns that only show up when the cycle starts turning. A quiet shift is underway - and it’s beginning to look a lot like the early stages of altcoin season.
Ethereum and Solana are at the centre of it, and what happens next could set the tone for the entire altcoin landscape.
Ethereum price outlook: Rally gains some credibility.
Ethereum is not just bouncing - it’s breaking out with purpose. On Tuesday, 22 April, ETH surged more than 10%, with over $127 million in liquidations - the bulk of them short sellers caught on the wrong side of the trade.

This rally comes against a backdrop of supportive macro news. President Trump recently hinted that tariffs on Chinese goods could be reduced, while Treasury Secretary Scott Bessent called the U.S.-China trade dispute “unsustainable.” Those remarks have boosted risk assets broadly, and Ethereum is riding the tailwind.
But this isn’t just a news-driven spike. Ethereum’s fundamentals are flashing green:
- Market cap surged 12% in a day, a signal of growing investor confidence.
- According to IntoTheBlock, new user activity is up 40%, pointing to real adoption, not just recycled capital.
- Resistance levels around $1,860 to $1,895 have recently been tested. A decisive breakout could open the door to $2,000 and beyond.
Crypto analyst Crypto Rover compared Ethereum’s current setup to Bitcoin’s 2020 rally - a bold call, but not entirely without merit. Behind the scenes, Ethereum’s DeFi ecosystem is thriving: TVL hit a record $100 billion last week, reinforcing its role as the financial backbone of Web3.
Ethereum’s market health also looks positive, with IntoTheBlock data showing a high concentration of positive addresses, suggesting that more investors are locking in profits.

According to the data, most Ether holders are profitable, with only about 38.66% of addresses ‘out of the money’ - a sign of market stability and a generally favorable outlook.
The Ethereum effect also lifts ecosystem players. Chainlink (LINK) and Aave (AAVE) saw 10% and 8% spikes - early signs of rotation deeper into blue-chip altcoins.
Solana institutional investment and reclaiming its momentum.
While Ethereum commands the spotlight, Solana (SOL) builds a compelling case. It’s up more than 20% in the past week, now trading above $150. Whale wallets holding 10,000+ SOL have grown by 1.53%, suggesting confidence from larger players.
Perhaps more telling is the explosion in stablecoin activity on the network. Solana now hosts $12.885 billion in stablecoins, with Circle recently minting $250 million in USDC on-chain. That level of liquidity has only one implication: the ecosystem is gaining traction with users and institutions.
And the institutional signs are everywhere:
- Galaxy Digital swapped $100 million worth of ETH for SOL, which speaks volumes.
- A new Solana ETF launched in Canada, giving traditional investors access through regulated vehicles.
This resurgence is underpinned by Solana’s core strengths: low fees, fast settlement, and an increasingly sticky developer community. The Solana Foundation’s report showed a developer retention rate of over 50%, a rare feat in crypto.
And it’s not just the majors gaining attention. New altcoins like JetBolt (JBOLT) - offering zero-gas tech - have already sold 349 million tokens in presale, showing a clear appetite for fresh innovations.
Classic altcoin signals are flashing
Are the boxes getting ticked?
✅ Bitcoin dominance dropping - Check.
✅ Altcoin trading volumes up - Big check.
✅ Ethereum and Solana leading the charge - Check.
✅ Ethereum-based altcoins (like LINK and AAVE) surging - Yep.
✅ Social sentiment shifting to alts - Your timeline probably says it all.
✅ Major development and institutional interest in top altcoin ecosystems - Double check
Want to trade ETH and SOL before the potential altcoin season hits? Deriv MT5 lets you speculate in real-time.
Outlook for Ethereum, Solana, and the Altcoin market
Altcoin seasons often arrive quietly before picking up speed. If Ethereum breaks through $2,000 and Solana continues toward the $200 mark, the narrative could solidify quickly. With whales re-entering, ETF flows increasing, and retail sentiment improving, momentum is building beneath the surface.
What makes this potential alt-season different is the quality of participation. There’s less noise from meme coins and more focus on infrastructure and DeFi growth. Ethereum and Solana aren’t just rising - they’re pulling their ecosystems up with them. Chainlink, Aave, JetBolt, and other altcoins are riding those coattails, and more could follow.
No one can time a cycle perfectly. But if you’re waiting for a flashing green sign that alt-season has arrived, consider this your signal to start paying attention.
At press time, ETH is taking a breather after a notable uptick that saw it test the $1,800 and $1,830 price levels. Prices remain below the moving average, hinting that the larger trend is still down despite recent upward pressure. The RSI, which is almost flat at the midline, paints a picture of slowing momentum. If we see a further slide, prices could be held at the $1,723 and $1,588 support levels, while an uptick could see prices encounter a resistance wall at $1,835.

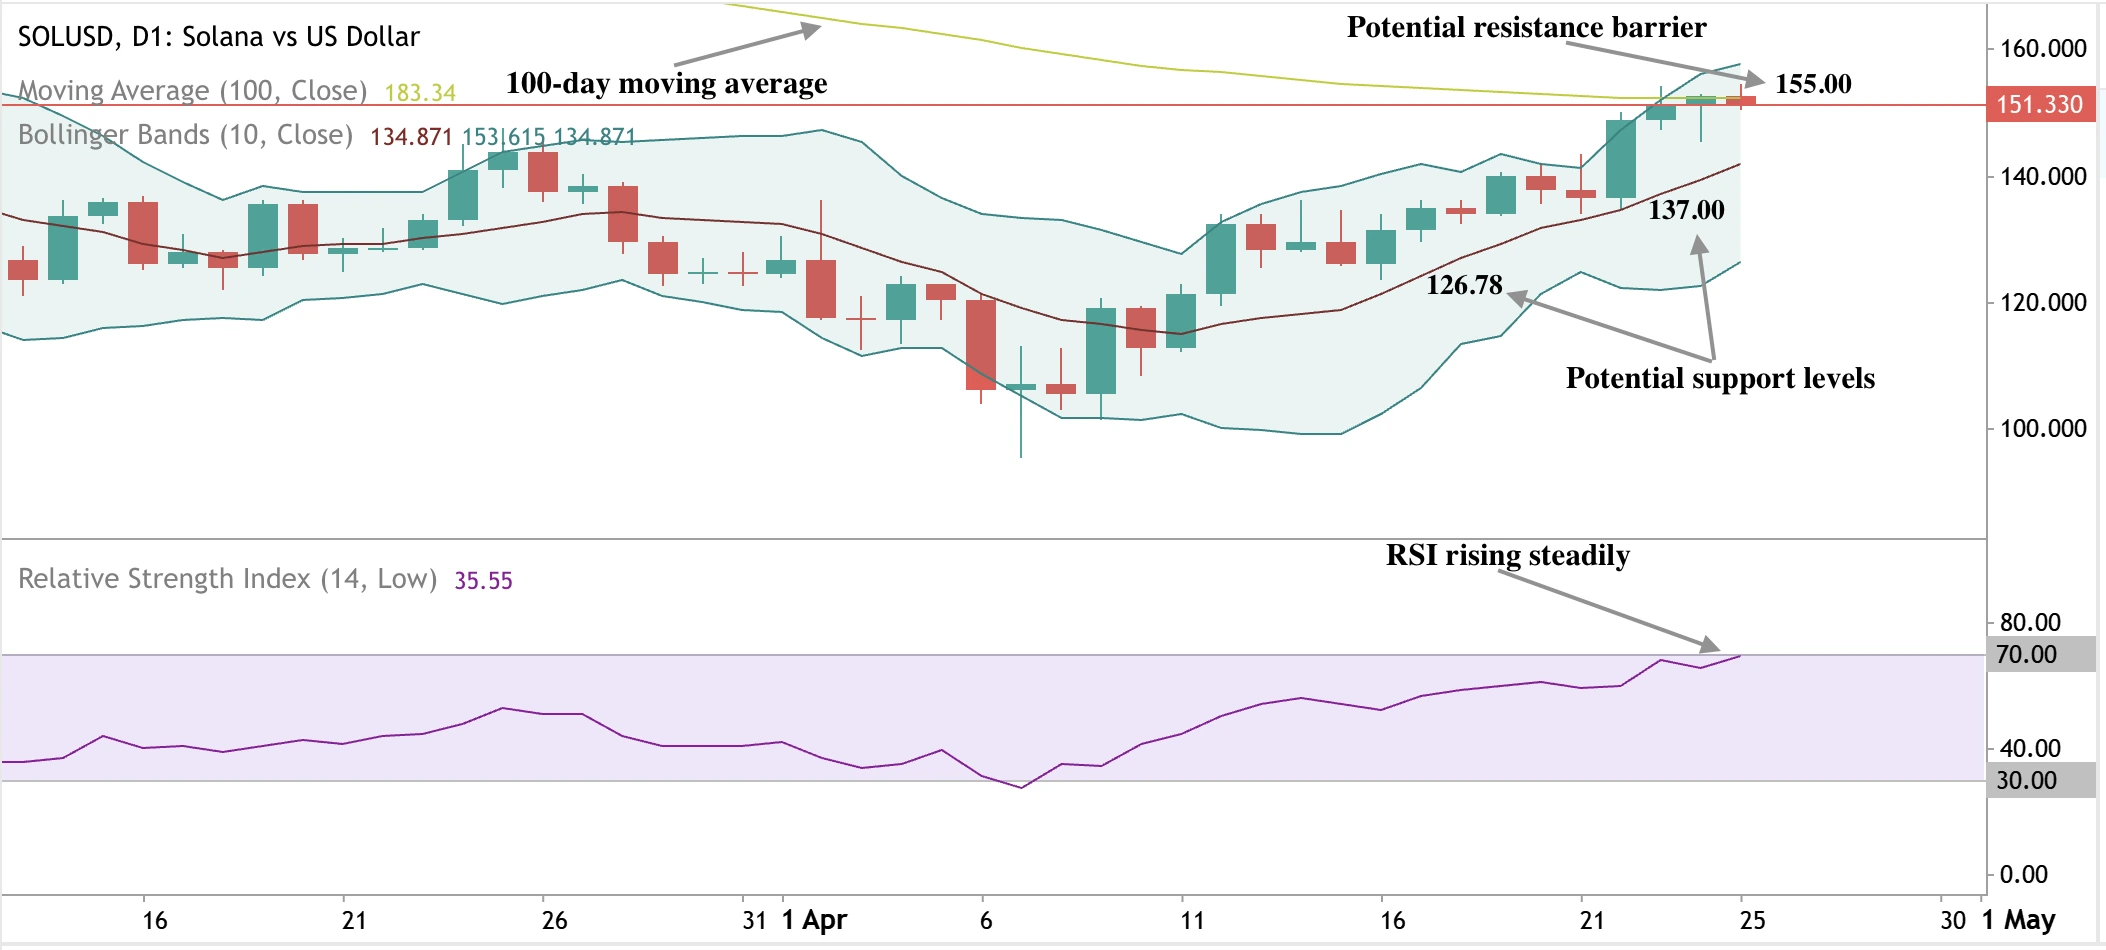
SOL is also catching a breather from its recent rally after price touched the upper boundary of the Bollinger band, hinting at bearish conditions. However, the price also exceeds the moving average, indicating that the overall trend could be switching from down to up. RSI is also pointing up sharply, adding to the upward narrative.
Should we see a further uptick, prices could encounter resistance at the $155.00 resistance level, while a further slump could be held at the $137.00 and $126.78 price levels.
Are you excited about potential altcoin volatility? You can speculate on ETH and SOL with a Deriv MT5 or Deriv X account.

Nvidia and Intel are fighting very different chip wars
The AI chip competition sees Nvidia sprinting while Intel rebuilds. Our semiconductor stock forecast reveals trading opportunities amid tech disruption.
Nvidia is riding momentum. Intel is laying off 20% of its workforce. This isn’t an earnings week - it’s a test of who still matters in the chip war.
As Nvidia rockets toward AI domination with soaring stock and silicon supremacy, Intel is cutting deep to survive. It’s no longer about who leads in chips. It’s about who adapts fast enough to matter in a market that punishes hesitation and rewards reinvention.
This April, two chip giants - one riding momentum, the other undergoing triage - are giving investors and traders a front-row seat to how the semiconductor war is being fought. With Q1 earnings about to drop, we’ll see who’s built for what comes next.
Nvidia: Momentum meets macro risk
Nvidia isn’t just winning - it’s winning fast. The stock surged past $104 this week, gaining 5.2% in premarket trading after a 2% rise the day before. A strong rebound, especially after falling below the psychologically critical $100 level on Monday.
The spark?
President Trump’s announcement that the U.S. would “substantially” lower 145% tariffs on Chinese imports. While Nvidia’s chips are largely produced in Taiwan, fears of retaliatory levies have clouded the sector. The rollback relieved Nvidia and the entire AI ecosystem, which depends on stable supply chains.
Still, storm clouds remain. According to BofA Securities, the Biden-era AI Diffusion Rule will take effect on 15 May and could impact up to 10% of Nvidia’s revenue and 11% of earnings per share. Nvidia is also preparing for a $5.5 billion charge related to export license delays for its powerful H20 chips this quarter.
Yet analysts remain bullish. Barclays and Bank of America cut their price targets ($155 and $150, respectively) but still see an upside of 50% or more from current levels. Nvidia’s strategic pivot to U.S.-based production, with major builds in Arizona and Texas, is being framed as a long-term hedge against geopolitical instability - and a national branding move as the U.S. races to reclaim chip dominance.
Intel restructuring news: Cutting deep to rebuild
Intel’s story is far messier and, potentially, more meaningful.
Intel is now in deep transformation mode after falling behind in AI, lagging in advanced chip manufacturing, and ceding mindshare to Nvidia. New CEO Lip-Bu Tan oversees a massive overhaul, slashing 20% of the workforce just a year after a 15,000-job cut.
The message? This is not a routine trim. It’s a systemic reset.
Intel has also postponed construction of its Ohio fab and recently sold a majority stake in its programmable chip unit, Altera, to Silver Lake for $4.46 billion - a move aimed at strengthening the balance sheet ahead of a brutal transition phase.
Intel’s Q1 earnings, due Thursday after market close, are expected to reflect that pain: analysts forecast $0.01 EPS on $12.3 billion in revenue. However, Wall Street will focus less on numbers and more on signals of clarity and control from the new leadership.
The stock rose 3.56% to $19.51 on restructuring news. And while hedge fund activity remains split, there’s interest:
- Morgan Stanley added 59M shares in Q4 (+128%)
- Jane Street added 27M (+447%)
- Meanwhile, Capital Research and Bank of America dumped tens of millions in stock
On Capitol Hill, Intel has quietly become a bipartisan favorite. Congressional trading disclosures show that 14 of 16 recent trades were purchases, with representatives like Robert Bresnahan and Marjorie Taylor Greene consistently buying over the past six months.
A chip season that could reshape the sector
What makes this earnings season different is the context. It’s not just about beating estimates - it’s about navigating:
- Tariff turbulence
- AI monetisation uncertainty
- Supply chain realignment
- New Chinese competitors (Huawei’s 910C AI chip, for example, now rivals Nvidia’s H100 in capability)
Other players like AMD, Qualcomm, and Huawei are in the mix, but Nvidia and Intel are telling the clearest story this quarter.
Nvidia is betting on scale, speed, and relentless innovation. Intel is betting on humility, hard pivots, and time.

Want to trade Nvidia and Intel before earnings hit? Deriv MT5 lets you speculate in real-time.
Looking ahead: Semiconductor stock forecast
Will Nvidia’s pace eventually outstrip demand and trigger oversupply? Will Intel’s streamlining restore its innovative edge? Those questions won’t be fully answered this quarter - but the seeds of the next five years are being planted.
This isn’t just about quarters’ results.
It’s about who shapes the AI era and who scrambles to stay in it.
At the time of writing, Nvidia trades around the $102.57 mark, with beamish pressure apparent on the daily chart. A recent “death cross” where the 200 SMA crossed above the 50 SMA adds to the bearish narrative. However, the rising RSI around the midline hints at upward pressure building. Should we see a slide, prices could be held at the $96.40 and $92.45 support levels. Should we see a bounce, prices could encounter a resistance wall at the $114.70 price level.

On the other hand, Intel stock is trading at around $20.56, with bearish pressure evident as prices remain below the moving average. However, the rising RSI around the midline hints at upward pressure building. Should we see a slide, prices could be held at the $19.00 and $18.00 support levels. If prices bounce, they could encounter resistance hurdles at the $21.60 $24.00 price levels.
Are you excited about the tech earnings season? You can speculate on Nvidia and Intel stock prices with a Deriv MT5 or Deriv X account.

Alphabet and Microsoft face AI-driven earnings test
Tech giants earnings 2025: Will Alphabet's Wiz acquisition and Microsoft quantum computing reshape AI investments? Key insights for traders.
This month, two giants of the so-called "Magnificent Seven," Alphabet and Microsoft, are preparing to report earnings that could shape the future of tech investing in 2025. With billions of dollars at stake, investors and traders are eager to see how these tech leaders navigate high-stakes AI investments, looming tariffs, and evolving market dynamics.
Alphabet's AI ambitions meet tariff turbulence
Alphabet-Google and YouTube’s parent company - will kick things off with its first-quarter earnings announcement on 24 April. Goldman Sachs, bullishly holding nearly $9 billion in Alphabet stock (47.3 million shares), clearly expects big returns from Alphabet’s aggressive AI-focused strategy.
Alphabet recently made headlines with its $32 billion acquisition of cybersecurity leader Wiz, signaling a bold move to dominate cloud and cybersecurity markets. Wiz’s standout feature? Its compatibility with rival platforms AWS and Azure places Alphabet right at the heart of the multi-cloud landscape.
However, Alphabet isn’t immune to turbulence. Increased competition from Amazon’s strategic ad partnerships with Pinterest and Snapchat, especially in appealing to younger audiences, could challenge Alphabet's advertising dominance. Additionally, the company faces growing antitrust scrutiny and potential budget tightening triggered by President Trump’s proposed tariffs. Although tariffs don't directly impact software, broader economic uncertainty could cause companies to reduce spending on Alphabet’s premium AI and cloud solutions.
Analysts remain optimistic about Alphabet’s performance as the earnings call date approaches.
Analysts project:
- EPS: $2.03 (up from $1.89 last year)
- Revenue: $89.2 billion (up from $80.5 billion last year)
Still, caution prevails. Citi recently lowered its price target from $229 to $195 due to concerns about ad market volatility.
Microsoft quantum computing hype and the OpenAI question
Meanwhile, Microsoft shareholders experienced a recent rollercoaster ride, with the stock falling sharply by over 8.6% after OpenAI’s unexpected $3 billion acquisition of Windsurf, a premier AI coding assistant. With Microsoft's earnings scheduled for April 30, investors are understandably nervous, wondering if OpenAI - once Microsoft's closest AI ally - might be evolving into a competitor.
Interestingly, Microsoft's partnership with OpenAI previously propelled its stock upward. Now, investors worry about resource allocation after OpenAI's massive $40 billion funding round, and they are concerned future acquisitions could divert resources from Microsoft’s AI advancements.
Yet analysts like Mizuho’s Gregg Moskowitz remain confident, setting a robust $475 target and highlighting Azure’s reliability as a recession-resistant growth engine. Microsoft 365 further reinforces this stability with consistently strong revenue.
Quantum computing, Wall Street’s hottest new topic, adds another fascinating dimension. Quantum spending has been growing steadily over the years and is expected to stay on that trajectory in the foreseeable future. Fifty - 60 percent of the spending is expected to come from the public sector, 35 - 50 percent from the corporate sector, and the rest from supply chain spending.

Microsoft has made headlines with its revolutionary Majorana 1 quantum chip, developed using the world’s first "top conductor." While quantum computing remains an emerging technology, the market potential is enormous, with estimates reaching between $90 billion and $170 billion by 2040. Microsoft is strategically positioned to capture this lucrative market with its substantial cloud infrastructure.
Technical outlook: The bottom line
The upcoming earnings calls from Alphabet and Microsoft will be pivotal. They will clarify AI strategies, quantum computing potential, and how each company plans to tackle economic uncertainties. Investors now face a crucial decision: jump in early, banking on potential upside, or await further clarity from executive insights.
Whichever approach investors choose, one thing is clear: Tech earnings season is shaping up to be exciting - and potentially lucrative - for those paying close attention.
At the time of writing, Google stock is hovering around the $153.86 mark. Prices remain below the moving average, indicating that the trend is still downwards. However, RSI rising steadily indicates that some upside pressure is building. Should the downward trend continue, prices could find support around the $149.18 and $146.34 support levels.

Microsoft stock has also seen some downward movement over the past few days. The RSI pointing up suggests that some upward pressure is building. However, we recently saw a “death cross,” a tell-tale sign of a bearish trend. This is when the 200 SMA crosses over the 50 SMA.
If the slump continues, prices could find a support floor at the $356.53 support level. Prices could find resistance barriers at the $380.00 and $395.00 resistance levels if we see a significant bounce.

Excited about earnings season? You can speculate on Alphabet and Microsoft stock prices with a Deriv MT5 or Deriv X account.

Gold price all-time-high as crypto eyes opportunity
Markets hate uncertainty, and 2025 is delivering boatloads of that.
Markets hate uncertainty, and 2025 is delivering boatloads of that. Right at the center of the action is Gold smashing through all-time highs as crypto waits on the wings eyeing its next big move. As the U.S. dollar wobbles and political fireworks erupt in Washington, a fascinating safe-haven shuffle is underway - and this could swing sentiment for the next few weeks or months.
Bitcoin vs gold in the defensive asset race
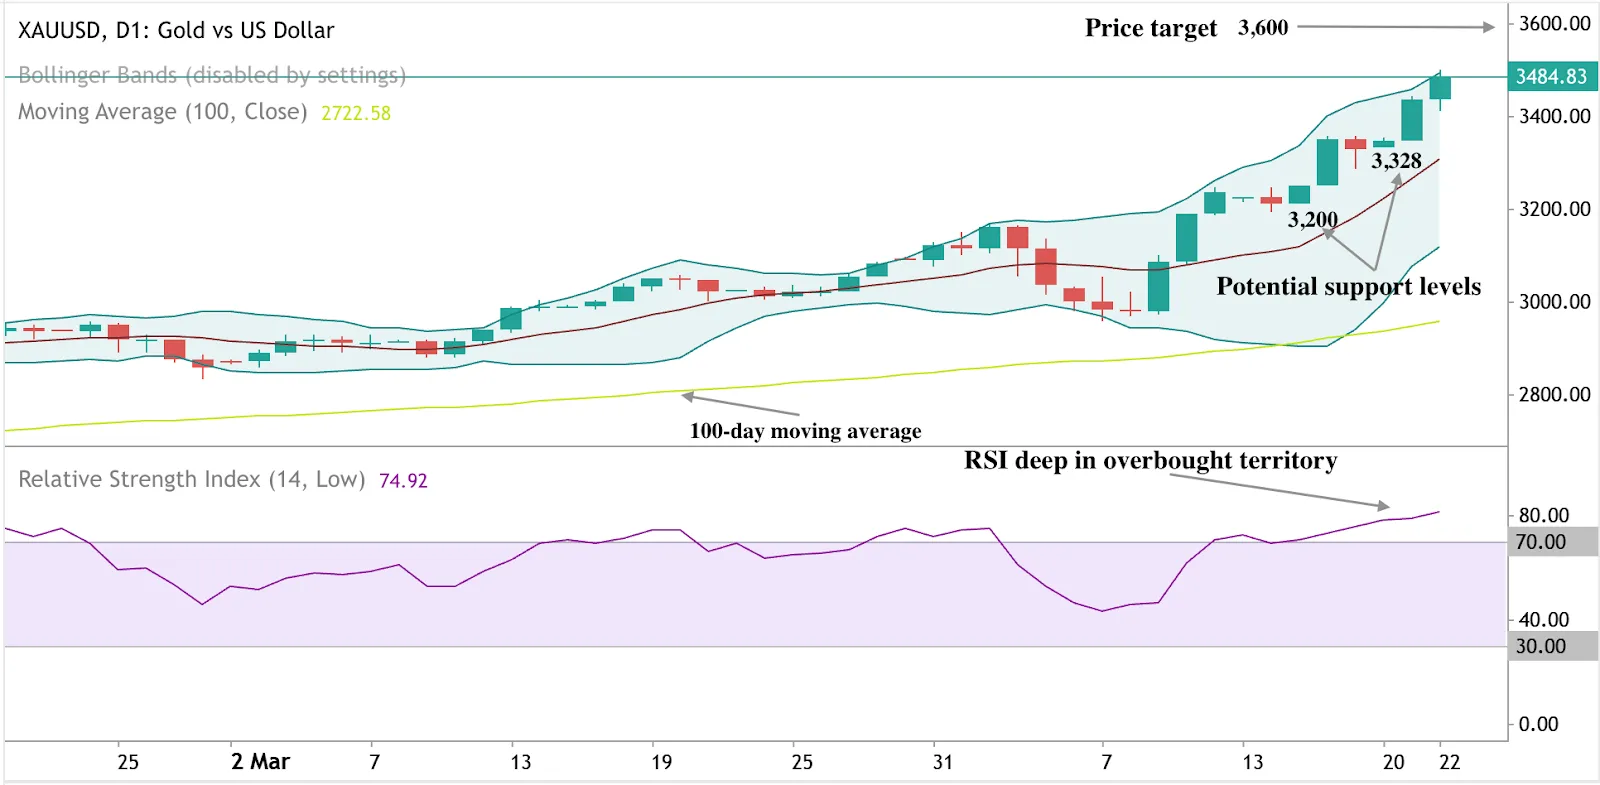
Gold is basking in the spotlight like never before on the world stage. The precious metal just blasted past $3,480 an ounce, notching a new record as investors scramble for safety. Driving this surge isn’t just old-fashioned inflation fear - it’s a cocktail of economic worries, trade tensions, and political intrigue straight from the top echelons of U.S. power.
No one can ignore the hard-hitting headlines: President Trump publicly called Fed Chair Jerome Powell “a major loser” and accused him of acting too late on interest rate cuts. It’s a rare sight when a sitting President openly questions the central bank’s independence - and markets are responding with a bang. The U.S. Dollar Index is dipping to levels last seen in April 2022, while confidence in America’s policy direction is being openly debated around trading desks everywhere.
The cherry on top? Some in the administration are even looking into whether Powell can be fired. Add on escalating tariff battles with China, sky-high trade barriers, and tit-for-tat retaliation, and it’s no wonder gold’s safe-haven status is shining brighter than ever. Even with talk of “overbought” conditions, the mood remains firmly risk-off - and that’s music to gold bugs everywhere.
Crypto price prediction: BTC stays calm and plots its move
But crypto isn’t sitting this one out. While Bitcoin tumbled from its towering $110,000 January peak, it's weathered this financial storm better than the traditional tech-heavy Nasdaq. Beneath the surface, crypto is still a digital hedge - stubbornly resilient even as equities flinch.
Big voices like Ray Dalio are ringing alarm bells about a possible “monetary order breakdown” and a crisis that might put 2008 to shame. In response, savvy investors - and even a few governments - are starting to pay closer attention to digital assets. The CEO of Binance just revealed they’re advising countries on how to build crypto reserves. Meanwhile, U.S. Treasury Secretary Scott Bessent surprised the old guard by suggesting Bitcoin could play a defensive role in turbulent times. Is crypto about to morph from outsider to institution?
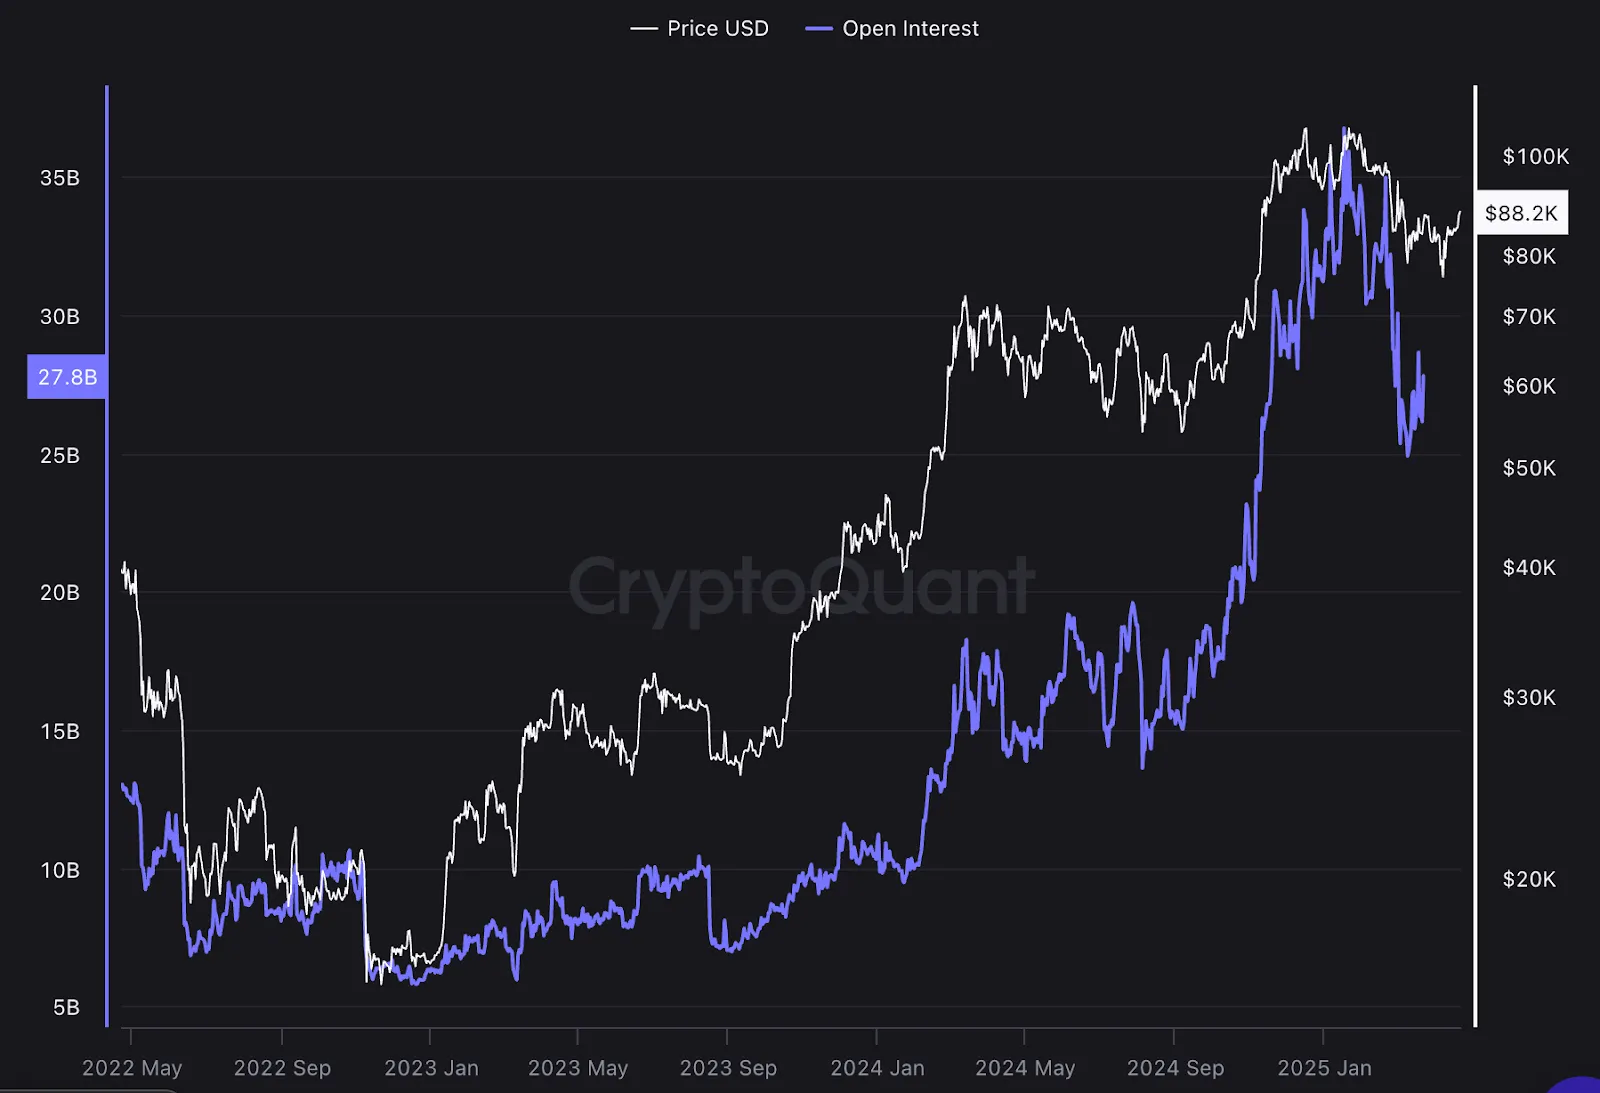
Popular analyst Ali Martinez has also pointed out that in just the last 24 hours (as of April 21, 2025), open interest surged by another $3.2 billion, showing a lot of new activity.
Market outlook 2025: The big picture
What’s clear is that faith in traditional economic playbooks is faltering. With fear of stagflation looming, trade wars rattling nerves, and central bank independence under pressure, investors are sprinting for assets with a track record of riding out uncertainty. Gold’s starring role isn’t likely to end soon - but behind the curtains, crypto is preparing for a new audition.
As traditional markets brace for more volatility, one thing’s for sure: this is no ordinary cycle. We’re witnessing a reset in risk - and possibly a rebalancing of what it means to be “safe.” For gold, it’s a moment of triumph. For crypto, the opportunity may be just beginning.
At the time of writing, Gold is inching towards $3,500, with upward pressure evident on the daily chart. However, the RSI, deep in overbought territory, hints at overbought conditions. Should prices slide, the yellow metal’s price could be held at $3,328 and $3,200.
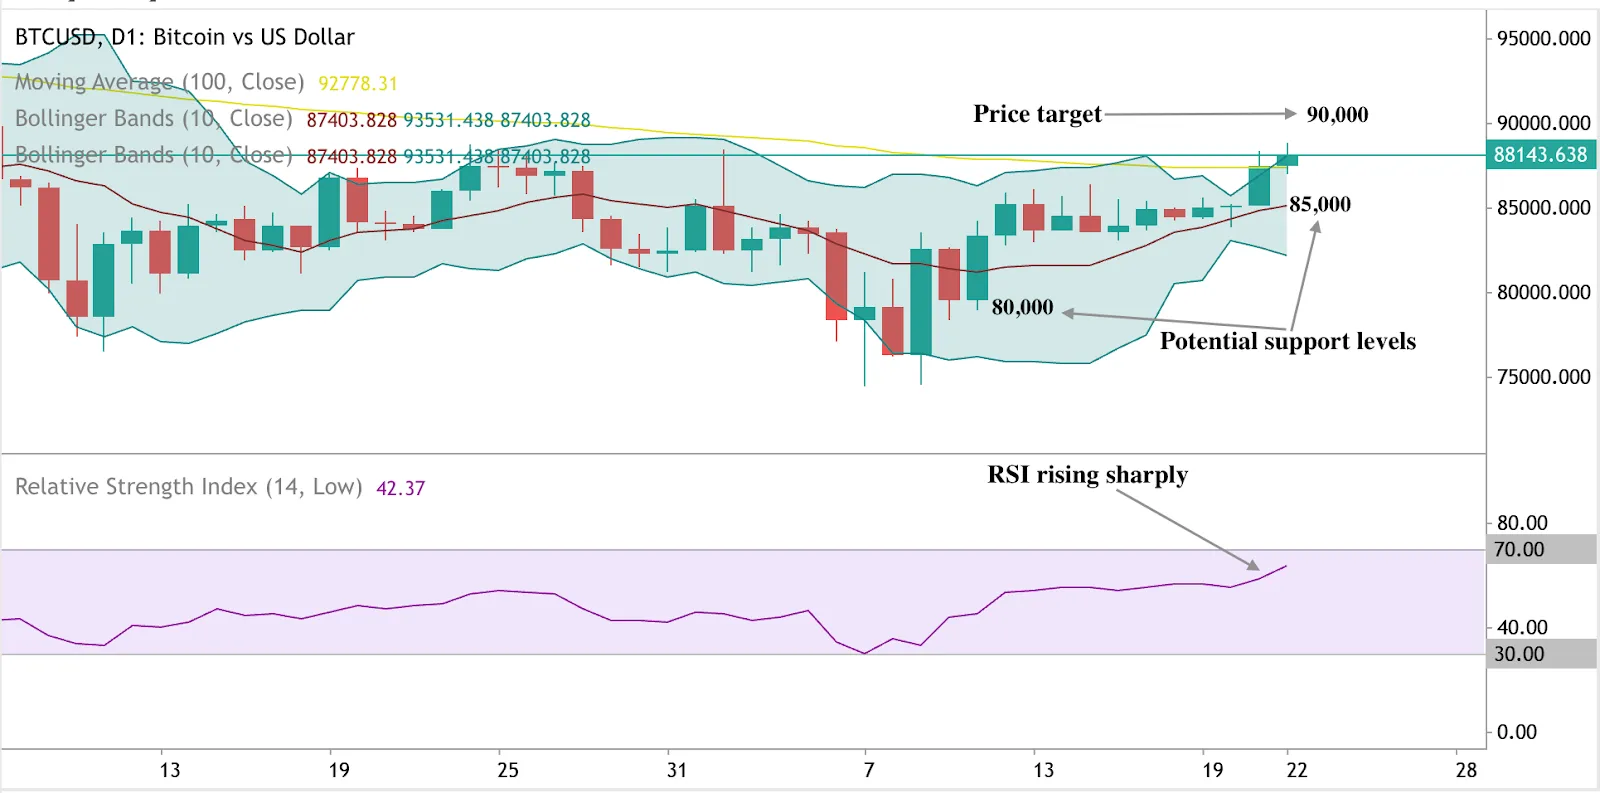
Bitcoin has also been trending up, with the path towards $90,000 looking clear. The bullish bias is evident as the RSI edges up sharply. However, prices touching the upper Bollinger band hint at overbought conditions. Should prices see a sharp slide, BTC could be held at the $85,000 and $80,000 price levels.
Ready to position yourself in this changing landscape? You can speculate on Gold’s and BTC price with a Deriv MT5 or Deriv X account.

How to test, troubleshoot, and optimise AI expert advisors for Deriv MT5 and cTrader
AI trading expert advisors are here — but you still need to test and refine them.
AI trading expert advisors are here — but you still need to test and refine them.
If you’ve already used AI tools like Claude or ChatGPT to create an expert advisor for Deriv MT5 or a cBot for Deriv cTrader, you’re off to a great start. But even when the code looks right, it can still contain mistakes that affect how the bot works.
Before you run your expert advisor (EA) in a live market, it’s important to test it and make sure it’s working the way you expect it to.
In this guide, we’ll walk through common coding mistakes in AI-generated EAs, how to fix them, and practical tips to improve your bot’s performance.
Common AI MQL5 coding errors
These are some of the most common issues found in AI-generated EAs, along with ways to correct them:
- Undeclared identifier error in MQL5
This error appears when the bot uses a variable or name that hasn’t been defined properly, like missing a parameter or using an incorrect name in indicators like iMA().
Fix:
Check the indicator’s parameters and make sure all variable names match what’s expected in MetaEditor (MT5’s coding tool).
- Missing Buy/Sell trade execution functions
Some AI-generated bots skip essential logic for opening trades.
Fix:
Manually add basic trade execution functions. Here’s an example of a basic structure to place a buy order:
void OpenBuy() {
MqlTradeRequest request; MqlTradeResult result;
request.action = TRADE_ACTION_DEAL;
request.type = ORDER_TYPE_BUY;
request.price = SymbolInfoDouble(_Symbol, SYMBOL_ASK);
request.volume = 0.1; request.magic = 12345;
OrderSend(request, result);
}
Make sure also to include logic for sell orders and define the conditions under which trades should be placed.
- Improper loop conditions in Deriv cTrader
In Deriv cTrader, the bot’s logic needs to run inside specific functions like OnBar() or OnTick(). These are triggered automatically when the market moves. If your code is placed outside these sections, such as in the wrong loop or global scope, it won’t run as expected.
Fix:
Ensure that bars and ticks are handled inside OnBar() or OnTick(). This will allow your bot to respond correctly to new ticks or bars during backtesting and live trading.
- Miscalculating lot size based on balance percentage
When the AI tries to set the lot size based on your account balance (e.g. risking 2% per trade), it may skip an important detail — the contract size. This can lead to inaccurate lot sizes.This won’t trigger a code error, but in testing, you’ll see trade sizes that don’t match your risk settings, resulting in overexposure or under-exposure in live trades.
Fix:
Use a formula with a lot size that factors in the contract size, such as:
//-----------------------------------------------------------------
double accountBalance = AccountInfoDouble(ACCOUNT_BALANCE);
double riskMoney = accountBalance * (RiskPercent / 100.0);
double tickValue = SymbolInfoDouble(_Symbol, SYMBOL_TRADE_TICK_VALUE);
double tickSize = SymbolInfoDouble(_Symbol, SYMBOL_TRADE_TICK_SIZE);
double pointValue = tickValue / tickSize;
double contractSize = SymbolInfoDouble(_Symbol, SYMBOL_TRADE_CONTRACT_SIZE);
if(contractSize > 0)
pointValue = pointValue / contractSize;
double lotSize = riskMoney / (StopLossPoints * pointValue);
double minLot = SymbolInfoDouble(_Symbol, SYMBOL_VOLUME_MIN);
double maxLot = SymbolInfoDouble(_Symbol, SYMBOL_VOLUME_MAX);
double lotStep = SymbolInfoDouble(_Symbol, SYMBOL_VOLUME_STEP);
lotSize = MathMax(lotSize, minLot);
lotSize = MathMin(lotSize, maxLot);
lotSize = MathFloor(lotSize / lotStep) * lotStep;
- Other errors
If you encounter one of these errors—or any other—you can always ask your AI model for help in identifying and fixing the issue.
Simply copy the error message and the relevant code, then share them with the AI model. Most of the time, it should be able to pinpoint the problem and offer a fix or suggest possible solutions.
Tip: Always run a backtest before going live. Issues like this don’t appear until you test the strategy with real market data.
Improve your AI-generated expert advisor
Once your bot is working, you can make small changes to improve its performance and stability. Here are a few common hacks to do so:
- Add error-handling logic to manage unexpected behaviour during high volatility or connection issues.
- Use a trailing stop-loss to lock in potential profits when the market moves in your favour.
- Backtest your strategy with historical data to see how it would have performed.
- Clean up and organise your code to improve readability and efficiency. This will make it easier to update or troubleshoot later.
Tip: Use the MetaEditor Debugger (on MT5) to test how your bot runs step by step.
Why backtesting trades is critical
AI-generated bots are a great way to automate your trading without needing to code from scratch. But even with AI, your strategy still needs human checks and adjustments to work well in live conditions.
Before going live, take time to test thoroughly and make small improvements. Even minor fixes can make a big difference in how consistently and effectively your EA performs.
Sorry, we couldn’t find any results matching .
Search tips:
- Check your spelling and try again
- Try another keyword