Results for
Can the Bitcoin bull run retain the spotlight with Ethereum heating up?
Until recently, the story was simple: Bitcoin was in charge. Then Ethereum crashed the party.
Until recently, the story was simple: Bitcoin was in charge. ETF approvals had kicked off a wave of institutional demand, the halving had trimmed supply, and the market seemed happy to crown BTC the leader of this bull cycle.
Then Ethereum crashed the party.
After drifting quietly in the background for months, ETH suddenly came to life. It didn’t just rise - it surged.
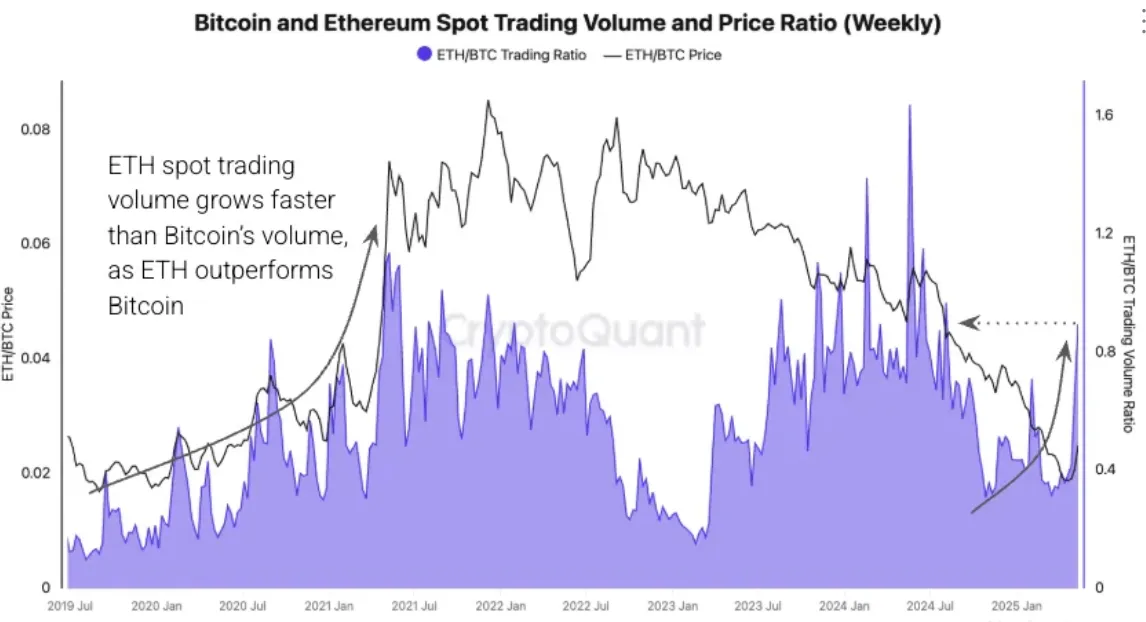
The ETH/BTC ratio spiked 38% in a week, the strongest reversal in years. That move wasn’t driven by noise; it was backed by solid metrics and growing market confidence. Trading volumes climbed, on-chain indicators flipped bullish, and institutional portfolios began shifting.
Just like that, the clean Bitcoin narrative got a lot messier.
The perfect market conditions
Bitcoin had everything going for it. The market had just digested one of the most anticipated events in crypto - spot ETF approval in the US - bringing a wave of institutional credibility. The halving followed soon after, setting the stage for a classic post-supply-shock rally. Add in geopolitical uncertainty and central bank wobbles, and Bitcoin looked primed to shine as digital gold.
And it was. Until Ethereum stirred the pot.
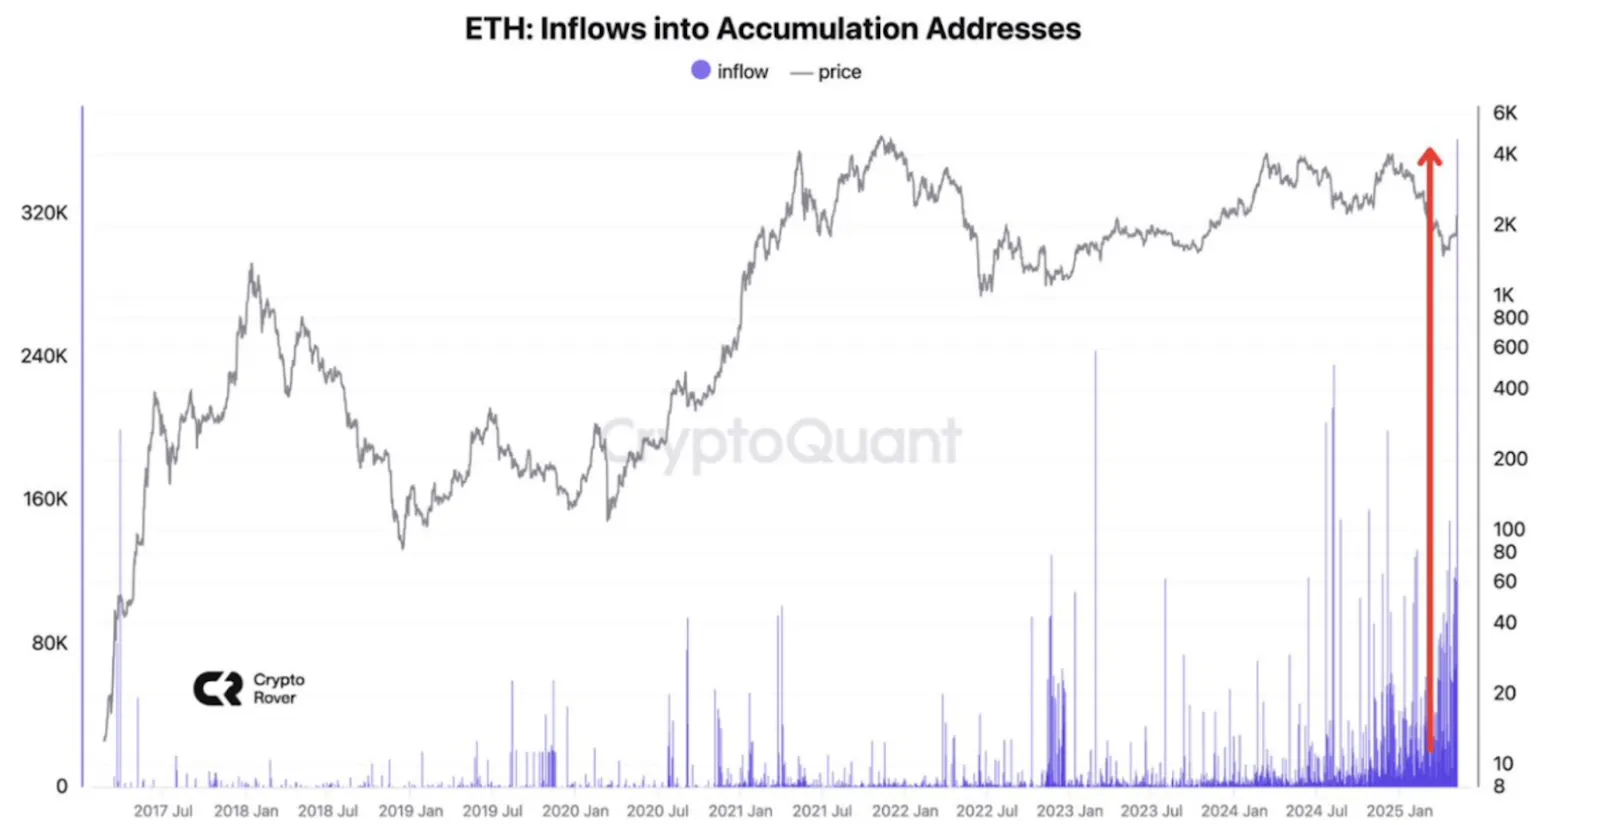
ETH’s breakout wasn’t just about price. On-chain, things began to shift. Exchange inflows, a proxy for sell pressure, dropped to their lowest levels since 2020, suggesting holders weren’t eager to cash out. Meanwhile, Ethereum ETF holdings quietly climbed, hinting at a subtle but growing wave of institutional interest.
ETH/BTC ratio
What stood out most, though, was the ETH/BTC valuation metric, which had dipped into extreme undervaluation territory for the first time since 2019.
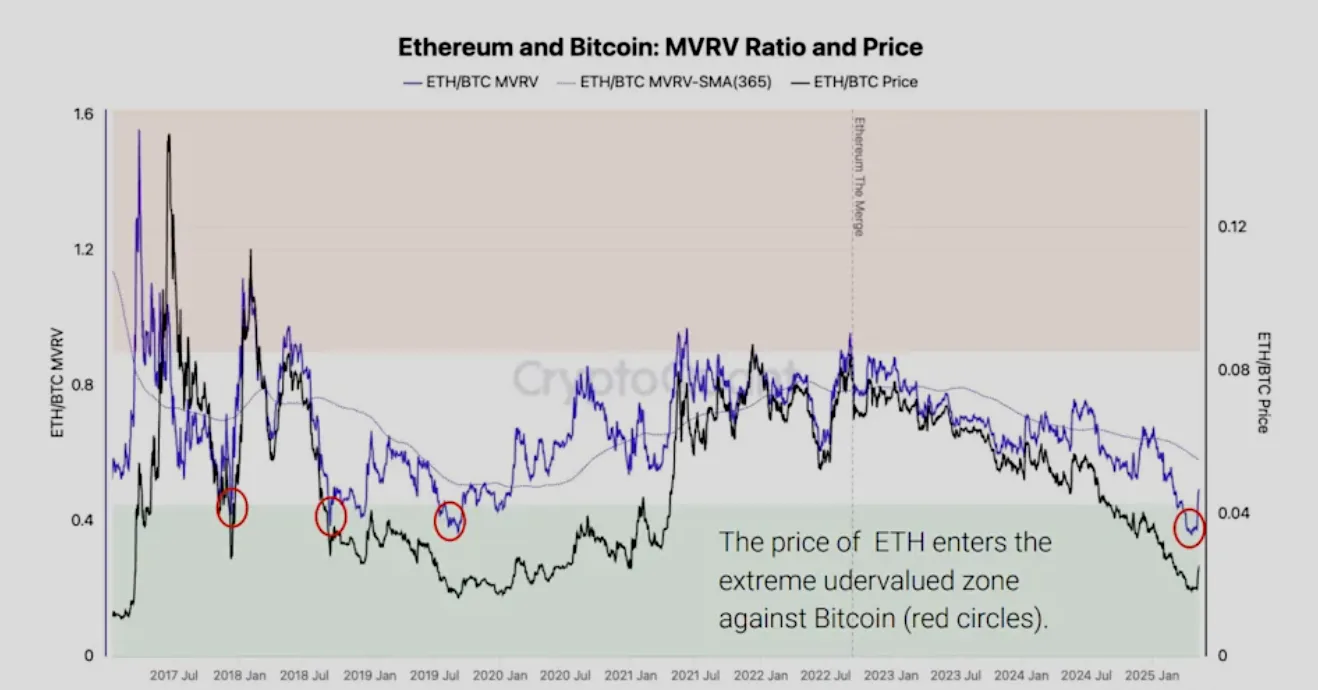
Historically, those levels have preceded periods of ETH outperformance. This time, it looks like history might be repeating.
ETH is no longer just along for the ride. It’s starting to steer its own narrative.
Bitcoin still leads - but it’s not alone
This doesn’t mean Bitcoin is losing ground - far from it. It’s still trading near highs, and its role as the anchor of the crypto market remains intact. But Ethereum’s comeback has introduced something BTC hasn’t had to deal with in a while: shared attention.
What was shaping up to be a textbook Bitcoin-led bull run has suddenly turned into a two-horse race. And that changes the dynamic - not in a negative way, but in a way that forces investors to think beyond a single asset thesis.
The market is no longer just banking on Bitcoin. It’s banking on crypto.
Bitcoin outlook: What’s next?
With both BTC and ETH pulling back slightly, it’s tempting to focus on short-term noise. But zoom out, and it’s clear that Ethereum’s momentum is more than a fluke. The capital rotation, the volume shift, the fundamental support - it all points to a market that’s broadening, not breaking.
Bitcoin remains the foundation, but Ethereum is emerging as the growth story within the same cycle. One is the anchor, and the other, the accelerator.
And that’s what makes this bull run so fascinating. It’s no longer just about how high Bitcoin can go - it’s about who else is coming with it.
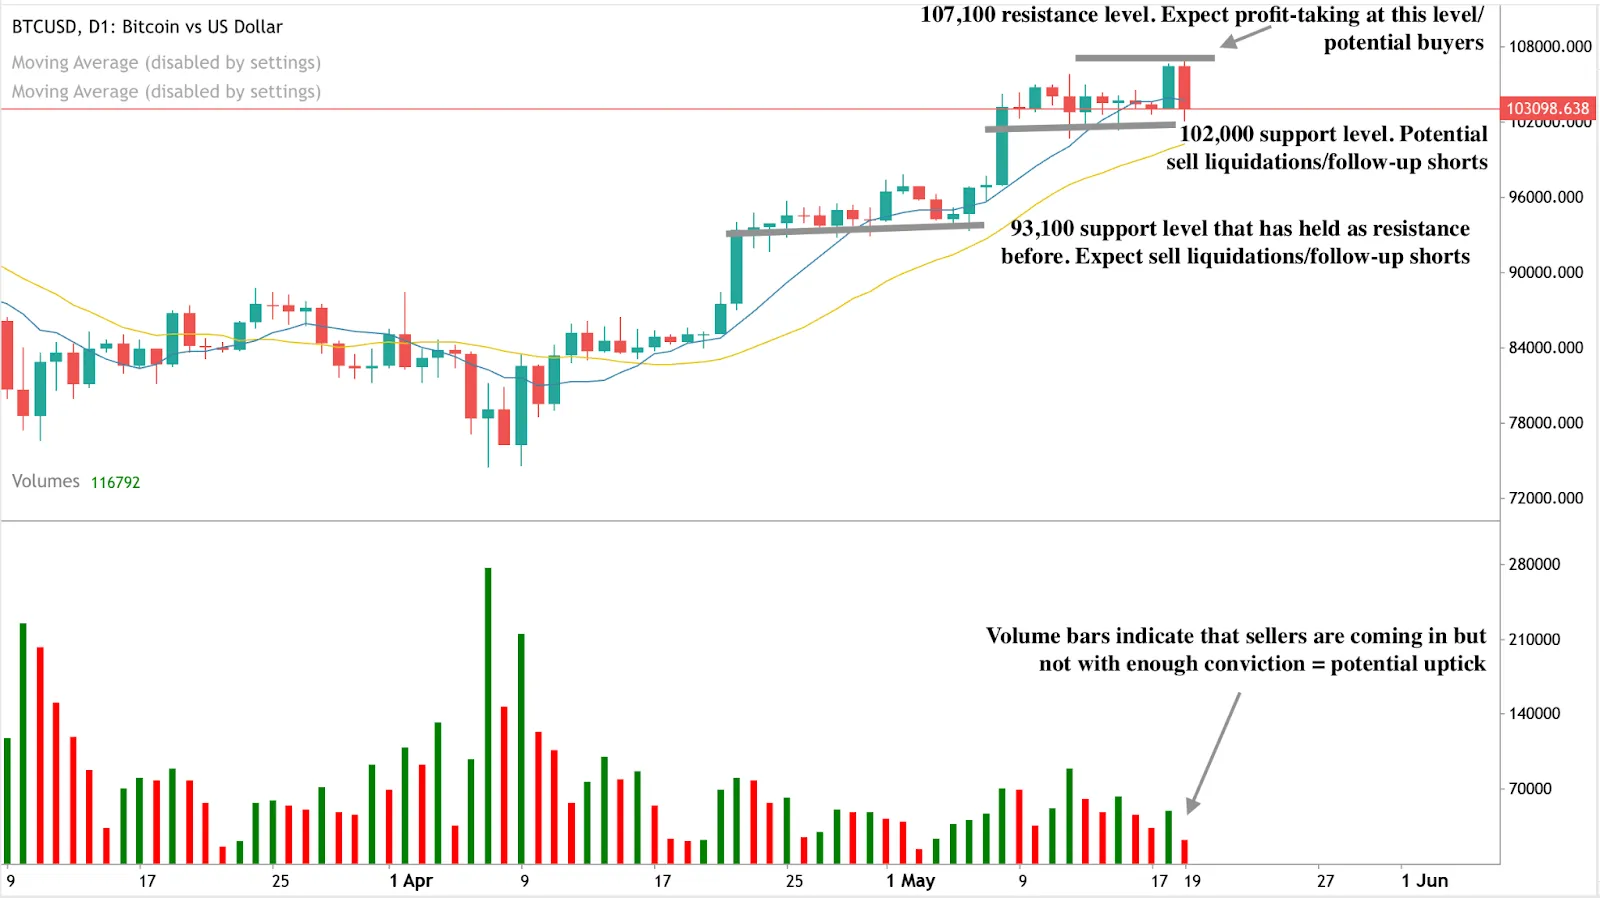
At the time of writing, BTC is retreating and currently touching a significant support level. Though sell-side bias is currently evident on the daily chart, the volume bars indicate that sell-side pressure is waning and the rally may resume.
If we see a bounce from the current support level, the price could encounter a resistance wall at the $107,100 level. On the contrary, if the slump continues past the support level, the price could find support floors at the $102,000 and $93,100 price levels.
Is ETH set for a huge bounce? You can speculate on the price of BTC and ETH with a Deriv MT5 or Deriv X account.

Could OPEC’s strategy shift and gold’s retreat set the tone for H2?
For years, commodities danced to the tune of crisis. But as 2025’s second half approaches, the signals are changing - and fast.
For years, commodities danced to the tune of crisis. OPEC+ fought market gravity with production cuts, while gold soared on fear and uncertainty. But as 2025’s second half approaches, the signals are changing - and fast.
Oil prices are rising, even as supply increases. Gold is falling, not on weak fundamentals, but on improving sentiment. This isn’t just a market quirk - it could be the early signs of a deeper shift: from reactive panic to strategic positioning.
Are we entering a new phase where commodities stop echoing headlines - and start setting the temp.
OPEC increases oil production
For two years, OPEC+ played the role of market caretaker - trimming supply, steadying nerves, and trying to prop up prices through sheer will. But 2025 has brought a decisive shift. Instead of more cuts, the group is ramping up production - and yet, oil prices are holding firm.
The announcements of successive supply increases, totalling over 800,000 barrels per day, initially raised eyebrows. But this isn’t an act of desperation, it looks more like a calculated repositioning. Saudi Arabia not only raised output but also hiked its official selling prices to Asia. That’s not what you do when you’re losing control - that’s a strategic flex.
Still, there’s tension behind the scenes. A Reuters report suggests further increases could be on the horizon. If compliance continues to falter, the 2.2 million barrels per day in voluntary cuts from eight OPEC+ countries risk being entirely reversed by October or November.
Kazakhstan and Iraq have repeatedly exceeded their quotas, either ignoring agreed cuts or only partially delivering them. This ongoing lack of discipline is preventing the group from correcting the previous oversupply. And it seems Saudi Arabia’s patience is wearing thin.
If this trend continues, the market could tip into surplus much earlier than expected and potentially stay that way through the rest of 2025.
That said, the headline numbers may overstate the impact. Kazakhstan is already producing well above its adjusted limit, so has little room to increase further. Iraq is likely to be forced into fresh compensatory cuts soon, while the UAE’s capacity to pump more is limited.
OPEC’s own data suggests the real increase between March and June may be closer to 600,000 barrels per day, not quite the flood some feared.

OPEC+ may be sending a message to its own members, markets, and competitors. It’s testing sentiment, keeping options open, and applying pressure while allowing external factors, like easing US-China tensions, to give oil prices an extra lift.
Rather than losing their grip, OPEC+ may just be changing tactics - quietly navigating rather than openly steering the market.
Gold’s price forecast: Confidence or complacency?
Meanwhile, gold has had a rough month.
Prices plunged nearly 9% from April’s record highs, dipping below $3,200 after a wave of optimism swept markets. The catalyst? A surprisingly friendly round of US-China trade talks, plus news that Iran may be ready to ink a new nuclear deal. Suddenly, the world felt a little less scary.
But let’s not get ahead of ourselves.
Yes, gold thrives on uncertainty - but that doesn’t mean its case disappears the moment markets calm down. Inflation, central bank gold buying, and simmering geopolitical risk haven’t magically vanished. They’ve just been pushed off the front page.
In fact, even after the sell-off, gold remains one of 2025’s top-performing assets. Smart money knows that peace talks can stall and inflation can roar back without much warning. This dip? It might just be the breather before the next leg up.
The bigger picture: Market sentiment vs substance
What makes this moment interesting is that both oil and gold are moving in ways that challenge conventional logic. Oil is rising despite more supply, while gold is falling despite strong fundamentals.
Why? Because sentiment is shifting.
Markets aren’t reacting to events - they’re reacting to expectations. And for the first time in a while, expectations are leaning positive. That creates room for commodities to behave more like markets - and less like emotional barometers.
What’s the trading outlook for H2?
If oil keeps climbing while gold cools, we could be looking at a broader sentiment reset: a market that’s less focused on fear and more focused on fundamentals. That doesn’t mean volatility is gone - but it may mean investors will need to adjust their playbooks.
- For oil: Watch for further price resilience. If demand holds and supply remains calculated, prices could grind higher, even without OPEC+ theatrics.
- For gold: The retreat may continue in the short term, but don’t count it out. All it takes is one hawkish Fed comment or geopolitical surprise to light a fire under bullion again.
- For broader commodities: This may be the start of a phase where strategic supply moves, inventory trends, and real economic data matter more than headlines.
Commodities aren’t screaming anymore - they’re signalling. And those signals suggest a more strategic, less panicked second half of 2025. For traders, this could present both a challenge - and an opportunity.
Oil and Gold technical outlook
At the time of writing, Oil is seeing some drawdown, hovering around the $61.24 level. Price levels are just below a major sell zone, hinting that sellers could maintain control. However, a potential inverse head and shoulders formation is taking shape, hinting at a potential bullish move. The bullish narrative is also buttressed by the volume bars indicating waning sell pressure.
Should the slump continue, prices could be held at the strong $57.56 support level, which has held prices before. If bulls have their way, prices could encounter resistance walls at the $63.56 and $69.90 resistance levels.

Gold has seen a significant slump as risk-off sentiment dominates the market. Sell-side bias is evident on the daily chart. However, the volume bars tell a story of sells not yet moving with conviction. This could set the stage for a potential return of buyers. Should we see a collapse, prices could find a support floor at the $2,980 support level. If a bounce materialises though, prices could encounter resistance walls at the $3,250 and $3,435 resistance levels.

Will Oil and Gold see more volatility? You can speculate on the price of Oil and Gold with a Deriv MT5 or Deriv X account.

DOGE and SHIB could carry this meme coin rally further
It’s 2025, and the crypto markets are acting up again - but not in the way you’d expect.
It’s 2025, and the crypto markets are acting up again - but not in the way you’d expect.
While Bitcoin takes a breather, meme coins are stealing the show, with Dogecoin (DOGE) and Shiba Inu (SHIB) leading the charge. If you thought the meme coin craze was a relic of 2021, think again. These tokens are back - and this time, they’re backed by more than just hype.
We’re talking serious volume, bullish sentiment, and even ecosystem upgrades. So, are meme coins about to stage their next big rally? Or is this just a blip in a quiet market?
DOGE is barking again
Dogecoin is showing signs of life - and not just because of social media buzz.
Data from Glassnode shows a 63% jump in DOGE futures open interest over the past week, pushing the total to over $1.62 billion. That’s a strong indicator of renewed trader confidence and growing speculative activity.

What makes this move more interesting is that it’s happening while Bitcoin cools off. Some analysts are calling it a “decoupling,” where Dogecoin is moving independently of the broader market.
Dogecoin also soared more than 40% in the last seven days, briefly outperforming every other top 10 crypto. Add in positive funding rates, a weekly close above key resistance (now flipped to support), and commentary from macro investor Raoul Pal suggesting DOGE might outperform Bitcoin - and suddenly, things start to look very real for the top meme coin.
Even after a recent dip to $0.2238, increased trade volume suggests traders are still positioning for more upside.

SHIB’s not done yet
Shiba Inu started as a meme, but it’s been working hard to shed that label.
With its own decentralised exchange (ShibaSwap), NFT projects, utility tokens (BONE and LEASH), and a newly launched Layer-2 blockchain (Shibarium), SHIB has built a full-fledged ecosystem.
And now? It’s showing signs of revival. In just one week, over 330 million SHIB were burned, slashing supply in a deflationary move that reflects stronger community participation. The burn rate spiked 364%, according to Shibburn.
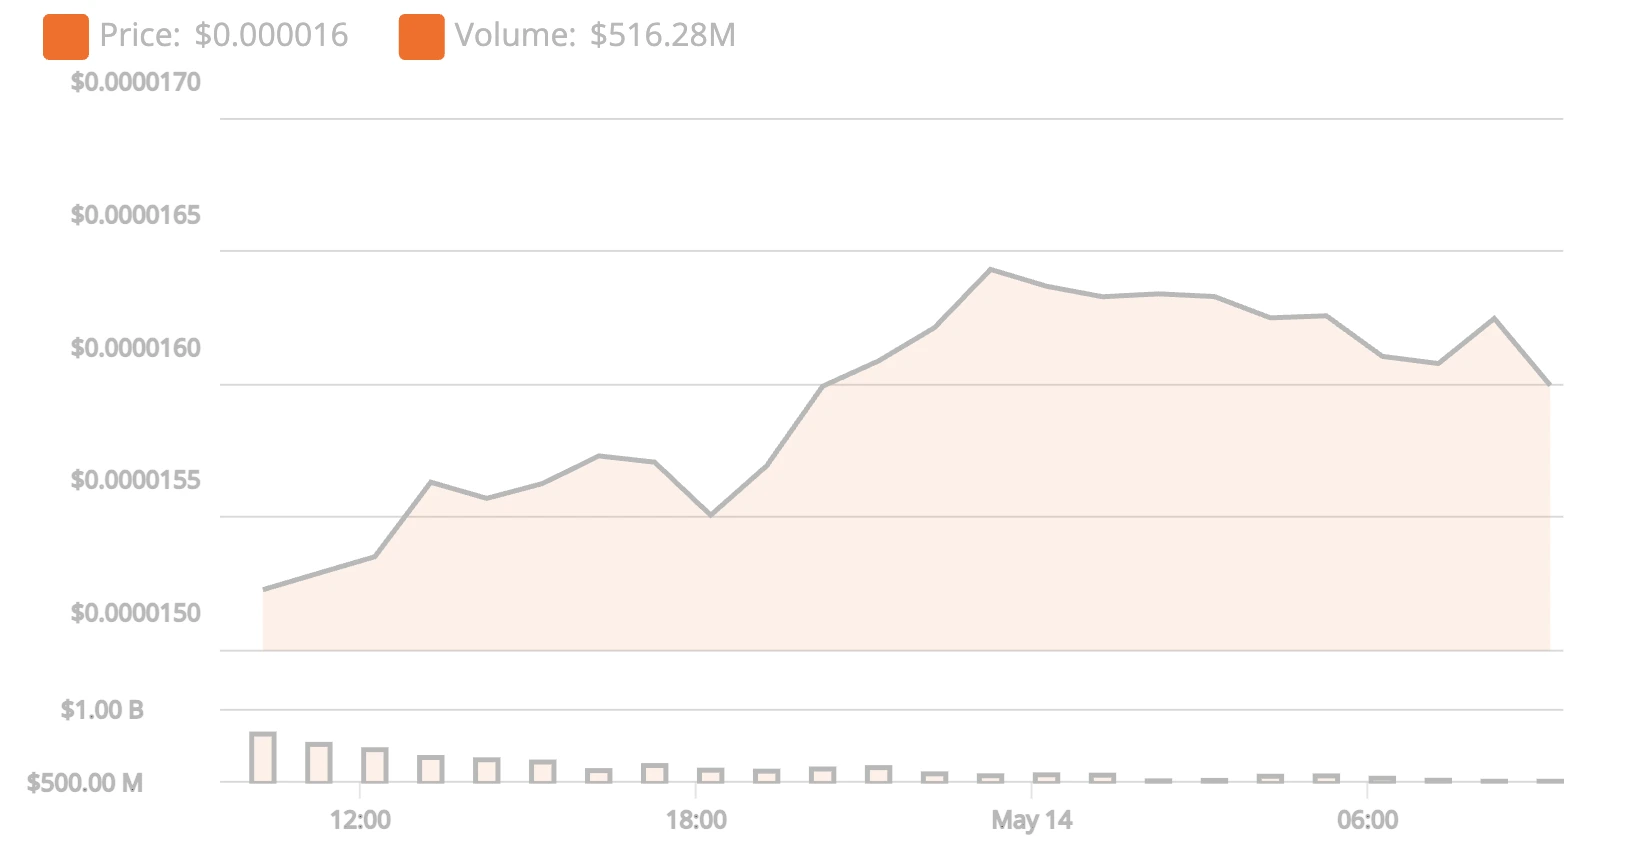
At the same time, SHIB’s 24-hour trading volume hit $516.28 million, and the token is now trading just below a major resistance level of $0.0001648. Market watchers are eyeing this closely for a potential breakout.
Historically, May has been good for SHIB. It gained 355% in May 2021, 13% in May 2024, and averages a 61% rise in this month alone. Add that to rising engagement and ecosystem growth, and SHIB’s story might be far from over.

Technical outlook: Meme coin mania but with muscle?
Unlike the pure hype cycles of 2021, this meme coin resurgence feels more grounded. There’s real infrastructure, stronger community mechanics, and rising technical signals.
DOGE is holding its own against Bitcoin. SHIB is burning tokens, launching networks, and pulling in liquidity. And with new contenders like DAGZ emerging, we may be looking at the early stages of meme coin season 2.0.
It’s still crypto, so anything can happen. But for now? The meme coins are making noise - and it’s not just for laughs.
At the time of writing, Dogecoin is showing some buying pressure after a pause that saw a significant drawdown. The bullish narrative is also helped by a recent bullish head-and-shoulder formation and the volume bars indicating waning sell pressure. However, prices are at a critical resistance level, which might see prices held or a significant reversal.
Should a bounce materialise, prices could find resistance at the $0.24782 price level. Should we see a price slide, prices could be held at the $0.22165 and $0.16710 support levels.

Shiba’s chart is almost identical to Doge’s, with a recent inverse head-and-shoulder pattern hinting at an upward trend, which materialised. The move was followed up by a pull-back, with sell pressure still evident on the daily chart. The volume bars indicate that sell pressure is waning, which could hint at a potential reversal.
Should prices bounce, they could find a resistance wall at $0.00001567. If they slide, we could find support at the $0.00001521 and $0.00001223 price levels.

Are you monitoring the meme coin hype? You can speculate on the price of DOGE and SHIB with a Deriv MT5 or Deriv X account.

Has tariff uncertainty peaked with the US-China deal or just paused?
Just when markets were bracing for more trade drama, the world’s two largest economies hit the pause button.
Just when markets were bracing for more trade drama, the world’s two largest economies hit the pause button. The US-China tariff war, which had sent tremors through global assets, is taking a 90-day breather - and that’s got investors wondering: is the worst over, or are we simply catching our breath before another round of uncertainty and turbulence?
Gold and silver, those trusty safe-haven assets, seem unconvinced. While equity markets surged and the US dollar flexed its muscles, precious metals quietly slipped into defensive mode. So, what’s really going on here - and could the calm be more fragile than it seems?
A tariff timeout - or a turning point?
Over the weekend, US and Chinese delegations reached a surprise agreement to roll back their most aggressive tariffs for a 90-day period.
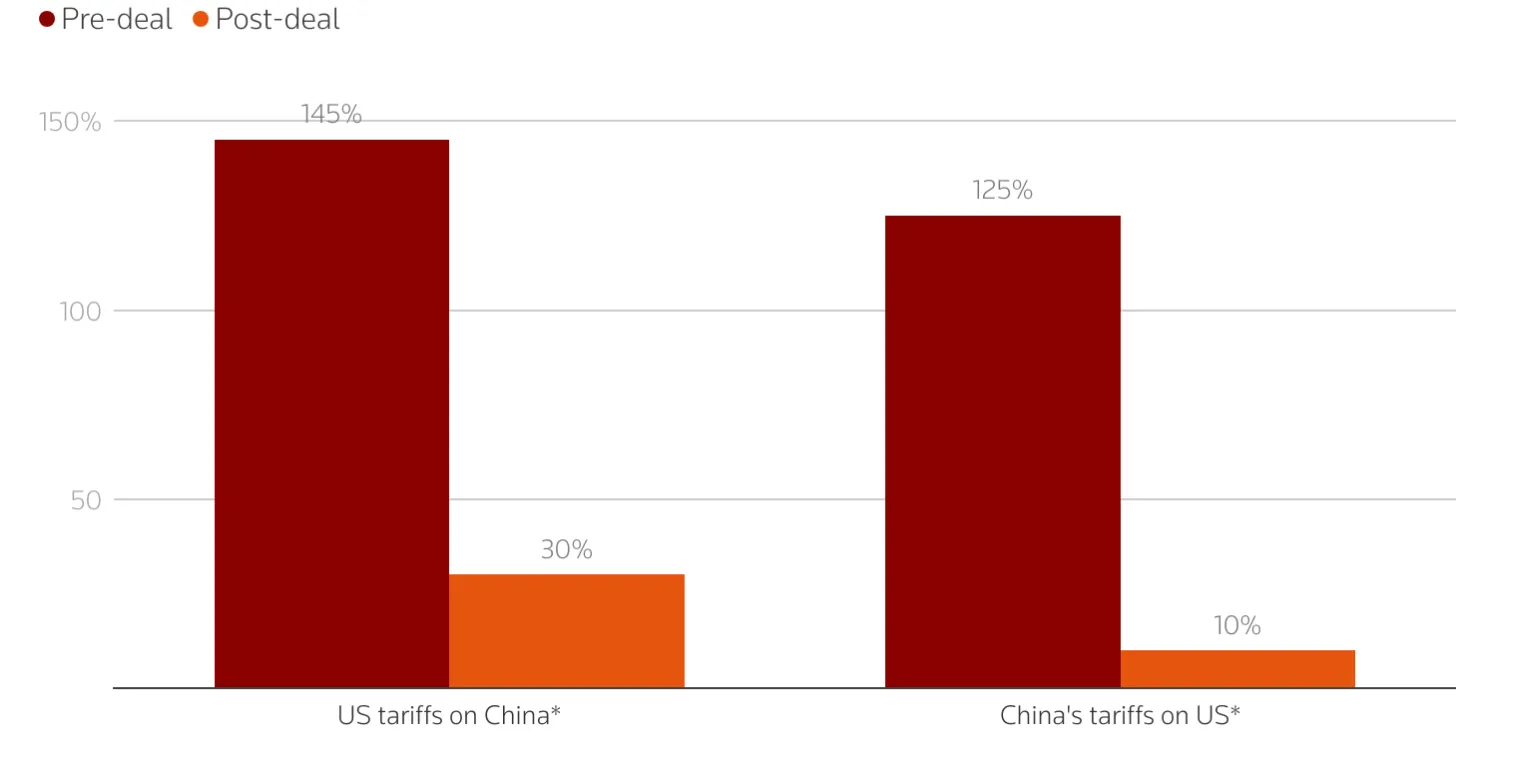
- The US will cut tariffs on Chinese imports from 145% down to 30%
- China will lower duties on US goods from 125% to 10%
Markets responded with enthusiasm. Equities soared, recession fears cooled, and risk sentiment returned with a vengeance. But here’s the kicker: many investors had only expected a vague commitment to “talks.” This was more than that - an actual rollback, even if only temporary.
So, naturally, the US dollar rallied hard. The dollar index climbed 1.5%, and safe-haven currencies like the Japanese yen took a backseat. But in this upbeat scenario, gold and silver were left out of the celebration.
Gold and Silver retreat as risk appetite returns
- Gold (XAU/USD) slid to around $3,235, pressured by a stronger dollar and rising yields.
- Silver (XAG/USD) lost over 0.40% on Monday and was flat in early Tuesday Asian trading at $32.56.
Why the pullback? When markets feel safer, they dump the “what if” hedges - and precious metals are at the top of that list. The US-China news boosted confidence just enough to make gold look a bit... well, boring.
But don’t count it out just yet.
Some say the US blinked - and the clock is ticking
Not everyone’s buying the idea that this is a true breakthrough.
“It’s 90 days - this just buys time. I think the US blinked,” said Marc Chandler, chief strategist at Bannockburn Global Forex.
His take? The US gave up its tariff leverage without extracting much in return. In other words, it’s a strategic pause - not peace. And come July, if deeper issues aren’t resolved (think tech access, subsidies, and data rights), the whole thing could unravel fast.
That’s where gold and silver could come back into play.
Inflation looms, and the Fed might not be so quick to cut
Beyond trade, the next big market driver is already queued up.
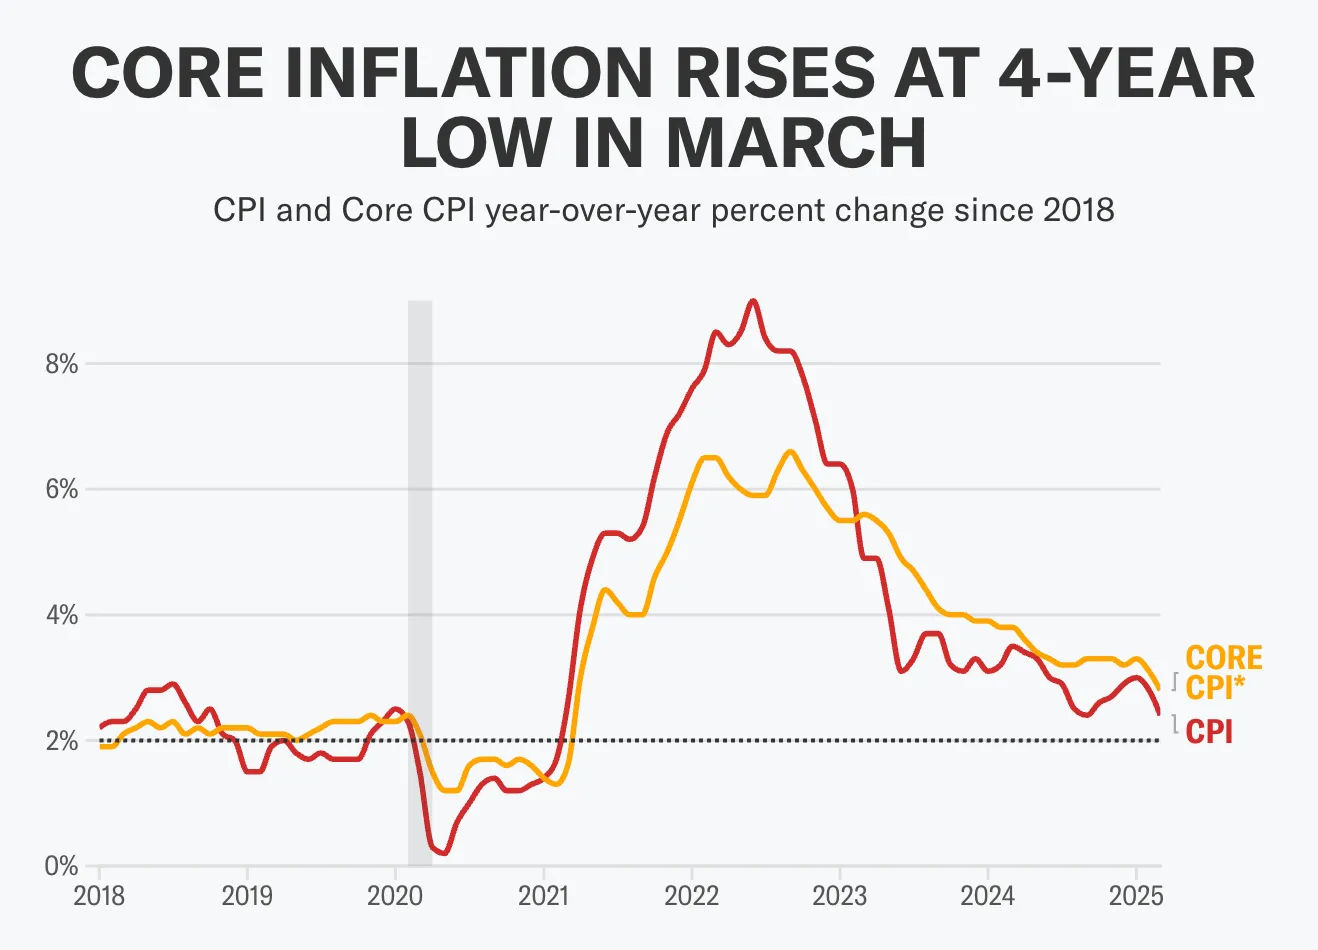
Core CPI, which excludes food and energy, is expected to rise 2.8% year-over-year in April, unchanged from March’s four-year low. Monthly core prices are seen increasing 0.3%, up from 0.1% in March.
These numbers matter. If inflation runs hotter than expected, it could delay US Federal Reserve interest rate cuts - another reason gold may remain subdued for now.
Markets have already pushed back their expectations for the Fed’s next move, now eyeing a first 25bps cut in September, rather than July. That’s more time for the dollar to stay strong - and for gold to tread water.
Geopolitics hasn’t gone away - and could snap back fast
Even as the US-China situation simmers down, other geopolitical risks are still bubbling:
- India’s Prime Minister Modi warned operations against Pakistan are only “in abeyance”
- Ukraine’s President Zelensky signalled readiness to meet Vladimir Putin, after Trump urged him to accept talks in Turkey
Analysts foresee any escalation in these arenas could flip sentiment in a heartbeat - and send money flowing back into safe-haven metals.
So, has the uncertainty peaked - or are we just in a holding pattern?
This deal is a relief, but it doesn’t fix the long-term problems between the US and China. It’s a truce, not a treaty. And while markets are celebrating now, the underlying volatility hasn’t gone away - it could just be taking a coffee break.
For gold and silver, this means short-term weakness but long-term potential. If talks collapse, inflation ticks up, or geopolitical tensions reignite, precious metals could find themselves back in demand - fast.
Gold and silver might have taken a step back, but their role as portfolio insurance isn’t going anywhere. Especially not in a world that loves a twist.
Technical outlook:
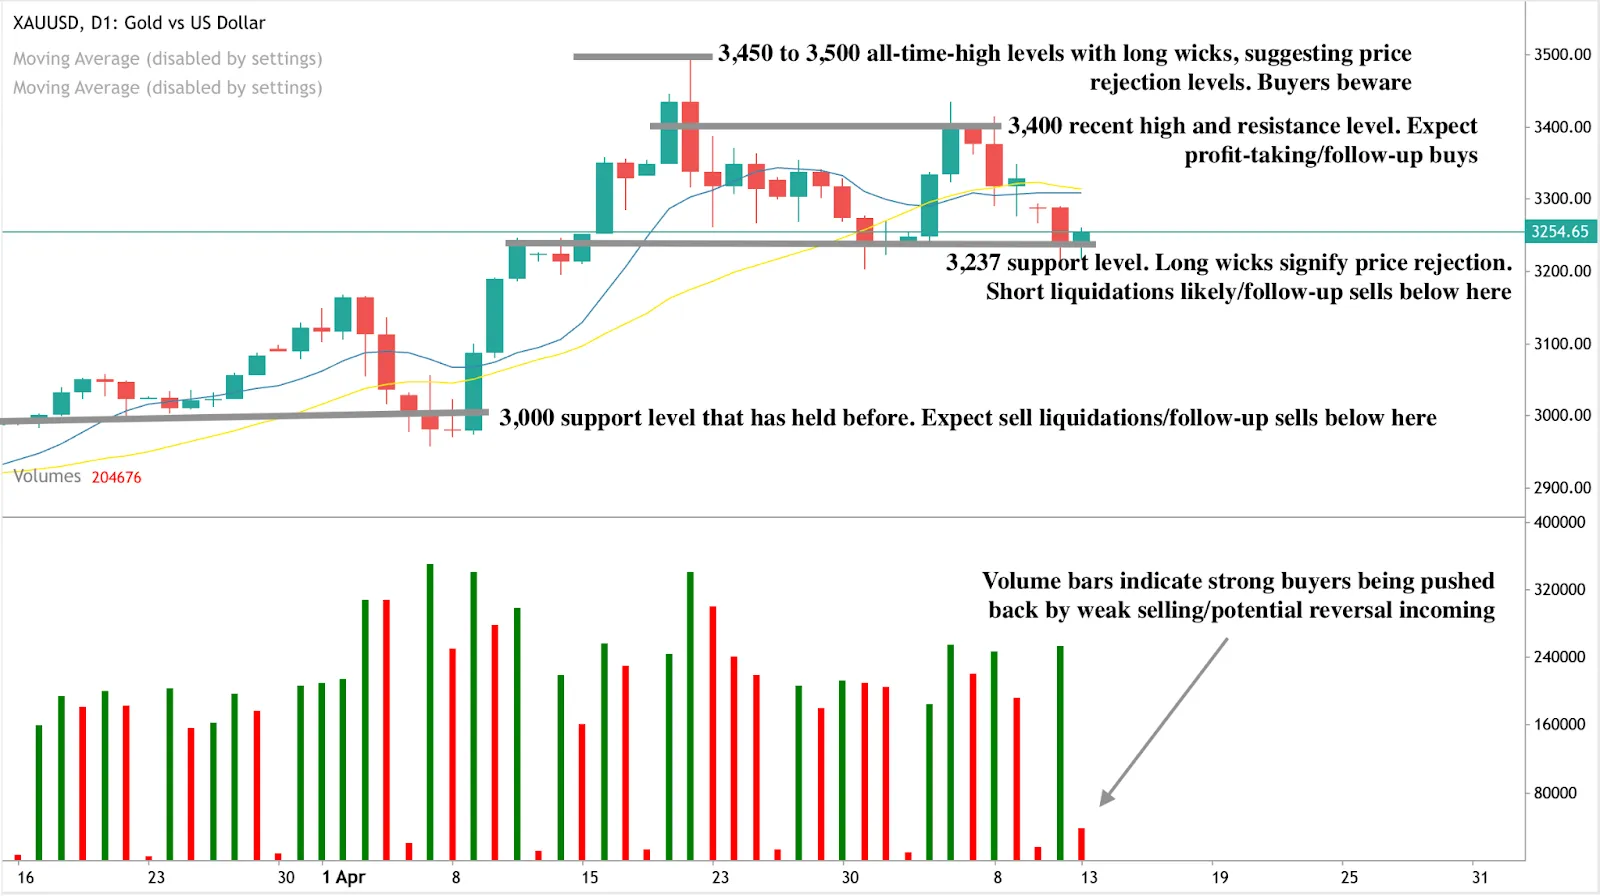
At the time of writing, Gold is holding at a major support level with sell pressure evident on the daily chart as trade tensions ease. The sell narrative is countered by the volume bars indicating the presence of strong buy pressure around the support area that has only been pushed back by weak sellers - hinting at a potential reversal.
Should we see a price rebound, prices could find resistance walls at $3,350 and $3,450 on their way to all-time highs of $3,500. If the slide continues past the support level, price could find new support levels at the $3,000 level.
Still hyped about Gold? You can speculate on the price of the yellow metal with a Deriv MT5 or Deriv X account.

Crypto evolves from meme frenzy to monetary chessboard
Remember when crypto was all rocket emojis, Shiba memes, and Elon tweets that could send coins flying - or crashing - within minutes? Those days were fun, chaotic, and borderline absurd.
Remember when crypto was all rocket emojis, Shiba memes, and Elon tweets that could send coins flying - or crashing - within minutes? Those days were fun, chaotic, and borderline absurd.
Fast-forward to 2025, and the mood has matured - dramatically. Bitcoin is trading above $100,000. Ethereum is flirting with $3K. XRP whales are quietly shifting hundreds of millions in tokens. But more important than the price tags is the vibe.
Crypto isn’t screaming for attention anymore. It’s sitting at the grown-up table.
The hype-fueled frenzy of 2021 has evolved into a more calculated, institutional game. From tokenised treasuries to sovereign wealth fund allocations, this market is no longer just a playground for internet culture - it’s a monetary chessboard where trillion-dollar strategies are unfolding in real-time.
Bitcoin: From rebel asset to reserve asset option
Bitcoin used to thrive on being the outsider - a hedge against traditional finance, a bet on digital freedom. That core identity hasn’t changed, but its audience has. With the Federal Reserve freezing rate hikes and talk of a $2.5 trillion dump in U.S. dollar assets by Asian trade partners, Bitcoin isn’t just the protest vote anymore. It’s Plan B for serious capital.
State treasuries are watching. Pension funds are inching in. ETF inflows are no longer a novelty - they’re a signal. The idea that Bitcoin could someday challenge gold’s $20 trillion market cap isn’t just late-night Twitter banter anymore. It’s getting modeled into risk strategies.
Geoff Kendrick of Standard Chartered even joked that his $120K price target for Q2 may be too conservative. That’s not hopium. That’s Excel spreadsheets in motion.
Ethereum Infrastructure, not just speculation
Meanwhile, Ethereum has outgrown its identity crisis. No longer “just” a platform for DeFi or NFT launches, Ethereum is becoming crypto’s version of critical infrastructure.
With the Ethereum 2.0 upgrade rolling out, the network is now faster, more scalable, and greener. But it’s what’s building on Ethereum that’s turning heads. Real finance is coming to the chain. Case in point: Ondo Finance is launching a tokenised U.S. Treasury fund using Ethereum tech. This isn’t a hype token - it’s a 24/7 gateway to government-backed bonds.
Ethereum’s growing credibility is turning ETH into a hybrid asset: part commodity, part utility, part yield machine. And yes, the $10K ETH dream no longer sounds like fantasy - it sounds like a use case.
XRP: The quiet operator in institutional finance
While Bitcoin gets the spotlight and Ethereum builds the roads, XRP is becoming the logistics layer - quietly, efficiently, and strategically.
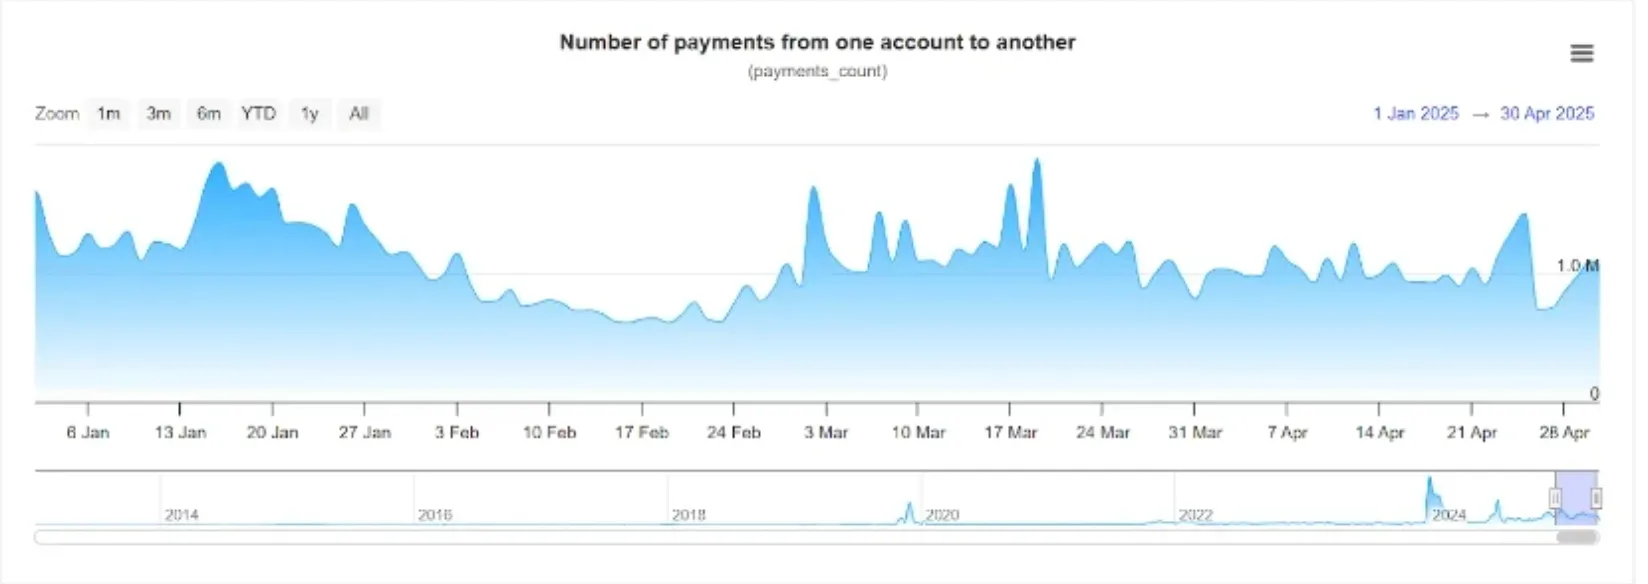
The XRP Ledger, Ripple's decentralised blockchain, saw a sharp rise in activity, with over one million transactions in the first week of May. Data from XRPSCAN shows payment volumes hitting record highs, reflecting growing interest in the network’s fast, low-cost infrastructure.
On 9 May, a Ripple-affiliated wallet moved 370 million XRP (worth over $780 million) to unknown wallets. To some, this looked suspicious. To others, it looked like internal treasury reshuffling. Either way, it wasn’t panic - it was planned.
At the same time, XRP whale wallets (1M–10M tokens) have been steadily growing, now holding 9.44% of the total supply, up from 8.24% just months ago. That’s not retail frenzy - it’s big money-making long-term bets.

Ripple also recently pulled the plug on its quarterly market reports, ending an eight-year tradition. The reason? They were being misused in the SEC’s lawsuit against them. In other words, XRP is ditching the PR fluff and focusing on strategy.
This isn’t a bull market. It’s a transition.
What we’re seeing across Bitcoin, Ethereum, and XRP isn’t just another cycle of greed and FOMO. It’s something deeper.
- Whales aren’t dumping - they’re coordinating.
- Institutions aren’t ignoring - they’re allocating.
- Stablecoins aren’t just trading chips - they’re being used to mint tokenised U.S. Treasuries.
Crypto isn’t fighting for relevance anymore. It’s integrating into global finance, step by step, protocol by protocol.
Technical outlook: Has the suit and tie phase finally arrived?
Crypto’s meme era gave it attention, and its crash cycles gave it scars. But this current moment? It’s giving it legitimacy.
And unlike the bull runs of the past, this one isn’t being chased. It’s being engineered. At the time of writing, BTC has retreated from highs of $105,000 to current levels of around $103,900. The upside target is around $105,000, a price level that has been tested before, as upside pressure remains evident on the daily chart. However, volume bars indicate waning buy pressure. We could see a strong rebound or a bullish fakeout before a retreat. Important support levels to watch should we see a slump are $93,600 and $83,600.

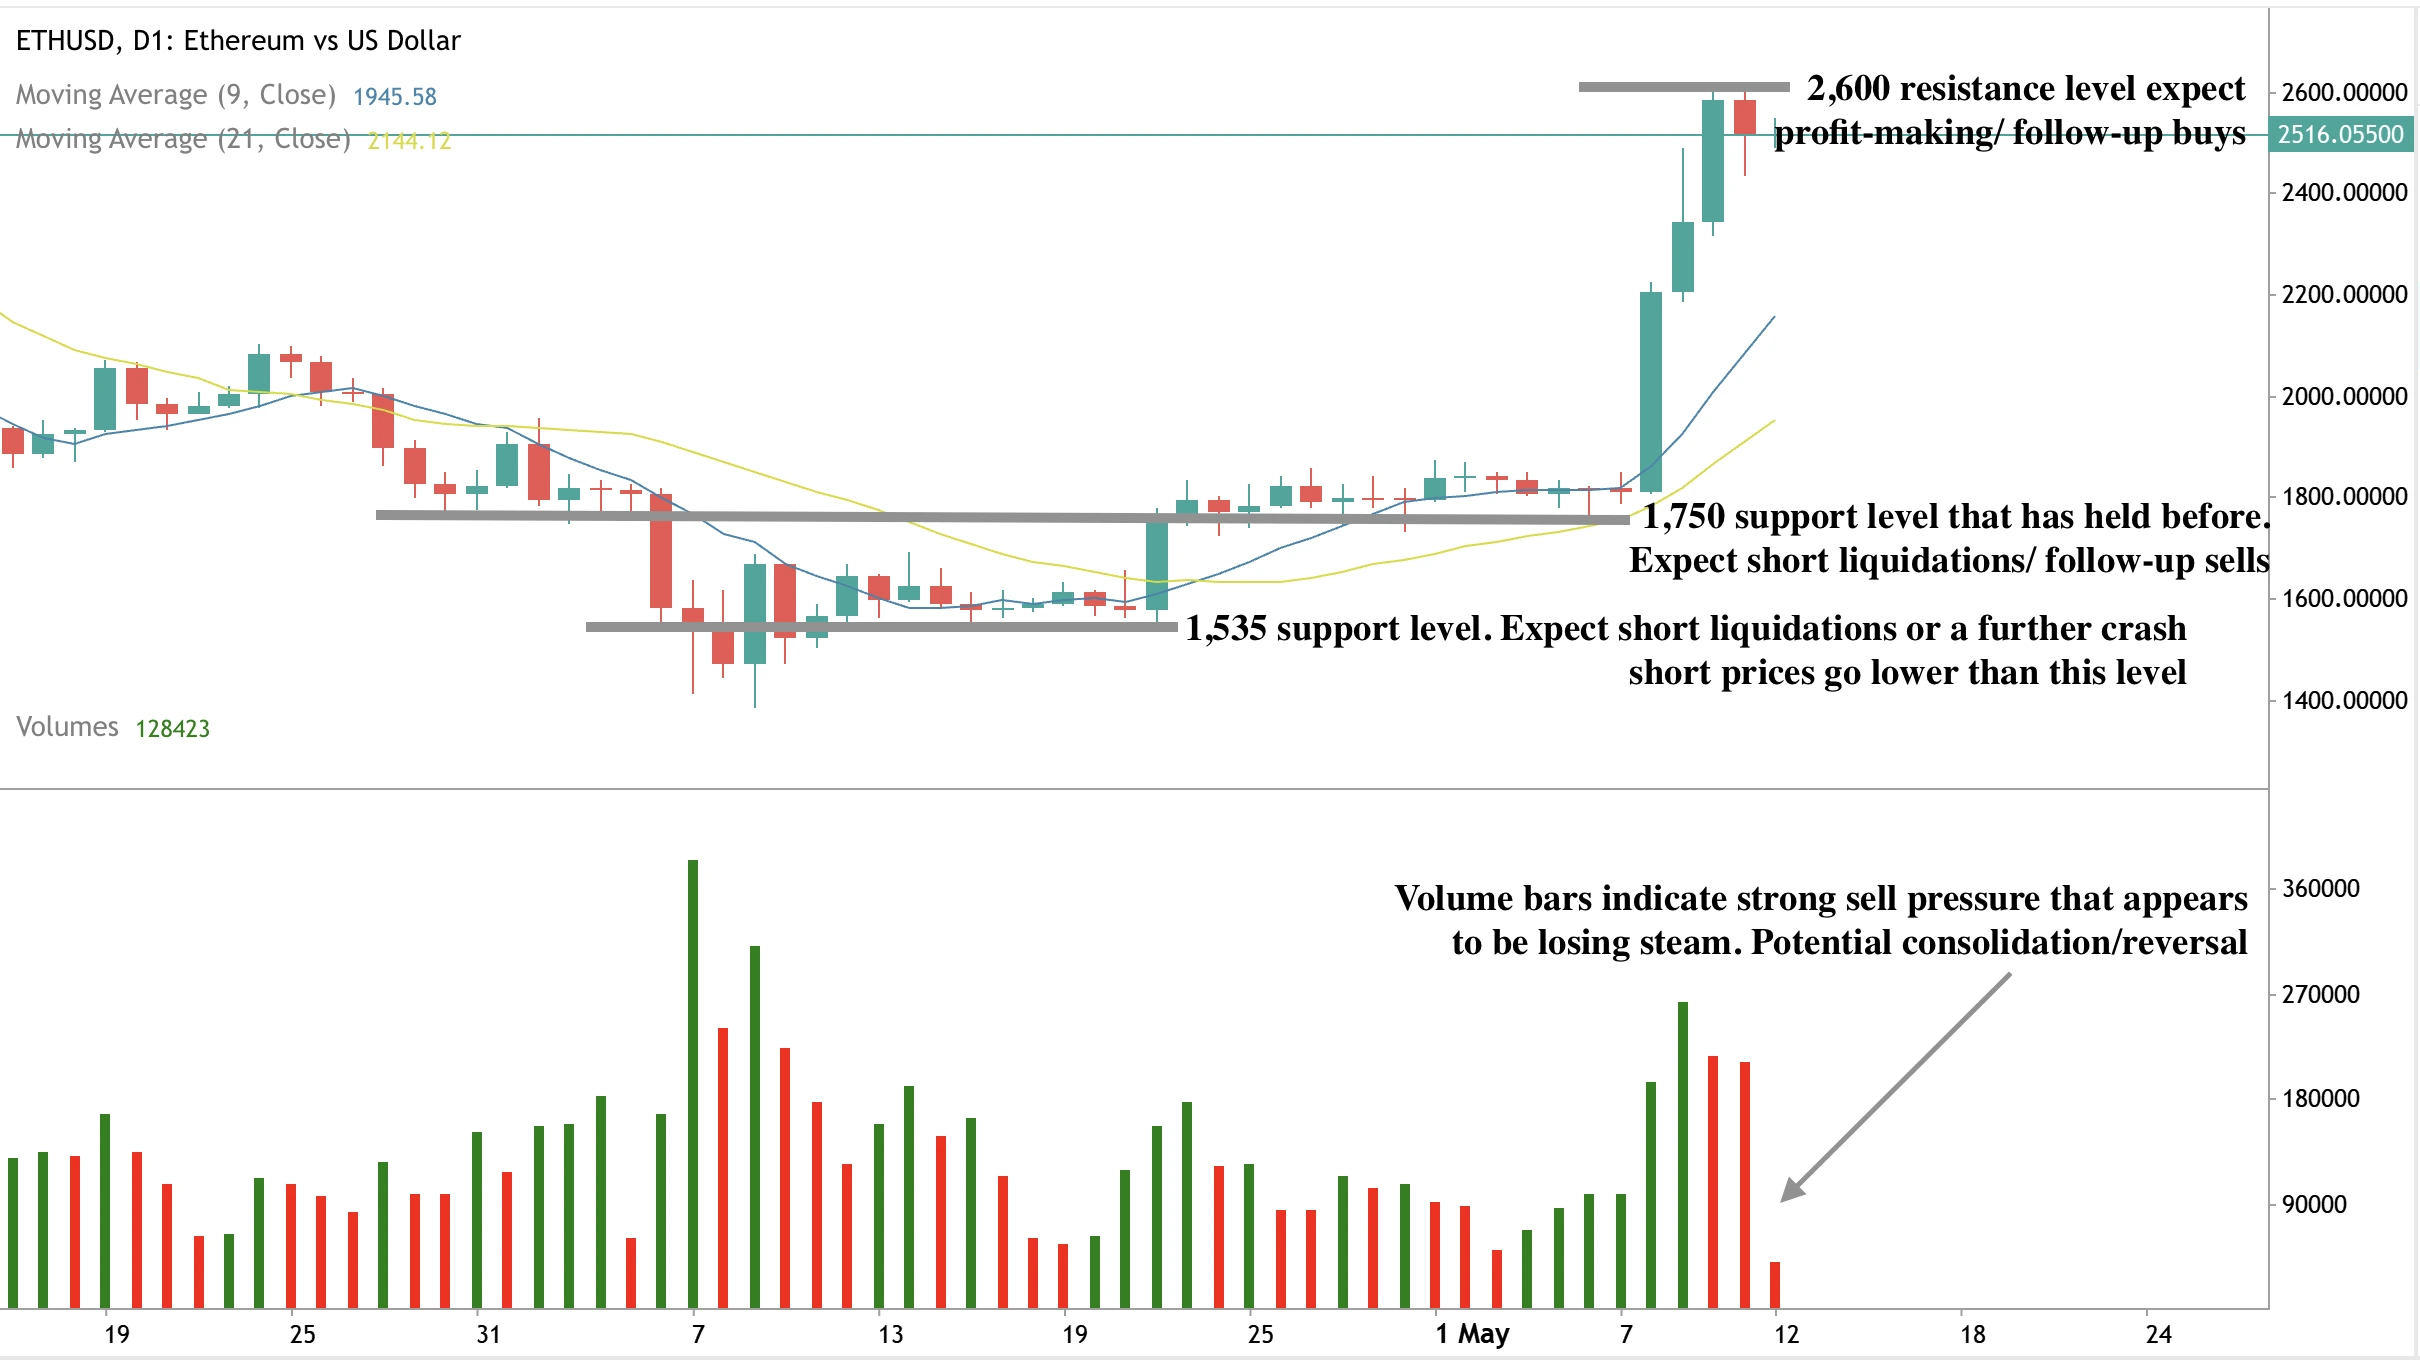
Ethereum has also seen strong bullish pressure with prices nearing the $2,600 resistance level. Recent price action has seen sellers take some control as indicated by the volume bars, however, the red volume bars getting smaller indicates waning sell pressure and a potential return to the bullish larger trend. Should sell pressure get rejuvenated, we could see a slump that gets held at the $1,750 support level. A further crash could get support at the $1,535 support level.
Looking to trade the crypto wave? You can speculate on BTC, ETH, XRP with a Deriv MT5 or Deriv X account.

Did the BoE just take its first step in a new rate-cutting cycle?
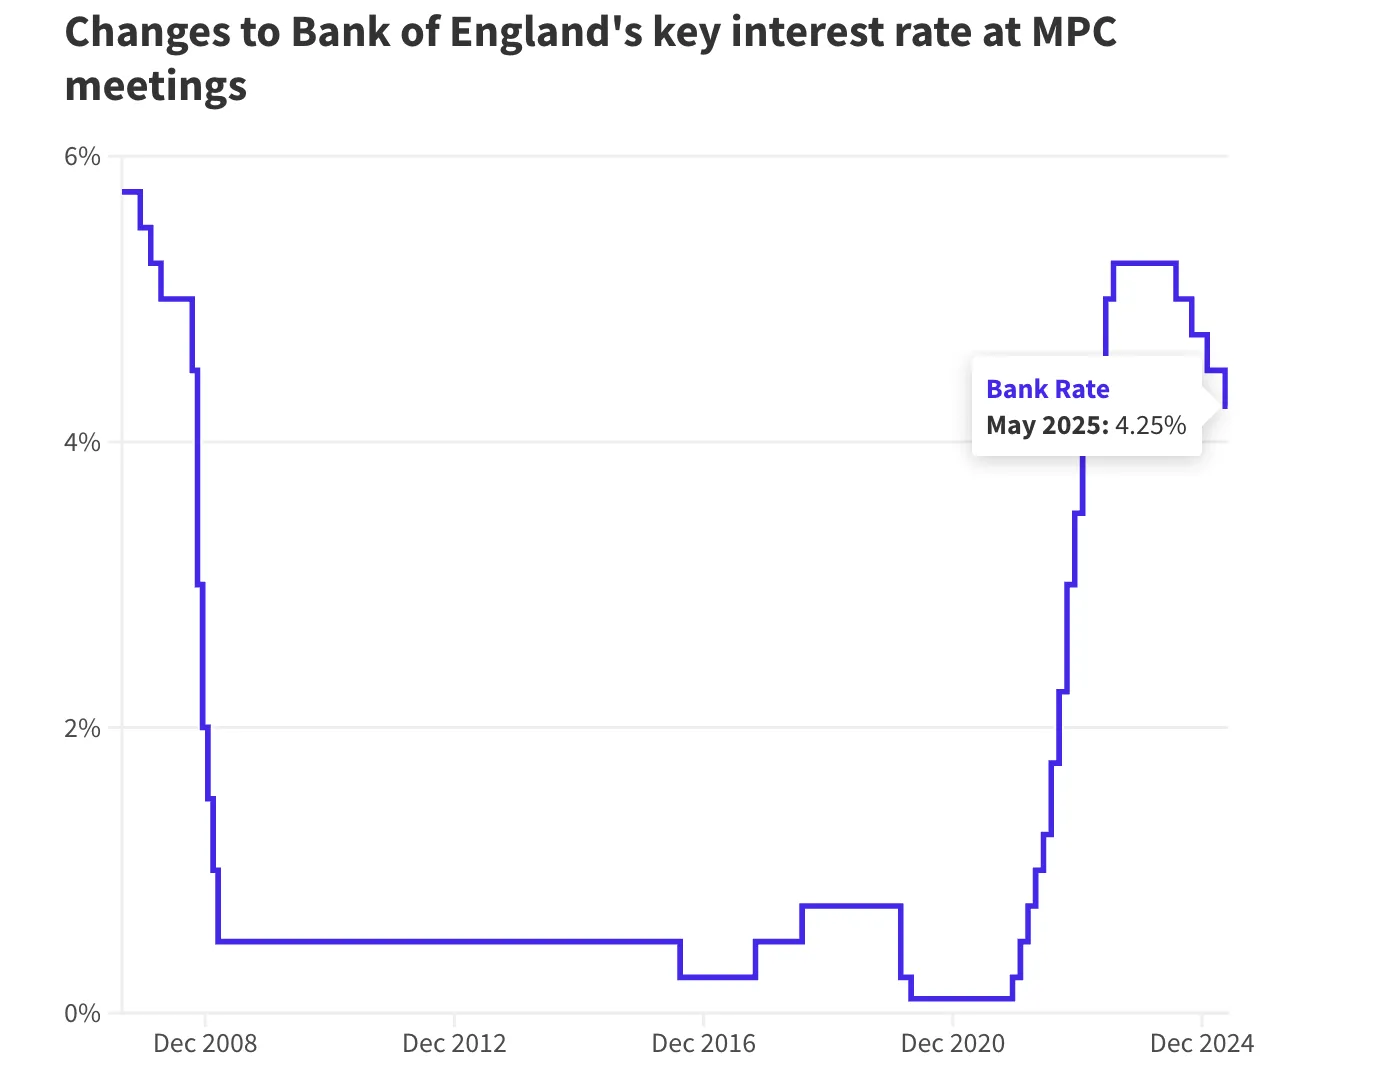
The Bank of England has made its move - a quarter-point interest rate cut to 4.25%.
Note: As of August 2025, we no longer offer the Deriv X platform.
The Bank of England has made its move - a quarter-point interest rate cut to 4.25%. But in today’s environment, even small moves carry big signals. While the cut was widely expected, the real question isn’t what the BoE did. It’s what they’re about to do next. Is this the start of a new rate-slashing cycle, or just a cautious one-off to keep the economy afloat?
A cut that says more than it looks
Yes, it was only 25 basis points. But the message behind the move is louder than the number itself.
Governor Andrew Bailey didn’t commit to a follow-up cut but left the door wide open. He emphasized the BoE is still on a “gradual and careful” path downward. That kind of phrasing is central banker code for we’re open to more cuts, but don’t hold us to a timeline.
Bank of England MPC vote
The Monetary Policy Committee split three ways:
- 5 voted for the 25-point cut
- 2 wanted a larger 50-point move
- 2 wanted no change at all
Translation? There’s no clear consensus. But pressure is mounting - both at home and abroad.
What’s moving the pound?
Initially, the Pound rose on the rate cut, as investors saw it as the BoE finally moving to support the economy. But the bump didn’t last. Markets quickly pivoted to the latest trade developments from the U.S., where President Trump announced what he called a “major breakthrough” in a U.S.-UK trade deal.
Sounds great, right? Not quite. A 10% tariff on UK imports is still set to return in July, keeping uncertainty high and dampening the Pound’s momentum.
GBP/USD remains above its 50-day moving average at 1.3061, but without real clarity on trade, holding that ground could be tough.
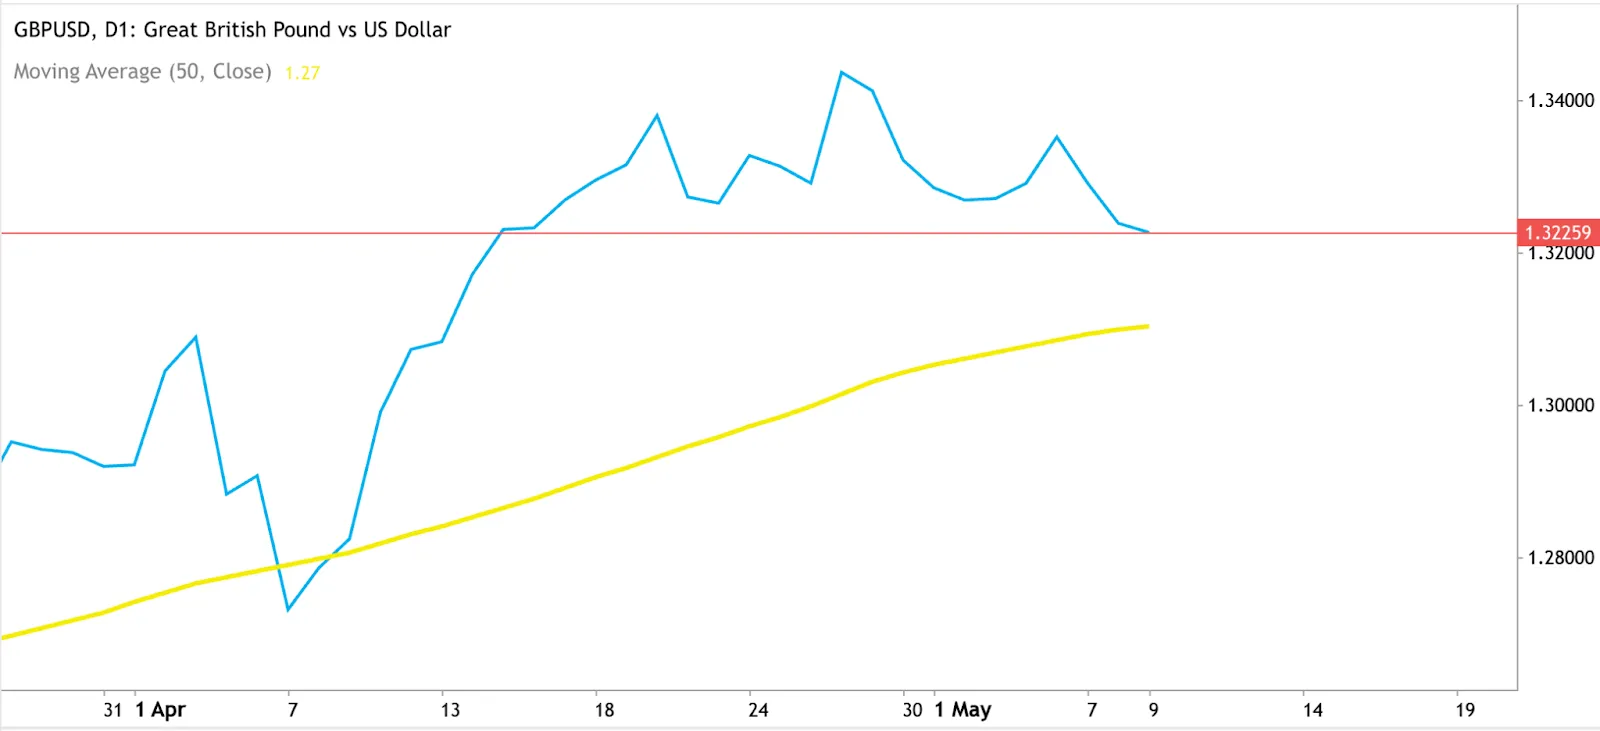
If Sterling can defend this level, it may aim again for the yearly high of 1.3445. But that climb will be steep if U.S. dollar strength continues to build on trade optimism and economic data.
Mortgages, markets, and your money
Homeowners with tracker mortgages are the big winners - about 600,000 households will see their monthly payments drop by an average of £29. Fixed-rate borrowers won’t feel the impact unless they’re refinancing soon, though falling market expectations for future rates could mean better deals ahead.
Borrowers in general may enjoy slightly cheaper loans and credit terms, while savers take the hit, earning less on their deposits just as inflation continues to nibble away at purchasing power.
Businesses may get some breathing room, especially small and medium-sized firms recently hit with higher wage costs and tax contributions. But most are still in “wait and see” mode, hesitant to hire or invest while economic signals remain mixed.
Meanwhile, in Japan…
USD/JPY is trading just below the 146.00 mark, caught in its own tug-of-war. On the one hand, Japanese household spending beat expectations, which should support future Bank of Japan (BoJ) rate hikes. On the other, real wages have fallen for three consecutive months—hardly a green light for tightening.
BoJ minutes from March revealed deep concerns over U.S. tariffs and how they might impact Japan’s export-driven economy. That, paired with a Fed that’s holding rates steady and a dollar boosted by falling jobless claims (down to 228K), creates a strong divergence: the U.S. dollar is backed by a steady central bank and solid data, while the yen remains stuck in caution.
Technical levels show USD/JPY supported at 144.78 and capped around 146.18. Traders watching this pair are essentially watching a central bank chess match unfold.
What’s the bigger picture?
The BoE expects UK inflation to rise to 3.5% temporarily, thanks to energy and household bill spikes, before easing later in the year as global oil and gas prices soften. Growth for Q1 2025 is expected to come in at 0.6%, boosted by U.S. companies stockpiling ahead of tariff deadlines.
But make no mistake: this rate cut isn’t a confidence signal. It’s a cautious, calculated move in an uncertain environment. Business confidence is fragile. Consumer sentiment is shaky. And international trade friction could easily tilt things in the wrong direction.
Governor Bailey was frank: the UK still has a long way to go before it returns to pre-crisis growth levels. Chancellor Rachel Reeves welcomed the rate cut but reminded everyone that households are still feeling the pinch from a high cost of living.
So, is this the start of a new cutting cycle?
Possibly. But don’t expect back-to-back rate slashes. The BoE is clearly playing the long game - balancing fragile growth, sticky inflation, and global instability. If inflation cools faster than expected and global risks worsen, further cuts are likely. But if price pressures resurface or the Fed starts leaning hawkish, the BoE might hold the line.
This isn’t an aggressive pivot - it’s more of a soft step. But it could very well be the first in a slow, steady sequence.
GBP/USD forecast
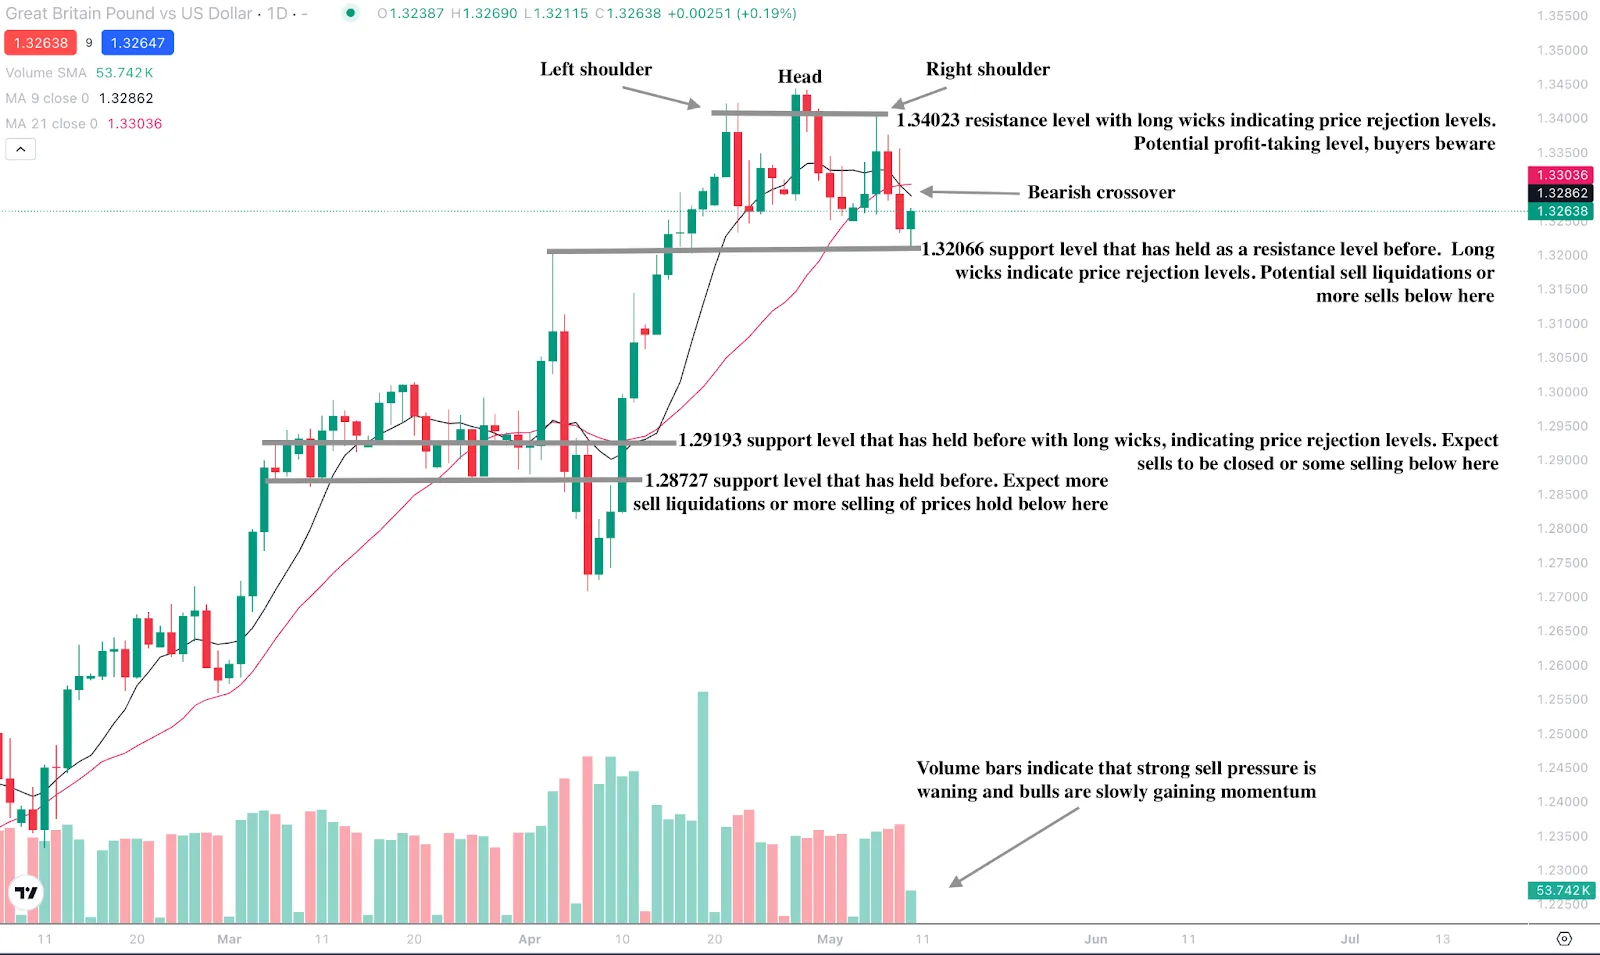
At the time of writing, the pair is seeing heavy sell pressure as the pound loses ground to the dollar. A recent bearish crossover hints that the pair could slide further. However, the sell volume bars contracting, on the other hand, tells a story of diminishing sell pressure. The head and shoulder pattern coming into play adds to the bearish narrative.
Should prices continue their slide, they could find support at the $1.32066, $1.29193, and $1.28727 price levels. If a price bounce materialises, prices could encounter resistance at the $1.33464 and $1.34023 price levels.
Looking to trade GBPUSD post-BoE? You can speculate on their price trajectory with a Deriv MT5 or Deriv X account.

Trump’s next move post-Fed could keep the gold rally alive
Donald Trump’s got markets on a rollercoaster again - and investors are holding their breath. Fresh off the Federal Reserve’s hawkish pause, all eyes are now on Trump’s next bold step in the ongoing U.S.-China trade showdown.
Note: As of August 2025, we no longer offer the Deriv X platform.
Donald Trump’s got markets on a rollercoaster again - and investors are holding their breath. Fresh off the Federal Reserve’s hawkish pause, all eyes are now on Trump’s next bold step in the ongoing U.S.-China trade showdown.
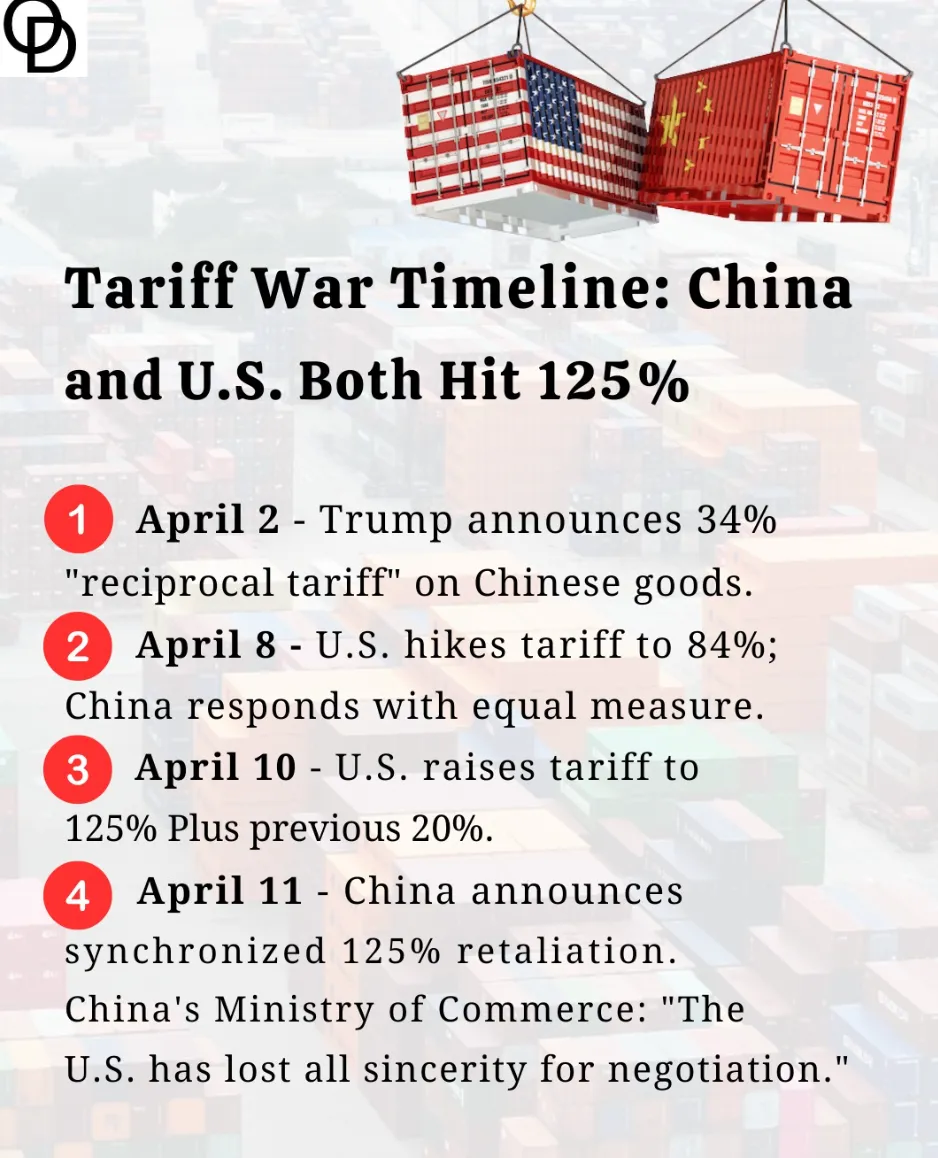
Forget calm and predictable: Trump just declared he has zero intentions of easing the hefty 145% tariffs on Chinese imports to bring China back to the negotiating table. Buckle up because this ride is far from over.
Trade Tariffs, tweets, and talks
Despite high-level discussions scheduled this weekend in Switzerland, featuring U.S. heavyweights Treasury Secretary Scott Bessent and Trade Representative Jamieson Greer, Trump isn’t budging - at least not publicly. “We don’t have to sign deals,” Trump bluntly remarked, shifting pressure onto China.
Just days earlier, he teased flexibility, saying tariffs might eventually be reduced "because otherwise, you could never do business with them.” Mixed signals much?
The current tariff war has been escalating since early 2023, with tariffs progressively jumping from 25% to a staggering 145%, marking one of the sharpest trade confrontations in recent memory.
This whiplash-inducing rhetoric leaves markets jittery, especially as China quietly exempts some U.S. goods from its retaliatory tariffs, aiming to lower temperatures without losing face. Meanwhile, Trump’s threats are expanding: pharmaceuticals and even foreign-made movies could soon face steep tariffs. Ford has already raised alarm bells, warning of significant disruptions from the ongoing trade war.
Safe havens shine bright: Post-Fed gold rally
Amid this chaos, investors are seeking shelter, and gold is happily stepping into the spotlight again. After briefly slipping following the Fed’s announcement, the precious metal quickly found fresh appeal as economic anxieties resurfaced. Investors, wary of a weakening dollar amid Trump’s unpredictable policies, are pouring back into gold, keeping the rally alive.
Bitcoin is joining the safe-haven party too. Often dubbed digital gold, Bitcoin surged nearly 2%, edging toward the $96,700 mark.
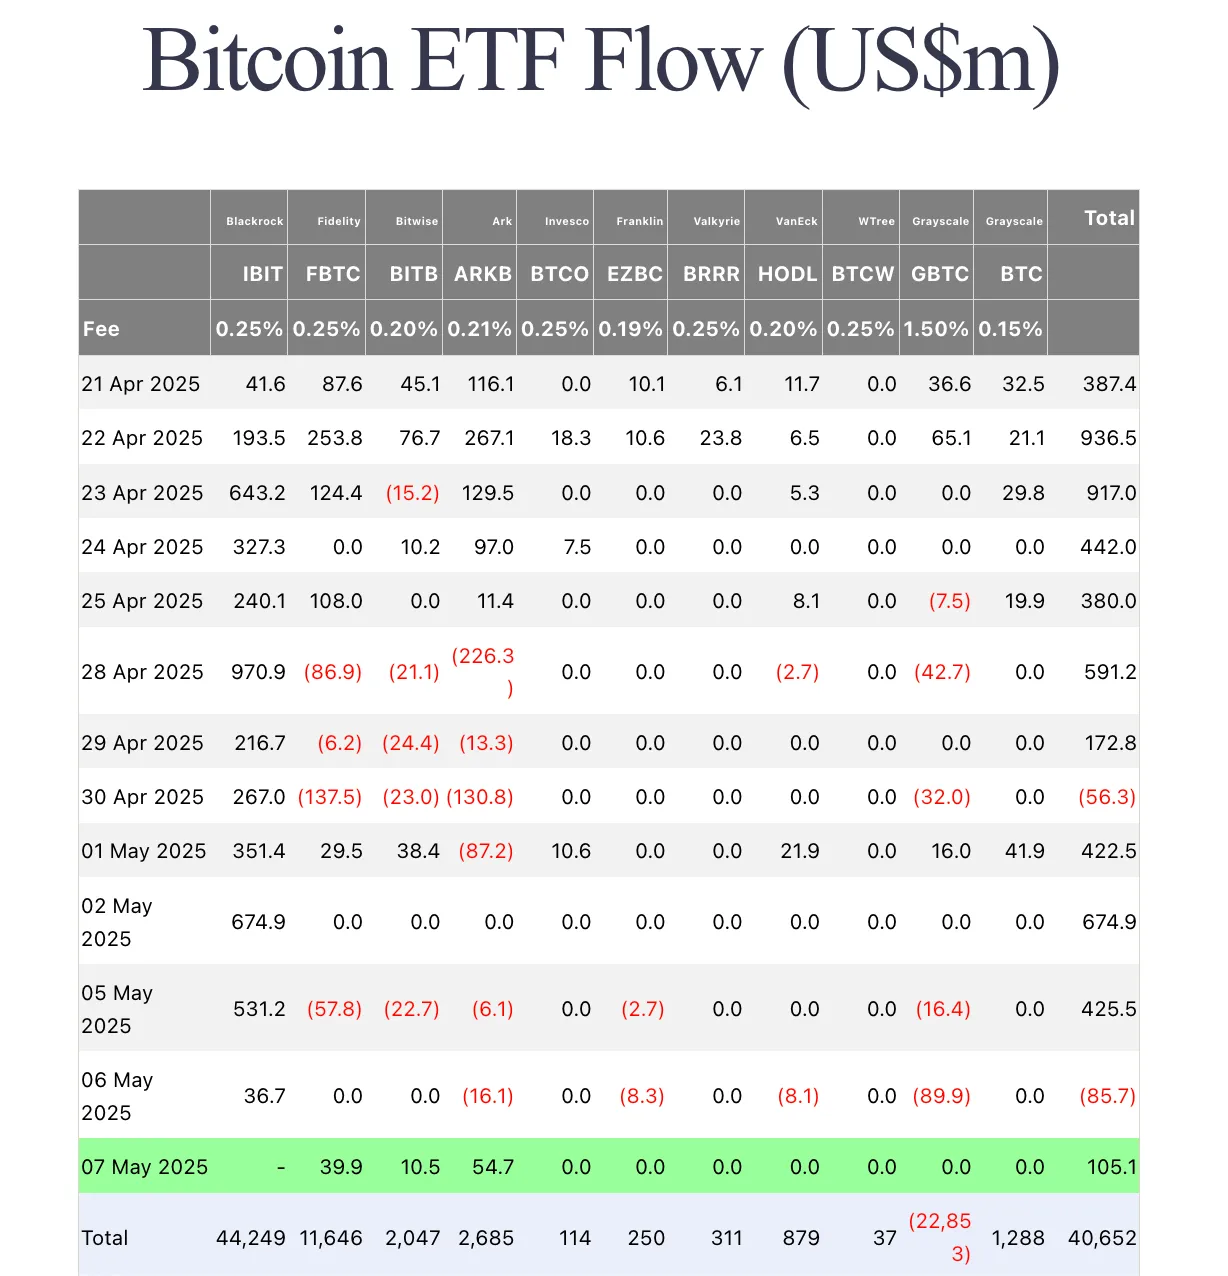
Bitcoin ETF inflows
Data from Farside highlighted this bullish sentiment, showing that after a sharp $85 million outflow on Tuesday, the US Bitcoin ETF attracted over $105 million in inflows following the Fed’s decision on Wednesday. Clearly, investors are hedging their bets, diversifying into digital assets amid ongoing economic turbulence.
Meanwhile, the World Gold Council reported central banks from China, Poland, and the Czech Republic increased their bullion reserves in April, reinforcing gold’s reputation as a reliable global safe haven during uncertain times.
Global watch: Japan joins the wait-and-see crowd
In Japan, central bankers are cautiously watching Trump’s moves unfold. Minutes from the Bank of Japan’s latest meeting show readiness to hike rates if economic and inflation goals are hit. Yet BoJ members stressed the need for cautious decisiveness, mindful that the U.S. policy twists could ripple through global markets.
As Trump continues to play hardball on the global economic stage, investors remain alert - and defensive. With no immediate end to the trade turbulence in sight, gold and Bitcoin are poised to remain attractive havens, proving once again that when markets shake, safety shines.
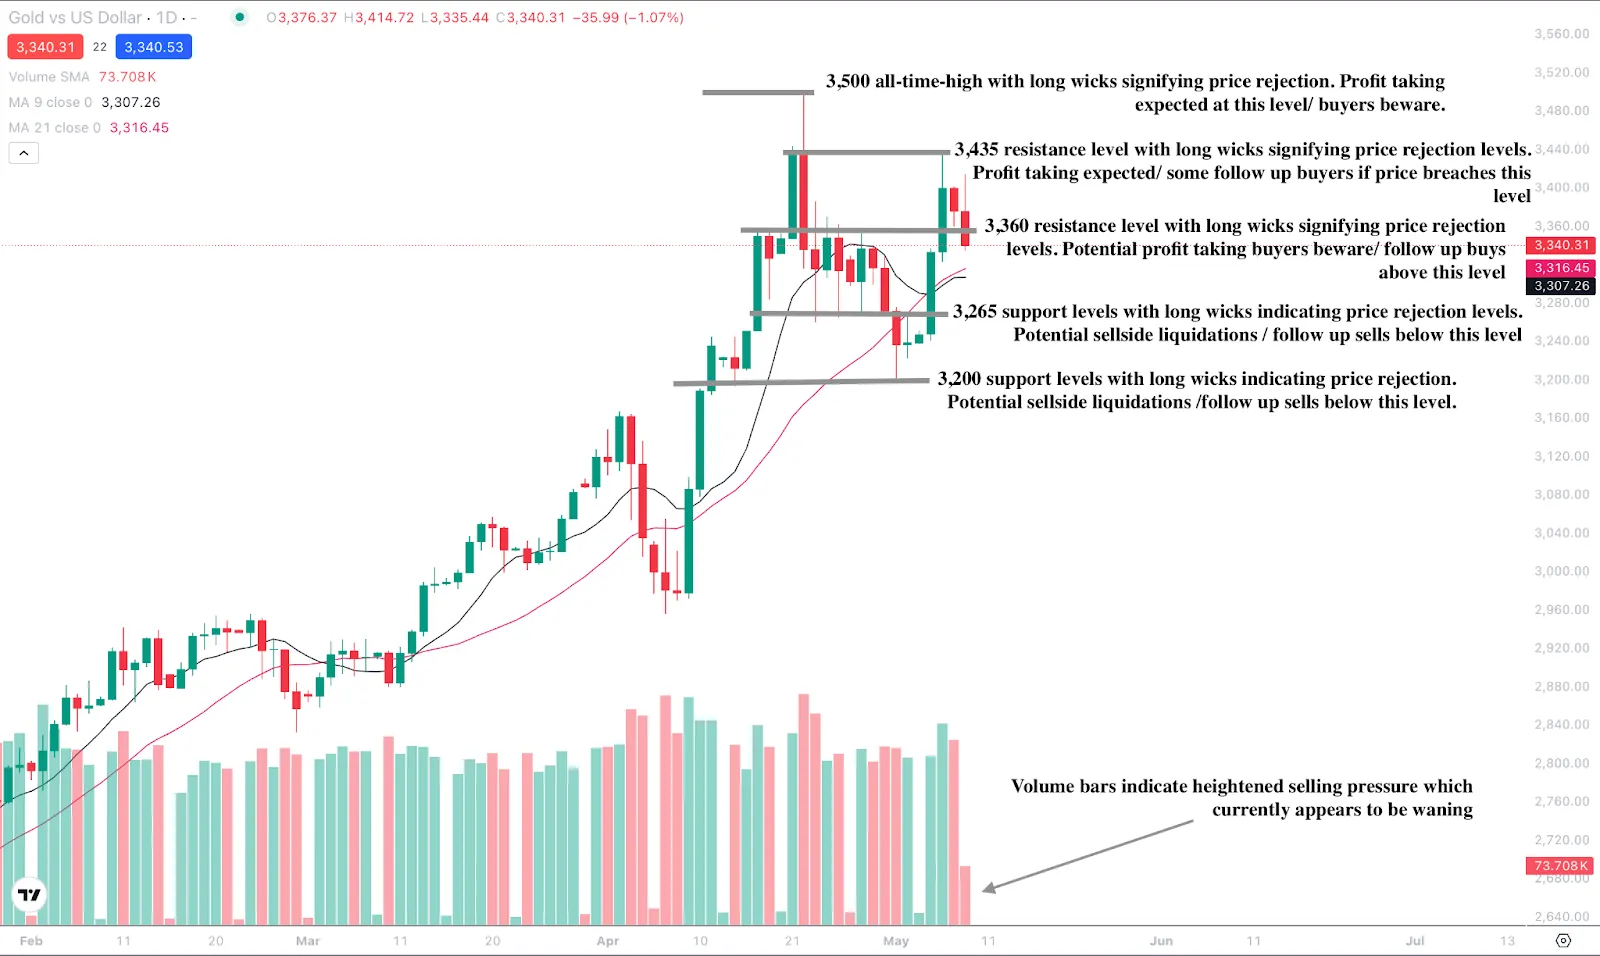
Gold technical analysis
Gold has recently displayed strong buy momentum on the daily chart, which was followed up by strong downside momentum. Volume bars tell the story of heightened bearish pressure, which appears to be waning. Should prices continue to slide, they could find support at the $3,265 and $3,200 support levels. If we see a rebound, prices could encounter resistance at the $3,360, $3,435, and $3,500 resistance levels.
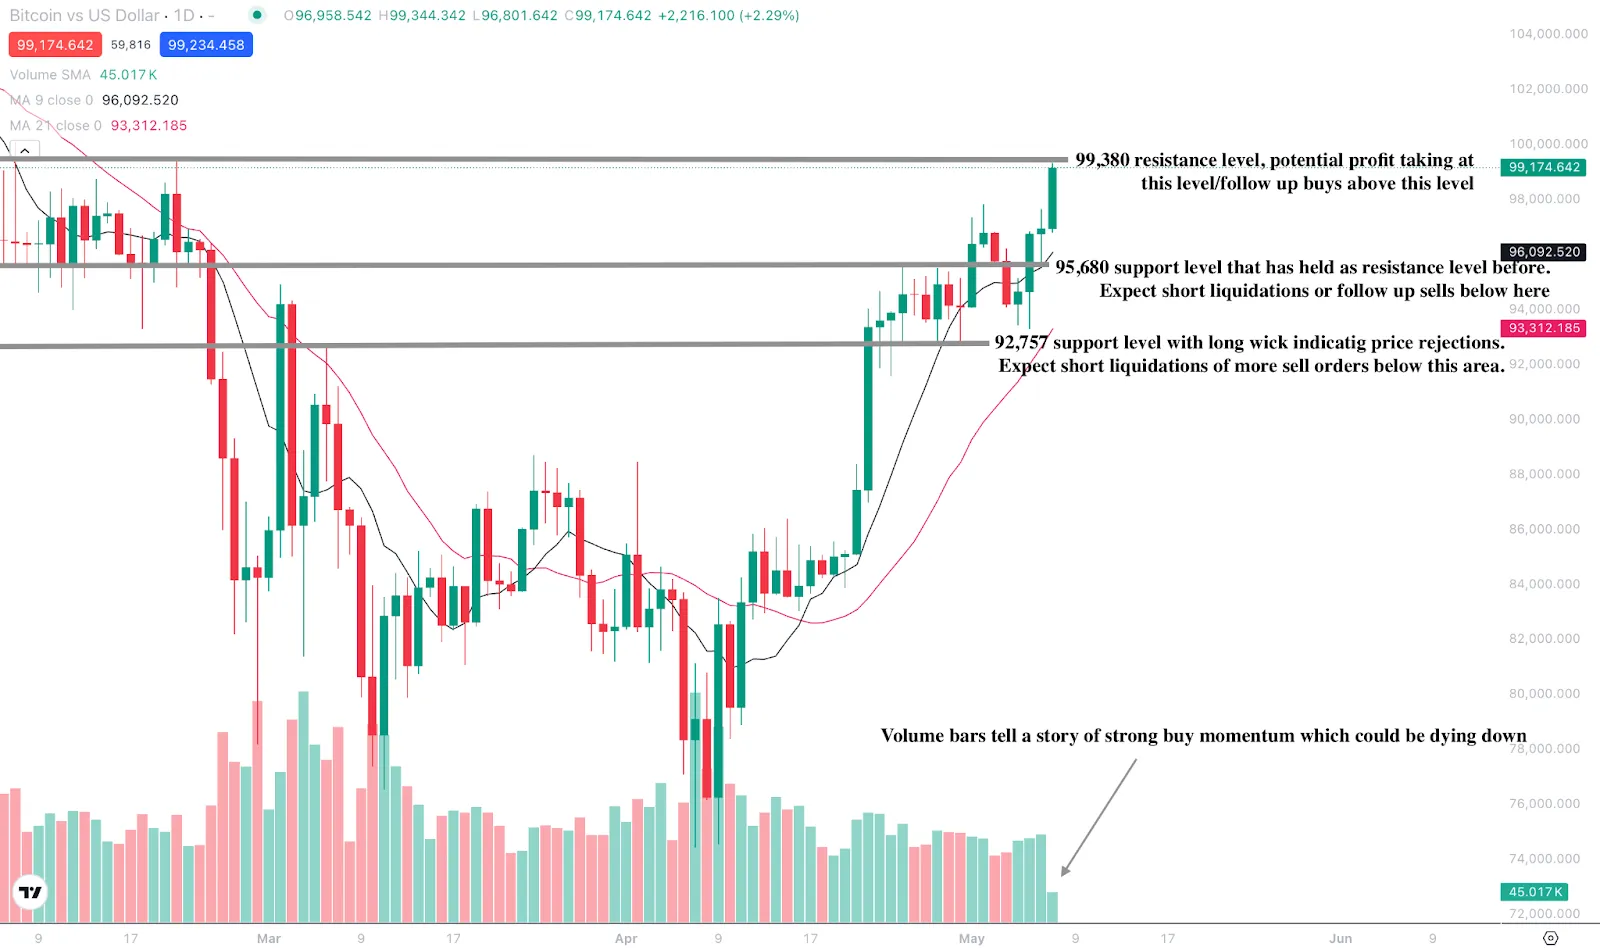
Bitcoin technical analysis
Bitcoin, on the other hand, has been displaying bullish signals, with bulls looking to return to highs of $100,000. Volume bars indicate that bullish momentum may be waning, so we could see a dip before a decisive move towards $100,000. Before racing towards $100,000, bulls will have to navigate the $99,380 resistance level, which could see significant profit-taking. On the downside, if prices see a slide, they could be held at the $92,680 and $92,757 support levels.
Looking to ride Gold’s and Bitcoin’s highs? You can speculate on their price trajectories with a Deriv MT5 or Deriv X account.
.webp)
Gold price surge: How high can it ride the risk-off wave?
Gold is having a moment - again - and the reasons are anything but surprising. As global tensions flare and economic uncertainty clouds the outlook, investors are doing what they’ve always done in times of turmoil: seeking shelter in the world’s oldest safe haven.
Note: As of August 2025, we no longer offer the Deriv X platform.
Gold is having a moment - again - and the reasons are anything but surprising. As global tensions flare and economic uncertainty clouds the outlook, investors are doing what they’ve always done in times of turmoil: seeking shelter in the world’s oldest safe haven.
This week, gold (XAU/USD) surged over 2%, rebounding from recent lows near $3,200 to trade above $3,320. The move is hardly surprising. Between geopolitical flashpoints, erratic trade policy, and nervous markets, gold is once more proving that it thrives in the chaos.
Gold nears record high on geopolitical concerns
Much of the recent demand is driven by the volatile geopolitical landscape. The conflict between Russia and Ukraine remains unresolved, with President Vladimir Putin declaring that Russia has the means to bring the war to a "logical conclusion" as he announced a short-term ceasefire.
Meanwhile, the Middle East is teetering on the edge, following a ballistic missile strike on Israel’s Ben Gurion Airport by Houthi rebels. Israel’s Prime Minister, Benjamin Netanyahu, has promised retaliation and warned Iran of consequences, while Iran has vowed to respond if provoked. These developments are keeping geopolitical risk elevated - and gold loves risk.
Adding to the instability, former US President Donald Trump continues to make headlines. Over the weekend, he unveiled a 100% tariff on foreign-produced films and even floated the idea of potential military action to seize control of Greenland. Markets, unsurprisingly, are unsettled by this unpredictable rhetoric, especially as it coincides with growing uncertainty about the direction of US economic policy.
The fed holds steady as markets brace for impact
While international headlines dominate, domestic policy is playing its part too. Trump has once again criticised the US Federal Reserve and its chairman, Jerome Powell, calling him “stiff” and urging the central bank to cut interest rates. The Fed, however, appears to be standing firm for now.
According to CME’s FedWatch Tool, there is only a 4.4% chance of a rate cut at this week’s meeting.

This ongoing tension between political pressure and central bank caution is leaving the US dollar subdued and Treasury yields restrained - both of which support the gold price. Despite some upbeat economic data, including a stronger-than-expected April jobs report and a rise in US service sector activity, markets remain uneasy.
In fact, the ISM’s Prices Paid index surged to its highest level since February 2023, suggesting inflationary pressures may be resurfacing. All of this contributes to an environment in which gold can thrive. Technically, the metal has cleared key resistance and now appears poised to test higher levels.

A move towards $3,400 - or even $3,500 - would not be out of the question if geopolitical tensions deepen or if the dollar continues to weaken. That said, any unexpected shift from the Fed or a sudden de-escalation in global conflicts could prompt a pullback. For now, though, the momentum is with the bulls.
Bitcoin cools, but institutional confidence grows
Of course, gold isn’t the only so-called safe haven in play. Bitcoin, often described as “digital gold”, is navigating its own storm.
After rallying earlier this month, BTC has retreated to around $95,000, down from recent highs near $97,700. On-chain data suggests many investors are locking in profits, contributing to the recent dip. Metrics like Santiment’s Network Realised Profit/Loss and Glassnode’s MVRV ratio point to a consolidation phase, with the latter falling back to 1.74 - historically associated with cooling periods.
Still, the institutional appetite for Bitcoin appears undiminished. Bitcoin ETFs recorded $1.8 billion in inflows last week alone, continuing a three-week streak that has drawn in $5.5 billion in total. Strategy, a Bitcoin-focused firm, purchased nearly 1,900 BTC for $180 million and raised its 2025 performance targets, while Semler Scientific and Thumzup Media also ramped up their holdings. This steady stream of institutional buying suggests confidence in Bitcoin’s long-term trajectory, even as retail investors take profits in the short term.
So, how far can gold ride this risk-off wave? If current trends persist, the metal may be on course to break new ground. While the journey won't be without volatility, the underlying forces - rising global tensions, political pressure on central banks, and persistent economic uncertainty - continue to favour gold.
As for Bitcoin? It may be wobbling, but with heavyweight backers piling in, its next move might not be far behind.
In a world where unpredictability is the new normal, gold’s quiet strength is making plenty of noise.
Gold price forecast
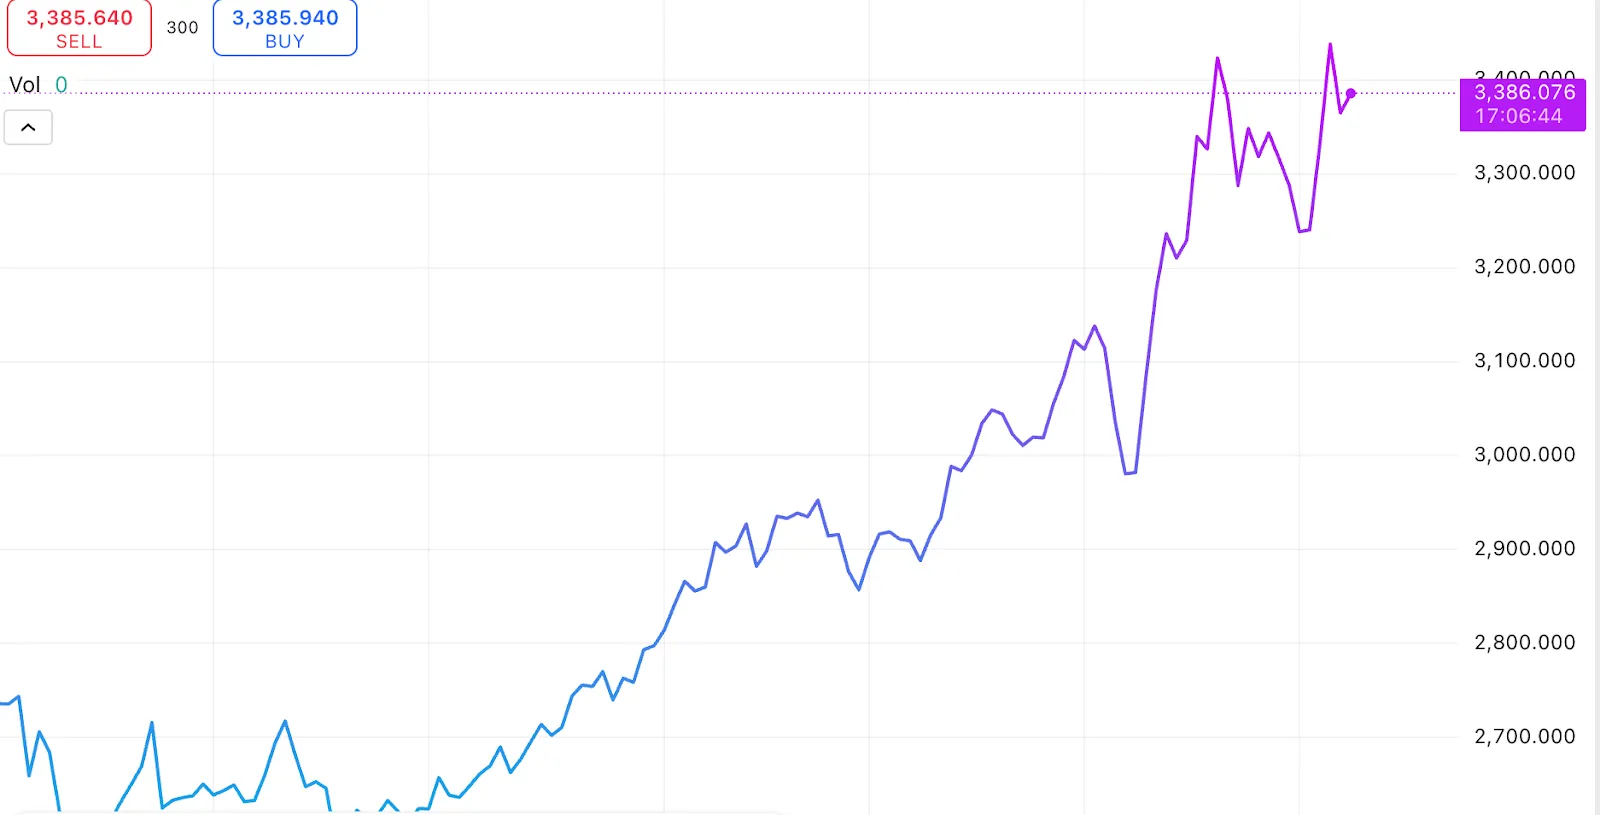
At the time of writing, Gold has surged past $3,300, with bullish pressure evident. A recent bullish crossover adds to the bullish narrative, though the volume bars hint that buy pressure could be potentially slowing down. Should the upward movement continue, prices could find resistance at the $3,385 and $3,500 all-time highs.

Bitcoin, on the other hand, has been in correction mode, with recent sell pressure evident on the daily chart. Volume bars indicate strong buy interest remains, though it could be waning. Should prices continue sliding, prices could find support at $93,000 and $80,000 in case of a collapse.

Looking to ride Gold’s and Bitcoin’s highs? You can speculate on their price trajectories with a Deriv MT5 or Deriv X account.
.webp)
What the market knows about Tesla and Nvidia that headlines miss
If you just skim the headlines, you’d think the shine is coming off two of the market’s most hyped names: Tesla and Nvidia. But while the headlines yell "trouble," the market is doing something very different.
Note: As of August 2025, we no longer offer the Deriv X platform.
If you just skim the headlines, you’d think the shine is coming off two of the market’s most hyped names: Tesla and Nvidia.
Tesla reported a 71% profit collapse and a 9% revenue drop. Nvidia pulled back from record highs amid signs of demand softening, rising competition, and export uncertainty.
But while the headlines yell "trouble," the market is doing something very different.
Investors are doubling down. Why? because they see past the panic to a bigger picture that’s being overlooked - a future defined by AI, data dominance, and massive platform potential.
Tesla Is losing margin today to build a moat for tomorrow
Tesla’s Q1 was rough - no doubt. Profits plunged. Revenue dropped. Consumer sentiment took a hit, and competition in the EV space is heating up.
And yet, the stock rallied.
That surprising reaction came down to Elon Musk signaling he’s refocusing on Tesla. By stepping back from his controversial government advisory roles and recommitting to the company, Musk sent a message investors wanted to hear: Tesla still has visionary leadership pushing its transformation forward.
But this isn't just about Musk’s presence. It’s about Tesla’s pivot to AI.
“Tesla is increasingly an AI and robotics company,” Musk said, reframing the company’s identity from carmaker to autonomous mobility platform.
While Tesla has a long history of overpromising on Full Self-Driving (FSD) - Musk even jokingly calls himself "the boy who cried FSD" - the upcoming June launch of unsupervised FSD in
Tesla AI robotaxi future
Austin is a significant milestone. It also coincides with plans to begin volume production of Tesla's purpose-built Cybercab robotaxi in 2026.
Yes, there are plenty of reasons to be cautious:
- The commercial scalability of robotaxis remains unproven
- Regulatory challenges still loom large
- Past delays make it hard to take timelines at face value
But Tesla isn’t alone in missing deadlines. Ford and GM both made big robotaxi promises and have since retreated. In fact, GM ended its program and is cutting $1 billion in costs as a result. The space has thinned, but Tesla is still charging forward, and that’s significant.
Tesla’s advantage? Scale, data, and vertical integration.
- Tesla already has millions of cars on the road collecting real-world driving data - something competitors like Waymo or Cruise simply don’t.
- It has the production scale to lower unit costs and introduce cheaper EV models, improving accessibility and adoption.
- Even Alphabet’s CEO Sundar Pichai has publicly discussed the future of robotaxis with optional personal ownership, hinting that Tesla’s "fleet of the future" could align with how consumers think about autonomy.
And unlike early-stage growth stocks still searching for a market, Tesla is already the EV leader. It’s not a moonshot trying to prove its concept - it’s an incumbent trying to evolve it.
As one analyst put it:
“Tesla is a growth stock, but it’s not your typical speculative play. It’s already winning, already profitable, and just happens to be aiming much, much higher.”
Nvidia’s pullback end or reset?
Meanwhile, Nvidia - the undisputed champion of the AI chip world - has pulled back from its dizzying highs. The trigger? A flurry of headlines warning of rising threats:
- DeepSeek’s AI breakthrough that could lower model training costs
- Export restrictions introduced by the Trump administration
- Super-micro's revised guidance, pointing to demand delays
- Growing momentum for in-house chip development by cloud giants
And yes, Nvidia’s growth is slowing - from 114% revenue growth in fiscal 2025 to 65% projected in Q1 2026. With a P/E of 36 and a price-to-book ratio of 33, it’s easy to argue the stock looks expensive.

But zoom out.
The data center segment alone generated $115 billion of the $130 billion in revenue in 2025. In Q4, that segment grew 93% year over year, and AI chips now account for over 90% of total revenue.
Nvidia AI chip market dominance
And more importantly, demand isn't dying - it’s evolving.
- Microsoft confirmed it will maintain an $80 billion capex plan for AI data centers
- Meta just increased its 2025 capex outlook to as much as $72 billion, mostly for AI infrastructure
- AI chip demand is forecast to grow at 29% CAGR through 2030, according to Grand View Research
Nvidia still commands 85% of the high-performance AI chip market. Competitors aren’t just racing to match its current Blackwell architecture - they have to prepare for Rubin, the next-generation chip coming in 2026.
Its CUDA software ecosystem, ecosystem lock-in, and pace of innovation keep Nvidia two to three years ahead of its challengers.
And financially? The company is still crushing it. Non-GAAP EPS rose 71% in Q4, and it has exceeded earnings expectations for four consecutive quarters. Analysts project 48% and 24% revenue growth in fiscal 2026 and 2027, respectively.
Tesla and Nvidia: Two giants, one megatrend
Tesla and Nvidia have different business models, challenges, and personalities. But they share something crucial: They are both betting on - and building on - the future of AI.
- Tesla is transforming into an autonomous mobility and robotics company, leveraging its fleet and data to dominate the future of self-driving transport
- Nvidia is the foundational infrastructure of the AI revolution, powering everything from ChatGPT to enterprise-scale AI deployments
Yes, the valuations are steep, and yes, execution risk is real. But compared to speculative growth plays with no customers, scale, or profits, Tesla and Nvidia offer a vision grounded in dominance.
The market isn’t blind to their risks. It just understands their rewards better than the headlines do.
Tech stock market analysis: Focus on Tesla and Nvidia
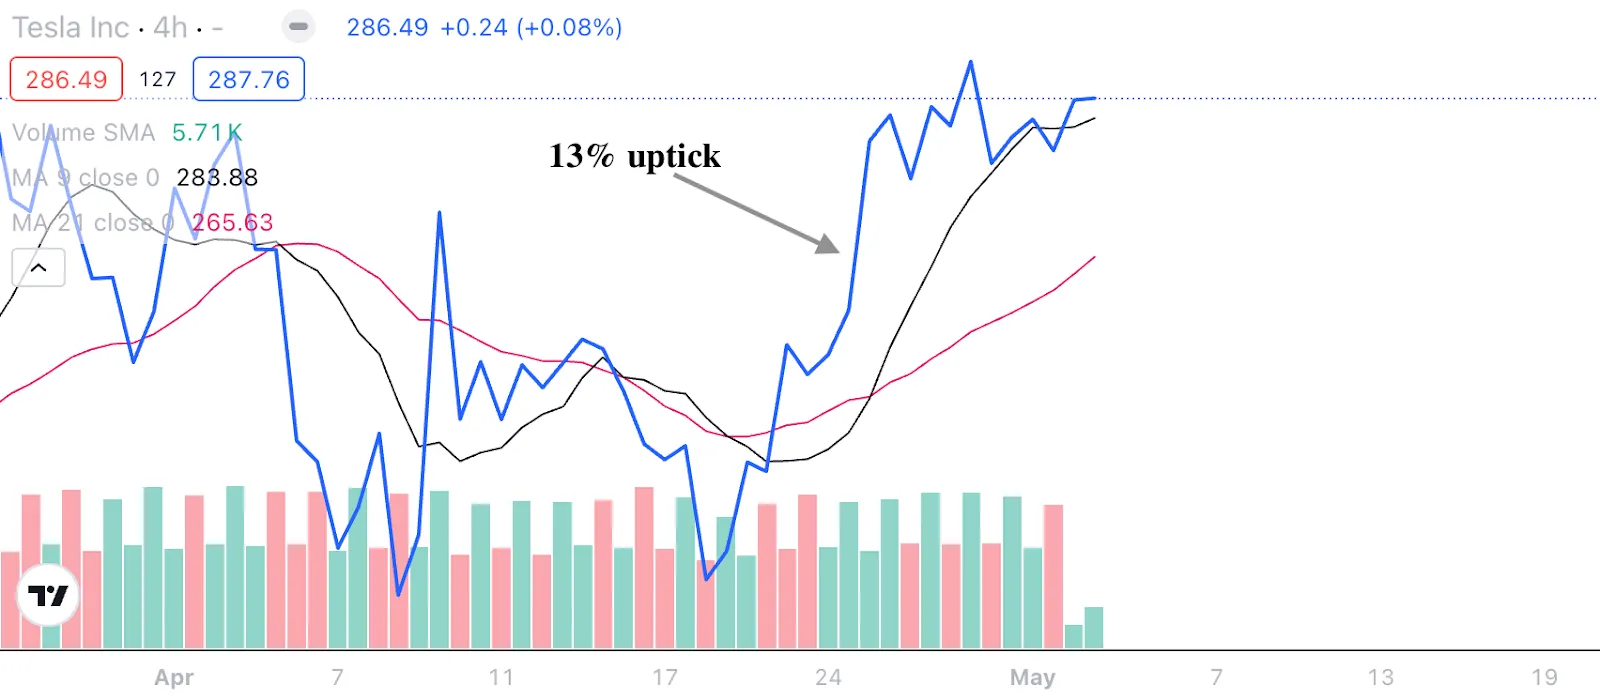
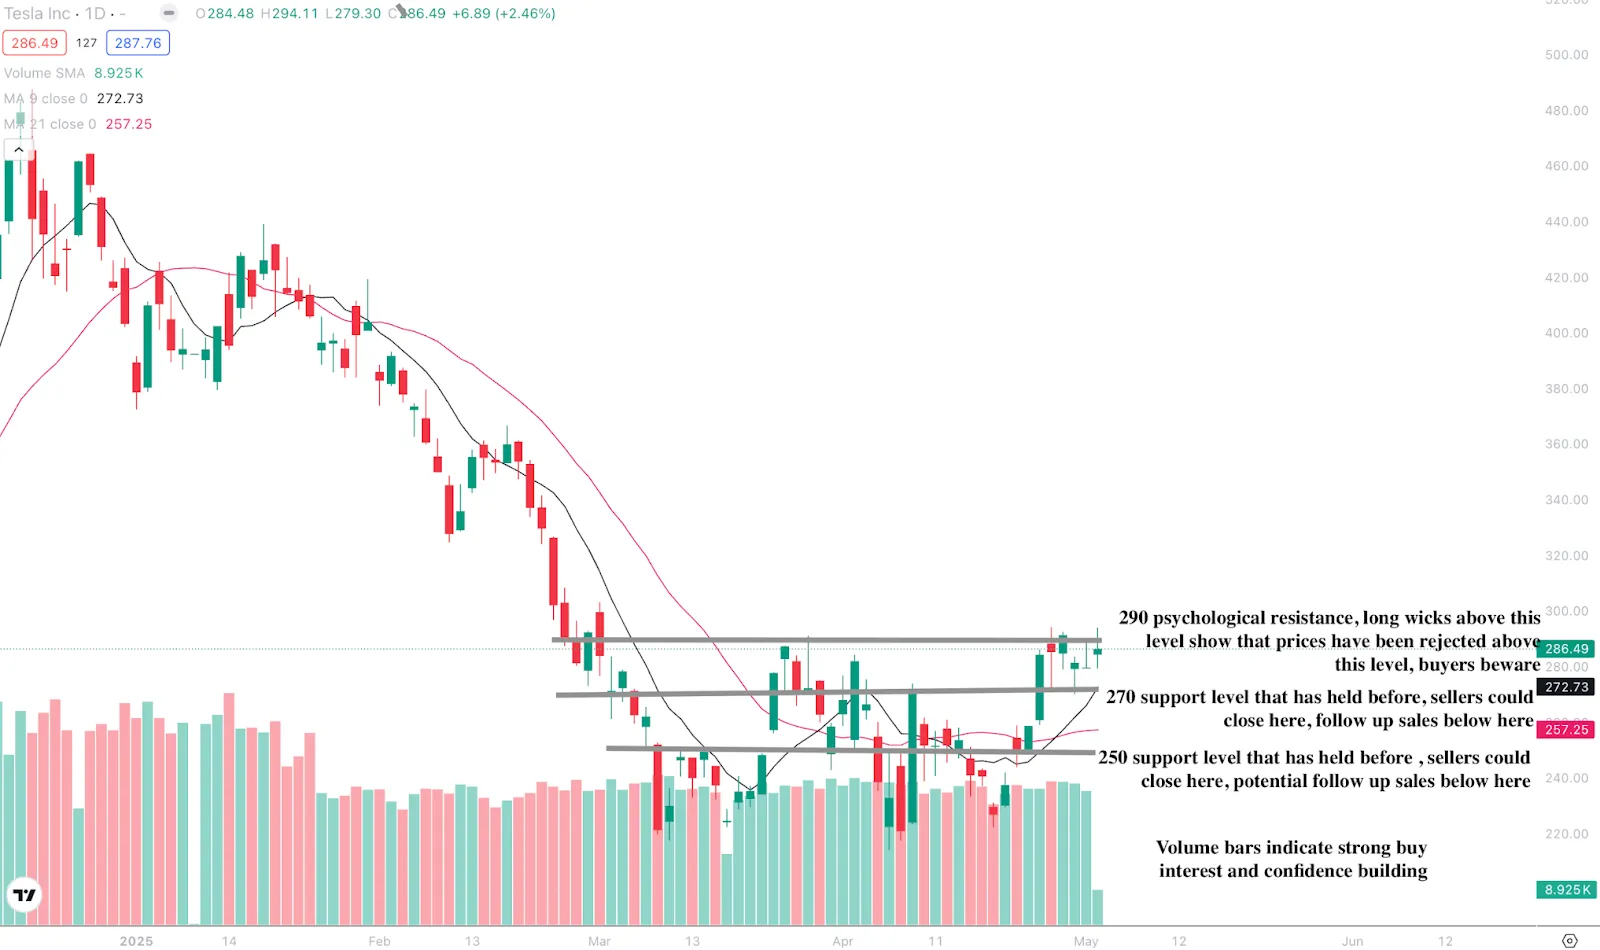
At the time of writing, Tesla stock is holding at a resistance level, with a move above this level potentially triggering follow-up buys. A recent bullish crossover indicates that we are still in buy territory, but the volume bars below tell a story of bulls still in a cautious state. Should we see a move up, prices could encounter resistance at the $290 resistance level. A slide could see prices held at the $270 and $250 support levels.
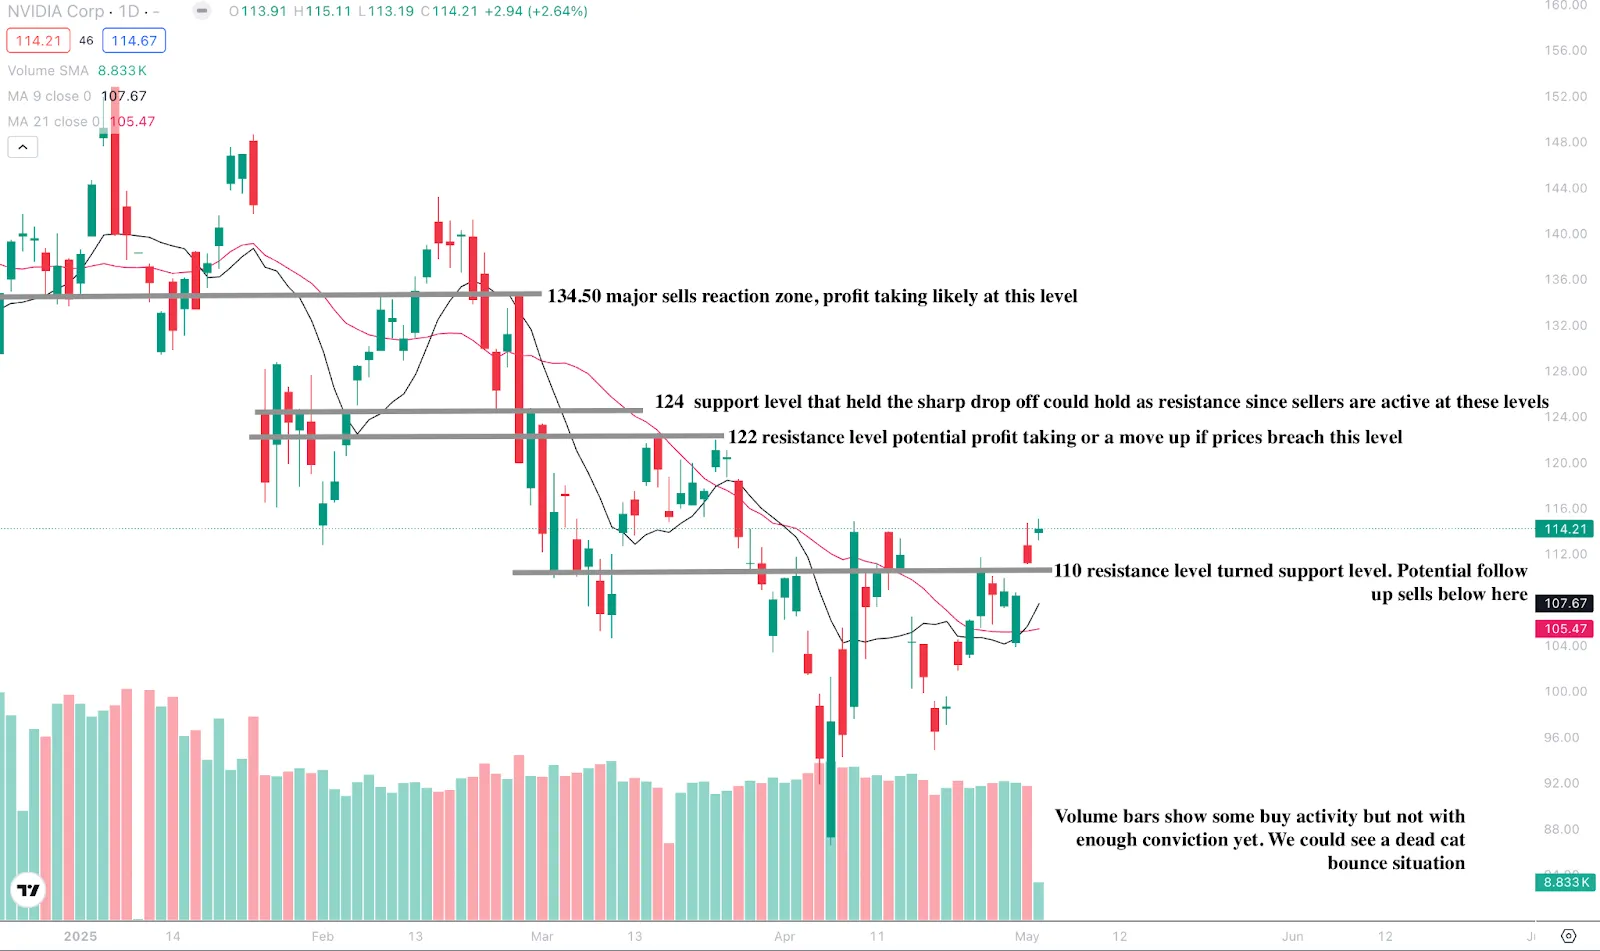
Nvidia is also trading at a resistance level, where prices could see an uptick above this level. A recent bearish crossover paints a picture of bearish conditions, though the volume bars tell us that bulls could be gearing up to make a bigger move. If prices hold above current levels and move up, they could encounter resistance at the $122, $124, and $134.50 price levels. A price slide could find resistance at the $110 price level.
Are you into AI stocks? You can speculate on the price trajectories of TSLA and NVDA with a Deriv MT5 or Deriv X account.
Sorry, we couldn’t find any results matching .
Search tips:
- Check your spelling and try again
- Try another keyword