Results for
Bitcoin’s institutional demand could trigger the next big rally
With public companies scooping up coins faster than ETFs and political heavyweights like Elon Musk making pro-Bitcoin noise, the original crypto is having a serious glow-up.
Once the rebellious outsider of the financial world, Bitcoin is now rubbing shoulders with the suits. With public companies scooping up coins faster than ETFs and political heavyweights like Elon Musk making pro-Bitcoin noise, the original crypto is having a serious glow-up.
From Wall Street boardrooms to Capitol Hill spats, Bitcoin is no longer just a decentralised experiment - it’s becoming a power play. But with massive inflows, mounting debt, and a bit of political theatre in the mix, the big question now is: could this new wave of corporate and political clout spark the next major rally?
Bitcoin ETF inflows are back - and it's not what you think
In the second quarter of 2025 alone, public companies purchased a staggering 131,355 Bitcoins, boosting their holdings by 18%, according to Bitcoin Treasuries. ETFs weren’t far behind, adding 111,411 BTC - up 8% over the same period.
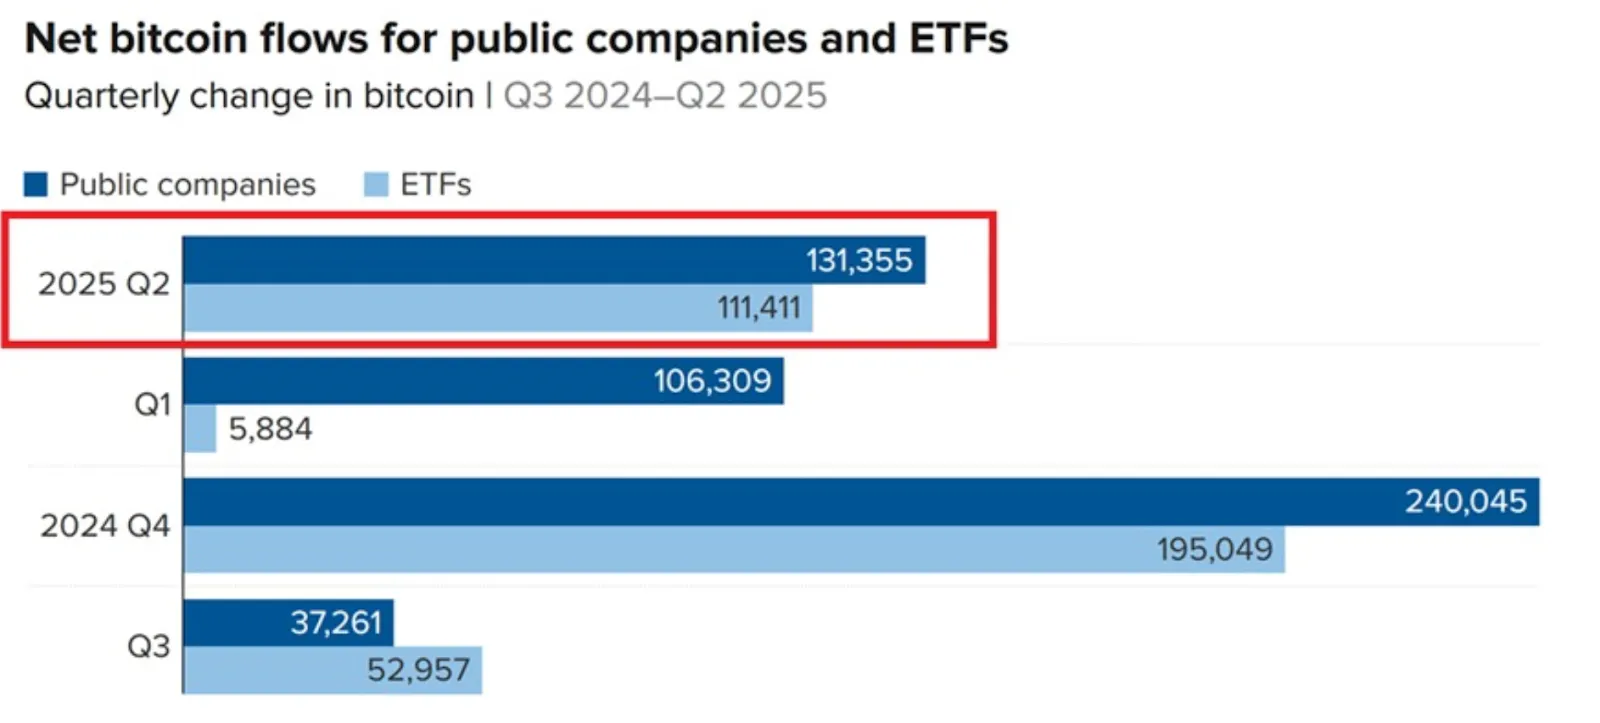
But here’s the twist: this is the third quarter in a row that public companies have out-bought ETFs. Year to date, companies have gobbled up 237,664 BTC, nearly double the amount acquired by ETFs. All in all, corporates now hold around 855,000 Bitcoins or roughly 4% of the total supply.
In other words, this isn’t just a Wall Street story - it’s a full-blown boardroom binge. Bitcoin is no longer a fringe hedge. It’s becoming a balance sheet asset.
Politics gets messy as Bitcoin news rides along
Enter Elon Musk, never one to shy away from a headline. After falling out with Donald Trump over what he dubbed a fiscally reckless “one big, beautiful bill,” Musk launched his own political movement - the “America Party.” At the heart of it? Ballooning U.S. debt and the belief that Bitcoin might just be the last line of defence.
Musk isn’t alone. Wall Street analysts and podcasters alike are sounding the alarm over the $37 trillion U.S. debt mountain, which is growing even faster thanks to new spending legislation that adds another $3 trillion to the tab and raises the debt ceiling by $5 trillion.
Musk and others’ message is clear: if the U.S. keeps printing and spending, the dollar risks losing credibility, and Bitcoin might be the “hard money” hedge that saves the day.
The bull case builds even as the Bitcoin price drops
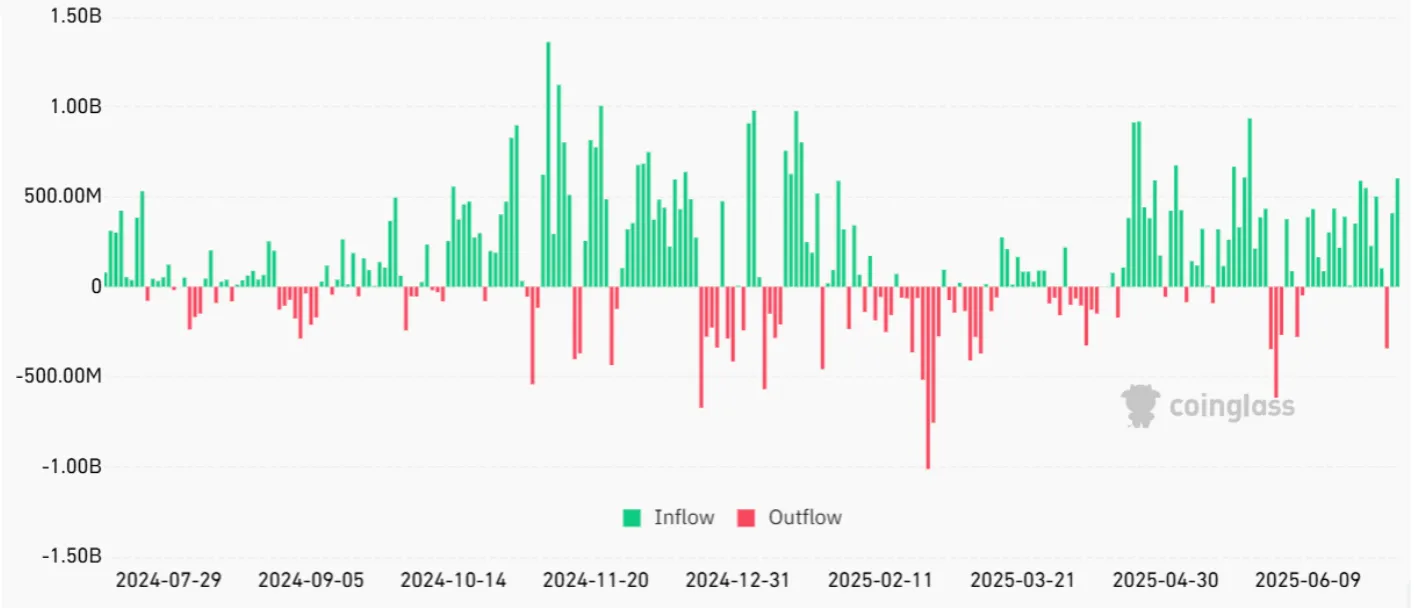
Now here’s where it gets interesting. Despite all this bullish momentum, institutional buying, political attention, and Wall Street product launches, Bitcoin’s price dropped to around $107,000, even after a $1 billion ETF inflow over two days.
That’s not how the script was supposed to go.
Analysts blame a mix of profit-taking, macro uncertainty, and regulatory jitters for the price dip. It’s a stark reminder that in crypto, narratives are powerful, but they don’t always move the price when you expect them to. ETF inflows are bullish, yes - but they’re not a magic wand.
Altcoin season indicators: Spotlight on Ethereum and Solana
While Bitcoin consolidates, the rest of the crypto market isn’t sitting still. Ethereum ETFs are quietly stacking up inflows, with $148.5 million added on Thursday alone - $85.4 million of that going into BlackRock’s ETHA fund. Since launching in July 2024, these Ethereum funds have attracted $4.4 billion.
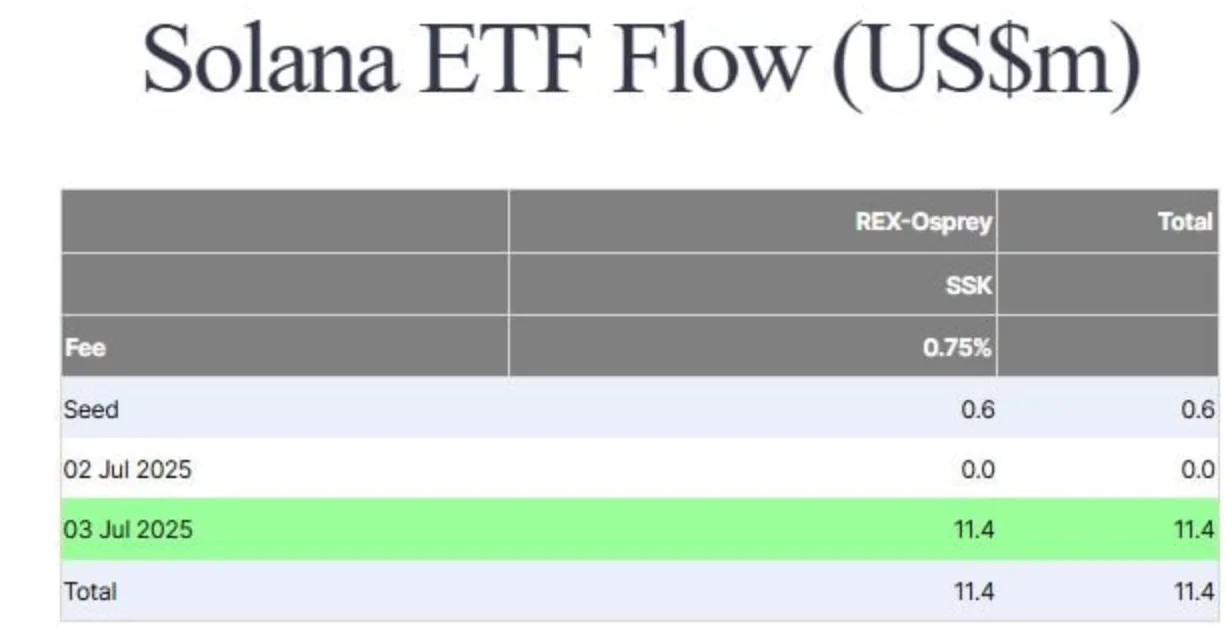
Even Solana is getting its institutional moment, thanks to a brand-new staking ETF from REX Shares and Osprey Funds. It debuted this week with strong $11.4 million in day-one inflows, which is not bad for a token that was once written off as a meme chain with outages.
The takeaway? Institutions are no longer just banking on Bitcoin. They’re building crypto portfolios - and that could be huge for altcoins in the coming months.
The Altseason season setup is taking shape
Bitcoin dominance has climbed to 64.6%, which, if you’ve been around long enough, you’ll know is a level that often signals a shift. When BTC dominance peaks and starts to roll over, that’s when altcoins historically shine. It’s like a pressure valve releasing capital across the crypto landscape.
As BRN Research Analyst Valentin Fournier puts it: if Bitcoin consolidates near its highs, it could pave the way for a full-blown altseason. That means Ethereum, Solana, and even some of the usual meme suspects could get their moment in the sun - fuelled by both institutional inflows and good old retail FOMO.
Does this potential Bitcoin transformation mean take off?
Here’s the million-pound question: will Bitcoin’s new suit-and-tie persona finally deliver the rocket-fuelled rally investors are hoping for?
There’s a strong case for it:
- Institutions are all-in with ETFs nearing $50 billion in cumulative inflows.
- Corporate buyers are stacking sats like it’s a treasury strategy.
- Politicians are name-dropping Bitcoin amid a fiscal credibility crisis.
- And yet, the price wobbles - reminding everyone this is still crypto.
The glow-up is undeniable. Bitcoin has gone from a rebellious outsider to a respected asset class. But whether that transformation triggers the next major rally depends on one thing: what the market chooses to believe next.
Bitcoin price outlook
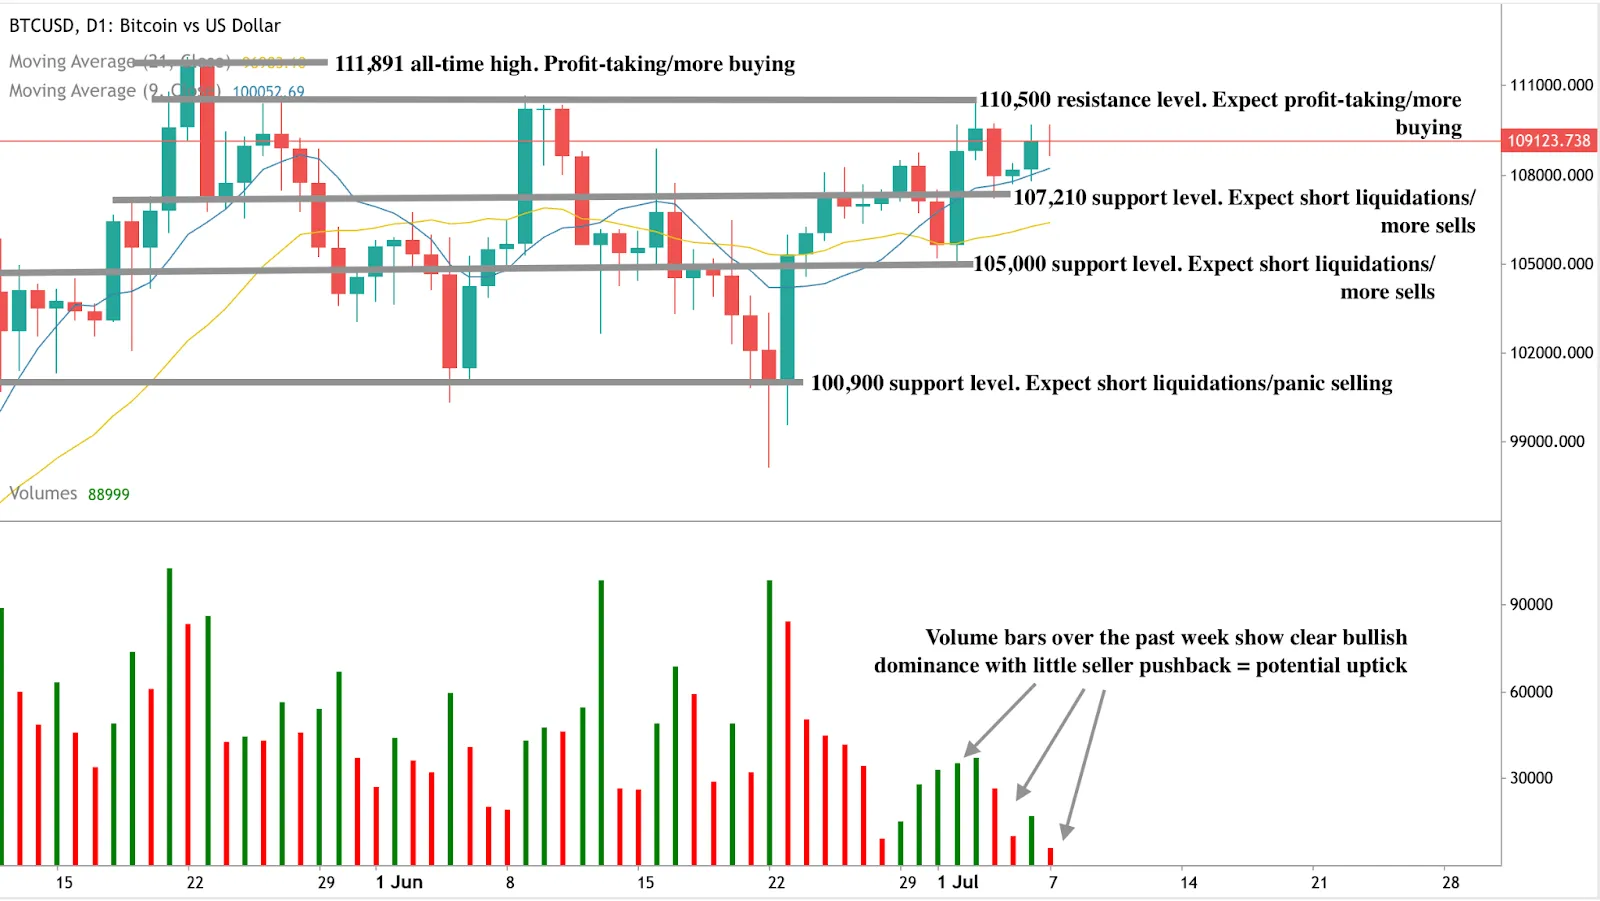
At the time of writing, Bitcoin is showing some buy pressure within a sell zone, hinting that the sellers could swoop in strongly at any time. However, the volume bars have shown bullish dominance over the past few days with little pushback from sellers, hinting at a potential uptick. If we see a price uptick, bulls could encounter resistance at the $110,500 and $111,891 price levels. Conversely, if we see a drawdown, sellers could find support at the $107,210, $105,000, and $100,900 support levels.

Is the S&P 500 rally living on borrowed time?
The stock market’s on a high again. On the surface, it all looks bulletproof. But peek behind the curtain and a different story emerges.
Note: As of August 2025, we no longer offer the Deriv X platform.
The stock market’s on a high again. The S&P 500 is smashing records, tech stocks are flying, and a surprisingly strong jobs report has traders feeling rather chipper. On the surface, it all looks bulletproof. But peek behind the curtain and a different story emerges: foreign investors are quietly hedging against the dollar, the Fed’s sitting on its hands, and America’s spending spree shows no signs of slowing down.
So, what gives? Is this the start of a new bull market, or are we dancing a little too close to the edge?
The rally that’s ignoring fed signals
Let’s start with the good news - June’s jobs report was better than expected, adding 147,000 new roles and bringing the unemployment rate down to 4.1%.

Not bad, considering economists were bracing for a slowdown. Wall Street took the news and ran with it, sending the S&P 500 and Nasdaq to fresh record highs. Again.
But here’s the twist: strong jobs usually means weak rate-cut odds. Traders have now priced out any chance of a rate cut in July and are scaling back their predictions for September. So while the market is climbing, the very safety net it was hoping for, Fed rate relief, is disappearing beneath its feet.
Foreign investors employ dollar hedging strategies
Here’s where things get even more interesting: foreign investors are losing faith in the dollar.
For years, global investors held U.S. stocks and bonds with minimal currency hedging. Why bother? The dollar was strong, and even when stocks dipped, currency gains often softened the blow. But now the dollar’s down 10% for the year - and 13% against the euro - and that old “natural hedge” has turned into a liability.

Asset managers across Europe, the UK, and Asia are quietly upping their hedge ratios. One Russell Investments client bumped theirs from 50% to 75%. BNP Paribas, Northern Trust, and others are trimming dollar exposure and buying up euros, yen, and Aussie dollars. Derivatives desks are buzzing, FX is back in the boardroom, and forward selling of the dollar is at a four-year high.
It’s not a panic, but it’s not exactly a vote of confidence either.
A rally fuelled by the US fiscal stimulus
Meanwhile, Washington is busy lighting the fuse on a $3.4 trillion tax-and-spend bill. It’s cleared the Senate, is moving through the House, and could be signed off by Trump just in time for Independence Day fireworks.
That sort of stimulus tends to juice the market - and clearly, it’s doing the trick. But let’s not forget the price tag. The U.S. national debt is already north of $36 trillion, and this bill would push it even higher. Traders may love the sugar high, but the hangover could be brutal.
Trade tensions take a breather though a tariff pause expiry looms
In a rare moment of calm, U.S.-Vietnam trade talks yielded a deal, and restrictions on chip design software exports to China were lifted. That helped lift shares of Synopsys and Cadence Design Systems. Even Nvidia’s stock hit record highs, pushing it closer to becoming the most valuable company in history.
However, he 90-day tariff pause ends next week, and Trump has made it clear he’s willing to “get tough”. If fresh tariffs are back on the table, things could take a different turn.
Volatility hedging vs. market confidence
According to analysts, investors aren’t exactly pulling out - but they’re definitely strapping on seatbelts. FX hedging is up. Volatility is lurking. And while AI hype and tech dominance are keeping the party going, the fundamentals are starting to wobble.
There’s no denying the resilience of the U.S. economy - at least for now. But the rally is beginning to feel like one of those magic tricks that looks amazing… right up until the wires start to show.
Is the S&P 500 rally flying or floating?
Right now, the S&P 500 feels untouchable. But step back, and you’ve got:
- A Fed that’s out of moves,
- A dollar that’s lost its shine,
- And foreign investors quietly shifting into defence mode.
That’s not to say a crash is coming. But a correction? A wobble? A sudden shift in tone? That wouldn’t be surprising at all. The question isn’t whether this rally has legs - it’s whether those legs are standing on solid ground, or just a very shiny patch of quicksand.
At the time of writing, the S&P 500 rally is seeing some exhaustion with a red candle forming, hinting at a potential drawdown. The potential bearish narrative is buttressed by the volume bars indicating that buy pressure is currently waning. Should we see a significant drawdown, prices could find support at the $5,945 and $5,585 support levels. Conversely, if the uptick resumes, prices could encounter resistance at the $6,289 price level.

Is the S&P 500 going to break yet another record? You can speculate on US markets with a Deriv MT5, Deriv cTrader, or a Deriv X account.

Fed braces for impact as ‘stagflation 2025’ fears grow
Something doesn’t quite add up. Inflation’s cooling, jobs are still growing, and yet the world’s most powerful central bank is looking increasingly uneasy.
Note: As of August 2025, we no longer offer the Deriv X platform.
Something doesn’t quite add up.
Inflation’s cooling, jobs are still growing, and yet the world’s most powerful central bank is looking increasingly uneasy. The Fed hasn’t resumed rate cuts, market jitters are rising, and suddenly, the word stagflation - that nasty blend of rising prices and slowing growth - is creeping back into the conversation.
It’s not 1970, but it’s starting to feel uncomfortably familiar. With warning signs flashing from GDP to the jobs market, and tariffs quietly stirring up inflation pressure behind the scenes, the Fed looks less like it’s managing a soft landing - and more like it’s bracing for a bumpy one.
Let’s unpack what’s really going on.
Stagflation risk is mounting
In May 2025, 14 FOMC members flagged upside risks to both inflation and unemployment - a rare and worrying alignment. Not one projected a meaningful decline in either. This pattern was also seen in March 2025, December 2024, and September 2024.

This is more than just cautious forecasting - it’s the kind of dual risk signal last seen during the stagflation era of the 1970s, when soaring prices and sluggish growth left policymakers in a no-win situation.


So far, Jerome Powell has resisted cutting rates, despite cooling CPI numbers, and now we can see why. He’s not just looking at what inflation is today, but what it could become if tariffs squeeze supply chains and cost pressures get passed on.
GDP contraction and jobs tell a split story
At first glance, the economy doesn’t look too bad. The May jobs report showed 139,000 new jobs, a touch better than expected. But the details matter - especially the 95,000 downward revision to previous months and early signs of rising layoffs in key sectors.

The labour market might still be moving, but it’s losing momentum.
And then there’s growth. The U.S. economy contracted by 0.2% in Q1 - the first negative GDP print in over two years. The headline number was hit by a historic import surge, creating the largest trade drag in nearly 80 years. But strip away the noise, and core GDP -measured by final sales to private domestic buyers- tells an even starker story: a drop from 2.5% in Q1 to an expected -1.0% in Q2.
That’s not just a slowdown, it’s a stall.
Inflation is cooling… but only just
On the surface, inflation looks tame. Headline CPI came in at 2.35% year-on-year in May, below the Fed’s 2.5% comfort zone. Core inflation has hovered near 2% for three straight months.

So why isn’t the Fed relaxing?
Nomura economists point out that real inflation pressure is still in the pipeline. Survey data shows that nearly a third of manufacturers and 45% of service firms plan to fully pass on tariff-related costs to consumers. So far, elevated inventories have masked these price hikes, but once those buffers run out, we may see inflation creep back up right when growth is already fading.
US Dollar weakness when it should be strengthening
Here’s where things get stranger. In theory, stagflation, with sticky inflation and a hawkish Fed, should strengthen the U.S. dollar. And yet, 2025 has been brutal for the greenback.
The U.S. Dollar Index (DXY) is down 10.8% so far this year - the worst first-half performance since 1973, when Bretton Woods collapsed. The Bloomberg Dollar Spot Index has declined for six straight months, matching its longest losing streak in eight years.
This isn’t just a weak dollar story - it’s a confidence story. The market is reacting to mounting deficit spending, tariff shocks, and the growing belief that the Fed will eventually cave and cut rates, even if inflation isn’t fully tamed.
Policy paralysis and the 1970s trap
The Fed’s current dilemma has all the hallmarks of a policy trap. Cut rates now, and you risk igniting inflation all over again - a mistake the central bank made repeatedly in the 1970s. Hold rates too high for too long, and you deepen the downturn.
Meanwhile, fiscal policy is boxed in. The Trump administration just passed a “big, beautiful budget bill” that adds trillions in spending, further ballooning the national debt.
Some argue this might be a strategic currency weakening to reduce the real debt burden. As noted by the National Bureau of Economic Research, a 10% drop in the dollar could shave $3.3 trillion off the U.S. debt. But push that too far, and you risk undermining the dollar’s global reserve status - the very thing keeping the U.S. economy afloat.
Technical outlook: Is stagflation coming?
We’re not in full-blown stagflation - not yet. But the foundations are starting to crack. Growth is faltering, inflation pressures are reloading, policy tools are limited, and the Fed, clearly, is on edge.
Markets may be banking on a soft landing. The Fed, meanwhile, looks like it’s preparing for something harder and bumpier. A stagflation situation would likely support the dollar and lead to it strengthening over the Euro, toppling the current state of affairs.
At the time of writing, the EURUSD pair is still on an upward trajectory, though sellers are evidently having their say on the daily chart. Volume bars show that sellers are pushing back strongly against recent buy pressure, hinting that we could see a significant drawdown.
Should prices inch lower significantly, sellers could find support at the 1.1452 and 1.1229 price levels. Conversely, if we see an uptick, buyers could encounter resistance at the 1.1832 price level.

Will the dollar strengthen over the Euro as stagflation fears grow? Speculate on the price trajectory of the EURUSD pair with a Deriv MT5, Deriv cTrader, or a Deriv X account.
.webp)
Is it a good time to buy silver?
Gold may have the glamour, but silver’s making a serious play for the crown this year.
Note: As of August 2025, we no longer offer the Deriv X platform.
Gold may have the glamour, but silver’s making a serious play for the crown this year.
In 2025, it’s not just jewellery boxes and coin collections - silver is powering electric vehicles, fuelling solar energy, and quietly becoming the metal behind the world’s next big tech leap. It’s affordable, in demand, and gaining ground fast. So, is silver finally stepping out of gold’s shadow? All signs point to yes.
Silver industrial demand meets investment charm
Silver’s not just riding the wave of hype - it’s riding a surge in real-world demand. Global silver usage is set to surpass 1.2 billion ounces this year. In India alone, imports have more than tripled in Q1, driven by booming sectors like electric vehicles (EVs), solar power, and next-gen tech.

To put it simply, we’re using more silver than we can dig up. Each EV needs around 50 grams of silver for its circuits and sensors. Solar panels also need Silver because of the industrial metal’s unmatched conductivity, which makes it essential to photovoltaic (PV) cells. Even AI chips and 5G infrastructure rely on it to stay cool and connected. The metal that once sat quietly in the background is now central to the green and digital revolutions.
Silver vs gold ratio: Macro moves are working in silver’s favour
It’s not just tech driving the silver story - the broader economic backdrop is also playing a big part. Central banks are back in rate-cutting mode, which tends to benefit precious metals. Meanwhile, the US dollar is on the ropes, making dollar-priced silver more attractive for global buyers.
Then there’s the gold-silver ratio, currently hovering around 100:1. That’s a flashing signal that silver is historically undervalued compared to gold.

In past bull markets - think 2020 and 2024 - silver didn’t just keep pace with gold, it outperformed it.

Silver vs gold in 2025
With all that momentum, it’s no surprise investors are starting to rethink their portfolios. Silver isn’t just a hedge anymore - it’s a growth story, and one that’s far more accessible than gold.
Insiders say bullion buyers are now allocating 20-30% of their precious metals portfolio to silver, a big leap from years past.
And while gold will always have an emotional and cultural pull, the world over, silver is proving itself to be more than just second best. It’s useful, affordable, and riding some of the biggest megatrends of the decade.
Silver price forecast
Silver has been underestimated for too long. But 2025 is shaping up to be its breakout year - the perfect blend of safe-haven and future-facing asset. Whether you’re an everyday saver, a sustainability-minded investor, or simply looking for smart diversification, silver is ticking all the right boxes. It may not have gold’s legacy. But in 2025, silver has something better: momentum.

Trade silver's movements with a Deriv X or a Deriv MT5 account today.

EUR/USD forecast at a crossroads as dollar weakens further
After a six-day winning streak, the EUR/USD pair has surged to its highest level since 2021, turning heads across the FX world.
Note: As of August 2025, we no longer offer the Deriv X platform.
The euro is on a tear, and traders are loving it. After a six-day winning streak, the EUR/USD pair has surged to its highest level since 2021, turning heads across the FX world. But with fresh data on the horizon from both sides of the Atlantic, can this rally keep going, or are we nearing the top?
Markets are bracing for answers, and the next move could be big.
Trump and Fed uncertainty
Much of the recent momentum has less to do with euro strength and more to do with dollar weakness - and that’s a story packed with politics and soft data.
US President Donald Trump once again attacked Federal Reserve Chair Jerome Powell, branding him “terrible” and “very political” during a press conference in The Hague. Trump’s not-so-subtle suggestion that Powell could soon be replaced has rattled investors, who already fear that Fed independence is under siege.
While Powell’s term officially runs through 2026, the mere hint of political interference has added a fresh layer of uncertainty to the Fed’s outlook - and weighed heavily on the greenback.
On the data front, things haven’t looked much better. The US economy contracted by 0.5% in the first quarter of 2025 - the first quarterly drop in three years and worse than the previously estimated 0.2% decline. A soft patch in consumer spending and a sharp fall in exports did most of the damage.

Meanwhile, jobless claims dipped slightly to 236,000, but they remain stubbornly high compared to the yearly average, not exactly the confidence booster markets were hoping for. Sure, there was one bright spot - May’s Durable Goods Orders surged by over 16%, but that pop looks more like a one-off bounce than a sign of sustained strength.

EU inflation data: Europe’s calm amid the chaos
While the US narrative has been noisy, Europe has offered a quieter, more measured tone - and in this market, that’s proving attractive.
European Central Bank Vice President Luis de Guindos made it clear this week that the ECB is sticking to a data-dependent, meeting-by-meeting approach. No bold promises, no political drama. Instead, he flagged trade tensions and geopolitical risks as the main concerns and left the door slightly ajar for further rate cuts if needed. That calm, considered stance has added to the euro’s appeal, especially when contrasted with the storm brewing across the Atlantic.
Eurozone data has been far from spectacular, but it hasn’t spooked markets either. PMI figures are hovering around the 50 mark, not too hot, not too cold, and inflation, while still on the low side, hasn’t collapsed.

Alt text: Bar chart of Eurozone composite PMI readings showing stability around 50, indicating balanced economic activity without significant expansion or contraction
Source: S&P Global, Trading Economics
Put simply, the euro isn’t booming, but it’s behaving - and right now, that’s enough.
US Inflation data takes the spotlight
So, where does that leave the EUR/USD pair? It’s right on the edge of something bigger - or a possible pullback.
All eyes now turn to the upcoming data releases, starting with Germany’s HICP flash data and followed by the Eurozone-wide numbers.
Analysts perceive this trio of figures could tip the balance either way:
- If US inflation undershoots, it strengthens the case for rate cuts, pushing the dollar lower and possibly sending EUR/USD even higher.
- If Eurozone inflation holds steady or ticks up, the ECB may hold back on easing - another win for the euro.
- But a surprise in either direction could throw this tidy narrative off course.
Trading at the edge: Are we at EUR/USD resistance levels?
At around 1.1700, the EUR/USD pair is sitting at a level not seen since late 2021. The pair’s recent rally has been powered by a mix of macro divergence, political risk, and market positioning, but for it to continue, the fundamentals need to deliver. That means inflation needs to support the narrative, and central banks need to stay in their respective lanes.
Of course, things could just as easily snap back. A hot US inflation print or a hawkish Fed pivot could bring the dollar back to life - and take the euro down a peg. At the time of writing, the pair is holding above the 1.1700 price level with signs of a pullback evident within a buy zone. However, recent volume shows dominant bullish pressure, with little push-back from sellers, hinting at more movement north.
Should we see a further uptick, prices could be held at the 1.1754 resistance level. Conversely, should we see a slide, prices could find support at the 1.1454, 1.1290, and 1.1094 support levels.

Will EUR/USD keep pushing up? You can speculate with a Deriv X and a Deriv MT5 account.

All eyes on BTC and XRP as risk fever returns
It’s getting hot in the markets again - and crypto’s feeling the heat.
Note: As of August 2025, we no longer offer the Deriv X platform.
It’s getting hot in the markets again - and crypto’s feeling the heat. With tensions cooling in the Middle East and the Fed hitting pause on rate cuts (for now), traders are dusting off their appetite for risk. Bitcoin has bounced back above $107K, XRP’s clawed its way past $2, and talk of breakouts is buzzing across trading desks and crypto X alike.
Are we on the cusp of another moon mission - or just riding another sugar rush?
Bitcoin’s bungee jump and bounce back
Just a few days ago, Bitcoin slipped below $100K as geopolitical tensions rattled investor confidence. But the rebound was swift. In under 48 hours, BTC surged back above $107K, brushing up against its all-time highs and proving that demand for crypto remains strong even in moments of uncertainty.

What makes this move interesting is how composed Bitcoin has been. It’s no longer reacting as wildly to macro shocks. While equities flinched and gold swung back and forth, Bitcoin held its ground. For some, that’s a sign it’s starting to behave more like a serious macro asset - potentially even a digital safe haven.
XRP price gathers momentum
XRP, too, is making a strong recovery. After slipping to $1.90 during last weekend’s sell-off, it’s now trading around $2.17. A move towards $2.50 - or even $3.00 - is on the cards if this momentum continues.
Under the surface, the data shows growing interest: open interest has climbed nearly 5% to $3.74 billion, while trading volume has jumped over 10% to $9.5 billion. Short positions worth $9.3 million were liquidated in the past 24 hours, far outweighing longs.
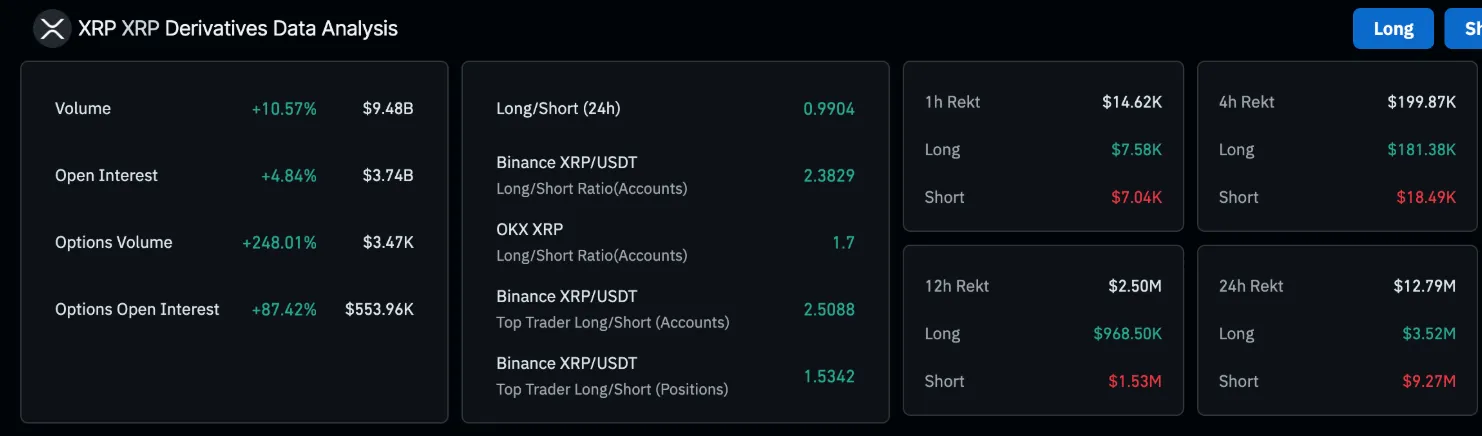
The result? A classic short squeeze, with bullish sentiment leading the charge. On Binance, the long-to-short ratio sits at a notably bullish 2.38.
Powell sends a mixed signal
The macro backdrop is adding fuel to the fire. US Federal Reserve Chair Jerome Powell made it clear this week that interest rate cuts are not imminent. He said tariffs imposed earlier this year are likely to push prices up and slow economic activity. For now, the Fed wants to wait and see.
This doesn’t align with what the market - or Donald Trump - wants to hear. Trump called on Powell to cut rates by “two to three points” and branded him “too late.” But Powell’s message was measured: the Fed is not making any sudden moves.
The XRP $1,000 rumour
Meanwhile, XRP is getting attention for a more speculative reason. Viral posts on social media have claimed that Ripple co-founder Chris Larsen predicted XRP could hit $1,000 if Ripple captures 10% of SWIFT’s global payments volume.
There’s no public record of Larsen making that statement, but that hasn’t stopped the rumour from spreading. It’s fuelled by Ripple’s long-standing ambitions to modernise cross-border payments and potentially work alongside - or in place of - legacy systems like SWIFT.
A few years ago, Ripple CEO Brad Garlinghouse floated the idea that XRP could process up to 14% of SWIFT’s volume. Whether that happens or not, the fact that such rumours gain traction so quickly speaks to how invested the XRP community remains.
Corporates back in the mix
Outside the coins themselves, corporate engagement with crypto is once again in focus. GameStop recently raised $2.7 billion through a convertible notes offering, giving it scope to increase its Bitcoin holdings after a $512 million BTC buy in May. Meanwhile, UK-based Smarter Web Company has seen its stock rise by over 6,000% after revealing a Bitcoin reserve policy, with plans to accumulate up to 1,000 BTC in the coming months.
These moves signal that crypto’s appeal isn’t limited to day traders - it’s appearing in boardroom strategies, IPO narratives, and investor pitches.
Between Bitcoin’s impressive rebound, XRP’s growing momentum, and renewed appetite for risk, the crypto market is showing signs of life. Add in corporate participation and a market that’s learning to look past short-term shocks, and we might just be on the edge of a new phase, according to analysts.
A breakout? Possibly. A bubble? Too soon to say. But one thing’s certain - crypto is back on the radar, and this time, the noise is backed by real market activity.
BTC technical outlook
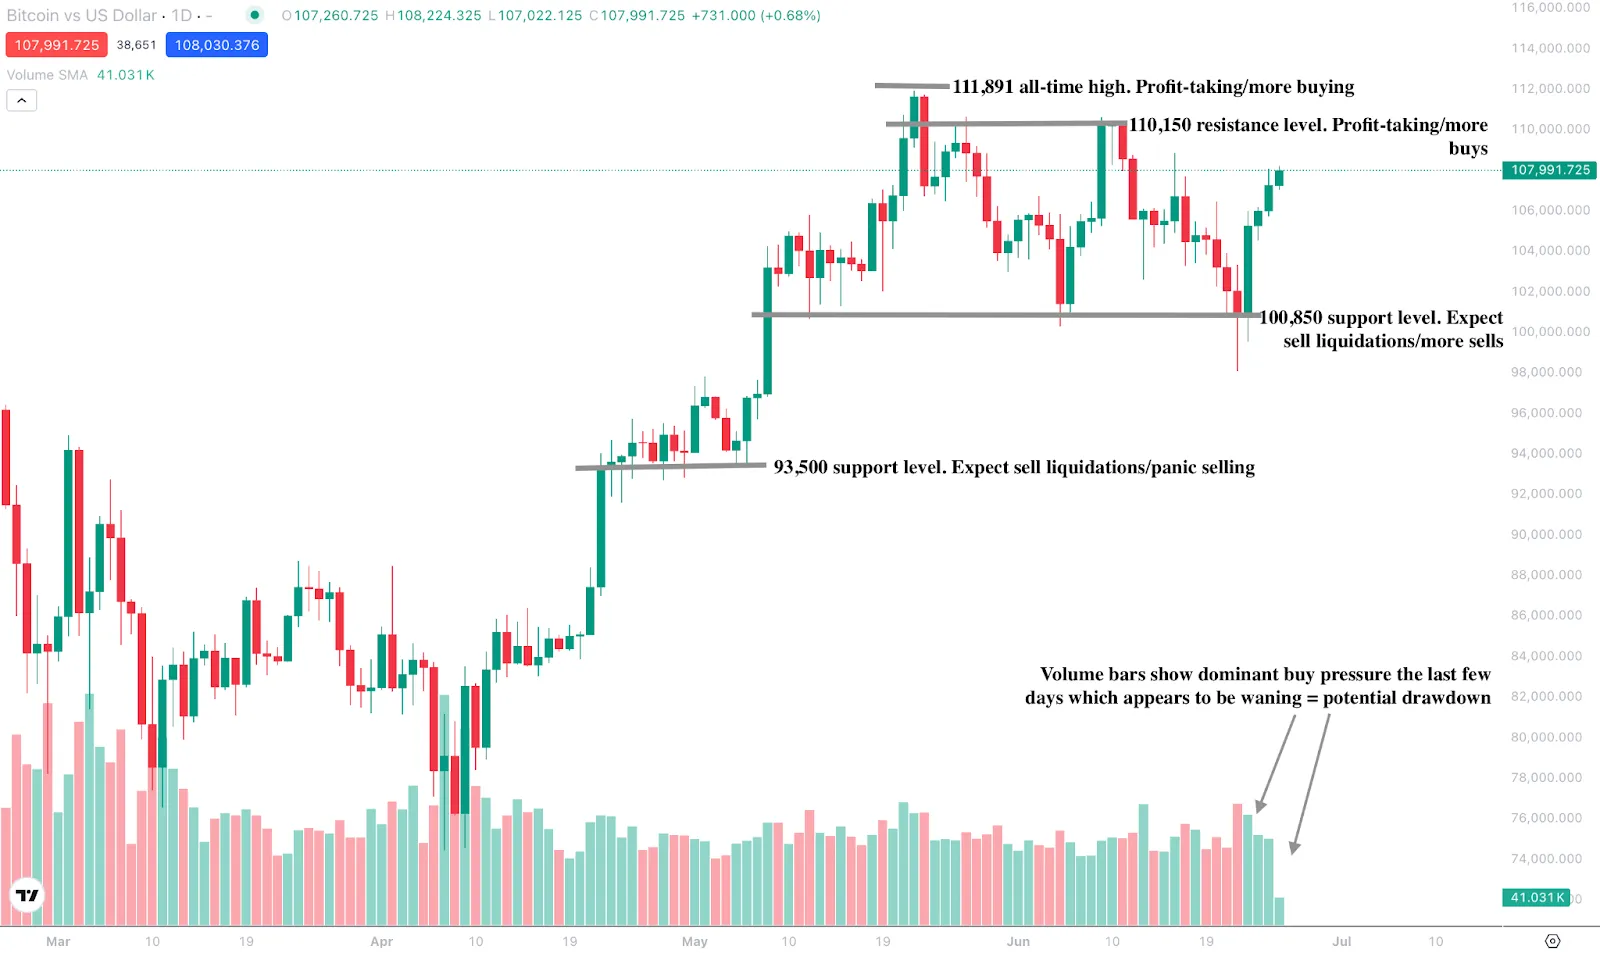
At the time of writing, BTC prices are still surging within a larger sell zone, hinting at potential exhaustion and reversal. The volume bars showing waning bullish pressure buttress the case for a drawdown. Should we see a further uptick, prices could find resistance at the $110,150 and $111,891 price levels.
XRP price prediction
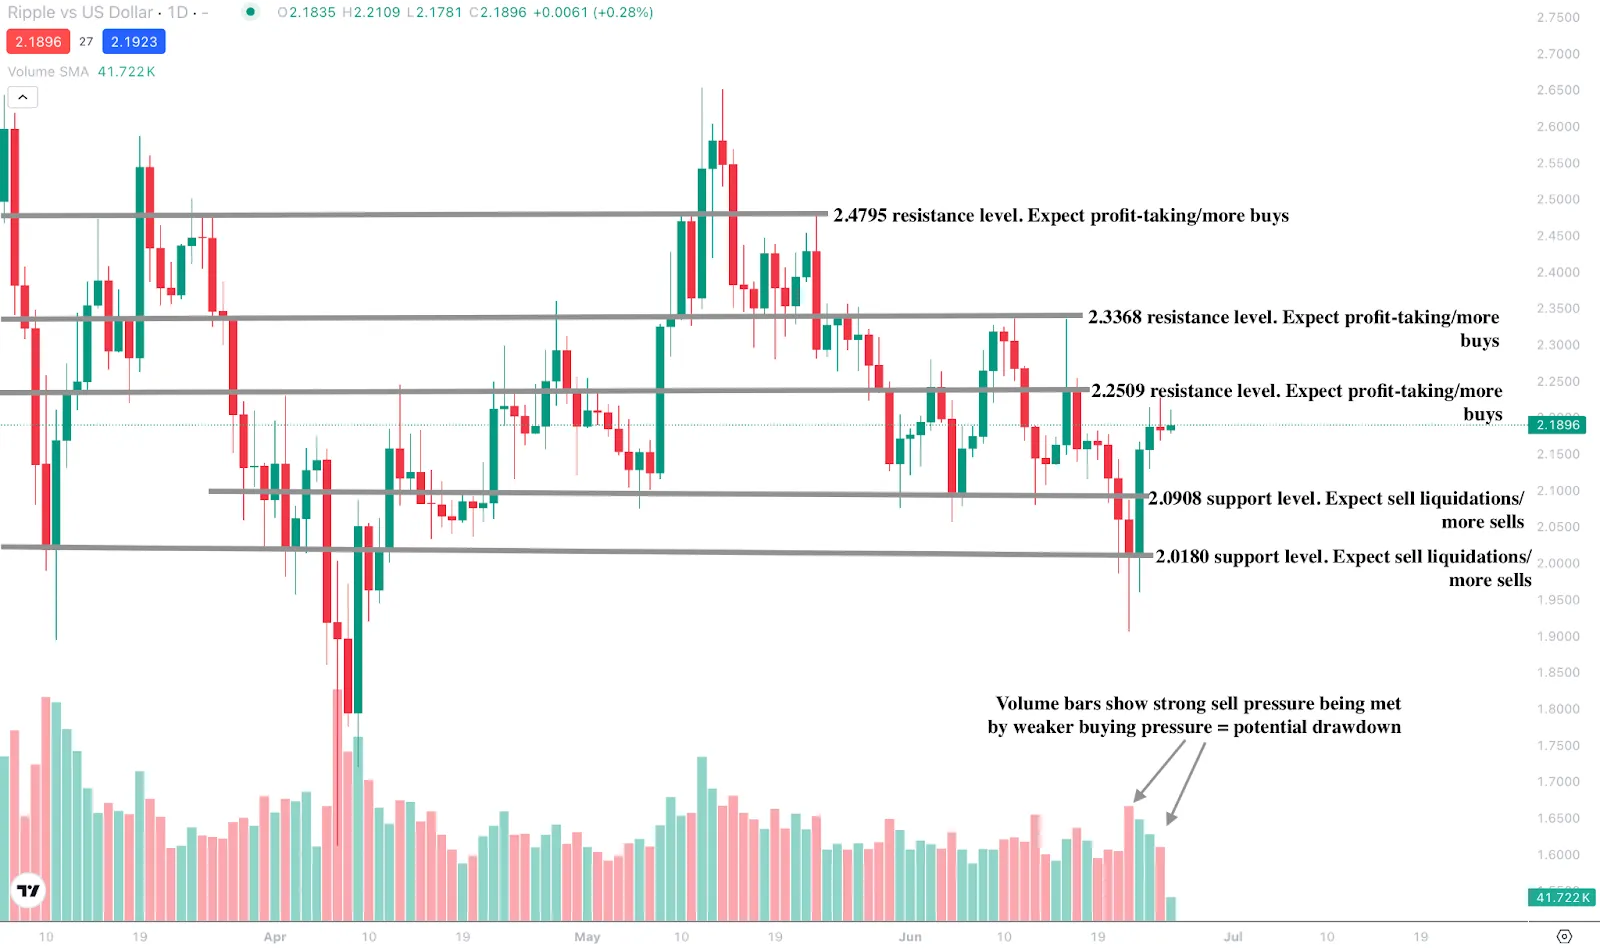
XRP has also seen considerable bullish pressure that appears to be slowing down within a strong sell area, hinting at potential price reversal. The bearish narrative is solidified by the volume bars showing buyers struggling to push back against strong sell pressure. Should buyers keep pushing up, they could find resistance at the $2.2509, $2.3368, and $2.4795 price levels. Conversely, should sell pressure prevail, prices could find support floors at the $2.0908 and $2.0180 price levels.
Are you keen on the price trajectory of BTC and XRP? You can speculate with a Deriv X and a Deriv MT5 account.

How high can Nvidia’s stock price climb as markets rally?
After a turbulent few months, Nvidia's shares have bounced back more than 9% since its May earnings. With momentum building, the big question now is: how much further can it climb?
Note: As of August 2025, we no longer offer the Deriv X platform.
The S&P 500 is edging closer to a record high, with markets buoyed by cooling geopolitical tensions and a wait-and-see Fed. Among the tech names riding the wave is Nvidia - not exactly leading the charge, but certainly making noise.
After a turbulent few months, the AI chipmaker’s shares have bounced back more than 9% since its May earnings, comfortably outpacing the broader market.

With momentum building, the big question now is: how much further can it climb?
From US-China chip war fears to investor favourite
Earlier this year, Nvidia looked like it might become collateral damage in the growing tech standoff between the US and China. A ban on sales of its advanced H20 chips to China hit hard, costing the company $2.5 billion in Q1 alone and setting it up for a potential $8 billion dent in Q2.
That, combined with fresh competition from Chinese AI challengers like Huawei and DeepSeek, sent shares tumbling to just over $94 in April, their lowest level in over a year.
But the May earnings report changed the mood. Nvidia beat Wall Street’s expectations and gave the market something it hadn’t seen in weeks - a reason to feel optimistic.

Suddenly, the story wasn’t about lost sales, but global expansion and resilience in the face of headwinds.
Nvidia global expansion deals and AI momentum
Part of Nvidia’s recent momentum stems from its growing footprint outside China. In May, the company struck major deals with Saudi Arabia and the United Arab Emirates to supply hundreds of thousands of AI chips. Those agreements helped to offset the damage from China and hinted at a broader geopolitical shift - if one door closes, another opens in the Gulf.
Add to that the ongoing AI buildout in the West, and Nvidia has found itself in a sweet spot. Many still see it as the backbone of the AI revolution, powering data centres, startups, and even government-backed projects.
S&P 500 record high incoming?
It’s not just Nvidia doing well. The S&P 500 is now less than 1% below its record high, lifted by investor relief over a ceasefire in the Middle East and signs that the Federal Reserve isn’t in a hurry to raise rates again. Financials and tech stocks are leading the way, while energy names lag due to falling oil prices.
In this environment, Nvidia is doing what strong stocks tend to do - catching the tailwind. It may not be dragging the market upwards single-handedly, but it’s part of the story investors are currently buying into.
Next stop: Nvidia humanoid robots?
One of the more intriguing parts of Nvidia’s future isn’t about chips at all - it’s about robots. The company is teaming up with Foxconn to deploy humanoid robots at a new factory in Houston. These robots, set to go live by early next year, will help build Nvidia’s next-generation GB300 AI servers.
It’s a futuristic twist, but also a smart move. Nvidia already supplies the platforms that help power humanoid development, so using robots to make its own products feels like a natural and strategic evolution.
Despite the strong run, not everything’s pointing up. Nvidia CEO Jensen Huang recently sold $14.4 million worth of shares as part of a pre-arranged trading plan. Board member Mark Stevens also sold more than $88 million in stock around the same time.
These planned sales aren’t uncommon for executives, especially in a year of massive valuation gains. But they do serve as a reminder: while Nvidia’s prospects look strong, some insiders are taking a bit of profit off the table.
Nvidia technical outlook: How high can it climb?
That depends on a few things. If the AI momentum continues and Nvidia retains its place at the centre of that story, there may well be more upside to come. If the Fed stays on the sidelines and geopolitical tensions don’t flare up again, the S&P 500 could break into new territory — and Nvidia could go along for the ride.
But expectations are already high, and much of the optimism is now priced in. Any sign of slowing AI adoption or further hits to revenue, especially from China, could easily dampen the rally. For now, though, Nvidia’s back in the game. Analysts note that it’s not charging ahead, but it’s climbing steadily, and traders are watching every step.
At the time of writing, the stock price is enjoying a significant uptick past $147.00, around a sell zone, hinting that sellers may join the fray and push prices downwards, leading to a price reversal. However, the volume bars paint a picture of a tug-of-war between bulls and bears, with bulls currently enjoying an upper hand. Should the bulls continue dominating, prices could find resistance at the $152.70 resistance level. Conversely, if sellers make a comeback, they could find support floors at the $141.87, $129.55, and $115.00.

Keen on Nvidia’s price trajectory? You can speculate with a Deriv X and a Deriv MT5 account.

Tesla stock rally hints at markets backing a driverless future
Tesla’s shares jumped over 8% this week, and it wasn’t due to a new model or a flashy earnings beat. It was something far more futuristic: robotaxis.
Note: As of August 2025, we no longer offer the Deriv X platform.
Tesla’s shares jumped over 8% this week, and it wasn’t due to a new model or a flashy earnings beat. It was something far more futuristic: robotaxis.
The EV giant has officially launched its autonomous ride-hailing service in Austin, Texas. It’s limited for now, a small zone, early access users, and a Tesla staffer riding along, but it’s real, and markets took notice.
This sudden rally might be more than a short-term reaction. It could be a sign that investors are warming up to a future where cars drive themselves - and maybe even earn their keep while you’re asleep.
Tesla’s robotaxi: Not just another tech demo
Tesla’s robotaxi rollout isn’t a concept sketch or a lofty promise from a stage. It’s happening on the streets - albeit quietly. Passengers are being ferried around South Austin in autonomous Model Ys, with each ride priced at a flat $4.20. Yes, there’s a safety monitor in the passenger seat, and yes, it’s far from the sci-fi version we’ve been sold. But it’s a start - and an important one.
What’s more telling is the market’s response. Tesla’s stock didn’t just tick upwards - it leapt.

For a company already heavily scrutinised, that kind of reaction suggests something deeper: belief. Investors appear to be pricing in more than just a successful pilot - they’re placing early calls on what could become a massive shift in mobility.
Tesla ride-hailing: The long game
Elon Musk has long argued that Teslas shouldn’t just be cars - they should be workers. In his vision, your Tesla drives you to work in the morning, then spends the day chauffeuring other people around, earning income on your behalf - a personal robotaxi.
It’s an ambitious idea - one that’s taken years of development, missed deadlines, and raised plenty of eyebrows. But now, with even a small-scale launch in motion, that vision has taken a step closer to reality. And the market, it seems, is paying attention.
Tesla’s approach sets it apart from rivals like Waymo and Zoox. While they’re fitting out their vehicles with an arsenal of sensors, including LiDAR, radar, and all sorts of tech wizardry. Tesla is going all in on cameras and neural networks. It’s a bold move: fewer sensors, more software.
Some call it reckless. Others say it’s the only scalable solution. Either way, Tesla’s rally suggests investors are buying into the idea that software will win - and that Tesla, not the tech giants, might just crack driverless transport first.
GM stock outlook: The value pick in the background
While Tesla grabs headlines with its $4.20 robotaxis and surging share price, General Motors has been quietly gaining ground. Its stock is up over 10% in recent months, and some analysts still consider it undervalued based on price-to-earnings multiples.
No, GM isn’t promising fully autonomous fleets tomorrow. And no, it won’t flood your feed with memes. But it is turning out steady profits, and for investors who prefer fundamentals over fanfare, that might be enough.
Its projected earnings growth, around 6.8%, isn’t eye-catching, but it’s reliable.

In a market often distracted by hype, GM offers something refreshingly straightforward: value.
Tesla technical outlook: Two different roads, same destination?
Tesla and GM represent two sides of the transport future. One is pushing the boundaries of autonomy with grand visions and viral launches. The other is building quietly, focusing on profitability, scale, and a slower EV transition.
Both are heading toward a future where cars drive themselves, just at different speeds, and with different investors in the passenger seat.
So while Tesla’s robotaxis may have stolen the spotlight this week, don’t count out the old guard. If markets really are backing a driverless future, there might be room for both the dreamers and the doers.
At the time of writing, Tesla is seeing some price retreat within a sell zone, hinting at a possible price reversal. However, the volume bars show strong bullish pushback against recent dominant sell pressure, hinting at a price uptick. Should we see more upside, prices could find resistance at the $357.00, $367.00, and $410.00 price levels. Conversely, should we see a slump, prices could find support at the $314.00 and $272.00 price levels.

Want to be part of the future of automation? You can speculate on the price trajectory of Tesla stock with a Deriv X and a Deriv MT5 account.

Is the oil price outlook dismissing threats of wider conflict?
For all the talk of global conflict, the oil market seems unconvinced. No surge. No panic.
Note: As of August 2025, we no longer offer the Deriv X platform.
The United States just bombed Iranian nuclear sites. Iran’s parliament voted to shut the Strait of Hormuz - a chokepoint for a fifth of the world’s oil. And yet, crude prices barely flinched. No surge. No panic. Just a brief uptick before settling down like nothing happened. For all the talk of global conflict, the oil market seems unconvinced. So, is this calm a sign of confidence, or are traders dangerously out of touch with the geopolitical reality unfolding around them?
Iran-US tensions: Markets, missiles, and a surprising shrug
Within an hour of markets opening, oil gave up most of its early gains. Brent briefly popped to $80. WTI hovered near $76. And then? Nothing. No runaway rally. No fear, trade. A move this muted would be odd after a production cut, let alone a bombing raid on nuclear infrastructure.
To recap: U.S. airstrikes targeted Iran’s Fordow, Natanz, and Isfahan nuclear sites. Iran responded with defiance, its foreign minister warning that “all options” remain on the table. Iran’s parliament even backed a motion to close the Strait of Hormuz, through which nearly 20 million barrels of oil pass each day.
Still, markets didn’t panic. If anything, they yawned.
Why the oil market sentiment is calm
Markets, after all, aren’t headline readers - they’re probability machines. And right now, they’re pricing in a few assumptions according to analysts:
- Iran may not follow through on closing Hormuz - not unless pushed.
- U.S. deterrence will hold, and full-blown escalation is unlikely.
- Inventories are healthy, and there’s no immediate supply crunch.
- Traders are tactical, playing short-term price action rather than long-term geopolitical shifts.
As veteran analyst Tom Kloza put it, traders are “waiting to see if Iran disrupts Hormuz before lifting the gas price alarm.” In other words, it’s a show-me market - full of hedged calls, not fear.
The Strait of Hormuz oil supply factor
The Strait of Hormuz isn’t just another oil route - it’s the oil route. Roughly 20% of global oil and a significant share of natural gas exports squeeze through this narrow stretch of water between Iran and Oman.

Iran’s parliament may have voted to close it, but the real decision lies with the Supreme National Security Council. And while Iran relies on Hormuz for its own exports, history shows that national pride, especially under external pressure, has a funny way of overriding economic logic.
Goldman Sachs warns that if even half the flows through Hormuz were disrupted for a month, Brent crude could spike to $110, and natural gas markets could also be jolted. In a more sustained disruption scenario, prices could remain elevated for months.
Are we underpricing the geopolitical risk premium again?
There’s a precedent here. After the 2019 drone attacks on Saudi Arabia’s Abqaiq facility, Brent surged nearly 20% in a single day - the biggest jump in history.

In early 2020, the killing of Iranian general Qassem Soleimani sparked fears of regional retaliation, but prices barely moved. It seems the market has grown numb to Middle East conflict - unless it hits actual barrels.
But there’s a danger in that numbness. Today’s geopolitical backdrop - a direct U.S. strike on Iranian nuclear infrastructure, rhetoric of retaliation, a formal threat to close a global oil artery - would have triggered a major repricing a decade ago. Now, it barely moves the needle.
So ask yourself: is the market smart, or just sedated?
Leaders shouldn’t follow oil price volatility blindly
Decision-makers, whether in finance, energy, logistics, or policy, should not follow markets blindly. The price of oil today may reflect trader optimism, high inventory buffers, or simply complacency. But it does not reflect the full range of outcomes, according to analysts.
Right now, prediction markets assign a 52% probability that Iran will attempt to close the Strait of Hormuz in 2025. If that happens, the rerating will not be gradual - it will be sharp and chaotic.
China, which buys over half of Iran’s exported crude, has major influence and equally large stakes in keeping Hormuz open. U.S. officials have already nudged Beijing to step in diplomatically, but those are quiet signals, not firm safeguards.
Oil price technical outlook: The calm before the what?
Oil markets may be dismissing the threat of World War III, but leadership can’t afford to. This isn’t about predicting the next move. It’s about preparing for the one everyone assumes won’t happen. If Iran retaliates, if the Strait of Hormuz is disrupted, today’s sleepy price chart could look laughably optimistic in hindsight.
For now, markets are betting on restraint. But when bombs fall and prices don’t rise, it might not mean the danger has passed - only that the clock is still ticking.
At the time of writing, oil prices are dipping sharply from the highs seen over the weekend. Oil prices are dipping within a buy zone, hinting at a potential price reversal. If we see a reversal, prices could find resistance at the $76.85 level. Conversely, if we see a protracted slump, prices could find support at the $73.08, $66.55, and $60.00 price levels.

Are you keen on how geopolitics will affect oil prices? You can speculate on the oil price trajectory with a Deriv X and a Deriv MT5 account.
Sorry, we couldn’t find any results matching .
Search tips:
- Check your spelling and try again
- Try another keyword