Results for

Japan’s Bond market decline is a cautionary tale for the US
For years, Japan was the textbook case of low rates and high debt without consequence. But now, the consequences are catching up.
Note: As of August 2025, we no longer offer the Deriv X platform.
Reports say Japan’s bond market isn’t just having a wobble - it’s in the midst of a full-blown reckoning. Yields are climbing, losses are mounting, and the central bank’s balance sheet is buckling under the weight of decades of easy money. For years, Japan was the textbook case of low rates and high debt without consequence. But now, the consequences are catching up. If Japan’s debt story feels distant, the US shouldn’t get too comfortable. The cracks in Tokyo may well be a preview of what’s going to Washington.
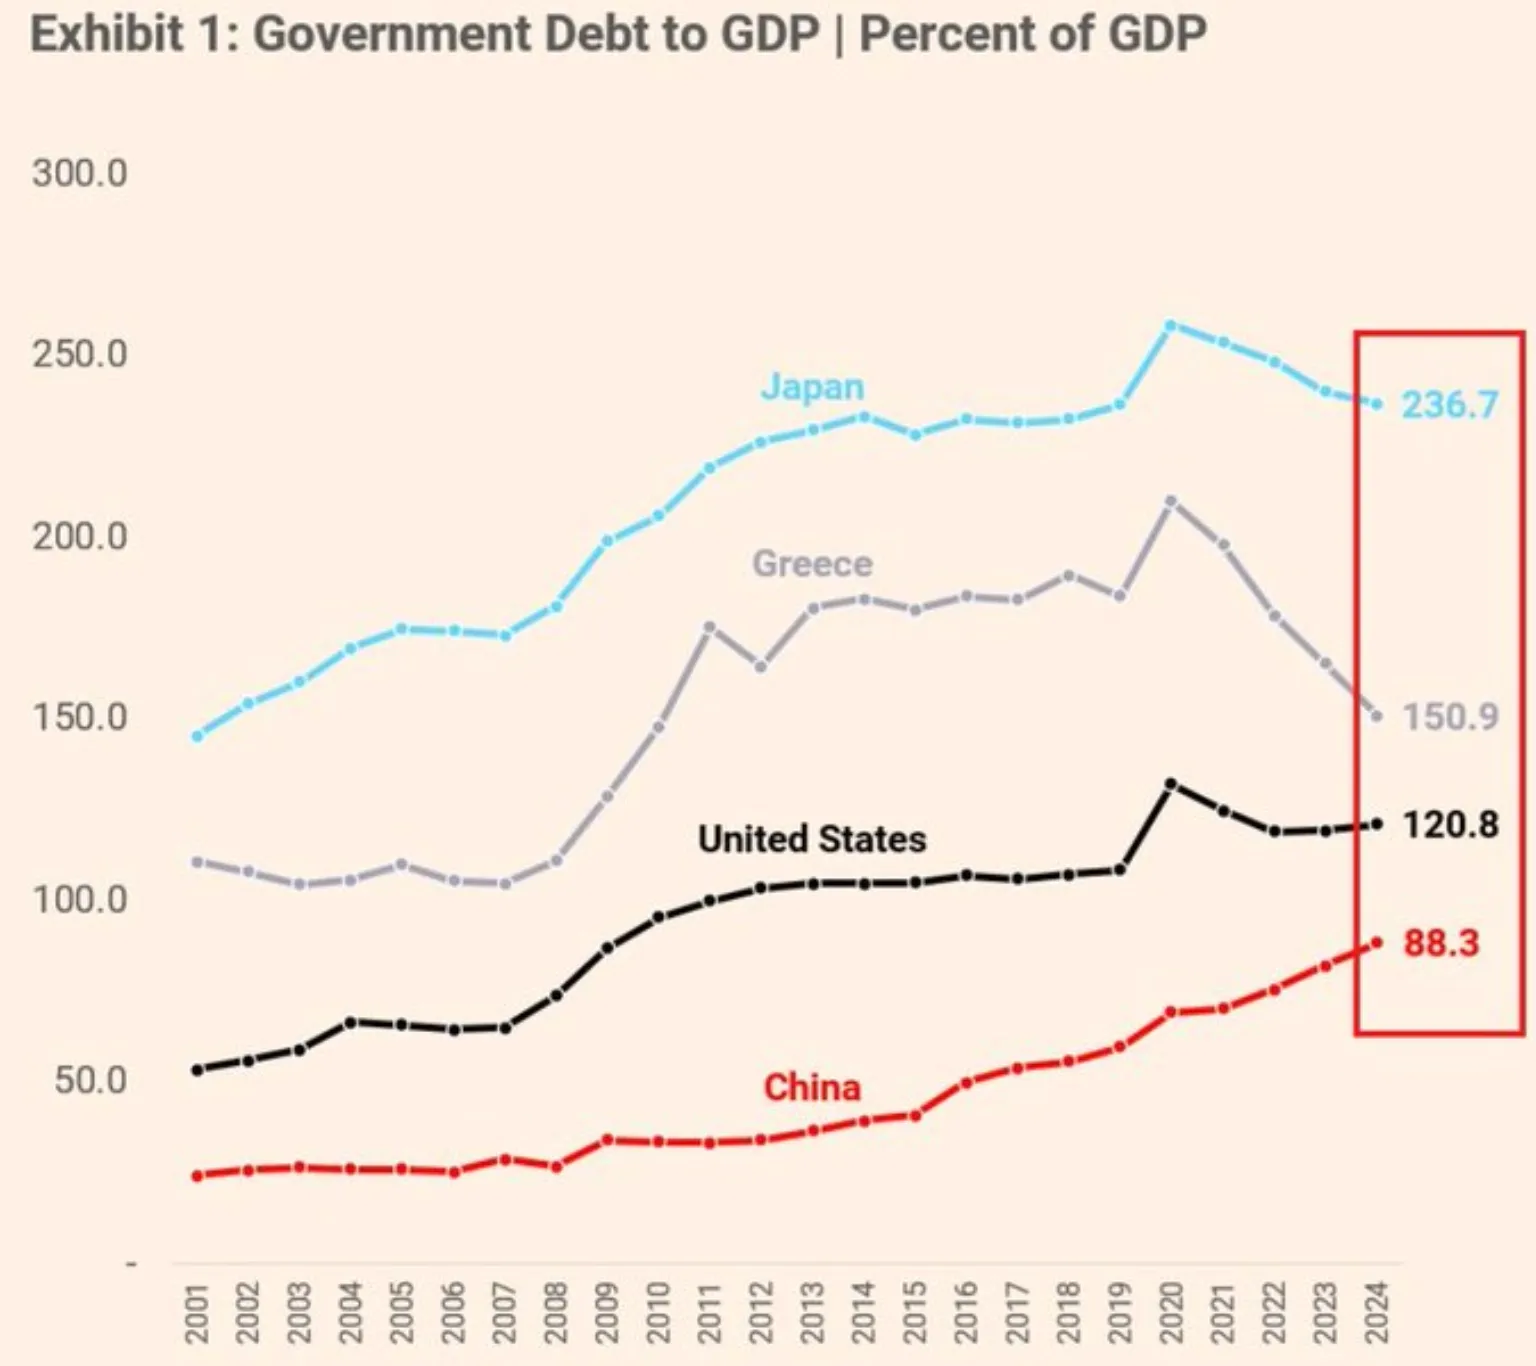
Government debt-to-GDP ratio: Fortresses no more
The 30-year Japanese government bond yield hit 3.209% in mid-July - the highest in years - marking a 100 basis point surge in just 12 months.
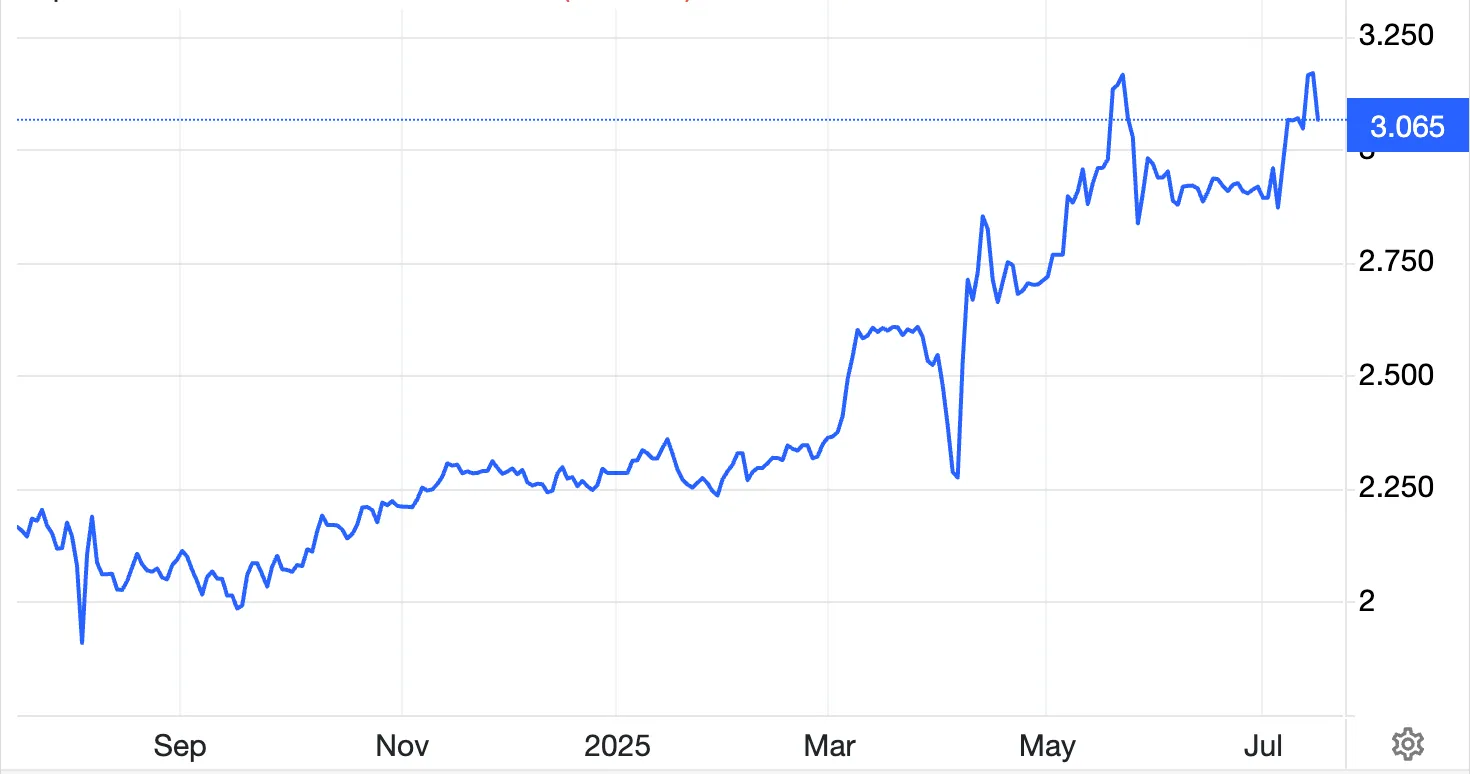
On the surface, that’s just a number. But beneath it lies something deeper: a 45% drop in bond value since 2019. This isn’t just a slide - it’s a collapse.
Japan’s bond market was once the gold standard of safety. But that status is slipping as investors grow uneasy about the country’s mounting debt burden, and more importantly, the Bank of Japan’s (BOJ) ability to manage it.
With a debt-to-GDP ratio now exceeding 260%, more than double that of the United States, Japan’s fiscal house is looking shakier by the day.
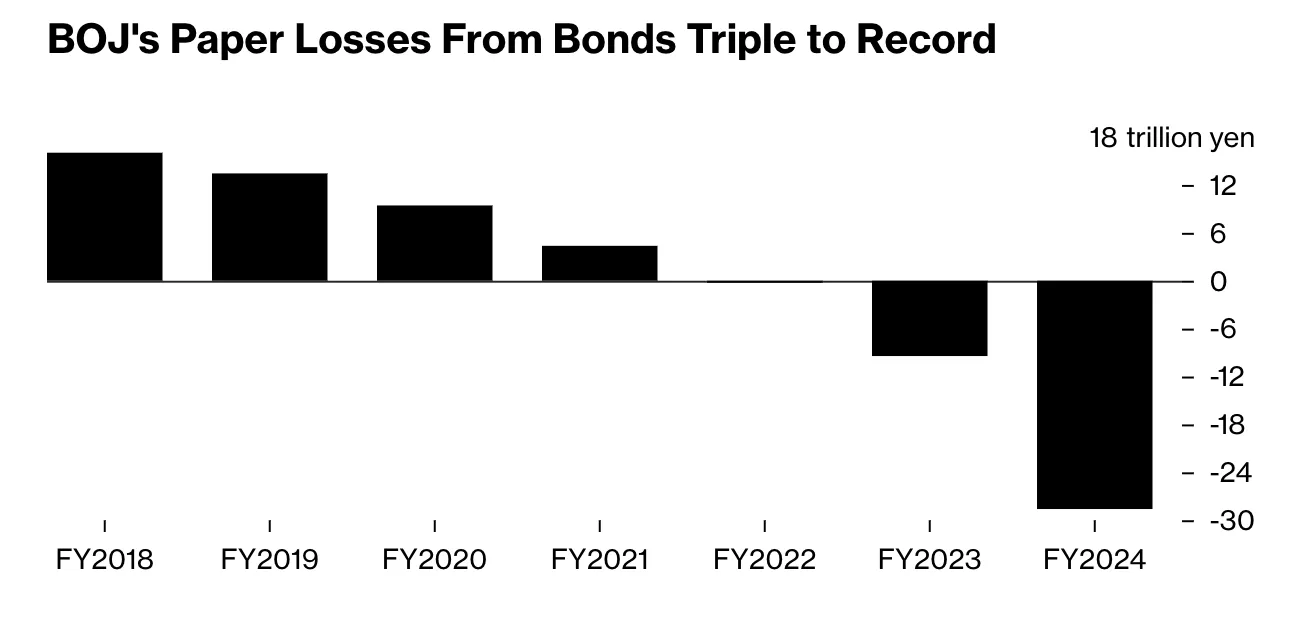
Bank of Japan bond losses: The cost of confidence
The Bank of Japan, once a guardian of market stability, is now sitting on a record ¥198 trillion (about $198 billion) in unrealised losses on government bonds - a threefold increase in just one year. That’s not just a paper cut. It’s a gaping wound.
The fallout doesn’t stop there. Japan’s largest life insurers, long-time holders of government debt, reported a combined ¥60 billion in unrealised losses in Q1 2025 alone - quadruple what they held just a year earlier. Rising yields are rippling through the financial system, quietly eroding balance sheets and tightening liquidity.
Perhaps most telling of all: over 52% of all Japanese government bonds are now owned by the BOJ itself. When the buyer of last resort becomes the primary holder, the system starts to look eerily self-referential - and dangerously fragile.
A debt playbook the world knows well
Japan’s economic story is unique in many ways - a rapidly ageing population, a deflationary mindset, and a penchant for long-term planning. But its playbook - low interest rates, heavy bond-buying, and ballooning public debt - is anything but isolated.
In fact, it’s starting to sound rather familiar. In the United States, 10-year Treasury yields have surged over 500% since 2020.
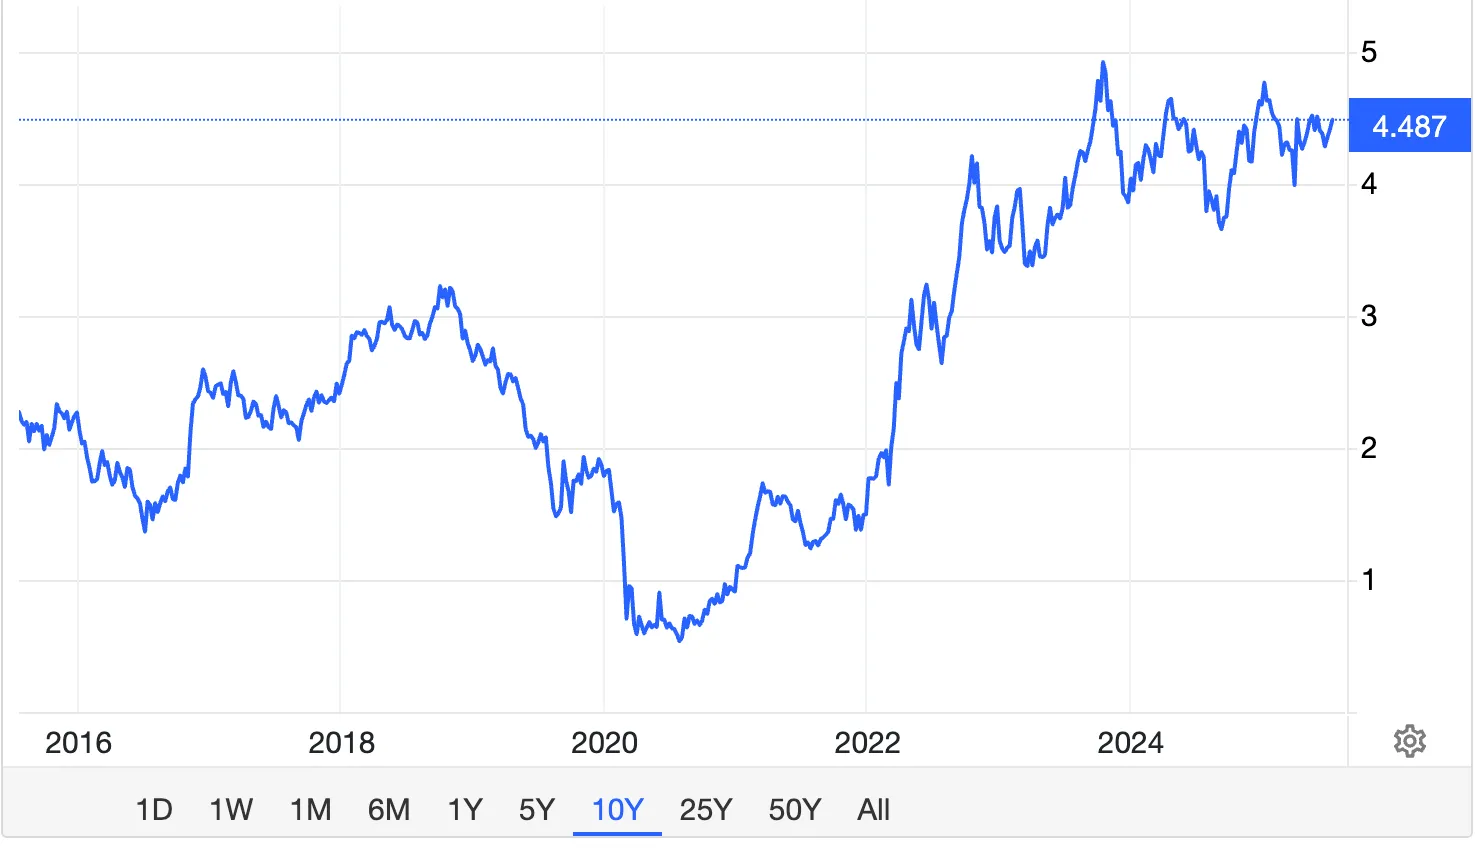
Banks are shouldering more than $500 billion in unrealised bond losses. Deficit spending is accelerating. And central bank balance sheets are still bloated from years of stimulus. While the US hasn’t reached Japan’s 260% debt-to-GDP, it’s moving fast - and with fewer excuses.
Global bond market liquidity
What’s happening in Japan isn’t just about Japan. It’s a signal of what happens when confidence starts to slip - when the promise that governments can always repay their debts no longer feels like a sure bet.
Market liquidity is drying up. Bloomberg’s Government Bond Liquidity Index has dropped below levels seen during the 2008 crisis, and investors are taking note. Gold and Bitcoin are surging, not just on speculation but on fear that the rules of the old monetary system might be fraying.
This moment also challenges long-held beliefs. For decades, economists insisted that high debt levels were manageable as long as interest rates stayed low. But Japan has kept its policy rate at 0.50%, and still faces bond yields around 3.1%, on par with Germany, whose debt load is just a fraction. That disconnect suggests something more profound is at play: trust is eroding.
The message markets are sending
Japan’s bond market is offering the world a lesson in real time - one that policymakers and investors would do well to study. A country can carry high debt and low rates for a long time… until it can’t. Once yields rise, the feedback loop kicks in: losses mount, confidence erodes, and liquidity evaporates.
The real warning for economies like the US isn’t just in the numbers - it’s in the trajectory. The very tools that kept systems afloat - such as bond purchases, ultra-low rates, and fiscal expansion- may now be amplifying the risks. And unlike in the past, there’s no clean exit.
USDJPY price outlook
According to experts, Japan’s bond market decline isn’t an isolated incident or a temporary blip. It’s a stress test for the global financial order - and it’s revealing just how fragile that order might be. As the world’s second-largest bondholder starts to buckle, others should take note.
This isn’t about panic. It’s about preparation. Because if Japan’s reckoning has begun, the real question isn’t whether the US and others will face one too, but when. Meanwhile, the USDJPY pair continues to climb, reflecting investor jitters and the widening gap between US and Japanese bond yields.
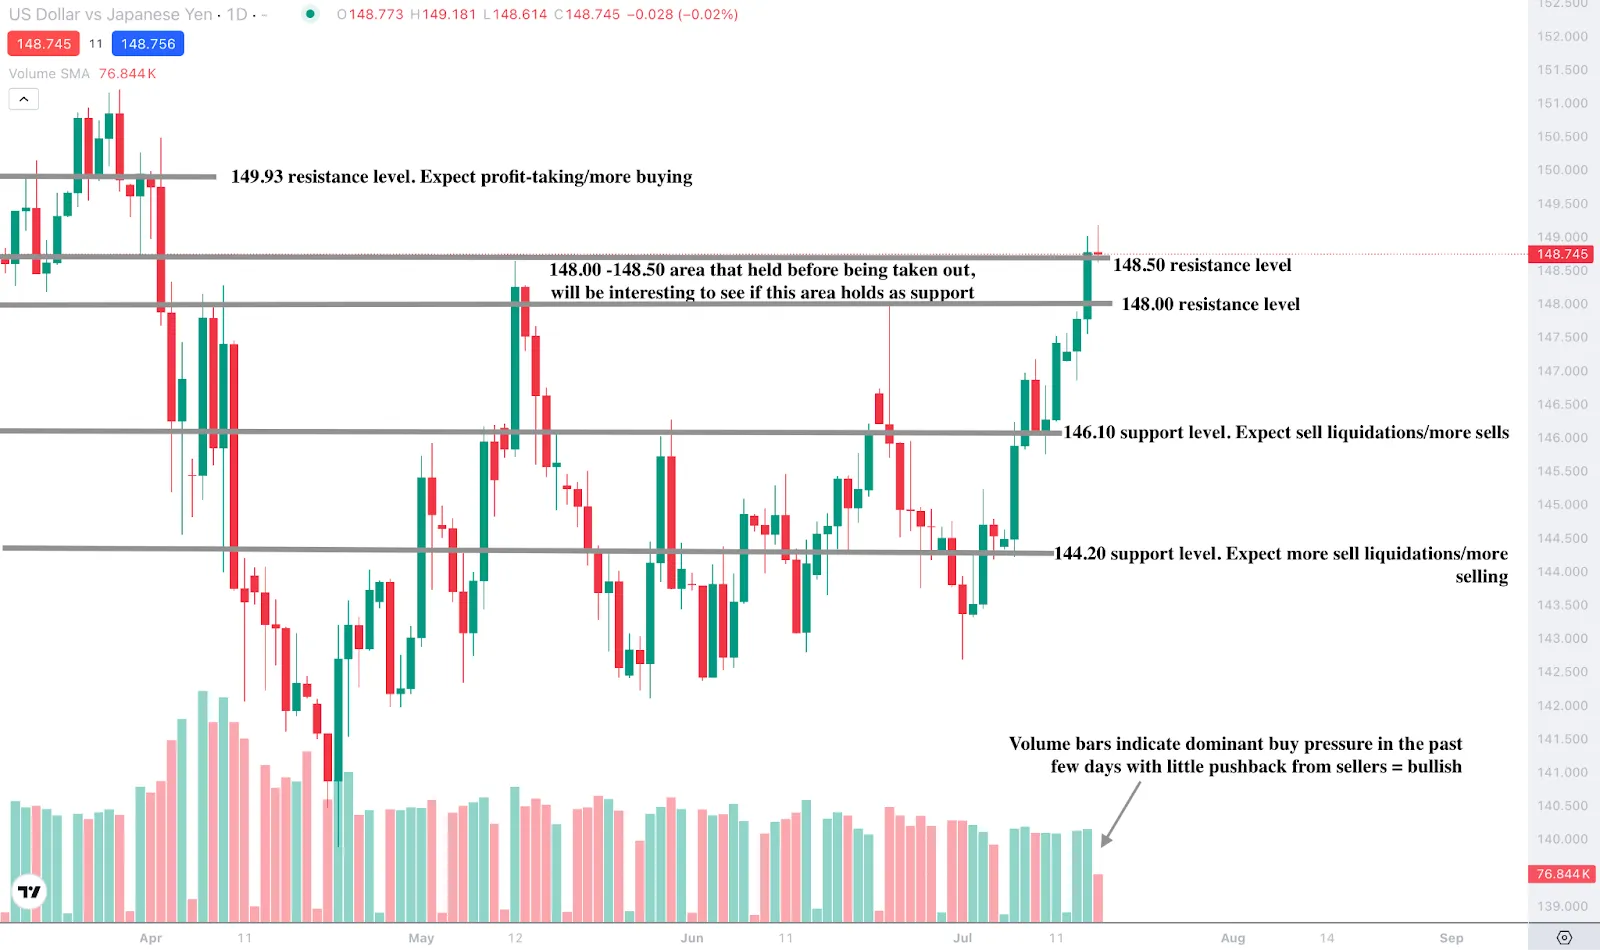
At the time of writing, the pair is still quite bullish with price coming out of a 4-month consolidation. The volume bars indicate that sellers have barely offered any pushback over the past few days, hinting at a pathway to more upside for the pair. If we see more upside, prices could encounter resistance at the 149.93 resistance level. Conversely, if we see a slump, prices could find support floors at the 146.100 and 144.200 support levels.
.webp)
Can Nvidia’s stock keep climbing after its 4 trillion milestone?
Nvidia has just done the unthinkable - hit a four trillion dollar market valuation. And yet, with shares hovering around $163, the question on every investor’s mind is simple: Can it go higher?
Note: As of August 2025, we no longer offer the Deriv X platform.
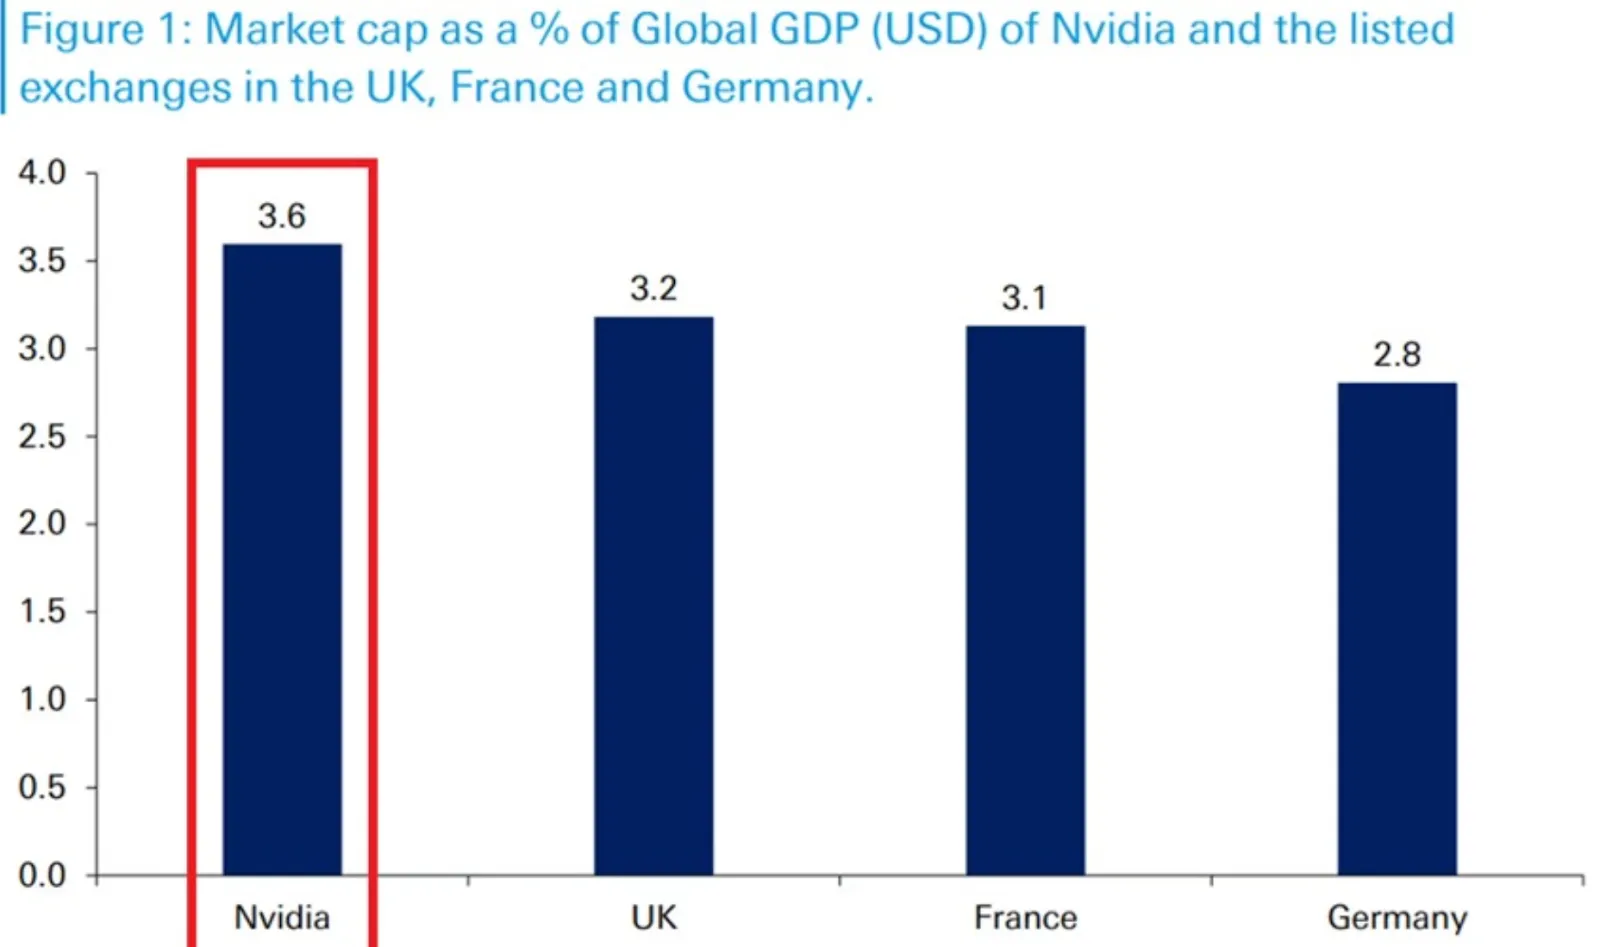
Nvidia has just done the unthinkable - hit a four trillion dollar market valuation. That’s not just impressive; it’s historic. It’s bigger than the entire UK stock market and more valuable than France and Germany’s combined. And yet, with shares hovering around $163, the question on every investor’s mind is simple: Can it go higher?
With AI booming, earnings soaring, and Wall Street buzzing, Nvidia looks unstoppable. But in markets, what goes up doesn’t always keep going. So, is $180 just around the corner?
Nvidia AI chip demand: The case for more upside
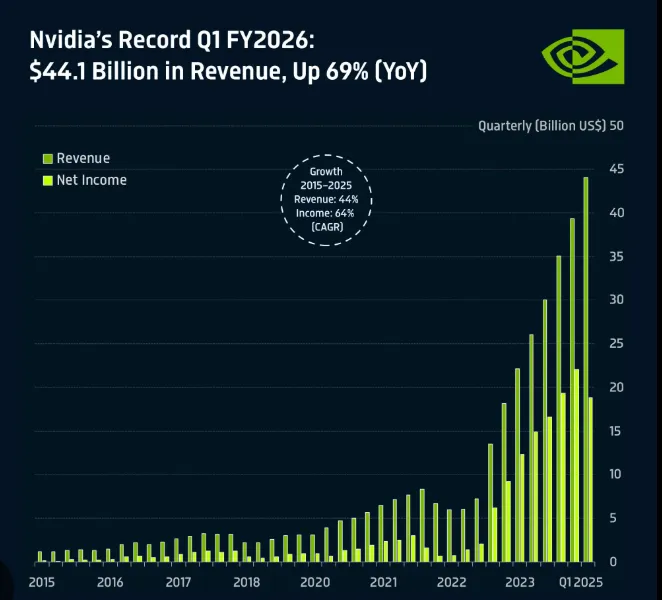
There’s no doubt Nvidia’s rise is rooted in fundamentals. First-quarter revenue surged 69% to $44.1 billion, and analysts are forecasting a blowout 2025: $200 billion in sales, $100 billion-plus in net income, and margins brushing up against 70%.
Not bad for a company that was worth just $144 billion six years ago. The real tailwind? AI. Nvidia’s chips are powering everything from OpenAI’s training clusters to smart factories in China.
Big names like Microsoft and Amazon are throwing money at AI infrastructure, and Nvidia remains the preferred supplier. No surprise, then, that CFRA’s Angelo Zino has a $196 price target, suggesting a market cap of nearly $4.8 trillion could be on the cards.
If Nvidia’s earnings, set for 27 August, meet expectations, some think the stock could easily add $10-$20 in a matter of days. With bullish chatter heating up on X (formerly Twitter) and the stock holding a hefty 7.5% weight in the S&P 500, the FOMO effect could well take hold, pushing the price closer to that $180–$200 zone, according to analysts.

Nvidia earnings forecast
To grasp just how far Nvidia has come, it’s worth revisiting the dot-com days. At its peak in 2000, Cisco’s valuation reached $550 billion, equivalent to 1.6% of global GDP. Nvidia now commands 3.6%. That’s not a typo.
And yet, comparing market cap to GDP has its critics. GDP is an annual flow of goods and services, and market cap is a snapshot of future expectations. As some analysts on X rightly note, it’s not quite apples to apples.
Still, others point to Nvidia’s projected net income of $153 billion in three years, nearly matching the entire FTSE 100. Now that’s a comparison worth chewing on.
What could go wrong?
Of course, no stock climbs forever. Nvidia’s forward price-to-earnings ratio may be sitting at a “reasonable” 33 (below its 5-year average of 41), but it’s still pricing in a whole lot of perfection. Any wobble, whether in earnings, AI spending, or global chip demand, could knock the wind out of its sails, according to analysts.
There’s also the thorny issue of geopolitics. Nvidia relies heavily on Taiwan for chip production, and escalating US-China tensions pose real risks. Add in the possibility of fresh export controls or tariffs, and supply disruptions could become more than just a headline risk.
Then there’s the trading dynamic. With only a 0.02% dividend yield and plenty of leveraged exposure in the market, any spike in interest rates or bout of margin selling could cause a sharp pullback. Let’s not forget: Nvidia lost nearly $600 billion in value earlier this year after DeepSeek’s surprise AI model announcement spooked the market.
Nvidia price Short-term outlook: $150 or $185 next?
According to analysts, in the next month or two, Nvidia’s price could swing between $150 and $185. A strong August earnings report could see it take out recent highs and test $180, while a miss - or a geopolitical curveball - could knock it back below $150.
Looking further out, the path diverges. If AI adoption continues to explode and Nvidia stays ahead of rivals like AMD, we could be talking $200–$250 by year-end. But if macro conditions tighten or competitors gain ground, a retrace to $125–$140 isn’t out of the question.
Nvidia’s $4 trillion milestone isn’t just about valuation - it’s a statement. A signal that the market believes AI isn’t hype, but a full-blown economic revolution. Still, even revolutions face resistance.
According to experts, whether Nvidia breaks through to $180 and beyond will depend on earnings, sentiment, and a healthy dose of geopolitical luck. For now, the stock may be flying high, but it’s not immune to gravity.
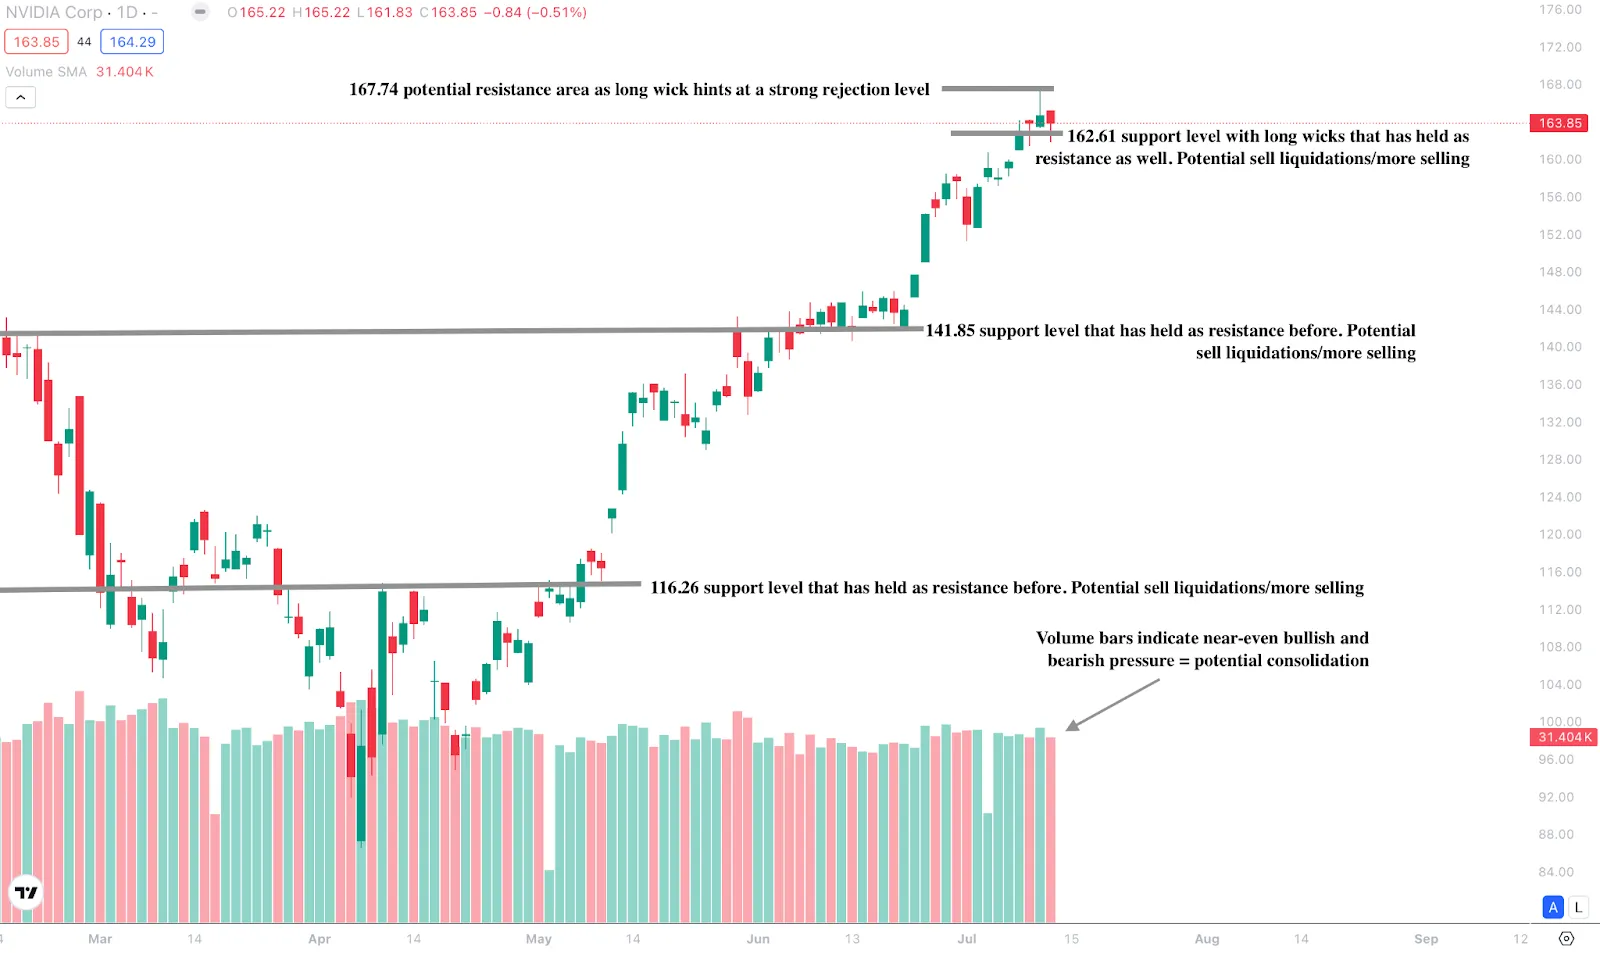
At the time of writing, we are seeing a slight pullback from record highs, indicating that sellers are offering some pushback which could lead to a significant drawdown. However, the volume bars paint a picture of near-even buy and sell pressure - hinting at potential consolidation. The $167.74 price is a potential resistance level if prices tick upwards. Conversely, should we see a crash, prices could find support floors at the $162.61, $141.85 and $116.26 support levels.

Bitcoin price hits 122K amid short squeeze murmurs
Bitcoin just passed $122k, and the crypto crowd is buzzing. Is this the start of something bigger - or are the bears about to get burned?
Bitcoin just passed $122k, and the crypto crowd is buzzing. While bulls celebrate the breakout, a new narrative is gaining steam: a potential short squeeze could fuel the fire. With Ether shorts hitting record highs and macro uncertainty still swirling, this rally might be running on more than just momentum.
Is this the start of something bigger - or are the bears about to get burned?
Two key dates changed everything
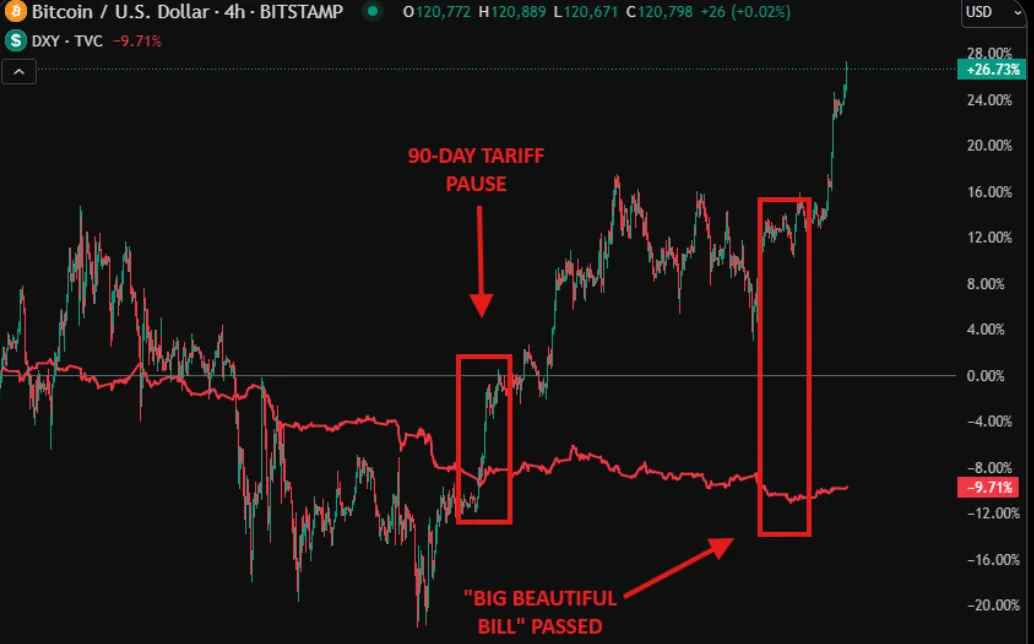
If you zoom out, Bitcoin’s recent moves weren’t random. Two major U.S. policy moments -9 April and 1 July - appear to have kicked off this latest wave of price action. The first was the 90-day tariff pause, which signalled potential monetary easing.
The second is the passing of the “Big Beautiful Bill," a fiscal bombshell projected to cut federal revenue by $5 trillion over a decade. Both events coincided with clear divergences on the charts - Bitcoin surged while the U.S. Dollar Index ($DXY) slipped hard. In fact, the dollar has dropped 11% in just six months. Traders and institutions took the hint.
From spending spree to crypto rally
May 2025 delivered one of the most eye-watering figures yet: a $316 billion U.S. deficit in a single month - the third-largest in history, according to the Congressional Budget Office.
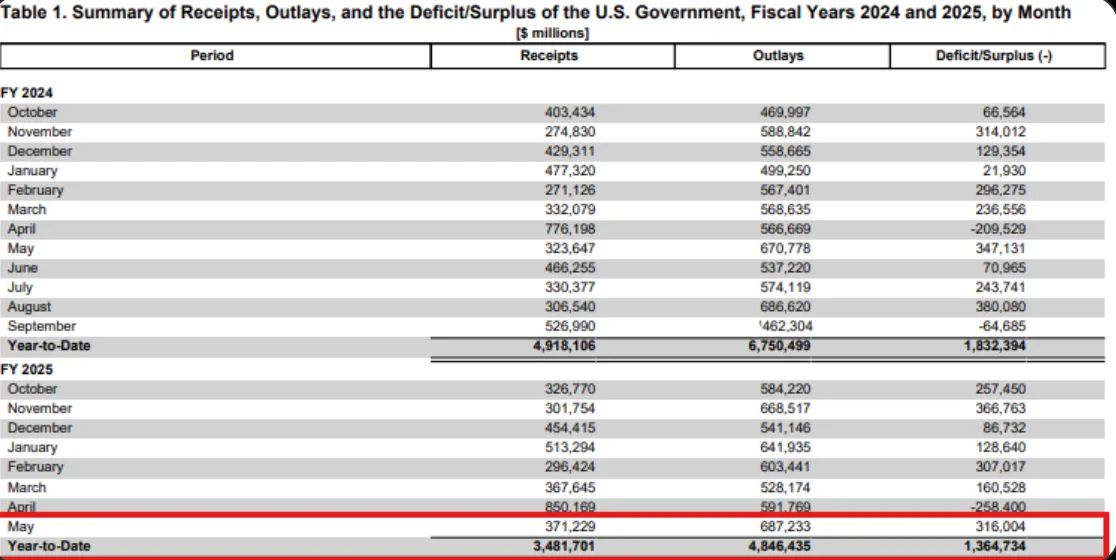
Add in the looming projections of a $1.9 trillion full-year deficit, and markets are now firmly pricing in long-term fiscal strain. Bitcoin isn’t just reacting to hype anymore. It’s starting to act like a macro barometer - a hedge against reckless spending and weakening fiat credibility. And the market’s behaviour reflects that: as the U.S. deficit deepens, Bitcoin’s price keeps climbing.
Eyes on Bitcoin ETFs: Institutions are quietly all in
This rally isn’t retail-driven. It’s institutional. The iShares Bitcoin ETF ($IBIT) has amassed a jaw-dropping $76 billion in assets under management, and it did it in less than 350 days. For context, gold’s flagship ETF ($GLD) took 15 years to hit the same milestone.
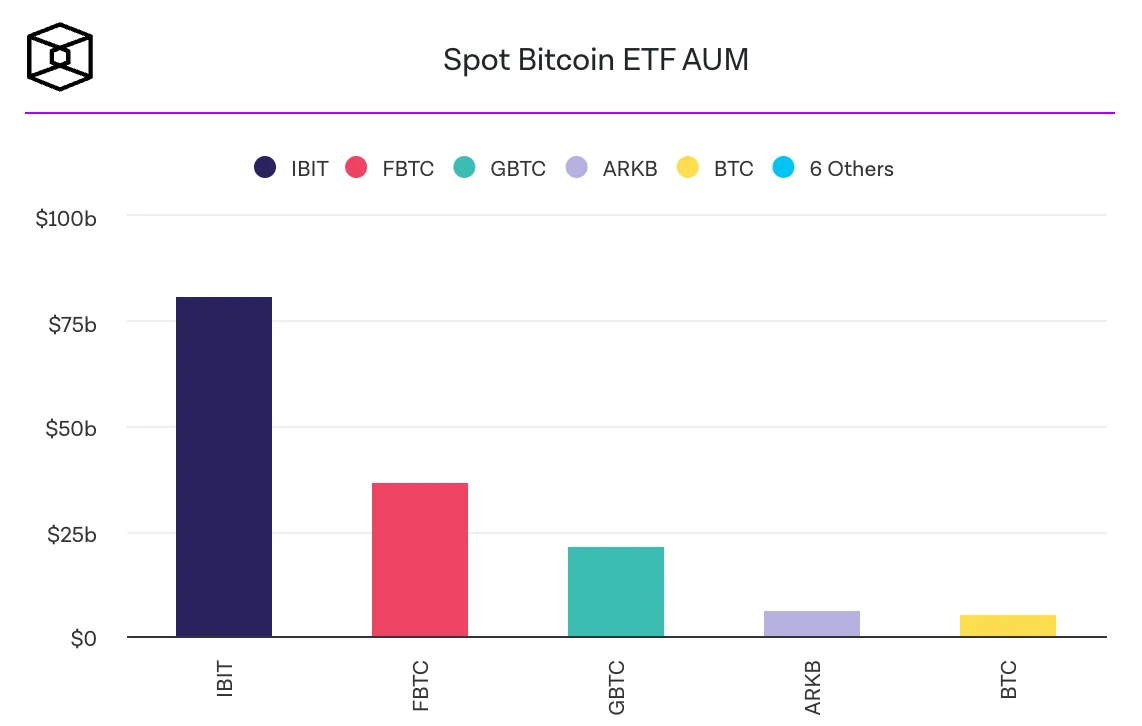
That shift isn’t just symbolic - it’s structural. Hedge funds and family offices are reportedly allocating around 1% of their portfolios to Bitcoin. They’re not doing it for fun - they’re doing it because Bitcoin is behaving like an escape hatch in an increasingly uncertain environment.
Shorts could be the final fuel
Then there’s Ether. According to recent data (via ZeroHedge), leverage shorts on Ether have hit all-time highs - a setup eerily similar to what we saw right before the April 2025 bottom. If a squeeze happens there, Bitcoin could ride the wave even higher.
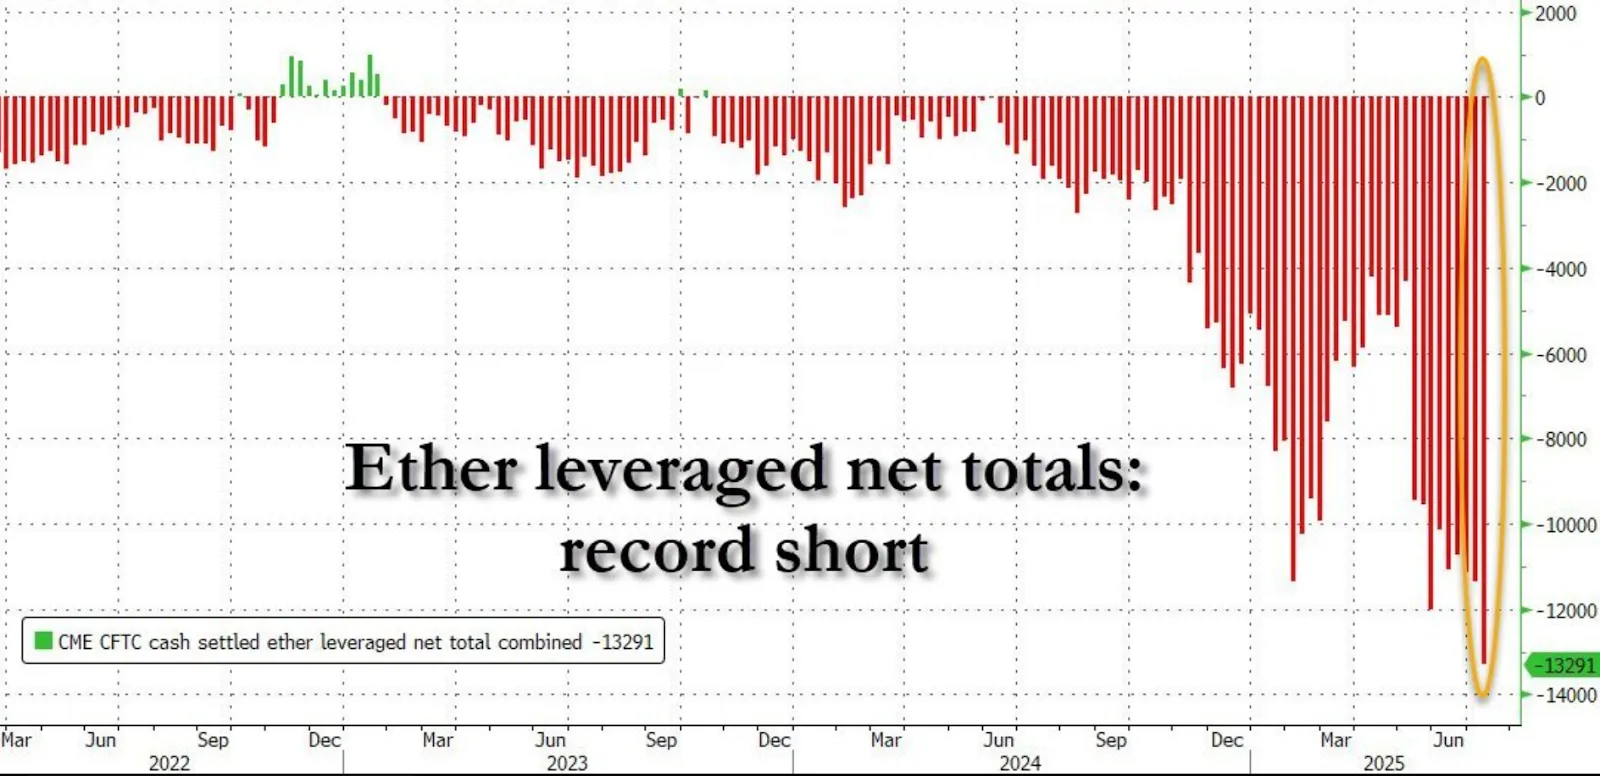
In other words, this isn’t just a story of long-term fundamentals. There’s potential firepower on the short side, too. A few liquidation cascades could turn a healthy rally into an all-out melt-up.
Bitcoin price outlook: Is Bitcoin the new normal?
Traditional safe havens like gold are rising. The dollar is falling. Yields are rising. And Bitcoin? It’s surging. These aren’t disconnected events - they’re all part of the same economic puzzle.
Bitcoin’s role is evolving. It’s not just a tech bet or an inflation hedge. It’s becoming a reaction to policy, to debt, deficits, and the sense that nobody’s steering the ship. Whether this ends in a squeeze, a supercycle, or something else entirely, one thing’s clear:
Markets are no longer ignoring Bitcoin. And neither should you.
At the time of writing, BTC is still soaring towards new highs. A wick is forming at the top, a telltale sign of seller pushback. However, the volume indicates that sell pressure has yet to manifest with conviction - an indicator that we could see more upside before the uptrend experiences exhaustion. If we see an uptick, prices could encounter resistance at the $123,275 price level. If we see a crash, prices could find support at the $108,000 and $105,000 support levels.


Trump's rate cut talk pushes gold price to new highs
It sounds wild, but that’s exactly what markets are whispering. President Donald Trump is now calling for a 300 basis point interest rate cut - the biggest in US history by a mile
It sounds wild, but that’s exactly what markets are whispering. President Donald Trump is now calling for a jaw-dropping 300 basis point interest rate cut - the biggest in US history by a mile. While that’s raising plenty of eyebrows, one asset is quietly loving the chaos: gold. With safe-haven demand climbing and inflation risks back in the spotlight, could this be the moment gold makes a run at $5,000?
Trump’s interest rate cut push
To put it plainly, a 300-point cut would be three times larger than the Fed’s record-breaking 100 bps slash in March 2020, during peak pandemic panic. Back then, gold soared, the dollar sank, and investors braced for inflation.
Now? Trump is pushing for a cut of that magnitude in a growing economy. The US is not in recession. In fact, GDP is running hot at 3.8% year-on-year.

Yet Trump argues that high interest rates are costing the US dearly in debt servicing - over $1.2 trillion annually, or roughly $3.3 billion a day in interest payments.
According to Trump, every 1% cut could save around $360 billion on $36 trillion in debt. But that number’s a bit fuzzy. In reality, only publicly held debt (about $29 trillion) is affected, and not all of it can be refinanced overnight.

Still, according to experts, the math points to potential savings of $870 billion per year if a full 3% cut were applied. More realistically, if just 20% of the debt is refinanced in year one, it could still shave off $174 billion - not pocket change.
Gold safe haven demand rises amid trade tensions
While markets digest the economic logic, gold has quietly rallied for three days straight, edging towards the top of its weekly range. Behind the scenes, Trump has also reignited a full-blown trade war, issuing more than 20 tariff notices in just one week, including a 35% tariff on Canadian imports and steep duties on Brazil and copper.
Investors are understandably jittery. Trade tensions are typically bad news for global growth, but they’re great news for gold. The yellow metal thrives in times of uncertainty. Add a falling US dollar (down over 10.8% in Q1 and Q2 - its worst start to a year since 1973), and the mix becomes even more gold-friendly.
The Federal Reserve interest rate factor
Normally, rising gold prices would coincide with growing expectations for a Fed rate cut. But here’s the twist - those expectations have cooled. The Fed’s latest meeting minutes showed division among officials. Some want cuts soon. Others see no urgency at all.
On one hand, San Francisco Fed President Mary Daly suggested rates could come down eventually, saying current policy remains restrictive. On the other, St. Louis Fed President Alberto Musalem struck a more cautious tone, warning it’s too early to gauge the full inflationary impact of tariffs. And Christopher Waller, a known dove and possible Powell successor, called for an early cut - but insisted it wouldn’t be political.
For now, the Fed seems stuck between strong job data and inflation risk. Initial jobless claims recently fell to 227,000, beating forecasts and signalling labour market resilience. That’s made the central bank wary of cutting too soon - even as Trump turns up the heat.

Gold forecast: Could it really hit $5,000?
Here’s the bullish case. If the Fed were to follow through on Trump’s wishes (or even partially), it would likely:
- Drive the dollar lower
- Ignite inflation expectations
- Stoke a safe-haven rush
- And potentially send gold on a parabolic move
Some analysts believe this scenario could send gold past $5,000 per ounce, especially with ongoing trade disruptions and global policy divergence in play. Gold is already up 40% over the past year, and 80% over five years - momentum is on its side.
And if all that sounds familiar, it’s because we’ve been here before. Post-2020, rate cuts and stimulus pushed gold to then-record highs. The environment now may be different, but the cocktail of trade wars, political drama, and central bank pressure is starting to taste a lot like déjà vu.
Gold technical outlook
Trump’s 300-point rate cut proposal might never happen, but the mere suggestion of it is reshaping market psychology. It’s fanning the flames of inflation fears, weakening the dollar, and bolstering demand for assets like gold.
So could gold hit $5,000? If the stars align, rate cuts, trade wars, a softening Fed, then yes, the path is there. Whether or not it takes that path is the real story investors will be watching.
At the time of writing, Gold is seeing a significant uptick within a sell zone, hinting that the uptick may be curtailed. However, the volume bars indicate waning sell pressure, hinting at a potential uptick. If we see an uptick, prices could be held at the $3,365, $3,395, and $3,450. Conversely, if we see a slump, prices could find support at the $3,300 and $3,250 support levels.

Could gold hit 5K? You can speculate on the price of Gold with a Deriv MT5 or Deriv cTrader account.

Bitcoin price all-time high has bulls chasing 120K
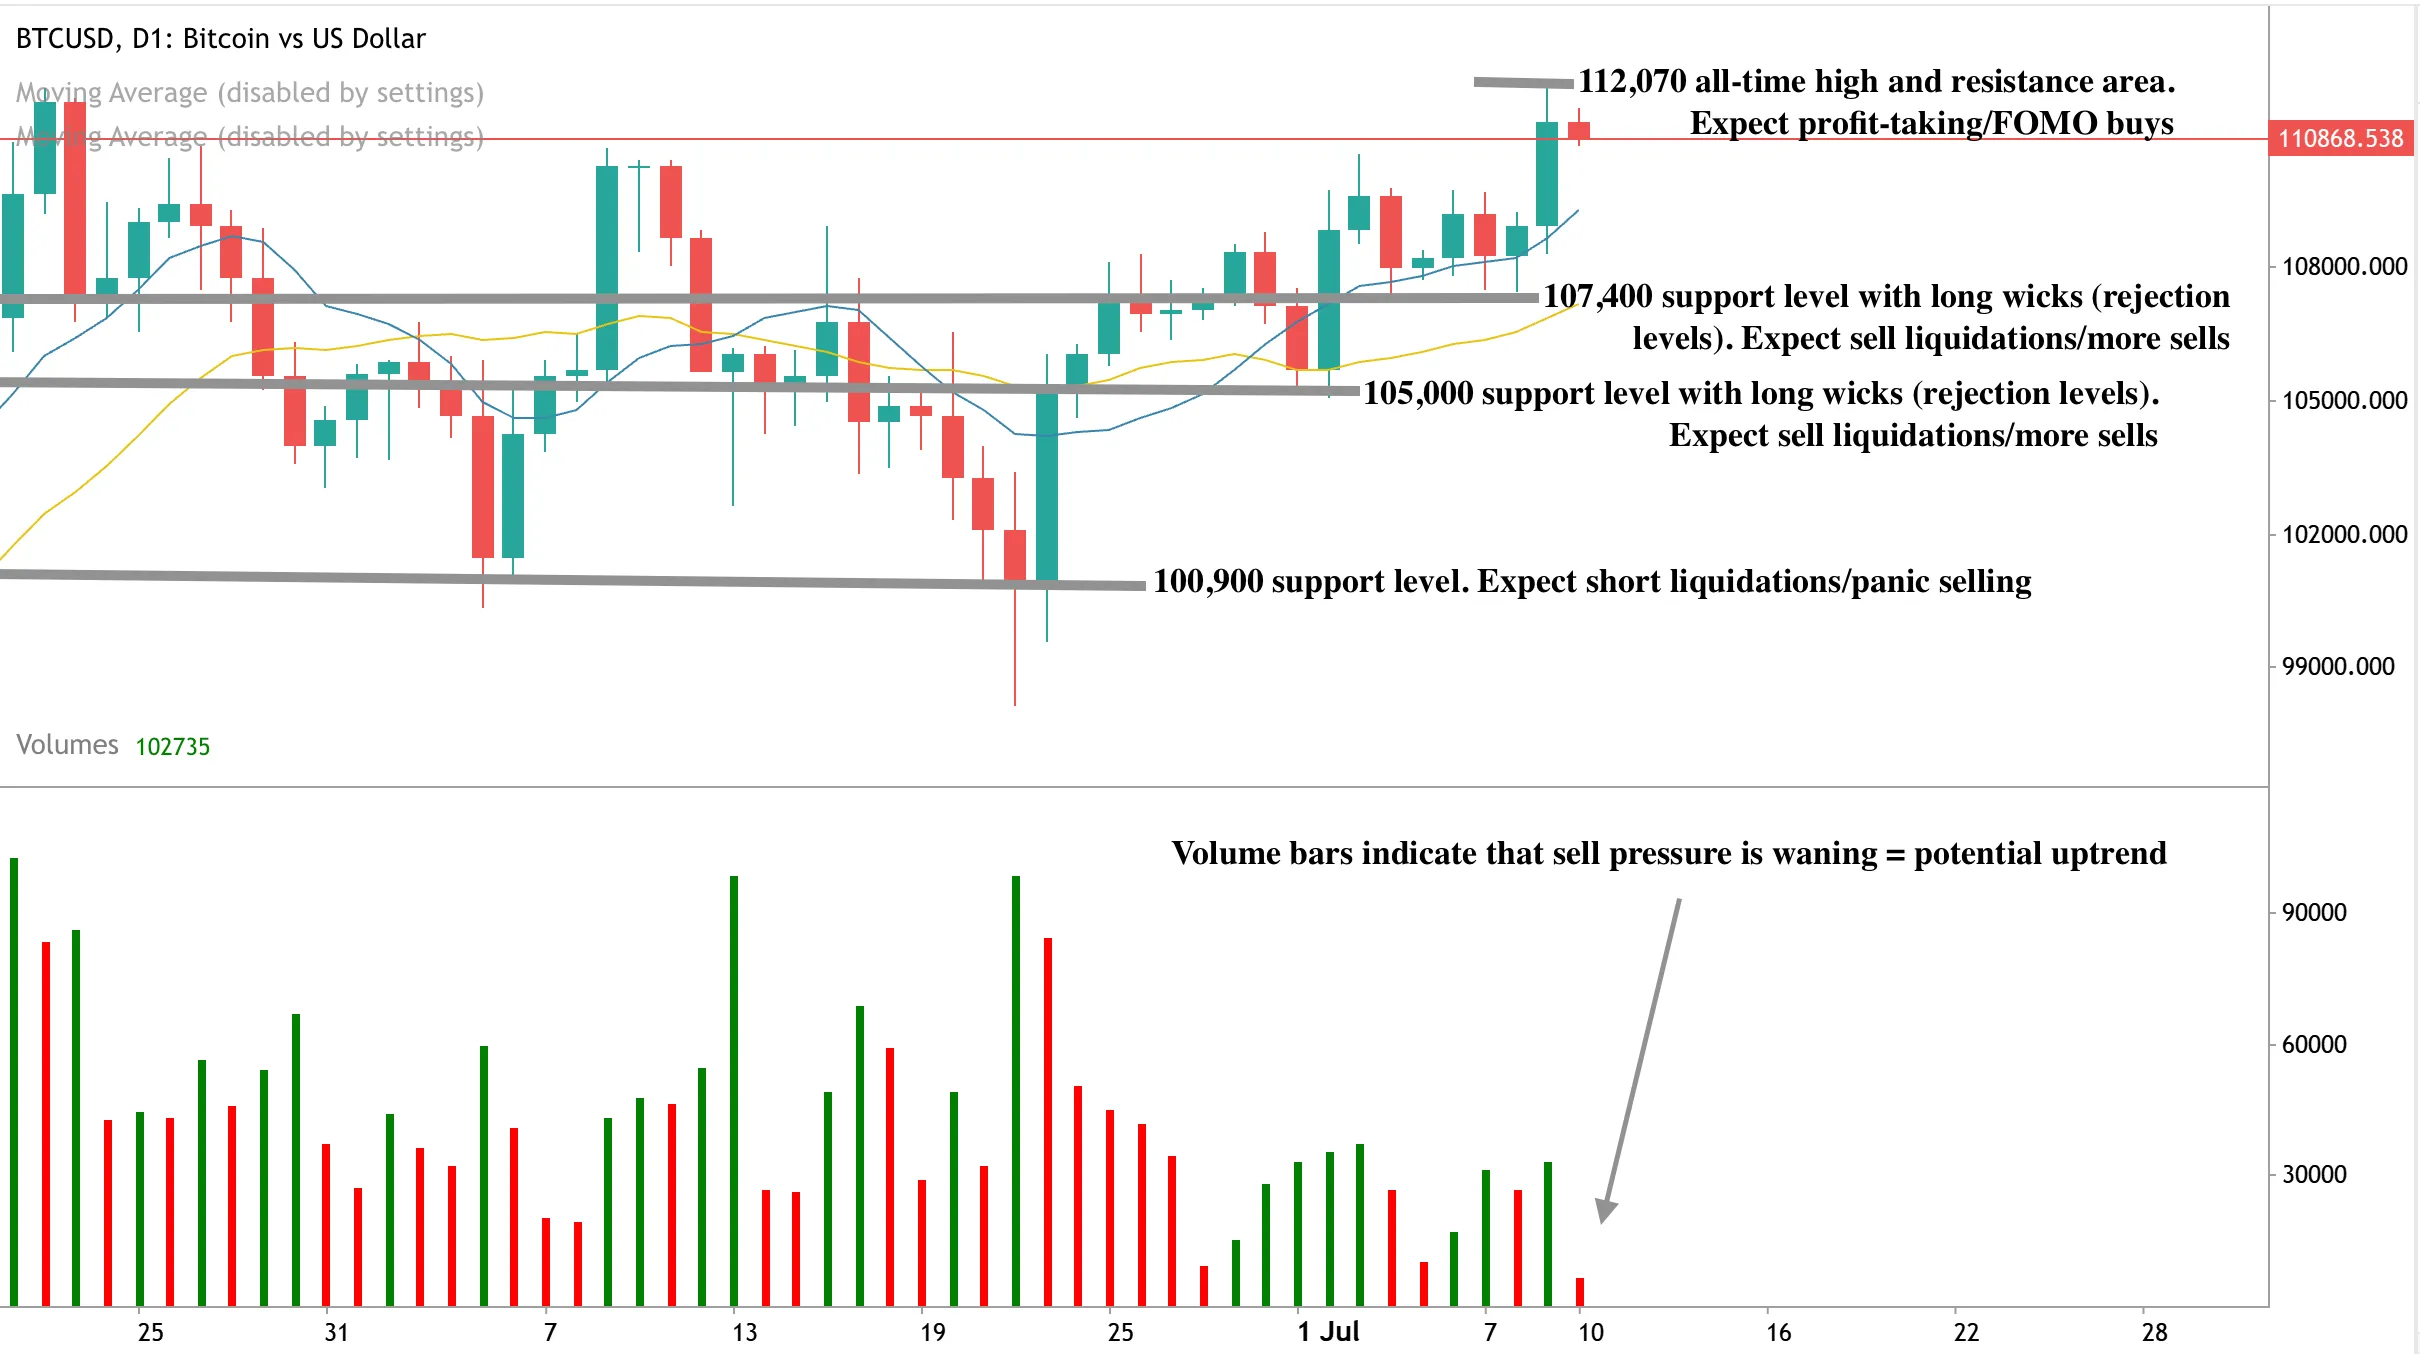
Bitcoin’s back in the spotlight and it’s not messing about. After smashing through its all-time high to top $112K, the world’s favourite cryptocurrency is once again testing the limits of what’s possible.
Note: As of August 2025, we no longer offer the Deriv X platform.
Bitcoin’s back in the spotlight and it’s not messing about. After smashing through its all-time high to top $112K, the world’s favourite cryptocurrency is once again testing the limits of what’s possible. With momentum building and the charts lighting up, the big question is doing the rounds: is $120K just around the corner, or are we getting ahead of ourselves?
Let’s unpack what’s driving the rally - and whether this time, it really is different.
A bitcoin price rally fuelled by more than just hype
This latest surge didn’t come out of nowhere. It was supercharged by the liquidation of over $425 million in leveraged short positions - a classic short squeeze that sent Bitcoin flying past the long-standing $110K resistance zone.

But unlike previous spikes that fizzled out as fast as they appeared, analysts say this one has substance. The momentum is being powered by real demand. According to analysts, people aren’t just banking on price moves - they’re buying to hold. Exchange reserves have dropped to their lowest since March, suggesting long-term conviction is on the rise. It’s less froth, more foundation.

Institutions pile into Bitcoin ETFs
The numbers speak volumes. Bitcoin ETFs, only approved in early 2024 after years of regulatory wrangling, have already topped $150 billion in assets under management. For context, it took gold ETFs over 16 years to hit that same milestone. That kind of growth doesn’t happen unless big players are piling in.

Backing this up, a study in the Journal of Financial Economics shows that nearly 70% of institutional investors now see Bitcoin as a legitimate asset class. And in a notable pivot, JPMorgan analysts have turned bullish on BTC, now expecting it to outperform gold in the second half of the year. They’ve even described the trend as a “zero-sum game” - when gold slips, Bitcoin climbs. That’s a big deal in traditional finance circles.
From digital gold to political headlines
There’s another force at play - politics. Bitcoin is increasingly behaving like a geopolitical hedge. Following President Trump’s announcement of sweeping tariffs on countries like Malaysia and South Africa, Bitcoin didn’t flinch. In fact, it rallied - and has continued to decouple from equity markets on days the S&P 500 corrects.
That perception of Bitcoin as a safe haven is gathering steam, especially as fears over fiat debasement resurface. Analysts at Sygnum Bank say this shift is helping Bitcoin carve out a role traditionally held by gold, but with the added allure of digital innovation.
Crypto regulation news could garner more institutional interest
All this is happening against a surprisingly pro-crypto policy backdrop. The U.S. Congress is preparing to debate the Genius Act - a bill designed to bring stablecoin issuers under regulatory oversight. It’s been redrafted to address concerns around consumer protection and national security, and now appears to have bipartisan support.
Bo Hines, executive director of the president’s council of advisors for digital assets, bluntly stated during this week’s Consensus conference: “We’re ready for adoption. We are moving extremely quickly and effectively.”
The implication? If passed, this legislation could unlock a new wave of institutional interest, particularly from cautious players waiting for clearer regulatory guardrails.
Bitcoin price prediction: Is 120K next?
Technically, Bitcoin is flirting with the next psychological milestone. It’s already broken out of a tight trading range and is holding above previous resistance. If it can stay there, and macro conditions remain supportive, $120K could come into view faster than many expect.
That said, a word of caution: the IMF recently warned that crypto assets remain three times more volatile than traditional ones. And while ETF growth is impressive, some market watchers worry it could be distorting natural price action.
Still, with spot buyers in control, institutional appetite growing, and regulation moving from theory to reality, this rally feels more grounded than the last. It’s not just charts and candles anymore - it’s policy, portfolios, and purpose.
Bitcoin price outlook
Bitcoin’s latest breakout isn’t just a price move - it’s a signal. A signal that crypto is no longer the fringe bet it once was. The ecosystem is maturing, institutions are engaging, and regulators are finally playing ball.
$120K? It’s no longer a moonshot. It might just be the next logical step.
At the time of writing, Bitcoin is seeing some pullback from its all-time high, with clear signs of profit-taking. The volume bars, on the other hand, tell the story of dominant buy pressure over the past days, with sellers offering little resistance, hinting at a potential further uptick. If the uptick materialises, we could see buyers face resistance around the all-time highs. Conversely, if we see a slump, prices could be held at the $107,400 and $100,900 support levels.
Will Bitcoin race to 120K? You can speculate on the price of BTC with a Deriv MT5, Deriv cTrader, or a Deriv X account.
Trade shifting market volatility with Volatility Switch Indices
What if you could trade a synthetic index that doesn’t just move randomly, but shifts through distinct phases of market activity, much like real markets?
What if you could trade a synthetic index that doesn’t just move randomly, but shifts through distinct phases of market activity, much like real markets? That’s what Volatility Switch Indices (VSI) offer: a structured way to trade changing volatility, all within one instrument.
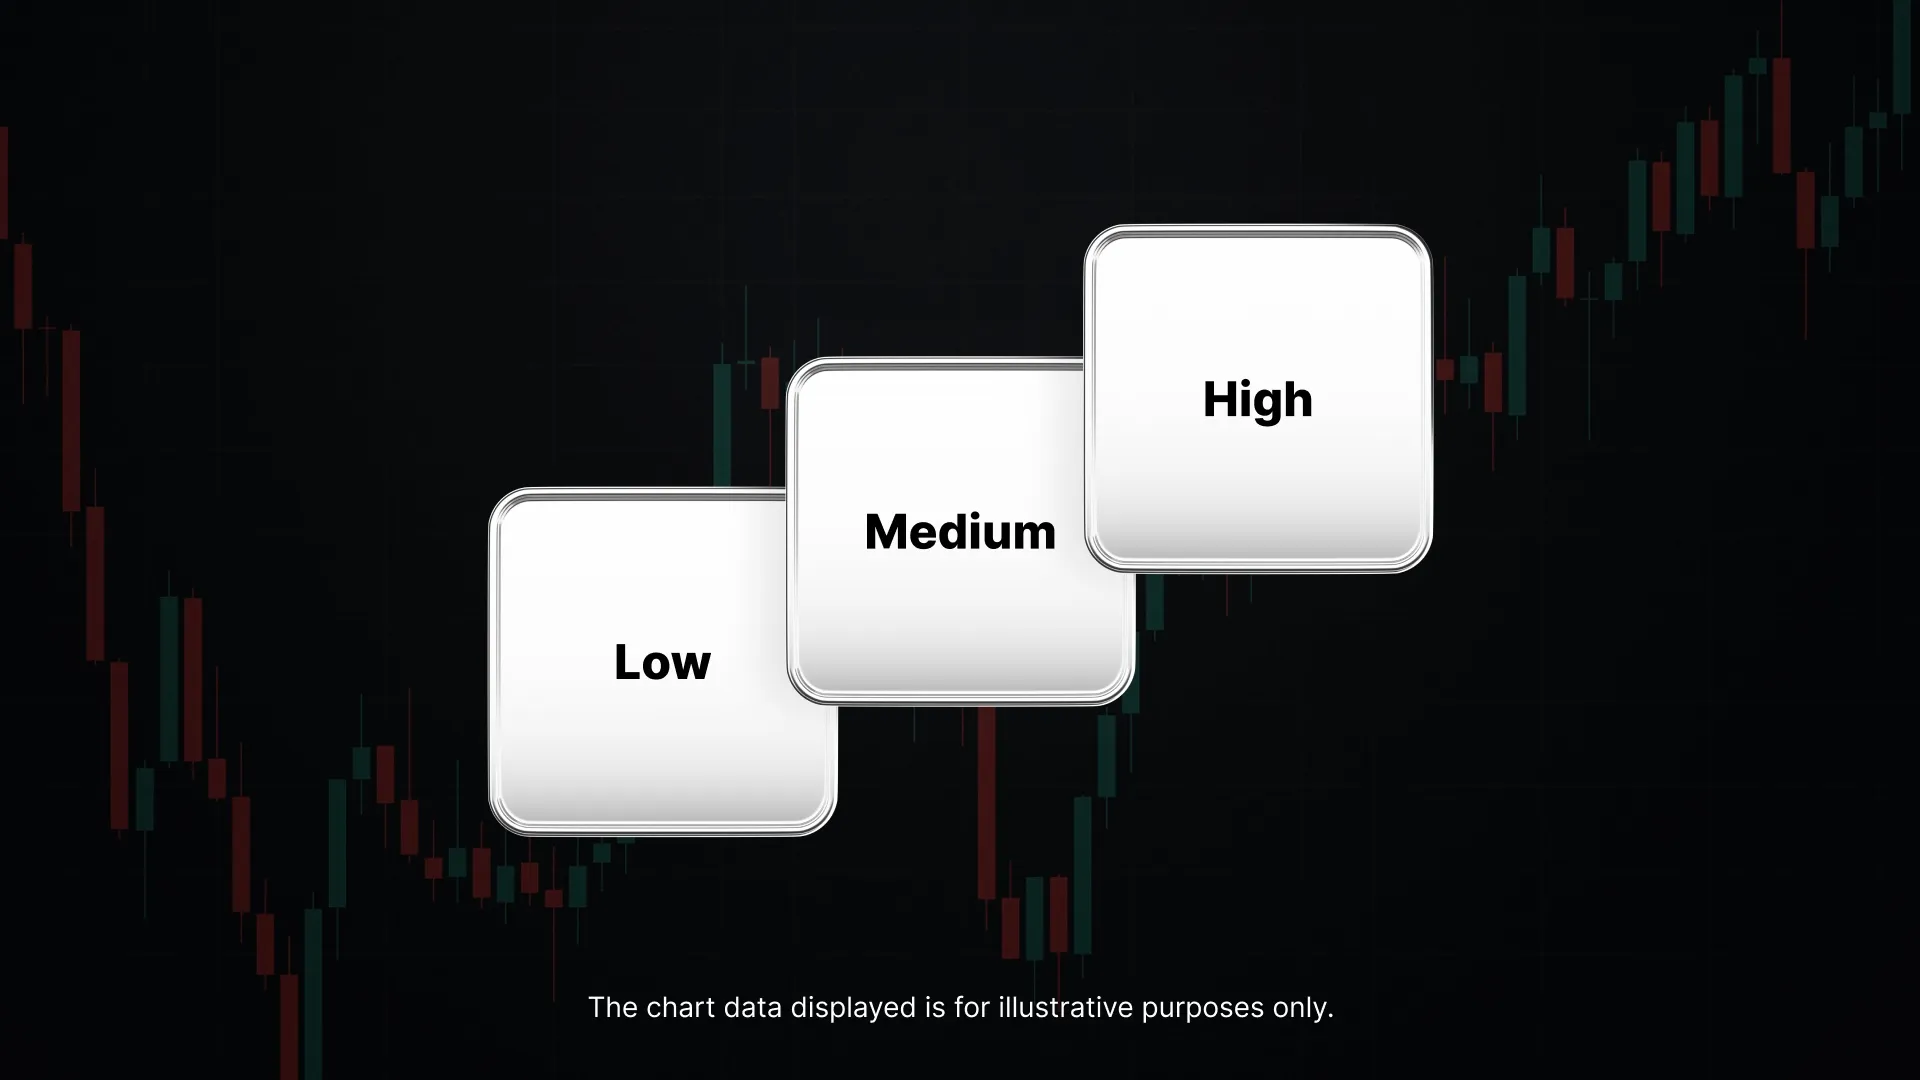
VSI is now available on Deriv, ready for you to explore. Each index cycles through low, medium, and high volatility phases in a continuous cycle, offering a dynamic and realistic synthetic market experience.
What makes Volatility Switch Indices different from trading other Synthetic Indices?
Most synthetic indices operate at a fixed volatility level or behave unpredictably. VSI introduces a structured cycle of changing conditions.
Each phase is defined by how much the index is expected to move with different levels of volatility:
- VSI Low: 10-25% volatility, with longer regime durations and steadier conditions
- VSI Medium: 50-100% volatility, offering a balanced mix of variability and pace
- VSI High: 100-200% volatility, with faster regime switching and more intense market behaviour
Rather than switching between indices to match changing market conditions, VSI gives you all three volatility phases in a single instrument.
Why traders should explore Volatility Switch Indices
Built for changing market behaviour, VSI allows traders to explore volatility trading strategies by offering:
- Predefined volatility regimes: Trade across low, medium, and high volatility phases — all within a single instrument
- Strategy flexibility: Adjust your strategy based on how volatility may evolve
- Dynamic spreads: Spread levels adjust based on the current volatility phase
- 24/7 availability: Trade any time, unaffected by real-world news or events
Start trading Volatility Switch Indices today
Volatility Switch Indices are now available for demo accounts on Deriv MT5 and Deriv cTrader.
Log in to your Deriv account and explore Volatility Switch Indices, or if you’re new to Deriv, sign up now to start trading.

Stable Spread Instruments bring clarity to your trading costs
With Stable Spread Instruments (SSI), managing your trading spread becomes more predictable even when market volatility rises. That means fewer surprises and more control when the markets move fast.
Picture this: You’re trading Gold or EUR/USD during a major news event. Normally, spreads might spike, raising your costs just when speed and timing matter most.
With Stable Spread Instruments (SSI), managing your trading spread becomes more predictable even when market volatility rises. That means fewer surprises and more control when the markets move fast.
What makes Stable Spread Instruments different?
Stable pricing gives traders better visibility into the spread in currency trading — helping you anticipate costs more effectively during volatile conditions. SSI supports this by aiming to keep spreads steady throughout the day.
Why traders should explore Stable Spread Instruments
Whether you're reacting to a move or setting up a longer trade, SSI offers consistent pricing that helps you reduce the impact of spread fluctuations, especially in fast-moving forex markets.
With SSI, you get:
- Spreads designed to stay consistent throughout the day
- Reduced spread spikes during fast or active markets
- Clearer visibility on entry and exit costs
- A steadier way to trade forex and metals — ideal for managing forex spread trading costs more consistently
Start trading Stable Spread Instruments today
Stable Spread Instruments are now available for demo accounts on Deriv MT5.
Log in to your Deriv account and explore Stable Spread Instruments, or if you’re new to Deriv, sign up now to start trading.

The copper price split may be just a blip
Copper’s having a moment - and not the kind you’d expect from a metal best known for quietly powering our homes, cars, and gadgets.
Copper’s having a moment - and not the kind you’d expect from a metal best known for quietly powering our homes, cars, and gadgets. Prices in the US have just shot to an all-time high, while markets in London and Shanghai seem to be shrugging it off.
In fact, copper is now trading at a jaw-dropping 25 percent premium in New York compared to the global benchmark. That’s not just unusual - it’s historic.
So, what’s going on? Is this a one-off market wobble triggered by tariff threats and trader panic? Or is copper flashing a warning light that something deeper is shifting in the global economy?
Let’s take a closer look at the split that’s got everyone from miners to manufacturers scrambling.
US copper tariffs: The spark behind the surge
It all started with a bold declaration. During a Cabinet meeting, former US President Donald Trump dropped a bombshell - plans to slap a 50 per cent tariff on copper imports. That single sentence sent markets into a frenzy.
Within hours, copper futures on the New York Comex surged by a record-breaking 17 percent, briefly hitting 5.89 dollars per pound - a level never seen before.

Meanwhile, in London, the mood was far less dramatic. Prices on the London Metal Exchange, which usually sets the tone for global copper trading, actually dipped 1.5 percent.
Shanghai’s market followed suit, leaving traders scratching their heads: Why is the US price flying solo?
A Copper market playing catch-up
Analysts note that copper doesn’t usually behave like this. It’s one of the most globally traded industrial metals, and pricing tends to stay relatively aligned across major exchanges. A small premium in one region? Sure. But 25 per cent? That’s like paying extra for a meal in New York because it might rain next week.
According to reports, tariff talk sparked a mad dash to stockpile copper in the US before prices climb even higher. Traders have been shipping record volumes into the country, hoping to beat the clock. And with fears of tighter supply, buyers are willing to pay more - a lot more - just to lock in what they can.
Copper market divergence: Blip or bigger problem?
Now, here’s the real question: Is this all temporary panic or the start of a long-term split in the copper market? Analysts are divided.
Some experts, including those at Morgan Stanley, believe the price surge could be short-lived. Once US inventories catch up and the market calms down, Comex prices may settle back into alignment. Traders hoarding copper now could find themselves sitting on expensive stock if demand doesn’t keep pace.
Others, however, see something more structural brewing. The US relies on imports for more than half of its refined copper, much of it coming from Chile, Canada, and Mexico.
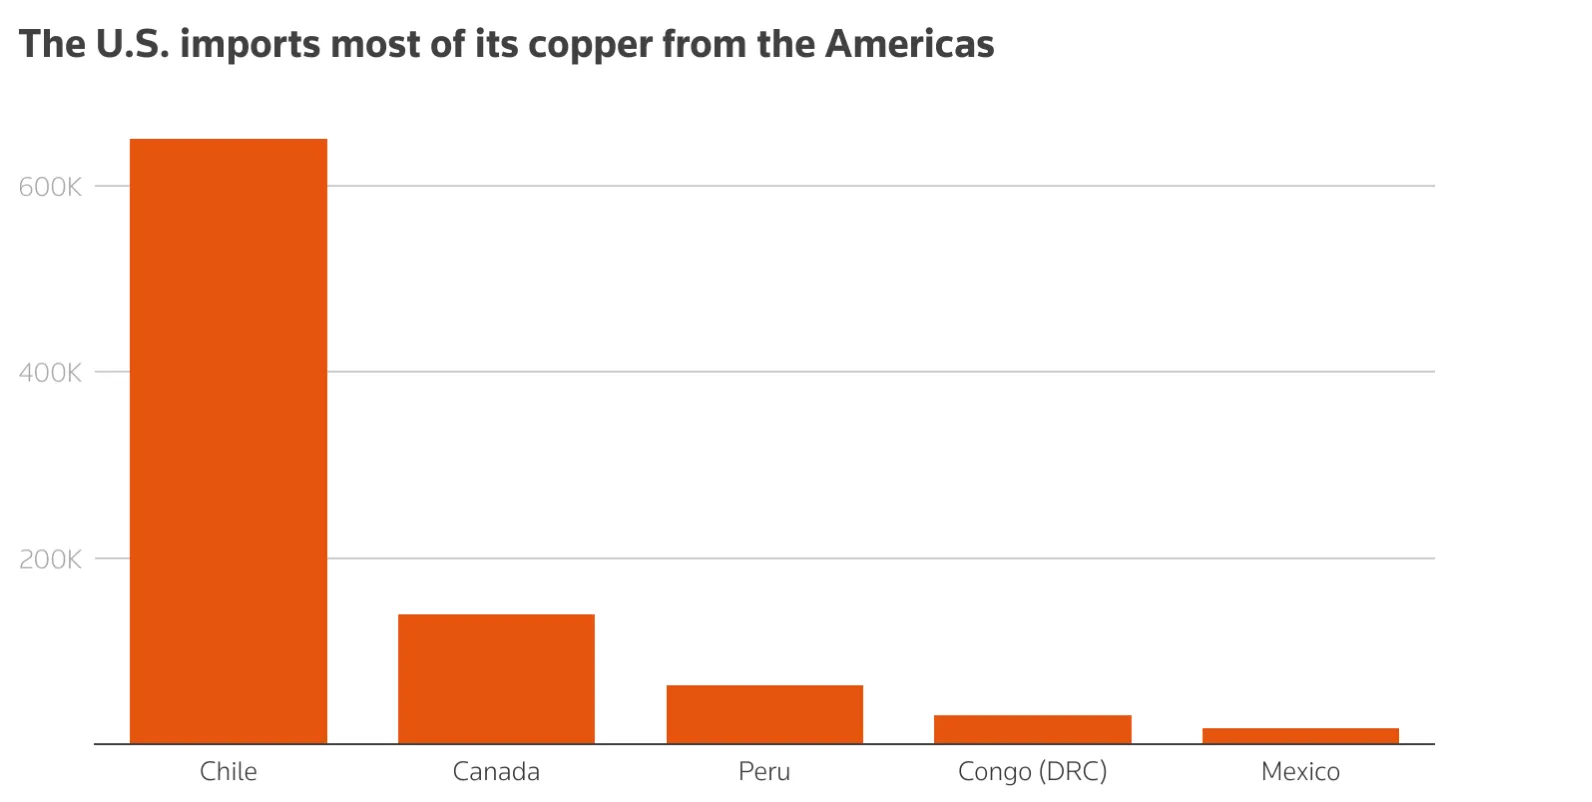
While America has rich copper reserves, it lacks the refining muscle to meet domestic demand. Tariffs might protect producers on paper, but they could just as easily saddle manufacturers with sky-high input costs. That’s hardly a recipe for industrial revival.
Why this matters more than you think
Copper isn’t just any old metal. It’s the lifeblood of the modern economy - and the green one we’re building. From electric vehicles and wind turbines to smartphones and data centres, copper is everywhere. If prices spiral in one region, it doesn’t just hit traders. It hits construction firms, automakers, and clean energy projects, too.
And there’s also the geopolitical ripple effect. If the US becomes a high-cost copper island, suppliers may start looking elsewhere, like China, for more stable and long-term trade relationships. In a world already feeling the strain of supply chain tensions, this price divergence could widen the gap even further.
So, where do copper prices go from here?
For now, there’s plenty of copper sitting in US warehouses, albeit at eye-watering prices. But the long-term picture remains murky. The market still doesn’t know when the tariffs will actually kick in, whether any products will be exempt, or if this divergence will force a deeper reshaping of global copper flows.
What’s clear is that markets don’t like uncertainty, and copper’s recent behaviour is a textbook example of what happens when policy, speculation, and supply chains collide.
Is the copper price split just a blip? Maybe. But if it is, it’s a blip with consequences. Because in today’s world, when a metal like copper breaks away from the pack, it’s rarely just about price - it’s about power, policy, and what comes next.
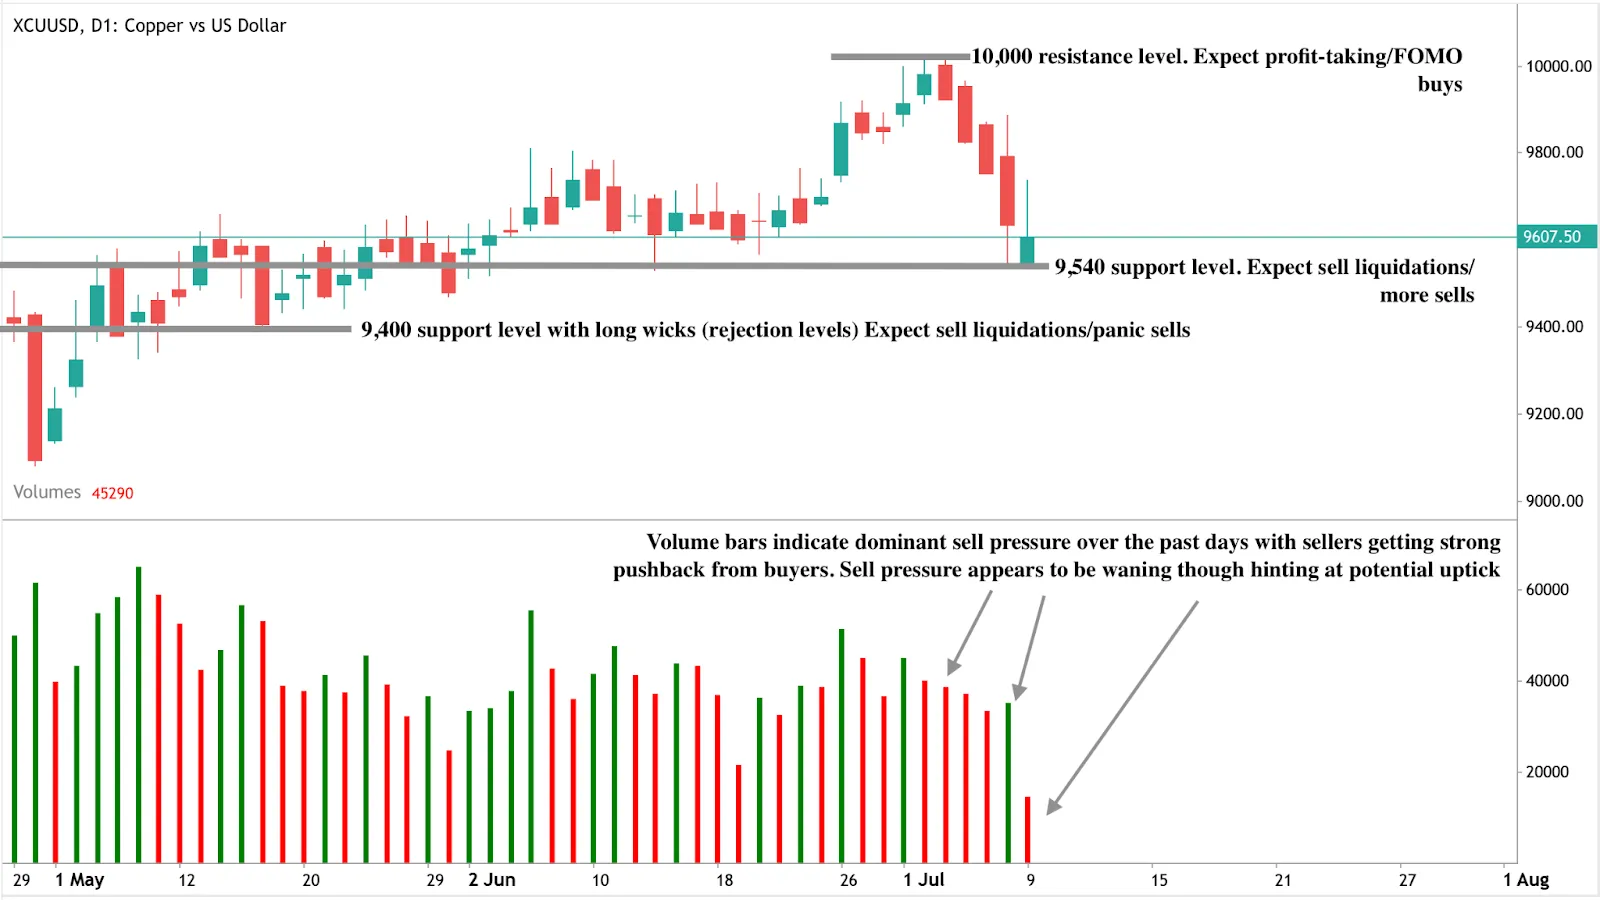
LME copper prices outlook
At the time of writing, Copper prices (LME) are under pressure with the latest green bar forming a massive wick, hinting at strong sell pressure. However, the volume bars indicate that sell pressure is waning, hinting that a move downwards could be curtailed. If a move downwards materialises, prices could find support at the $9,540 and $9,400 support levels. Conversely, if we see an uptick, prices could find resistance at the $10,000 price level.

Is buying the dip the best strategy in 2025?
With the S&P 500 at record highs and tech stocks like Nvidia bouncing back stronger after every fall, one question keeps coming up: is buying the dip not just working 0 but winning?
So far in 2025, what looks like market chaos has actually been a goldmine - at least for the brave. Every wobble, every sharp drop, every so-called “bloodbath” has turned into a buying opportunity. And those who dared to dive in? They’re laughing all the way to the bank.
With the S&P 500 at record highs and tech stocks like Nvidia bouncing back stronger after every fall, one question keeps coming up: is buying the dip not just working 0 but winning?
Nasdaq record highs
Let’s start with the numbers. According to analysts, if you’d simply bought the Nasdaq 100 every time it had a down day this year, you’d be up roughly 32% - the best result for that strategy in five years. For context, this time last year, that return sat at a modest 5%.
The pace we’re seeing now puts 2025 on track to become the best year for dip-buying since at least 1985. Yes, even better than the bubbly days of 1999.
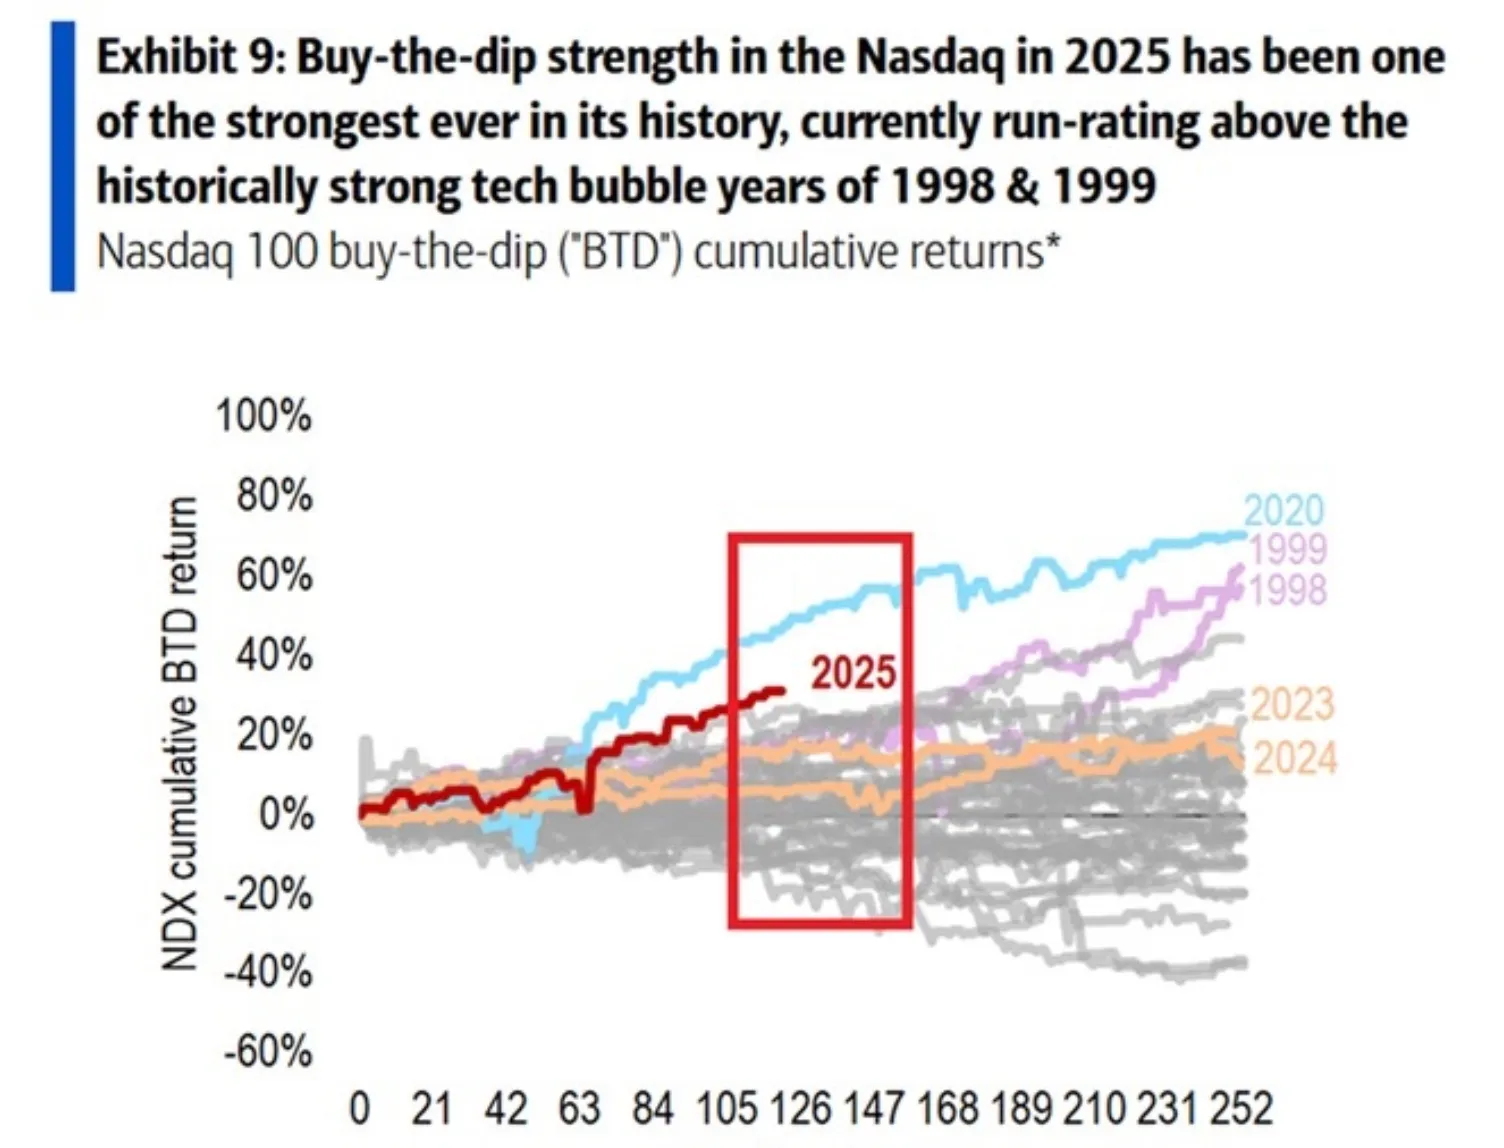
And it’s not like this has been a calm ride either. Out of the 124 trading days so far, the Nasdaq’s been down in 51 of them. That’s a whole lot of red candles - but also a whole lot of green rebounds.
Nvidia stock dips harder - and snaps back faster
If the market as a whole has rewarded dip-buyers, Nvidia has practically crowned them royalty.
The AI darling kicked off the year under pressure from China’s DeepSeek, a cheaper challenger in the machine-learning space. Then came the meltdown: on 27 January, Nvidia logged its worst-ever single-day drop - a brutal 17% fall. Ouch.
But that pain didn’t last. By early February, the stock had bounced back 20% heading into earnings. It wasn’t a one-off either. In April, Nvidia followed the market lower again, this time on fears surrounding Trump’s proposed tariffs. Shares tumbled 33% to their lowest point of the year.
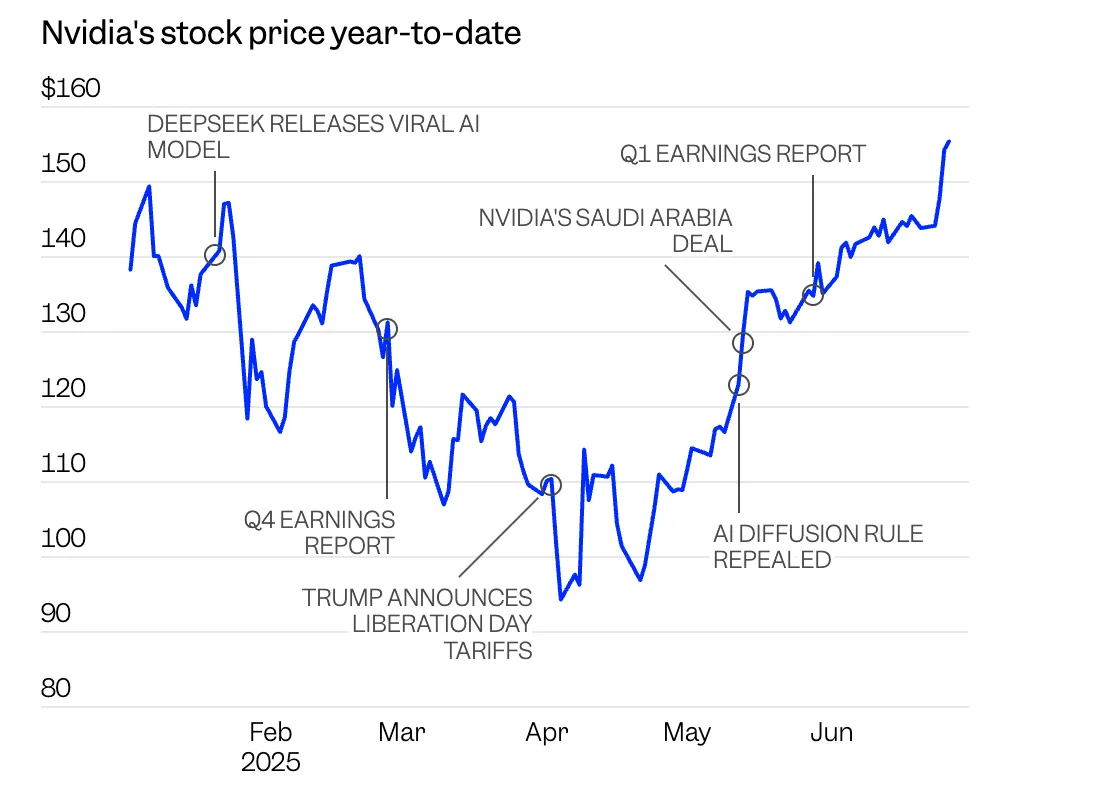
And then, you guessed it, another rally. A steep, unapologetic one. Since bottoming out, Nvidia has gone on to set new record highs, with shares rising 12% in just the past month. It’s been a dream for traders with the stomach for sharp drops and the conviction to hold through them.
Nvidia keeps hitting the Wall Street news
This isn’t just retail traders on Reddit throwing darts. Wall Street is increasingly convinced Nvidia’s dip-buying window is more than just luck.
Citi recently raised its price target to $190, suggesting a further 15% upside from current levels. One firm went even bolder, pegging a target at $250 - a price that would value Nvidia at a mind-bending $6 trillion.
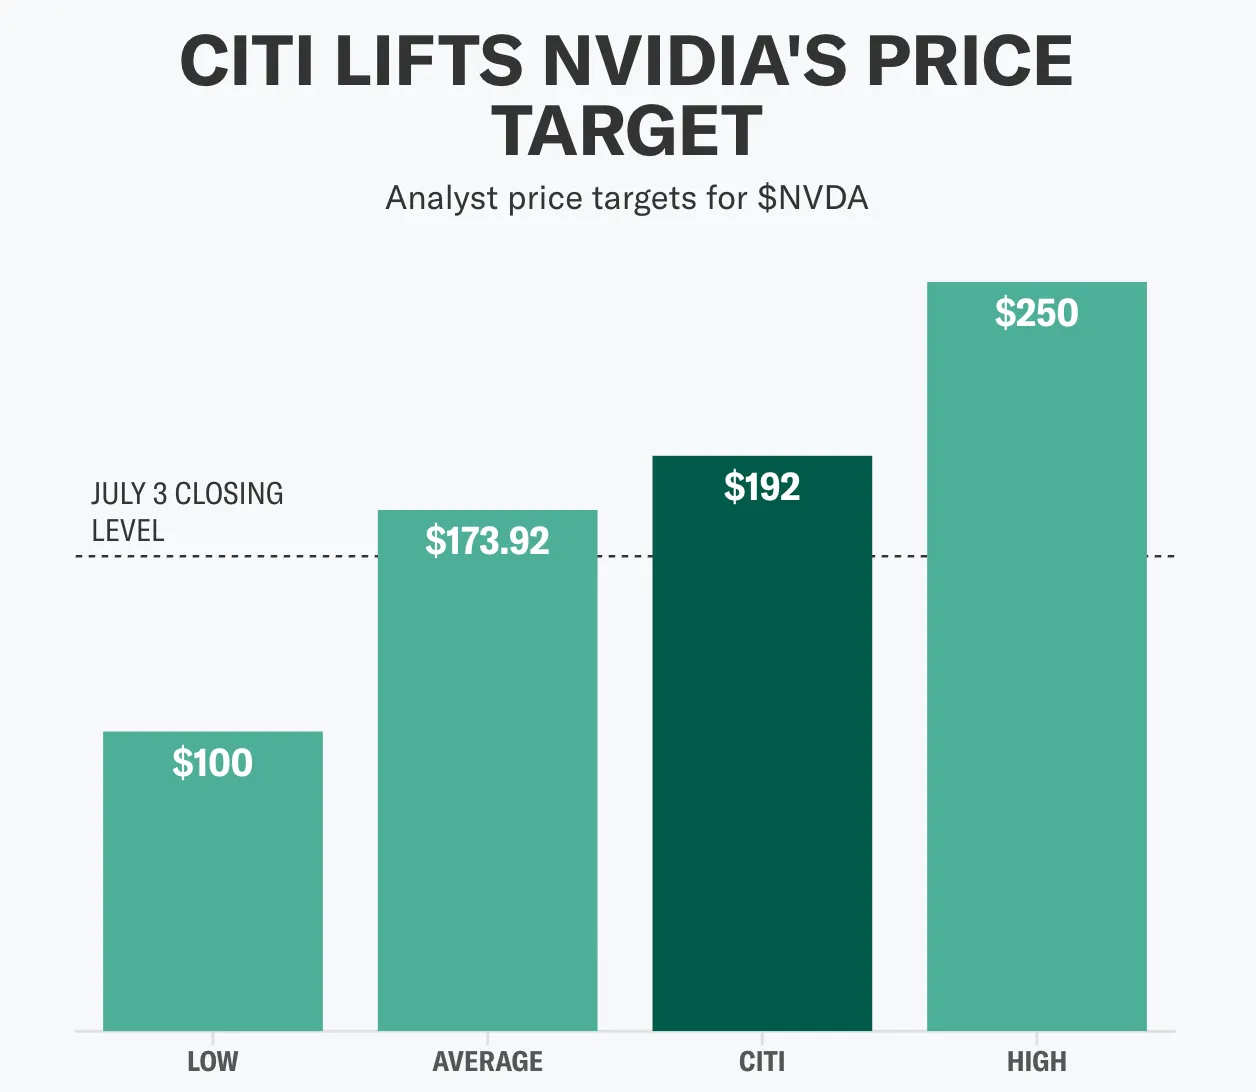
Why the enthusiasm? Simple: governments are buying AI infrastructure like it’s the new electricity. Citi’s analysts say sovereign demand alone could already be contributing billions of dollars in revenue this year. They expect it to ramp up even more in 2026.
The AI gold rush is real
At Nvidia’s recent generative AI conference, insiders floated a potential benchmark for national AI infrastructure: one supercomputer or 10,000 GPUs per 100,000 government employees. Think about that. That kind of buildout could keep Nvidia busy - and profitable - for years.
The company’s Blackwell GB200 chips are already powering most of these projects, and Citi believes the rollout is only accelerating. Supply chain concerns? Largely resolved. Rack buildouts? “Happening at a rapid pace.” Even the transition to next-gen GB300 chips is expected to be smooth, thanks to lessons learned from previous launches.
Global AI arms race: Green lights, with a hint of risk
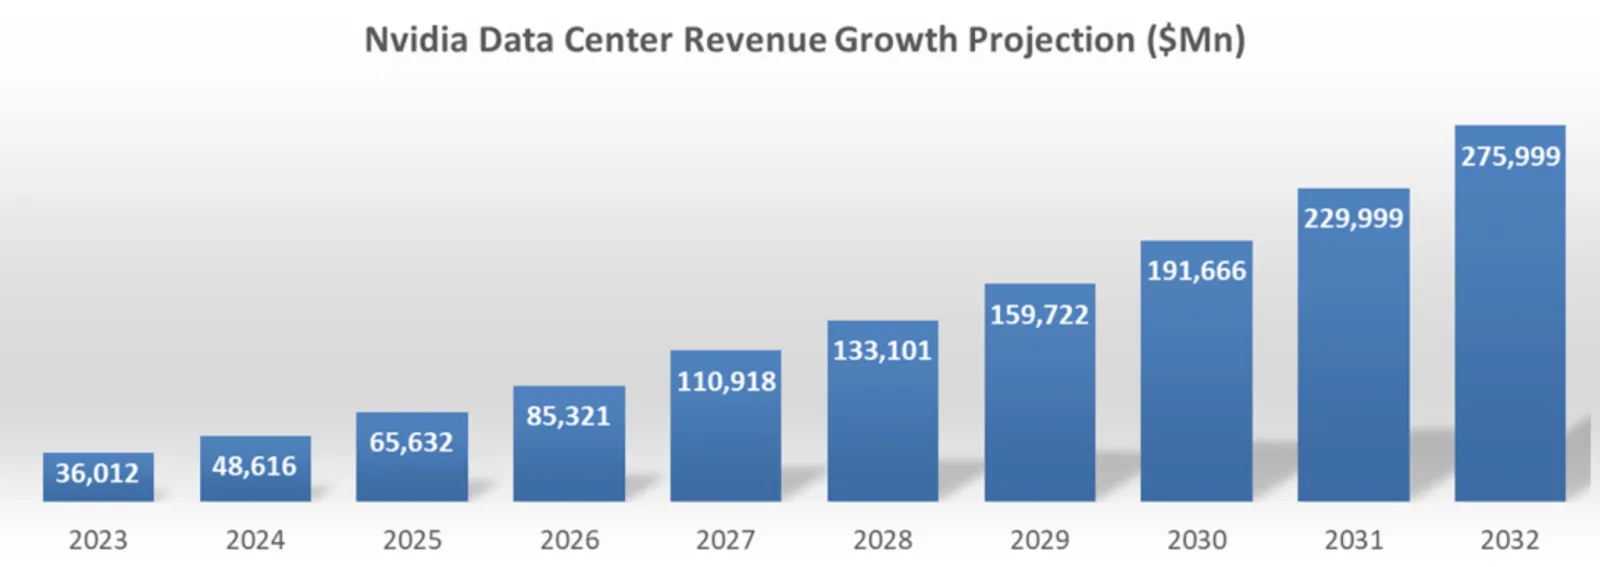
Citi now expects Nvidia’s data centre revenue to rise 5% in FY 2027 and 11% in FY 2028, with networking sales surging even faster. Margins are expected to stabilise in the mid-70% range, which is excellent for a company scaling at this pace.
That said, there are still clouds on the horizon. Trump’s administration could reintroduce export restrictions - particularly with scrutiny on Malaysia and Thailand for possible indirect shipments to China. Regulatory risks remain real, especially for a company at the heart of a global AI arms race.
Dollar-cost averaging vs timing/buying the dip
If your timing’s been good this year, it’s not even close - buying the dip has been a beast. The market’s bouncing back with a vengeance, and Nvidia’s chart looks more like a trampoline than a trendline. Add in soaring demand, bullish analyst upgrades, and a possible sprint to a $4 trillion market cap, and it’s easy to see why traders are so confident.
But here’s the unfortunate twist, a Vanguard study analyzing 90 years of S&P 500 data, revealing that even perfect market timing to "buy the dip" underperformed dollar-cost averaging (DCA), challenging the common investor belief that timing dips maximises returns
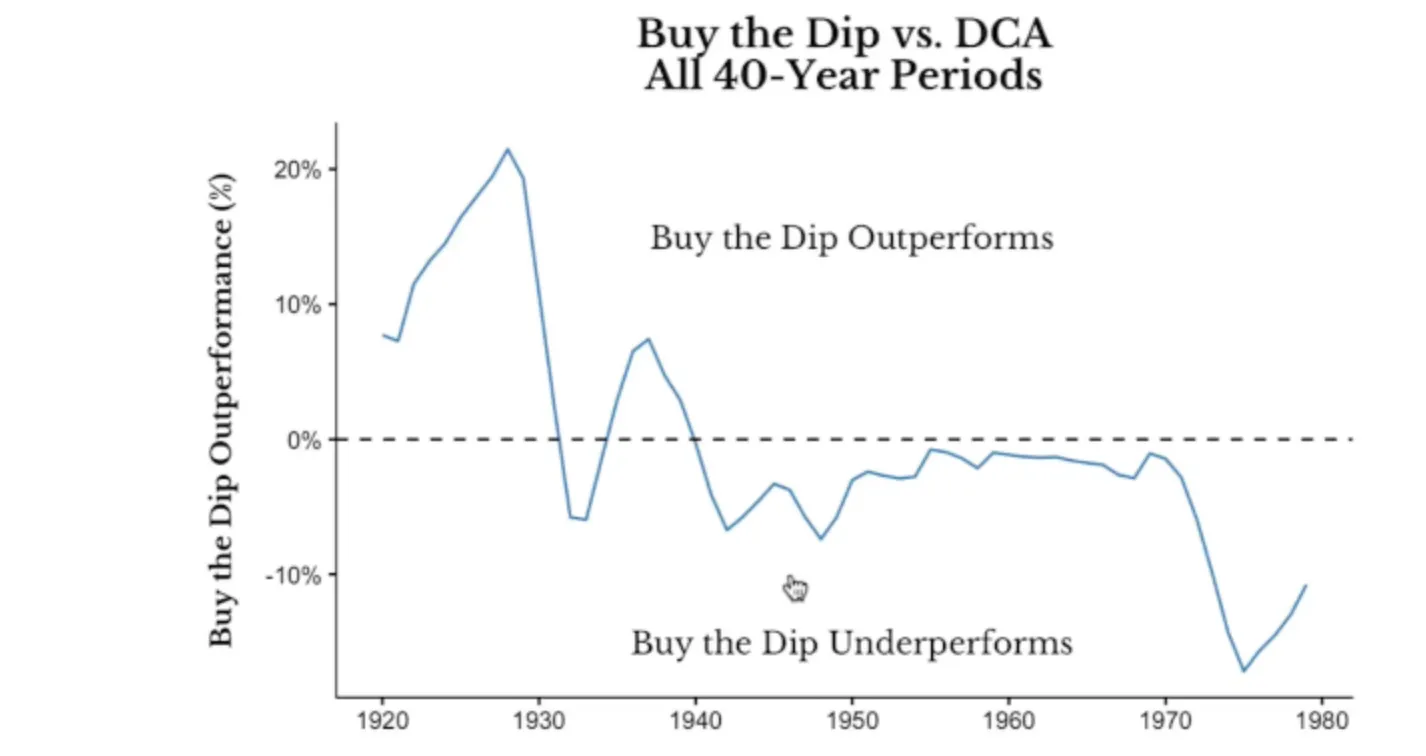
So, in a 2025 where buying the dip and holding your ground, especially with stocks like Nvidia, has rewarded you. the market’s been more than happy to reward you - the strategy has shown vulnerabilty in the long-term.
But as far as 2025 is concerned, volatility hasn’t been the enemy this year - it’s been the opportunity.
Nvidia outlook
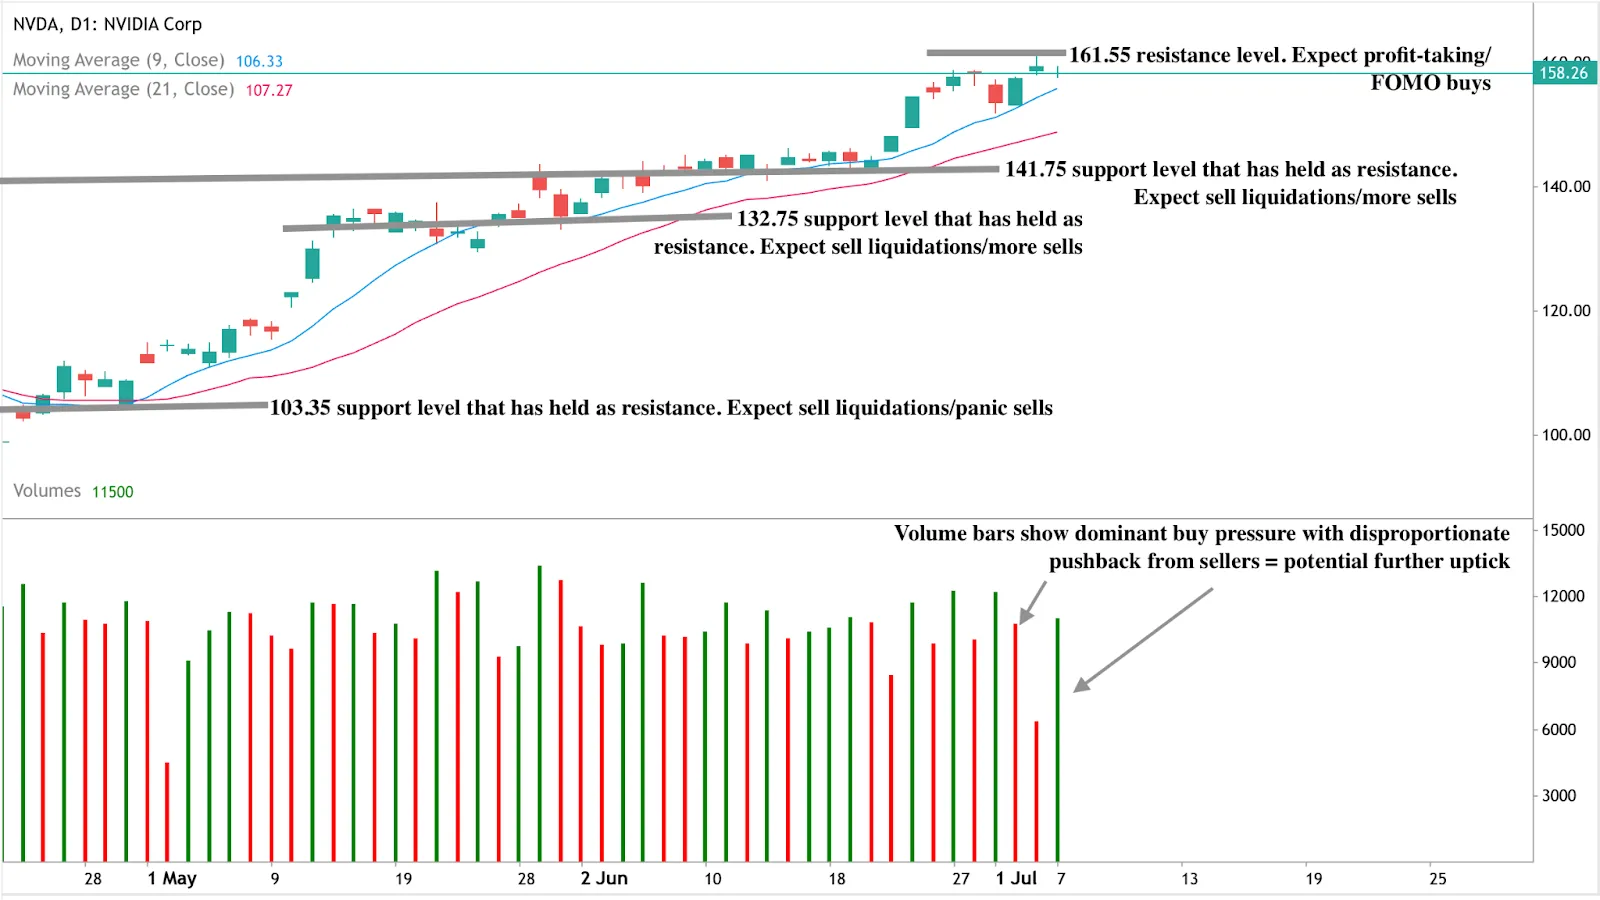
At the time of writing, Nvidia is showing signs of buy-side exhaustion after a significant rally, hinting at a potential reversal. However, the volume bars show that dominant buy pressure over the past few days has been met by disproportionate sell-side pushback, hinting that an upside move could still be on.
If we see an uptick, prices could encounter resistance at the $161.55 resistance level. Conversely, if we see a slump, prices could find support floors at the $141.75, $132.75, and $103.35 support levels.
Is trading Nvidia dips a potential winning strategy? You can speculate on Nvidia’s price trajectory with a Deriv MT5 account.
Sorry, we couldn’t find any results matching .
Search tips:
- Check your spelling and try again
- Try another keyword