The case for a gold price breakout as market volatility returns

Gold prices continued climbing into August 2025 as traders brace for renewed volatility in equity markets and prepare for a widely expected pivot by the U.S. Federal Reserve. The Volatility Index (VIX) has lingered near its yearly low of 15 but is seasonally primed to rise through October, a pattern historically associated with surging demand for safe-haven assets like gold.
According to World Gold Council data, Q2 2025 saw a record $132 billion in global gold demand - driven by ETF inflows, retail investor activity, and growing inflation and trade risks.
Key takeaways
- The VIX hovers near 17.48, historically near a seasonal bottom. CBOE data shows a typical 30% rise from August to October, creating conditions for risk-off sentiment.
- Global gold demand reached a record $132 billion in Q2 2025, with investment flows up 78% year-on-year and ETF inflows at the strongest level since 2020.
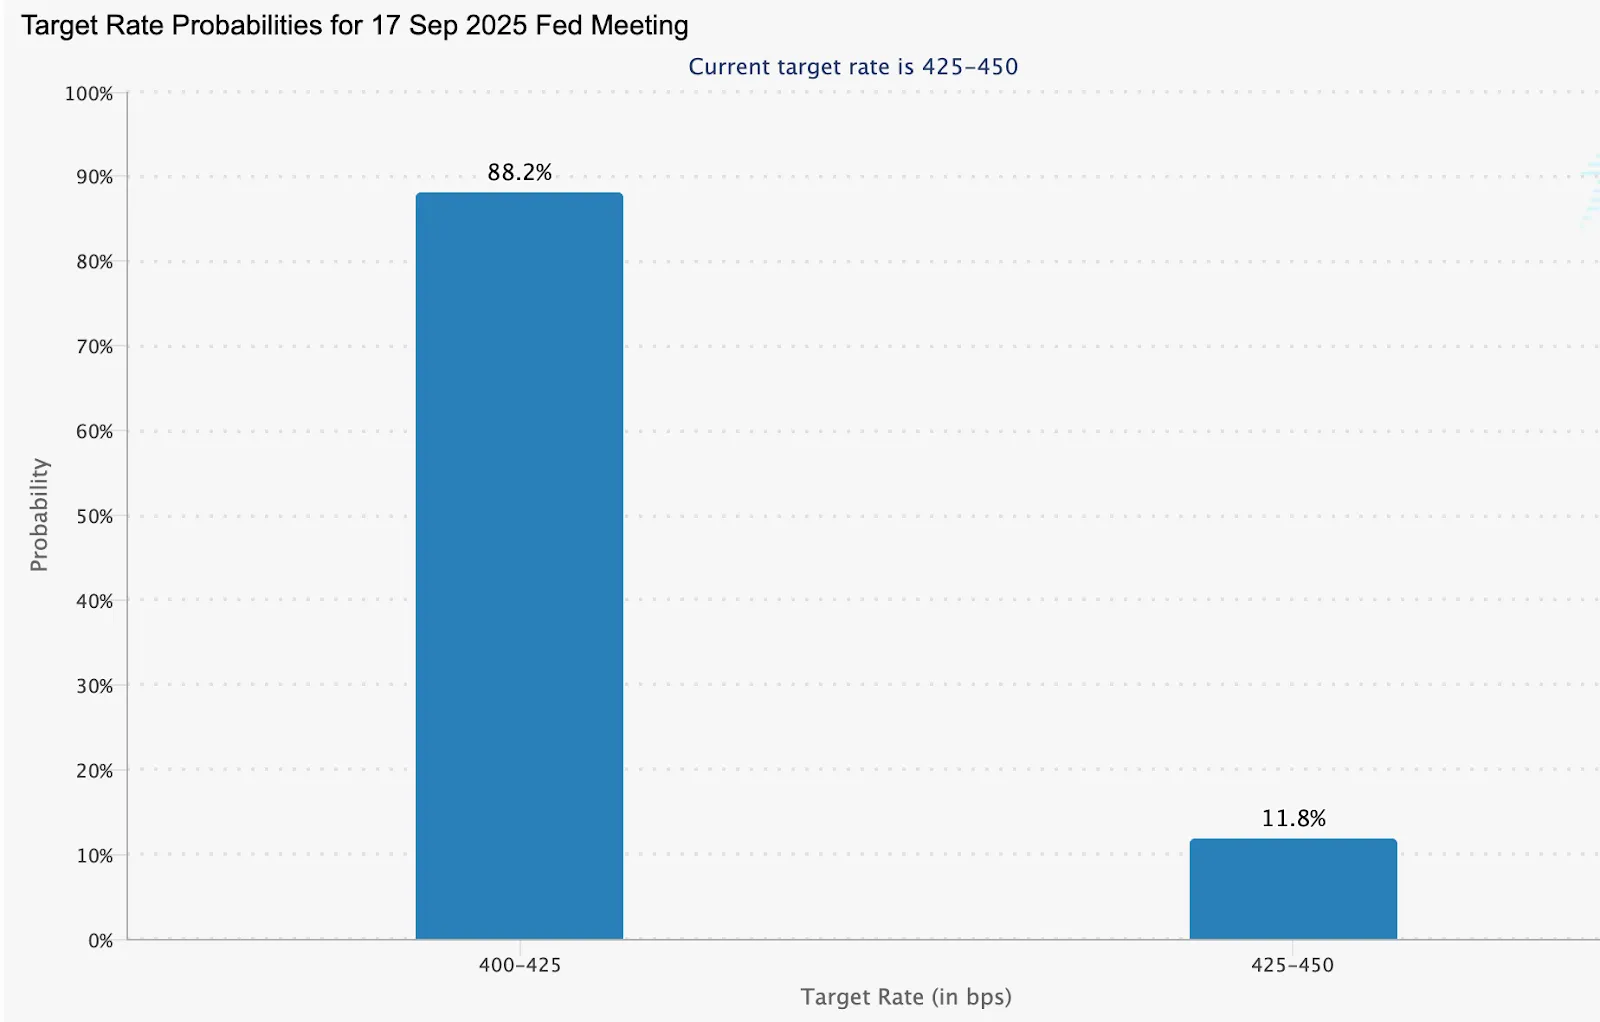
- Expectations of a Fed rate cut in September rose to 87.8% following weak job data and rising PCE inflation, creating bullish conditions for gold.
- Tariffs imposed by the U.S. on key trading partners, including Canada, India, and Brazil, increase inflation risks and global trade uncertainty - both key drivers of gold interest.
Gold and market volatility: The safe-haven play
The VIX, often referred to as Wall Street’s “fear gauge,” has declined over 45% since April and now sits near multi-month lows. But history suggests this calm won’t last.
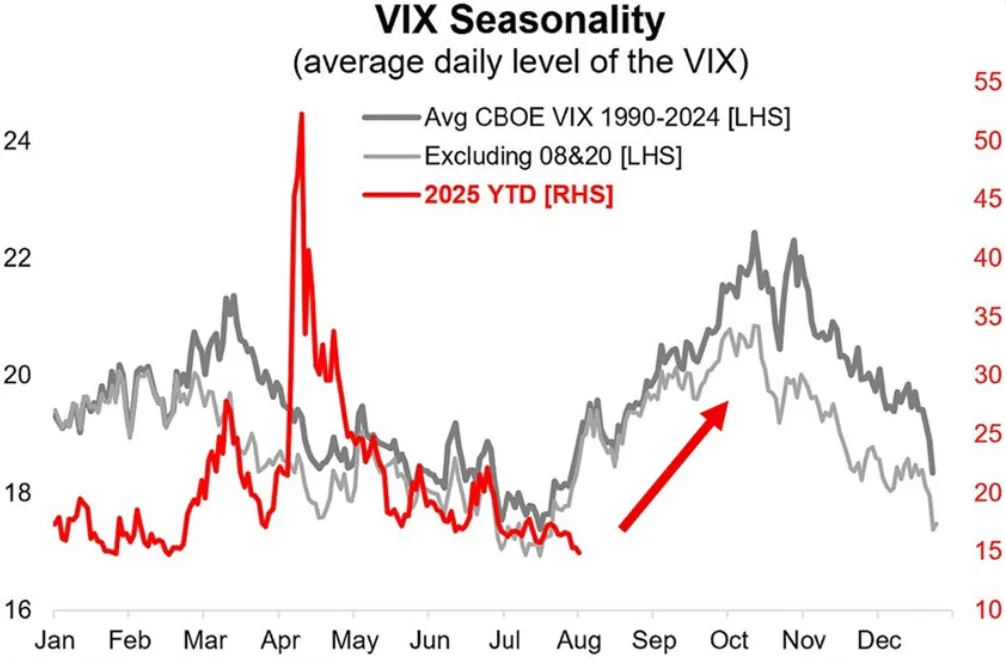
According to seasonal data tracked by market analysts, the VIX typically rises from August through October, as institutional rebalancing, earnings volatility, and geopolitical concerns emerge.
Periods of rising VIX often coincide with stronger gold prices. As risk sentiment flips, institutional and retail investors typically move capital into gold ETFs and physical bullion. A 2021 study found that gold returns positively correlate with implied volatility during periods of heightened market stress.
The S&P 500 has now traded above its 20-day moving average for 68 straight sessions - the longest stretch since the 1990s.
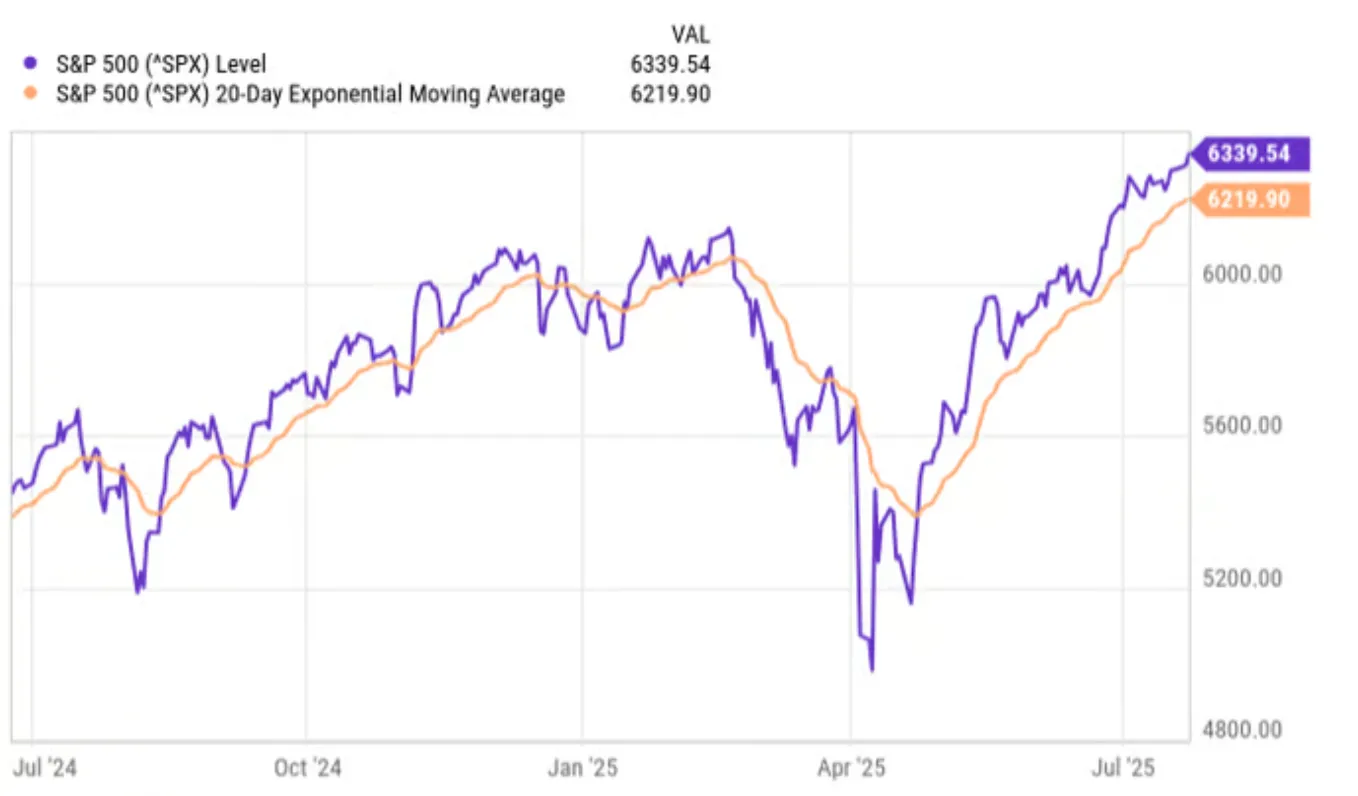
Market complacency, as measured by low implied volatility and high equity valuations, suggests gold may be well-positioned if sentiment turns sharply risk-off.
Monetary policy and inflationary tailwinds
Gold’s appeal is rising alongside growing expectations for monetary easing. The CME FedWatch Tool shows an 87.8% probability of a Fed rate cut in September, up from 63% just one week earlier. Market pricing now reflects an additional cut in December.
Recent U.S. labour market data showed nonfarm payroll revisions slashed 258,000 jobs from prior reports, reinforcing the view that the Fed may ease to avoid deeper economic weakness. Meanwhile, the Fed’s preferred inflation gauge - the Personal Consumption Expenditures (PCE) Index - rose 0.3% in June, up from a revised 0.2% in May, driven in part by rising costs linked to trade tariffs.
Lower rates reduce the opportunity cost of holding non-yielding gold, while persistent inflation reinforces gold’s value as a store of wealth. The World Gold Council predicts global inflation could exceed 5% in the second half of 2025, even as growth remains subdued - a classic stagflation setup historically favourable for gold.
Record-breaking demand and Gold ETF inflows
According to the World Gold Council’s Q2 2025 report:
- Total gold demand by volume rose 3% year-on-year to 1,249 metric tons.
- By value, demand surged 45% to $132 billion — the highest on record.
- ETF inflows reached 170 metric tons in Q2, with H1 demand at 397 metric tons — the strongest six-month performance since H1 2020.
- Bar and coin demand remained strong in China and Europe. In China, retail investment in gold surpassed jewellery consumption for the first time in years.
OTC and institutional demand also rose, while central bank gold purchases - though down 33% from Q1 - remained above historical averages at 166 metric tons.
Divergence in jewellery and tech demand
While investment demand soared, gold demand for jewellery and technology applications weakened:
- Global jewellery demand fell to 341 metric tons — the lowest since Q3 2020 and 30% below the five-year average.
- Technology-sector gold usage slipped 2% year-on-year to 79 metric tons amid trade uncertainty and declining East Asian manufacturing activity.
The WGC noted that demand from AI-related technologies helped offset the broader decline in electronics.
Supply-side dynamics and gold price resilience
Gold supply rose to 1,249 metric tons in Q2 2025, driven by a record 909 metric tons in mine production and a 4% increase in recycling activity. However, recycling remains subdued relative to historical patterns, suggesting holders are reluctant to sell amid rising prices and economic uncertainty.
Gold price technical outlook and trading range
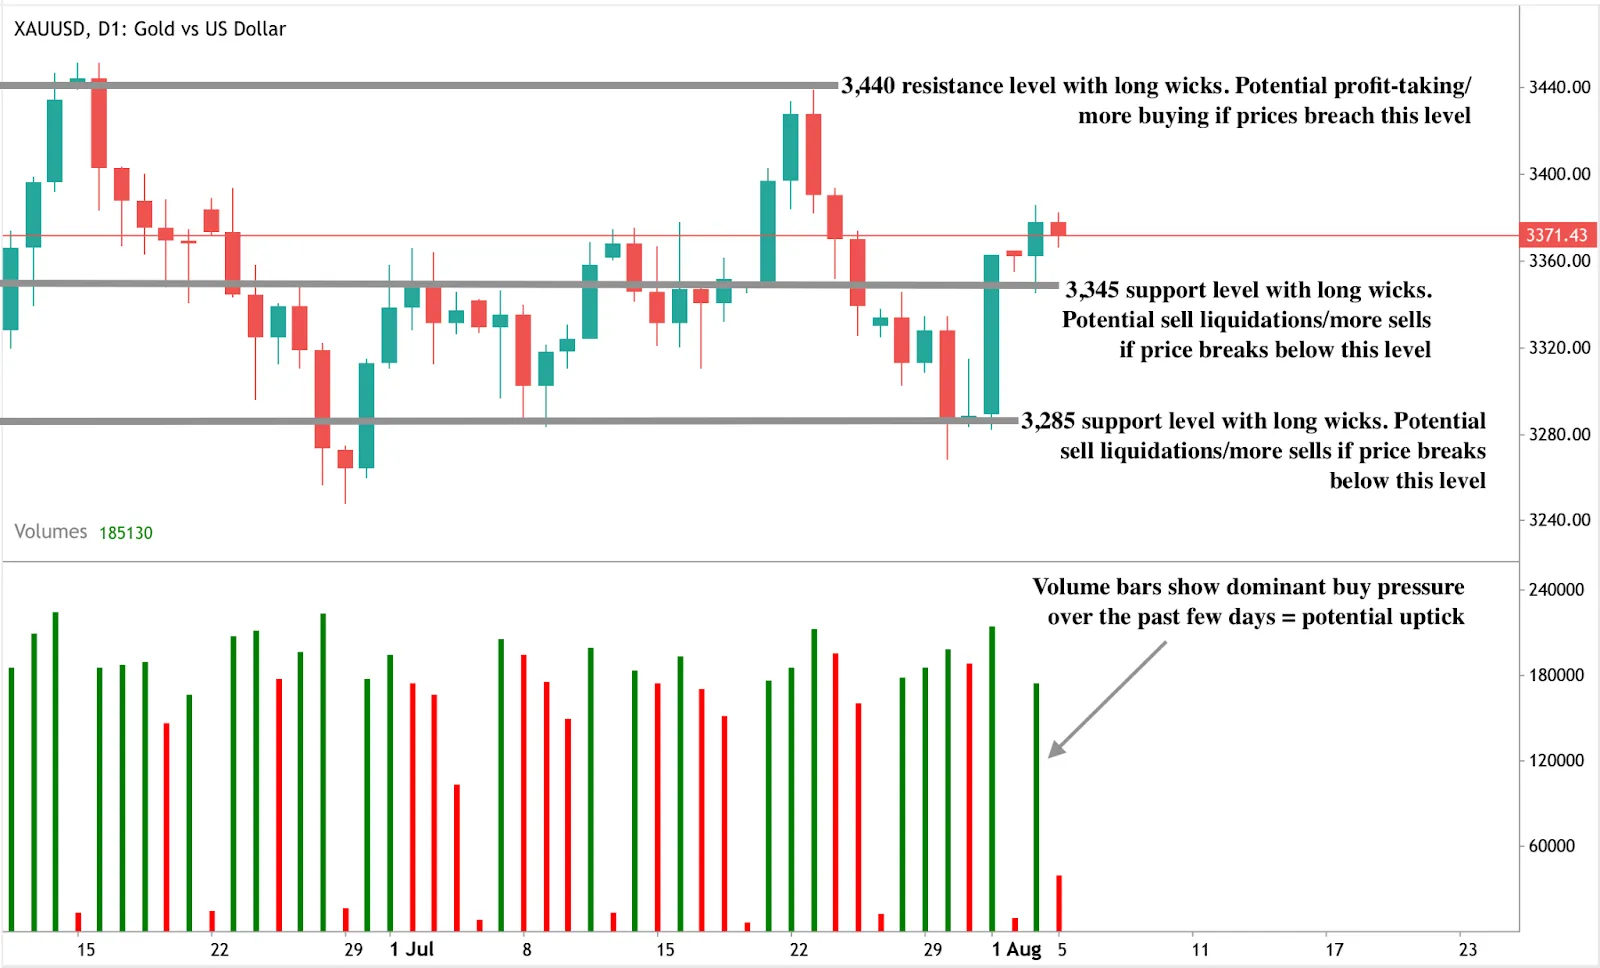
At the time of writing, gold is seeing some retreat from a strong price uptick. The pullback is occurring within a known sell zone, which could hint at further downside in the short term. However, volume analysis reveals dominant buy pressure, reinforcing the broader bullish narrative.
If prices manage to breach current levels and push higher, gold could encounter resistance at the $3,440 level. On the downside, any pullback may find support at $3,345 and $3,285, levels that traders will be watching closely for potential accumulation zones.
What does this mean for gold in 2025?
Gold appears poised to benefit from a convergence of macro catalysts:
- Rising market volatility (VIX) tends to correlate positively with gold in periods of financial stress.
- Rate cuts are increasingly priced in, making non-yielding assets like gold more attractive.
- Sticky inflation and new tariffs could further reinforce gold’s role as a hedge.
- Robust investment flows, particularly in ETFs and physical bars, signal strong investor conviction.
Frequently asked questions
Why is gold considered a hedge during market volatility?
Gold often appreciates when market risk rises, serving as a safe haven against equity downturns, geopolitical instability, and inflation.
What are the key technical levels for gold in H2 2025?
Resistance is identified near $3,440, while support levels lie at $3,345 and $3,285. Volume trends suggest bullish sentiment remains dominant.
How do interest rates impact gold prices?
Lower rates reduce the opportunity cost of holding gold, increasing its appeal. Gold prices often rise as rate cut expectations build.
Is the record $132 billion in gold demand sustainable?
Investment demand is expected to remain firm. However, jewellery and tech demand may stay weak amid global trade tensions and high prices.
Investment implications
Gold is regaining its safe-haven status as markets prepare for renewed volatility. With record demand, strong ETF inflows, and dovish central bank expectations, the setup for a breakout rally is in place. Investors should monitor upcoming CPI data, Fed meeting outcomes, and VIX levels for confirmation signals.
For traders, a break above $3,440 could signal the beginning of a new bull run. For long-term investors, gold offers both a diversification tool and an inflation hedge in what remains an unpredictable macro environment.
Disclaimer:
The performance figures quoted are not a guarantee of future performance.


