What is driving Central Bank Gold demand instead of US Treasuries in 2025?

Gold is holding at all-time highs at around $3,609, up 37% this year after a 27% gain in 2024. The main driver is a shift in reserve preference: central banks are steadily buying gold instead of US Treasuries, signalling a reordering of how nations hedge against financial risk. Weak US jobs data and expectations of Federal Reserve rate cuts are accelerating this shift, while speculative traders and retail demand are adding momentum. The question is no longer whether gold is a safe-haven asset, but whether it is becoming a foundation for a new monetary order.
Key takeaways
- Gold price is at $3,609, supported by central bank demand and Fed rate cut expectations.
- US Treasuries are losing appeal, as central banks seek diversification in gold reserves.
- China’s PBoC added gold for the 10th consecutive month in August, increasing holdings to 74.02 million ounces.
- Traders are fully pricing in a 25 bps Fed cut on 17 September, while Gold has surged 37% in 2025, outpacing the S&P 500 and acting like a growth asset.
- Speculative demand is rising, with net long positions climbing by 20,740 contracts in early September.
- Silver prices are also surging, hitting a 14-year high, reflecting broader demand for hard assets.
Gold vs US Treasuries: Central banks drive gold higher
The most significant force behind gold’s rise is central banks shifting away from US Treasuries. The People’s Bank of China (PBoC) purchased gold for the 10th straight month in August, lifting reserves from 73.96 to 74.02 million fine troy ounces. This is not an isolated move: global central banks have steadily reduced their Treasury holdings in favour of bullion as a hedge against US debt risk, sanctions exposure, and dollar volatility.
The decision reflects a structural realignment. Treasuries, once considered the safest store of value, now carry risks tied to Washington’s fiscal position, political disputes, and reliance on Fed monetary policy. By contrast, gold offers liquidity and neutrality, making it increasingly attractive for reserve diversification.
Fed policy and weak US data amplify the shift
The latest US jobs report has reinforced gold’s momentum. Nonfarm Payrolls (NFP) showed only 22,000 jobs added in August compared to expectations of 75,000, while unemployment rose to 4.3%, the highest since 2021.
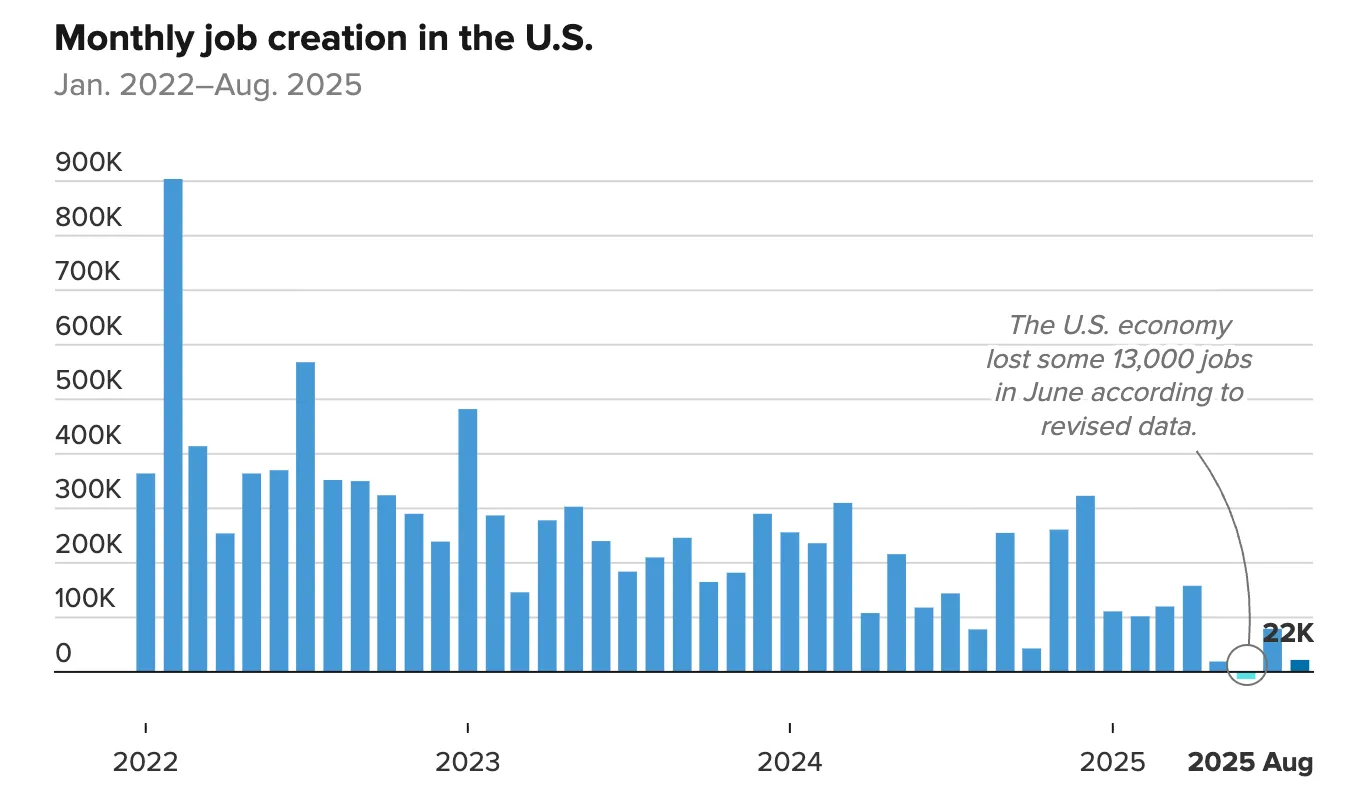
This weakness confirms labour market softening, undermining the case for higher rates.
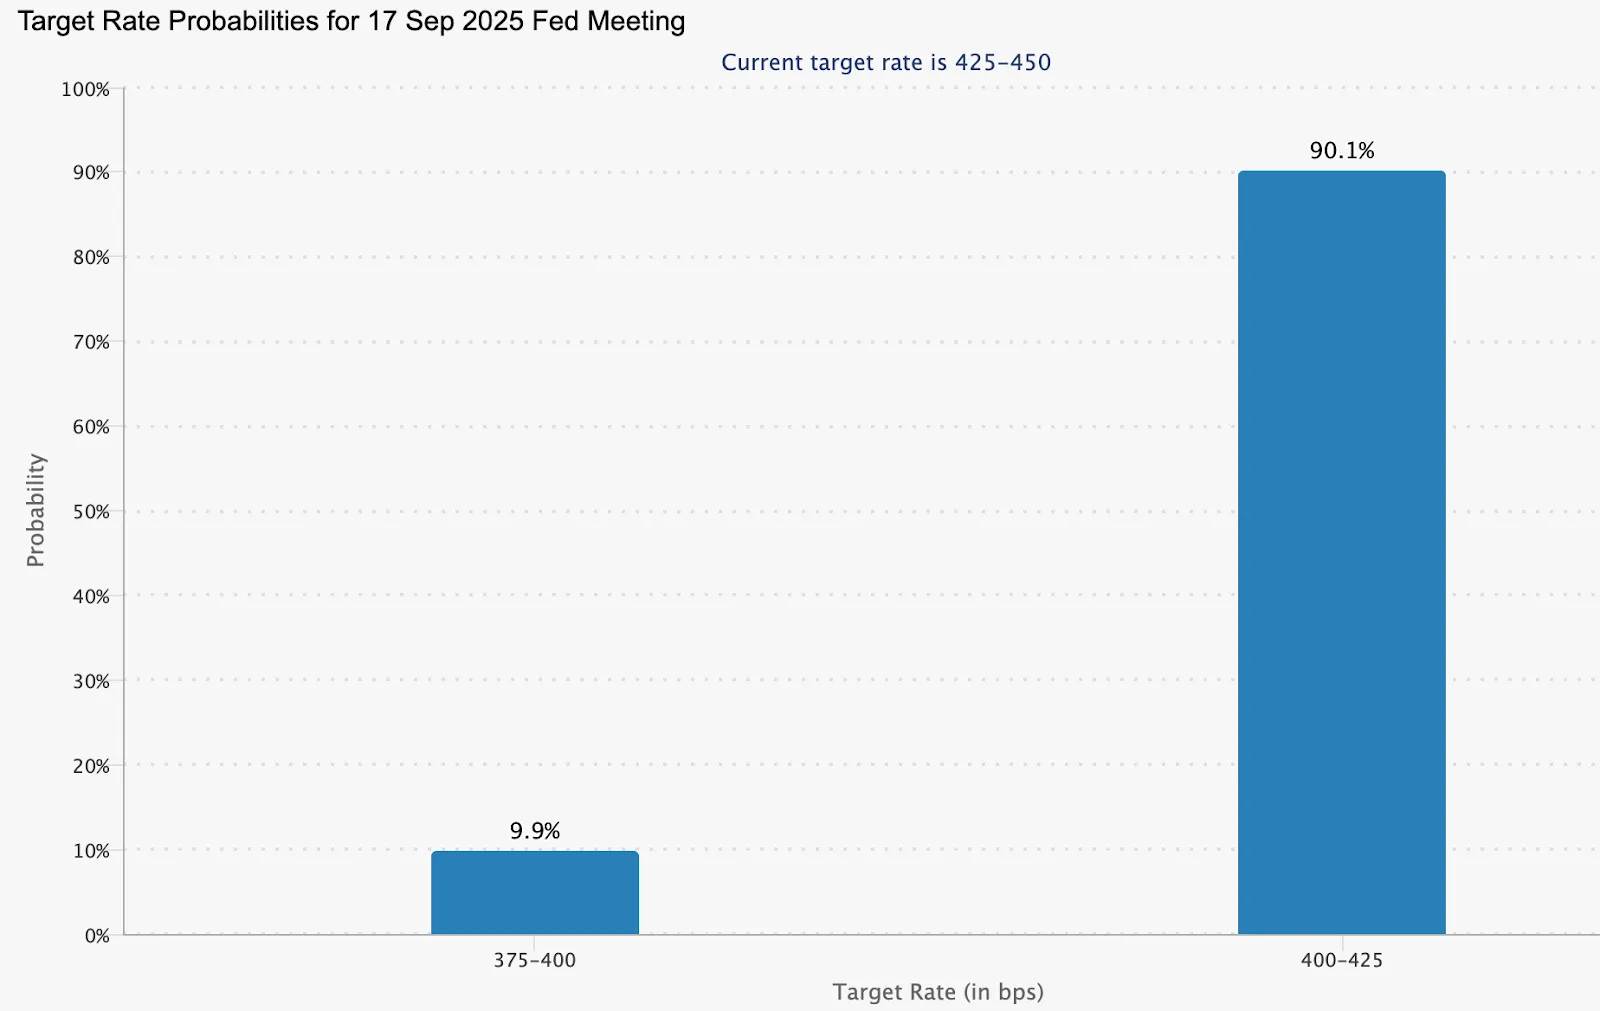
Markets are now almost certain the Fed will cut rates on 17 September, with a 90.1% probability of a 25-basis-point cut.
Lower interest rates reduce the opportunity cost of holding gold, while weighing on the US dollar. This creates a dual boost: Treasuries lose yield appeal, and gold becomes relatively more attractive for both official and private investors.
Speculative and retail flows add fuel
Alongside central bank buying, speculative positioning is rising sharply. Gold net long futures contracts increased by 20,740 in the week ending 2 September, bringing the total to 168,862. This shows momentum traders are leaning into the rally, amplifying the move.
Retail and domestic markets are also joining the surge. In India, weakness in the rupee has made gold and silver more attractive as hedges against currency risk. According to analysts, the dual demand from official institutions and private investors creates a powerful base of support above $3600.
Silver price higher highs
Gold’s surge is not occurring in isolation. Silver hit a 14-year high last week, signalling a broader appetite for precious metals as alternatives to fiat-denominated assets.
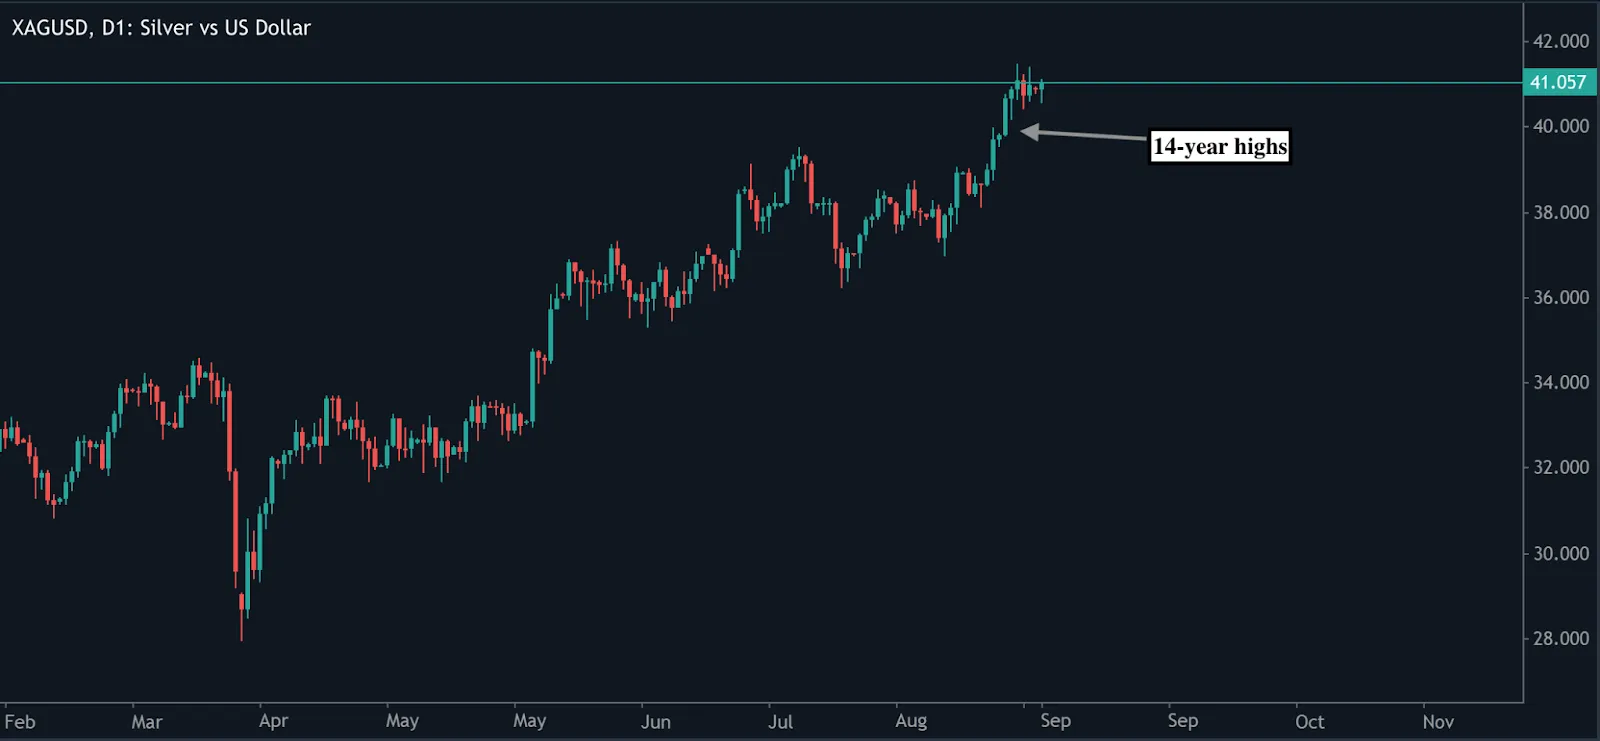
Silver’s dual role as both an industrial metal and a safe-haven asset makes its rally a confirming signal that investors are hedging systemic risk, not just trading short-term volatility.
Will prices decisively stay above $3,600?
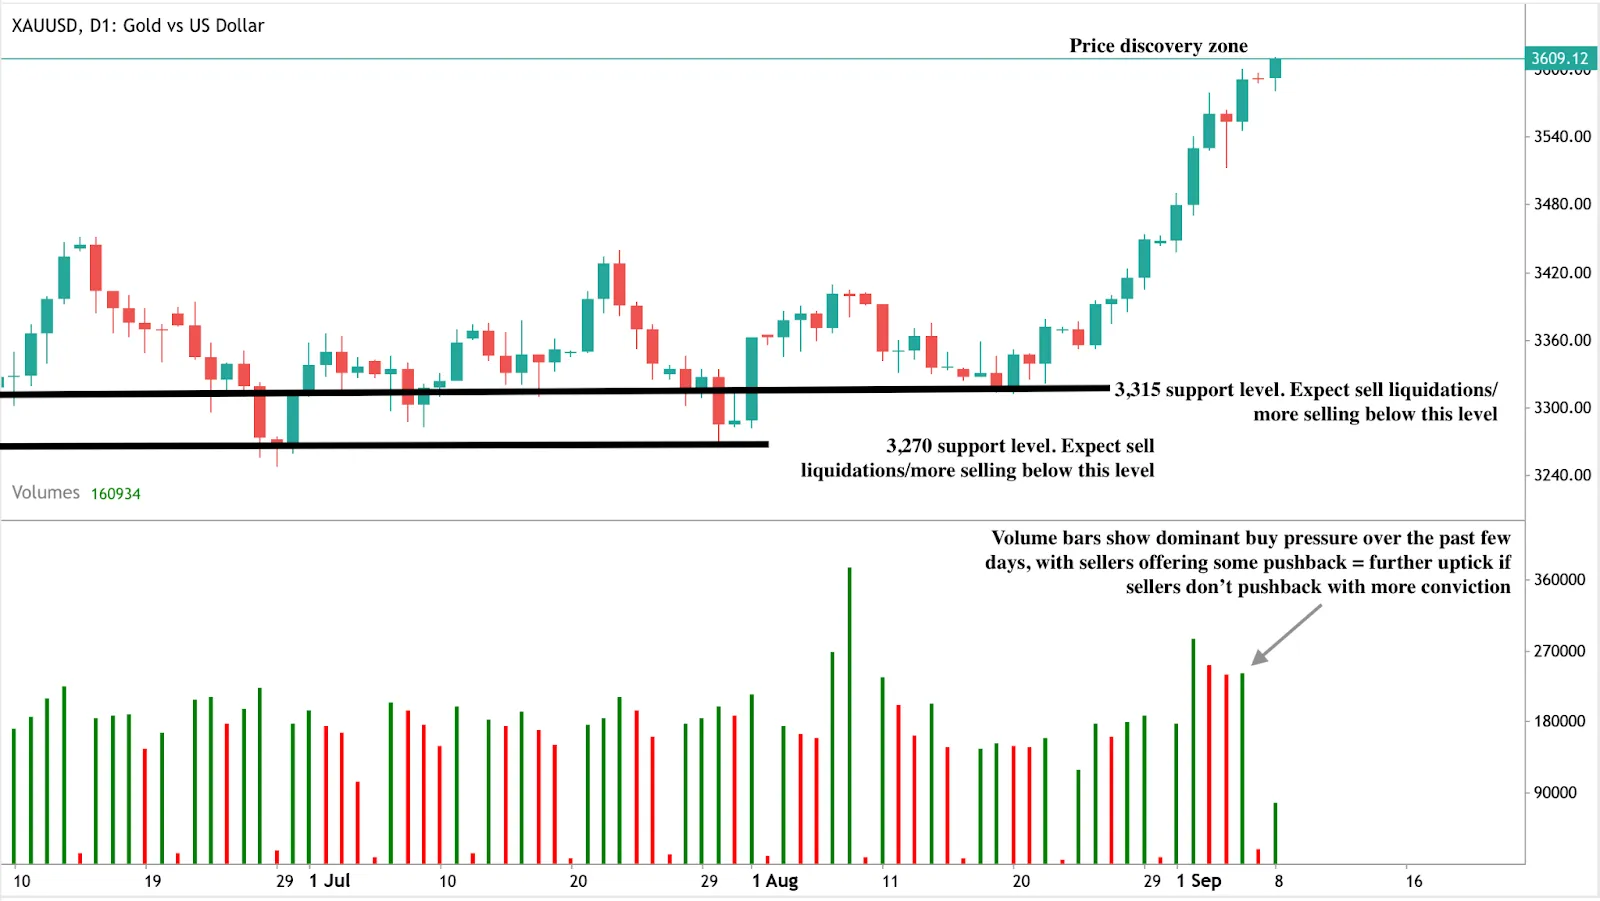
Gold is now in price discovery mode.
- Breakout case: Central bank demand, weak US jobs data, and Fed cuts could lift prices decisively above $3,600, opening the path for a new trading range.
- Stall case: The near-term risk is the upcoming US inflation report (Thursday). A hotter-than-expected print could strengthen the dollar and delay a clean breakout, leading to a temporary consolidation before the next move.
Gold Market outlook and scenarios
Gold’s performance so far in 2025 has reshaped its role:
- As a hedge, it continues to protect against inflation, dollar weakness, and geopolitical uncertainty.
- As a growth asset, gold has outperformed major equity benchmarks, with 74% compounded gains from 2024 to 2025.

In the short term, inflation data could inject volatility, but the structural drivers - central bank diversification away from Treasuries, sustained official purchases, and weakening US macro signals - underpin a higher long-term floor.
If central bank demand continues and the Fed delivers multiple cuts, gold could establish a new plateau way above $3,600. Conversely, if inflation runs hot and the dollar rebounds, traders may see consolidation before the next surge.
Gold technical insights
At the time of writing, Gold is going parabolic, slightly going past the $3,600 mark - bullish signals are evident on the daily chart. The volume bars also tell a bullish story with buy pressure dominating over the past few days. If sellers don’t push back with conviction, we could see a decisive move past the $3,600 mark. Conversely, if sellers offer more pushback, we could see prices tank. A change in the fundamentals, coupled with profit-taking, could see prices crash to find support at the $3,315 and $3,270 price levels.
Investment implications
For investors, the message is clear:
- Short-term: Watch Thursday’s inflation data and the Fed’s 17 September meeting. These are the catalysts above the $3,600 level.
- Medium-term: Central bank diversification away from Treasuries suggests gold demand is structural, not cyclical, supporting a higher price floor.
Strategy: If inflation shocks cause pullbacks, traders can look for tactical opportunities near support. For longer-term allocations, gold’s outperformance versus equities argues for treating it as a core growth asset, not just an emergency hedge.
Disclaimer:
The performance figures quoted are not a guarantee of future performance.


