Results for

USD/JPY hovering in danger zone: Can Japan halt a Climb to 160?
USD/JPY is hovering in what traders now call the “danger zone” - the 155–160 range that has previously forced Japan’s hand.
USD/JPY is hovering in what traders now call the “danger zone” - the 155–160 range that has previously forced Japan’s hand. The pair is testing levels that, if breached, could compel Tokyo to intervene once again to defend the yen, according to analysts. For markets, this isn’t just a psychological threshold; it’s a line drawn by history. Every move closer to 160 revives memories of past interventions and speculation over how far Japan will let its currency weaken before stepping in.
Reports stated that at the heart of the tension is a growing divergence between Japan’s fiscal expansion and its cautious monetary stance. Prime Minister Sanae Takaichi’s ¥21.3 trillion (£112 billion) stimulus plan has pushed yields higher and weakened the yen further, just as the United States maintains high interest rates.
The question now is whether Japan can - or will - act in time to halt USD/JPY’s climb before it breaks through 160 and tests Tokyo’s resolve on the global stage.
What’s driving USD/JPY?
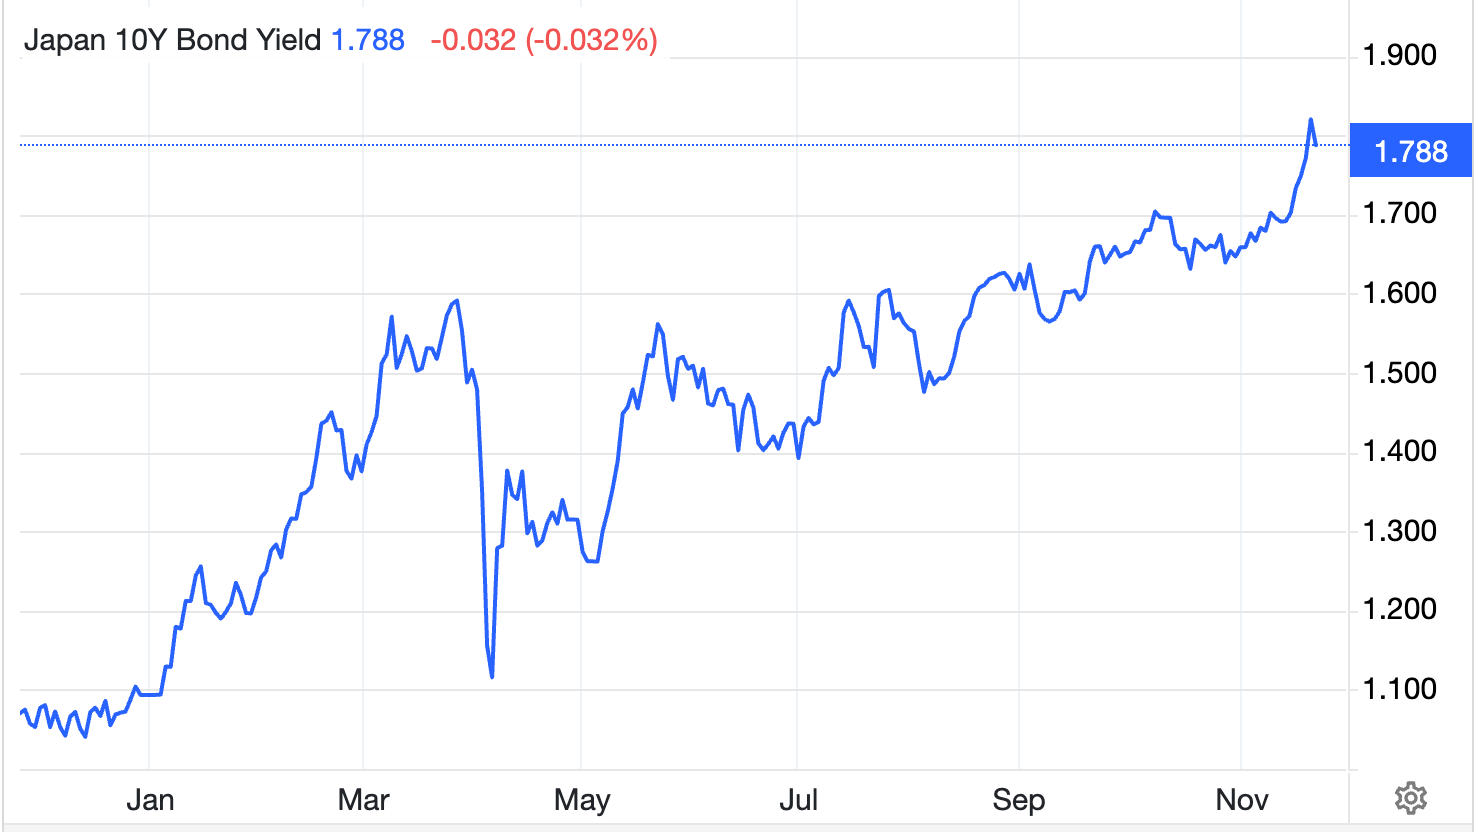
The yen’s latest decline is rooted in Japan’s widening policy gap with the United States. Takaichi’s stimulus, the largest since the pandemic, includes spending on energy relief, tax breaks, and cash handouts. It aims to ease cost-of-living pressures, yet investors view it as inflationary and fiscally reckless. Bloomberg reported that Japanese Government Bond (JGB) yields have surged to their highest since 2008 as debt worries deepen and confidence in long-term fiscal discipline wanes
The Bank of Japan’s cautious stance has only amplified the pressure. Governor Kazuo Ueda continues to argue that wage growth must stabilise before any major policy shift, even as inflation remains above the 2 per cent target.

In contrast, the Federal Reserve has kept US interest rates elevated and remains reluctant to cut quickly. That yield differential makes holding dollars more rewarding, sending capital flowing out of the yen and keeping USD/JPY pinned near multi-year highs.
Why it matters
Market watchers say the yen’s weakness cuts both ways. A softer currency benefits exporters such as Toyota and Sony, whose overseas earnings translate into higher profits. Yet for importers and households, the pain is immediate. Japan relies heavily on imported fuel and food, meaning each tick higher in USD/JPY makes everyday life more expensive. “Japan’s yen in real effective terms is almost as weak as the Turkish lira,” warned Robin Brooks of the Brookings Institution, describing the government’s fiscal stance as “denial on debt”.
Beyond Japan’s borders, the yen serves as a global barometer of risk sentiment. When it weakens sharply, it signals growing confidence in the dollar and emboldens carry-trade strategies funded in yen. But it also heightens the risk of abrupt reversals if Tokyo intervenes. Markets still recall the mid-year period, when Japan reportedly spent over $60 billion defending its currency after the USD/JPY briefly topped 160. That legacy makes every move within this band feel like a countdown.
Impact on markets and strategy
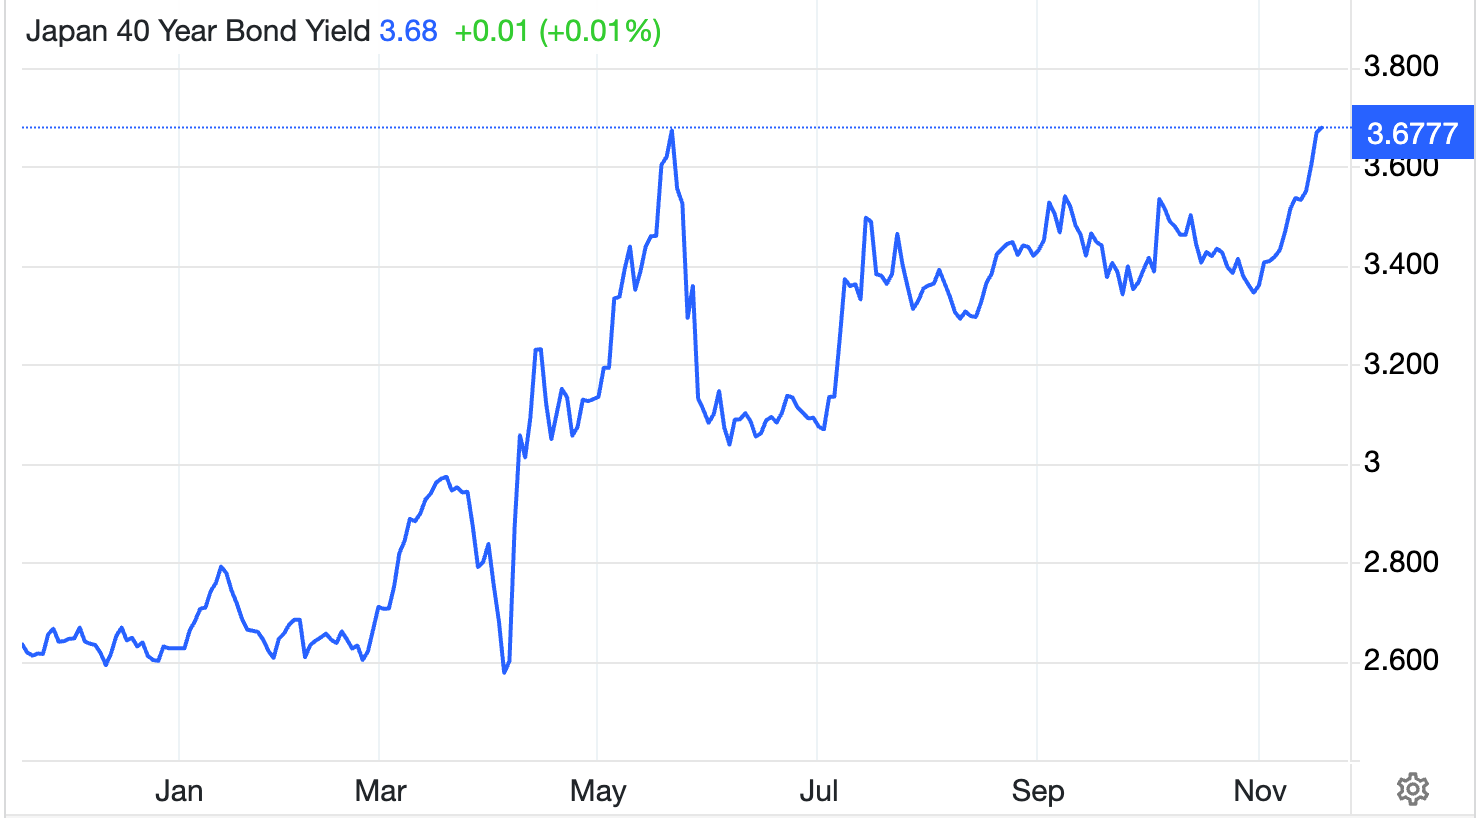
In bond markets, investors are demanding higher yields to offset fiscal risk, pushing ten-year JGB rates above 1 per cent and forty-year yields beyond 3.6 per cent. The rise reflects concern that Japan’s debt - already more than twice the size of its economy - will swell further under Takaichi’s pro-growth agenda.
Finance Minister Satsuki Katayama has already warned that the government “will act against disorderly moves,” a phrase traders now interpret as a veiled threat of intervention.
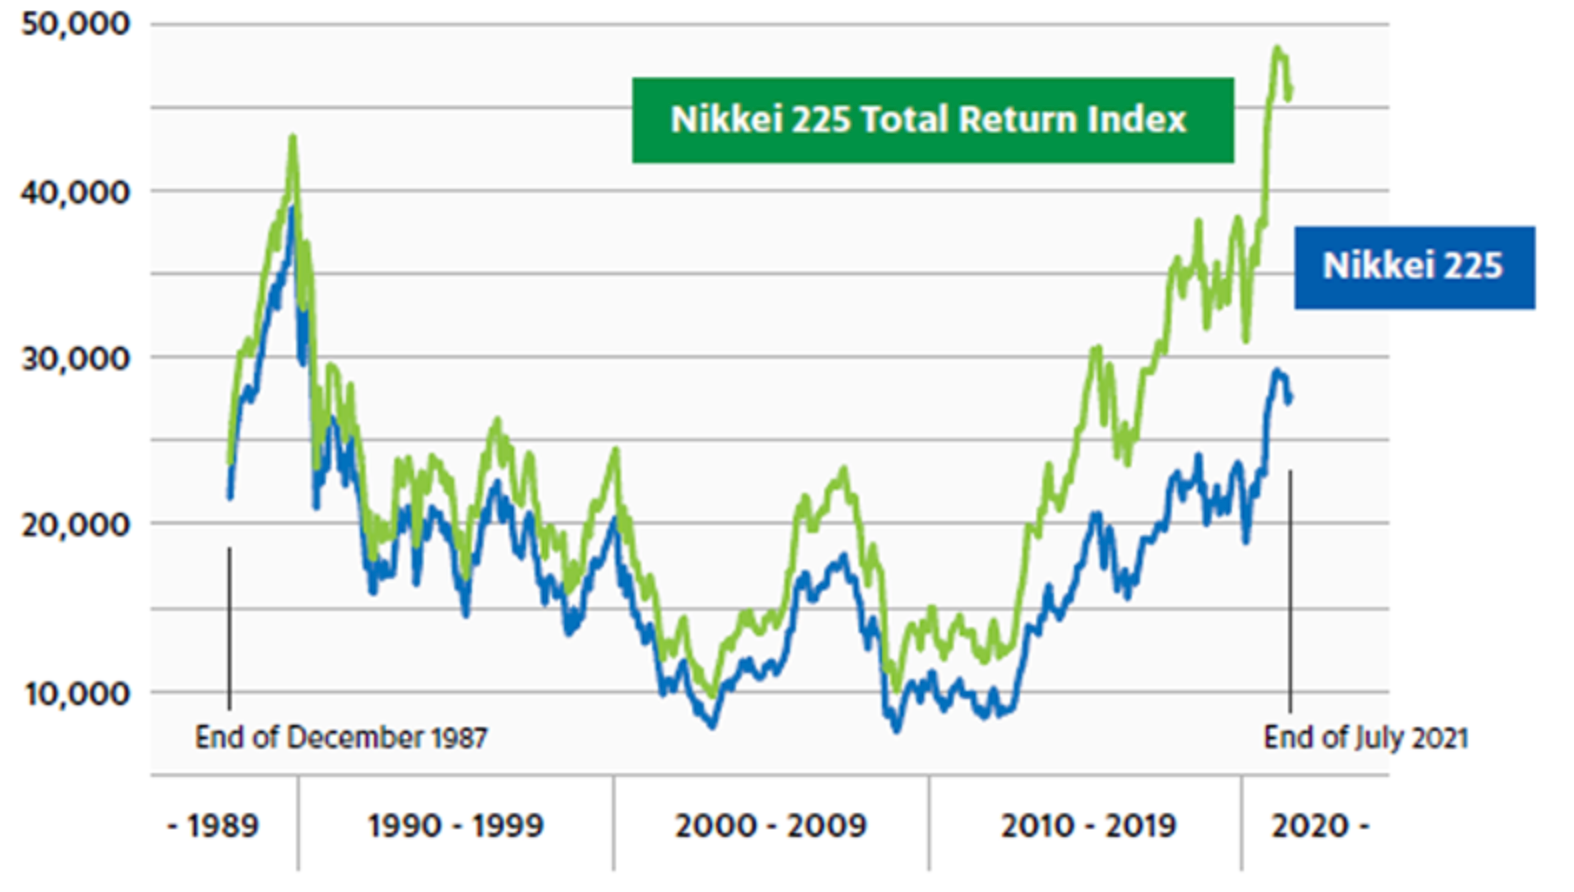
For equity investors, the weaker yen has delivered a short-term boost. The Nikkei 225 has climbed to its highest level in decades, supported by export-heavy stocks and overseas earnings windfalls.
Yet this comes at a cost: consumer confidence has declined, and inflation expectations are rising. Globally, the yen’s softness feeds risk appetite - fuel for equities and even crypto - but leaves markets vulnerable to a sharp correction if Tokyo or the BoJ suddenly shifts stance.
For retail traders, this volatility presents opportunity and risk in equal measure. With high volatility around key levels, disciplined position sizing and margin tracking become essential - tools like the Deriv calculator can help traders estimate pip values, contract sizes, and potential profit or loss before entering the market.
Expert outlook
Forecasts for USD/JPY hinge on timing. If the BoJ raises rates to 0.75 per cent in December, as a narrow majority of economists expect, the yen could stage a relief rally back towards 150.
However, if the central bank delays, and US data remain firm, traders may continue testing the upper bound of the range. “Sanae Takaichi’s Abenomics-style stimulus will expand global liquidity and strengthen the dollar - King Dollar is alive and well,” said James Thorne of Wellington Altus.
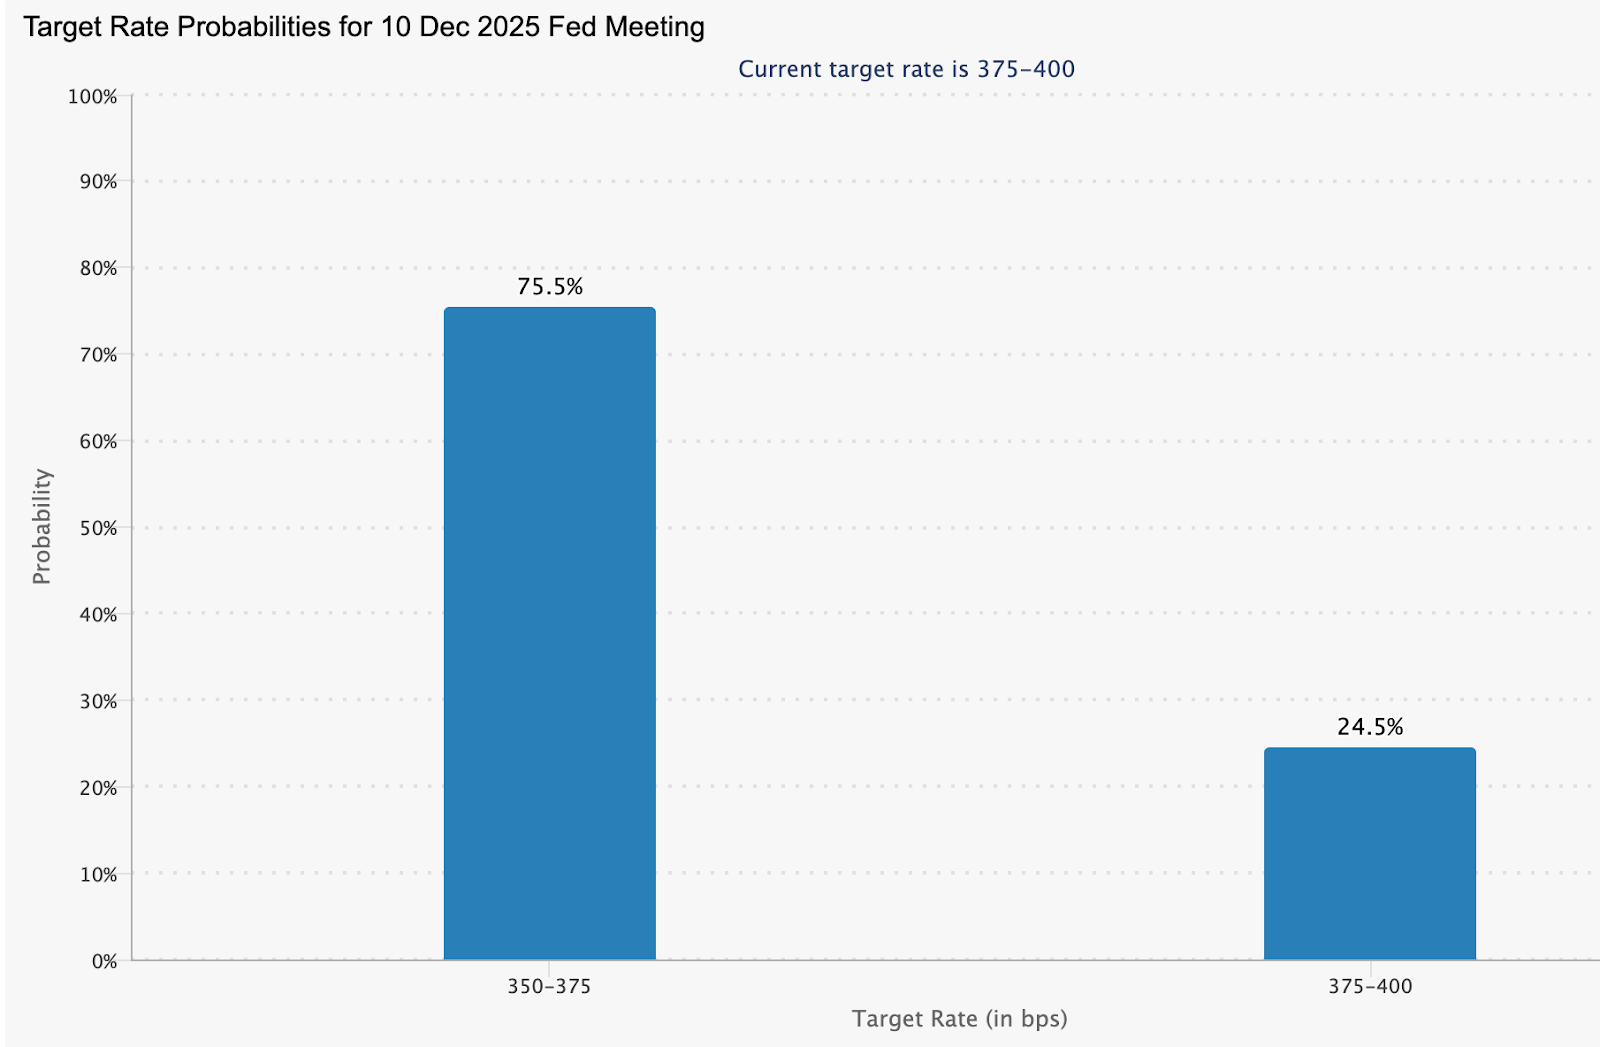
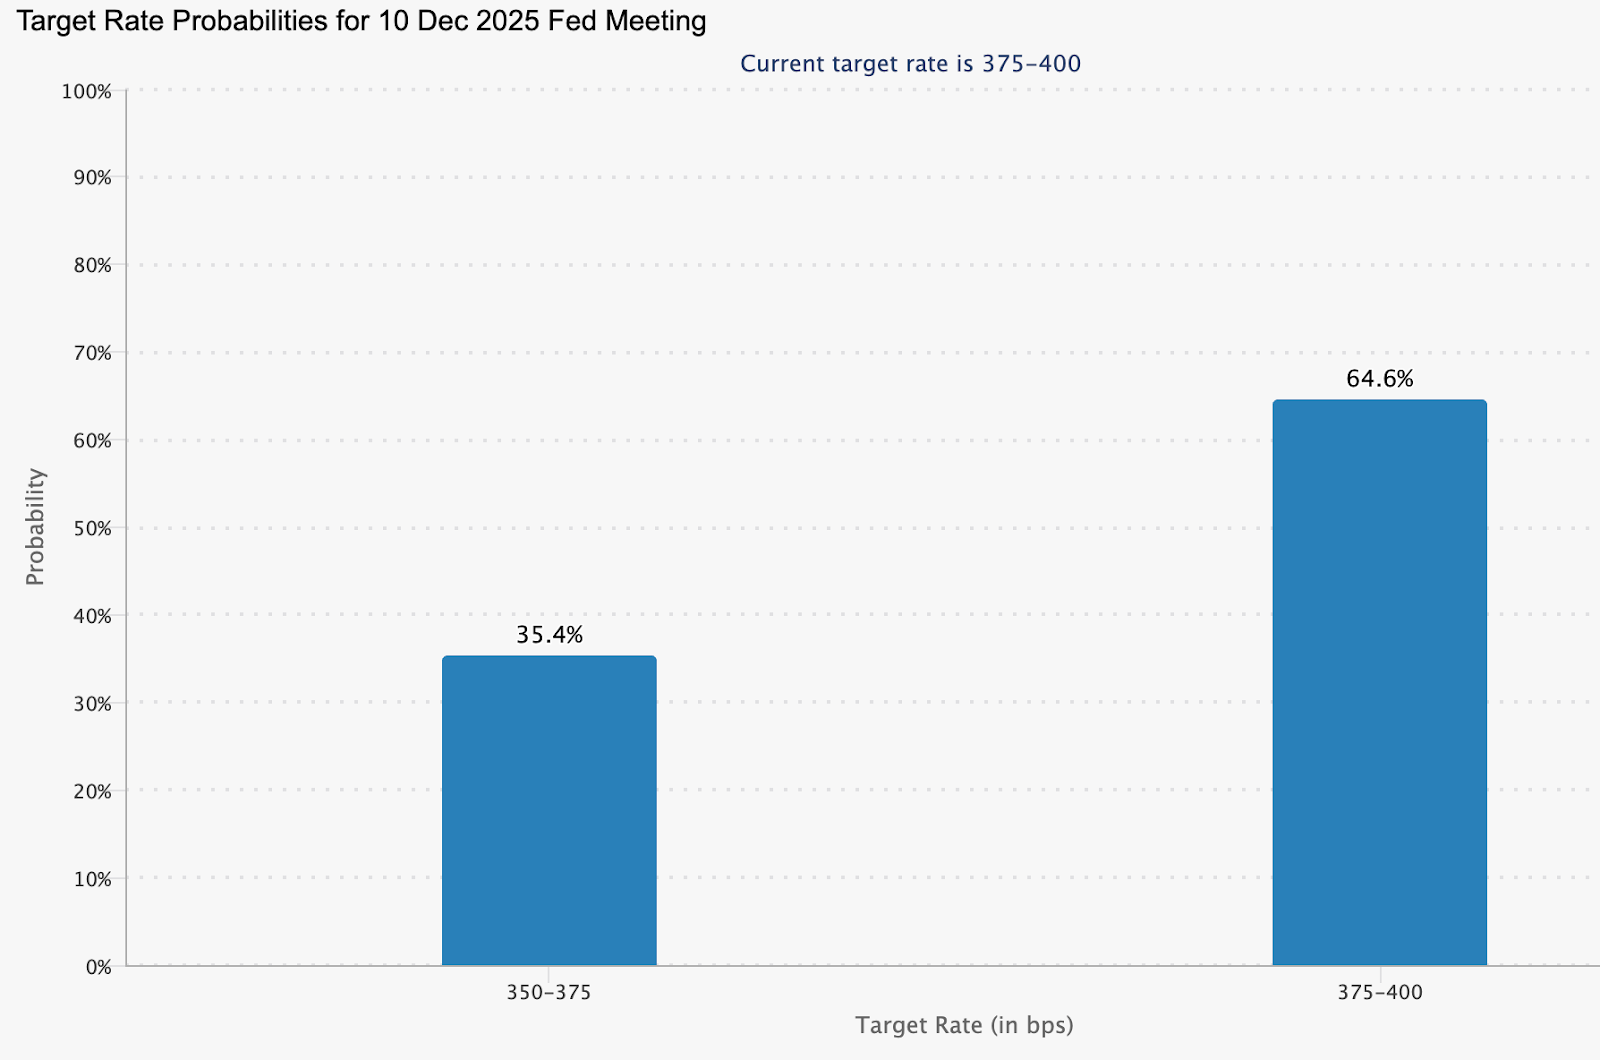
Much depends on whether the Fed shifts before the BoJ does. Futures markets currently price a 75.5% chance of a US rate cut in December.
Analysts also added that a dovish Fed could narrow the yield gap and trigger yen buying. But absent that, Japan’s currency remains hostage to policy inertia and global sentiment. The longer USD/JPY stays near 160, the greater the pressure on Tokyo to prove it still commands the market’s respect.
USD/JPY technical insights
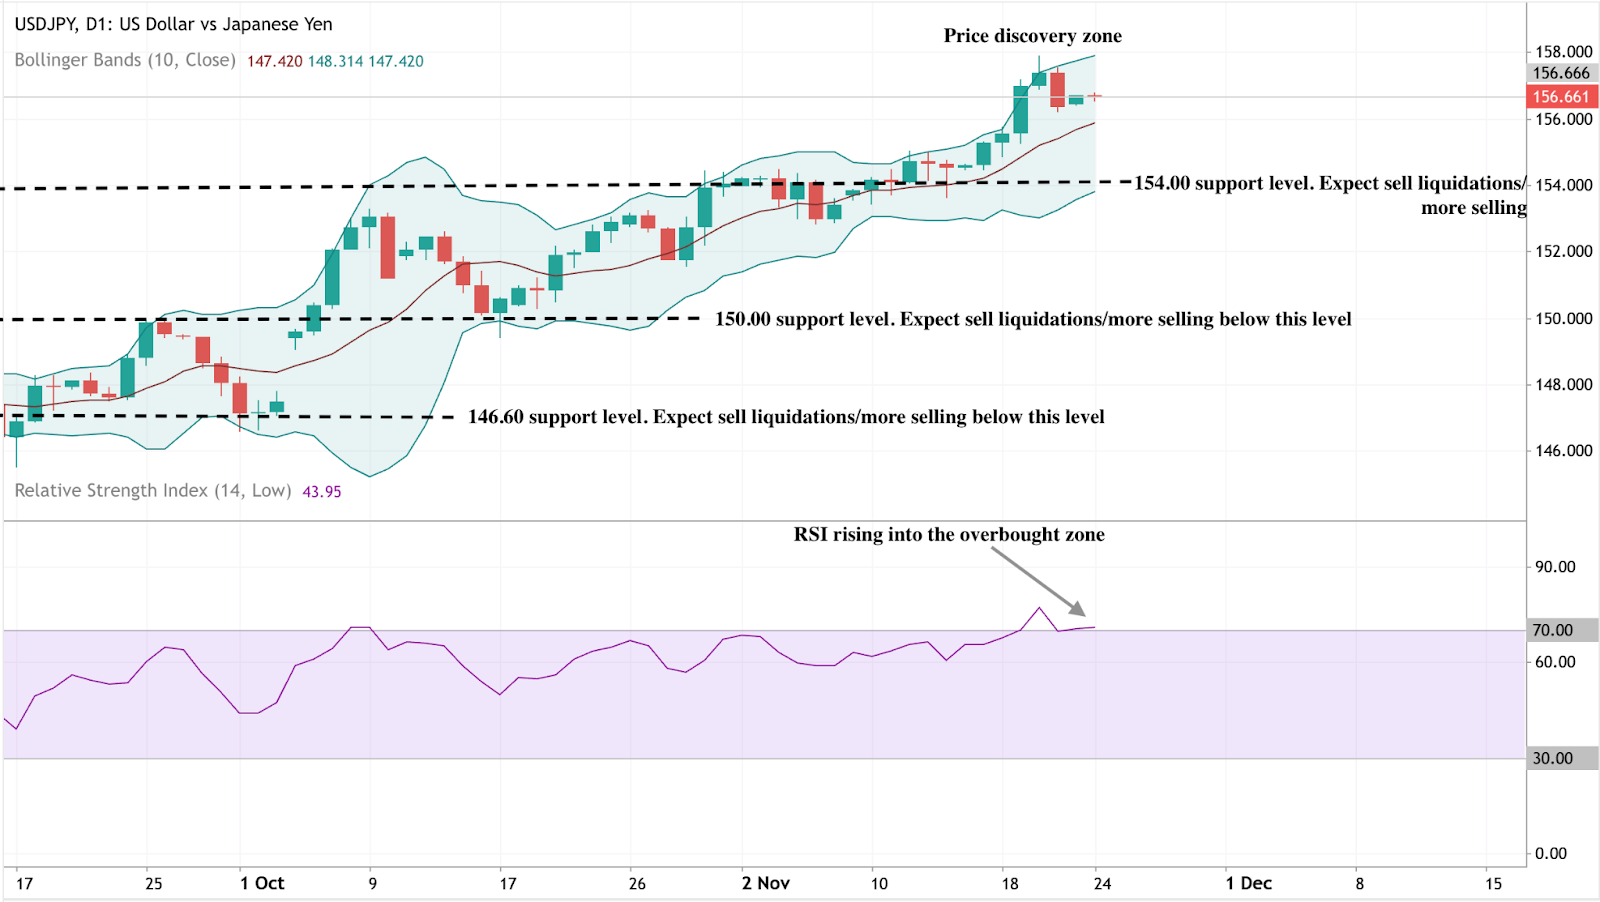
At the time of writing, USD/JPY is trading near 156.66, consolidating within a price discovery zone after an extended bullish run. The Bollinger Bands (10, close) are widening, showing heightened volatility and a continuation bias as price action remains close to the upper band — a sign of strong bullish momentum but also increased risk of short-term exhaustion.
Key support zones sit at 154.00, 150.00, and 146.60, where a break below each could trigger sell liquidations and deeper corrections. On the upside, price discovery above 156.00 leaves limited resistance, meaning the next pullbacks may attract dip buyers unless volatility spikes.
The RSI (14) is climbing into the overbought zone, suggesting bullish strength may be nearing its peak. If the RSI sustains a reading above 70, momentum could extend higher; however, any reversal below this level might indicate profit-taking or early selling pressure ahead.
Key takeaway
According to analysts, USD/JPY’s return to the 155–160 corridor is more than a chart pattern; it is a referendum on Japan’s policy mix. Fiscal expansion without matching monetary adjustment has left the yen vulnerable and investors sceptical. Intervention may stabilise markets briefly, but only decisive tightening or fiscal restraint will restore confidence. Until then, the pair sits squarely in the danger zone - where every move higher tests not just Tokyo’s tolerance, but the world’s faith in Japan’s ability to control its own currency.

Nvidia’s blowout quarter gets the market’s cold shoulder
Despite Nvidia's surge and raised guidance of about $65 billion for the next quarter, the market’s reaction was oddly restrained.
When Nvidia Corporation reported third-quarter revenue of $57 billion - up 62 % year-on-year - it looked like another flawless win in the AI hardware race. Yet despite the surge and raised guidance of about $65 billion for the next quarter, the market’s reaction was oddly restrained.
In a leaked all-hands meeting, CEO Jensen Huang admitted: “The market did not appreciate it.” This disconnect between execution and excitement reveals how high expectations - and AI euphoria - have raised the bar for even the best performers.
What’s driving Nvidia’s blowout quarter
The lifeblood of Nvidia’s results is still data-centre demand - the backbone of AI infrastructure. That segment alone generated roughly $51 billion in revenue, up 66% year-over-year and 25% quarter-over-quarter.

Flagship products like the Blackwell platform continue to dominate enterprise orders, while guidance now points toward another record quarter - $65 billion in revenue, 65% growth year-on-year. Nvidia isn’t merely growing; it’s defining the tempo for an entire industry’s capital-expenditure cycle.
Geopolitical and structural forces amplify that growth. As cloud, robotics and autonomous systems scale globally, Nvidia’s hardware sits at the centre of innovation - and the bottleneck of supply. But with success comes fragility: when perfection becomes expected, the smallest wobble feels seismic. “When you’ve trained the market to expect perfection,” one analyst quipped, “even great isn’t good enough.”
Why it matters
Nvidia now commands roughly 7.31% of the S&P 500’s total weighting, making it the single most influential barometer of AI sentiment. A stock this large moving sideways after a record quarter suggests investors are questioning not the data, but the narrative.
FinancialContent called it “a crucible moment for AI and the broader market.” If Nvidia’s excellence no longer excites, the rest of tech will feel the chill.
Huang himself put it plainly: deliver a bad quarter and you’re blamed for bursting the bubble; deliver a great one and you’re accused of fuelling it. That perception trap highlights a new phase in the AI trade - one where results must be beyond exceptional to move markets. It also reflects a subtle shift: from hype and promise to discipline and delivery.
Impact on the tech & AI ecosystem
Nvidia’s print initially lifted tech shares across the board, with AMD, Broadcom and memory suppliers riding the optimism. But as the day wore on, those gains faded - proof that enthusiasm has become fragile.
According to analysts, if monster results no longer trigger a rally, it implies much of the AI infrastructure growth is already priced in. Investors may now reward operational efficiency over raw expansion. That’s a natural evolution: when growth matures, valuation discipline takes over.
For hardware buyers and enterprise users, this evolution may mean slightly easier supply conditions but tighter pricing. Nvidia’s challenge will be to sustain margins while scaling output - a shift from visionary growth to industrial precision.
Expert outlook
Market watchers say two roads lie ahead. If Nvidia continues to execute - scaling new product lines, widening manufacturing capacity, and navigating export risks - it can retain leadership and extend its run. The company still holds a technological moat that few can breach.
The other scenario is one of valuation reset: if investors start questioning whether hardware growth can outpace cost inflation and competition indefinitely, Nvidia could face a plateau. As one Bernstein analyst put it: “I’m not sure what else you can ask for, at least on the print.”
For traders, the signals to monitor are guidance trends, backlog updates (especially in China), and the rollout pace of the Rubin and Blackwell chips. A market-cap swing of half a trillion dollars in weeks shows just how sensitive sentiment has become.
Nvidia technical insights
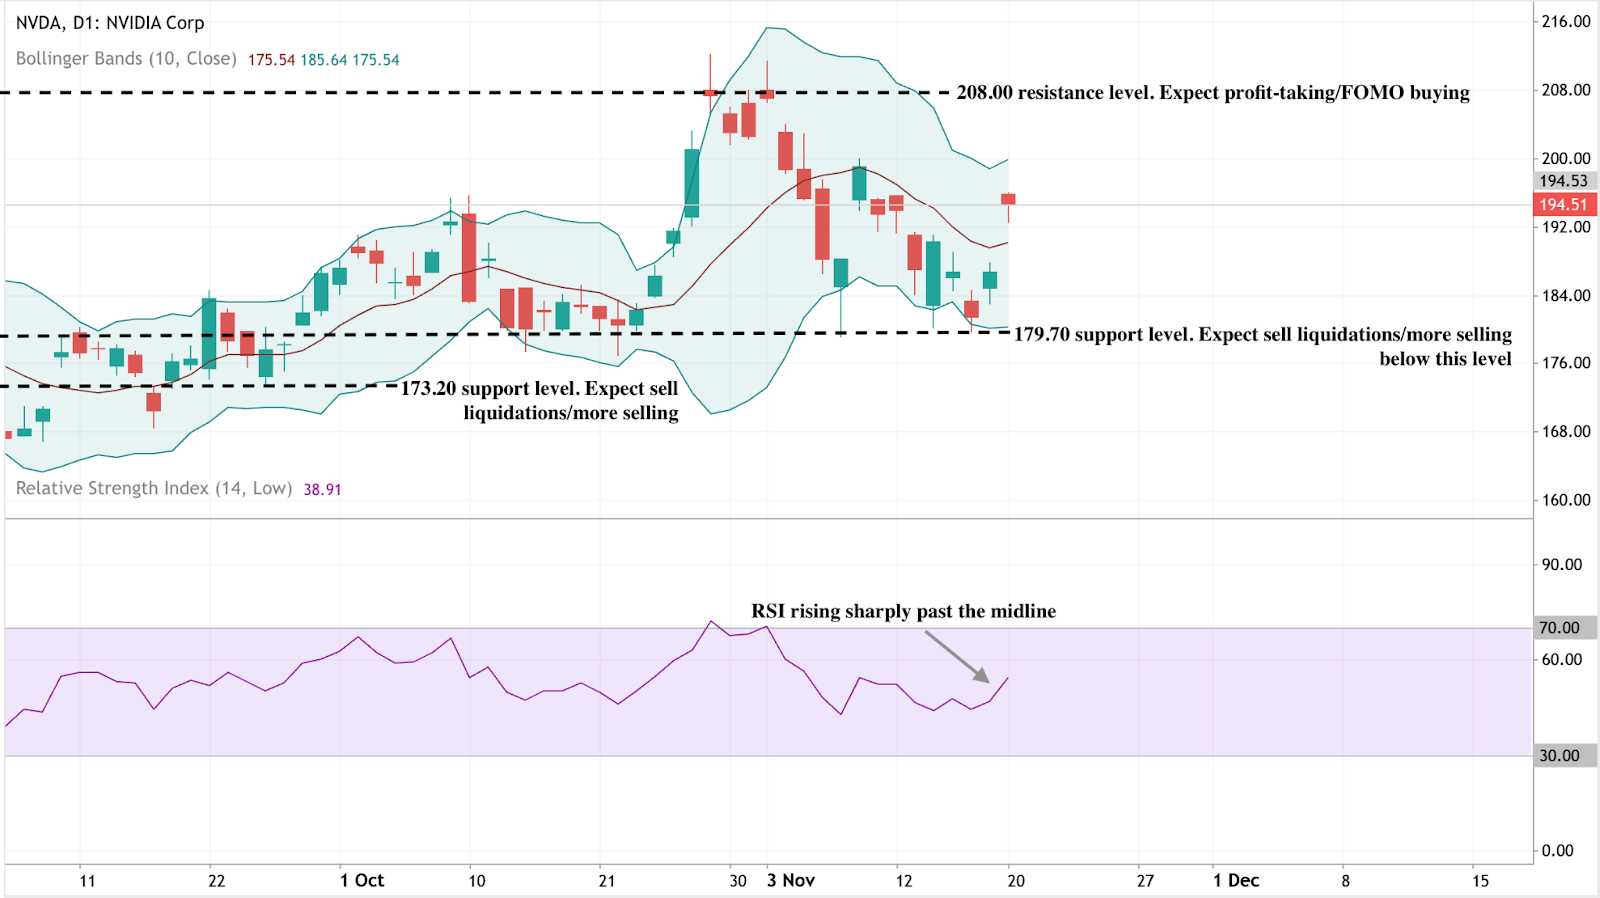
At the time of writing, Nvidia (NVDA) trades near $194.50, rebounding from the lower Bollinger Band after testing the $179.70 support level. The Bollinger Bands (10, close) are moderately widening - a sign of increasing volatility - with price action gravitating toward the midline. This suggests a potential continuation toward the upper band in the short term.
The $173.20 level stands out as the next key support; a break below could spark sell liquidations and amplify downside momentum. Conversely, $208.00 forms a strong resistance zone where both profit-taking and late-cycle FOMO buying could emerge if the rally extends.
Momentum indicators add weight to the bullish case. The RSI (14) has turned sharply upward, crossing above the midline around 50 - a technical cue for renewed buying pressure. A sustained move above that level, supported by stability above $179.70, would reinforce a short-term uptrend and re-engage traders eyeing momentum moves.
For those mapping scenarios, the Deriv calculator can be useful for simulating profit and loss under different volatility setups - an essential complement to chart analysis when planning NVDA trades on Deriv MT5.
Key takeaway
Investors see Nvidia as remaining the nucleus of the AI infrastructure boom - financially unmatched and technologically dominant. Yet the market’s lukewarm response marks a turning point: investors no longer reward promise, only proof. In this new phase of the AI trade, execution, margin resilience and innovation cadence will define leadership. For traders, Nvidia’s chart may hint at short-term upside, but the bigger story is one of shifting expectations - where perfection is now the baseline, not the surprise.

Gold price outlook: Central banks are providing a floor
Beneath the noise of fading rate-cut bets and dollar strength lies a deeper structural force: relentless gold buying by the world’s central banks.
Gold’s remarkable steadiness near $4,050 per ounce is no accident, according to reports. Beneath the noise of fading rate-cut bets and dollar strength lies a deeper structural force: relentless buying by the world’s central banks. From Beijing to Ankara, policymakers are quietly rewriting the rules of monetary safety, using gold as their hedge against political risk, currency instability, and waning trust in the U.S. financial order.
This demand has become the invisible hand supporting bullion, according to analysts. Even as speculative traders pull back and ETF flows flatten, sovereign buyers are helping to anchor the market.
With the People’s Bank of China extending its 12-month gold-buying streak and other central banks following suit, gold’s downside risk now looks more like a pause than a collapse - a floor reinforced by nations, not funds.
What’s driving gold right now?
The latest U.S. jobs data has reset expectations across global markets. The September Nonfarm Payrolls report showed a gain of 119,000 jobs, more than double what economists expected, while unemployment inched up to 4.4 %.

On the surface, the data appears mixed - strong hiring but softening momentum - yet it was enough to prompt investors to dial back their calls on a December rate cut from the Federal Reserve.
That recalibration lifted the dollar and U.S. yields, typically a toxic combination for gold. But the metal barely flinched. The reason is that central-bank demand has altered gold’s sensitivity to policy cycles.
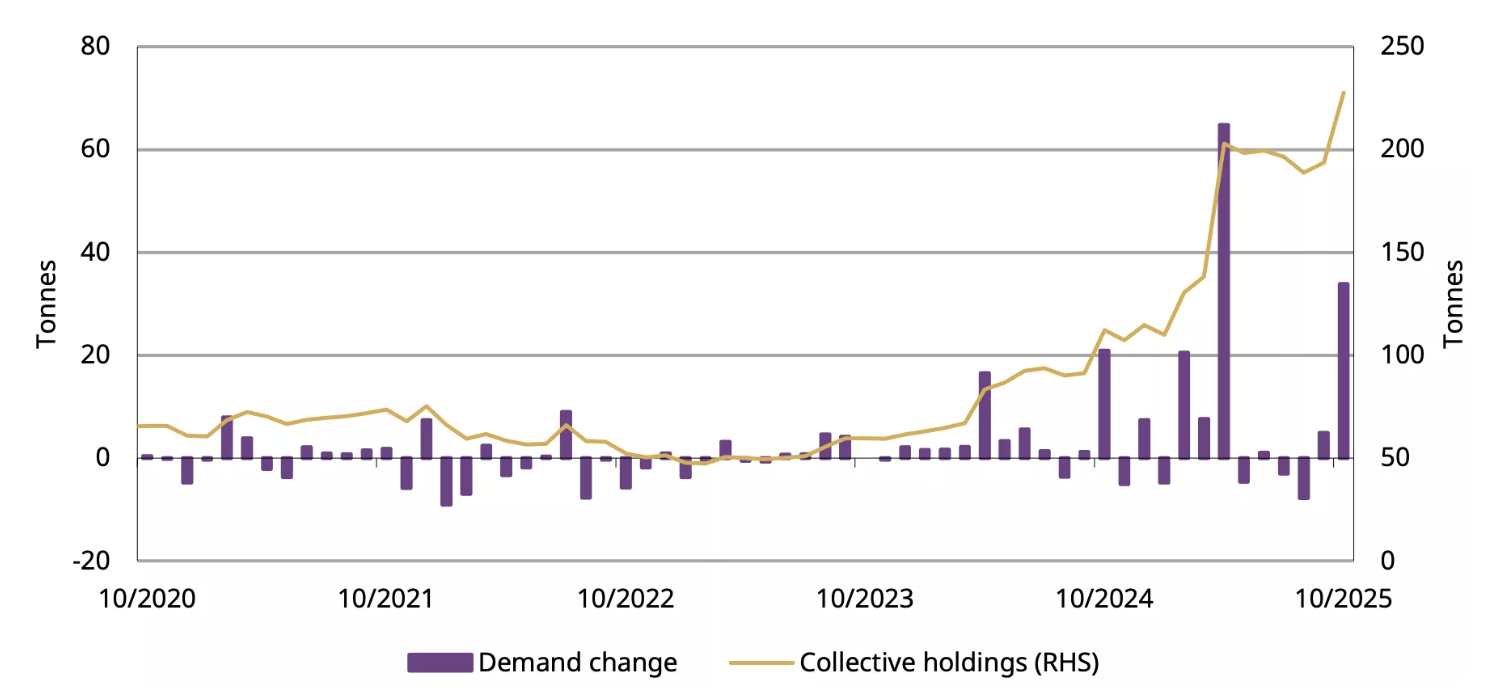
According to data from the World Gold Council, official sector purchases now account for nearly a quarter of annual demand - a structural shift from a decade ago. When the Fed hesitates, central banks don’t.
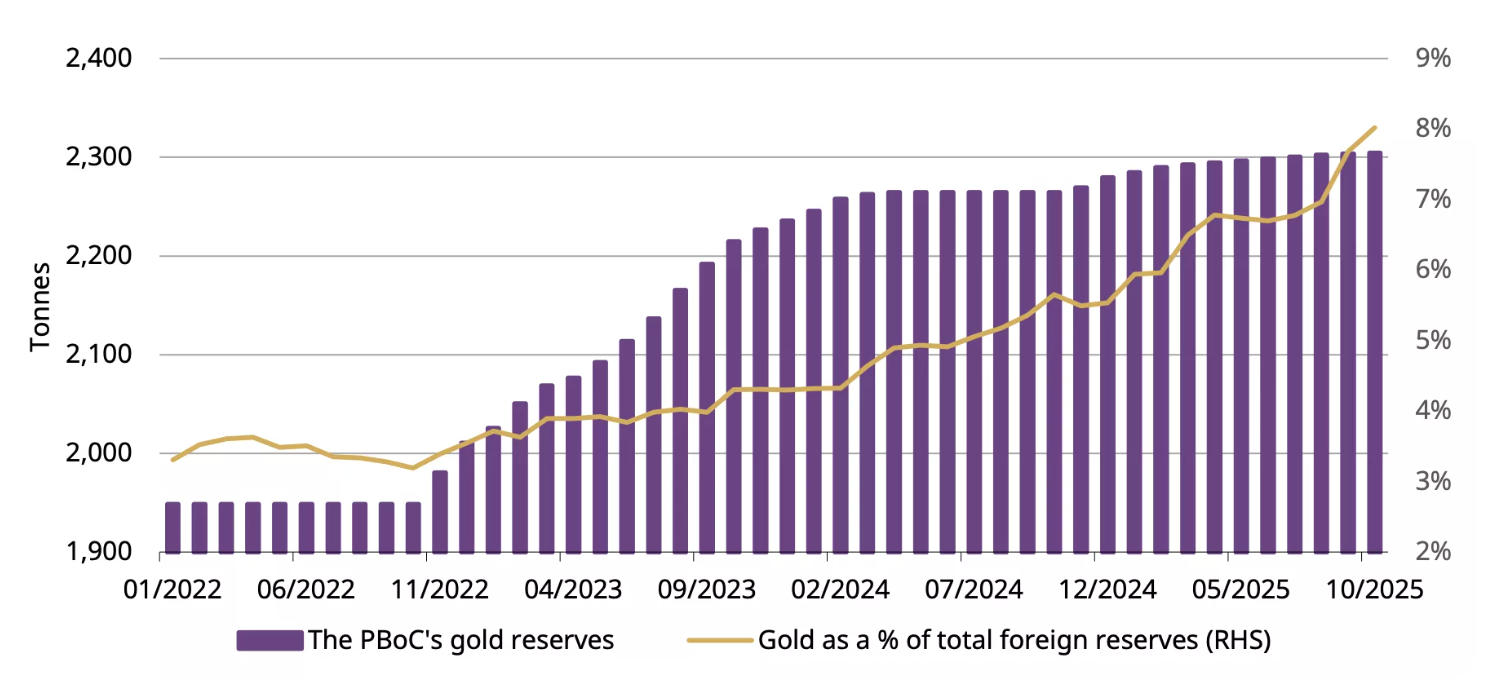
The People’s Bank of China (PBoC) has reported gold purchases for 12 consecutive months, adding 0.9t in October, which lifted the total to 2,304t, representing 8% of China’s foreign exchange reserves and marking a full year of uninterrupted buying. Turkey, Poland, and India have all joined the trend of accumulation.
Why it matters
Market watchers say this quiet sovereign accumulation is reshaping the role of gold in the global financial system. What used to be a “risk-off” trade is now part of the national reserve strategy. The freezing of Russian foreign assets in 2022 prompted governments to reassess their exposure to the dollar-dominated system, and gold emerged as a neutral alternative.
As Zaner Metals strategist Peter Grant puts it, the latest U.S. jobs data “confirms a slowing yet stable market - but that doesn’t reduce the appetite for safety.”
For policymakers in emerging markets, gold offers something paper assets can’t: insulation from sanctions, inflation, and the politics of currency. For investors, this means that gold’s price is no longer solely a function of interest rates or risk appetite. It’s a geopolitical indicator - a mirror of how much trust remains in the current monetary order.
Impact on markets and investors
The most striking change in this cycle is that gold is holding near record highs even as the U.S. dollar index (DXY) trades at its strongest level in months. The traditional inverse relationship has weakened. According to analysts, both assets are being purchased for the same reason: safety. This dynamic challenges the idea that gold only rallies when rates fall.
For traders, that complicates short-term positioning. With gold now roughly 7% below its October record of $4,380, momentum has cooled, but structural demand remains intact. ETF flows, although mildly negative in recent weeks, show no signs of panic.
Retail investors have trimmed exposure, but the official sector has replaced them as the marginal buyer. For long-term investors, this shift suggests that pullbacks may offer opportunities rather than warnings, especially if macroeconomic uncertainty deepens into 2026.
Expert outlook
Analysts remain divided on how far this central-bank bid can carry the metal. Goldman Sachs still sees the recent weakness as “a blip, not a reversal,” maintaining that both sovereign and private investment demand will underpin prices through 2026. UBS projects a possible climb to $4,900 per ounce within the next two years, assuming continued diversification away from dollar reserves.
The main risk to that outlook lies in monetary complacency. If U.S. data stays firm and the Fed reaffirms its “higher for longer” stance, speculative interest could fade further. But for now, gold’s resilience speaks for itself. The market is adjusting to a new reality - one where central banks, not traders, set the tone.
Gold technical insights
At the time of writing, Gold (XAU/USD) is trading around the $4,030 region, hovering near the $4,020 support level. The RSI is flat and close to the midline, indicating a lack of strong momentum in either direction - a sign of market indecision.
Meanwhile, Bollinger Bands have started to narrow, reflecting lower volatility after recent swings. The price is oscillating near the mid-band, suggesting a potential consolidation phase before the next breakout.
On the upside, $4,200 and $4,365 remain key resistance levels, where traders may expect profit-taking or renewed buying interest if bullish sentiment returns. Conversely, a break below $4,020 could open the door to the $3,940 support, where increased selling pressure or liquidations may occur.

Key takeaways
Gold’s resilience in late 2025 isn’t a mystery - it’s a message analysts expressed. The same institutions that once trusted U.S. Treasuries are now buying bullion to insure against policy, politics, and uncertainty. Traders may fade the rally, but central banks aren’t flinching. As the Fed navigates a divided policy outlook and global reserves continue to shift eastward, the floor under gold looks as firm as the hands holding it.
.png)
Bitcoin’s harsh reset: Flows, fear and two lines that matter
The world’s largest cryptocurrency has shed nearly a third of its value since its October peak, slipping toward critical technical levels as headwinds take effect.
Bitcoin’s harsh reset has arrived. The world’s largest cryptocurrency has shed nearly a third of its value since its October peak, slipping toward critical technical levels as exchange-traded fund outflows and macroeconomic headwinds take effect.
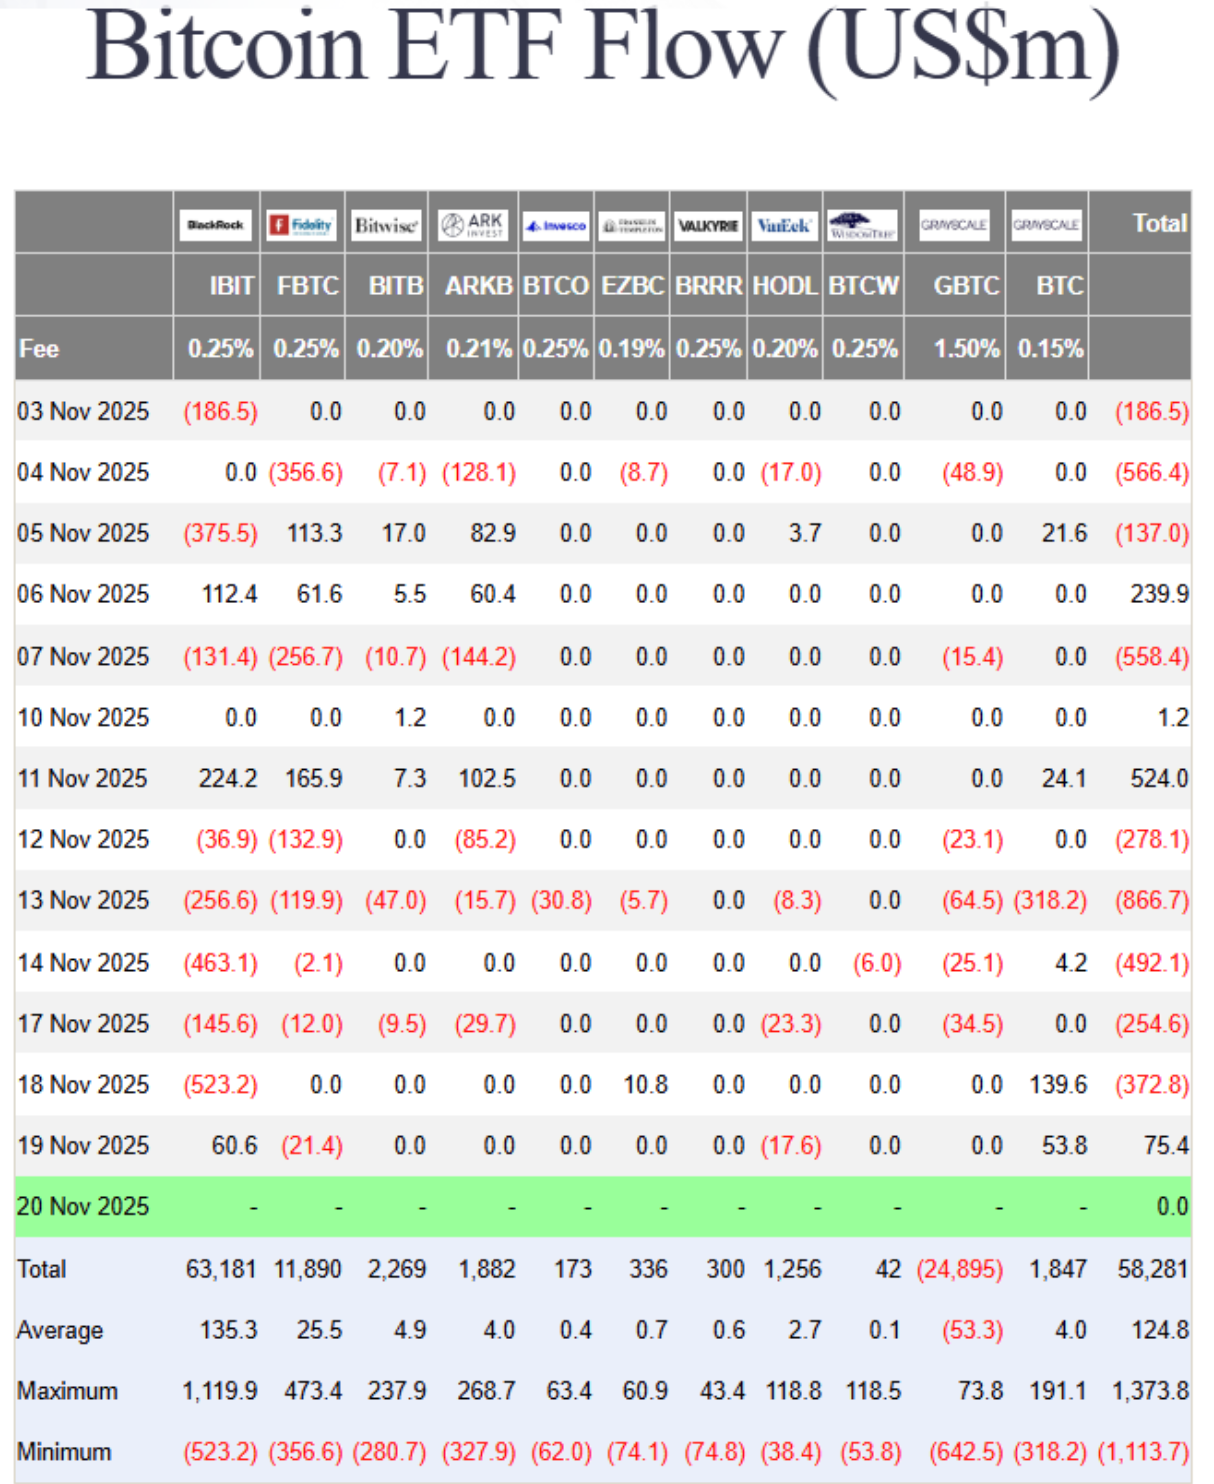
Recent data showed nearly $3 billion has exited Bitcoin ETFs this month alone, turning the same institutional flows that once fuelled the rally into a feedback loop of redemptions and retreat.
Behind the selloff lies a mix of fading Fed-rate-cut hopes, tightening liquidity, and a market paralysed by “extreme fear”. With prices hovering near $85,600 and the one-year low at $74,000 looming, the question is simple but urgent: is this correction a passing flush - or the start of a deeper shift in Bitcoin’s new ETF era?
What’s driving Bitcoin’s correction
Bitcoin’s 30% slide isn’t being driven by scandal or shock - it’s the result of structural forces finally reversing, according to analysts. After two years of relentless inflows, spot Bitcoin ETFs are now experiencing capital outflows. Institutional investors, once hailed as crypto’s stabilisers, are showing how quickly sentiment turns when markets wobble.
According to Farside data, ETF redemptions have occurred on all but four days this month, stripping nearly $3 billion in net outflows.
Part of that retreat stems from shifting macro conditions. The Federal Reserve’s reluctance to confirm rate cuts has strengthened the US dollar, drawing liquidity away from speculative assets.
Past movements have shown that a stronger dollar typically weighs on Bitcoin, and with inflation readings still sticky, traders are reassessing the narrative of “easy money” returning in December. The result is a market where rallies are met with selling rather than enthusiasm - a sharp turn from the euphoria that drove Bitcoin to $126,000 just weeks ago.
Why it matters
Bitcoin’s selloff is revealing just how tightly traditional and digital markets are now intertwined. ETFs opened the floodgates for institutional exposure, but they also linked Bitcoin to broader risk trends. When investors pull money from ETF products, the effect ricochets through liquidity pools and sentiment alike.
As Matt Williams of Luxor explained, “The drop to $86,000 is largely driven by macro forces - rate expectations, inflation - and by large holders cutting exposure after breaking key technical supports.”
For traders, this is a psychological turning point. The same retail crowd that once flooded exchanges during Thanksgiving 2017 - when Bitcoin first crossed $10,000 - is largely silent now.
Social data from Santiment shows sentiment evenly split between predictions of a plunge below $70,000 and wild optimism for a rally to $130,000. The divide signals indecision, not conviction. In this phase, fear - not fundamentals - is setting the tone.

Impact on markets and investors
The selloff has spilled beyond the crypto space. Bitcoin’s correlation with equity indices, such as the Nasdaq 100, has climbed above 0.8 at times, meaning that moves in tech stocks and digital assets now feed off the same macro triggers. When rate optimism fades, both markets suffer. That link cuts against Bitcoin’s long-standing claim as a hedge against monetary risk.
ETF outflows are another pressure point. As funds are redeemed, liquidity providers are compelled to unwind their positions in futures and spot markets, thereby deepening volatility.
The Crypto Fear & Greed Index, which plunged to 14 this week - its lowest since February - underscores how rapidly sentiment has deteriorated. Analysts like Rachael Lucas of BTC Markets warn that momentum, money flow, and volume trends “all reflect a sharp deterioration in sentiment,” driven by macro tightening and risk-off positioning.

In the background, liquidity providers are struggling. Tom Lee of Fundstrat compared crypto market makers to “central banks” of digital liquidity - and right now, those banks are running dry.
Following October’s $20 billion liquidation wave, market makers are operating with smaller balance sheets, which limits their ability to absorb order flow. It’s a reminder that crypto’s plumbing, though more sophisticated, is still fragile.
Expert outlook
Analysts are torn between caution and curiosity. Nic Puckrin of Coin Bureau describes the current landscape as a “bull-bear tug of war,” with macroeconomic pessimism offset by resilience in the tech sector.
Nvidia’s earnings beat briefly lifted risk appetite, but Bitcoin failed to follow through, suggesting traders are still unwinding rather than reloading. Puckrin pegs the next resistance at $107,500, if a rebound can gain traction.
Andre Dragosch of Bitwise sees parallels to past mid-cycle corrections, noting that the depth and duration of this decline “remain consistent with interim pullbacks in previous bull markets.” His base case still anticipates the cycle extending into 2026, driven by gradual global monetary easing.
For now, though, short-term risk remains tilted lower, with $85,600 and $74,000 as the two critical levels to watch. Hold those, and Bitcoin could form a base; lose them, and the next flush could be swift.
The bigger picture: Could Bitcoin trigger a financial crisis?
Despite the panic, Bitcoin remains relatively small compared to the real financial system. The total crypto market stands around $3–4 trillion, with Bitcoin representing roughly half. In contrast, global financial assets exceed $400 trillion. Past collapses, such as FTX in 2022 and Terra in 2021, caused chaos within the crypto industry but barely rippled across global markets.
That said, every cycle pulls crypto closer to traditional finance. ETFs, corporate holdings, and stablecoins backed by US Treasuries have created real linkages. A severe Bitcoin crash could trigger ETF redemptions, hurt balance sheets at companies holding BTC, and pressure stablecoins to liquidate their Treasury assets. None of that would cause a 2008-style crisis today - but as the overlap grows, the line between “crypto crash” and “financial contagion” gets thinner.
Bitcoin technical insights
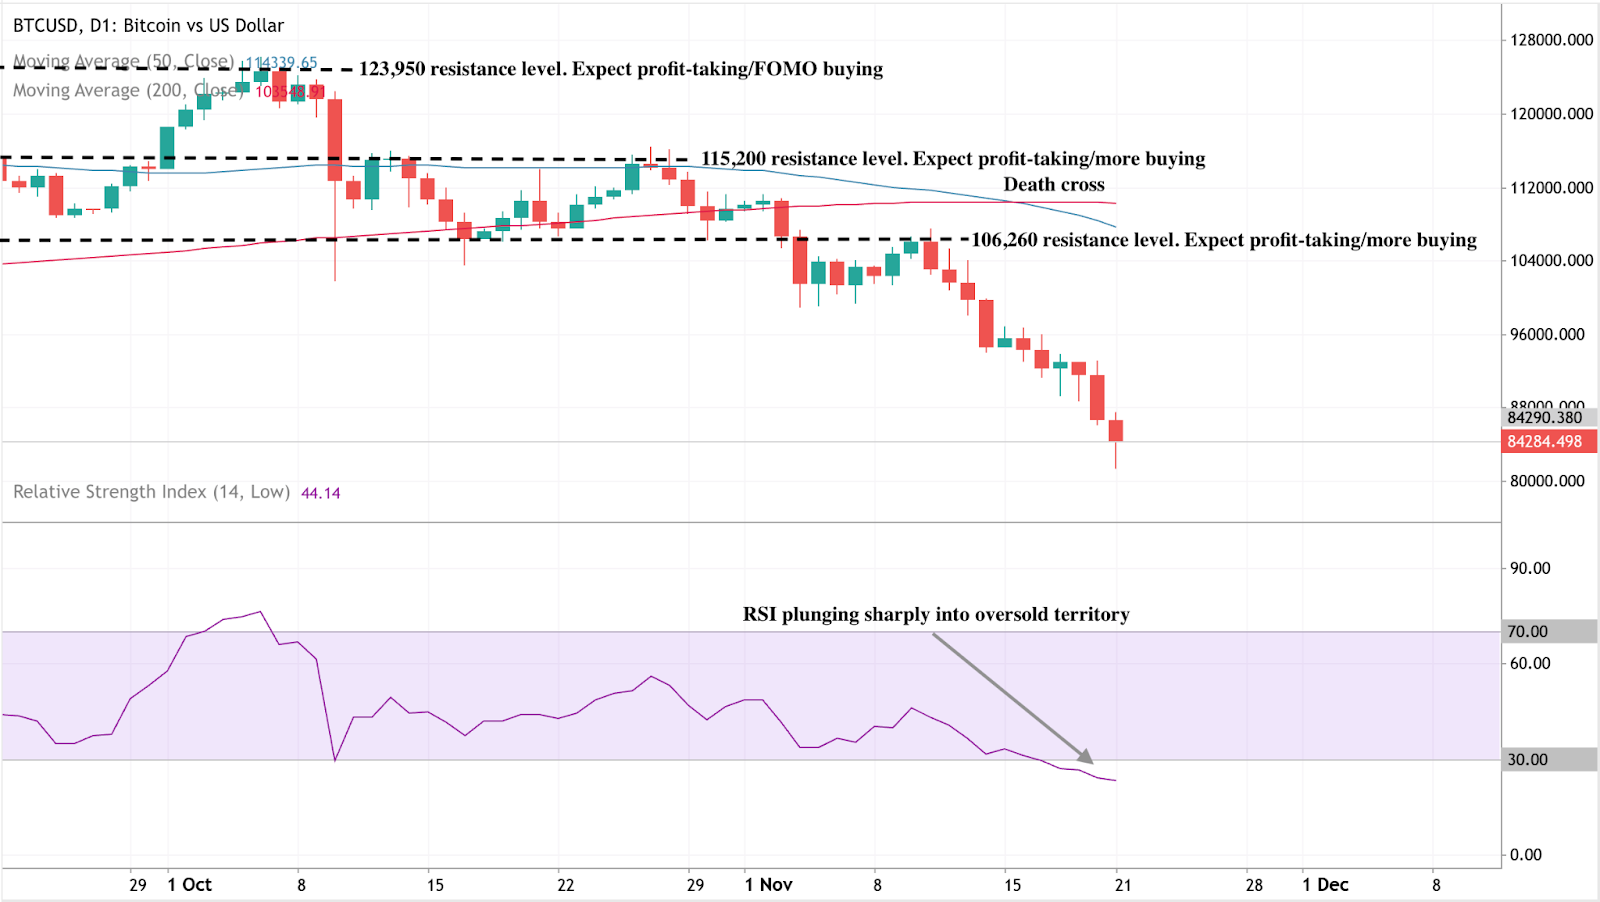
At the time of writing, Bitcoin (BTC/USD) is trading around the $84,200 mark after an extended downtrend. The RSI has plunged sharply into oversold territory, signalling intense bearish momentum and the potential for a short-term relief bounce if buyers step in.
A death cross - where the 50-day moving average has fallen below the 200-day moving average - reinforces the bearish bias, suggesting further downside pressure in the near term.
Key resistance levels sit at $106,260, $115,200, and $123,950, where traders may expect profit-taking or renewed buying interest if recovery attempts occur. Failure to reclaim these zones could see Bitcoin remain under pressure, with sentiment staying fragile amid persistent selling.
Key takeaways
Bitcoin’s decline isn’t an accident - it’s a stress test of its new reality. The ETF era has tied the cryptocurrency closer to the global financial system, for better and worse. Liquidity, once a tailwind, now cuts both ways. Fear dominates, but deep corrections are part of Bitcoin’s DNA.
If those two lines - $85,600 and $74,000 - hold firm, many say this reset may end up looking like just another cleansing phase before the next wave of institutional demand. Lose them, and Bitcoin’s harsh reset could turn into something much deeper.

Nvidia earnings reality check: Is the AI boom back on track?
Nvidia’s latest earnings didn’t inflate another round of hype; they restored confidence that artificial intelligence is entering its scale phase.
Yes - the AI boom is back on track, according to analysts, just in a different gear. Nvidia’s latest earnings didn’t inflate another round of hype; they restored confidence that artificial intelligence is entering its scale phase, not its speculative one.
Nvidia investors are bracing for a $300 billion surge in market value after the chipmaker reported its first sales acceleration in seven quarters, signalling that AI demand isn’t fading - it’s normalising into a sustainable growth cycle.
For months, markets were haunted by talk of “peak AI.” However, Nvidia’s results - record data centre revenue, renewed partnerships, and a 5% share spike in after-hours trading - show the story isn’t one of collapse, but calibration. This isn’t a bubble bursting; it’s the industry learning how to breathe again.
What’s driving Nvidia’s momentum
At the core of Nvidia’s dominance in artificial intelligence architecture is its data centre segment, which surpassed $50 billion this quarter, a milestone reached earlier than analysts expected.
This reflects an industrial-scale buildout, not a speculative frenzy. The surge in demand from AI workloads has transformed GPUs from niche products into the backbone of modern computing, powering everything from ChatGPT to enterprise cloud systems.
CEO Jensen Huang captured it best: “We’re in every cloud.” That ubiquity underpins Nvidia’s stability. Its chips are not optional - they’re essential infrastructure. With Blackwell GPUs offering up to 40 times faster inference speeds than the previous generation, the company isn’t chasing hype; it’s engineering the next leap in computational efficiency.
Why it matters
Nvidia’s report acts as a barometer for the AI economy. The stock’s post-earnings rally wasn’t just about profits; it was about validation. The market had priced in fear after days of tech sell-offs, but Nvidia’s blowout numbers reintroduced realism.
Analysts like Julian Emanuel of Evercore ISI summed up the pre-earnings tension: “The angst around ‘peak AI’ has been palpable.” Those fears evaporated when Nvidia showed that demand isn’t flattening - it’s broadening.
The company’s performance has become closely tied to the trajectory of U.S. equities. With AI now a structural growth driver, Nvidia’s consistency reassures investors that this is an economic revolution in progress, not a fleeting mania. Its $5 trillion valuation last month wasn’t an aberration; it was a preview of scale yet to come.
Impact on global markets
The aftershocks were immediate. Tech indices that had stumbled under the weight of “AI fatigue” rebounded as Nvidia reignited investor faith. Asian markets opened higher, and S&P futures turned positive, driven by renewed conviction that the AI trade still has legs. Even after a period of correction - Meta down 19%, Oracle off 20% - Nvidia’s performance reaffirmed that the long-term AI thesis remains intact.
Beyond markets, Nvidia’s results signal a new capital cycle. Its multibillion-dollar partnerships with Microsoft, OpenAI, and Anthropic aren’t one-off investments; they’re structural commitments to an AI-driven infrastructure era. Every dollar of GPU spending feeds into an ecosystem that’s building capacity for the next generation of models, data centres, and intelligent services.
Expert outlook
Forecasts are being rewritten. McKinsey estimates $7 trillion in AI infrastructure spending by 2030, with $5.2 trillion going toward data centres. According to McKinsey, we will also see significant incremental AI capacity added every year through to 2030.
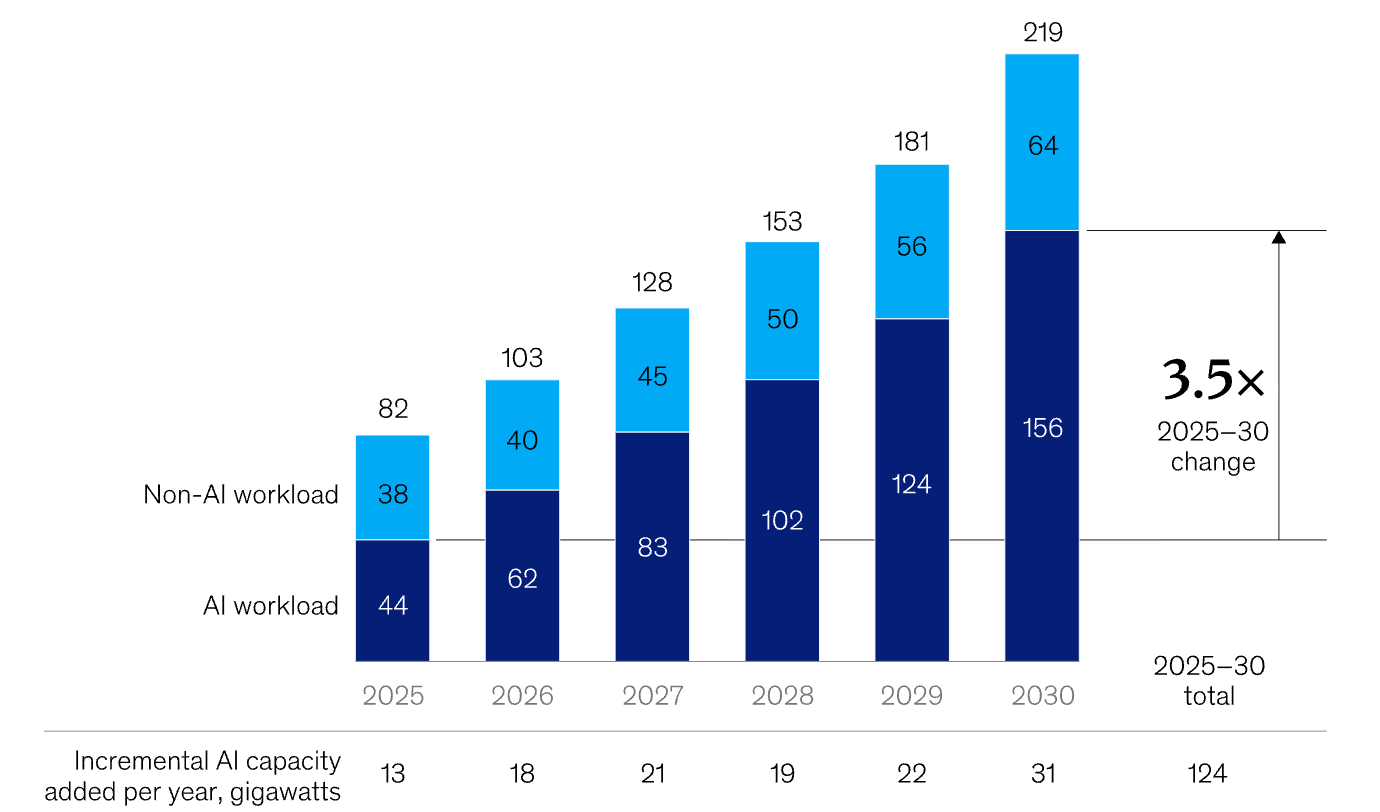
Nvidia’s share of that pie could exceed 50%, given its current dominance and design lead. Some analysts even project a $20 trillion market capitalisation by 2030 if the company maintains its pace of innovation.
Still, this is not a frictionless ascent. Export restrictions to China and the rise of custom silicon from rivals like AMD and Google pose challenges. Yet Nvidia’s edge isn’t just its hardware - it’s the CUDA software ecosystem, which locks developers and enterprises into its platform. As long as AI workloads require versatility and performance across models and frameworks, Nvidia’s moat will hold.
Nvidia technical analysis
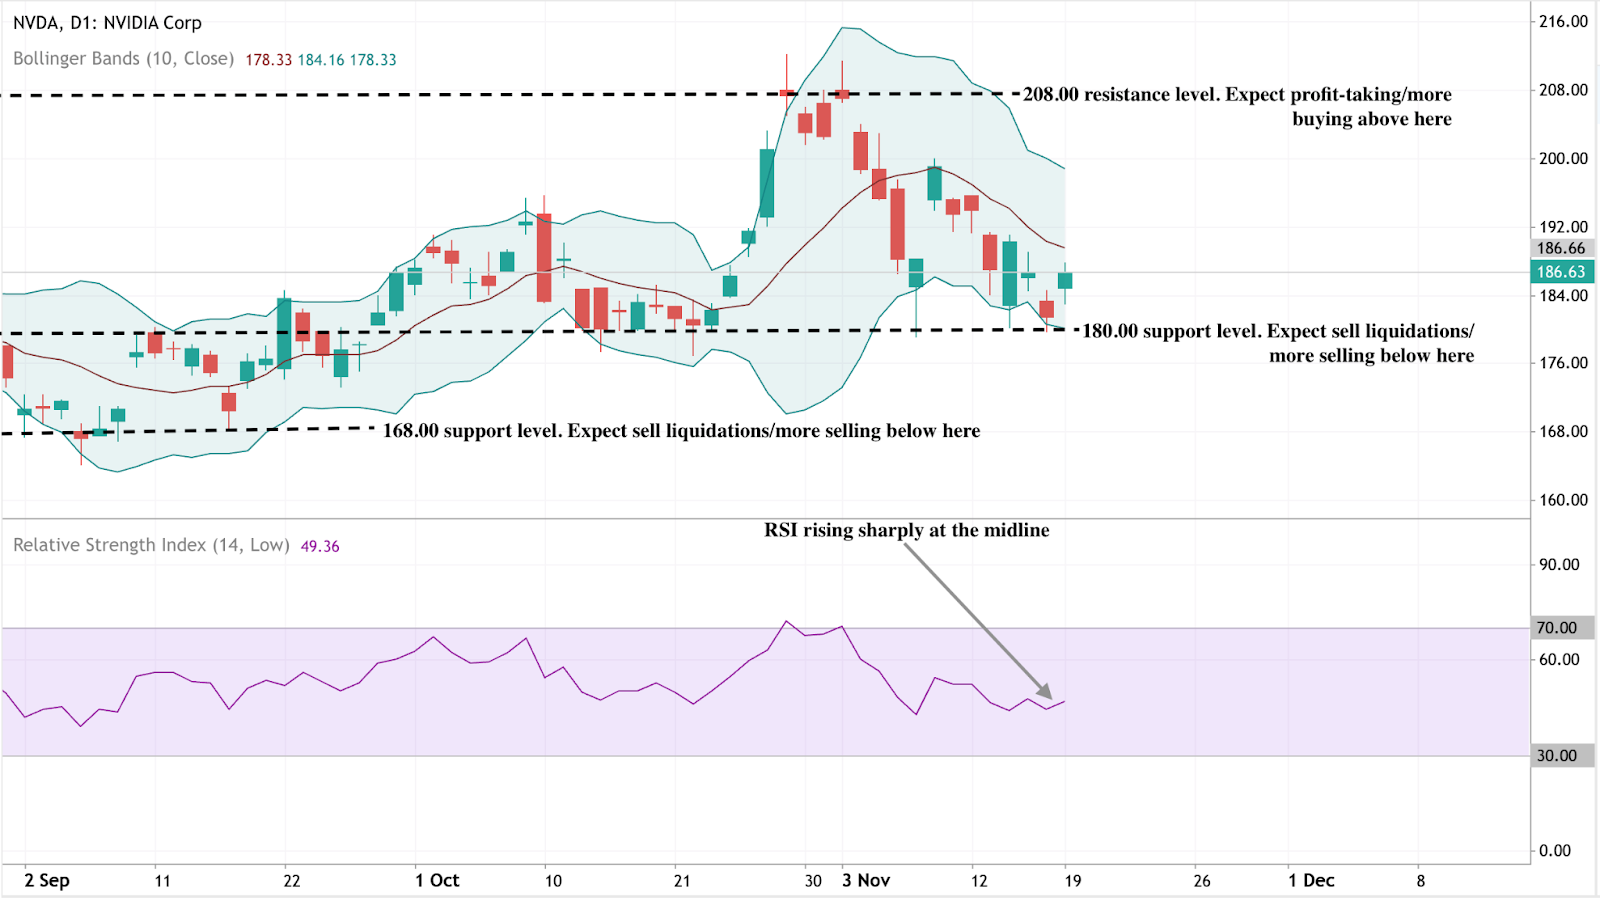
At the time of writing, Nvidia’s stock (NVDA) is hovering around $186, showing early signs of recovery after a short-term pullback. The RSI is rising sharply from the midline near 50, indicating that bullish momentum may be building as buying pressure intensifies.
Meanwhile, the Bollinger Bands are starting to narrow slightly, signalling a potential volatility squeeze that could precede a directional breakout. The price is currently positioned around the middle band, indicating a balance between buying and selling forces.
On the downside, support levels lie at $180 and $168. A drop below $180 may trigger further selling or stop-loss liquidations, while a break under $168 could confirm a deeper correction. On the upside, the key resistance sits at $208, where profit-taking and fresh buying activity are likely to intensify if the price breaks above it.
Key takeaway
Nvidia’s potential $300bn surge isn’t a sign of euphoria - it’s a reality check for those betting on an AI crash. The company’s results confirm that artificial intelligence has moved beyond the phase of promise into proof. As capital shifts from prototypes to platforms, the question isn’t whether AI will endure - it’s how fast it will reshape every market it touches. For now, Nvidia remains the pulse of that transformation.
For traders navigating that transformation, platforms like Deriv MT5 offer exposure to the tech rally’s next phase - while tools such as the Deriv trading calculator provide the precision to manage risk as the AI-driven market matures.

Sanctions vs supply glut: The battle defining Oil prices
Oil prices are caught in a tug-of-war that defines the entire energy narrative right now - sanctions versus surplus.
Oil prices are caught in a tug-of-war that defines the entire energy narrative right now - sanctions versus surplus. As Washington’s latest restrictions on Russian oil giants, such as Rosneft and Lukoil, take effect, traders are wondering whether this will finally squeeze supply enough to lift prices or if swelling inventories and record U.S. output will keep them grounded.
WTI crude has hovered near $60 in recent sessions, reflecting that same indecision. Every headline about sanctions sparks a flicker of optimism; every inventory report snuffs it out. The outcome of this standoff - between geopolitics and fundamentals - will decide whether oil’s next move is a breakout or another false dawn.
What’s driving the rebound
According to analysts, the recent oil bounce is largely fuelled by heightened concern over Russia’s export flows. In a press release issued by the U.S. Department of the Treasury, the United States and allied countries have imposed sweeping sanctions targeting major Russian oil producers, including Rosneft and Lukoil, along with hundreds of vessels from the “shadow fleet”.
These measures are designed to choke off Russia’s oil revenues and, by extension, reduce its export volumes. The logic is simple: fewer barrels from Russia = tighter global supply = higher prices. But the counter-force is significant: global supply remains robust, and demand isn’t bouncing back as expected.
According to the International Energy Agency (IEA), non-OPEC+ production is forecast to grow by 1.7 million barrels per day (bpd) in 2025, while demand growth is projected at just 0.79 million bpd, signalling a structural surplus unless changes occur.
Meanwhile, data show that Russia’s output and export adapt-workarounds remain effective so far - Russian production rose by about 100,000 bpd even after sanctions. Thus, the rebound is caught between a genuine supply shock narrative and a stubborn demand/stock overhang, and whether prices break out depends on which side prevails.
Why it matters
For traders, producers and consumers, this dynamic is far from academic. A sustained rally driven by supply constraints would favour oil-heavy portfolios, refining margins, and exporting nations. Conversely, if oversupply persists and demand disappoints, even the sanction narrative won’t save prices. As one senior energy analyst noted: “The market doesn’t expect much lost supply until enforcement becomes indisputable.”
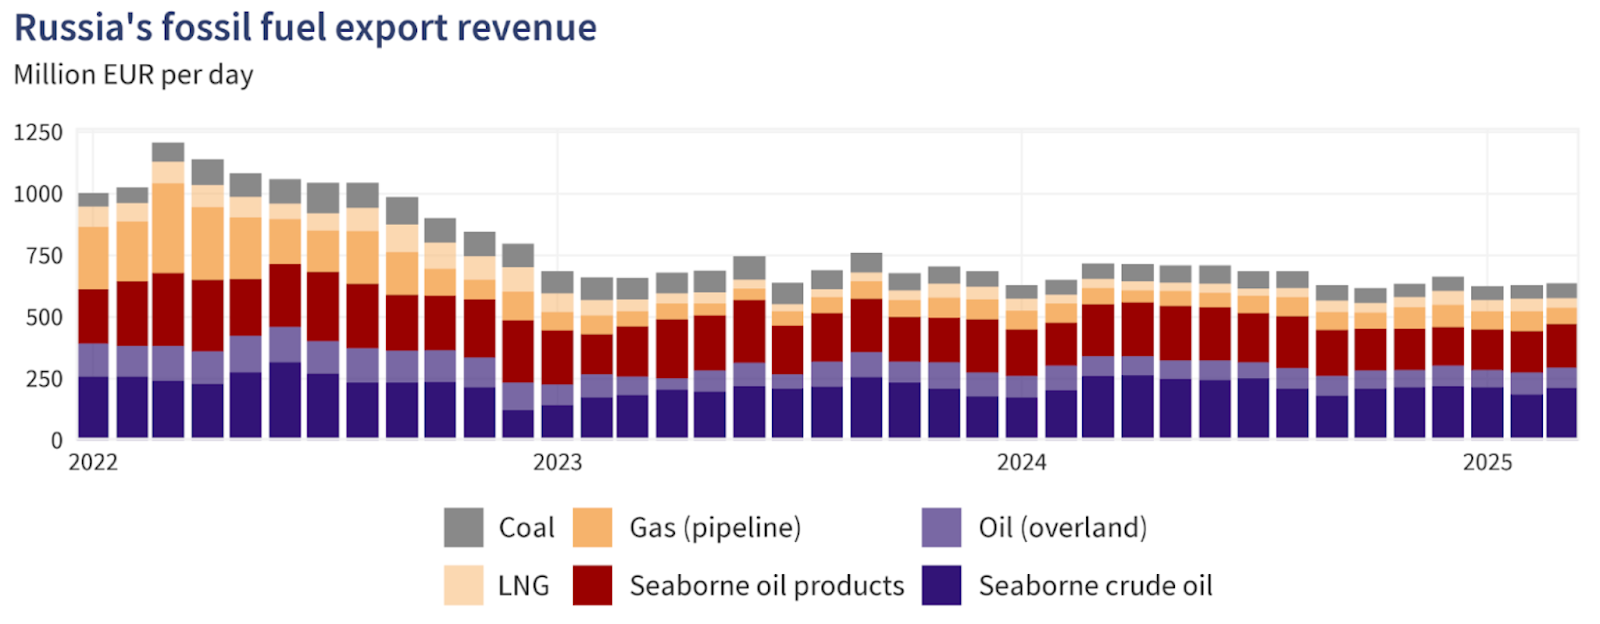
For Russia and its global buyers, the stakes are high. Russia’s oil and gas revenues plunged by 27% in October 2025 compared to the same month a year earlier, reflecting the pressure of sanctions even as volumes held up through workarounds.
At the same time, major oil importers such as India and China have been increasing their Russian cargoes in recent months before the November plunge, which has cast doubts about continued oil flows to those countries.
So, if importers continue to absorb discounted Russian barrels, global supply may remain ample even though the narrative suggests otherwise. On the consumer end, if oil prices are kept low due to oversupply, fuel costs remain manageable. If supply loss dominates, refined-product prices (diesel, gasoline) could rise, feeding inflation and impacting economic growth - a risk to be watched for in both developed and emerging markets.
Impact on the market
In practical terms, the battle lines are drawn according to analysts. On the supply-risk side, if sanctions bite and Russian exports drop materially, markets may tighten quickly, and oil prices could rally.
The risk premium is already reflected in crude spreads: the discount for Russian Urals crude versus global benchmarks jumped to around US$19 per barrel by early November, as buyers shunned Russian cargoes, according to a report by Meduza. That suggests the sanction effect may be starting to crack.
But on the flip side, tracking data suggest that Russian flows are still being rerouted, and global producers (especially shale, Brazil and the U.S.) are responding. With U.S. production at record levels and inventories increasing, the oversupply story remains viable, according to industry commentators. If demand remains weak - for instance, from China or the global industry - then any supply-shock rally may be short-lived, and prices could retreat.
Refining and trade flows are also adjusting. Dealers and refiners are now considering discounted Russian crude, longer shipping routes, and higher freight and insurance costs - all of which increase complexity but don’t necessarily immediately reduce volumes. Until actual barrel losses show up in export data, the market may remain in limbo, reluctant to commit to strong upward momentum.
Expert outlook
According to analysts, the most probable scenario is a market stuck in a range-bound trading pattern, punctuated by bursts of volatility. That is, oil may temporarily rally on rumours of sanctions or supply disruptions, but unless demand proves stronger and supply genuinely tightens, the move may lack legs. Reuters reported that the IEA continues to expect supply growth outpacing demand this year.
If enforcement of sanctions tightens - for example, if shadow-fleet tankers are blocked, insurance costs spike or major importers pull back from Russian oil - then we could see a meaningful rally.
On the demand front, counter-signals to watch include refining run-rates (which remain under pressure), travel and mobility trends, and China’s petro-chemical demand. Until one of these breaks clearly favourably, the oversupply story will likely keep a lid on prices.
In short, the supply risk is real, but it hasn’t yet overridden the oversupply/weak-demand backdrop. Until that happens, the rally remains tentative.
Oil technical insights
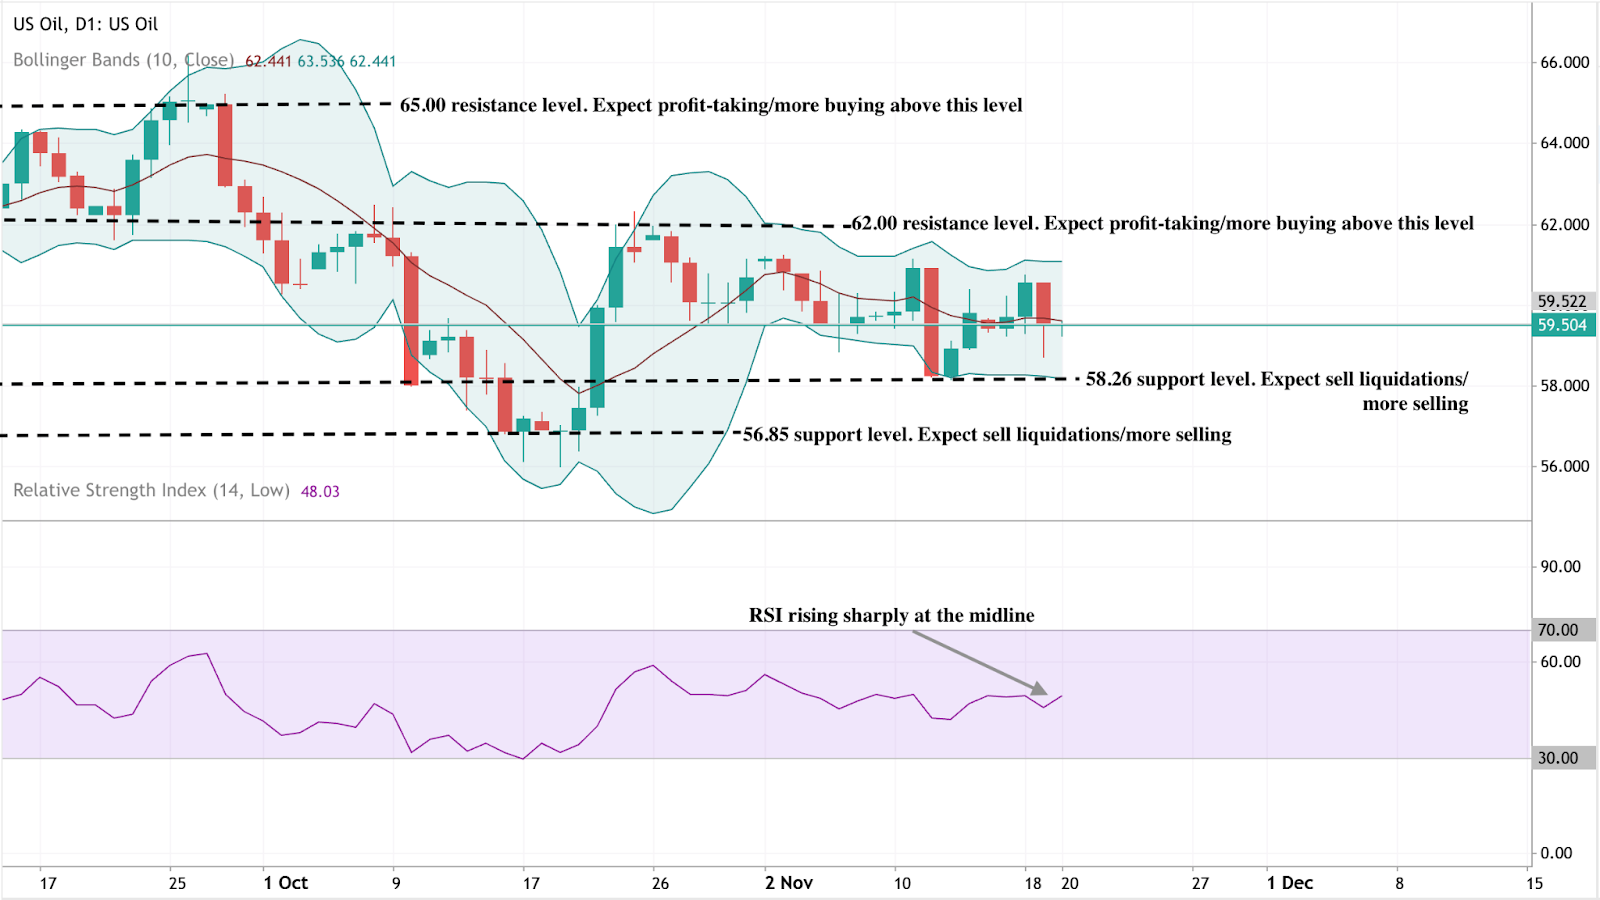
At the time of writing, US Oil is trading around $59.50, consolidating within a narrow range as momentum starts to stabilise. The RSI is climbing sharply from the midline near 50, hinting at strengthening bullish momentum and suggesting that buyers may be regaining short-term control.
The Bollinger Bands (10, close) are relatively tight, signalling reduced volatility and the potential for a breakout. Price action remains centred around the middle band, showing indecision but with a slight upward bias as buyers attempt to push above the mid-range.
Key support levels are found at $58.26 and $56.85, where a break lower could trigger further selling pressure or stop-loss liquidations. On the upside, resistance sits at $62.00 and $65.00 - levels where profit-taking and stronger buying activity could emerge if the market breaks higher.
Key takeaway
The oil market is at a crossroads where the sanction-driven supply-risk narrative clashes with the solid structural reality of oversupply and weak demand. While the latest Russian sanctions have sharpened the risk premium, global production and inventories remain elevated and demand remains fragile.
Unless export losses are real and demand picks up, the oversupply story will likely keep oil prices pinned. The next key signals to monitor: export data from Russia, inventory changes globally and demand indicators from Asia and the U.S. Stay alert - this is a high-stakes battle that could tip either way.
For traders navigating the oil market, Deriv MT5 offers exposure to both WTI and Brent. Meanwhile, tools such as the Deriv trading calculator provide the precision needed to manage risk as the AI-driven market matures.

USD/JPY outlook: Can the Yen hold its ground amid Japan’s policy tug-of-war?
Reports indicate that the Japanese yen is struggling to maintain its stability as Japan’s fiscal and monetary priorities diverge in opposite directions.
Reports indicate that the Japanese yen is struggling to maintain its stability as Japan’s fiscal and monetary priorities diverge in opposite directions. A massive ¥25 trillion stimulus plan from Prime Minister Sanae Takaichi has reignited concerns about inflation and weighed on the currency, while the Bank of Japan’s cautious stance on rate hikes offers little support. The result is a yen pinned near a nine-month low, with the USD/JPY pair hovering around ¥155.
Many say Japan’s policy tug-of-war is tilting decisively against the yen. Unless the government and central bank find common ground, traders may see further weakness - especially if the dollar remains buoyed by a patient but firm Federal Reserve.
What’s driving USD/JPY
The yen’s weakness stems from a widening policy divide inside Japan’s leadership. Prime Minister Takaichi’s administration has revived Abenomics-style stimulus, prioritising fiscal expansion to boost wages and consumer demand.
Lawmakers have proposed a supplementary budget exceeding ¥25 trillion, stoking concerns over rising debt issuance and sending 40-year Japanese government bond yields to record highs.
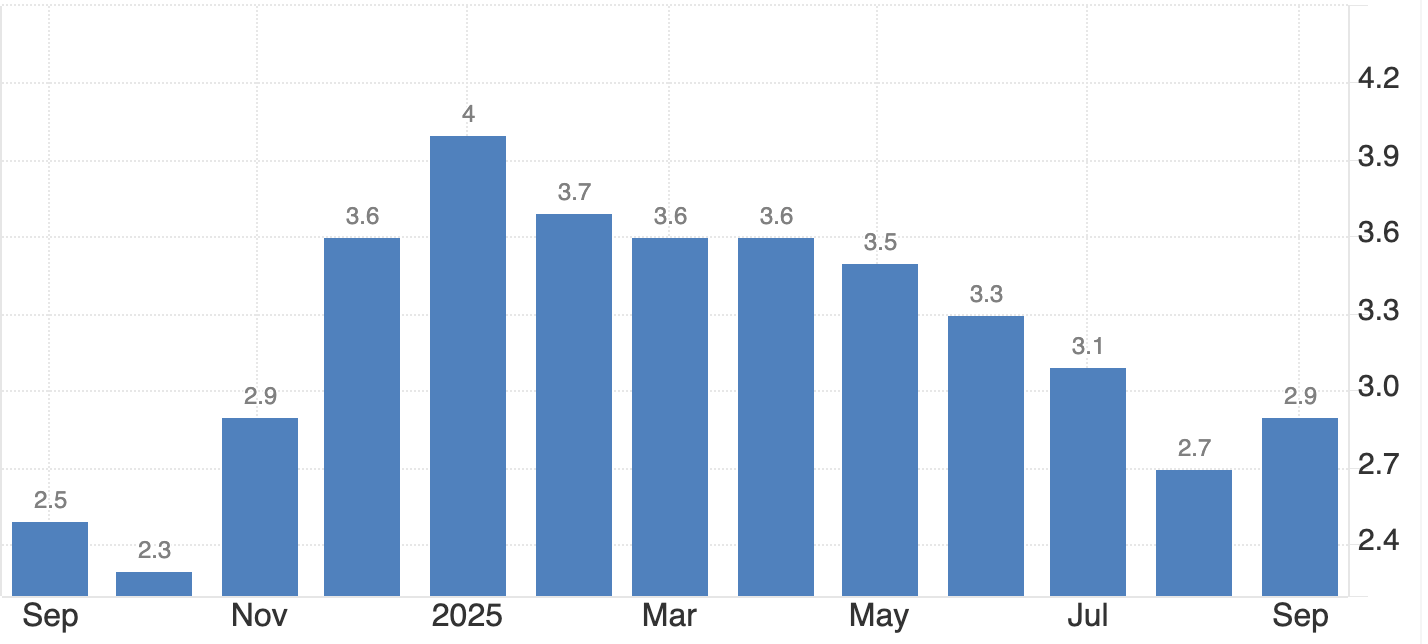
Meanwhile, the Bank of Japan (BoJ) is caught between political pressure and macroeconomic caution. Inflation, currently around 2.9%, remains above target, yet the prime minister insists on keeping rates low until wage growth - not food or energy costs - drives price stability.
Governor Kazuo Ueda has hinted at tightening if inflation persists, but uneven growth complicates matters: GDP grew 1.1% year-on-year, yet contracted 0.4% quarter-on-quarter. This tug-of-war has left investors unsure whether Japan’s policies are reflating the economy or eroding its currency.
Why it matters
This internal conflict is redefining how global markets view the yen. Once seen as a safe-haven anchor, it’s now behaving more like a risk currency, moving with rather than against global sentiment. “Japan has added a tumultuous element - they’re a little more wild, a little more volatile,” said Juan Perez of Monex USA. That volatility reflects a new reality: fiscal expansion is now Japan’s dominant narrative, while monetary prudence takes a back seat.
For traders, the risk is that verbal intervention replaces actual action. Finance Minister Satsuki Katayama has expressed concern over the yen’s sharp depreciation, but Tokyo has so far refrained from stepping into the market. Intervention is likely only if USD/JPY breaches ¥156 decisively - a level seen as politically sensitive rather than economically critical by analysts.
Impact across markets
According to reports, the consequences of Japan’s fiscal-monetary split are evident across its bond and currency markets. The yield curve has steepened sharply as investors price in heavier debt issuance, while near-zero short-term rates keep domestic liquidity abundant. This imbalance encourages capital outflows, as investors seek higher yields abroad, further putting downward pressure on the yen.
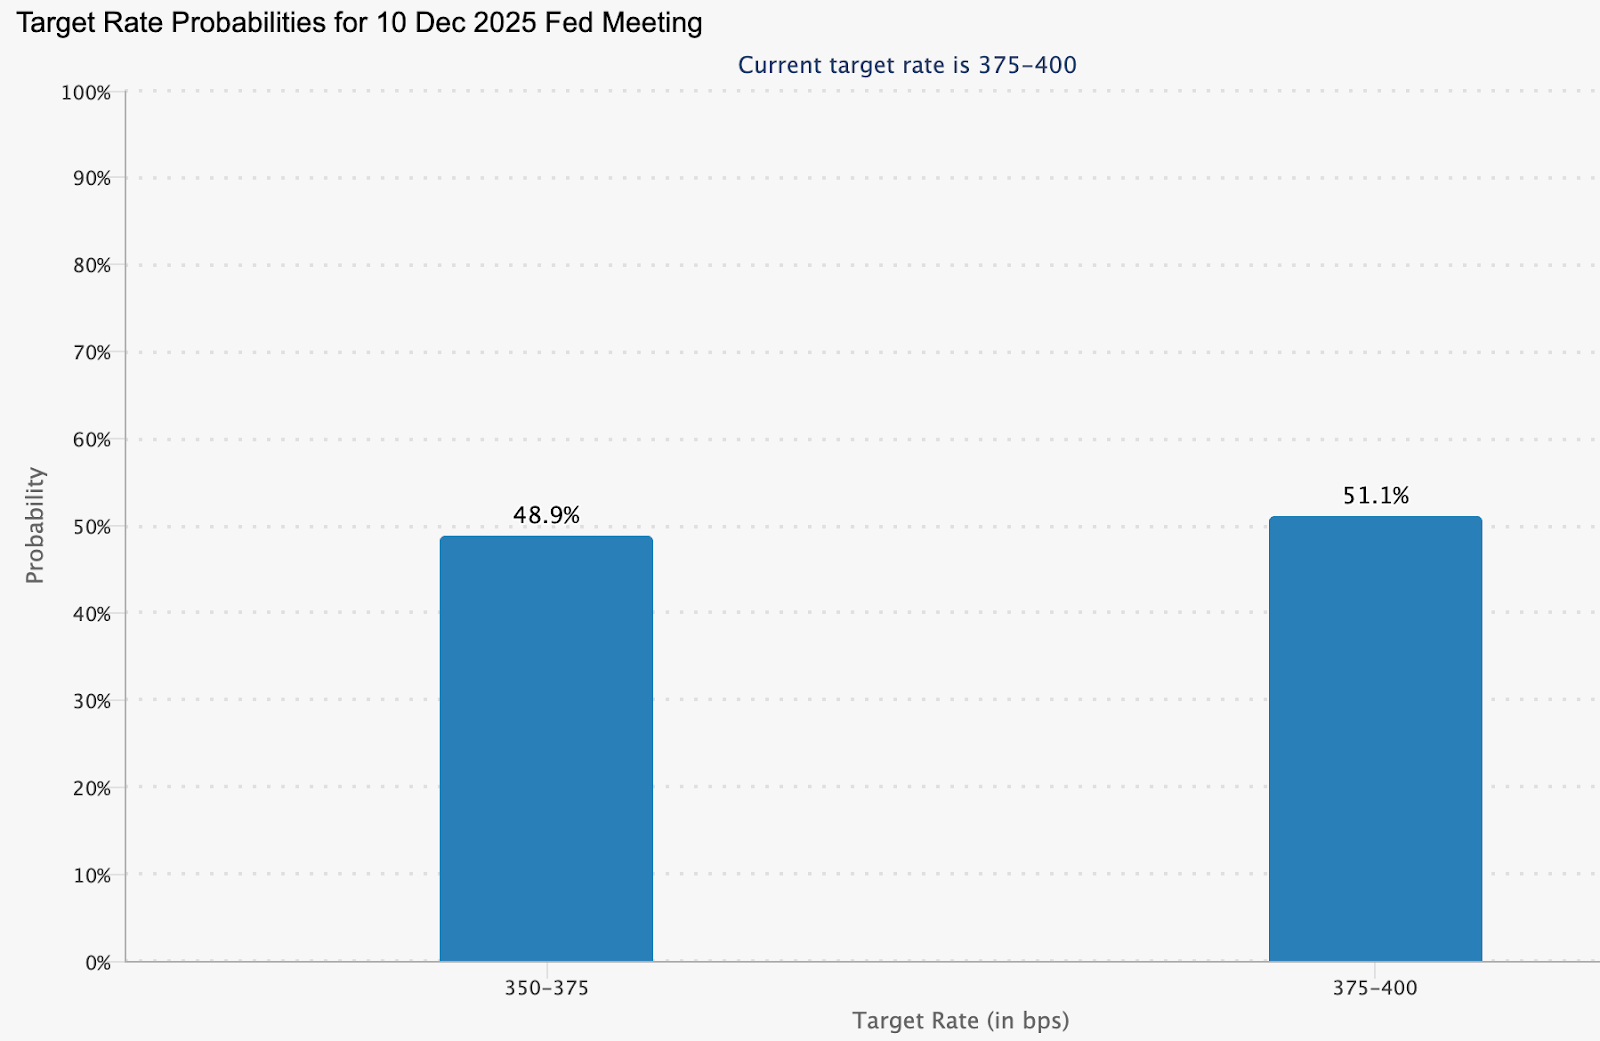
Across the Pacific, the Federal Reserve’s steadiness has reinforced dollar strength. Officials such as Philip Jefferson and Christopher Waller continue to advocate patience on rate cuts, trimming the probability of a December reduction to around 48%, down from 60% last week (CME FedWatch).
According to analysts, as long as this interest-rate gap persists, the dollar will remain structurally favoured against the yen, - and any yen rallies will likely prove temporary.
Expert outlook
Analysts see little relief for the yen in the near term. Barclays recommends holding a long position on the dollar against the yen, arguing that Takaichi’s expansionary agenda will suppress domestic yields and maintain downward pressure on the currency. Still, a sustained climb beyond ¥156 could test Tokyo’s resolve and force coordinated intervention.
The next key event is the delayed US Non-Farm Payrolls report, expected to provide fresh insight into labour market conditions. A weaker reading could trigger short-term dollar selling, allowing the yen to recover briefly. Yet without a policy shift in Japan, that reprieve may be short-lived. For now, the yen’s trajectory is dictated less by data and more by the dissonance between fiscal ambition and monetary caution.
USD/JPY technical insight
At the time of writing, USD/JPY is trading around 155.45, extending gains within a price discovery zone as bullish momentum persists. The pair is hugging the upper Bollinger Band, signalling strong buying pressure but also hinting at a possible overextension.
The RSI is climbing toward the overbought region, reinforcing the risk of a short-term pullback or profit-taking. Immediate support lies at 152.96, followed by 146.45, where a breakdown could trigger sell liquidations and accelerate downside movement.
However, as long as prices hold above the middle Bollinger Band and 153.00, the broader uptrend could remain intact, supported by policy divergence between the Federal Reserve and the Bank of Japan.

Key takeaway
Japan’s yen problem isn’t just about markets - it’s about messaging. Expansionary fiscal policy collides with a hesitant central bank, leaving investors unsure which signal to follow. The result is a currency under sustained strain, with verbal intervention doing little to stop the slide. Unless Tokyo finds alignment between stimulus and stability, the yen’s effort to hold its ground may remain more symbolic than successful.

Gold’s reversion to the mean: A pause before the next rally?
Gold has climbed back above $4,050 per ounce, stabilising after a sharp two-week selloff that pulled the metal down from record highs.
Gold has climbed back above $4,050 per ounce, stabilising after a sharp two-week selloff that pulled the metal down from record highs. The move reflects what analysts increasingly describe as a reversion to the mean - a natural correction following a steep run from $3,450 to $4,380 earlier in the quarter.
With the long-delayed US Non-Farm Payrolls (NFP) report now in focus, traders are watching whether this consolidation is a breather before the next leg up. The broader backdrop remains tense. Hawkish Federal Reserve remarks, delayed data from the US government shutdown, and continued geopolitical stress are all reshaping sentiment. Yet, behind the noise, gold’s pullback looks less like weakness - and more like equilibrium returning.
What’s driving gold’s mean reversion
The latest correction follows months of relentless buying, fuelled by soft US data, de-dollarisation flows, and record central-bank accumulation. Gold’s sprint from $3,450 to $4,380 outpaced fundamentals, leaving technical indicators stretched and sentiment euphoric.
Now, as traders recalibrate expectations for a December rate cut - pricing in a 48.9% chance according to CME FedWatch - the metal has slipped back toward its midrange, around $4,050–$4,100, where short-term and long-term averages converge.
This retreat also mirrors a psychological reset. Markets are digesting the Fed’s cautious tone, with Vice Chair Philip Jefferson urging a “slow approach” to policy changes and regional presidents Bostic and Schmid signalling preference for steady rates. Those comments, paired with delayed macro data, have thinned speculative positions and allowed gold to breathe. In effect, the market is rediscovering balance - a hallmark of mean reversion after an overextended move.
Why it matters
Gold’s mean reversion tells a deeper story about trust and monetary fatigue. As Citadel’s Ken Griffin noted, the rising price of gold reflects “a loss of trust first in US Treasuries, then in G7 bond markets.” Investors are responding not to short-term volatility, but to structural concerns about government debt and the stability of fiat currency.
Analysts at Deutsche Bank maintain that the medium-term trend remains intact, projecting an average gold price of $4,000 per ounce next year. They highlight “elevated official demand” - a reference to sustained central-bank buying.
In October, China’s central bank added 0.9 tonnes to its reserves, marking its 12th straight month of accumulation. Ongoing purchases throughout 2025 have lifted China’s official gold reserves to 2,304.5 tonnes.
This underlines that while traders may be reverting to the mean, nations are not - they’re steadily diversifying away from the dollar.
Impact across markets
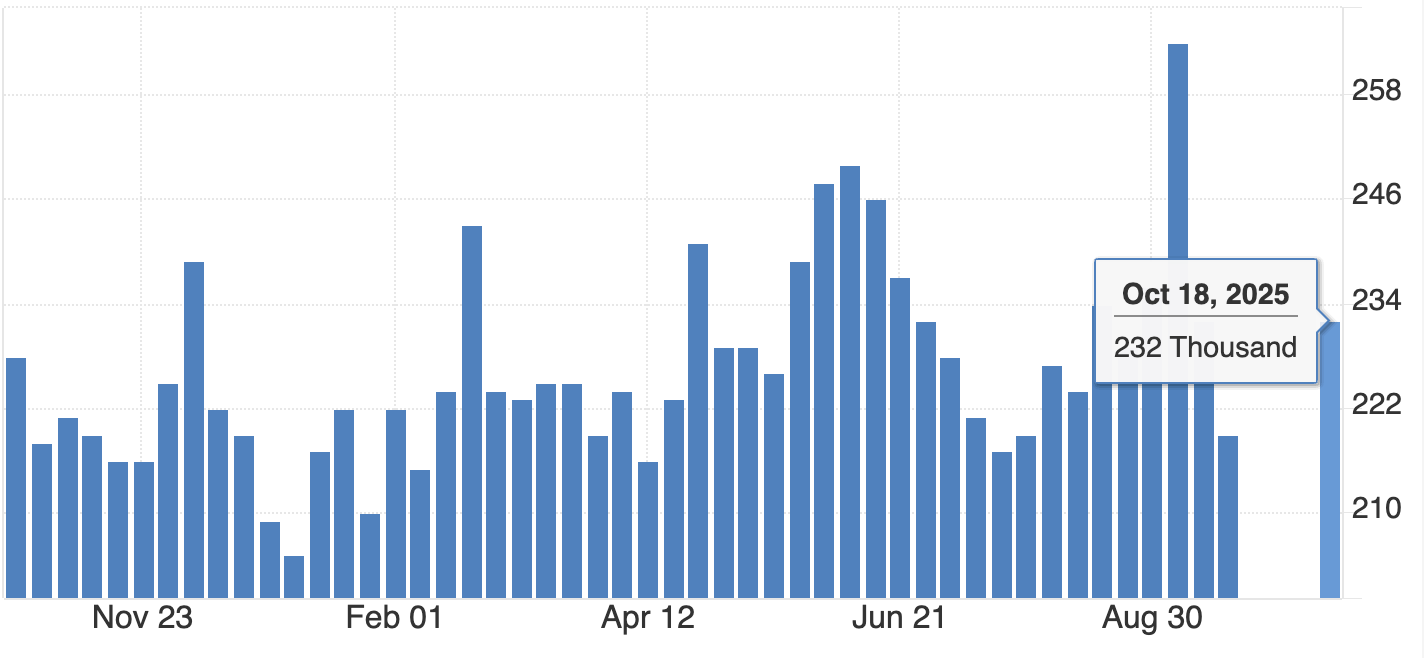
In China, investor appetite for gold remains vigorous even during the correction. ETF inflows jumped RMB 32 billion (US$4.5 billion) in October, pushing total holdings to a record 227 tonnes.
Physical demand, measured by withdrawals from the Shanghai Gold Exchange, rose 17 tonnes year-on-year to 124 tonnes, defying seasonal softness. The data suggests that investors see dips as opportunities, not red flags.
Globally, the story is similar. Soft US employment data and climbing jobless claims have tempered the dollar’s strength, nudging investors back into gold and silver.
Still, there’s awareness that a stronger NFP print or easing geopolitical risk could stall momentum. Even so, mean reversion isn’t a bearish event - it’s the market’s way of restoring order after a speculative sprint. And order, in uncertain times, is the most bullish foundation of all.
Expert outlook
Most analysts agree that gold’s medium-term trajectory remains higher, although near-term volatility will hinge on the US jobs data and the Fed’s stance in December. Independent trader Tai Wong says, “soft data is slightly boosting hopes for a December cut - helping gold and silver, which are trying to break a three-day losing streak.” That sentiment captures the current equilibrium: cautious optimism tempered by macro prudence.
If the NFP report underperforms, gold could swiftly retest $4,200, according to analysts. If it surprises to the upside, a dip toward $3,950 would complete a textbook mean reversion cycle before stabilising. Either way, the long-term bull case - driven by de-dollarisation, AI-driven labour disruption, and inflation inertia - remains intact. The question isn’t whether gold rises again, but when.
Gold technical analysis
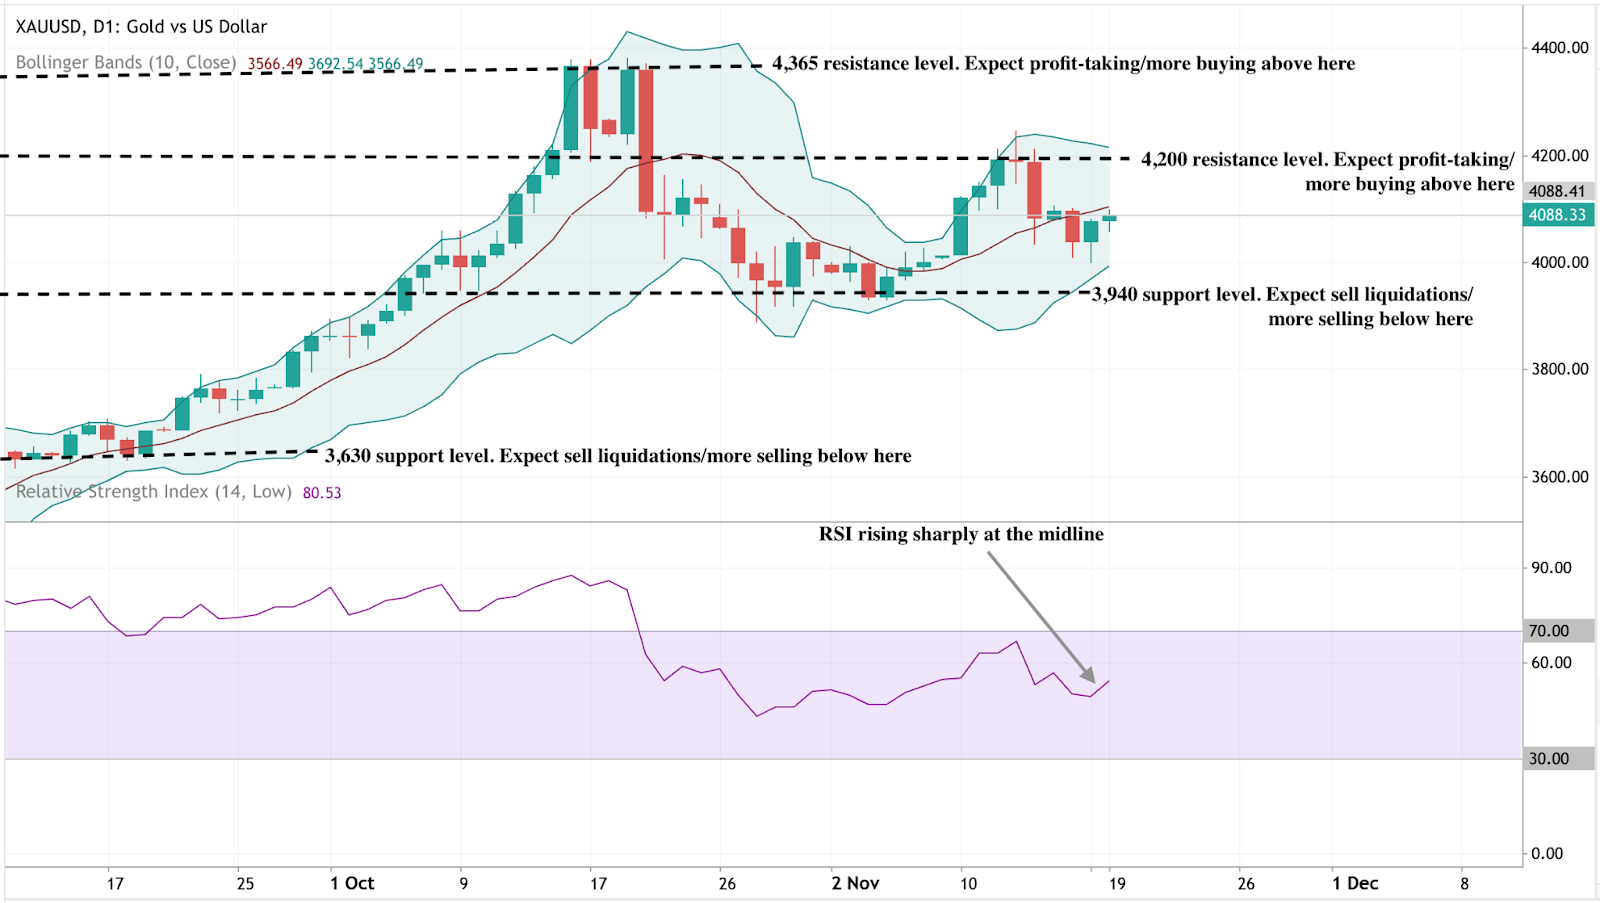
At the time of writing, XAU/USD is trading near $4,088, rebounding from the lower Bollinger Band as buyers re-enter the market. The Bollinger Bands are beginning to widen after a period of contraction, suggesting that volatility may be returning.
The RSI is rising sharply from the midline, signalling improving bullish momentum. Key resistance levels are seen at $4,200 and $4,365, where profit-taking or further buying could occur if gold breaks higher. On the downside, a fall below $3,940 would likely trigger sell liquidations, exposing deeper support at $3,630.
Overall, gold appears to be in the early stages of a potential bullish continuation, with the technical setup hinting at renewed upside pressure if momentum sustains above the mid-Bollinger Band.
Key takeaway
Gold’s pullback to the $4,000 zone isn’t weakness - it’s rhythm. A reversion to the mean after a parabolic rise is how sustainable trends reset. Beneath short-term volatility, the drivers of this bull phase - de-dollarisation, central-bank accumulation, and macro distrust - remain fully in play. As the US jobs data and Fed decisions unfold, this pause could mark the quiet before gold’s next major rally.

The $300 billion tech selloff: Is an AI bubble looming?
Nvidia, the centrepiece of the current AI boom, is at the heart of this market drama, with investors now bracing for what could be a pivotal earnings announcement.
The tech sector just witnessed a staggering $300 billion erased in a single trading session—raising urgent questions about whether Wall Street’s AI enthusiasm is transforming into a cautionary tale for investors. Nvidia, the centrepiece of the current AI boom, is at the heart of this market drama, with investors now bracing for what could be a pivotal earnings announcement.
What caused $300 billion to vanish overnight?
Recent trading saw major technology and AI-related stocks plummet, wiping nearly $300 billion from market valuations. The rout was triggered by growing fears that the relentless surge in AI investment, particularly in companies like Nvidia, may have outpaced realistic near-term profits and fundamentals.
- High-profile hedge funds and investors are shorting AI stocks, questioning whether current prices reflect sustainable growth or speculative hype.
- SoftBank and other major players have reportedly pared their Nvidia holdings, compounding the sense of caution in the sector.
Why Nvidia’s earnings matter for the AI boom
Nvidia’s upcoming Q3 2025 earnings announcement is being closely watched as the definitive test of AI sector optimism. Analysts estimate over $54 billion in revenue this quarter, but the real spotlight will be on guidance: can the company sustain the pace that investors now demand?
- Failure to deliver stronger forward guidance could push the “AI bubble” narrative into the spotlight and trigger further market turbulence.
Is there really an AI bubble? Expert views
Financial commentators and social media influencers warn that tech’s infatuation with AI is showing signs reminiscent of the dot-com boom and bust. Michael Burry and Peter Thiel have bet against top AI players, signaling growing skepticism.
- Major market swings are being interpreted as “warning signs” about unsustainable valuations.
- Despite impressive R&D and sector growth, investors are demanding proof that the AI spend will translate to lasting returns.
Market sentiment: The role of social media
- X (formerly Twitter) is buzzing with posts spotlighting Nvidia's $230–$300 billion market cap wipeout, often framing upcoming earnings as a “make or break” moment for the AI movement.
- Viral finance tweets warn that the situation could trigger a chain reaction across broader tech indices.
What happens next?
This week’s events highlight a turning point for the technology sector, with Nvidia’s earnings report set to either restore confidence in AI’s financial promise or deepen concerns about unsustainable hype. Investor attention is now laser-focused on hard financial data and signals from market leaders.
Monitor Nvidia’s performance with a Deriv MT5 account today.
Sorry, we couldn’t find any results matching .
Search tips:
- Check your spelling and try again
- Try another keyword