Results for

Bitcoin crashes under $90K as ‘death cross’ bites
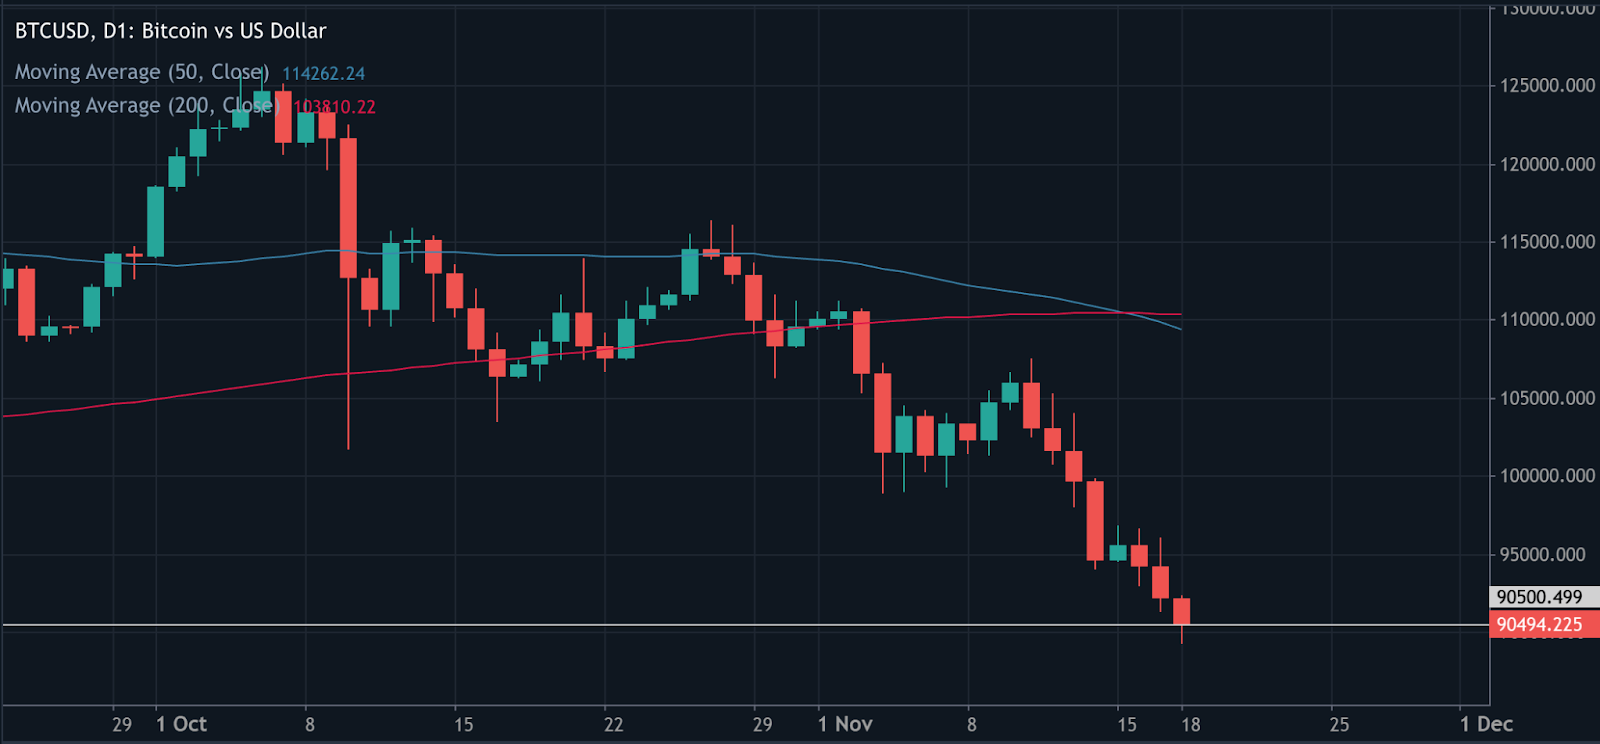
Spot prices printed as low as 89,420 dollars, the weakest level since February, only six weeks after setting a record near 126,250 dollars.
Bitcoin slipped below 90,000 dollars on Tuesday, extending a selloff that has erased its 2025 gains and pushed sentiment toward the bleak end of the spectrum. Spot prices printed as low as 89,420 dollars, the weakest level since February, only six weeks after setting a record near 126,250 dollars.
The breakdown coincided with a bearish technical crossover known as a death cross and increasingly hesitant fund flows into U.S. spot ETFs.
Together with macro anxiety around the rate path, these factors have tightened liquidity and amplified swings across majors. The next phase hinges on whether price can quickly reclaim lost support and whether ETF prints stabilise from recent choppiness.
What’s driving the slide
The proximate trigger is technical: Bitcoin fell back through reclaimed support near 93,700 dollars, lost its 200-day moving average, and then registered a death cross as the 50-day slipped beneath the 200-day.
On its own the signal is imperfect, but in weak liquidity regimes it often coincides with multi-week drawdowns as momentum traders de-risk.
Flows add fuel. U.S. spot ETF activity has turned choppy after heavy intake earlier in the year, with trackers showing sequences of outflows or flat prints that blunt marginal demand. When the incremental demand fades, price tends to chase lower liquidity pockets until new buyers emerge. Recent dashboards corroborate the stop-start nature of ETF demand. CoinDesk+1.
The Mt. Gox repayments - a trigger, not the cause
Adding fuel to the fire, over 10,600 BTC (worth roughly $953 million) were transferred from Mt. Gox wallets on 18 November 2025, marking the first such movement in eight months.

The long-running repayment saga, stemming from the 2014 collapse of the world’s then-largest exchange, has left creditors waiting over a decade for compensation.
While some feared that repayments could unleash fresh supply, blockchain data shows these movements were administrative, not market sales. Still, perception alone was enough to unsettle sentiment, sparking liquidations and feeding the broader risk-off tone. Analysts now estimate over 230,000 trading accounts were liquidated within 24 hours, totalling more than $1 billion in forced sell orders.
Why this matters
Sentiment has swung hard into fear. CoinDesk flagged “extreme fear” conditions into the weekend and early week, aligning with widely followed gauges that punish downside volatility and negative breadth. In past cycles, similar extremes have marked acceleration phases within larger drawdowns or short-lived exhaustion points.
The macro overlay is not helping. Traders are parsing shifting expectations for U.S. rate cuts and inflation risks tied to policy developments, a mix that reduces risk appetite and tightens crypto liquidity. Reuters’ read-across captures the mood: a near 30 percent retreat from the October peak and growing caution among institutions.
Impact on markets and participants
Price leadership rotated back to bitcoin as traders sold altcoins to manage risk, a pattern visible when social attention and volumes consolidate in the benchmark asset during stress. Ether and other large caps have tracked lower alongside, while crypto-linked equities have generally underperformed on drawdown days, transmitting crypto volatility into listed proxies.
For allocators, ETF prints serve as the cleanest real-time barometer of spot demand. Multi-day flat or negative flows often coincide with fragility in order books and heavier slippage, which is why desks are laser-focused on whether the next sequence turns positive again. If it doesn’t, the unfilled liquidity pocket toward 86,000–88,000 dollars cited by traders continues to be a live risk.
Expert outlook
CoinDesk’s market desk notes that fear spikes of this magnitude have sometimes preceded relief rallies, particularly when realised-loss pressure begins to stabilise and ETF outflows slow. That requires confirmation: a swift reclaim of broken support and evidence of renewed net inflows. Until then, technicals and positioning argue for elevated two-way volatility.
Long-horizon investors continue to point at structural adoption and institutional participation as reasons to stay constructive on multi-year horizons. Dan Tapiero, whose 50T platform backs later-stage crypto companies, frames short-term turbulence as noise against a secular build-out, a view he has reiterated while forecasting a much larger digital-asset economy over the next decade.
Bitcoin price technical insight
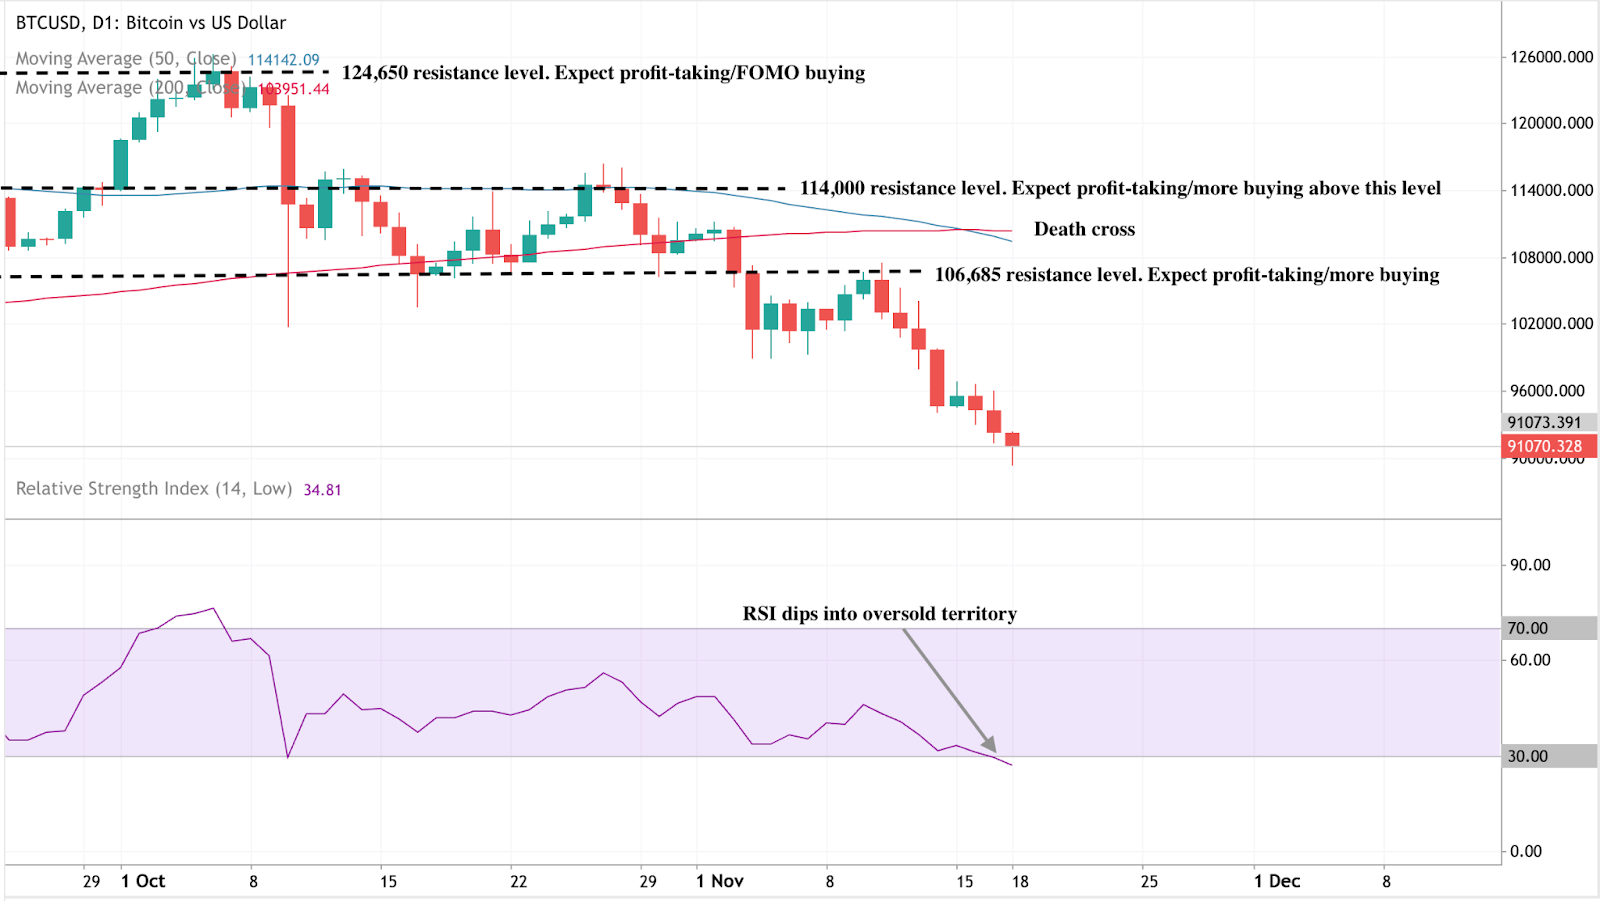
Bitcoin (BTC/USD) continues its downward trajectory after forming a death cross, with the 50-day moving average (MA) crossing below the 200-day MA - a classic bearish signal suggesting extended downside pressure. The price is currently hovering near $91,000, after repeatedly failing to hold above key resistance levels at $106,685, $114,000, and $124,650, where prior rallies saw heavy profit-taking and FOMO-driven buying.
The Relative Strength Index (RSI) has dipped into oversold territory, indicating that selling momentum may be overextended and a short-term technical rebound could occur. However, as long as BTC remains below the 50-day MA, the broader trend remains bearish, with traders likely to view any bounce as a chance to sell into strength.
Key takeaway
Bitcoin’s slide below $90,000 reflects a convergence of technical breakdown, hesitant ETF demand, and a risk-off macro tone. The resulting fear spike is typical of late-stage selloffs, but it needs flow confirmation before calling a durable low. Watch for a quick reclaim of the $ 90,000 - $93,000 zone and a run of positive ETF prints to validate any rebound attempt. Until then, expect elevated volatility and tighter liquidity conditions.

Yen carry trade in reverse: Japan’s yield shift and its impact on USD/JPY
As domestic yields rise, Japanese investors are increasingly repatriating funds from abroad, strengthening the yen and unsettling one of the world’s longest-standing funding trades.
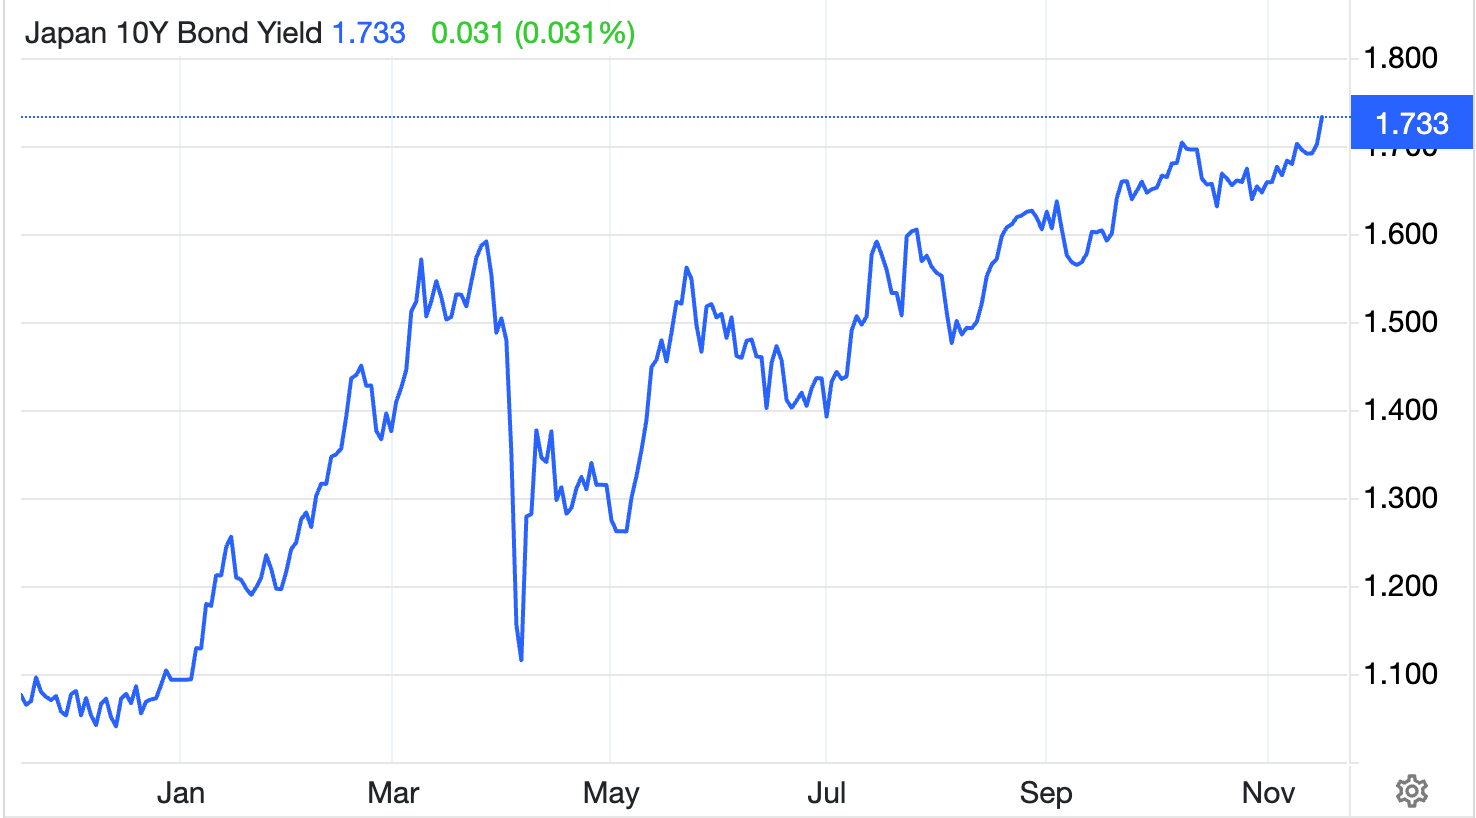
Japan’s bond market is rewriting the rules of the global foreign exchange market. The country’s 10-year government bond (JGB) yield has surged to 1.73% - its highest level since June 2008 - as markets brace for a ¥17 trillion (£88 billion / $110 billion) fiscal stimulus and a further reduction in Bank of Japan (BoJ) bond purchases. The move signals the beginning of a new phase: the yen carry trade in reverse.
As domestic yields rise, Japanese investors are increasingly repatriating funds from abroad, strengthening the yen and unsettling one of the world’s longest-standing funding trades.
The question now dominating markets is clear - will this shift pull USD/JPY back from its multi-decade highs near 156, or force the BoJ and Ministry of Finance (MoF) to intervene once again to stabilise the currency?
Key takeaways
- Japan’s 10-year bond yield has reached 1.73%, the highest since 2008, as markets price in rising inflation, fiscal stimulus, and reduced BoJ support.
- The BoJ’s gradual normalisation - with short-term rates now at 0.5% - is driving a global reassessment of the yen’s funding role.
- A planned ¥17 trillion stimulus aims to offset Japan’s 0.4% GDP contraction in Q3 but risks adding inflationary pressure.
- Rising yields are drawing capital back into Japan, prompting a partial unwinding of the yen carry trade.
- USD/JPY faces key resistance near 155–156, a zone where past interventions have been triggered.
Japan bond yields go up to breach the 1.7 mark
After nearly two decades of near-zero yields, Japan’s bond market is finally moving under its own weight.
The 10-year JGB yield, which stayed below 1% for years due to the BoJ’s Yield Curve Control (YCC), has now broken decisively higher - a sign that investors expect sustained inflation, more fiscal spending, and a lighter BoJ hand in the market.
Several forces have converged:
- The BoJ is tapering bond purchases, reducing artificial demand for JGBs.
- Short-term policy rates have been raised to 0.5%, marking the end of an era of negative rates.
- A massive stimulus plan under Prime Minister Sanae Takaichi is expected to inject over ¥17 trillion into the economy through tax cuts, infrastructure spending, and household support.
Together, these dynamics have pushed bond yields to levels unseen since the global financial crisis, marking what analysts describe as the end of Japan’s “zero-cost money” era.
Higher yields despite Japan’s fragile economy
Despite higher yields, Japan’s economy remains fragile. Data from the Cabinet Office show that GDP contracted by 0.4% in Q3, its first decline in six quarters. Weak residential investment and subdued consumer demand dragged growth lower, even as exports rebounded slightly in September.
BNP Paribas economist Ryutaro Kono noted that while the contraction is not “particularly serious”, it highlights uneven recovery momentum. Still, the forthcoming stimulus package - expected to be approved soon - aims to restore confidence and support households facing rising living costs.
Yet the market reaction suggests scepticism. Investors view fiscal expansion as inflationary and debt-heavy. With Japan’s public debt exceeding 230% of GDP, every new round of spending increases pressure on the bond market - and by extension, the yen.
The mechanics: Why higher yields strengthen the yen
The surge in Japanese yields has immediate foreign exchange implications, particularly for the USD/JPY exchange rate.
1. Repatriation of capital
Japan’s institutional investors - who collectively hold trillions of dollars in foreign bonds - are now finding better returns at home. As domestic yields climb, they begin selling U.S. Treasuries, European debt, and emerging market assets to reinvest in JGBs. This process increases demand for yen, supporting its value against major currencies.
2. Unwinding the carry trade
The yen carry trade - borrowing in low-yielding yen to buy higher-yielding assets abroad - has been a cornerstone of global markets for years. With Japanese rates rising, this trade becomes less profitable. Traders must buy yen to repay loans, triggering powerful short-term rallies.
3. Yield Differentials and Global Comparison
Even with U.S. 10-year yields near 4–5%, Japan’s rapid shift from near-zero to 1.7% is significant. For Japanese investors who once earned nothing on domestic bonds, the new yield environment is competitive enough to slow outflows and boost inflows, tilting currency dynamics in favour of the yen.
Yen policy trade-offs: Growth, debt, and stability
For the BoJ, this shift poses a major challenge. Governor Kazuo Ueda must balance a weak economy, rising inflation, and market volatility. The ¥17 trillion fiscal push could revive domestic demand, but it also risks fueling inflation expectations and adding strain to already high debt levels.
If yields rise too high, the BoJ may need to intervene in bond markets again or issue verbal guidance to temper speculation. Finance Minister Satsuki Katayama has already warned she is “watching FX moves with a sense of urgency”. Historically, such language has preceded yen-supportive interventions, particularly when USD/JPY nears 155–156 - a zone Credit Agricole analysts flag as Tokyo’s soft intervention threshold.
Geopolitics: China tensions and trade headwinds
External risks compound Japan’s policy dilemma. Relations with China have deteriorated following Takaichi’s remarks on Taiwan, prompting mutual travel warnings and raising fears of trade retaliation.
Economists such as Marcel Thieliant at Capital Economics warn that restrictions on rare earth exports or Japanese goods could escalate into a broader trade dispute - one that hurts exporters already under pressure from Chinese electric vehicle competition.
These tensions could trigger safe-haven inflows into the yen, but they also risk weakening Japan’s export engine - another reason why policymakers may resist further currency volatility.
USD/JPY forecast: Scenarios for late 2025
In the near term, a test of 145–148 remains plausible as capital returns home. But if the U.S. Federal Reserve delays rate cuts - keeping U.S. yields high - USD/JPY could stay anchored closer to 150–153.
Either way, the BoJ’s tolerance threshold around 156 is becoming a critical line for traders to watch. Traders can monitor these levels directly on Deriv MT5, which offers live market depth and advanced charting to track yen volatility in real time.
USD/JPY technical analysis

At the time of writing, USD/JPY is trading around 154.72, holding just below a fresh price discovery zone. The RSI sits flat just below the overbought threshold, signalling that bullish momentum remains strong but may be nearing exhaustion if no further upside breakout occurs.
Meanwhile, Bollinger Bands are expanding, indicating an increase in volatility. The price is hugging the upper band, reflecting sustained buying pressure - though such positioning often precedes short-term pullbacks or consolidation phases.
On the downside, immediate support lies at 153.00, with further key levels at 150.00 and 146.45. A break below these levels could trigger sell liquidations or panic selling, especially if sentiment turns against the dollar.
Overall, momentum currently favours the bulls, but with the RSI nearing overbought territory and price extended along the upper Bollinger Band, traders should watch for possible short-term corrections before any continuation higher.
Global ripple effects of yen
Japan’s yield shift is not an isolated story. As the world’s largest creditor nation, any repatriation of Japanese funds can affect global bond markets:
- U.S. Treasuries: Selling pressure from Japanese investors could lift U.S. yields.
- Europe and Australia: Investors may rebalance towards JGBs, driving global yield convergence.
- Emerging markets: Funding costs could rise as yen liquidity tightens.
The implications are profound - the end of Japan’s zero-yield era may gradually unwind two decades of global risk-taking built on cheap yen funding.
Investment and trading implications of yen
For traders, Japan’s bond market is now the most important variable in the yen equation.
- Short-term outlook: Higher JGB yields and repatriation flows could push USD/JPY lower towards 145–148, especially if U.S. yields stabilise.
- Medium-term: Fiscal stimulus and persistent inflation may keep yields elevated but volatile, anchoring USD/JPY near 150–153.
Intervention watch: If the pair nears 156, expect stronger verbal warnings and possible BoJ/MoF coordination.

EUR/USD outlook ahead of U.S. inflation data and labour data
EUR/USD remains range-bound as markets await clarity from delayed U.S. inflation data.
EUR/USD remains range-bound as markets await clarity from delayed U.S. inflation data. The pair has been trading between 1.156 and 1.166, with traders hesitant to commit until the Consumer Price Index (CPI) figures reveal whether the Federal Reserve will maintain its dovish stance or pause further easing.
The absence of data has reduced volatility and left the euro steady against a softening dollar, as markets weigh growth slowdowns, shifting rate expectations, and improving global risk sentiment.
Key takeaways
- EUR/USD holds steady near 1.1642, trading within a narrow 1.156–1.166 band as traders await CPI data.
- U.S. data delays following the government shutdown have frozen market direction and undermined dollar momentum.
- Policy divergence is narrowing, with the Fed edging towards cuts while the ECB holds steady.
- Eurozone stability and improving sentiment contrast with U.S. uncertainty, supporting the euro’s resilience.
- Volatility compression points to a potential breakout once inflation data is released.
Market stall as US inflation and labour data delays persist
The delayed release of U.S. inflation and labour data has left the market directionless. The Bureau of Labor Statistics (BLS) is still addressing disruptions caused by the recent government shutdown, raising the possibility that some October figures may never be released.
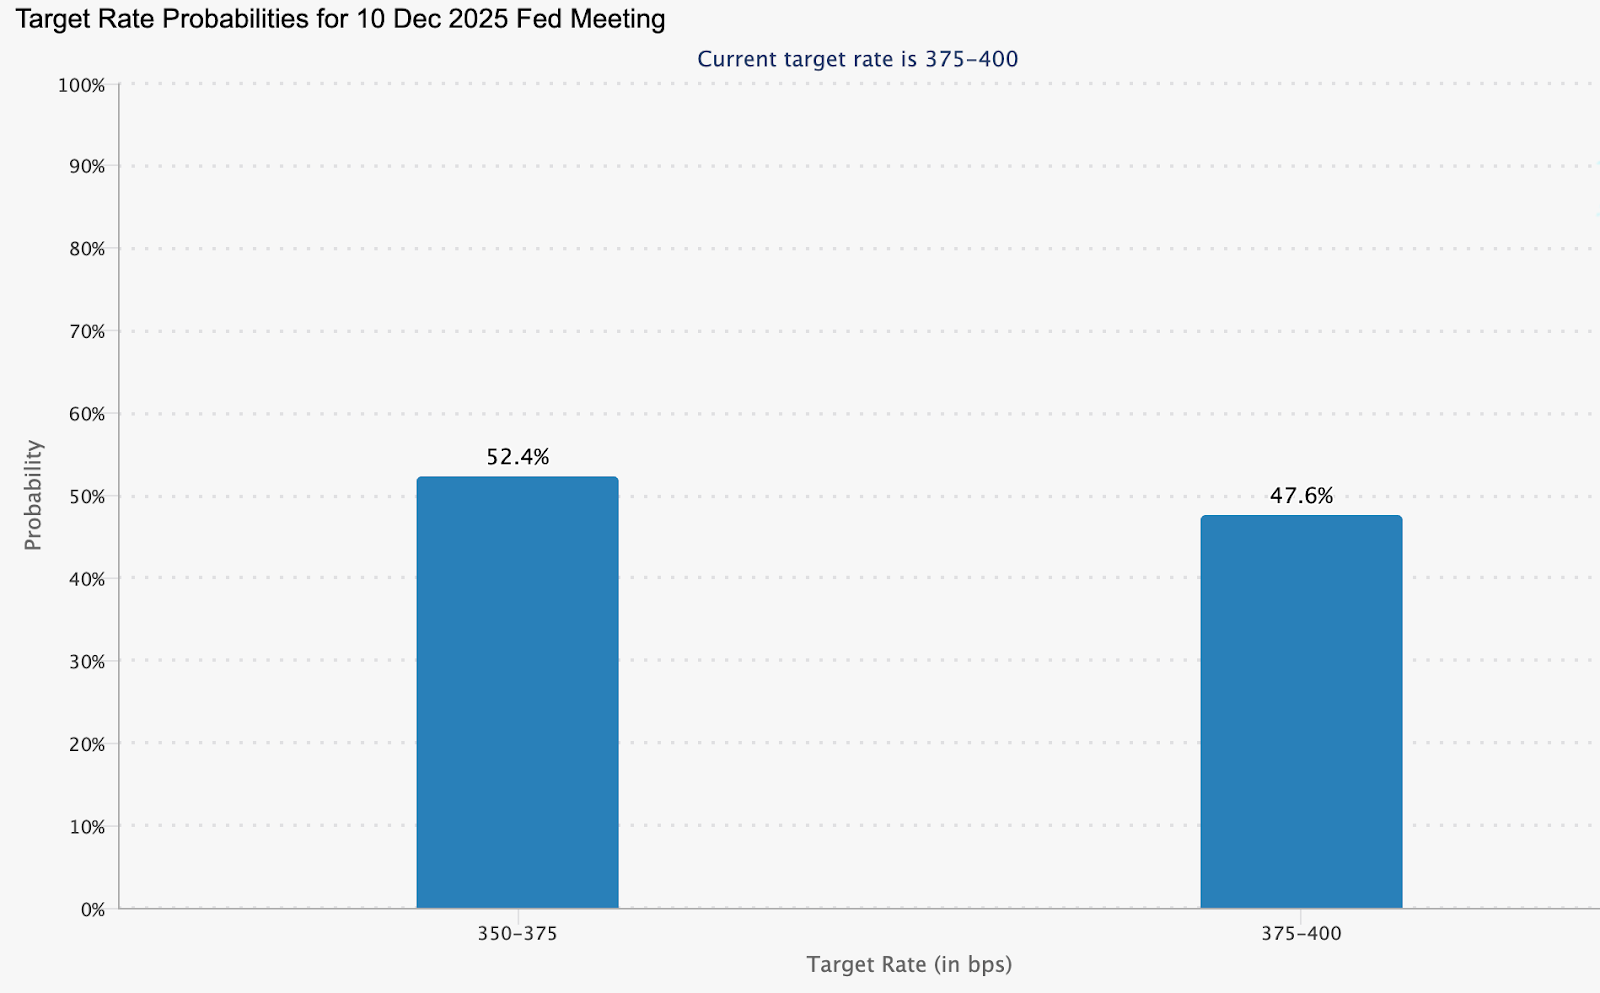
This lack of visibility has paralysed both traders and policymakers. Without CPI or Non-Farm Payrolls data, the Fed’s decision-making is reduced to conjecture. According to the CME FedWatch Tool, markets now price a 52.4% chance of a 25-basis-point rate cut in December, but conviction is fading fast.
Risk appetite, meanwhile, is improving, while European indices are stable - a combination that typically weakens the dollar. As risk-on sentiment spreads, the euro gains passive support from improved capital flows and reduced demand for safe-haven assets.
Euro gains as ECB-Fed policy gap and growth divergence narrow
Beyond the current data blackout, broader fundamentals are tilting in favor of euro support. The IMF forecasts U.S. GDP growth to slow from 2.8% to 2.0% in 2025, while the Eurozone’s growth rate is expected to rise from 0.9% to 1.2%. That narrowing growth gap erodes one of the dollar’s traditional strengths.
Monetary policy is also converging. The European Central Bank (ECB) has likely concluded its easing phase, while the Federal Reserve appears closer to cutting rates as U.S. momentum cools. The narrowing yield differential is historically positive for EUR/USD.
At the same time, Eurozone stability is becoming an asset. Energy risks have receded, political volatility has eased, and consumer confidence is showing faint signs of recovery. With fewer structural risks and steady monetary policy, the euro no longer needs to rally on optimism - it simply needs to stay consistent as the dollar struggles for direction.
CPI data impact: The market’s biggest blind spot
Inflation remains the pivot point. If U.S. CPI surprises to the upside, markets could reprice expectations for a Fed pause, pushing EUR/USD lower. A weaker print, however, would validate the dovish outlook and strengthen the euro’s hand.
For now, the absence of inflation data has become its own catalyst. Without new numbers, traders are increasingly relying on sentiment and technical signals rather than fundamentals. This has compressed volatility and reduced conviction, but the longer it lasts, the stronger the eventual breakout could be.
EUR/USD investment implications: Momentum meets resistance
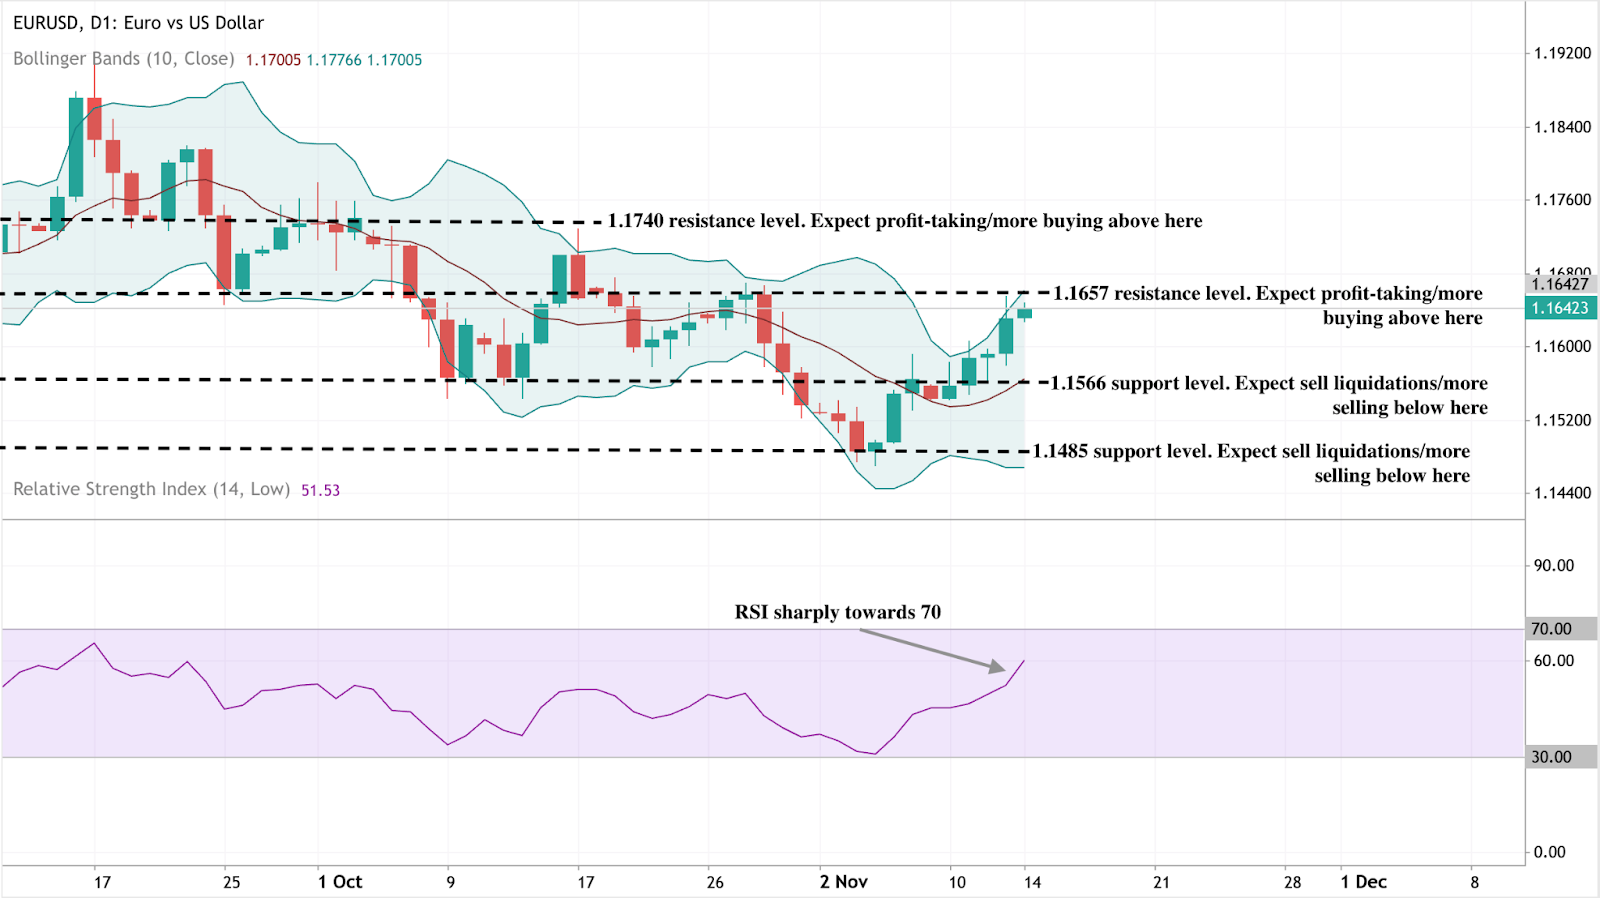
At the time of writing, EUR/USD is trading near 1.1642, with momentum leaning bullish but facing a critical resistance zone.
The Bollinger Bands indicate that price action is pressing against the upper band, suggesting heightened volatility and strong buying pressure. However, as the pair approaches 1.1657, traders may anticipate profit-taking or short-term consolidation before any further move higher.
A decisive breakout above 1.1740 could reinforce bullish sentiment and attract additional buying interest. On the downside, immediate support lies at 1.1566, with a deeper floor around 1.1485. A break below these levels would likely trigger sell liquidations and renewed downside pressure.
Meanwhile, the RSI is approaching 70, signalling that the pair is nearing overbought territory. This suggests a possible short-term correction before the trend resumes its upward trajectory.
EUR/USD investment implications
For traders, this is a market defined by patience rather than aggression. Range-trading around 1.156–1.166 remains viable, but tight stops are essential given the risk of a data-driven breakout.
Medium-term investors should note that the euro’s underlying stability, narrowing growth gaps, and reduced Eurozone risk could sustain gradual upside momentum towards 1.18–1.20 if the dollar continues to weaken through early 2026.
As volatility compresses, risk management becomes crucial. Using the Deriv trading calculator, traders can estimate pip values, margin requirements, and potential profit or loss before executing a position. This precision helps manage exposure around critical levels, such as 1.156 support or 1.174 resistance - an important edge in low-volatility markets.
With EUR/USD hovering near key technical levels, traders can track live price movements on Deriv MT5 and plan data-driven entries using the Deriv Trading Calculator. When the CPI report is released, both tools will be vital for identifying breakout momentum and managing exposure in real-time.

Silver price forecast: Why the metal's rally has teeth this time
Silver’s rally over the past five days isn’t a false dawn - it’s a move built on fundamentals, not fear, according to analysts.
Silver’s rally over the past five days isn’t a false dawn - it’s a move built on fundamentals, not fear, according to analysts. Unlike past speculative spikes, this surge reflects a convergence of monetary easing expectations, tight supply conditions, and surging industrial demand from renewables and semiconductor manufacturing.
With the dollar under pressure and traders pricing in a December rate cut, silver’s recent strength signals the start of a fundamentally driven phase rather than another short-lived burst of optimism.
Key takeaways
- Silver trades near $54.40, extending its strongest rally since October.
- Fed rate cut odds rose to 68%, prompting investors to shift towards non-yielding assets, such as silver.
- Mining supply is down 7% since 2016, as industrial demand outpaces production.
- Renewable energy and EV demand now account for over half of total silver consumption.
Silver policy shift and data weakness drives buying
Silver’s latest rally was triggered by a sharp shift in interest rate expectations. Recent U.S. data showed the economy losing momentum - private-sector job creation dropped by around 11,000 per week through late October, according to ADP. The slowdown boosted market confidence that the Federal Reserve will cut rates in December, with odds climbing from 62% to 68%, as tracked by the CME FedWatch Tool.
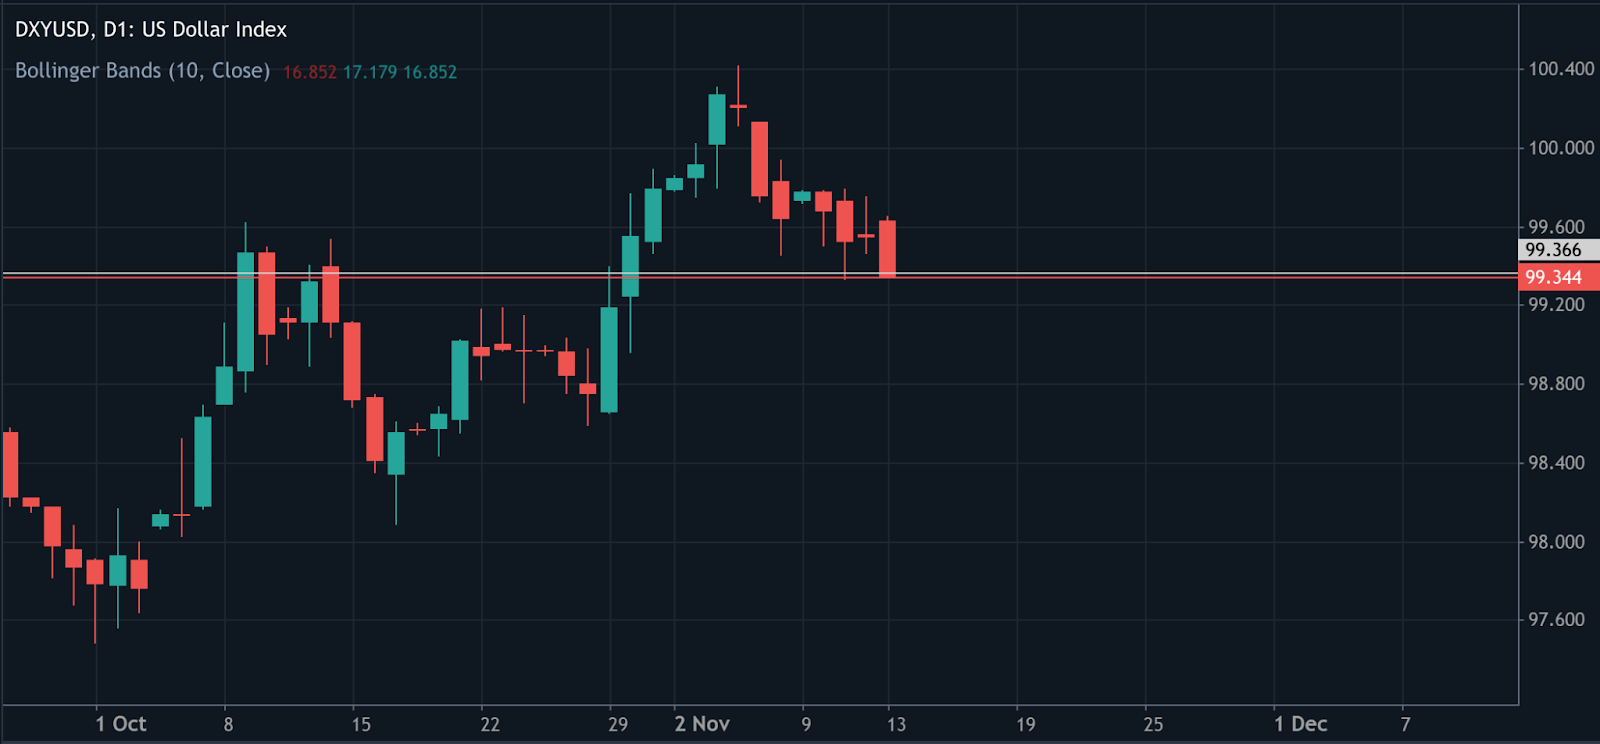
Lower rates typically weaken the dollar and boost demand for non-yielding safe-haven assets. The U.S. Dollar Index (DXY) has slipped to around 99.60, amplifying gains in gold and silver as investors seek alternatives to low-yielding cash.
Ordinarily, progress on the U.S. government shutdown would have cooled safe-haven demand, but this time, policy expectations outweighed politics. The market is reacting to a broader story: slowing growth and a Fed forced into easing.
Fear to fundamentals: Silver’s supply deficit and demand story
This rally marks a departure from previous episodes driven by speculative trading. According to Sprott Asset Management, silver’s strength is now anchored in structural supply deficits and industrial expansion, not hype. Total mine output has fallen by 7% since 2016, while demand from renewable energy, electric vehicles (EVs), and electronics has risen steadily.
Silver industrial demand continues to outpace supply growth
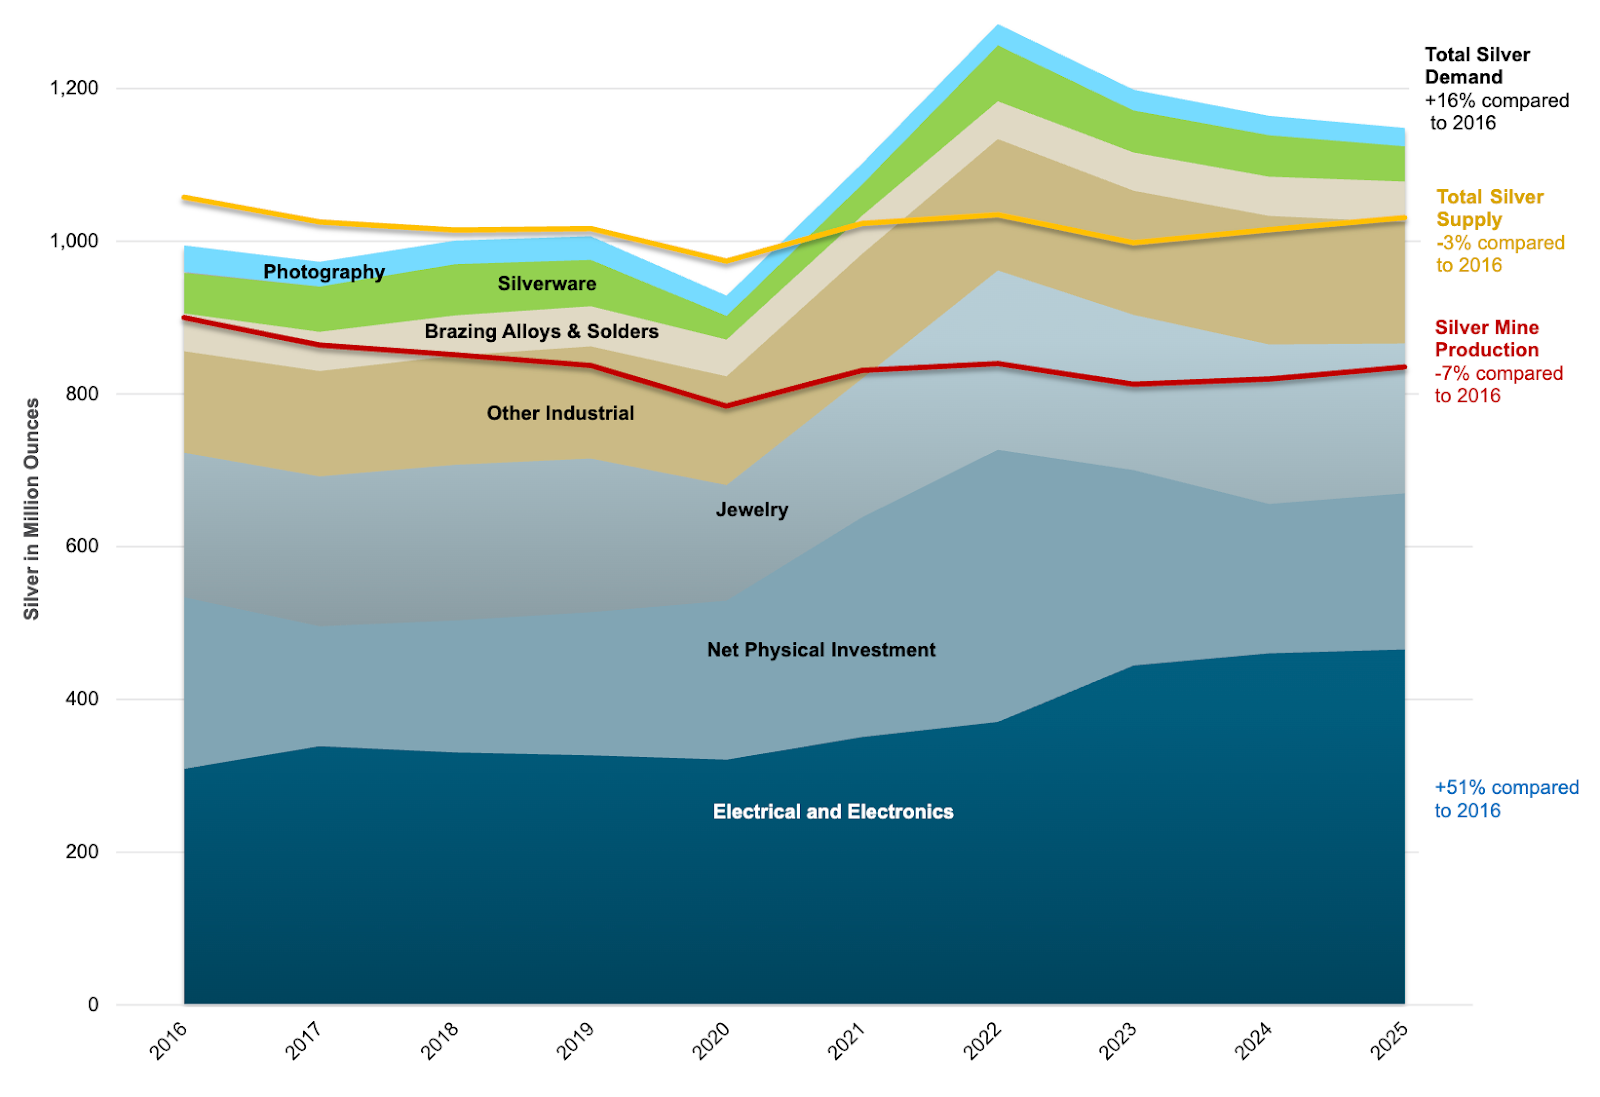
Over half of silver’s total demand now comes from industrial applications - primarily solar panel manufacturing, semiconductors, and EV components. Supply, however, has not kept pace. Recycling volumes have grown only modestly, and new mining investments remain limited, leaving the market increasingly tight.
As one analyst observed, “This is the first silver rally in years driven more by factories than by fear.”
If you’re planning your trade entry, the Deriv trading calculator helps you estimate margin, swap, and potential profit across Deriv platforms, such as Deriv MT5.
The macro backdrop: Dollar weakness and dovish policy
The broader environment reinforces silver’s strength. The combination of a weaker dollar, falling yields, and soft economic indicators has created an ideal setup for precious metals. The University of Michigan Consumer Sentiment Index dropped to its lowest since 2022, while retail activity has softened, signalling that the Fed’s tightening cycle has reached its limit.
US consumer sentiment


Gold has also contributed to sector momentum, briefly rising above $4,300 per ounce in October. Silver, traditionally more volatile, has benefited from the spillover as investors diversify across metals in anticipation of prolonged monetary easing.
In parallel, copper’s supply squeeze adds weight to the argument that the entire metals complex is entering a supply-led revaluation phase. The same structural shortages seen in copper are now emerging in silver, underscoring a shared narrative: demand growth outpacing production across critical commodities.
Industrial strength: The new driver of the silver cycle
Silver’s dual role - safe-haven and industrial metal - makes it unique among commodities.
While gold depends largely on investor and central bank demand, silver benefits from its role in clean energy and technology supply chains. Solar installations are expected to hit record levels in 2025, while EV adoption continues to accelerate.
Analysts estimate that demand from renewables and electronics will grow faster than mining output for at least the next two years, leading to projected price gains of 34% in 2025 and 8% in 2026. Even modest increases in consumption now trigger outsized price responses due to persistent deficits.
Silver technical insights
At the time of writing, silver (XAG/USD) is testing the $54.30 resistance level, a key zone where profit-taking could increase after a strong bullish rally. The RSI is hovering near 69, approaching the overbought region, which signals potential exhaustion in buying momentum and a likelihood of short-term consolidation or a pullback.
The Bollinger Bands show that price action is hugging the upper band, indicating strong bullish pressure but also a risk of near-term overextension. A decisive break above $54.30 could invite further buying, targeting new highs.
However, failure to clear this level may trigger a retracement toward the $47.00 support level, where buyers could re-emerge. Below that, the next key level sits at $41.28, marking a deeper support zone tied to earlier accumulation.

Risks and potential reversals of silver
Despite the strong outlook, a few risks remain:
- A dollar rebound on stronger U.S. data could temporarily cap gains.
- A slower industrial recovery or reduced rollout of renewables could soften demand growth.
- Short-term profit-taking could trigger volatility around the $50–52 range.
However, these are likely to be temporary corrections rather than trend reversals. Tight supply conditions and solid industrial fundamentals provide a durable floor under the market.
Silver outlook: A rally supported by substance
Silver’s ascent is less about speculation and more about structural change. As monetary policy turns accommodative and industrial demand accelerates, the market is transitioning from a reactive trade to a long-term revaluation.
Analysts expect silver to remain above $50 per ounce in 2025, with a potential retest of October’s $54 peak if rate cuts materialise and industrial activity stabilises. The alignment of macroeconomic easing, green energy expansion, and supply deficits provides this rally with the most credible foundation in over a decade.
Put simply, fear may have sparked it - but fundamentals are now driving it.

Will rising AI, EV and energy demand turn copper into the next oil?
Copper’s role in the global economy is shifting from an industrial input to a strategic resource underpinning the energy and technology transitions.
Yes - and the data increasingly supports that view. Copper’s role in the global economy is shifting from an industrial input to a strategic resource underpinning the energy and technology transitions. Prices are trading near $11,000 per tonne on the London Metal Exchange (LME), up about 27% since January 2025, as demand from AI data centres, electric vehicles (EVs), and renewable energy infrastructure surges.
With global supply struggling to keep pace, analysts believe copper could soon become as central to modern growth as oil was to the 20th century - powering everything from high-voltage grids to the AI servers of the digital age.
Key takeaways
- Copper prices remain near record highs, supported by demand from AI data centres, EVs, and renewable energy projects.
- Supply disruptions in Chile and Peru, combined with declining ore grades and project delays, are tightening global output.
- Institutional inflows from pension and sovereign wealth funds have transformed copper into a strategic investment asset.
- JPMorgan expects copper to reach $12,000 per tonne by early 2026, while Morgan Stanley projects a deepening supply deficit through 2029.
- Trade policy uncertainty and a cautious Fed may create short-term volatility, but structural fundamentals remain overwhelmingly bullish.
Copper’s supply shortage meets surging demand
Unlike previous commodity booms, copper’s rally isn’t a product of speculation - it’s a response to deep, structural imbalances. Global production continues to struggle, with around 6% of supply currently offline due to labour strikes, weather disruptions, and infrastructure bottlenecks across South America.
Chile and Peru, which together account for approximately 40% of the world's copper output, are facing severe operational pressures. Damaged logistics networks, delayed maintenance schedules, and limited transport capacity have curtailed ore movement, while ageing smelters are operating below capacity.
Compounding this is geology. New copper deposits are yielding lower ore grades - typically 0.3–0.8% copper content, compared with 2–5% in earlier decades. This means miners must process more rock to achieve the same metal output, thereby increasing both costs and environmental footprints.
Meanwhile, mine development timelines have stretched to between seven and eighteen years, limiting the speed at which new supply can respond to rising demand. Morgan Stanley forecasts a 590,000-tonne global deficit in 2026, which is expected to widen to 1.1 million tonnes by 2029 - the largest in over two decades.

Copper demand revolution: AI, EVs, and clean energy
The next decade’s copper demand will not come from construction or traditional manufacturing, but from technologies powering the global energy and data transitions.
AI data centres have become a major new source of demand. According to the U.S. Department of Energy and research by the Lawrence Berkeley National Laboratory, data centres could consume 6.7% to 12% of total U.S. electricity by 2028, up from 4.4% in 2023. Every new facility requires vast quantities of copper for cabling, transformers, and power distribution.
Electric vehicles (EVs) are another key driver of growth. Each EV contains around 40–50 kilograms of copper, roughly four times more than a petrol-powered car. With EV production scaling globally, copper’s role in automotive manufacturing is expanding rapidly.
Meanwhile, the renewables sector - particularly wind and solar power - continues to absorb unprecedented quantities of copper. A single 2–3 megawatt offshore wind turbine uses 5–7 tonnes of copper across its generator coils, wiring, and control systems. Grid modernisation and battery storage investments only add to this copper intensity.
Together, these forces are fuelling what many analysts describe as a once-in-a-generation demand transformation - one that positions copper as the critical link between electrification, digitalisation, and decarbonisation.
Copper’s momentum: Industrial metal to strategic asset
Copper is no longer just an industrial metal - it’s now a financial and strategic asset. The London Metal Exchange remains the primary benchmark for global pricing, but trading volumes in copper futures and ETFs have surged throughout 2025.
Institutional investors, including pension funds and sovereign wealth funds, have increased their exposure to copper as a hedge against the global energy transition. This institutional demand compounds existing supply pressures, creating a feedback loop in which rising prices attract additional capital inflows.
Commodity strategists note that this cycle is becoming self-reinforcing: “as long as deficits persist, investors will keep buying the shortage,” one analyst observed.
On Deriv MT5, traders can monitor copper’s price movements (XCU/USD) directly through advanced charting and technical indicators - giving them access to institutional-grade analysis tools used in professional trading environments.
Copper tariffs, policy, and Fed caution
Despite strong fundamentals, copper’s short-term performance is still influenced by trade and monetary policy.
The Trump administration’s shifting tariff policy on refined copper earlier this year created volatility between the CME and LME benchmarks. When tariffs were initially proposed, U.S. copper prices surged as importers rushed to secure supply. Once refined copper was exempted, prices corrected - but the gap underscored how political risk now moves metal markets.
The 2026 tariff review remains a key risk event, and traders expect further dislocations if the exemption is lifted. Analysts like Roukaya Ibrahim of BCA Research believe “the lingering possibility of tariffs on refined copper will continue to impact the market,” keeping U.S. prices at a premium.
Meanwhile, the Federal Reserve’s cautious tone on rate cuts has temporarily slowed speculative inflows into commodities. Yet for long-term investors, the structural tightness in copper supply is overshadowing short-term policy noise.
Copper investment outlook: Path towards $12,000 and beyond
JPMorgan Chase forecasts that copper prices could reach $12,000 per tonne by early 2026, representing an 11% increase from current levels. Its bullish outlook is supported by:
- Expanding investment in renewable energy, EVs, and AI infrastructure.
- Limited near-term supply response from major producers.
- Lengthy mine development cycles delay new output.
- Sustained institutional demand for commodities exposure.
Similarly, Morgan Stanley expects the market to enter its most severe deficit in 22 years, while Goldman Sachs has described copper as “the most compelling long-term opportunity in the industrial metals complex”.
Should these forecasts materialise, copper could maintain a new price floor above $10,000 per tonne, even in the face of temporary macroeconomic slowdowns.
Copper technical analysis
At the time of writing, Copper (XCU/USD) is trading near 10,850, consolidating between a key support zone at 10,470 and a resistance level at 11,100. A breakout above 11,100 could trigger renewed bullish momentum, while a drop below 10,470 might invite fresh selling pressure. The next lower support sits around 9,840, where further liquidation could occur if sentiment turns risk-off.
The RSI is hovering around 57, almost flat near the midline, suggesting a neutral bias - neither strongly overbought nor oversold. This indicates a market in wait-and-see mode, with momentum lacking clear direction.
Meanwhile, the MACD line remains slightly above the signal line but shows fading momentum, reflecting a weakening bullish impulse. If the MACD crosses below the signal line, it could confirm short-term bearish sentiment.
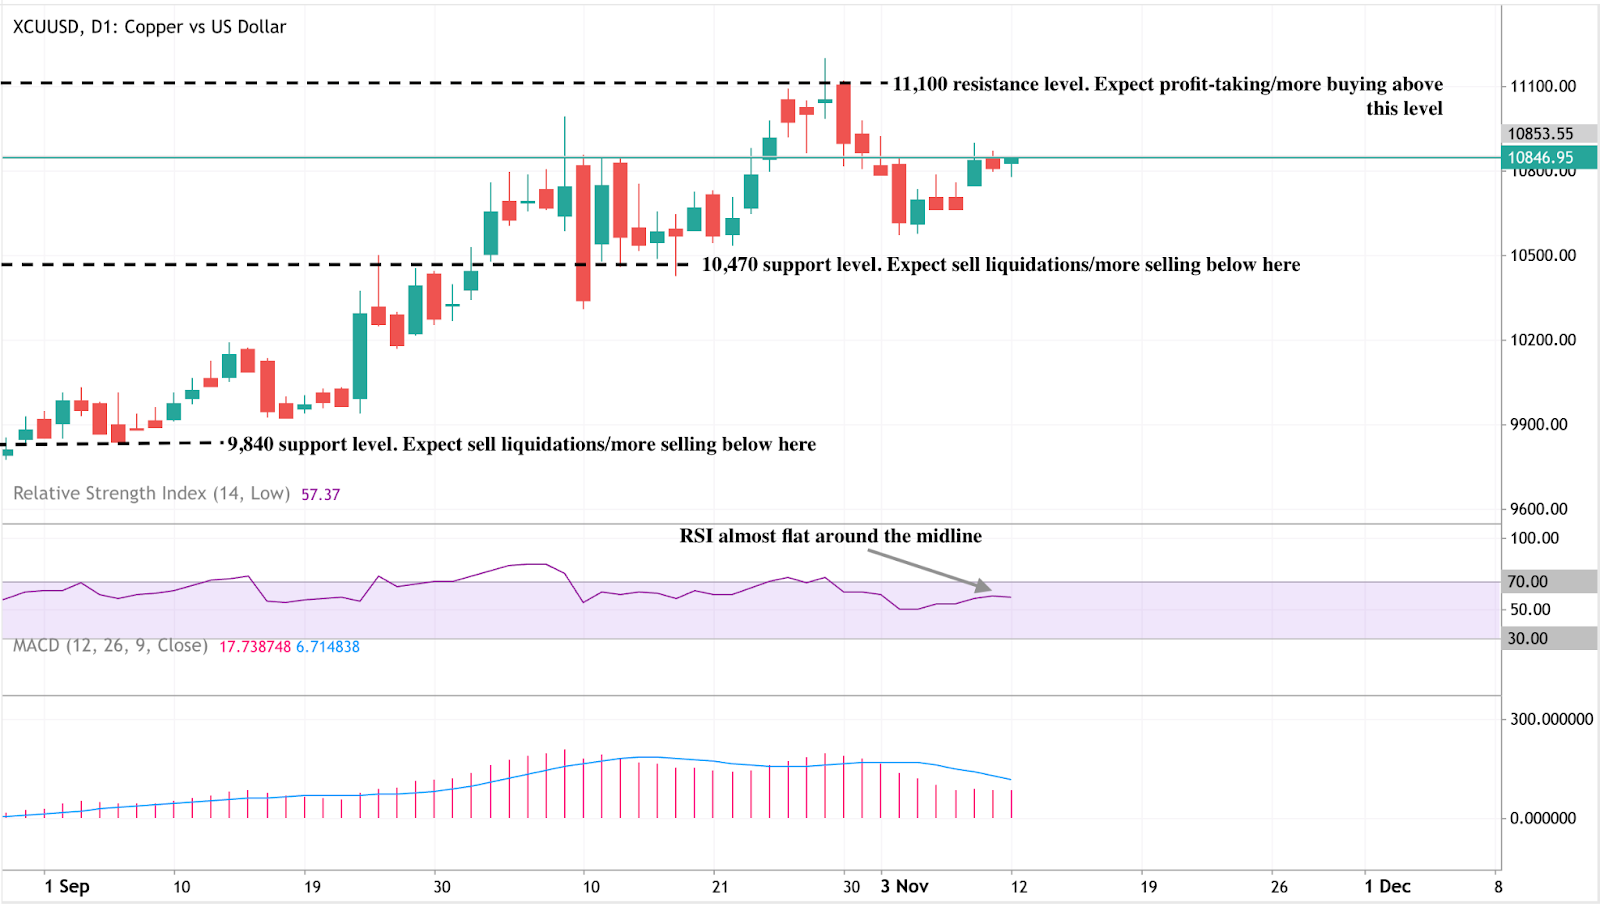
Traders can use the Deriv trading calculator to estimate margin requirements and profit potential when trading copper and other metals. To deepen your understanding of commodities trading strategies, explore Deriv’s detailed commodity trading guides - ideal for both new and advanced traders.
Copper’s short-term volatility vs long-term conviction
Despite the bullish longer-term trend, short-term headwinds persist. China’s property sector slowdown continues to weigh on sentiment for industrial metals, while tighter financial conditions may delay speculative inflows.
However, analysts widely believe that any price correction will be short-lived, as long-term fundamentals remain supportive. Pullbacks towards the $9,000–$9,500 range are seen as buying opportunities by funds positioning for the next uptrend in 2026.
Analysis: What’s driving the parallel rally in Gold prices and US stocks?
The parallel rally in both gold prices and U.S. stocks is somewhat unusual, as traditionally, gold is considered a "safe-haven" asset.
The parallel rally in both gold prices and U.S. stocks is somewhat unusual, as traditionally, gold is considered a "safe-haven" asset that tends to perform well during periods of economic uncertainty, while stocks are more linked to economic growth and risk appetite. Several factors are driving both markets higher simultaneously, according to analysts.
Traders see a 63% chance of a 25-basis-point cut in December, according to CME’s FedWatch tool. That single narrative - cheaper money - is lifting assets that usually move in opposite directions: gold, the classic safe haven, and stocks, the traditional risk play.
Both markets are feeding off policy-driven optimism rather than economic strength. Weak jobs data, soft consumer sentiment, and signs of fiscal strain are prompting traders to position for a gentler monetary path, fuelling a liquidity rally that blurs the line between safety and speculation.
Key takeaways
- Gold holds above $4,100 per ounce, its highest level in two weeks, as traders anticipate the Fed's easing.
- US equities are also climbing as lower rate expectations boost future earnings valuations.
- The rally reflects liquidity confidence, not growth - a market driven by central banks, not fundamentals.
- Fiscal anxiety and rising US Treasury yields add a second layer of support for gold.
- Strong physical demand from India and central banks underpins prices beneath the speculative wave.
Fed rate cut calls drive gold and US stocks
The joint rally stems from a clear macro shift. Recent US economic data has pointed to a loss of momentum - private employment weakened in October, government and retail jobs fell, and consumer sentiment dropped to its lowest in months. Markets interpreted this as confirmation that the Fed will pivot to rate cuts in December.
Lower interest rates affect both sides of the market simultaneously:
- For equities, they make borrowing cheaper and lift the present value of corporate earnings.
- For gold, they reduce the opportunity cost of holding a non-yielding asset.
The result is a synchronised upswing. Investors aren’t choosing between safety and risk; they’re buying both, united by one expectation - the return of easier money.
For traders on Deriv MT5, these cross-asset dynamics have created new opportunities for diversification, as volatility in indices, commodities, and metals all respond to the same policy pulse.
US fiscal policy re-emerges as a hidden driver
The US government shutdown and its tentative resolution have sharpened focus on fiscal stability. The Senate’s bipartisan compromise to reopen the government - backed by President Donald Trump - eased short-term market stress but reminded investors of America’s long-term debt problem.
As Saxo Bank’s Ole Hansen noted, “Rising yields driven by fiscal anxiety, rather than economic strength, have historically been supportive for investment metals.” Higher bond yields, in this context, reflect concern about debt sustainability, not a stronger economy - reinforcing the case for holding gold as a hedge against fiscal uncertainty.
The reopening of government agencies will also restore access to official economic data, providing markets with greater clarity. Yet, with that data likely to confirm slowing activity, traders see even more justification for the Fed to act.
Gold and stocks: A rare tandem surge in the markets
Gold and equities traditionally move in opposite directions. One represents fear, the other confidence. However, 2025’s market behaviour suggests that both are now expressions of liquidity expectations.
When investors expect monetary easing, everything that benefits from cheap money rallies - from gold to growth tech stocks. This correlation shift highlights a structural change in how markets operate: policy anticipation has overtaken fundamentals as the key price driver.
Gold’s ability to rise even as the US dollar strengthens reinforces that shift. Currency dynamics are being eclipsed by the dominance of central bank policy in global asset pricing.
Gold demand adds depth to the rally
Beyond the speculative narrative, gold’s rise has strong real-world backing. Physical demand remains robust, particularly in India and among central banks:
- India’s gold ETF inflows reached $2.9 billion in the first 10 months of 2025 - equivalent to 26 tonnes of gold, almost matching the total from 2020 to 2024 combined.
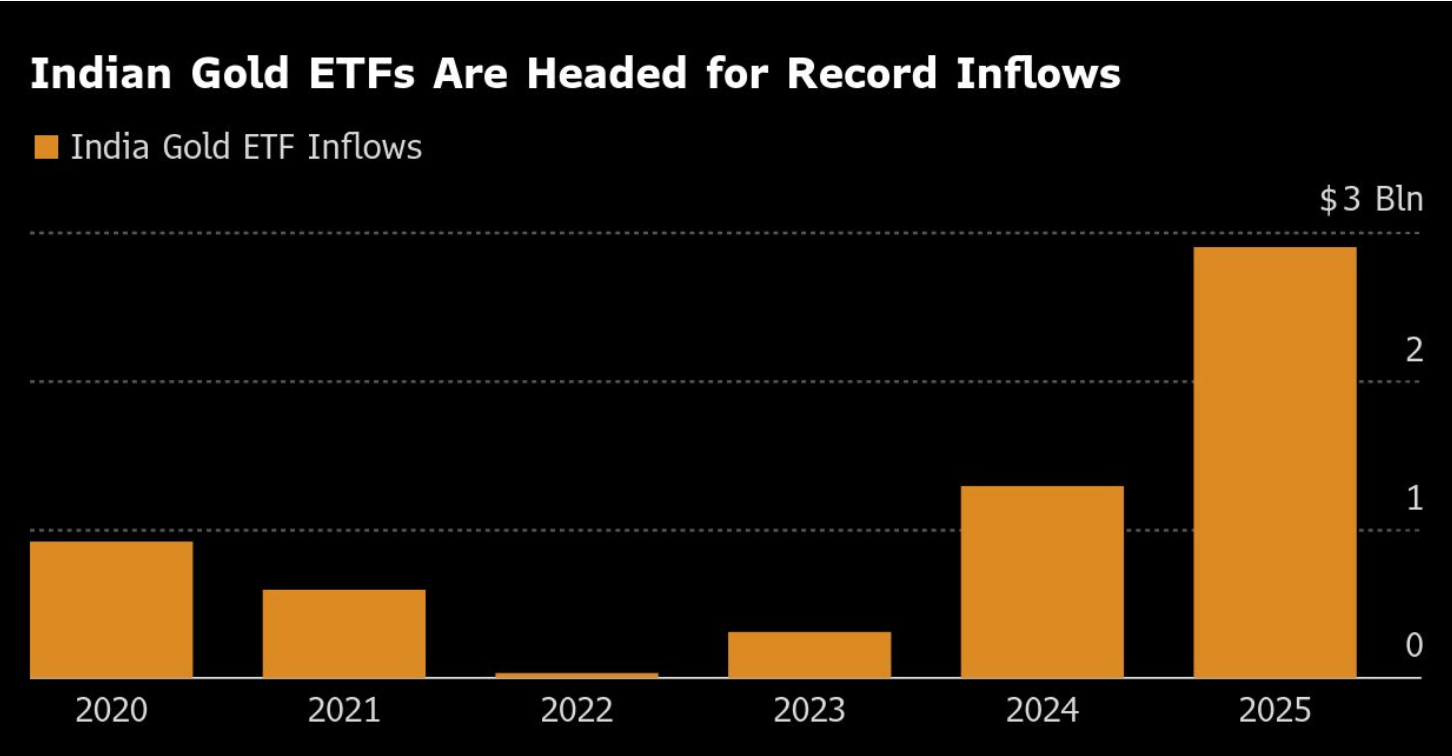
- October alone saw $850 million in new inflows, following a record $942 million in September.
- India’s total ETF holdings now stand at 83.5 tonnes, worth over $11 billion.
This demand suggests the rally is not purely speculative. It reflects a genuine global appetite for gold as a long-term store of value - a counterbalance to monetary and fiscal uncertainty.
Gold miners mirror investor confidence
The corporate side of the gold market echoes this sentiment. Barrick Gold (ABX.TO), one of the world’s largest producers, raised its quarterly dividend by 25% and expanded its $500 million share buyback programme after reporting an adjusted profit beat.
- Average realised gold price: $3,457 per ounce, up from $2,494 a year earlier.
- Output fell from 943,000 to 829,000 ounces, while all-in sustaining costs rose slightly to $1,538 per ounce.
Despite operational challenges and a $1 billion write-off linked to the loss of its Mali mine, Barrick’s strategic pivot toward North American production signals confidence in sustained high gold prices.
However, the Mali dispute - which includes the detention of employees and export restrictions - underscores the geopolitical fragility of global gold supply, a factor that could tighten markets further if unresolved.
Market backdrop: debt, yields, and the policy paradox
Gold’s more than 50% rise this year is not simply a reflection of inflation fears. It’s a response to fiscal fragility and market dependence on liquidity.
Rising Treasury yields are less a sign of economic health and more a warning about debt sustainability. Investors are buying gold as a hedge against these structural risks while simultaneously bidding up equities on the assumption that liquidity will continue to flow.
This dual behaviour - seeking safety and risk simultaneously - is the defining paradox of 2025’s market psychology.
Gold and US stock Scenarios for the months ahead
- Bullish breakout
If the Fed cuts rates in December and hints at further easing, gold could breach $4,200 quickly, supported by fiscal concerns and steady central bank demand.
- Short-term consolidation
A cautious or delayed Fed stance could see gold hover between $4,050 and $4,150, with equities likely maintaining gains until liquidity expectations fade.
Either way, the key takeaway is that gold and stocks are now responding to the same macroeconomic driver - the price of money - rather than opposing emotional forces.
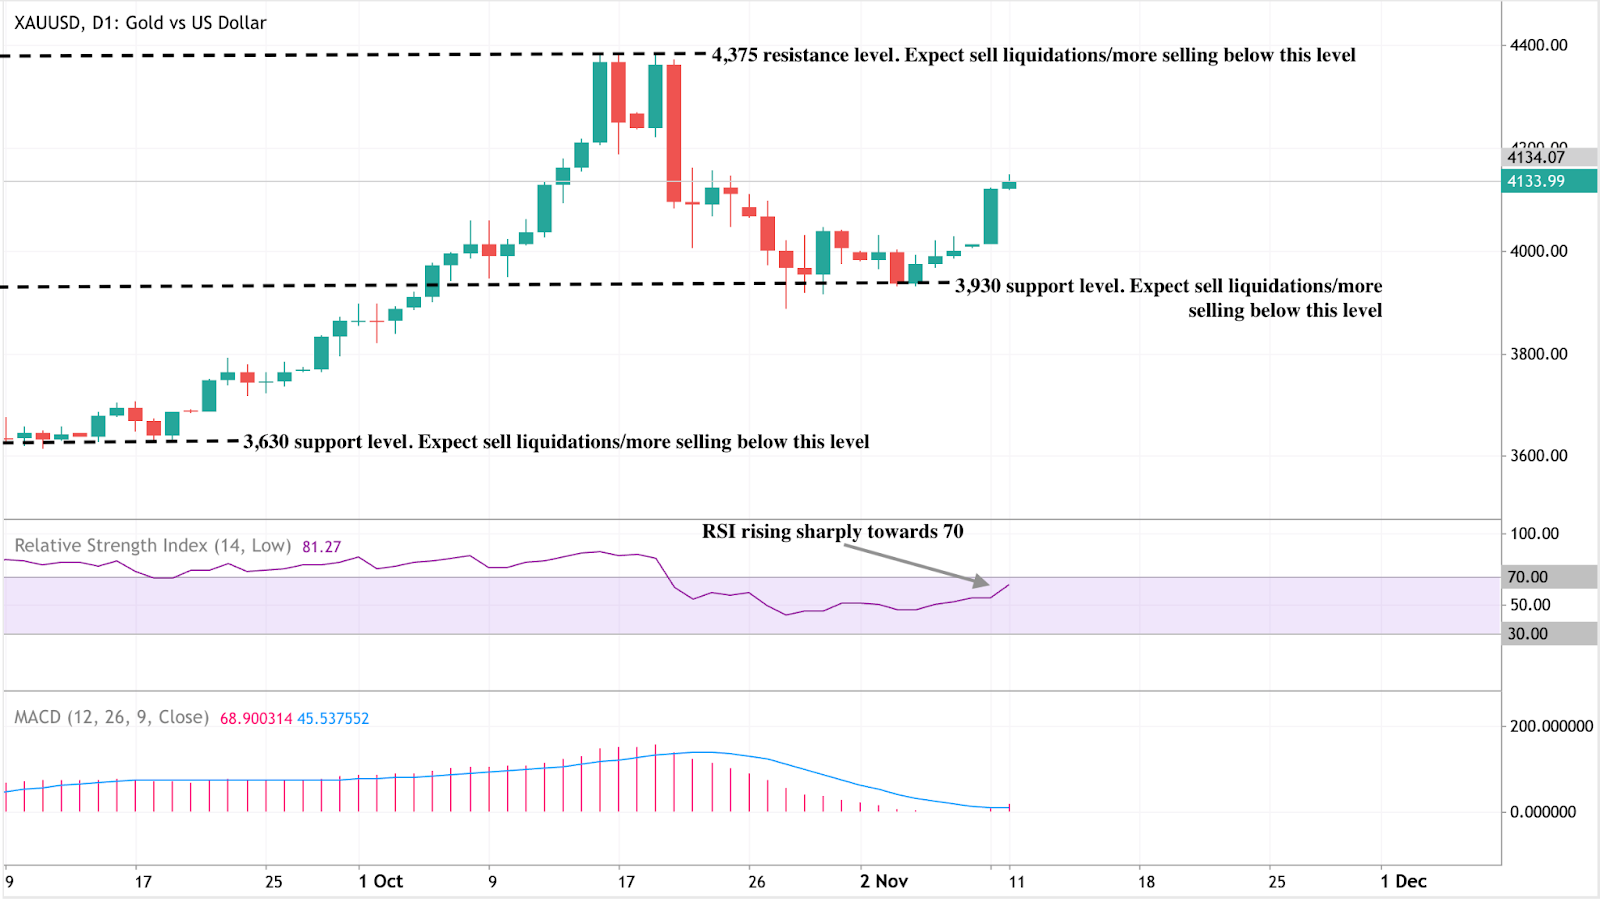
Gold technical insights
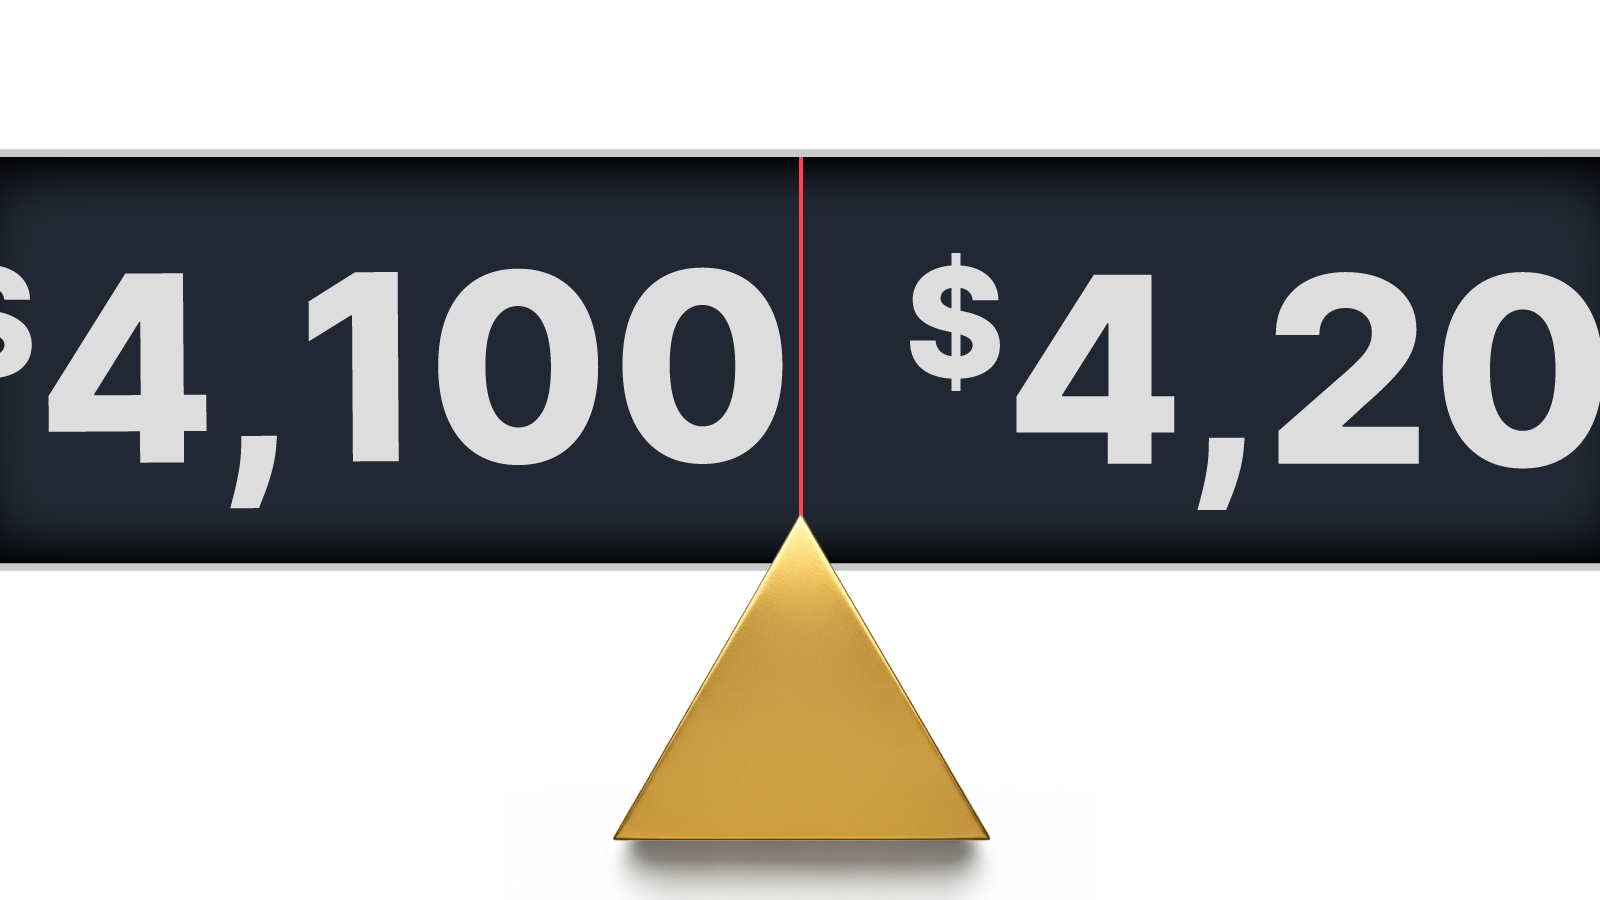
Gold (XAU/USD) is trading around $4,134, consolidating between key levels - resistance at $4,375 and support at $3,930. A breakout above $4,375 could extend the rally, while a drop below $3,930 risks renewed selling toward $3,630.
The RSI (81) indicates strong bullish momentum but signals overbought conditions, suggesting a possible short-term consolidation or pullback. Meanwhile, the MACD remains in a bullish crossover, confirming ongoing buying pressure.
Overall, gold’s bias stays positive above $3,930, but traders should watch for momentum cooling near overbought zones. You can monitor these levels directly on Deriv MT5 or experiment with margin and risk setups using the Deriv Trading Calculator to plan positions across metals and indices.
Gold investment outlook
- Short-term traders: The $4,100–$4,200 zone is the key range to watch ahead of the Fed’s December decision.
- Medium-term investors: Fiscal stress, real yield volatility, and Indian demand form the core drivers for continued strength.
Portfolio managers: Gold’s evolving correlation with equities means it now behaves as a policy-sensitive parallel asset, not a pure hedge. Diversification strategies should take into account this structural shift.

Can a tariff dividend create a new liquidity cycle for Bitcoin in 2025?
Analysts suggest that President Donald Trump’s proposed $2,000 “tariff dividend” has fuelled a wave of market optimism rather than a genuine injection of liquidity.
Yes - but only in sentiment, not in substance. Analysts suggest that President Donald Trump’s proposed $2,000 “tariff dividend” has fuelled a wave of market optimism rather than a genuine injection of liquidity.
The announcement triggered a short-lived crypto rebound, lifting Bitcoin back above $104,000, as traders drew parallels with the 2020 pandemic payments that helped fuel the last major bull run. Yet with limited fiscal backing and political obstacles, many believe this rally may be driven more by sentiment than by substance.
Key takeaways
- Trump’s $2,000 “tariff dividend” prompted a brief rally in Bitcoin and Ethereum, despite serious doubts over its feasibility.
- Funding gap: The proposed payout would cost around $300 billion, but tariff revenues generate only about $90 billion net.
- Institutional demand remains strong, with $2.7 billion in ETF inflows and BlackRock’s IBIT managing close to $100 billion in BTC.
- The Federal Reserve’s 25-basis-point rate cut and improved risk appetite continue to support Bitcoin above the $100K mark.
- Analysts see two paths: A climb towards $120K–$125K if optimism holds, or a slide below $100K once political enthusiasm fades.
- Crypto’s sensitivity to liquidity narratives underscores how sentiment - not policy - often leads market direction.
Trump’s tariff dividend promise and the market reaction
In a Truth Social post, President Trump claimed that the United States was generating “trillions of dollars” from tariffs and could use those funds to both reduce its $38 trillion national debt and finance a “dividend” for most Americans, excluding high earners.
The statement triggered a modest crypto rally as traders priced in the possibility of more household liquidity.
Markets quickly drew comparisons to the pandemic-era stimulus cheques that helped spark a historic bull market. Traders, long conditioned to respond to any hint of fresh money supply, reacted instinctively - even though the policy remains more political talking point than fiscal plan.
Why the maths don’t add up
Despite the excitement, the numbers simply do not work. Fiscal experts note that Trump cannot unilaterally authorise such payments; they require Congressional approval and a new funding bill.
The funding shortfall is also substantial:
- A $2,000 payment for 150 million adults would cost around $300 billion.
- Tariff collections to date total $120 billion, and after factoring in slower economic growth and lower tax receipts, net revenue sits closer to $90 billion.
As Erica York, Vice President of Federal Tax Policy, explained: “Each dollar raised through tariffs offsets about 24 cents in income and payroll tax revenue.” In short, the government lacks both the legal authority and the financial headroom to execute this plan, making any near-term payout highly unlikely.
Stimulus Déjà Vu: Why markets still care
The crypto rally reflects not fiscal reality but liquidity psychology. Even without concrete policy action, the mere suggestion of a “dividend” rekindles traders’ belief in free-flowing money and renewed risk-taking.
This mirrors 2020, when stimulus payments coincided with a surge in Bitcoin and altcoins as retail investors redirected government cheques into digital assets.

Although the scale is smaller this time, the pattern remains: crypto markets respond instantly to liquidity cues - whether real or imagined.
Bitcoin ETF inflows and structural strength
Beyond political headlines, Bitcoin’s structural outlook remains solid. Institutional inflows into U.S. spot Bitcoin ETFs exceeded $2.7 billion in early November, led by BlackRock’s IBIT and Fidelity’s FBTC. IBIT alone now holds $80.47 billion, cementing its position as the fastest-growing ETF in U.S. history.
Macroeconomic conditions are also supportive:
- The Federal Reserve’s 25-basis-point rate cut has lifted risk appetite.
- Trump’s pardon of Binance founder Changpeng Zhao signalled a more conciliatory stance towards crypto.
- Thailand and Malaysia are exploring the inclusion of Bitcoin in national reserves, marking a step towards mainstream adoption.
These developments indicate that even if Trump’s “dividend” proves politically untenable, the underlying liquidity narrative remains alive.
Market impact and price scenarios
If bullish sentiment and ETF inflows persist, Bitcoin could extend towards $120,000, driven by institutional accumulation and looser policy. However, should enthusiasm fade, a pullback below $100,000 remains a possibility as traders reassess the fundamentals.
So far, Bitcoin’s stability above $100,000 reflects confidence from institutional investors - although analysts warn that the rally is driven more by belief than by financial logic.
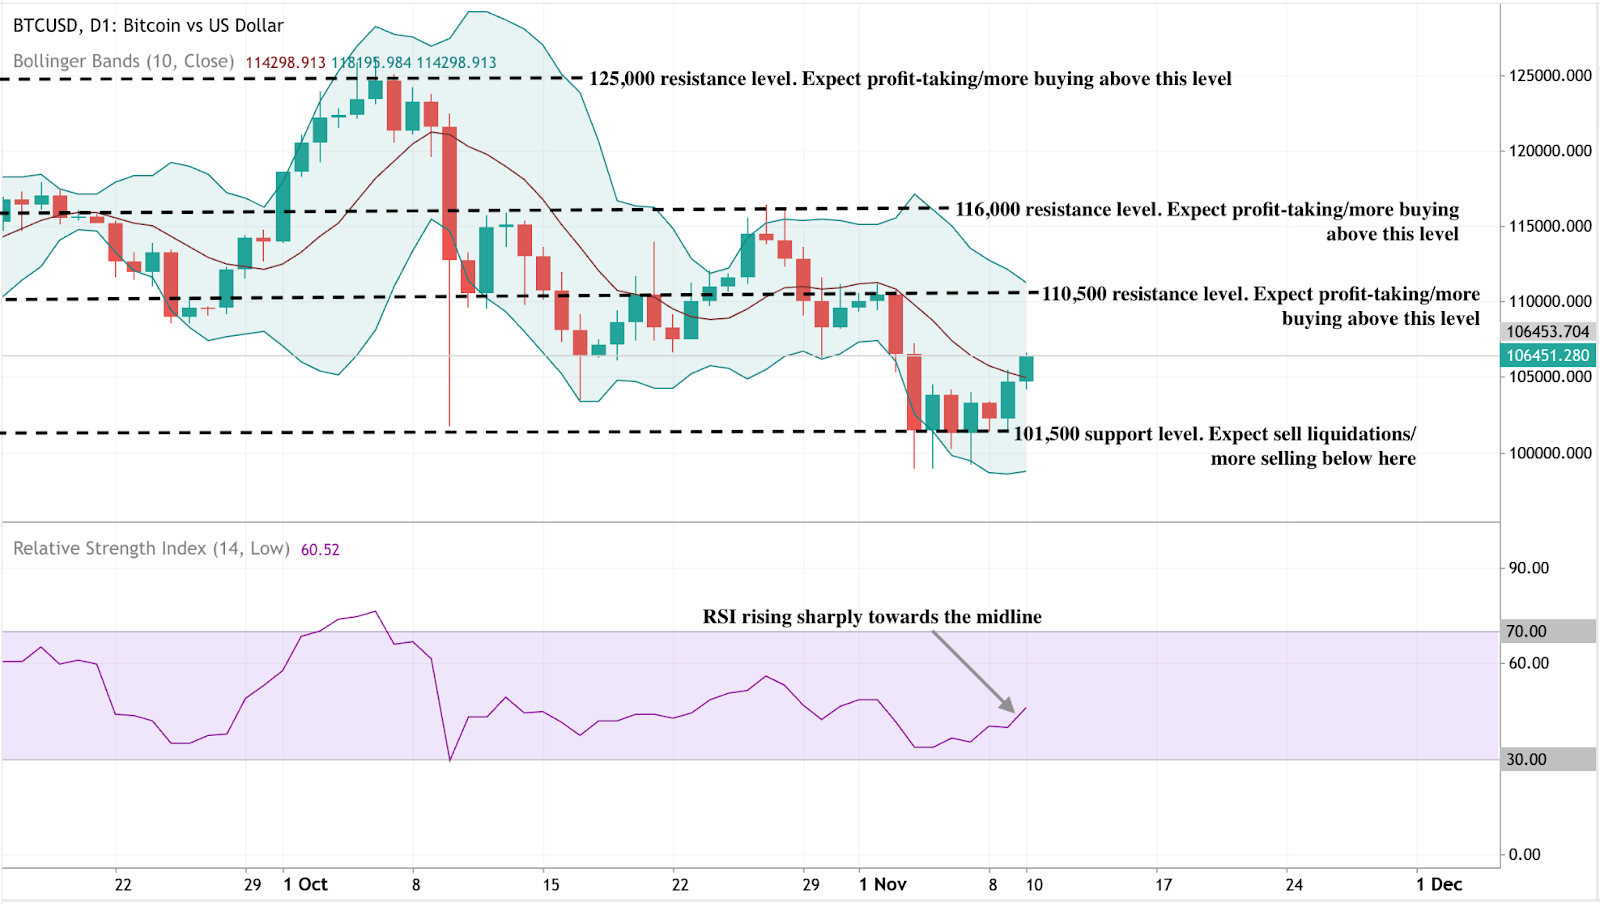
Bitcoin technical insights
Bitcoin’s price action shows early signs of recovery after holding above the key $101,500 support level, where sellers appear to have exhausted their momentum. This level remains crucial - a decisive break below could trigger further liquidations. On the upside, $110,500 serves as the first major resistance, followed by $116,000 and $125,000, where profit-taking is likely to intensify.
The Bollinger Bands are beginning to narrow after a period of strong volatility, suggesting potential consolidation before the next breakout. The price is also attempting to climb back toward the middle band (the 10-day moving average), signalling an improving short-term outlook.
Meanwhile, the RSI (14) has risen sharply to around 60, pointing to strengthening bullish momentum without yet entering overbought territory. If RSI continues upward past 60–70, it would confirm a shift in market sentiment toward renewed buying pressure.
Investment implications
For traders, sentiment remains the main short-term driver. Bitcoin’s $100K level represents the critical dividing line between bullish conviction and renewed caution.
Those trading crypto through Deriv MT5 can access advanced charting tools and cross-market analysis, making it easier to track correlations between Bitcoin, gold, and the U.S. dollar - especially during policy-driven volatility.
Meanwhile, traders can use the Deriv Trading Calculator to estimate potential profits, required margin, and swap rates before entering a position, ensuring tighter risk control in fast-moving conditions.
- Short term: Tactical buying opportunities exist above $102K–$104K if ETF inflows remain robust.
- Medium-term: Expect volatility tied to political announcements and monetary policy signals.
Long-term: Institutional accumulation and steady global adoption continue to underpin a structurally bullish outlook, even if near-term hype cools.

Is Filecoin’s price surge the start of a broader crypto market recovery?
According to experts, Filecoin’s 50% surge could mark the early stages of a broader recovery across the cryptocurrency market, driven by renewed interest in utility-based blockchain assets.
According to experts, Filecoin’s 50% surge could mark the early stages of a broader recovery across the cryptocurrency market, driven by renewed interest in utility-based blockchain assets. The decentralised storage token’s sharp rebound above the $2 level has placed it at the forefront of the DePIN (Decentralised Physical Infrastructure Network) rally - a niche sector that has gained roughly 11% overall in recent days.
Analysts point to rising network activity, strong developer funding, and growing institutional focus on real-world blockchain utilities as reasons why Filecoin’s latest move may represent more than just a speculative bounce. Still, whether the rally extends further will depend on broader market sentiment and sustained adoption within the decentralised storage ecosystem.
Key takeaways
- Filecoin leads crypto recovery: Up over 50% in 24 hours, Filecoin is outperforming most major tokens and driving gains in the DePIN sector.
- DePIN sector strength: Decentralised infrastructure projects have collectively gained 11%, signalling investor interest in tokens with tangible use cases.
- Ecosystem investment expanding: Protocol Labs has launched RetroPGF Round 3, allocating 585,000 FIL to support developer projects from November 2024 to September 2025.
- Market capitalisation: Filecoin’s valuation now stands at $1.52 billion, ranking it among the top 50 public blockchains.
- A short-term focus on maintaining momentum above $2 could pave the way for a move to $3, a key technical resistance level.
- Long-term outlook: Experts see Filecoin as a leading project in the growing Web3 infrastructure and decentralised storage economy.
Filecoin rally leads the market’s structural recovery
Filecoin’s performance is part of a broader market trend where investors are shifting capital towards utility-based projects - tokens that provide real-world functionality. Within this trend, DePIN networks stand out. These projects bridge physical resources such as computing power, energy, and data storage with blockchain incentive mechanisms, creating measurable productivity within decentralised systems.
The DePIN sector’s 11% rise reflects a shift in sentiment from speculative trading towards functional blockchain services. Filecoin’s 50% rally to above $2.00 has cemented its status as the flagship token for decentralised storage and one of the strongest indicators that the market is rediscovering value in blockchain infrastructure.

Filecoin vs traditional cloud storage
Launched in October 2020 by Protocol Labs, Filecoin provides a peer-to-peer marketplace for data storage. It enables users to rent out unused hard drive space, earning FIL tokens in exchange. Unlike traditional storage services such as Google Drive, iCloud, or Dropbox, Filecoin’s system operates without a central authority - meaning that pricing, availability, and access are determined entirely by the network.
The system relies on two unique consensus mechanisms:
- Proof-of-Replication (PoRep): Verifies that storage providers hold exact copies of the data they claim to store.
- Proof-of-Spacetime (PoSt): Confirms that the data remains stored for the entire agreed period.
Together, these mechanisms make Filecoin’s network verifiable, secure, and tamper-resistant, addressing long-standing challenges in data storage trust and transparency.
Decentralised storage: From research to real-world impact
Filecoin’s origins date back to 2014, when Protocol Labs developed the InterPlanetary File System (IPFS) - a decentralised file-sharing protocol designed to replace centralised web servers. Filecoin was later introduced as the economic layer of IPFS, incentivising users to store and maintain data using blockchain rewards.
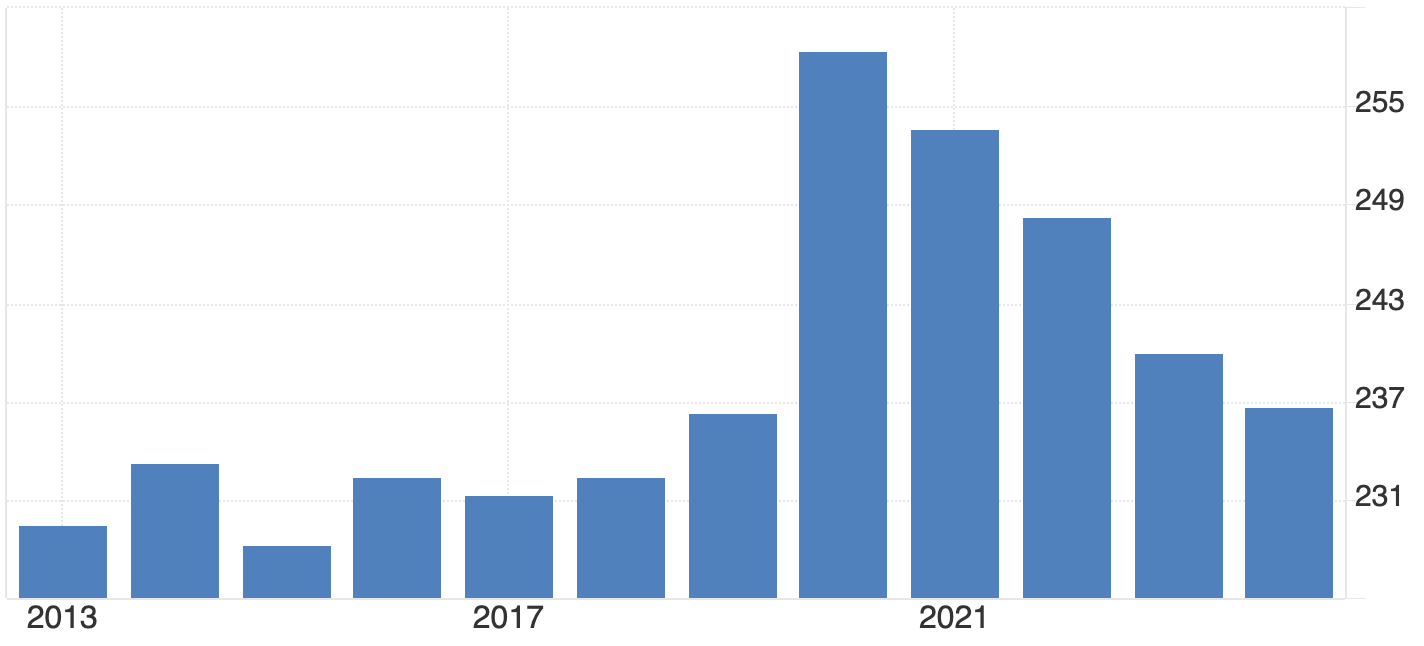
In August 2017, Filecoin completed one of the largest token offerings in crypto history, raising $257 million in its Initial Coin Offering (ICO). Major investors, including Sequoia Capital, Union Square Ventures, and Digital Currency Group, backed the project.
By the time its mainnet launched in October 2020, Filecoin had become one of the most anticipated blockchain networks globally. Its price soared to an all-time high of $236.97 in 2021 before correcting sharply alongside the broader market downturn. Despite that decline, the network has continued to expand and maintain strong developer interest, positioning it as one of the most credible decentralised storage solutions in the Web3 space.
Filecoin’s ecosystem expansion reinforces fundamentals
While price volatility has dominated headlines, Filecoin’s ecosystem growth has been quietly strengthening. Protocol Labs recently launched RetroPGF Round 3, allocating 585,000 FIL to projects that contributed to the ecosystem between late 2024 and 2025.
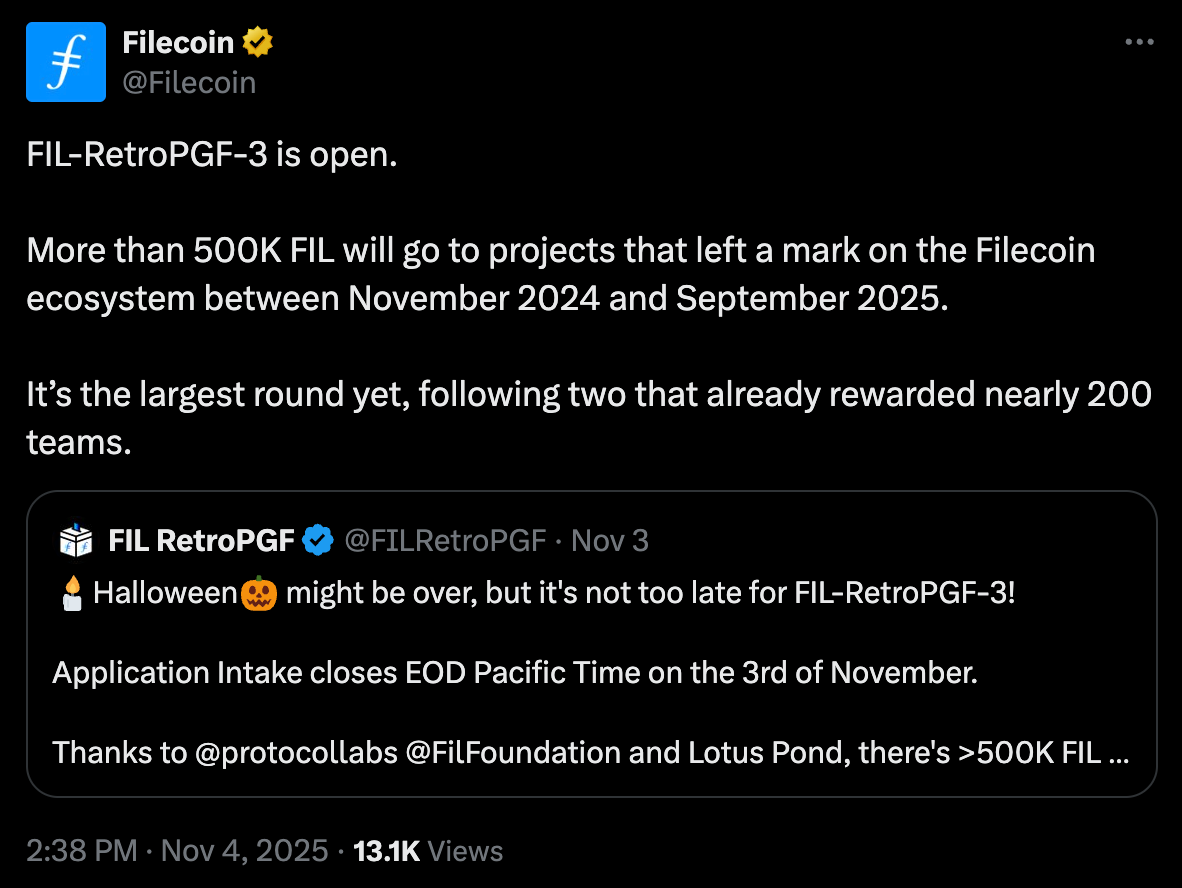
This round follows two earlier programmes that rewarded nearly 200 development teams, supporting innovations in decentralised computing, data retrieval, and dApp integration. The funding initiative underscores Filecoin’s commitment to sustainable growth - a key differentiator in a market often driven by short-term speculation.
Such ecosystem support not only encourages innovation but also signals confidence to institutional investors who are increasingly assessing Web3 infrastructure projects as long-term opportunities.
Market outlook: Can Filecoin sustain momentum?
Breaking past the $2 psychological level marks a pivotal moment for Filecoin. The next major resistance sits near $3, a level last tested in mid-2023. Technical analysts suggest that continued momentum could propel prices toward this mark if trading volumes remain high and the DePIN rally sustains.
However, Filecoin still trades far below its 2021 highs, underscoring both its potential for recovery and its vulnerability to market sentiment. Short-term corrections are possible as traders take profits, but experts say the latest surge is supported by more robust fundamentals than previous speculative rallies.
With a market cap of $1.52 billion and growing integration across decentralised applications, Filecoin is viewed as a key player in Web3’s evolving infrastructure layer. Its combination of utility, decentralisation, and developer support could allow it to benefit from the next major rotation into functional crypto assets.
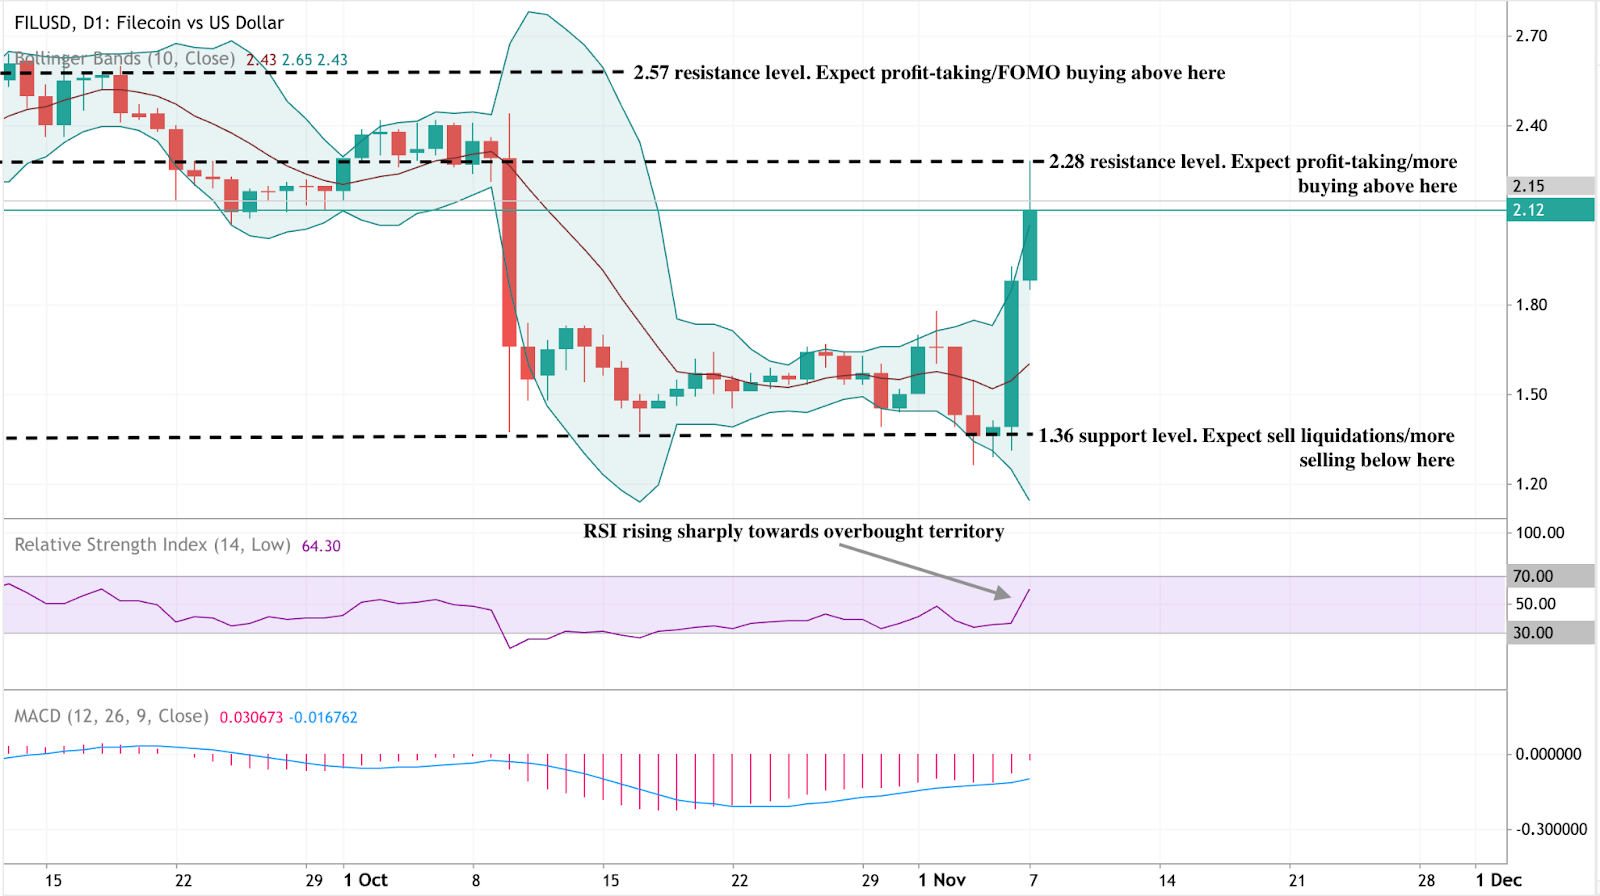
Filecoin technical analysis
At the time of writing, Filecoin (FIL/USD) is trading around $2.12, extending its rally after rebounding from the $1.36 support level. The Bollinger Bands have expanded, reflecting heightened volatility, with price now testing the upper band - often a sign of short-term exhaustion. The RSI, at 64.3, is rising sharply toward the overbought zone, suggesting momentum remains strong but could soon face a cooling period.
Meanwhile, the MACD has turned positive with a fresh bullish crossover, reinforcing the current uptrend. However, traders should monitor momentum closely as the histogram begins to flatten. The next key resistance levels sit at $2.28 and $2.57, where profit-taking or renewed buying may occur. On the downside, $1.36 remains the critical support level - a break below it could trigger another wave of selling.
To explore and analyse these setups in real-time, traders can track Filecoin price action directly on Deriv MT5, which provides advanced charting tools, indicators, and multi-asset trading access for crypto, forex, and commodities markets.
Filecoin’s short-term outlook is bullish but nearing overbought territory, hinting at a potential cooldown if resistance levels hold.
Filecoin investment implications
For traders, Filecoin’s recent breakout offers short-term momentum opportunities above the $2 level, with upside potential towards $3 if DePIN sector strength continues. Caution remains warranted given crypto market volatility, but the technical setup favours buyers as long as Filecoin holds its newly reclaimed support zone.
For long-term investors, Filecoin stands out as one of the few blockchain networks with clear real-world use cases. Its robust developer base, institutional backing, and role in the decentralised data economy make it an appealing bet on the future of Web3 infrastructure.
Competition from centralised cloud giants and other blockchain storage protocols could cap growth if adoption plateaus. Filecoin’s success will depend on scaling efficiently, maintaining ecosystem incentives, and integrating more deeply into decentralised application frameworks.
Before entering Filecoin positions, traders can use the Deriv trading calculator to estimate potential profit and loss based on position size, leverage, and price movement - an essential tool for managing risk in volatile crypto markets.
Trading Filecoin on Deriv
- Momentum trading: Traders can use RSI and MACD crossovers on Deriv MT5 to capture short bursts of volatility during rallies above key breakout levels.
- Range trading: When Filecoin consolidates between $1.80–$2.50, short-term traders may use Bollinger Band reversals to enter positions at range extremes.
- Breakout strategy: A sustained move above $2.57 could signal a new bullish leg toward $3.00 - traders can confirm signals using MT5’s volume indicators and EMA crossovers.

How Solana’s real-world integrations are redefining crypto in 2025
From institutional ETFs to payment infrastructure and decentralised finance (DeFi) applications, Solana is reshaping what it means for a blockchain to operate at scale in 2025.
Solana’s expanding real-world integrations - ranging from institutional ETFs to payment infrastructure and decentralised finance (DeFi) applications - are redefining what it means for a blockchain to operate at scale in 2025. The network’s steady ETF inflows, validator reforms, and partnership activity show that Solana’s growth story is no longer simply about price volatility; it is about building financial and operational depth across both on-chain and institutional layers.
Key takeaways
- Institutional inflows remain steady: Solana ETFs have recorded six consecutive days of positive inflows, signalling confidence from long-term investors.
- Retail activity returns: Futures open interest has climbed to $7.64 billion, up 2.73% in 24 hours, while funding rates have turned positive - a sign of renewed retail optimism.
- Real-world integration grows: Solana is under evaluation for Western Union’s blockchain-based remittance pilot, positioning it for mainstream financial use.
- Network efficiency improves: Validator count has fallen 64% since early 2023, yet performance has strengthened as outdated operators were removed.
- Liquidity risks persist: Despite Solana total value locked (TVL) rising to $10.2 billion, stablecoin liquidity has declined 8.16% in a week - a warning for on-chain demand.
Solana institutional investment anchors Solana’s 2025 momentum
Institutional interest has become the foundation of Solana’s resilience this year. The Bitwise Solana Staking ETF (BSOL) drew $417 million in its debut week - outpacing even Bitcoin and Ethereum products - while the Grayscale Solana Trust (GSOL) attracted more than $1 million on its first day.
This consistent flow marks Solana’s shift from speculative trade to structured investment vehicle. For the sixth consecutive day, Solana ETFs have reported net inflows totalling $9.7 million mid-week, as professional investors position for long-term exposure despite macroeconomic uncertainty.
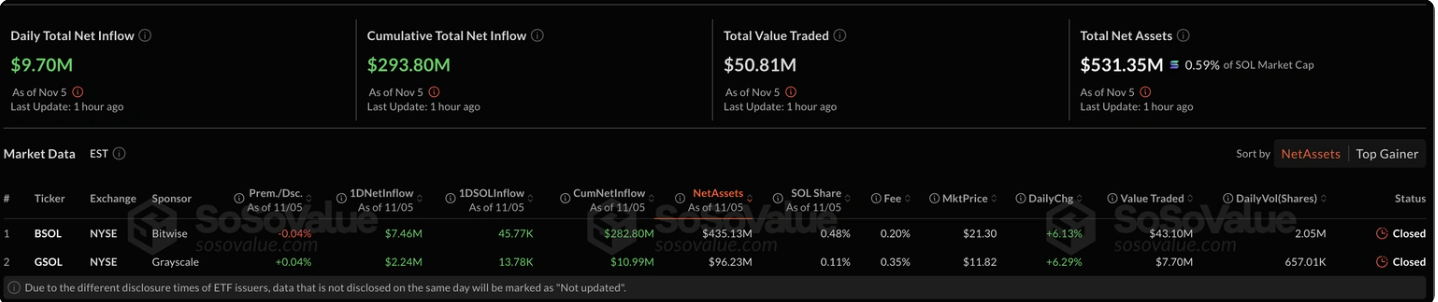
The rise of ETFs also introduces new liquidity and transparency. Each inflow represents a vote of confidence in Solana’s sustainability, particularly significant in a market shaped by cautious institutional allocators following the turbulence of 2022–23.
Solana retail traders re-engage as on-chain data strengthens
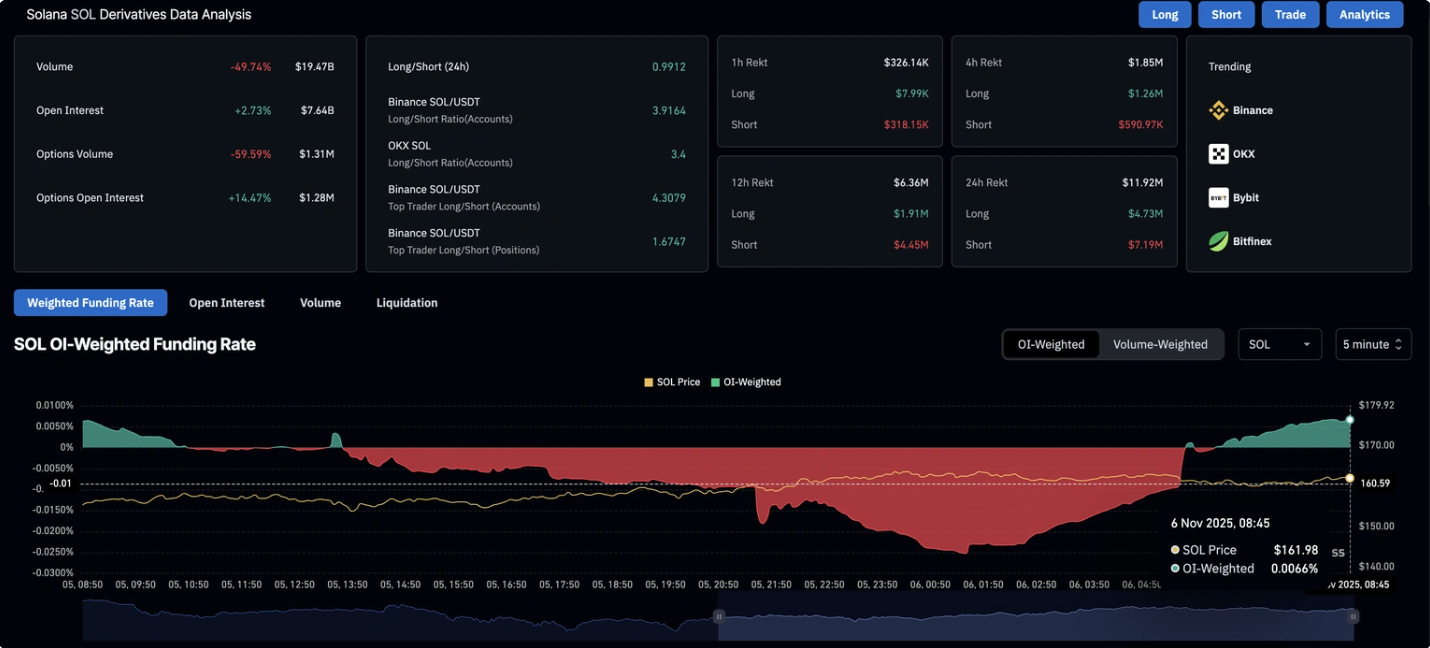
Following a weak start to the week, retail interest in Solana has picked up. According to CoinGlass, open interest in Solana futures increased 2.73% within 24 hours, and funding rates flipped from negative to positive territory. This indicates an expansion in leveraged long positions as traders bet on a continued rebound from the $155 support zone, with potential tests at $174–$177.
Short liquidations totaling $7.19 million exceeded long liquidations of $4.73 million, indicating that bearish positions were squeezed out and adding upward pressure on the price. The long-to-short ratio of 0.9912 indicates a market leaning cautiously bullish, yet still balanced.
Solana validator reforms make the network leaner and faster
Solana’s validator count has declined from around 2,500 to under 900 since 2023 - a 64% reduction - but this contraction reflects strategic consolidation rather than weakness. Many of the removed validators were outdated, slow, or linked to exploitative trading behaviours such as “sandwich” attacks.
The Solana Foundation has restructured its subsidy programme, now removing three subsidised validators for every new one added. The result: lower congestion, smoother transaction flow, and a healthier infrastructure.
As Tomas Eminger, Chief Infrastructure Officer at RockawayX, noted, this shift improves hardware quality and eliminates inefficiencies that previously slowed the network.
Solana real-world adoption: From DeFi to payments
Beyond market speculation, Solana is strengthening its institutional relevance through real-world adoption. Western Union has officially partnered with Solana to develop and test blockchain-powered cross-border transfer systems.
If adopted, the integration could channel significant transactional volume through Solana’s ecosystem, lifting both TVL and stablecoin demand. Simultaneously, developers are expanding Solana’s DeFi and asset-listing infrastructure:
- New perpetual markets are live.
- Launchpads are enabling faster token distribution.
- A revised asset-listing process simplifies onboarding for fintech and DeFi projects.
Together, these improvements suggest that Solana’s next growth phase will be driven less by speculative yield-farming and more by functional adoption - a shift reminiscent of how cloud computing matured from experimentation to enterprise utility.
Solana’s liquidity constraints: The risk beneath the rally
Despite these advances, the network faces liquidity constraints. DeFiLlama data shows Solana’s TVL rose 2.27% in 24 hours to $10.215 billion, but its stablecoin market capitalisation fell 8.16% over the week to $13.816 billion.

Falling stablecoin liquidity often signals shrinking capital reserves for decentralised applications, potentially reducing on-chain activity even as price metrics remain elevated.
If this decline continues, Solana may require stronger external inflows, such as ETF-driven liquidity or new payment-related transactions, to sustain ecosystem growth.
Comparing Solana’s institutional path to gold’s macro role
Solana’s 2025 performance mirrors gold’s cautious yet persistent rally amid uncertainty from the Federal Reserve. Both assets now reflect investor demand for alternatives that combine liquidity with long-term value preservation.
Just as gold ETFs legitimised physical gold as a mainstream portfolio component in the early 2000s, Solana’s regulated ETFs are giving institutions a compliant channel to access crypto exposure.
If the Fed’s December meeting signals prolonged policy tightness, risk assets could falter - yet steady institutional inflows suggest Solana is maturing into a digital asset capable of weathering policy-driven volatility.
Solana trading strategies on Deriv
- Breakout trading: Use Bollinger Bands or trendlines on Deriv MT5 to identify volatility-driven price movements. A confirmed breakout above resistance levels, such as $178 could indicate a bullish momentum continuation.
- Swing trading: Analyse Solana’s RSI and moving averages to time short- to medium-term entries. Combining this with the Deriv Trading Calculator can help manage position sizes and margin efficiently.
- Range trading: During consolidation, consider buying near support and selling near resistance using smaller lot sizes to manage risk effectively.
Deriv provides tight spreads, flexible leverage, and 24/7 access to crypto markets, allowing traders to act swiftly as Solana’s price responds to institutional flows or network developments.
Solana technical insights
Solana is consolidating around $159 after bouncing from the $148 support, a key level where further sell-offs could accelerate if breached. The RSI at 72.6 is rising sharply towards the midline, signalling improving momentum and the potential for a short-term rebound.
The Bollinger Bands indicate that the price is hugging the lower band, suggesting oversold conditions with room for mean reversion if buying pressure strengthens. Immediate resistance lies at $178, followed by $204.55, where profit-taking is likely. A sustained break above $178 could signal a move towards $200–$210, while a failure to hold $148 risks a slide towards $135.
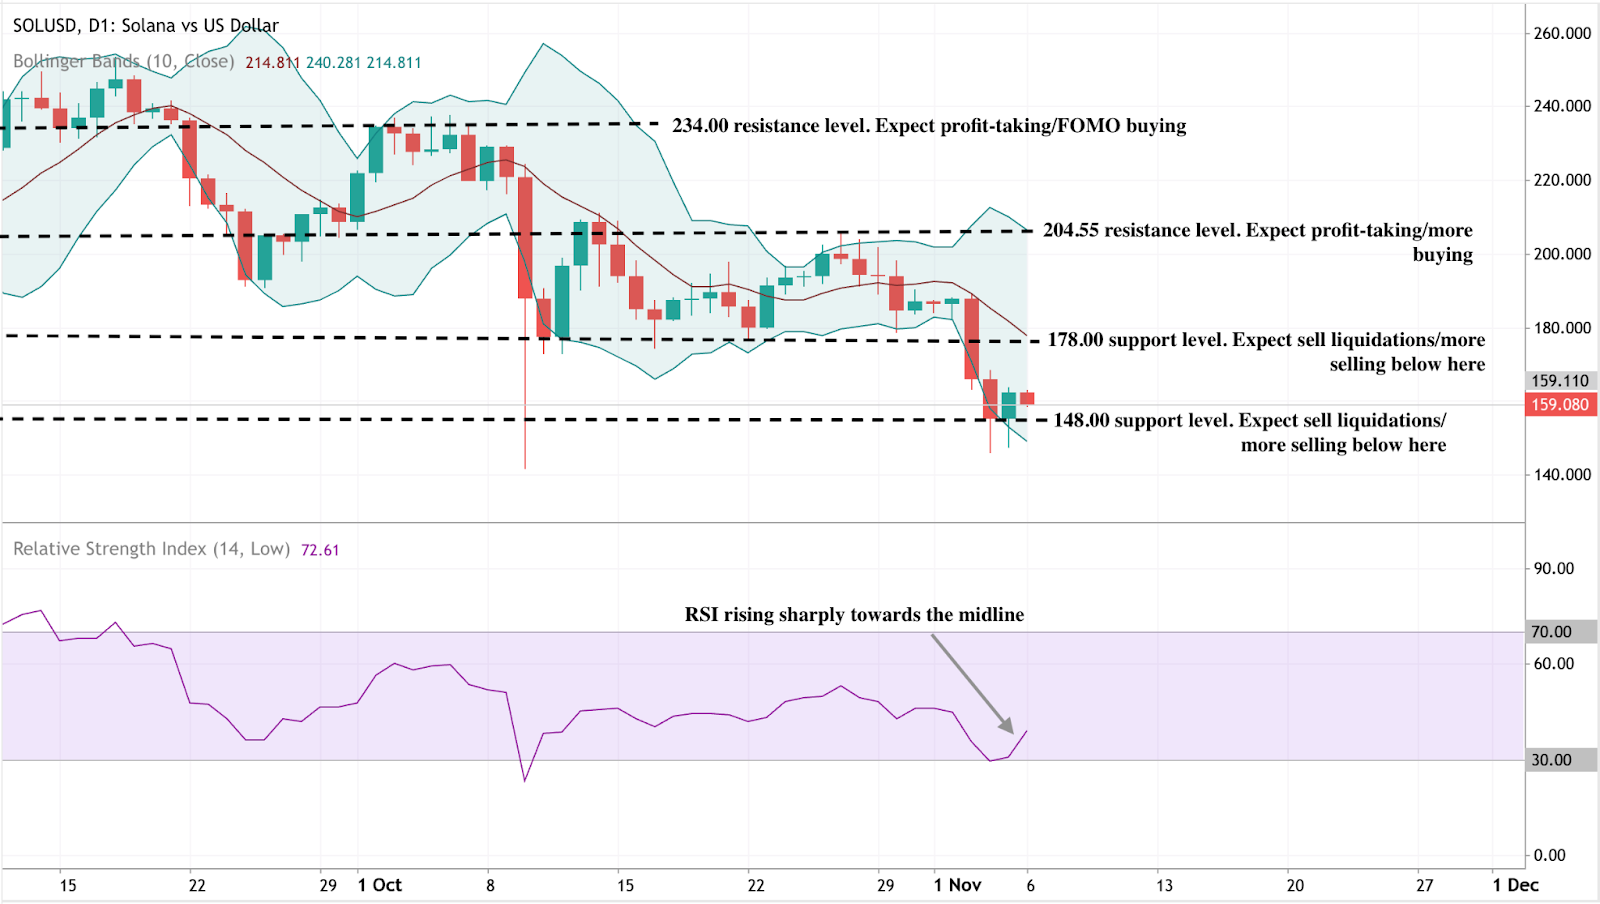
For traders interested in capitalising on such opportunities, Solana CFDs are available on Deriv MT5.
Solana price prediction and investment outlook
For portfolio managers, Solana’s transformation signals a gradual shift from a speculative token to an institutional-grade digital infrastructure.
- In the short term, price performance may remain tied to macroeconomic sentiment and ETF flows.
- Medium-term: The adoption of payment rails and DeFi applications could deepen liquidity.
- In the long term, continued integration with global finance and efficient network scaling may establish Solana as one of the few crypto assets offering both utility and institutional credibility.
In 2025, the real story is not the daily price chart - it is the quiet institutional infrastructure forming beneath it.
Sorry, we couldn’t find any results matching .
Search tips:
- Check your spelling and try again
- Try another keyword